Some Insights on Development from the Economics of ... Insights on Development from the Economics of...
32
Some Insights on Development from the Economics of Happiness* Forthcoming in the World Bank Research Observer Carol Graham Economic Studies Programs The Brookings Institution Revised version, April 2005 Abstract The literature on the economics of happiness in the developed economies finds discrepancies between reported measures of well-being and income measures. One is the so-called “Easterlin paradox”: average happiness levels do not increase as countries grow wealthier. This article explores how that paradox – and survey research on reported well-being more generally – can provide insights into gaps between standard measures of economic development and individual assessments of welfare. The author’s research on reported well-being in Latin America and Russia finds notable discrepancies between respondents’ assessments of their own well-being and income or expenditure based measures. Accepting that there is a wide margin for error in both types of measures, the article posits that taking such discrepancies into account may help us better understand development outcomes by providing a broader view on well being than comes from income-based measures alone. It suggests particular areas where research on reported well- being has the most potential to contribute. Yet the paper also notes that some interpretations of happiness research – in particular psychologists’ set point theory – may be quite limited in their application to development questions, and issues a note of caution about the direct translation of results from happiness surveys into policy recommendations. * The author is Senior Fellow in the Economic Studies Program and Co-Director of the Center on Social and Economic Dynamics at the Brookings Institution. She would like to thank Nancy Birdsall, Gary Burtless, Angus Deaton, Andrew Eggers, Michael Kremer, Margaret MacLeod,and three anonymous reviewers for helpful comments. A companion paper, with a special emphasis on globalization, was presented at a WIDER conference on globalization and inequality in October 2004, benefited greatly from comments from participants there, and will be published as part of the conference proceedings. 1
Transcript of Some Insights on Development from the Economics of ... Insights on Development from the Economics of...

Some Insights on Development from the Economics of Happiness*
Forthcoming in the World Bank Research Observer
Carol Graham
Economic Studies Programs The Brookings Institution
Revised version, April 2005
Abstract The literature on the economics of happiness in the developed economies finds discrepancies between reported measures of well-being and income measures. One is the so-called “Easterlin paradox”: average happiness levels do not increase as countries grow wealthier. This article explores how that paradox – and survey research on reported well-being more generally – can provide insights into gaps between standard measures of economic development and individual assessments of welfare. The author’s research on reported well-being in Latin America and Russia finds notable discrepancies between respondents’ assessments of their own well-being and income or expenditure based measures. Accepting that there is a wide margin for error in both types of measures, the article posits that taking such discrepancies into account may help us better understand development outcomes by providing a broader view on well being than comes from income-based measures alone. It suggests particular areas where research on reported well-being has the most potential to contribute. Yet the paper also notes that some interpretations of happiness research – in particular psychologists’ set point theory – may be quite limited in their application to development questions, and issues a note of caution about the direct translation of results from happiness surveys into policy recommendations.
* The author is Senior Fellow in the Economic Studies Program and Co-Director of the Center on Social and Economic Dynamics at the Brookings Institution. She would like to thank Nancy Birdsall, Gary Burtless, Angus Deaton, Andrew Eggers, Michael Kremer, Margaret MacLeod,and three anonymous reviewers for helpful comments. A companion paper, with a special emphasis on globalization, was presented at a WIDER conference on globalization and inequality in October 2004, benefited greatly from comments from participants there, and will be published as part of the conference proceedings.
1

Some Insights on Development from the Economics of Happiness
Central to the findings of much of the happiness literature in the developed economies are numerous discrepancies between reported measures of well-being and income measures. Richard Easterlin pioneered the economics of happiness in the mid-1970s.1 He found that across countries and cultures, the way that most people spend their time is similar: working and trying to provide for their families. Thus the concerns that they express when asked about happiness are similar. His finding—that wealthy people tend to be happier than poorer ones within countries, but that there is no such relationship among countries or over time—has since been supported by a number of subsequent studies, and is known as the “Easterlin paradox”.2
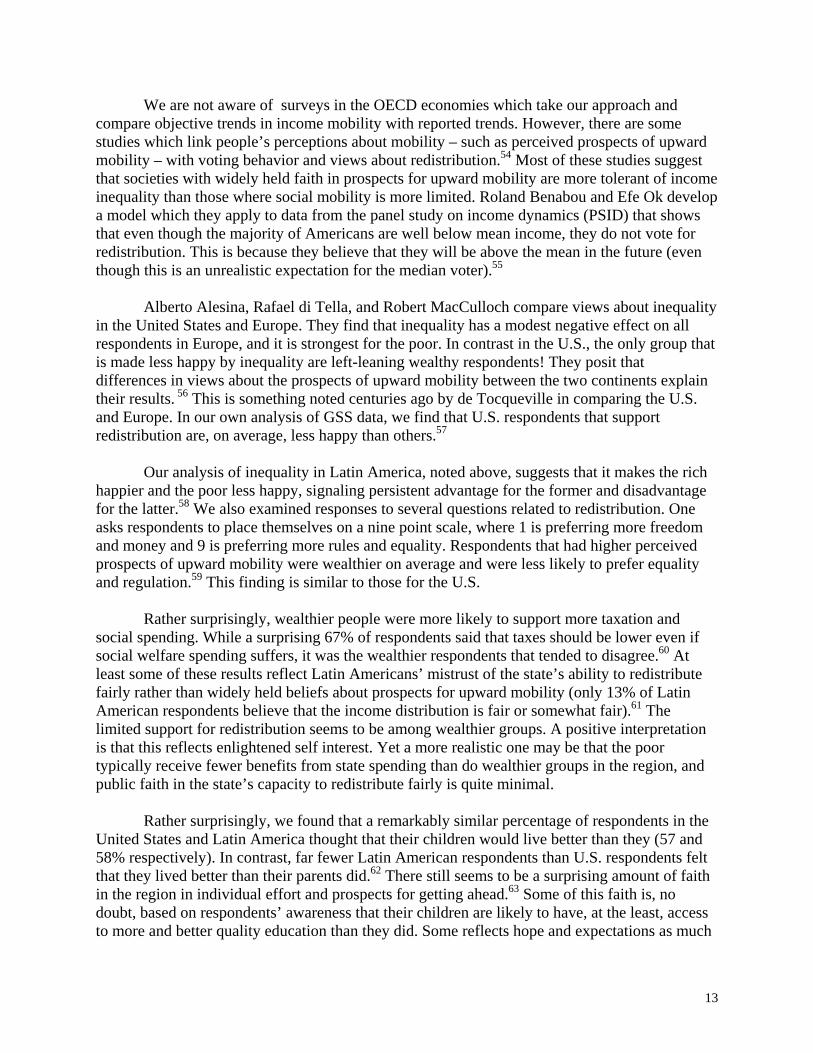
More recently, Stefano Pettinato and I developed data for 17 countries in Latin America. We found similar results in that there is no obvious relationship between income and happiness among our sample of developing economies. Yet for the most part, average happiness levels are higher in the advanced economies than they are in the developing ones. [See Figure 1]
The objective of this article is to explore how the paradox that Easterlin originally
highlighted – and the study of happiness more generally - provides insights into the way in which individuals in developing countries assess their own welfare, and how those assessments diverge from those based on traditional measures. Better understanding those divergences – particularly if they are significant and related to factors that can be influenced by policy – may help development economists and practitioners improve their benchmarks for measuring progress. My own research in Latin America and Russia, conducted jointly with several colleagues and discussed below, suggests that happiness surveys can tell us much about how the dynamics of poverty and inequality affect well-being, as well as about many other elements of well-being which are not captured by income measures alone.
In particular, they may help us understand public frustration in contexts where income
measures alone provide insufficient explanation and/or they may help shed light on issues where a revealed preferences approach is limited. One example of the latter is the effects of inequality on well being. It is difficult to imagine how a poor Bolivian, for example, who is made unhappy by inequality can reveal his/her preferences and move to a context where there is less inequality (short of emigrating). Nor can he or she do much to alter the distribution of income by voting, given that progressive taxation is not on the policy agenda in much of the region. In such contexts, surveys of well being may provide useful information.
It is important, though, to think of happiness surveys as complements to rather than
substitutes for income based measures of progress. While happiness surveys can provide us with novel information and suggest new analytical approaches, they can also pose challenges when translated into direct policy recommendations. For example, at the same time that countries have grown wealthier over time, they have also made major improvements in other indicators, such as morbidity, mortality, and literacy rates.3 Yet if the direct policy conclusion from the Easterlin paradox is that more money does not make people happier, then a related conclusion could be that long term gains in health and education also do not make people happier.4 Most development economists would find this extremely problematic.
2

Related to this, a prominent explanation for the Easterlin paradox is that norms and expectations adapt upwards at about the same rate as income increases, and thus after basic needs are met, more income does not make people happier.5 The extreme view of adaptation is the psychologists’ “set point” theory, which posits that all individuals have a set point of happiness, which they adapt back to even after major events like winning a lottery or getting divorced.6
A strict interpretation of the set point theory suggests that there is nothing much that
policy can do to make people happier, and that happiness surveys cannot be usefully applied to development questions. That is, of course, unless one is willing to accept that extremely poor and destitute people who report they are happy, most likely because of psychological attributes, are as well off as much wealthier, healthier, and more educated respondents. Few policymakers – or social scientists – would be comfortable with this, not least because decades of research – and economic progress – demonstrate that people live longer, healthier, and more fulfilling lives when they are not destitute, regardless of how they report their well being.7
Yet the set point interpretation is an extreme one. There is no doubt that there is a tremendous amount of adaptation to all kinds of change, and the evidence suggests that people often do return to or near to their set point, particularly in the case of income changes. Yet there is also evidence that some things seem to have more lasting effects on people’s happiness. Certainly people adapt over time to events such as divorce or serious illness, but the evidence is much less conclusive on whether they ever adapt fully.8
Even if norms and adaptation play a major role in determining subjective well-being,
there is ample evidence that objective conditions – and changes in objective conditions – matter. Within virtually all countries where such surveys are conducted, cross section data show that wealthier people are happier than poor ones. Healthier people are also happier, as are more educated people, employed people, and married people. Conversely, economic and other forms of insecurity, such as high levels of crime, seem to have negative effects on people’s happiness.9
The extreme set point interpretation suggests that progress does not matter to happiness at all, an interpretation that this author is not comfortable with. A more nuanced view, however, posits that happiness surveys can tell us things that purely income based measures of progress do not, and this may shed light on how the direction and nature of progress affects well being. Having sufficient income seems to matter to people’s happiness – and is essential to poverty reduction, but other non-income factors, such as stable employment, marital status and good health, also matter a great deal to well being (and, with the exception of marriage, also matter to poverty reduction).
While across nations there are diminishing returns to increasing income, other things that
correlate with national income, such as health, quality of government, and human rights, are correlated with higher happiness levels.10 In a recent cross-country study, for example, John Helliwell concludes that people with the highest well-being “are not those who live in the richest countries, but those who live where social and political institutions are effective, where mutual trust is high, and corruption is low”.11 In addition, my co-authors and I find that happiness levels are still, on average, lower in most developing economies than they are in the advanced ones, suggesting that if there is a threshold beyond which more money does not average levels of enhance reported well being, most developing economies have not yet crossed it.12
3

The discrepancy between cross section and over-time country level findings, meanwhile,
is a paradox on its own. After minimum basic needs are met, respondents do not seem to factor in long-term, aggregate improvements in per capita income levels or in basic health and literacy standards as they assess their well-being. At the same time, at any point in time within individual countries, wealthier and healthier people are happier than are poorer and less healthy people; responses are also influenced by changes in both income and health status. And even if over time gains do not affect people’s answers to happiness surveys, if life expectancy is longer and disease incidence is lower, then these happier, wealthier, and healthier people within countries will have more years to enjoy their lives.13
One example of well-being surveys informing unresolved questions is the evidence that they provide, albeit mixed, that distributional outcomes matter to welfare. Experimental, firm and region level studies find that inequities in rank or in the distribution of particular rewards can erode the positive gains accrued from income.14 Blanchflower and Oswald, based on U.S. data from the General Social Survey, find that relative income differences matter to happiness even when absolute income is held constant.15 Andrew Felton and I find that relative income differences (as well as perceived income differences) make the rich in Latin America happier than average and the poor less happy. We posit that while inequality can signal mobility and opportunity as much as injustice in the advanced economies, in Latin America it seems to be a signal of persistent advantages for the rich and disadvantages for the poor.16
Happiness surveys also suggest that macroeconomic conditions matter to well-being.
Studies in the developed economies find that higher inflation and unemployment rates make respondents less happy, all else being equal.17 Our own research corroborates these findings for Latin America, with high inflation being bad for happiness, and with unemployment rates having a negative effect. 18 Most economists and policymakers would be quite comfortable with the logical conclusion from these results: high inflation and unemployment are bad for well-being.
Yet caution is also necessary. In a more recent study of the costs of regional
unemployment rates in Russia, we find that respondents that live in regions with higher unemployment rates are, all else held equal, happier than their counterparts in regions with lower rates.19 These results reflect the unusual nature of the Russian economy and its uneven transition to the market; a detailed interpretation is beyond the scope of this paper. The point is that the policy implications, taken at face value, are that high unemployment rates are good for well-being in Russia. Few analysts would find that useful or conscionable.
Accepting that caution is necessary when drawing policy prescriptions, the point of this paper is to demonstrate how happiness research can provide new insights into the development process and how individuals fare – and/or perceive they fare – during that process. These insights complement but cannot replace the valuable information and benchmarks of progress provided by income based measures. But they may be useful in helping explain policy puzzles such as differences among societies’ tolerance for inequality; divergent assessments of the benefits of the globalization process; and unexpected interruptions in social and political stability.
What Are Standard Measures Missing?
4

An obvious question is what are our traditional measures missing? Respondents
assessments of their own welfare often highlight factors which are not adequately captured by income measures. Examples of these are real and perceived insecurity as rewards and incentives systems adapt to structural changes; the state of essential public services, such as education, health, and crime prevention; and norms of fairness and justice. Even the trends that can be measured in income terms, such as poverty and inequality, have broader dimensions – as well as dynamic elements – which are not captured by traditional income-based measures, such as poverty headcounts and Gini coefficients.
Gini coefficients, for example, are static, aggregate measures that do not change very
much over time, and usually do not reflect distributional shifts among regions or skill cohorts. Poverty head-count studies based on cross-section studies conducted every few years often miss short-term movements in and out of poverty.20 Such movements are common in developing countries and create widespread insecurity among the middle class as well as the poor.21 Panel data which measure income mobility are better suited to capturing such changes. Yet these data are rare and only exist for a few developing countries.22 Fixed international poverty lines, such as the $1 or $2 per day lines, meanwhile, while useful for intra-country comparisons, often have very little to do with public conceptions of poverty within particular countries and regions.
An example of the incomplete picture provided by income-based measures is the gap
between economists’ assessments of the effects of globalization based on traditional measures and the more negative assessments typical from the average citizen experiencing the process. While this gap may be exaggerated by the vocal opponents or proponents of globalization, it may also reflect trends – and broader dimensions of welfare - that standard income measures are not capturing. Few development economists dispute the notion that growth is a necessary but insufficient condition for poverty reduction. It should come as little surprise, then, that measures of poverty and inequality which only capture income and expenditure trends do not provide a complete picture of the many and broader dimensions of poverty and inequality, much less fully depict how they are affected by the complex process of globalization in the developing world.
Another example where income measures provide an incomplete picture is the seeming puzzle that civil unrest and social protest is more likely to occur in societies that are developing and growing than in those that are stagnant. Ted Robert Gurr, in an oft-cited cross-country study, cites relative deprivation as “the basic, instigating condition for participants in collective violence. . . . Societal conditions that increase the average level or intensity of expectations without increasing capabilities increase the intensity of discontent.”23 Despite many subsequent studies, there is still vast disagreement over the relationships between GDP growth, inequality, and civil violence.24 Using broader measures may help shed insights.
A related example is public tolerance for inequality. Years ago, in a classic article, Albert
Hirschman compared public tolerance for inequality in the development process to a traffic jam in a tunnel.25 He noted that when one lane moves forward, it gives those in the stalled lanes hope, as it provides a signal or information about where they might be going in the future. But if only one lane continues to move and the others remain stalled for a long period of time, then those in the stalled lanes become frustrated and are tempted to revert to radical behavior such as jumping
5

the median strip. Note that the frustration and radical behavior comes after a period of growth and development (albeit unevenly shared), not at a time of overall stagnation. There is nothing in our standard measures of growth or inequality that allows us to gauge the timing of such frustration and how the tolerance threshold differs among societies.
The more important question, however, is whether this gap between economists’
assessments and broader measures of well-being matters to outcomes in poor countries. Surely the bottom line or minimum requirement for economic development is economic growth. Will understanding broader and surely more difficult to measure dimensions of welfare contribute anything to the already complex challenges of development? And if there is merit in pursuing these broader concepts, how can we better measure what traditional tools do not capture? Can the economics of happiness provide some new tools to help answer these questions?
The Economics of Happiness The study of happiness, or subjective well-being (terms which are used interchangeably),
is a fairly new area for economists, although psychologists have been studying it for years. Some of the earliest economists, such as Jeremy Bentham, were concerned with the pursuit of individual happiness. As the field became more rigorous and quantitative, however, much narrower definitions of individual welfare, or utility, became the norm. In addition, economists have traditionally shied away from the use of survey data because of justifiable concerns that answers to surveys of individual preferences—and reported well-being—are subject to bias from factors such as the respondents’ moods at the time of the survey and minor changes in the phrasing of survey questions, which can produce large skews in results.26 Thus traditional economic analysis focuses on actual behavior, such as revealed preferences in consumption, savings, and labor market participation, under the assumption that individuals rationally process all the information at their disposal to maximize their utility. In recent years, however, the strictly rational vision of economic decision making has come under increasing scrutiny. One important innovation is the concept of bounded rationality, in which individuals are assumed to have access to limited or local information and to make decisions according to simple heuristic rules rather than complex optimization calculations.27 A more recent trend has been the increased influence of behavioral economics, which supplements the methods and questions of economists with those more common to psychologists. 28
Economists who work in the area broadly define happiness and/or subjective well-being as satisfaction with life in general. Indeed, the three sets of terms are used interchangeably in most studies. Most studies are based on a very simple set of survey questions that typically ask respondents “How satisfied are you with your life?” or “How happy are you with your life?” Critics used to defining welfare or utility in material or income terms bemoan the lack of precise definition in these questions. Yet the economists who use these surveys emphasize their advantages in making comparisons across cohorts of individuals—in which they find a surprising consistency in the patterns of responses both within and across countries—rather than in evaluating the actual happiness levels of specific individuals. Psychologists, meanwhile, find a significant degree of “validation” in subjective well-being surveys, wherein individuals who
6

report higher levels of happiness actually smile more, as well as meet several other psychological measures of well-being.29 Economists that work in the area have devoted a fair amount of attention to trying to explain the paradox that that improvements in living standards over time were not reflected in peoples’ answers to happiness surveys. Easterlin explained the anomaly by suggesting that absolute income levels matter up to a certain point—particularly when basic needs are unmet—but after that, relative income differences matter more. Decades earlier, Pigou reasoned that because the rich derive much of their satisfaction from their relative, rather than absolute, income, satisfaction would not be reduced if the incomes of all the rich were diminished at the same time, justifying redistributive taxation.30
Psychologist Ed Diener and his colleagues find a stronger relationship between income and happiness at the lower end of the income scale, and a flatter one at higher incomes that are well above subsistence levels. Across countries, they found a moderate relationship between affluence and life satisfaction.31 They based their analysis on a cross-section of 18,000 college students in thirty-nine countries (primarily developed economies), and on a ten-year (1971–81) longitudinal study of 4,942 adults in the United States.
Norms and expectations also adapt upward with economic progress. Thus the expected gains of income on happiness are mediated by the rising aspirations that accompany the income gains. Empirical studies support this proposition, showing a much stronger relation between income and happiness at the lower end of the income scale.32
Easterlin’s proposition about changing reference norms is supported by James Merton’s
well known sociological work, based on Stouffer’s analysis of the effects of promotions among U.S. military men. Stouffer found that infantry men, for whom promotion was quite rare, were much more satisfied with promotions when they occurred than were air force men, for whom upward mobility was the norm rather than the exception.33
At about the same time that Merton wrote his book, James Duesenberry explored the relationship between income aspirations and social status. His specific interest was in ascertaining how this relationship influences savings behavior, but the empirical work on which he based his analysis was remarkably similar to Merton's work. He relied on sociological research based in public opinion polls in the United States in the 1940s. He found that those in the highest income group surveyed stated that they needed a higher percentage increase in income to make their family live comfortably than did those in many lower income groups. 34 The importance placed on relative income and reference groups can lead to an ever-rising bar of perceived needs. In a classic work, Thorstein Veblen posits that in affluent societies, spending—and in particular conspicuous consumption—becomes the vehicle through which people establish social position. Several decades later, Juliet Schor cites repeated surveys showing that more than half of the population of the United States, the richest population in the world, say they cannot afford everything they really need.35
7

The importance of relative income differences to perceived well-being depends in part on social norms, which vary among societies. Under some norms, some societies, such as the United States, are more willing to tolerate higher levels of inequality in exchange for benefits (real or perceived) such as greater freedom or opportunity.36
The concept of changing reference norms and aspirations is also relevant to the economic development process in poor countries. An anecdotal example comes from Peru in the 1960’s. Richard Webb of the Instituto Cuanto interviewed a random sample of urban workers. Respondents of many different income levels were asked how much more income than they currently earned would they need to “live well”. The vast majority of respondents – across all income levels – responded that they would need twice as much as they currently earned.37
Increasing income levels and economic growth is a necessary if not sufficient condition
for development. And the process can be quite uneven. Thus aspirations and reference norms may adapt upwards well before significant sectors of society see the benefits. The integration of global markets, meanwhile, has been accompanied by a marked increase in the availability of global information regarding living standards within poor countries and beyond their borders. Many developing countries, particularly in Latin America, have large gaps between the very wealthy and the rest of society, gaps which are often exacerbated by integration into global markets. If skilled labor benefits disproportionately from the process, as has been the case in Latin America, narrowing the gaps, which requires expanding the pool of skilled labor, is likely to take an order of magnitude larger than it does to increase awareness about them. 38
The concepts of rising aspirations and relative deprivation are not at all new to the study
of development economics. They are highlighted in Hirschman’s work, for example. Yet these concepts are not well incorporated into our existing measures of progress, even though they may have significant effects on individuals’ assessments of their welfare.
The broader question posed by the Easterlin paradox – why countries do not get happier
as they get wealthier – is also very relevant to this discussion. At minimum it introduces a rather different element into the discussion of the tradeoffs involved for developing countries when they opt to pursue objectives other than growth, such as more equitable distribution and better social welfare systems. Our research on happiness in the developing countries of course cannot answer these widely debated questions. Yet perhaps it can provide some new insights into them.
The Economics of Happiness in Developing Countries: An Initial Exploration There are very few studies of happiness in the developing economies, and to the extent
they exist, they tend to cover individual countries. As far as we know, our study of reported well-being in Latin America and Russia is the first such study in a large sample of developing countries. 39 Our results strongly support the important role played by relative income differences, reference norms, and other non-income factors highlighted above. Indeed, we found that for the most part, the determinants of happiness were very similar in the developing economies as they are in the advanced economies.
Our work began as an attempt to better understand the determinants of income mobility
(as a proxy for the distribution of opportunities) in developing countries that are in the process of
8

opening their economies.40 In the process, we expanded our approach to examine the role of perceptions of past and future mobility, linking data on subjective well-being to detailed over time data on income mobility for the same respondents. We introduced this approach to data collection in Peru, and were subsequently able to apply it to data from Russia. Unfortunately, we did not have similar mobility data for the larger Latin America-wide sample, which is a large cross section survey of respondents in 17 countries.41 In Peru, we re-interviewed a sub-sample (500) of respondents in a large, nationally representative panel for 1991-2000, and asked a number of questions about their perceptions of their past progress and for their future prospects. We repeated this perceptions survey three years in a row.
Measurement Error and Other Concerns Prior to reviewing our results, it is necessary to mention possible sources of measurement
error in both our panel and perceptions data. Panel data on income mobility is rare, as it requires following individuals over a prolonged period of time. And the most obvious drawback of panel data is its scarcity. There is a paucity of such data, in large part due to the expense of generating it. There are only a small number of nationally representative panels for developing countries. Even then, the data is rarely without flaws. Respondents move, leading to attrition and possible bias. Attrition tends to be greatest at the tails of the distribution, as the wealthiest respondents tend to move to better neighborhoods, and the poorest ones move in with others or return to their places of origin.42 In addition, as respondents in the panel age, they also may become less representative of the population as a whole. Another problem with longitudinal data is accounting for error in reporting income, a problem that is gravely aggravated by policy shocks such as devaluations and/or high levels of inflation. People who are self employed or employed in the informal sector have a difficult time estimating any sort of monthly or annual salary, in part because their income fluctuates a great deal. Thus expenditure data is more accurate than income data for samples with large numbers of self employed and/or formal sector workers and agricultural workers. It is also more difficult to under or mis-report expenditures. Yet expenditure data miss part of the story, particularly at the upper end of the distribution, and do not capture volatility in income flows, as people tend to smooth their consumption where possible by dis-saving.
Adding perceptions data to longitudinal data has benefits, but creates its own set of
methodological problems. While happiness questions are not very useful in measuring the well-being of particular individuals, there is surprising consistency in the patterns of responses both within and across countries. Psychologists find that a number of well-being indicators validate how most individuals respond to happiness or life satisfaction surveys. The correlation coefficient between happiness and life satisfaction questions, meanwhile, is approximately .50, and the micro-econometric equations have almost identical forms.43
The data are most useful in the aggregate, as an individual’s answer to a question on
happiness can be biased by day to day events, and the same person’s answer could be quite different from day to day or year to year. The simple correlation from a regression of happiness in year two on happiness in year one was .2734 for our Russia sample, suggesting a significant
9
amount of fluctuation in happiness levels. (Given the highly volatile economic context in Russia during the period, this correlation is probably lower than the average for other countries.)
Accuracy in reporting is another major issue. Responses can be biased by the phrasing or the placement of questions in the survey. Another problem is bias introduced by different or changing reference norms. If you ask people how much income would they need to make ends meet, and/or to be happy, they usually base their answers on their existing income and increase it by some proportion, regardless of the absolute level. Alternatively, people base their answers on others in their community or others “like themselves”. When we asked people in our Peru survey to compare themselves with others in their community and then with others in their country, we found much more consistency in how respondents compared themselves to those in their community than to those in their country, as the latter is a much vaguer reference point.
There is clearly a large margin for error in both kinds of data. The most important, from
the perspective of our analysis, is that income gains could be mis-measured. Thus what we are recording as respondents’ positive or negative perceptions of those gains could instead be a more realistic assessment than what our measures report. While this may account for some of our findings, the positive correlation that we find between our reported perceptions and other contextual variables gives us some confidence that our results are not solely artifacts of error. Accepting that some error is likely and that caution is necessary in interpreting the results, we feel that they provide useful information that static income data alone would not.
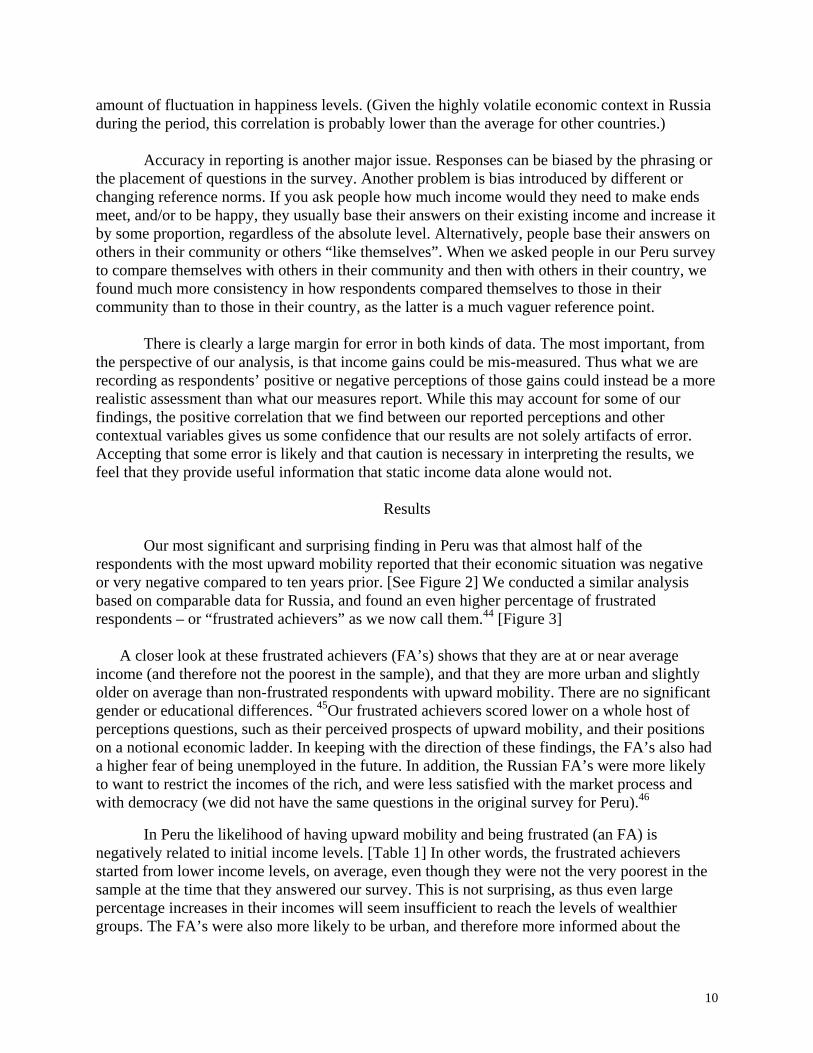
Results Our most significant and surprising finding in Peru was that almost half of the
respondents with the most upward mobility reported that their economic situation was negative or very negative compared to ten years prior. [See Figure 2] We conducted a similar analysis based on comparable data for Russia, and found an even higher percentage of frustrated respondents – or “frustrated achievers” as we now call them.44 [Figure 3] A closer look at these frustrated achievers (FA’s) shows that they are at or near average income (and therefore not the poorest in the sample), and that they are more urban and slightly older on average than non-frustrated respondents with upward mobility. There are no significant gender or educational differences. 45Our frustrated achievers scored lower on a whole host of perceptions questions, such as their perceived prospects of upward mobility, and their positions on a notional economic ladder. In keeping with the direction of these findings, the FA’s also had a higher fear of being unemployed in the future. In addition, the Russian FA’s were more likely to want to restrict the incomes of the rich, and were less satisfied with the market process and with democracy (we did not have the same questions in the original survey for Peru).46
In Peru the likelihood of having upward mobility and being frustrated (an FA) is
negatively related to initial income levels. [Table 1] In other words, the frustrated achievers started from lower income levels, on average, even though they were not the very poorest in the sample at the time that they answered our survey. This is not surprising, as thus even large percentage increases in their incomes will seem insufficient to reach the levels of wealthier groups. The FA’s were also more likely to be urban, and therefore more informed about the
10

lifestyles of others, including those of the very wealthy. There is, of course, also the possibility that initial income was mis-measured, which would over-state the gains that the FA’s made.
Assuming that all our findings are not caused by error, what explains these frustrations? Relative income differences could certainly be a plausible explanation. Both Peru and Russia have high degrees of inequality. The FA’s were more likely to score lower on the notional economic ladder in both surveys, as well as to compare their situations negatively to others in their community and their country in Peru (this latter question was not in the Russia survey).
A lack of adequate social insurance and insecurity could be another explanation. The
FA’s had a higher fear of unemployment than non-frustrated achievers. Thus even though the FA’s are doing well by objective income measures, they perceive that there is no guarantee of stability in their earnings levels. This is not surprising, given that both surveys were conducted in very volatile economic contexts, and the objective mobility data reveal a remarkable degree of vulnerability. A higher percentage of respondents went from “rags to riches” – or from the bottom to the top quintile in a ten year period in Peru (5%) than in a similar period in the United States (1%), for example.47 Yet a surprising 11% of respondents in the middle of the distribution (quintile 4 in Peru) fell back all the way to the bottom quintile, which is analogous to falling from the middle class into extreme poverty.
We explored whether the frustrated achievers suffered more from this volatility, which in
turn might drive some of their frustrations. Yet in Peru, the FA’s have less volatility in their income trajectory, as measured by the coefficient of variation, a puzzling result if uncertainty or volatility is an explanation for the frustrations. In Russia the coefficient of variation is higher, which at first glance seems a more intuitive finding.
Andrew Clark finds that respondents with greater income variance (controlling for levels)
are more tolerant of inequality in Britain, presumably because the variance signals that great gains or opportunities are possible.48 This is the opposite of our initial intuition, in which volatility produces insecurity and reduces well-being. It may be that some combination of both interpretations is at play: while our frustrated achievers may be concerned about inequality and unemployment, they may also view income variance as a reflection of new opportunities, at least in Peru. Tolerance for inequality varies across societies. There may be similar differences in tolerance for volatility related to inequality.
The fact that most of the FAs were at mean levels of education is probably relevant to the
discussion of volatility versus opportunity. In Latin America, with the opening of trade and capital markets in the 1990’s, those with higher levels of education are gaining high marginal returns compared to the rest of society, while those with secondary education are seeing decreasing marginal returns compared to those with primary education.49
Lastly, it is quite plausible that some of the frustrations that we find are driven by
individual character traits rather than by economic and other variables. There is probably some percent of every sample that will always be negative or unhappy, regardless of objective conditions. That led us to ask if our population samples were significantly different from others. Unfortunately, we do not, at this point, have similar income mobility and perceptions data for a
11

broader sample of countries, which would allow us to compare the percentage of frustrated achievers across countries. We were able to re-interview an urban sub-sample of our panel in 2003, and found that there are still frustrated achievers, although a slightly lower percentage of the (fewer) upwardly mobile respondents were frustrated (27% of our urban respondents were frustrated achievers in the 1991-2000 period, 18% were in the 2000-2003 period). The economy was contracting from 2000 to 2003, in contrast to the previous, rapid growth period. This suggests that frustrations decrease somewhat with aspirations, but that some percent of our sample may be frustrated regardless of conditions.50
We were able to explore the broader question of whether the determinants of happiness
differ in the developing economies from those in the advanced industrial economies. We compared the determinants of happiness in Latin America and in Russia with those of the United States. For the U.S., we used the pooled data for 1973-1998 from the GSS. For Russia, we used the most recent available survey (2000) from the Russian Longitudinal Monitoring Survey (RLMS). For Latin America, we relied on the 2001 Latinobarometro survey because it is the one year for which we have variables for both self reported health status and for being a minority, which makes it comparable to the U.S. and Russia surveys. [See Tables 2,3,4]
We find a remarkable degree of similarity in the effects of age, income, education,
marriage, employment, and health.51 In all contexts, unemployed people are less happy than others. Self employed people were happier in the U.S. and in Russia on average, while in Latin America, they were less happy. While in the U.S. self employment is a choice, in Latin America the self employed are often in the informal sector by default. Another difference is that women were happier than men in the U.S., while in Russia men were happier than women (due to disparities in status?). In Latin America there was no gender difference. Blacks are less happy than other races in the United States, and similarly, those that identify as minorities in Latin America are less happy. In contrast, minorities in Russia are happier than ethnic Russians.
We also found that, in both Latin America and Russia, happier people were more likely
to support market policies, to be satisfied with how democracy was working, and to prefer democracy to any other system of government. A cross canton study in Switzerland by Bruno Frey and Alois Stutzer finds that people who participate in direct democracy are happier than those who do not, all else being equal.52 While we do not have similar information on respondents’ voting patterns, our results do suggest a virtuous circle of sorts, between happiness and support for democracy (even though we cannot establish the direction of causality).
Happier people, on average, had higher prospects for their own and their children’s future
mobility; were more likely to believe that the distribution of income in their country was fair; placed themselves higher on a notional economic ladder; and had lower fear of unemployment.53 In contrast, the negative perceptions of our frustrated achievers in Peru and Russia are correlated with lower life satisfaction (happiness) scores; lower scores on a notional societal economic ladder (compared to non-frustrated respondents of comparable income levels); lower perceived prospects of upward mobility; higher fear of unemployment; and less satisfaction with market policies and a lower probability of preferring democracy as a system of government.
12
We are not aware of surveys in the OECD economies which take our approach and compare objective trends in income mobility with reported trends. However, there are some studies which link people’s perceptions about mobility – such as perceived prospects of upward mobility – with voting behavior and views about redistribution.54 Most of these studies suggest that societies with widely held faith in prospects for upward mobility are more tolerant of income inequality than those where social mobility is more limited. Roland Benabou and Efe Ok develop a model which they apply to data from the panel study on income dynamics (PSID) that shows that even though the majority of Americans are well below mean income, they do not vote for redistribution. This is because they believe that they will be above the mean in the future (even though this is an unrealistic expectation for the median voter).55
Alberto Alesina, Rafael di Tella, and Robert MacCulloch compare views about inequality
in the United States and Europe. They find that inequality has a modest negative effect on all respondents in Europe, and it is strongest for the poor. In contrast in the U.S., the only group that is made less happy by inequality are left-leaning wealthy respondents! They posit that differences in views about the prospects of upward mobility between the two continents explain their results. 56 This is something noted centuries ago by de Tocqueville in comparing the U.S. and Europe. In our own analysis of GSS data, we find that U.S. respondents that support redistribution are, on average, less happy than others.57
Our analysis of inequality in Latin America, noted above, suggests that it makes the rich
happier and the poor less happy, signaling persistent advantage for the former and disadvantage for the latter.58 We also examined responses to several questions related to redistribution. One asks respondents to place themselves on a nine point scale, where 1 is preferring more freedom and money and 9 is preferring more rules and equality. Respondents that had higher perceived prospects of upward mobility were wealthier on average and were less likely to prefer equality and regulation.59 This finding is similar to those for the U.S.
Rather surprisingly, wealthier people were more likely to support more taxation and
social spending. While a surprising 67% of respondents said that taxes should be lower even if social welfare spending suffers, it was the wealthier respondents that tended to disagree.60 At least some of these results reflect Latin Americans’ mistrust of the state’s ability to redistribute fairly rather than widely held beliefs about prospects for upward mobility (only 13% of Latin American respondents believe that the income distribution is fair or somewhat fair).61 The limited support for redistribution seems to be among wealthier groups. A positive interpretation is that this reflects enlightened self interest. Yet a more realistic one may be that the poor typically receive fewer benefits from state spending than do wealthier groups in the region, and public faith in the state’s capacity to redistribute fairly is quite minimal.
Rather surprisingly, we found that a remarkably similar percentage of respondents in the
United States and Latin America thought that their children would live better than they (57 and 58% respectively). In contrast, far fewer Latin American respondents than U.S. respondents felt that they lived better than their parents did.62 There still seems to be a surprising amount of faith in the region in individual effort and prospects for getting ahead.63 Some of this faith is, no doubt, based on respondents’ awareness that their children are likely to have, at the least, access to more and better quality education than they did. Some reflects hope and expectations as much
13

as anything else. For our Peru sample, we found that some of the same respondents that assessed their own situation more negatively than was warranted by objective income measures still assessed their children’s prospects in a positive light.
Those with higher prospects for upward mobility were also more likely to favor market
policies, to support democracy over any other system of government, and to place themselves higher on the notional economic ladder.64 In contrast, our frustrated achiever respondents in Peru and Russia, who on average had higher fear of unemployment and lower POUM scores, tended to be less supportive of market policies and of democracy. 65 Our findings yield notable public frustration, frustration which is linked to concerns about income differentials and unemployment and with reduced support for markets and democracy.
Causality Conundrums
While the frustrations and unhappiness that we find are indeed linked to policy relevant
questions, the direction of causality is not fully clear. We do not know whether policies and/or environments drive the frustrations, or whether underlying character traits (such as lower innate levels of happiness) drive negative assessments of policies and environments. In other words, it may well be that frustrated or unhappy people are more likely to be pessimistic about the future and concerned about relative income differences or insecurity.
At least some of the explanation for patterns in reported well-being lies in character traits. One of our studies in Russia finds that only 3% of the variation in happiness is explained by socioeconomic and demographic variables; the rest is either behavioral or error driven.66 Yet there also seems to be an explanatory role for factors that policy can influence, such as inequality, macroeconomic volatility, and large gaps in rewards to different skill cohorts.
In a recent study, we tried to get a better understanding of the interaction between
contextually driven attitudes and behaviorally driven ones. Based on Russian data for which we had observations on both happiness and income at two points in time, we found that behavioral traits had a role in explaining differences among individuals’ performances and outcomes.
We found that happier people earn more income in later periods, on average, than less
happy people.67 [Table 5] Our method of analysis entailed calculating the residual or unexplained happiness for each respondent in the first period – e.g. the happiness that was not explained by the usual socio-economic and demographic variables, something that must be close to the behavioral component of reported happiness. We included that residual as an independent variable with second period income as the dependent variable. Controlling for first period income, we found that our residual had positive and significant effects on second period income. We also found that happier people were healthier in future periods.
Accepting that there is a large margin for error and/or correlated error in this analysis, our
results suggest that happier people seem to earn more income, perform better in the labor market, and are healthier. Psychologists attribute traits such as positive outlook and high self-esteem (so-called positive cognitive bias) to happier people. It is not surprising that these traits also
14

contribute to productivity and health. A very tentative extension of these findings is that the frustrations of our achievers could be a signal of more negative future outcomes.
We also found that the correlation between happiness and future income was stronger for those at lower levels of income, while the role of first period income was more important for future income for those at higher levels of income. [Table 5] A positive outlook and high self-esteem may be valuable labor market assets for those with less assets or income, particularly for those who provide services. These traits probably matter less for those who have sufficient income or assets to leverage in making future gains.
We found that related perceptions variables had a similar relationship with future income.
Having a high POUM or placing oneself high on the notional economic ladder (ELQ) in the first period was positively correlated with higher levels of income in the second period. In contrast, having higher fear of unemployment was negatively correlated with future income (albeit only significant at the 10% level).[See Table 6] Respondents’ views or attitudes about their future prospects are correlated with their future outcomes and may play a role in determining those outcomes. It is likely that both happiness and perceptions variables are picking up similar character traits, such as optimism and self esteem.68
Indeed, it is plausible that some of what we find is explained by people’s abilities to
forecast or predict their future income, and thus first period attitudes merely reflect people’s knowledge of the future.69 The highly unstable nature of the Russian context, however, renders this unlikely as the entire explanation. There is broader psychological evidence that character traits have effects on individuals’ labor market performance and on their health outcomes.70 It may be that behavioral or attitudinal variables may be more important in extremely uncertain contexts such as in Russia, where it is more difficult to predict the future. Research based on comparable data for other countries is necessary to test such a proposition.
These results are suggestive and do not establish any direction of causality. It is possible
that causality runs both from policy relevant variables or factors such as economic performance to happiness, as well as in the other direction, or from third factors that influence both. What, then, are the implications?
At a minimum, it is clear that using longitudinal data on both mobility and on subjective well-being gives a very different picture than looking at standard income data in isolation. While it is fairly standard to equate well-being or utility with income, our research and that of many others suggests that there are very important non-income determinants of well-being, a finding which is in keeping with the broader questions raised by the Easterlin paradox. These elements of well-being also seem to have a correlation with labor market performance and future earnings outcomes. An unanswered question, however, is how can we most usefully – and prudently – incorporate these novel approaches and new kinds of data into the analysis of developing economies and into the policies that stem from that analysis.
Relevance of Happiness Research to Development Theory and Policy
The fairly new research on reported well-being in both developed and now developing
economies suggests that our standard assumptions about rationally calculated, income based
15

utility may not capture all of what drives economic behavior and determines welfare. In addition, the research may provide us with new tools to help answer questions over which there is much debate among economists and other social scientists, such as the effects of inequality on well-being and the relationship between economic growth (or lack thereof) and social unrest.
Perhaps the most notable finding from this research is the notable gaps between measures
of welfare as gauged in standard terms such as earned income or expenditures - and even other standard measures of development progress, such as gains in life expectancy, education, and reductions in infant mortality - and those reported in surveys of well-being. These complementary measures of welfare could inform our efforts to model and analyze economic behavior – and micro level responses to policy incentives. Yet this poses a conceptual as well as an empirical challenge, not least because there are times that the policy implications of findings from reported well-being surveys run in the opposite direction of what most development experts would consider “sound” policies.
One problem is that it is difficult to cleanly separate cause from effect when assessing the importance of these gaps. In other words, the differences between measured and reported welfare may be driven by the effects of non-income variables which our standard measures do not capture – such as job insecurity, relative income differences, and health and marital status. Yet it is also quite plausible that less happy people are more likely to attribute importance to these insecurities and differences, as well as less likely to be healthy and to get married.
Across countries, the Easterlin paradox suggests that there are limits to the extent that
income growth alone – and even aggregate improvements in important areas such as health and education - can increase average levels of happiness, as individuals’ adapt their expectations upwards as societies progress. A strict interpretation of the “set point” theory would suggest that happiness surveys cannot offer any realistic insights for policy, as virtually nothing will make people happier for long.
There is some debate about the long-term consequences of events like serious illness,
unemployment, and losing a spouse for people’s happiness, with some studies suggesting that they are permanent, while others show that with sufficient time individuals adapt to virtually any event, including divorce or serious illness.71 Cross section studies of happiness within societies consistently conclude that individuals value things like health, stable employment, and marriage as much as, if not more than, income, and at the same time adapt less – or less quickly – to changes in these realms than to changes in income. Indeed, it may well be that changes in these variables, such as getting married or divorced – and related leads and lags – are the main drivers of these results, while the extent to which the effects last is less clear (and most likely varies across variables). 72 And even if happiness levels eventually adapt upwards to a longer term equilibrium (after a negative shock like illness or divorce), mitigating or preventing the unhappiness and disruption that individuals experience for months, or even years, in the interim certainly seems like a worthwhile objective for policy.
Across nations there are diminishing returns to increasing income. Yet there are other
things that correlate with national income, such as health, quality of government, and respect for human rights, which seem to correlate with higher happiness levels. There is also some evidence that perceived equity in the distribution of income or rewards can matter as much to people’s
16

happiness as the rewards themselves. All of this suggests that happiness surveys - if used cautiously and with awareness that they do not well reflect long-term gains in income and health, which are important to the welfare of the poor - may broaden our understanding of a number of development questions.
Reported well-being seems to be correlated with economic outcomes. Reported happiness
and many related perceptions, such as people’s perceived prospects of upward mobility (which are highly correlated), are correlated with economic outcomes and with political views. No doubt some of what we might consider “effect” is individuals’ abilities to predict or forecast their future outcomes. Yet there is also psychological evidence that character traits, such as high self esteem and optimism, have effects on individuals’ labor market performance and on their health outcomes. Thus a remaining challenge is how to better account for the role of subjective well-being and related perceptions in explaining individual economic and political behavior. Addressing such questions might enhance our understanding of development challenges such as persistent poverty traps, in which low expectations play a role in the willingness of the poor to both take risks and make investments in their children’s future.
The same psychological factors that affect subjective evaluations of well-being also seem to explain individuals’ abilities to adapt to tremendous adversity and/or negative shocks and often even to return to previous levels of happiness. A nuanced view of adaptation – to either negative shocks or to the disruptions and changes that often accompany economic progress and development – is that the process is very much moderated by peoples’ norms about equity and perceptions of fairness. This helps to explain why there is often unexpected social stability in very poor societies, and, at the same time, unexpected outbreaks of violence and social unrest in societies where there is a great deal of economic progress – but differential rewards to different cohorts. Our upwardly mobile frustrated respondents are a case in point.
A remaining challenge is better understanding the interaction between norms about
fairness and equity with economic progress and change – including integration into global markets and information systems.73 Tolerance for inequality seems higher in contexts where there are perceived (even if not real) prospects for upward mobility.74 Downward mobility, meanwhile, or the threat thereof, is more likely to cause frustration and social unrest than is persistent poverty, as in the case of our frustrated achievers in Peru and Russia, or more generally as in Argentina in the late 1990’s.
Our own research results suggest that we underestimate the effects of macroeconomic volatility, unstable employment, and highly unequal income distributions on the well-being of individuals in the developing economies. One logical policy implication is the need for better social insurance and social policies in these countries. Not only the very poor but those in the middle of the distribution are often very vulnerable to falling into poverty.75 While such policy conclusions are hardly novel ones, what is novel is their strong backing in individual welfare assessments rather than in a more general political or public policy debate, as is usually the case.
The more fundamental point is that broader and/or novel measures of welfare can help us
better understand development outcomes, both positive and negative. Surveys of reported well-being are a helpful tool, although alone are insufficient. Their potential contribution increases markedly when they can be matched with objective (and hopefully sound) income data for the
17

same respondents. Yet caution is necessary when using this information as the basis for policy, particularly when surveys are conducted in unstable economic and political climates.
In the end, many of the results from surveys of reported well-being – or put more simply,
from asking people what is important to their own welfare – drum home an old saw that seems to need constant reinforcing: growth is a necessary but not sufficient condition for poverty reduction. Other key factors - such as public investments in health; institutions that can ensure adherence to basic norms of equity and fairness; and collective investments in social insurance to protect workers from the volatility that often accompanies integration into global markets - are essential to sustaining the gains that growth and development bring about, and for increasing the chances that larger numbers of the world’s poor can eventually lead happy and fulfilling lives.
1 Easterlin used thirty surveys from nineteen countries, including some developing countries. See Richard A. Easterlin, “Does Economic Growth Improve the Human Lot? Some Empirical Evidence.” In Nations and Households in Economic Growth, edited by Paul A. David and Melvin W. Reder. New York: Academic Press (1974); “Will Raising the Incomes of All Increase the Happiness of All?” Journal of Economic Behavior and Organization 27 (June): 35–48, 1995; “Life Cycle Welfare: Trends and Differences.” Journal of Happiness Studies, Vol. 2, pp.1–12, 2001; and “Income and Happiness: Towards a Unified Theory”, The Economic Journal, Vol.111, No.473, (July) 2003. He also finds that health is a demographic variable with clear effects on happiness in all societies, a finding that other studies corroborate. For an excellent summary of many of these studies, see the October 4 issue of the New Scientist magazine. 2 Easterlin (1974); and David Blanchflower and Andrew Oswald, “Well-being in Britain and the USA”, Journal of Public Economics, Vol.88 (2004), pp.1359-1387. They find that well-being in the U.S. has trended slightly downwards, while in the UK it has trended slightly upwards. See also Ed Diener, “Subjective Well-Being.” Psychological Bulletin 95 (3): 542–75, 1984; and Bruno Frey and Alois Stutzer, Happiness and Economics (Princeton: Princeton University Press, 2000). 3 For an excellent review of the relationship between health and development (and the links or lack thereof to inequality) see Angus Deaton, “Health, Inequality, and Development”, Journal of Economic Literature, Vol. XLI, March 2003, pp.113-158. 4 I thank an anonymous reviewer for making this point. 5 An additional – and in some cases plausible – explanation for the paradox is that happiness questions – which are usually based on a four or seven point scale – have an upper bound, while progress does not. This may help explain some of the cross country conundrum, but does not explain why happiness levels have fallen after forty years of economic progress in Japan, for example. 6 Easterlin discusses arguments in favor and against the “set point” theory in Richard Easterlin, “Explaining Happiness”, Inaugural Article Special Series by Newly Elected Members, National Academy of Sciences, Volume 100, No.19, September 4, 2003. More recently, an over-time study of monozygotic and dizygotic twins in Denmark finds that reported happiness has some genetic components, but is also shaped importantly by experiences with partners and children. See Hans-Peter Kohler, Jere Behrman, and Axel Skythe, “Partner + Children = Happiness?: An Assessment of Fertility and Partnerships on Subjective Well Being”, Mimeo, Departments of Economics and Sociology, University of Pennsylvania, April 2005. 7 The paradox of reported happiness going down while objective measures of progress – such as health and life expectancy go up – is discussed in the case of the U.S. by Gregg Easterbrook in The Progress Paradox: How Life Gets Better While People Feel Worse (New York: Random House, 2003). 8 Easterlin’s work posits that people adapt and recuperate much faster from pecuniary changes or shocks (upwards or downwards) than they do to changes in non-pecuniary areas such as marriage or health. His data shows that individuals never adapt fully to significant marital or health shocks. In contrast, work on the German socio-economic panel suggests that people eventually adapt fully from the negative effects of divorce. See Richard Easterlin, “Explaining Happiness”, Proceedings of the National Academy of Sciences, Vol.100, No.19, September 16, 2003.
18

9 For the negative effects of unemployment, for example, see Andrew Clark and Andrew Oswald, “Unhappiness and Unemployment”, The Economic Journal, Volume 104, Issue 424, pp.648-659; on income volatility, see Graham and Pettinato (2002); and on crime, see Nattavudh Powdthavee, “Happiness and the Standard of Living: The Case for South Africa”, Economica (forthcoming). . 10 See Frey and Stutzer (2002); Diener (2004). For an excellent review of the findings of happiness research for policy in an advanced economy, see Nick Donovan and David Halpern, “Life Satisfaction: The State of Knowledge and Implications for Government”, Mimeo, Strategy Unit, Office of the Prime Minister, United Kingdom, December 2002. 11 John Helliwell, J.F., “Well-being and Social Capital: Does Suicide Pose a Puzzle?”, Unpublished manuscript; University of British Columbia, Vancouver (2003); cited in Ed Diener and Martin E.P. Seligman, “Beyond Money: Toward an Economy of Well-being”, Psychological Science in the Public Interest, Volume 5, No.1, 2004 (forthcoming). . 12 Graham and Pettinato (2002). 13 I thank Andrew Oswald for a discussion of this point. 14 Experimental studies, such as the Ultimatum game, find that people are willing to turn down fairly large amounts of “reward” money rather than accept a reward that is unfairly divided between two people. Oswald (2003) finds that worker’s place a higher value on rank in a firm – and how their salary compares to other co-workers, than to the actual amount of salary. Hagerty (2000) finds that, controlling for personal income, individuals living in higher income areas in the U.S. were lower in happiness than those living in lower income areas. 15 They use two specifications as proxies for relative income. The first is the ratio of individual income to state income per capita (controlling for regional housing prices) and the second is a series of variables which measure income relative to the average level of income in each of the different quintiles of income within the person’s state. In both instances, greater relative differences make people less happy, and in the latter instance, the greatest effects come from the ratio of individual income to income in the top quintile. See Blanchflower and Oswald (2004). 16 See Carol Graham and Andrew Felton, “Does Income Inequality Matter to Individual Welfare? An Initial Exploration Based on Happiness Surveys from Latin America”, Center on Social and Economic Dynamics Working Paper Series No.37, The Brookings Institution, January 2005. 17 See Rafael Di Tella, Robert MacCulloch, and Andrew Oswald, “Preferences for Inflation and Unemployment: Some Evidence from Surveys of Happiness”, The American Economic Review, Vol.91, No.1, pp.335-341 18 On inflation, see Graham and Pettinato (2002); on unemployment, see Andrew Eggers and Carol Graham, “The Costs of Unemployment in Latin America”, Mimeo, The Brookings Institution (2004). The unemployment finding is significant at the 5 or 10% level, depending on the specification. One explanation for the mixed results is the large proportion of the population in the informal sector, and therefore not directly affected by the unemployment rate. 19 See Andrew Eggers, Clifford Gaddy, and Carol Graham, “Well-being and Unemployment in Russia in the 1990’s: Can Society’s Suffering Be Individuals’ Solace?”, Journal of SocioEconomics, forthcoming. 20 In the first three years of the financial crisis in Indonesia of the late 1990’s, 20% of the population was below the poverty line at any given point in time. Yet 50% of the population was in poverty at some point during the three year period. See Lant Pritchett, Asep Suryahadi, and Sudarno Sumarto. 2000. “Quantifying Vulnerability to Poverty: A Proposed Measure with Application to Indonesia.” Washington: World Bank (January).
21For a discussion of the extent of drops into poverty during financial market crises, for example, see William Cline, “Financial Crises and Poverty in Emerging Market Economies”, Center for Global Development, Working Paper #8, June 2002. For a discussion of insecurity among the middle class, see Nancy Birdsall, Carol Graham, and Stefano Pettinato, “Stuck in the Tunnel: Has Globalization Muddled the Middle Class?”, Center on Social and Economic Dynamics Working Papers # 13, The Brookings Institution, August 2001. 22 Even then they usually cover short time periods – say 1 to 3 years – and are rarely nationally representative samples. 23 Gurr relies on his well known data base, as well as on earlier data for 1948 conflicts. Gurr’s data base can be found at www.bsos.umd.edu/cidcm/mar . The full study is in Ted Robert Gurr, Why Men Rebel (Princeton: Princeton University Press, 1970). 24 See Collier, Lanki Elliott, Havard Hegre, Anke Hoeffler, Marta Reynal-Querrol, and Nicholas Sambanis, Breaking the Conflict Trap: Civil War and Development Policy (Washington, D.C.: The World Bank and Oxford University Press, 2003); and Nicholas Sambanis, “Poverty and the Organization of Political Violence: A Review and Some Conjectures”, in Susan Collins and Carol Graham, eds., Brookings Trade Forum 2004: Globalization, Poverty, and Inequality (Washington, D.C.: The Brookings Institution Press, forthcoming
19

25 Albert O. Hirschman, “Changing Tolerance for Income Inequality in the Course of Economic Development.” Quarterly Journal of Economics 87 (November): 544–66, 1973. 26 For a summary of the critiques of the use of survey data, see Marianne Bertrand and Sendhil Mullainathan “Do People Mean What they Say? Implications for Subjective Survey Data.” Cambridge, Mass.: National Bureau of Economic Research. (2001). 27 See, among others, John Conlisk “Why Bounded Rationality?” Journal of Economic Literature 34 (June): 669–700, 1996; and Herbert Simon “Rationality as a Process and Product of Thought.” American Economic Review 68 (May, Papers and Proceedings): 1–16, 1978. 28 A notable recognition of the behavioralist approach was the awarding of the 2002 Nobel Prize in Economics to Daniel Kahneman, a psychologist. 29 See, for example, Ed Diener and Robert Biswas-Diener “Income and Subjective Well-Being: Will Money Make Us Happy?” University of Illinois, Department of Psychology (December) 2000; and Diener and Seligman (2004). 30 A.C. Pigou, The Economics of Welfare. (London: Macmillan 1920), p.53. 31 Ed Diener et al., “The Relationship Between Income and Subjective Well-Being: Relative or Absolute?” Social Indicators Research 28: 195–223, 1993. 32 Some scholars also find an additional effect at the very top of the scale, which might be explained by greed or changing preferences resulting from high levels of wealth. See Michael Argyle “Causes and Correlates of Happiness.” In Daniel Kahneman, Ed Diener, and Norbert Schwarz, Well-Being: The Foundations of Hedonic Psychology (New York: Russell Sage Foundation, 1999), 353–73. Ruut Veenhoven, meanwhile, finds that the correlation between income and happiness is much greater in poor countries. See Veenhoven, “Is Happiness Relative?” Social Indicators Research 24: 1-34, 1991. 33 See Stouffer’s account as summarized in Robert Merton, Social Theory and Social Structure (Glencoe, Ill.: Free Press of Glencoe, 1957). I thank George Akerlof for pointing me in the direction of Stouffer’s work. 34 James Duesenberry Income, Saving, and the Theory of Consumer Behavior. (Cambridge: Harvard University Press, 1949, pp.47-50). Kapteyn’s more recent work on savings in the Netherlands supports these results. See Arie Kapteyn, “Savings and Reference Groups.” Paper presented to MacArthur Network on Inequality and Social Interactions. The Brookings Institution, Center on Social and Economic Dynamics (December 1999 ). 35 Veblen, The Theory of the Leisure Class (USA: Viking Penguin, Inc.,1967); Schor, The Overspent American: Why Want What We Don’t Need (U.S.A: Basic Books, 1998). 36 For different societies’ tolerance for inequality, see Gosta Esping-Andersen, 1990. Three Worlds of Welfare Capitalism (Princeton: Princeton University Press, 1990). For an excellent overview of trends in mobility and opportunity in the United States, see Daniel McMurrer and Isabel Sawhill, Getting Ahead: Economic and Social Mobility in America (Washington, D.C.: Urban Institute Press, 1998). For a brief account of divergences between public beliefs and recent trends, see Carol Graham and Peyton Young, “Ignorance Fills the Income Gulf, The Boston Globe, June 23, 2003. 37 Richard Webb survey cited in Oiga magazine, Lima, circa 1965. 38 For trends in inequality related to the opening of capital markets and the liberalization of trade in Latin America, see Jere Behrman, Nancy Birdsall, and Miguel Szekely, “Economic Reform and Wage Differentials in Latin America”, Carnegie Endowment Working Papers, November 2001. 39 See Graham and Pettinato (2002); Graham and Pettinato, “Frustrated Achievers: Winners, Losers, and Subjective Well-being in Emerging Market Economies, Journal of Development Studies, Vol. 38, No.4, April 2002; and Graham and Pettinato, “Happiness, Markets, and Democracy: Latin America in Comparative Perspective”, Journal of Happiness Studies, Vol. 2, 2001). There have been some smaller studies in particular countries, such as Ceema Namafie and Peter Sanfey in Kyrgystan, Mariano Rojas in Mexico, and Martin Ravallion and Misha Lokshin in Russia. See Namafie and Sanfey, “Happiness in Transition: The Case of Kyrgyzstan.” Discussion Paper 40. London School of Economics, Distributional Analysis Research Programme, July 1998); Rojas, “Happiness and Public Policy: Political Economy Considerations”, Paper presented to the Fifth Conference of the International Society for Quality of Life Studies (ISQOLS), Frankfurt, July 2003; and Ravallion and Lokshin in Russia. (See “Subjective Economic Welfare.” Policy Research Working Paper 2106. Washington: World Bank, April, 1999). As far as we know, there are no other region-wide studies in the developing countries. Berndt Hayo has recently completed a study in the transition economies in Eastern Europe (see “Happiness in Eastern Europe: Paper Presented to the Fifth Conference of the ISQOLS, July 2003).
20

40 For detail on the data and the underlying methodology, see Graham and Pettinato (2002) and Carol Graham, “Happiness and Hardship: Lessons from Panel Data on Mobility and Subjective Well-being in Peru and Russia”, Paper presented to DFID-ODI-DPU Conference on Longitundinal Data, London, May 2003. For an excellent summary of the few mobility studies that do exist in the LDCs, see Bob Baulch and John Hoddinot, “Economic Mobility and Poverty Dynamics in Developing Countries.” Journal of Development Studies 36 (August ): 1–24 (2000). 41 The Latinobarometro survey consists of approximately 1000 interviews in 17 countries in Latin America, providing 17,000 observations for statistical analysis. The samples are conducted annually by a prestigious research firm in each country, and are nationally representative except for Brazil and Paraguay. The survey is produced by the NGO Latinobarometro, a non-profit organization based in Santiago de Chile and directed by Marta Lagos (www.latinobarometro.org). The first survey was carried out in 1995 and covered 8 countries. Funding began with an grant from the European Community and is now from multiple sources. Access to the data is by purchase, with a 4 year lag in public release. Graham has worked with the survey team for years and assisted with fund raising, and therefore has access to the data. 42 In our studies, we had a 38% attrition rate over a 5 year period in Russia, and a 25% attrition rate for the 3 year period covered by our perceptions survey in Peru (for the 1991-2000 living standards measurement survey, we had less attrition). 43 Blanchflower and Oswald (2004) get a correlation coefficient of .56 for British data for 1975-1992 where both questions are available; Graham and Pettinato (2002) get a correlation coefficient of .50 for Latin American data for 2000-2001, in which alternative phrasing was used in different years. 44 The Peruvian data are in expenditures and the Russian data are in income. The uncertain economic context in Russia and the income data makes potential error an even larger problem. In one attempt to correct for error, we eliminated the roughly 60 zero income respondents from our Russia panel, as many of them also reported that they were employed. 45 For a complete picture of the statistically significant differences between frustrated and non-frustrated upwardly mobile respondents, see Graham and Pettinato (2002), Chapter 4. 46 In an initial and at this point cursory analysis of the 2003 Peru survey data, Graham and Margaret MacLeod (Mimeo, The Brookings Institution, 2003) find that the frustrated achievers are less likely to favor democracy, but there is no link with market policies. Yet the results are also not fully comparable as a much lower number of respondents had upward mobility during this latter period and thus there was a far lower percentage of frustrated achievers. 47 In both these cases, some of the mobility that we find could be driven by newly educated individuals entering the labor force. Yet as neither study controls for this, the rates are comparable – if perhaps slightly higher than they would be if we were able to implement such controls. 48 Andrew Clark, “Inequality-Aversion and Income Mobility: A Direct Test”, Mimeo, DELTA, Paris, June 2003. 49 See Behrman, Birdsall, and Szekely (2001). 50 See Carol Graham and Margaret MacLeod, “Curmudgeons or Frustrated Achievers? Economic Adjustment, Mobility, and Unhappiness in Peru, 2000-2003”, Mimeo, The Brookings Institution, 2004. 51 The coefficient on marriage for Latin America is positive but short of significant for the 2001 sample. For other years for which we have data, the coefficient on marriage is positive and significant. 52 Frey and Stutzer (2002). 53 The ELQ question asked respondents to place themselves on a 9 step ladder representing their society, where the poor are on step 1 and the rich are on step 9. Support for market policies was measured by an index based on several scaled questions about the private sector, foreign investment, free trade, and privatization. For detail, see Graham and Pettinato (2002). 54 See, for example, Roland Benabou and Efe Ok, “Social Mobility and the Demand for Redistribution: The POUM Hypothesis.” Working Paper 6795. Cambridge, Mass.: National Bureau of Economic Research, 1998; and Thomas Piketty, “Social Mobility and Redistributive Politics.” Quarterly Journal of Economics 110 (August): 551–84, 1995. 55 Benabou and Ok (1998). 56 See Alberto Alesina, Rafael di Tella, and Robert MacCulloch, “Inequality and Happiness: Are Europeans and Americans Different?” Harvard University and London School of Economics, December 2000. Skeptics of this study question the results. One potential problem is the extent to which within state inequality is a useful or realistic reference point for U.S. respondents.
21

57 See Carol Graham, “The Role of Government in Enhancing Opportunities for the Poor: Economic Mobility, Public Attitudes, and Public Policy” in Gary Fields and Guy Pfeffermann, eds., Pathways Out of Poverty: Private Firms and Economic Mobility in Developing Countries (Kluwer Academic Publishers, 2003). 58 Graham and Felton (2005). 59 In a regression with the variable EQUALSUP as the dependent variable, the coeffiicent on our propects of upward mobility variable – POUM – was negative and significant. The coefficient on the wealth index was positive and significant. It even remained positive when we squared it to see if there were differences in the attitudes of the very wealthy. Results available from the author. 60 We also split the sample (according to two different methods) into those respondents that were likely to pay taxes and those that were not, but did not get results that were significantly different. See Graham and Sukhtankar (2003). 61 In an earlier study we found that support for redistribution was lower in poorer, more unequal countries in the region than in the wealthier ones, while within countries wealthy people were more likely to favor productivity over redistribution. This finding is based on a question in the 1998 Latinobarometro asking respondents if what their country needs most to get ahead is more redistribution or more productivity. For detail, see Graham and Pettinato 2002, chapter 3. 62 The U.S. data are from the General Social Survey (GSS) while the Latin American data are from the 2001 Latinobarometro. For a detailed discussion, see Graham, “Crafting Sustainable Social Contracts in Latin America: Public Attitudes and Political Economy”, Center on Social and Economic Dynamics Working Papers #29, The Brookings Institution, July 2002. 63 Authors’ calculations based on GSS data and on the 2000 Latinobarometro survey. 64 See Graham and Pettinato (2002). 65 See Graham and Pettinato (2002). 66 See Carol Graham, Andrew Eggers, and Sandip Sukhtankar (2004), “Does Happiness Pay? An Exploration Based on Panel Data from Russia”, Journal of Economic Behavior and Organization, Vol.55 (July), pp.319-342. 67 See Graham, Eggers, and Sukhtankar (2004). 68 It is plausible, of course, that these results are also error driven, and that in the presence of measurement error, the effects of mis-measured variables are projected onto variables that are correlated with them. I thank Angus Deaton for raising this point. 69 I would like to thank a number of participants at the Brookings Warwick Conference on: “Why Inequality Matters: Lessons for Policy from the Economics of Happiness”, June 2003, for discussing this insight, and in particular Gary Burtless for raising the point. 70 Diener and Seligman (2004); R. Cummins and H. Nistico, “Maintaining Life Satisfaction: The Role of Positive Cognitive Bias” Journal of Happiness Studies (forthcoming). 71 Easterlin (2003) discusses this in general. In addition, several studies find that unemployment in particular has permanent effects on happiness, meanwhile. See Andrew Clark, Ed Diener, Yannis Georgellis, and Richard E. Lucas, “Unemployment Alters the Set Point for Life Satisfaction”, Mimeo, Department of Psychology, University of Illinois, 2004; and Darity, William, Jr. and Arthur H. Goldsmith, “Social Psychology, Unemployment, and Macroeconomics”, The Journal of Economic Perspectives, Vol.10, Issue 1, pp.121-140. 72 I would like to thank Angus Deaton for raising the point about the effects of changes. He cites evidence from the German GSEOP panel which shows that people adapt to the welfare losses of marriage or widowhood in about seven years. Our own work finds that during a five year period in Russia, the single most detrimental event for our sample of respondents was getting divorced. While our respondents may have adapted after the five period of study, they were significantly less happy than others during that period. See Graham, Eggers, and Sukhtankar (2004). 73 Norms about what is fair are endogenous to policy choices in the long run. The importance accorded to unions, for example, has long run effects on their bargaining power. Tony Atkinson makes the point that the loss of union power played a role in the reduced relative wages of blue collar workers, and now a bigger gap has become more acceptable. See Atkinson chapter in Vito Tanzi, Ke-Young Chu, and Sanjeev Gupta, eds., Economic Policy and Equity (Washington D.C., International Monetary Fund, 1999). 74 For a short critique of the gaps between perceived equality of opportunity in the United States and the empirical evidence, see Graham and Young (2003). 75 Even temporary drops into poverty can have lasting costs. For the effects of financial crises on poverty in emerging market countries, see Cline (2002). For the effects of financial market integration, see Eswar Prasad, Kenneth Rogoff, Shang-Jin Wei and Ayhan Kose, “Effects of Financial Globalization on Developing Countries:
22

Some Empirical Evidence”, IMF Occasional Paper 220, 2003. For the proximity of the near poor to the poor, see Nancy Birdsall, “Open Economy Social Contract”, Economia, forthcoming.
23
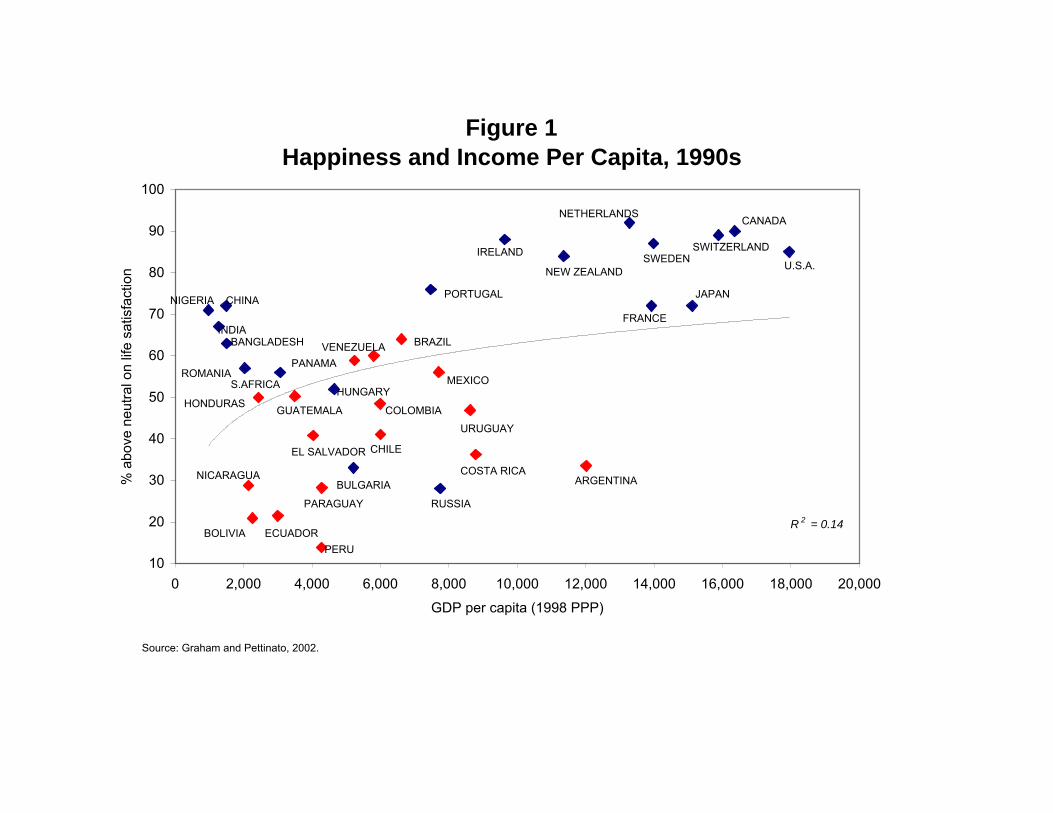
Source: Graham and Pettinato, 2002.
Figure 1Happiness and Income Per Capita, 1990s
R 2 = 0.14
10
20
30
40
50
60
70
80
90
100
0 2,000 4,000 6,000 8,000 10,000 12,000 14,000 16,000 18,000 20,000
GDP per capita (1998 PPP)
% a
bove
neu
tral o
n lif
e sa
tisfa
ctio
n
ARGENTINACOSTA RICA
URUGUAY
MEXICO
BRAZIL
COLOMBIA
NICARAGUA
BOLIVIA ECUADORPERU
PARAGUAY
EL SALVADOR CHILE
GUATEMALAHONDURAS
PANAMAVENEZUELA
U.S.A.
PORTUGAL
RUSSIA
BULGARIA
CHINANIGERIA
INDIABANGLADESH
ROMANIAS.AFRICA
HUNGARY
IRELAND
NEW ZEALAND
FRANCE
JAPAN
SWEDEN
NETHERLANDS
SWITZERLAND
CANADA

Very Negative
NegativeIndifferent
PositiveVery positive100+
99 to 30
30 to -30
-30 to less
0510152025303540
%
Perceived mobility
Objective mobility (% income change)
ON-THE-MARK'SFRUSTRATEDACHIEVERS
POLLYANNAS
Figure 2: Long term Perceived Mobility vs. 1991-00 Income MobilityPeru 2000
Source: Graham and Pettinato, 2002.

Very Negative
NegativeIndifferent
PositiveVery positive100+
99 to 30
30 to -30
-30 to less
0510
15
20
25
30
35
40
45
%
Perceived mobility
Objective mobility (% income change)
Figure 3: Perceived Past Mobility vs 1995-99 Income MobilityRussia, 1999
ON-THE-MARK'SFRUSTRATEDACHIEVERS
POLLYANNAS
Source: Graham and Pettinato, 2002.

Table 1: Frustrated Achievers in Peru, 1991 - 2000Dependent variable: Frustrated Achiever = 1; not = 0
Equation 1 Equation 2Independent variables coef z coef zAge 0.025 3.30 0.025 3.29Male -0.012 -0.05 -0.005 -0.02Years of education 0.042 1.61 0.051 1.93Married -0.207 -0.89 -0.209 -0.89Urban 1.495 3.58 1.349 3.35Log equiv expend. '91 -1.229 -6.04 −− −−Equivalent expend. '91 −− −− 0.000 -5.70constant 6.437 4.13 -2.471 -4.23observations 500 500Pseudo R-squared 0.0968 0.1093
* Logit estimation
Source: Graham and Pettinato, 2002.

Table 2: Happiness in Latin America, 2001
Dependent Variable: Happiness
Independent variables Coef. z
Age -0.025 -4.21Age squared 0.000 4.72Male -0.002 -0.07Married 0.056 1.63Log wealth index 0.395 10.56Years of education -0.003 -0.64Minority -0.083 -2.49Student 0.066 1.01Retired -0.005 -0.06Homemaker -0.053 -1.04Unemployed -0.485 -7.54Self employed -0.098 -2.33Health (self-reported) 0.468 24.58
Pseudo R 2
Number of obs.
* Ordered logit estimation; country dummies included but not shown.
Source: Latinobarometro, 2001. Author's calculations.
0.06215209

Table 3: Happiness in Russia, 2000
Dependent Variable: Happiness
Independent variables Coef. z Age -0.067 -7.42Age squared 0.001 7.15Male 0.152 2.80Married 0.088 1.40Log equivalent income 0.389 11.48Education Level 0.015 0.96Minority 0.172 2.46Student 0.199 1.59Retired -0.378 -3.97Housewife 0.049 0.33Unemployed -0.657 -6.51Self employed 0.537 2.23Health index 0.446 3.82
Pseudo R 2
Number of obs.
* Ordered logit estimation Source: Graham, Eggers, Sukhtankar (forthcoming).
51340.033

Table 4: Happiness in the U.S., 1972 - 1998
Dependent Variable: Happiness
Independent variables Coef. z
Age -0.025 -5.20Age squared 0.038 7.53Male -0.199 -6.80Married 0.775 25.32Log income 0.163 9.48Education 0.007 1.49Black -0.400 -10.02Other race 0.049 0.59Student 0.291 3.63Retired 0.219 3.93Housekeeper 0.065 1.66Unemployed -0.684 -8.72Self employed 0.098 2.29Health 0.623 35.91
Pseudo R 2
Number of obs.
* Ordered logit estimation; year dummies included but not shown.
Source: GSS data, Author's calculations.
0.07524128

Table 5: The effects of happiness on income in Russia, 1995-2000
Dependent Variable: Log equivalence income, 2000 (OLS)a b c
Independent variables coef t coef t coef tAge -0.013 -3.00 -0.013 -2.97 -0.015 -3.25Age squared 0.000 3.18 0.000 3.15 0.000 3.52Male 0.010 0.42 0.010 0.42 0.000 -0.02Married 0.205 7.84 0.205 7.84 0.205 7.84Education level 0.030 4.51 0.030 4.51 0.030 4.44Minority 0.121 3.98 0.123 4.03 0.122 4.00Student -0.034 -0.34 -0.030 -0.31 -0.037 -0.38Retired -0.191 -4.85 -0.190 -4.83 -0.166 -4.18Housewife -0.249 -3.90 -0.249 -3.90 -0.239 -3.73Unemployed -0.345 -8.16 -0.344 -8.12 -0.343 -8.07Self employed 0.142 1.46 0.141 1.46 0.128 1.33Health index 0.060 1.11 0.059 1.09 0.056 1.04Log equiv income 95 0.242 18.11 0.243 18.12 0.224 15.69Log equiv income 95, poor** * * * * 0.009 2.60Log equiv income 95, rich** * * * * 0.018 4.36Unexplained happiness, 95*** 0.030 2.64 0.063 2.32 0.027 2.38Unexp. happiness, 95***, 2nd quint * * -0.044 -1.14 * *Unexp. happiness, 95***, 3nd quint * * -0.036 -0.95 * *Unexp. happiness, 95***, 4th quint * * -0.063 -1.71 * *Unexp. happiness, 95***, 5th quint * * -0.023 -0.65 * *constant 5.833 36.35 5.823 36.19 5.936 34.62number of observations 4457 4457 4457adjusted R-squared 0.134 0.133 0.152
* omitted** "poor" is defined as bottom 40% of the income distribution in 1995; "rich" is the top 20%*** the residual of basic happiness 1995 regression
Regression a: no income quintile distinctionsRegression b: testing for a difference in the effect of unexplained happiness on 2000 income, by 1995 income quintileRegression c: testing for a difference in the effect of 1995 income on 2000 income, by 1995 income quintile
Independent variables are from 2000 unless otherwise noted.
Source: Graham, Eggers, and Sukhtankar (forthcoming).

Table 6: Effect of perceptions variables on future income in Russia, 1995- 2000
Dependent variable: log equivalence income in 2000 (OLS)a b
Independent variables coef t coef tAge -0.013 -3.00 -0.009 -0.78Age squared 0.000 3.18 0.000 1.24Male 0.010 0.42 -0.008 -0.23Married 0.205 7.84 0.241 6.15Education level 0.030 4.51 0.032 2.44Minority 0.121 3.98 0.081 1.80Student -0.034 -0.34 0.427 1.07Retired -0.191 -4.85 -0.273 -4.60Housewife -0.249 -3.90 -0.166 -1.60Unemployed -0.345 -8.16 -0.373 -5.82Self employed 0.142 1.46 0.094 0.72Health index 0.060 1.11 0.061 0.84Log equiv income 96 0.242 18.11 0.230 11.55Unexplained happiness, 95** 0.030 2.64 -0.002 -0.11Fear of unemployment, 95 * * -0.014 -1.22Family better off next year, 95 * * 0.041 2.27Economic ladder question, 95 * * 0.027 2.17constant 5.833 36.35 5.533 17.49observations 4457 2296adjusted R-squared 0.134 0.126
* omitted** the residual of basic happiness 1995 regressionIndependent variables are from 2000 unless otherwise noted.
Regression a: no perceptions variablesRegression b: perceptions variables included
Source: Graham, Eggers, and Sukhtankar (forthcoming).