SOME HISTORICAL PERSPECTIVES ON THE HYDROCLIMATE OF THE EASTERN PRAIRIES W. F. RANNIE University of...
19
SOME HISTORICAL PERSPECTIVES ON THE HYDROCLIMATE OF THE EASTERN PRAIRIES W. F. RANNIE University of Winnipeg
-
Upload
silas-nicholson -
Category
Documents
-
view
217 -
download
3
Transcript of SOME HISTORICAL PERSPECTIVES ON THE HYDROCLIMATE OF THE EASTERN PRAIRIES W. F. RANNIE University of...

SOME HISTORICAL PERSPECTIVES ON THE HYDROCLIMATE OF THE
EASTERN PRAIRIES
W. F. RANNIEUniversity of Winnipeg

Breakup and Freezeup, Red River
Median Dates of Freezeup and Breakup of the Red River, 1821-1980
FREEZEUP BREAKUP
Median Earliest Median Earliest
1821 - 1840 Nov. 8 Oct. 20 1821 – 1840 April 18 May 8
1841 - 1860 Nov. 13 Oct. 27 1841 - 1860 April 20 May 6
1861 – 1880 Nov. 6 Oct. 18 1861 – 1880 April 26 May 3
1881 – 1900 Nov. 10 Oct. 28 1881 – 1900 April 22 May 2
1901 - 1920 Nov. 14 Oct. 30 1901 - 1920 April 11 April 25
1921 – 1940 Nov. 18 Oct. 28 1921 - 1940 April 6 April 25
1941 – 1960 Nov. 19 Nov. 1 1941 – 1960 April 11 April 23
1961 – 1980 Nov. 23 Nov. 8 1961 – 1980 April 15 April 26

Frosts – Red River Settlement
• August 19, 1832: This morning the air was excessively cold, a thick hoar frost covered the ground and the stagnant waters of the swamps were frozen…” (Journal of William Cowan)
• August 19, 1836: we were visited by a most destructive frost which destroyed the reward of the farmer…in wheat; it was truly a gloomy morning the whole of the vegetable world drooped and blackened as the sun grew warm, and the air was filled with a most unpleasant odour… All the garden seeds have been destroyed. (Reverend Jones)
• July 25, 1863: a great many people [had] their wheat frozen badly, and potatoes also. (Diary of Samuel Taylor)
Comparison of 0°C First Fall Frost Dates at Selected Frequencies Before and After 1910
Return Period 1872-1910 1911-1988
100 years August 13 August 29
50 years August 16 September 1
25 years August 20 September 4
10 years August 26 September 9
4 years September 2 September 14

Annual Peak Flows of Red River

19th Century Floods - Red River

19th Century Summer Rainfall and Flooding
1806: June 26: Water extraordinarily high [on the Red River] and continued storms which breed an incredible number of mosquitoes. July 7: The travelling was tedious from the heavy rains…In many places we found several feet of water…Our horses often sunk up to their knees in mud; and at times had water up to their bellies…The water [on the Red River] was very high…They attempted to go [to the east side of the Red] but found the country almost entirely overflowed… August 13: This summer’s extraordinary rain, having overflowed the low country has caused the buffalo to move to the high lands southward… August 14: We found a great quantity of water, and for a long distance our horses had it up to their bellies…This road used to be good but the continued rain of the summer has altered the face of almost everything, and there is now mud and water knee deep. (Alexander Henry, southern Manitoba)
1812, 1814
1824: June 19: The nets could not be set in either of the Rivers in consequence of the height of the water and strength of the current. September 2: The weather continues wet, which has caused the [Red] River to raise considerably. (Red River Journal, Fort Garry)
1825: July 30: we are not as yet able to get the rafts unloaded the beach being still covered with twelve feet water. August 20: Much damage is done to the wheat crops in general by the smut and mildew, which are supposed to be the effects of the unusual high waters this season. September 23: Owing to the late heavy rains, both Rivers have risen considerably. (Red River Journal, Fort Garry)
1827: August 31: Since the 14th scarcely a day has passed without heavy rains, a circumstance of serious consideration to the inhabitants, and their crops are part rotted in the ground. September 20: Not a day passes without heavy rains…The Rivers are greatly swollen by the late rains, as much so, as after the ice went off in the spring and it is even a difficult matter to go on horseback from one end of the Settlement to the other, the face of the country is so entirely covered with water. September 30: Scarcely a dry day has been experienced since the last date. (Red River Journal, Fort Garry)
1828, 1830, 1831, 1832, 1833, 1834

Summer Rainfall and Flooding continued1849: June 27: The convoy has left and the water is extremely high. They say that Pembina is drowned; it is not possible to ride on the prairie and the water rises continually. Much wheat perishes because it rains often…M. Belcourt writes me that the wheat [at Pembina is almost drowned and the soldiers are stopped by the water he thinks…It is very difficult to communicate except by water. (Provencher, St. Boniface). July 17: [on the level prairie] the water stood from two inches to two feet deep almost the entire way…There had been such torrents of rain that the little branches that ordinarily furnish barely a sufficiency of water [for] a travelling train were now swimming…About eight miles from Rush River we came upon a little prairie stream much swollen and deep. August 1: we arrived at Pembina, and found the Red river and the little Pembina river with about twenty feet rise in them. (Woods). August 8: …the ground was one swamp with the incessant rains (James at Red River Settlement). August 26: When the expedition first reached Pembina [August 1], the incessant rains for weeks previous had caused all the rivers to overflow their banks. (Pope). August 28: the water has been so high all summer that there was no way to communicate with Pembina except by water…A company visited [Mr. Belcourt’s] post and they had to leave because there was no appearance of a harvest at Pembina; the water covered the fields. (Provencher, St. Boniface)
1851: July 15: Already for 15 days it has been raining, the water rises and rises. July 21: The abundant rain has done damage to the grain. The water rises continually and could destroy the crop on the low ground. This is already the case at White Horse Plain. (Provencher, St. Boniface). August 31: The summer of 1851…was one of the very wet summers in Minnesota, when the streams were flooded all the summer through. In making our trip for provisions in the spring we were detained at the crossing of one stream for almost a week…The Minnesota [River] was very high, spreading its waters over all the low bottom contiguous to the mission premises. (Mary Riggs at Lac qui Parle, Minnesota)
1854, 1855, 1856, 1857, 1858
1860: June 28: The present has been a very rainy month…The water has risen steadily…The [mail carriers] found much of the [route from Lake of the Woods] almost impassable-the streams all being swollen into little rivers by the late rains, and the morasses so flooded with water that [they] frequently sunk therein up to their breasts… July 14: The first half of July…has been a continuance in an aggravated form of the same wet season [as last month]. July 28: Mr. McVicar [carrying mail from Fort William and Fort Francis] found the rivers greatly swollen by the heavy rains, and [was] compelled to swim several of them with the mail bags on their backs. (Nor’Wester Newspaper). August 22: Still very rainy weather. August 31: I hear many people say that they never remember such a summer for rain. (Samuel Taylor at Red River Settlement)
1867, 1869, 1870

Summary of Wet Summers

1993 Summer Flow – Red River

19th Century Runoff – Red River
19th Century Runoff – Assiniboine River
Major Droughts

WET
DRY
Little Ice AgeMedieval Warm Period
Moon Lake Salinity

Devil’s Lake

Sensitivity to Climate Change
Ashmore and Church (2001)…records in the eastern Prairies show a marked sensitivity to climatic fluctuations
Karl and Riebsame (1989)… precipitation changes may be amplified one to six times in relative runoff changes [but] even 1°- 2° average temperature changes often have little effect on annual runoff.
Knox (1993)Modest climatic changes of 1-2°C in mean annual temperature and 10-20% in mean annual precipitation have been capable of producing large and sometimes abrupt adjustments in both magnitudes and frequencies of floods.

Sensitivity to Change
Change in Water-year Discharge, Little Blue River, Fairbury, Nebraska, Under Various Climatic Change Scenarios (Rowe et al., 1994)
Change in Temperature
(°C)
% Change in Water-year Discharge
% Change in Precipitation
-20 -10 0 +10 +20
+3° -77% -71% -59% -34% +10%
+1° -60% -48% -20% +22% +87%
0° -50% -30% 0 +54% +231%
-1° -35% -15% +23% +90% +276%
-3° -10% +24% +84% +270% +365%
Percentage Change in Mean Annual Runoff, Wilson Creek, Manitoba, for Various Climatic Change Scenarios (Zaltsberg, 1980)
Change in Temperature
(°C)
% Change in Water-year Discharge
% Change in Precipitation
-20 % -10% +10% +20%
+2° -61% (-49%) -50% (-31%) +11% (+12%) +25% (+39%)
-2° -14% (-25%) +2% (0%) +61% (+57%) +79% (+90%)
(bracketed figures calculated from Langbein graphs)
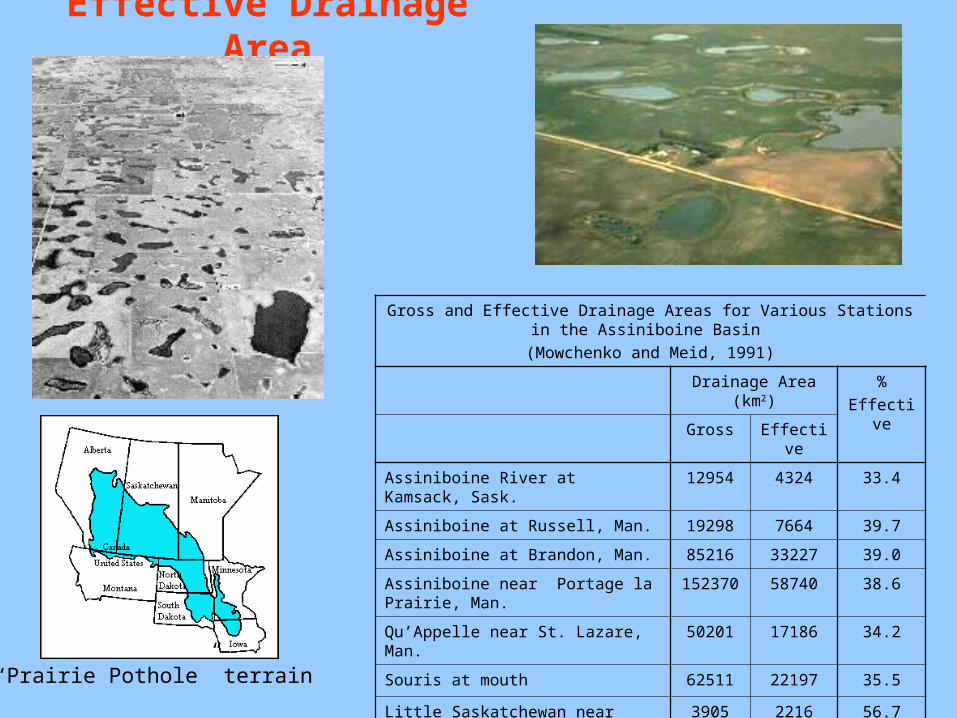
Effective Drainage Area
Gross and Effective Drainage Areas for Various Stations in the Assiniboine Basin
(Mowchenko and Meid, 1991)
Drainage Area (km2) %
EffectiveGross Effective
Assiniboine River at Kamsack, Sask. 12954 4324 33.4
Assiniboine at Russell, Man. 19298 7664 39.7
Assiniboine at Brandon, Man. 85216 33227 39.0
Assiniboine near Portage la Prairie, Man. 152370 58740 38.6
Qu’Appelle near St. Lazare, Man. 50201 17186 34.2
Souris at mouth 62511 22197 35.5
Little Saskatchewan near Rivers 3905 2216 56.7
Shell near Asessippi, Man. 2004 1132 56.5
Birdtail near Birtle, Man. 1125 580 51.6“Prairie Pothole” terrain

Original Wetlands
Comparison of Landscape Types, 1870s vs 1995
(Hanuta, 2001)
Landscape
Category
1870s
Landscape
Category
1995
Area
(km2)
Area
(%)
Area
(km2)
Area
(%)
Prairie 6872. 71.5 Cropland 7310 75.4
Wetland 1098 11.4 Wetland 14.5 0.1
Woodland 1082 11.2 Trees 535 5.5
Scrub 534 5.6 Grassland 967 10.0
Water 3.2 0.0 Forage 113 3.0
Other 27.9 0.3 Water 58.5 0.6
Urban/Transportation 515 5.3

Drainage

Hydrologic Response - Brun et al. (1981)
• for Maple and Goose Rivers in North Dakota:• artificial drainage increased effective areas by 64% and 180% respectively
• over 30-40 year period this “accounted for”
• 36% of observed increase in maximum daily Q
• 50% of observed increase in mean annual Q
• 70% of observed increase in mean spring Q

Water Quality
Henry Youle Hind, Lake of the Woods, August, 1858
“About four miles from land (on Lake of the Woods) the water became tinged with green, deriving its colour from a minute vegetable growth, which increased as we progressed, until it gave an appearance to the lake like that of a vast expanse of dirty green mud. On lifting up a quantity of water in a tin cup, or on looking closely over the side of the canoe, the water was seen to be clear, yet sustaining an infinite quantity of minute tubular needle-shaped organisms, sometimes detached, and sometimes clustered together in the form of spherical stars, varying from a quarter to half an inch in diameter…five miles from shore…the green confervae increased in quantity, and the little aggregations assumed larger dimensions, some of them exceeding one inch in diameter.
The temperature of the lake near the mouth of Rainy River…five miles from land [was] 76º, six inches below the surface…The depth of water here was thirty-six feet, and the green confervae uniformly abundant, so that it was impossible to obtain a tablespoonful of liquid free from the minute forms… Occasionally grasshoppers were seen resting on its calm glistening surface, and as we approached Keating Island they increased in number... The Indians think the “weed” proves destructive to fish; they had seen it on lake Winnipeg, where also we recognized it in September of the following year.”