Some examples of Type I supernova light curves Narrow range of absolute magnitude at maximum light...
79
Some examples of Type I supernova light curves Narrow range of absolute magnitude at maximum light indicates a good Standard Candle B b a n d a b s o l u t e m a g n i t u d e No. of days since maximum light
-
Upload
ada-melton -
Category
Documents
-
view
215 -
download
1
Transcript of Some examples of Type I supernova light curves Narrow range of absolute magnitude at maximum light...

Some examples of Type I supernova light curves
Narrow range of absolute magnitude at maximum light indicates a good Standard Candle
B b
and
a bso
lute
mag
nitu
de
No. of days since maximum light

Apparent brightness, or flux, falls off with the square of the distance, because the surface area of a sphere increases with the square of its radius
Luminosity and flux
FDL 24Luminosity, (watts) Flux, (watts / square metre)
Distance, (metres)

A Type I supernova has a luminosity times that of the Sun.
As seen from the Earth, the supernova appears fainter than the Sun.
How far away is the supernova?
FDL 24Luminosity, (watts) Flux, (watts / square metre)
Distance, (metres)
910
1710

Measuring the Hubble Constant – 3
Although the errors which caused Hubble to findwere gradually eliminated, even by the late 1980s, the value of theHubble constant was still controversial, because of disagreements over the different steps of the Distance Ladder.
Some astronomers argued that
Others that
The Hubble Space Telescope launched in 1990 was to come to the rescue!
H0 ~ 500 kms-1 Mpc-1
H0 ~ 100 kms-1 Mpc-1
H0 ~ 50 kms-1 Mpc-1

H0?

HST has ‘bypassed’ one stage of the Distance Ladder, by observing Cepheids beyond the Local Group of galaxies

HST Key Project, led by Wendy FreedmanMeasure Cepheid distances to ~30 nearby galaxies,
Link Cepheids to Secondary distance indicators

Virgo Cluster galaxyM100, 60 million light years distant…..


HST has ‘bypassed’ one stage of the Distance Ladder, by observing Cepheids beyond the Local Group of galaxies
This has dramatically improved measurements of H0

A Type I supernova has a luminosity times that of the Sun.
As seen from the Earth, the supernova appears fainter than the Sun.
How far away is the supernova?
FDL 24Luminosity, (watts) Flux, (watts / square metre)
Distance, (metres)
910
1710
Morphological Segregation
Analysis of galaxy redshift surveys reveals that ellipticalgalaxies are preferentially found in the cores of rich clusters, while spirals are generally not found there.
This morphological segregation is a consequence of how galaxies formed:
Spirals existed briefly in galaxy clusters, but their disks could not survive the strong tidal forces there.
Early population of cluster spirals torn apart. Many may have been ‘cannibalised’ by the giant elliptical galaxies in the centre of the clusters.


Active Galaxies
Galaxies whose luminosity is significantly greater than that solely due to the stars which they contain are known as active galaxies.
Their cores are known as active galactic nuclei (AGN).
All types of active galaxies are observed predominantly at high redshift, indicating they are very distant.
Light travels at a finite speed, so we see active galaxies as they were in the remote past.
This suggests that they represent a phase in the early history of galaxy formation, which is now over.

Active Galaxies
We will consider three types of Active Galaxy:
o Radio galaxies
o Seyfert galaxies
o Quasars

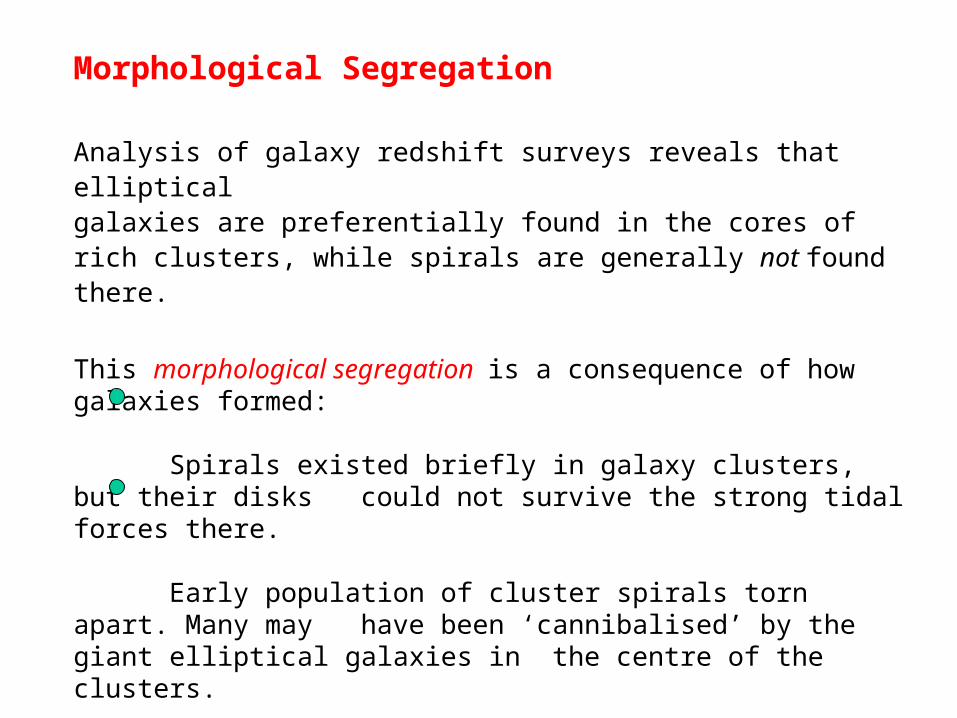
Properties of Radio Galaxies

Cygnus A: radio map

Properties of Radio Galaxies
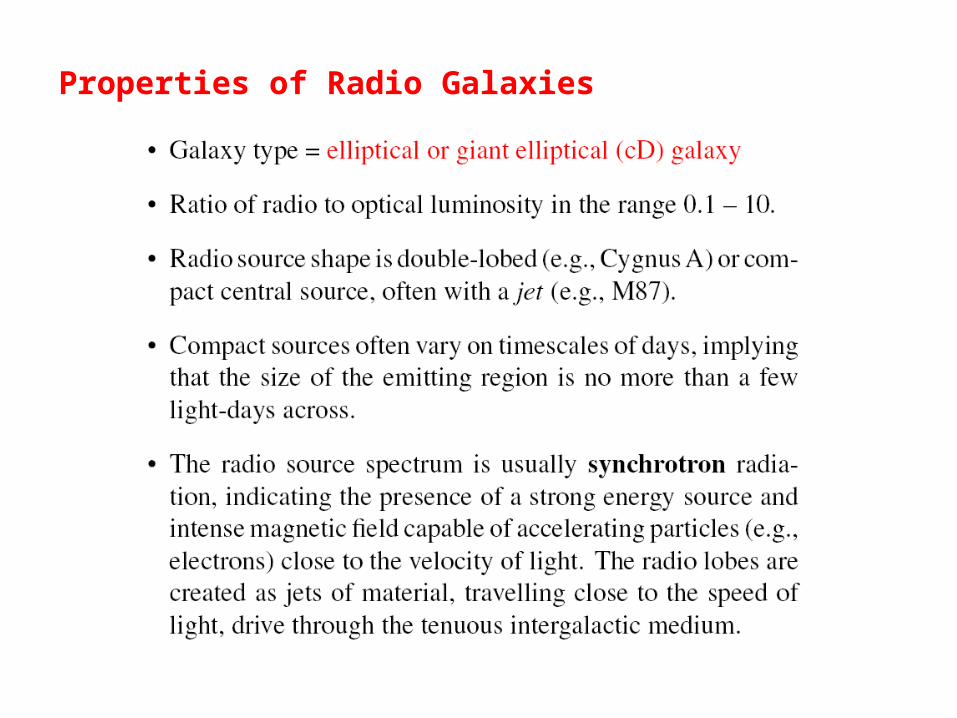
Properties of Radio Galaxies
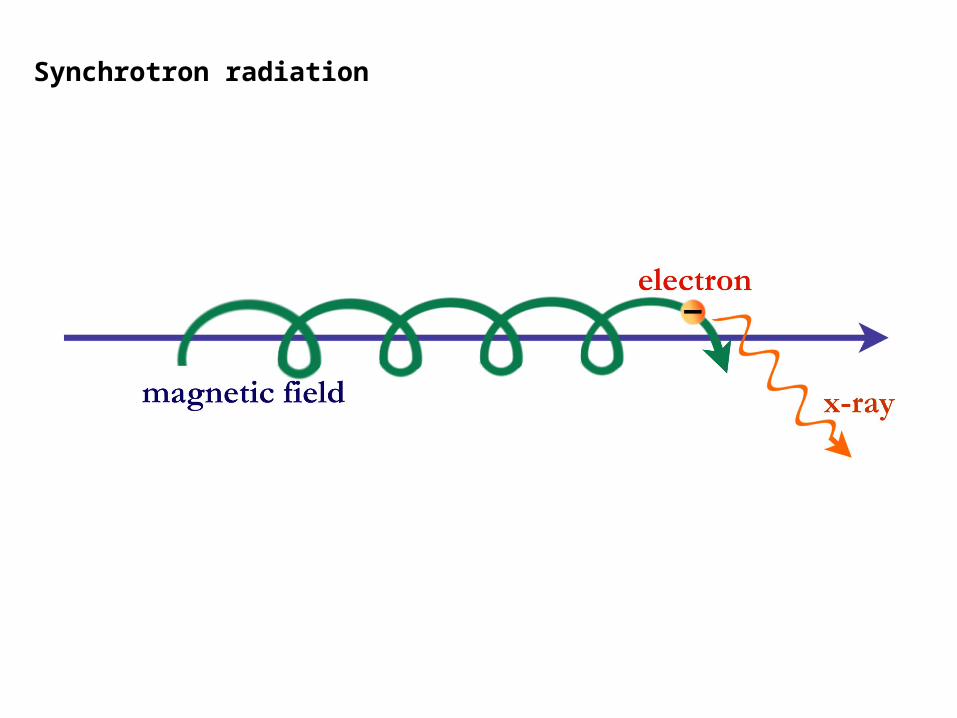
Synchrotron radiation
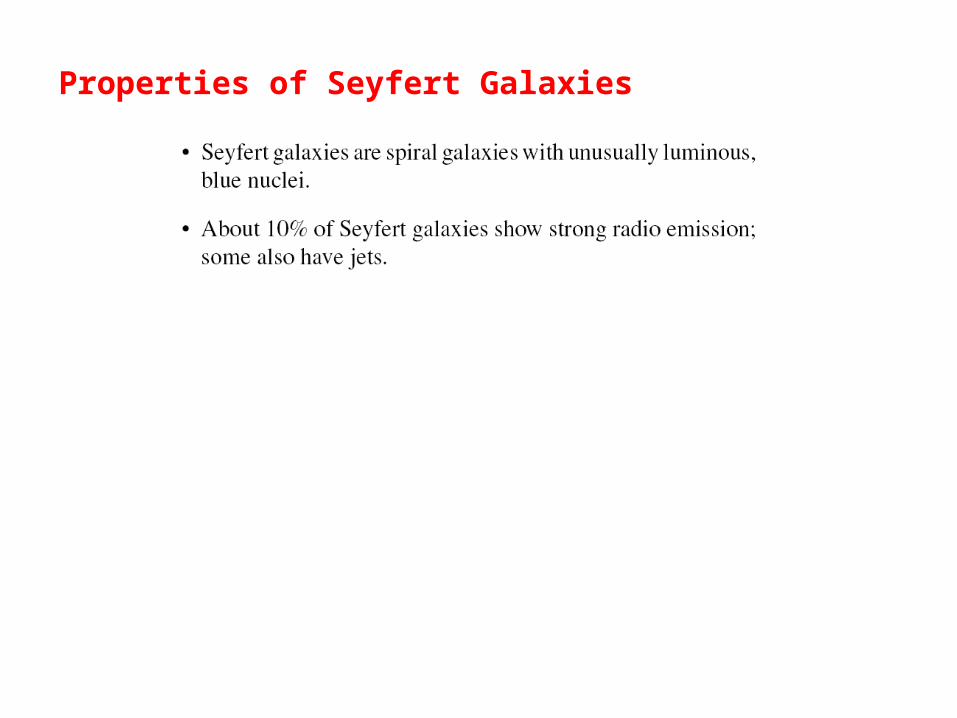
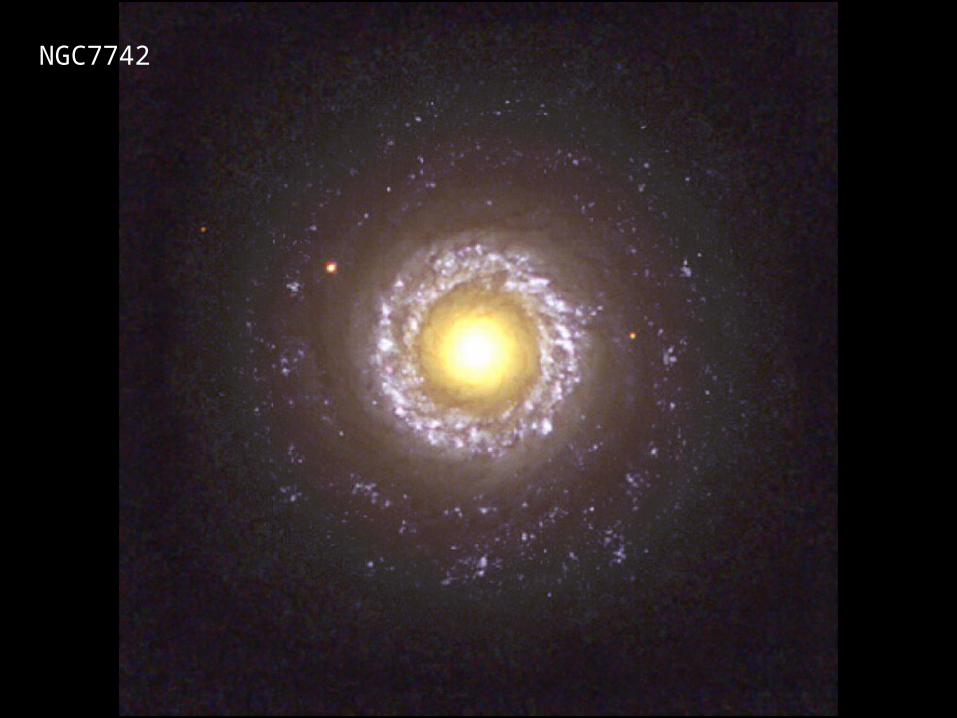
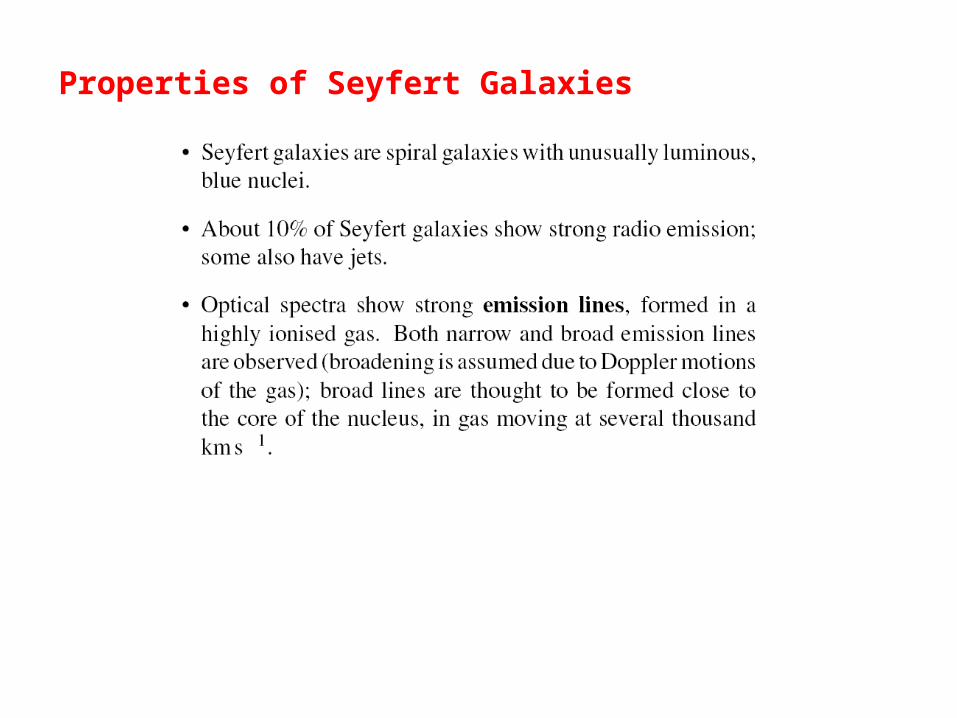
Properties of Seyfert Galaxies
NGC7742

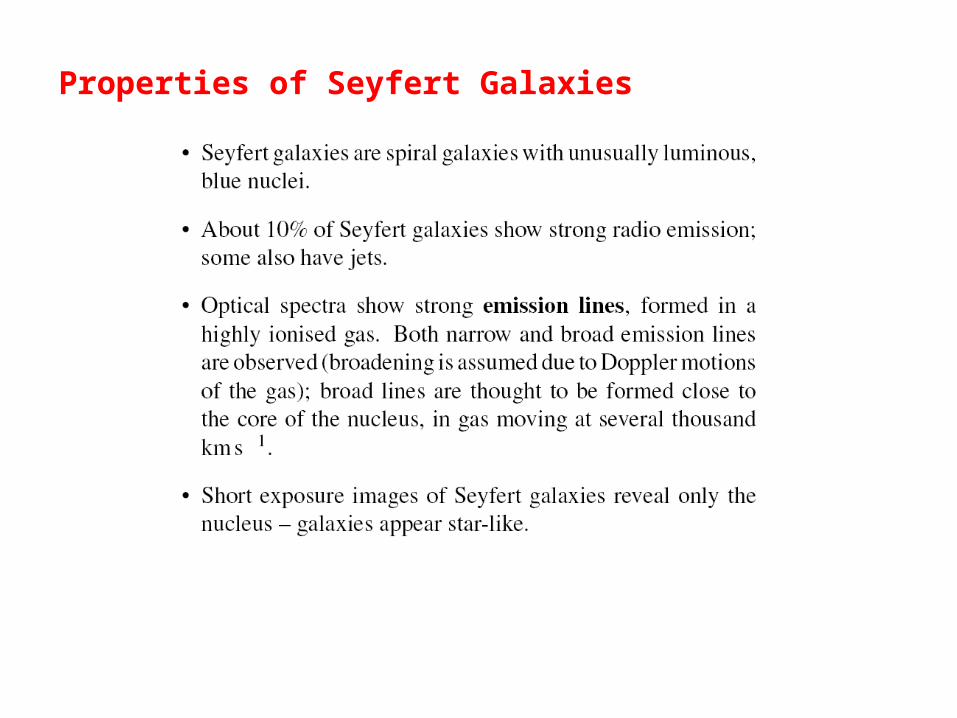
Properties of Seyfert Galaxies


Suppose gas moves in a circular orbit.
From Kepler’s third law:
But so
Hence
322gal 4 RPMG
v
2 RP
2
222
v
4 RP
G
RM
2
gal
v
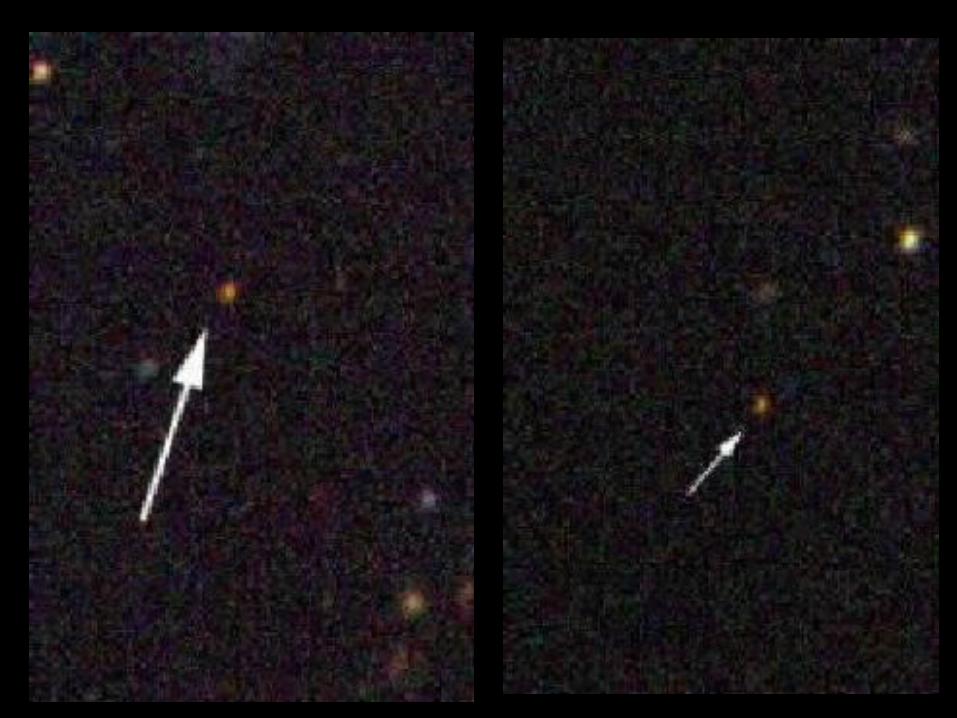
Properties of Seyfert Galaxies

Increasing exposure time
Seyfert galaxy nuclei
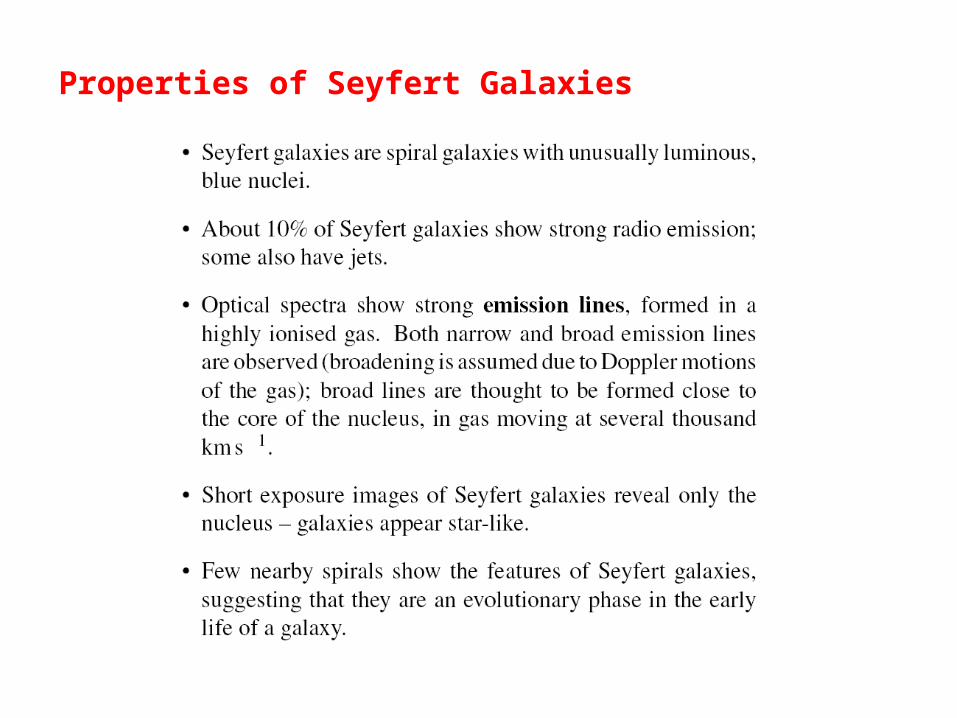
Properties of Seyfert Galaxies


Properties of Quasars

Hydrogen emission line
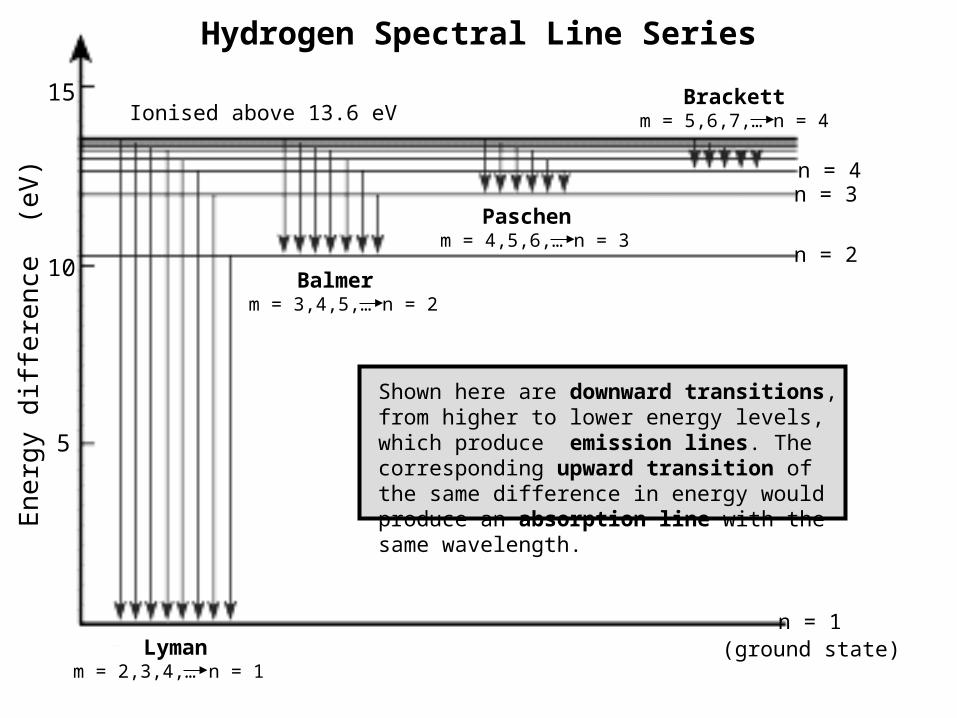
Hydrogen Spectral Line Series
n = 1
n = 2
n = 4
(ground state)
n = 3
Lyman
Balmer
Paschen
Brackett
Ene
rgy
diff
eren
ce (
eV)
5
10
15
m = 2,3,4,… n = 1
n = 2m = 3,4,5,…
m = 4,5,6,… n = 3
m = 5,6,7,… n = 4Ionised above 13.6 eV
Shown here are downward transitions, from higher to lower energy levels, which produce emission lines. The corresponding upward transition of the same difference in energy would produce an absorption line with the same wavelength.
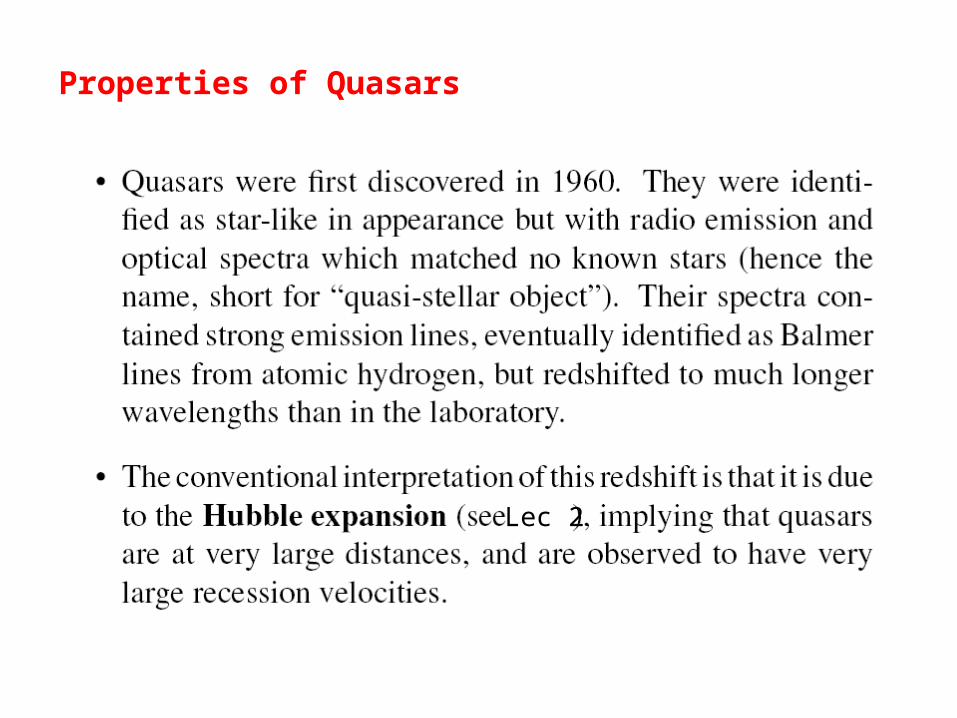
Properties of Quasars
Lec 2
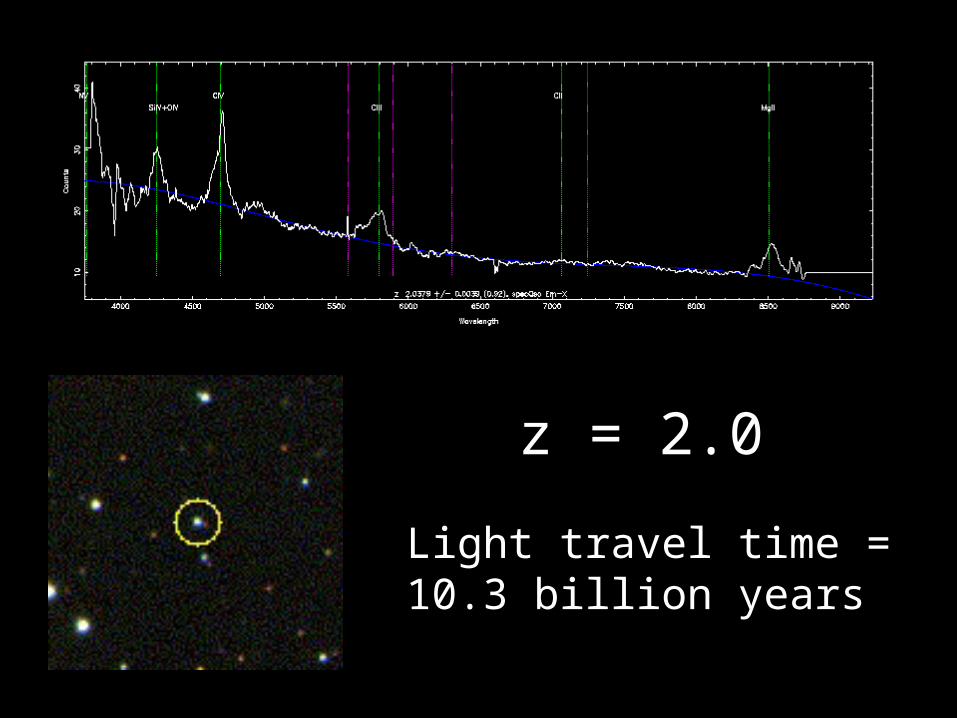
z = 2.0
Light travel time =10.3 billion years

z = 2.1
Light travel time =10.5 billion years

z = 2.2
Light travel time =10.6 billion years
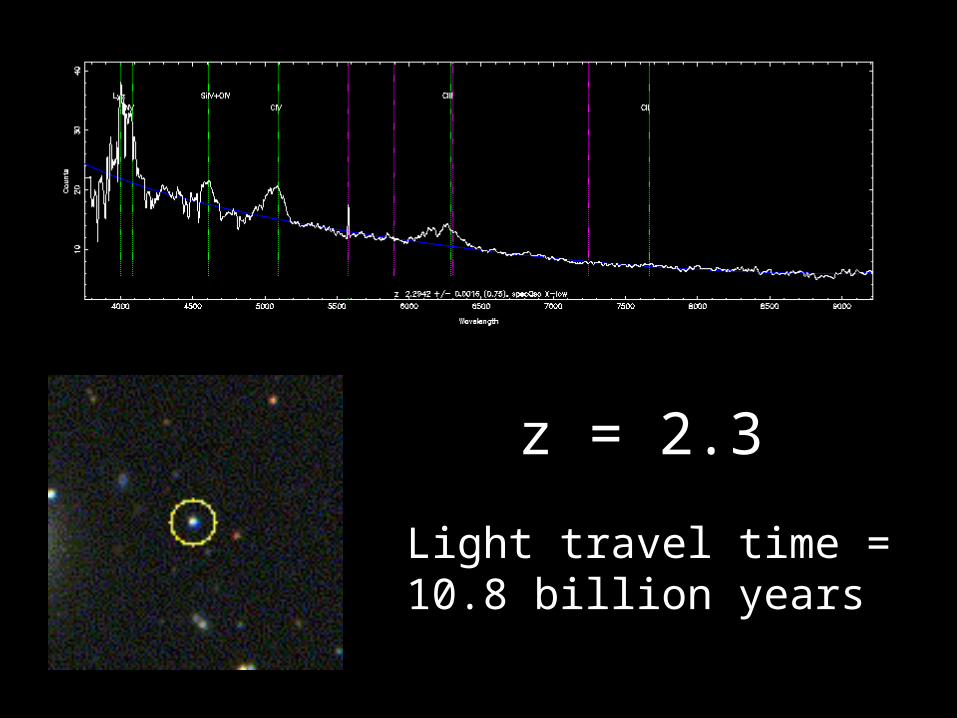
z = 2.3
Light travel time =10.8 billion years
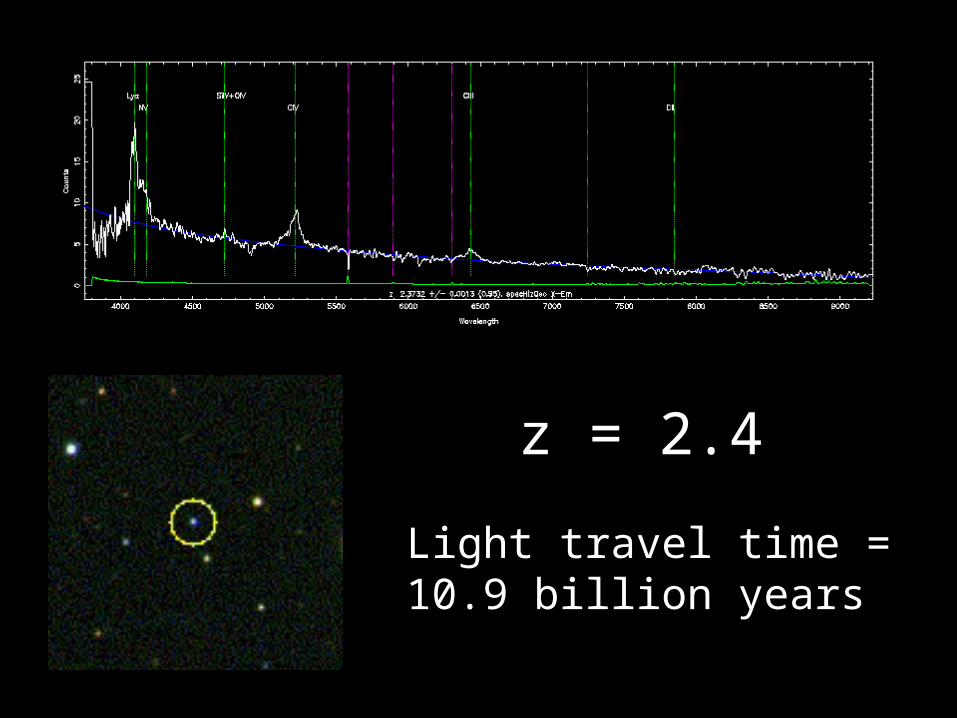
z = 2.4
Light travel time =10.9 billion years

z = 2.5
Light travel time =11.0 billion years

z = 2.6
Light travel time =11.1 billion years
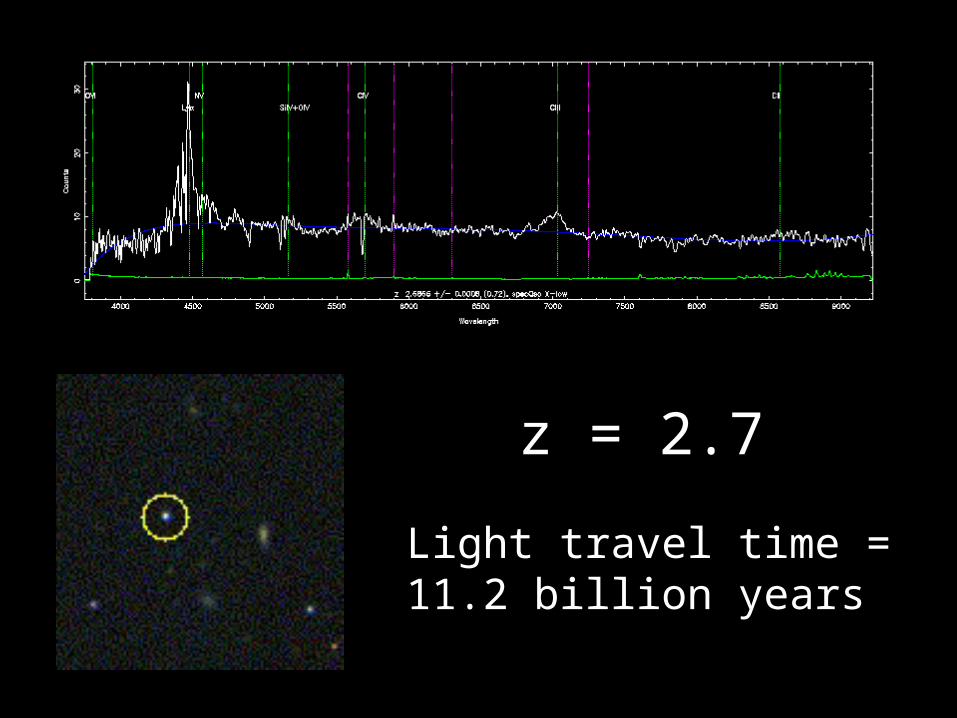
z = 2.7
Light travel time =11.2 billion years

z = 2.8
Light travel time =11.3 billion years

z = 2.9
Light travel time =11.4 billion years
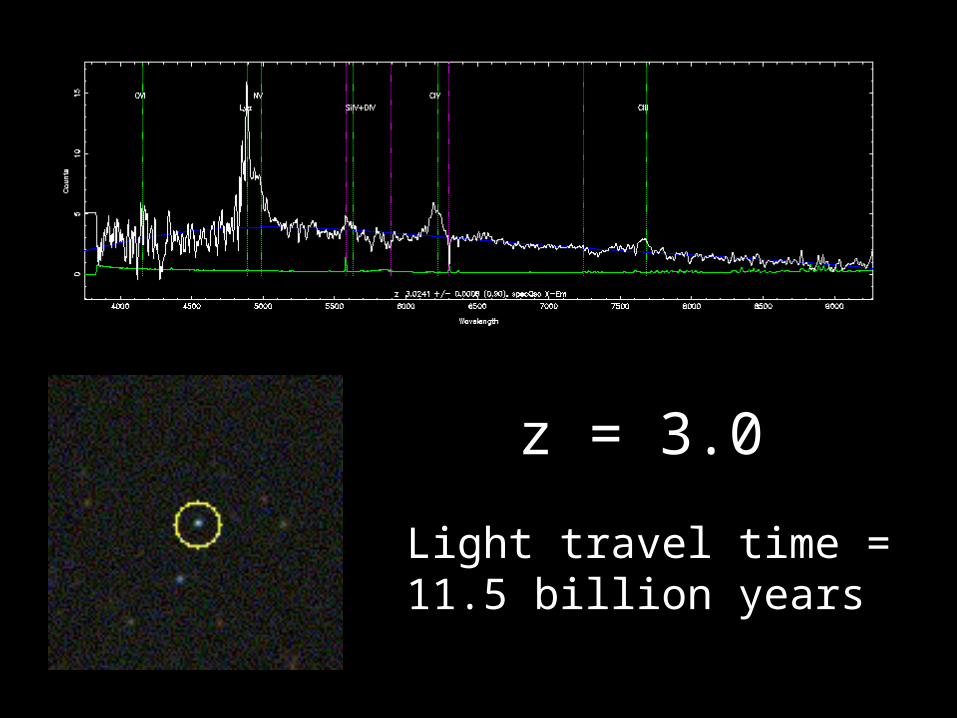
z = 3.0
Light travel time =11.5 billion years

z = 3.1
Light travel time =11.6 billion years

z = 3.2
Light travel time =11.6 billion years

z = 3.3
Light travel time =11.7 billion years

z = 3.4
Light travel time =11.8 billion years

z = 3.6
Light travel time =11.9 billion years
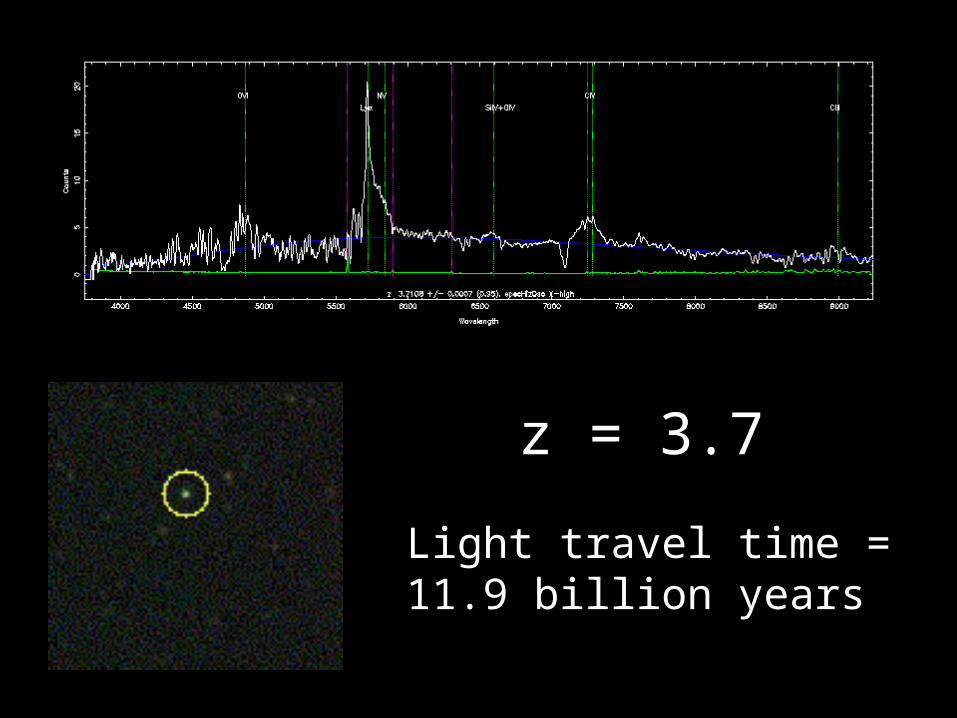
z = 3.7
Light travel time =11.9 billion years

z = 3.8
Light travel time =12.0 billion years
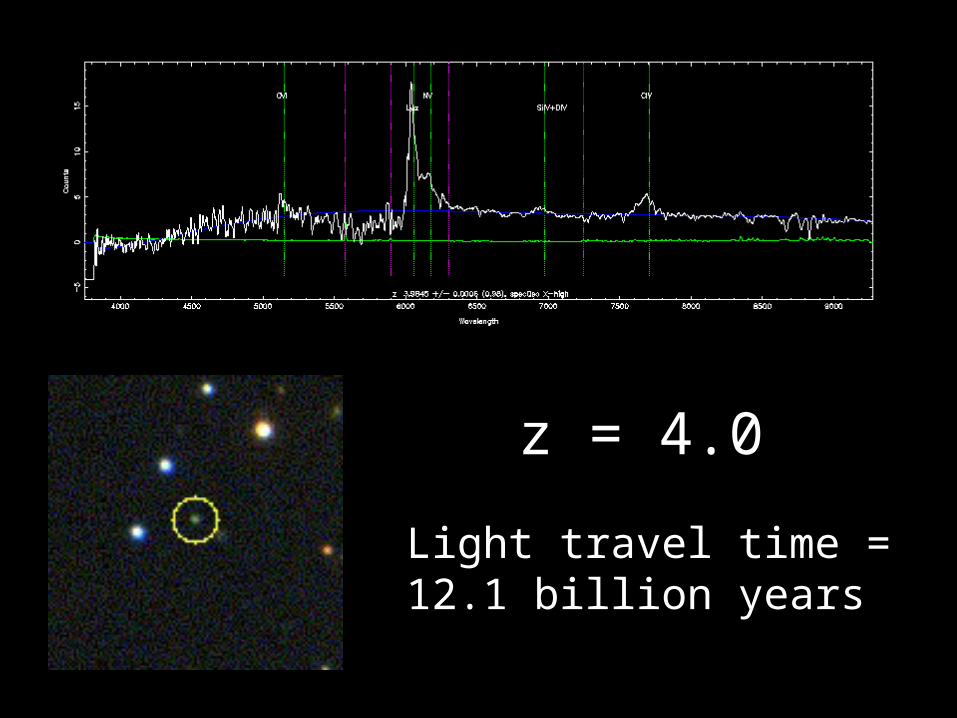
z = 4.0
Light travel time =12.1 billion years

z = 4.1
Light travel time =12.1 billion years

z = 4.3
Light travel time =12.2 billion years

z = 4.4
Light travel time =12.2 billion years

z = 4.5
Light travel time =12.3 billion years

z = 4.6
Light travel time =12.3 billion years
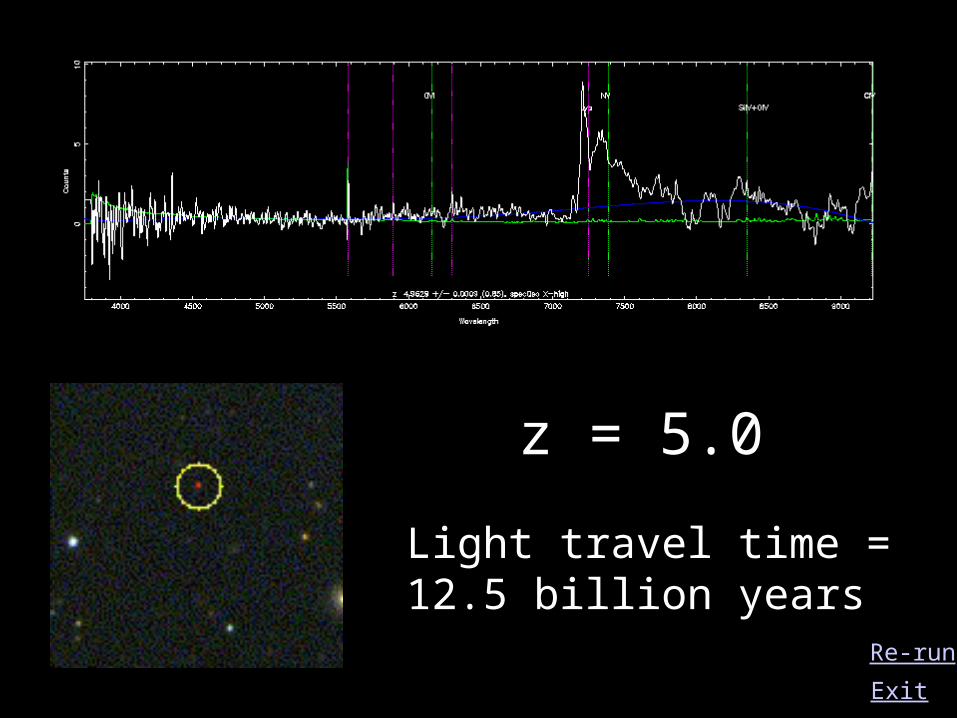
z = 5.0
Light travel time =12.5 billion years
Exit
Re-run

Properties of Quasars

Hydrogen emission line

Hydrogen emission line
Absorption lines produced byatoms in young galaxies between us and the quasar

Properties of Quasars

Quasars: Galaxies in Infancy
o Conclusive evidence that quasars are at cosmological distances: HST observed ‘host’ galaxies at same redshift


Quasars: Galaxies in Infancy
o Conclusive evidence that quasars are at cosmological distances: HST observed ‘host’ galaxies at same redshift
o How can such a high luminosity be produced in such a small volume?
Quasar powered by a supermassive black hole at its center. Infalling material releases large amounts of energy as it is swallowed up by the black hole.
No other satisfactory model can provide such a luminous source of energy .
Amount of energy released is of order
2mcE

Suppose a quasar ‘consumes’ the equivalent of 1 solar mass per year, and it converts 20% of this mass into energy.
What is the luminosity of the quasar?

Quasars: Galaxies in Infancy
Standard Model:
o Quasar is the core of a very young galaxy. Black hole forms at center during chaotic early collapse of protogalactic cloud.
o Infalling matter forms an accretion disk around the black hole
o Energy released by infalling matter accelerates electrons in beams, moving close to speed of light, which stream out from the disk. The electrons in turn produce synchrotron radiation
o Radio galaxies and Seyferts powered by same mechanism, but less energetic and/or viewed from different orientation.

The Milky Way was very likely once an active galaxy.
Sgr A: very strong radio source at the galactic center;
remnant of an AGN.