
Some Effects of Plant Ash and Heating of Soil Minerals on ...€¦ · thus affect the chemical...
152
Some Effects of Plant Ash and Heating of Soil Minerals on Soils Affected by Bushfires Baiq Emielda Yusiharni BSc. in Soil Science, University of Mataram, Indonesia MSc. University of Western Australia, Australia This thesis is presented for the degree of Doctor of Philosophy of The University of Western Australia School of Earth and Environment Faculty of Natural and Agricultural Sciences 2012
Transcript of Some Effects of Plant Ash and Heating of Soil Minerals on ...€¦ · thus affect the chemical...

Some Effects of Plant Ash and Heating of Soil
Minerals on Soils Affected by Bushfires
Baiq Emielda Yusiharni BSc. in Soil Science, University of Mataram, Indonesia
MSc. University of Western Australia, Australia
This thesis is presented for the degree of
Doctor of Philosophy of The University of Western Australia
School of Earth and Environment
Faculty of Natural and Agricultural Sciences
2012


i
ABSTRACT
Bushfires are very common in Australia and severely modify ecosystems including
soils. The effects of heating on soil chemical, mineralogical and morphological
properties including the growth of plants have been investigated using laboratory,
glasshouse and field observations. This thesis focuses on three soil minerals that are
affected by heating: kaolinite, gibbsite and goethite. The thesis also considers the
nature of ash created by bushfires and its reaction with soil.
A laboratory study investigated dehydroxylation of pure kaolinite, gibbsite and
goethite and their rehydroxylation under wet conditions. Rehydroxylation of heated
gibbsite was extensive at 95oC with bayerite and gibbsite forming during 14 days, the
process was much slower at 55oC. Metakaolinite formed from kaolinite and hematite
formed from goethite by heating did not recrystallise but did aquire structural water
during incubation in water. The specific surface area of all three dehydroxylated
minerals was increased substantially by wet incubation. Dehydroxylated minerals
and probably their partly rehydroxylated forms may exist in soils heated by fire and
thus affect the chemical behaviour of these soils.
Soil heated a day earlier in a bushfire at Wundowie in the Darling Range, Western
Australia was taken from under and adjacent to burnt Eucalyptus and grass tree
(Xanthorrhoea pressii) logs. Conventional and synchrotron XRD patterns of heated
and unheated soil show that the main crystalline compounds of unheated soil are
quartz, kaolinite, gibbsite and goethite. In heated soil, kaolinite had dehydroxylated
to form metakaolinite, gibbsite altered into an amorphous phase, while goethite
transformed into hematite (hydrohematite). The bushfire added calcite in plant ash to
the soil which considerably increased the pH. Increases in soil EC simply reflect the
addition of soluble salts in plant ash. Heating increased amounts of extractable Al, Fe
and Si due to crystalline minerals becoming amorphous as they were dehydroxylated
by heating. Evidently dehydroxylated minerals and possibly their rehydroxylated
forms are present in naturally heated soils and may exert a significant influence on
the chemical behavior of the soil.
ii
A glasshouse experiment was carried out on the impact of heating a lateritic podzolic
soil on phosphate availability and plant growth. Forest soil was heated at 250, 350
and 500oC which are temperatures attained by topsoil during bushfires. As in the
laboratory and field experiment, heating soil caused kaolinite, gibbsite and goethite
to dehydroxylate and to partly alter into metakaolinite, amorphous alumina and
hematite respectively. Heating increased soil pH and EC although EC then relatively
decreased for 350oC and 500oC heating. Yield of ryegrass decreased with increasing
temperature of heating for unfertilized soil and for heated soils supplied with
phosphate (P) fertilizer. The P concentration in ryegrass for each of three harvests
ranged from 0.03% to 0.30% and decreased in the same sequence as for yield (i.e
unheated soil>250oC>350oC>500oC heated soil). Clearly heating of soil by bushfires
may reduce the availability to plants of native and added phosphate.
Another study determined the amounts and forms of plant nutrient elements in the
ash of several Australian native plant species and investigated the reactions of ash
with soil. Ash may contain much calcium, magnesium, potassium, sodium or silicon
with amounts varying depending on plant species and plant part. Many minor
elements are also present including elements with no biological function. All
elements are mostly present in crystalline compounds which were identified using
XRD and SEM. Minerals present in ash include calcite (CaCO3), fairchildite
(K2Ca(CO3)2),, nesquehonite (MgCO3.H2O), sylvite (KCl), lime (CaO), scolecite
(CaAl2Si3O10.3(H2O)), quartz (SiO2), portlandite (Ca(OH)2, periclase (MgO), and an
apatite, probably resembling hydroxyl-apatite (Ca5(PO4)3(OH)) and wilkeite (Ca5((P,
S,Si)O4)3(OH,CO3)). Ash has important liming and fertilizer values and its
effectiveness in these roles is a consequence of the properties of these minerals and
their reaction with soil as was demonstrated in an ash plus soil incubation
experiment.
This study concludes that bushfires may have considerable impacts on soil chemical
and mineralogical properties. The impacts are diverse depending on the nature of the
fire, including the fire temperature, soil mineralogy and vegetation composition.
iii
ACKNOWLEDGEMENTS
I would like to express my sincere gratitude and appreciation to my supervisor
Winthrop Prof. Robert Gilkes for his excellent support, advice, encouragement, and
great attention throughout my study.
I would also like to acknowledge the Australian Government through the Department
of Innovation, Industry, Science and Research (DIISR) for funding my International
Postgraduate Research Scholarship (IPRS) and Scholarship for International
Research Fees (SIRF). I would like to acknowledge the Graduate Research School
and School of Earth and Environment, University of Western Australia for providing
me with a completion scholarship for the last few months of my study.
I thank Michael Smirk for his technical assistance, Australian Synchrotron for beam
time and staff at the Centre for Microscopy at the University of Western Australia for
assistance with electron-optical analysis. I thank the amazing women in the Soil
Science office, Margaret Pryor, Gail Ware and Karen Newnham for their assistances
during my study. Special thanks to Ksawery Kuligowsky, Nattaporn Prakongkep,
Rick Roberts and family, Cameron Duggin and Andrijana Eded for support,
assistance and friendship.
I would like to thank all mineralogy group members and postgraduate students at the
School of Earth and Environment, UWA for your friendship and sharing of
knowledge, experiences, thoughts, and laboratory equipment.
Finally, I would like to thank my family and friends; I could not have finished my
study without your constant prayer and support.
iv
DEDICATIONS
I dedicate this thesis to special people in my life. To my husband, Husnan Ziadi for
his constant love, encouragement, support and sometimes-technical assistance
throughout my study. To my daughters, Dhiyaul Aulia Huda and Fadila Almira
Huda, thank you for being so understanding, I could not do this without your
constant smiles and love. Thank you for always letting Mum concentrate on doing
the PhD study, for giving Mum the best support while multitasking as a Mum and a
student at the same time. I also dedicate this thesis to my late grandmother, Siti
Harah and my grandfather Saharudin. I wish to thank my parents, Suharni and Lalu
Yusuf for showering me with love and support. I also wish to thank my mother in
law, Aminah Hafs for her prayer and love. I dedicate this thesis to my late father in
law, Ruba’I, who believed in me since the first time we met, for encouraging me in
pursuing my dream. I finally made it.

v
LISTS OF CONTENTS
ABSTRACT i ACKNOWLEDGEMENTS iii DEDICATIONS iv LISTS OF CONTENTS v LIST OF TABLES viii LIST OF FIGURES x LIST OF APPENDICES xiv
Chapter 1. Introduction 1
1.1 General Introduction 1
1.2 Objectives of this Study 2
1.3 Structure of the thesis 2
Chapter 2. Literature review 4
2.1 Forest fires issues in the world 4
2.2 Forest fires issues in Australia 7
2.3 Impacts of forest fire on soil properties 10
2.4 Studies on ash 12
2.5 Heating effect on soil mineralogy 13
2.6 Studies on mineral reversion 15
Chapter 3 Rehydration of heated gibbsite, kaolinite and goethite: an
assessment of properties and environmental significance
18
3.1 Introduction 18
3.2 Materials and Methods 19
3.2.1 Pure minerals and heating procedures 19
3.2.2 Chemical and morphological analysis 19
3.3 Results and Discussion 21
3.3.1 X-ray diffraction and chemical data 21
3.3.2 Thermal analysis 26
3.3.3 Specific surface area and phosphate adsorption 30
3.3.4 Infrared analysis 31
3.3.5 Electron microscopy 39
3.4 Conclusions 41

vi
Chapter 4 Short term effects of heating a lateritic podzolic soil on the
availability to plants of native and added phosphate
42
4.1 Introduction 42
4.2 Materials and methods 43
4.2.1 Soil and glasshouse experiment 43
4.2.2 Soil and plant analysis techniques 46
4.3 Results and discussions 47
4.3.1 XRD and SEM 47
4.3.2 Heating impacts on chemical properties 51
4.3.3 Forms of Fe, Al and Si in the heated soils 53
4.3.4 Plant dry matter 56
4.3.5 Plant Analysis 57
4.4 Conclusions 60
Chapter 5 Changes in the mineralogy and chemistry of a lateritic soil
due to a bushfire at Wundowie, Darling Range, Western
Australia
61
5.1 Introduction 61
5.2 Materials and methods 62
5.2.1 Soil samples burnt in forest fires 62
5.2.2 Analytical techniques 65
5.3 Results and discussions 66
5.3.1 Carbon and nitrogen 66
5.3.2 Element concentrations, pH, EC, available P
and K, and extractable Fe, Al and Si in soil
samples
67
5.3.3 Mineralogical and morphological effects of
bushfire heating on soil minerals
72
5.4 Conclusions 78
Chapter 6 Minerals in the ash of Australian native plants 81
6.1 Introduction 81
vii
6.2 Materials and methods 83
6.2.1 Ash preparation 83
6.2.2 Characterization of the ash 83
6.2.3 Incubation of ash-soil mixture 84
6.3 Results and discussions 85
6.3.1 Characteristics of the ash 85
6.3.2 Total and water extractable elements, carbon
and nitrogen concentrations
87
6.3.3 Mineralogy and morphology of ash (XRD and
SEM)
92
6.3.4 Ash and soil incubation 95
6.4 Conclusions 96
Chapter 7 General Summary, Limitations and Future Work 104
7.1 Introduction 104
7.2 General Summary 105
7.2.1 Dehydroxylation and rehydroxylation of soil
minerals
105
7.2.2 Effects of heating soil on the availability of P
to plants
106
7.2.3 The properties of soil heated in bushfire 107
7.2.4 The composition of plant ash 109
7.2 Limitations to this research and suggested future work 111
Chapter 8 Publications from this thesis 113
8.1 Conference publications 113
8.2 Journal publications 114
8.3 Other publications 114
REFERENCES 115
APPENDICES 127

viii
LIST OF TABLES
Table Page 2.1 Example of a fire intensity and an associated severity rating for
eucalypt-dominated sclerophyll vegetation communities in south eastern Australia based on Cheney (1981), Jasper (1999) and (Shakesby et al, 2003). Fire intensity and severity are broadly related.
5
2.2 Specific surface area (SSA) and water content, expressed as TGA weight loss of metakaolinite, kaolinite and rehydrated kaolinite samples (Rocha et al, 1990).
16
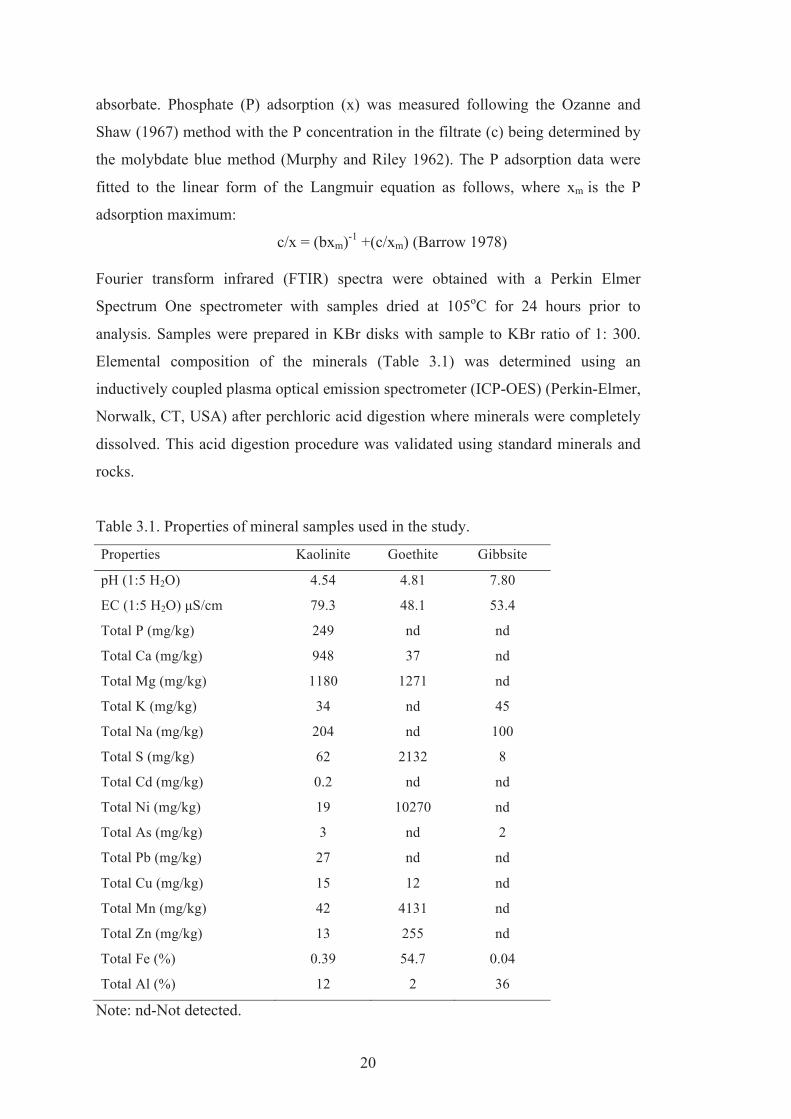
3.1 Properties of mineral samples used in the study. 20 3.2 Infrared absorption spectra maxima for variously
dehydroxylated kaolinite samples and 600 oC heated kaolinite wet incubated at 55/95 oC for 400 days, references values and assignments.
36
3.3 Infrared absorption spectra maxima for variously dehydroxylated goethite samples and 350 oC heated goethite wet incubated at 55/95 oC for 400 days, references values and assignments.
37
3.4 Infrared absorption spectra maxima for variously dehydroxylated gibbsite samples and 350 oC heated gibbsite wet incubated at 55/95 oC for 400 days, references values and assignments.
38
4.1 Properties of original and heated Bakers Hill (BH) soil samples (n = 1).
46
4.2 p-values for significant difference with level of P added (0, 1.66, 3.33, 6.66, and 13.33 mg P/kg) and heating temperature.
51
5.1 The nomenclature for the samples of heated soil from under burnt eucalyptus (Eucalyptus marginata) and grass tree (Xanthorrhoea preissii) logs at the Wundowie bush fire site.
64
5.2 Mean values of element concentrations (mg/kg), pH and EC for the unheated and heated soil (-2 mm), gravel, ash and charcoal after the bushfire.
68
5.3 Mean values of extractable Al, Fe and Si for soil, gravel, ash and charcoal under and adjacent to burnt grass tree (GT) and eucalyptus (EU) logs. SP = sodium pyrophosphate extractant, Oxalate = sodium oxalate extractant and DCB = dithionite-citrate-bicarbonate extractant.
72
6.1 The nomenclature for plant ash and some properties of the ash. SSA= specific surface area (m2/g), EC= electrical conductivity (mS/cm), Bic P= bicarbonate P (mg/kg).
82
6.2 Total element concentrations in plant ash (mg/kg). Silver wattle wood (SW), silver wattle leaf (SL), prickly moses leaf and twig (PM), wandoo wood (WW), wandoo leaf (WL), red gum wood (RW), red gum leaf (RL), grass tree leaf (GT), jarrah leaf (JL), and harsh hakea leaf and twig (HH).
86
6.3 (a) Concentration of water-soluble elements in plant ash. Silver wattle wood (SW), silver wattle leaf (SL), prickly moses leaf
87

ix
and twig (PM), wandoo wood (WW), wandoo leaf (WL), red gum wood (RW), red gum leaf (RL), grass tree leaf (GT), jarrah leaf (JL), and harsh hakea leaf and twig (HH).
(b) Proportion of element in plant ash that is water-soluble. 87 6.4 Crystalline compounds in plant ash identified by SXRD. Silver
wattle wood (SW), silver wattle leaf (SL), prickly moses leaf and twig (PM), wandoo wood (WW), wandoo leaf (WL), red gum wood (RW), red gum leaf (RL), grass tree leaf (GT), jarrah leaf (JL), and harsh hakea leaf and twig (HH).
94
x
LIST OF FIGURES
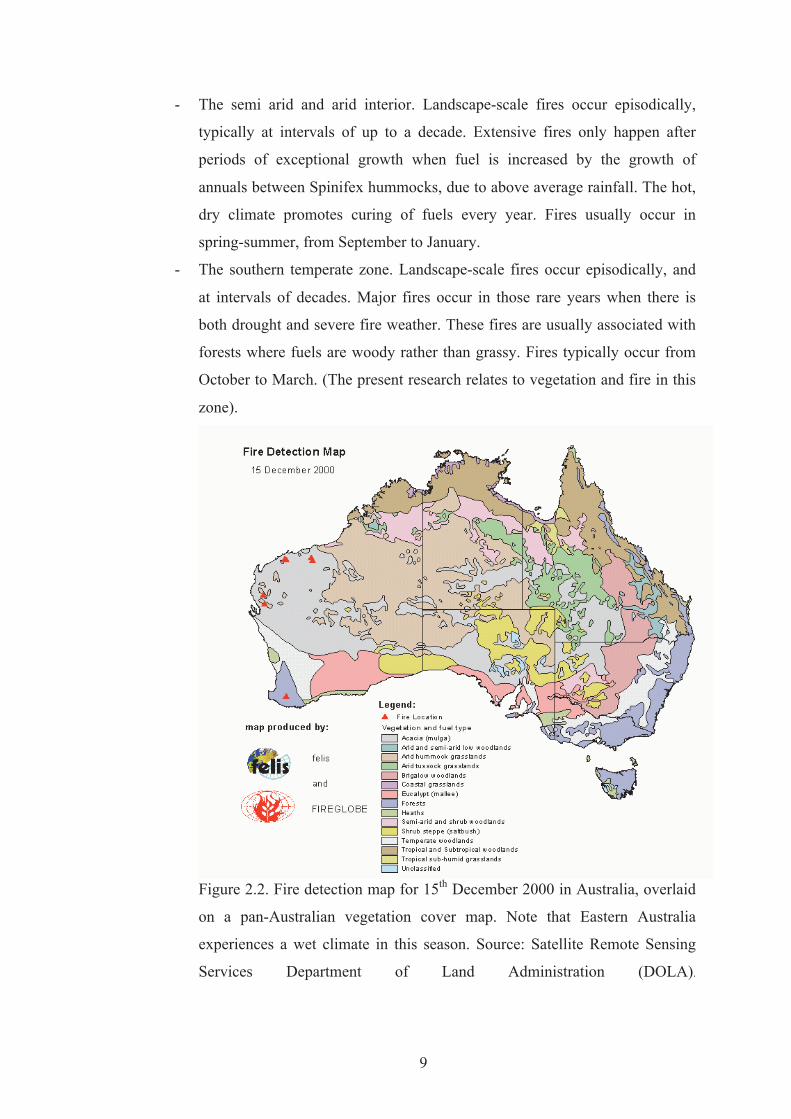
Figure Page 2.1 Scheme of fire development phases and fire spread regimes. 8 2.2 Fire detection map for 15th December 2000 in Australia,
overlaid on a pan-Australian vegetation cover map. Note that Eastern Australia experiences a wet climate in this season. Source: Satellite Remote Sensing Services Department of Land Administration (DOLA).
9
2.3 The times of peak fire danger over Australia (Australian Climate Extreme Fires, 2008).
10
2.4 A summary of the thermal reactions of kaolinite (Frost et al, 2003).
14
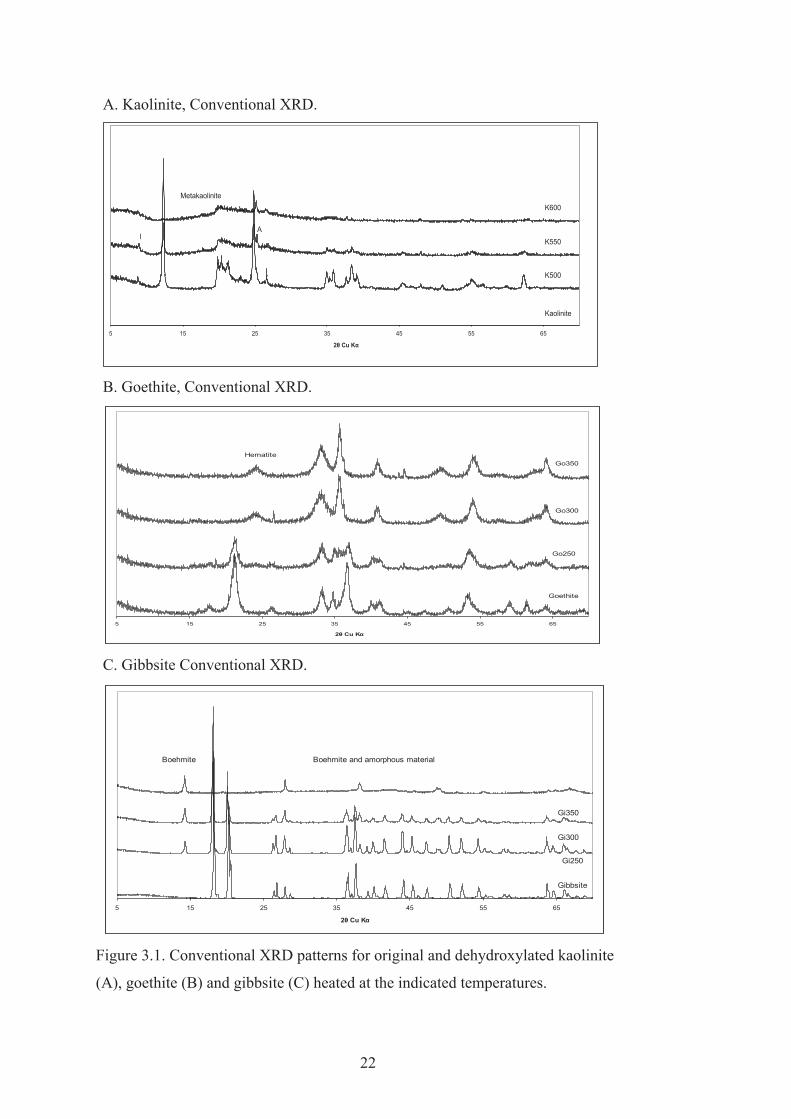
3.1 Conventional XRD patterns for original and dehydroxylated kaolinite (A), goethite (B) and gibbsite (C) heated at the indicated temperatures.
22
3.2 XRD patterns for heated kaolinite (A), goethite (B) and gibbsite (C), wet incubated at 55/95 oC, 0-400 days, Cu Kα radiation. I=illite, A=anatase, H=hematite, Bo=boehmite, Gi=gibbsite, and Ba=bayerite.
23
3.3 Synchrotron XRD patterns for unheated and 600oC heated kaolinite (A), 350oC heated goethite (B) and 350oC heated gibbsite (C), wet incubated at 95oC, for 200 and 400 days, Cu Kα radiation.
25
3.4 Thermal analysis results for original kaolinite (A), goethite (B) and gibbsite (C) showing dehydroxylation peaks.
27
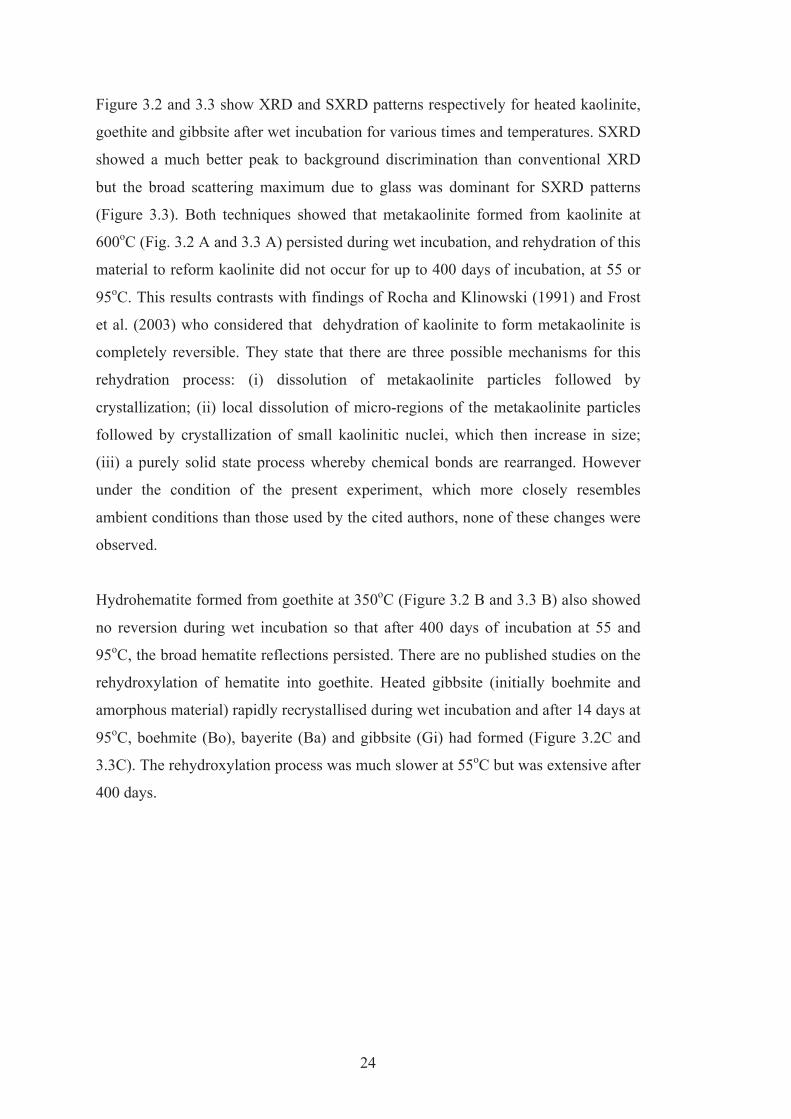
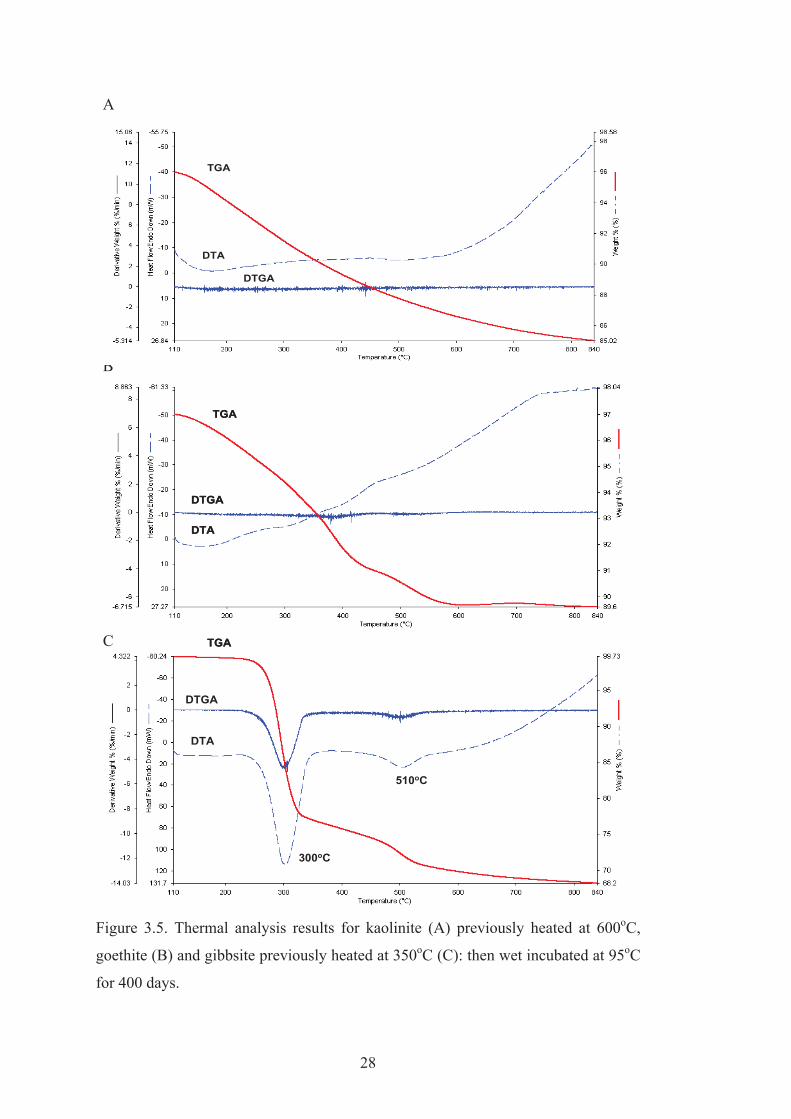
3.5 Thermal analysis results for kaolinite (A) previously heated at 600oC, goethite (B) and gibbsite previously heated at 350oC (C): then wet incubated at 95oC for 400 days.
28
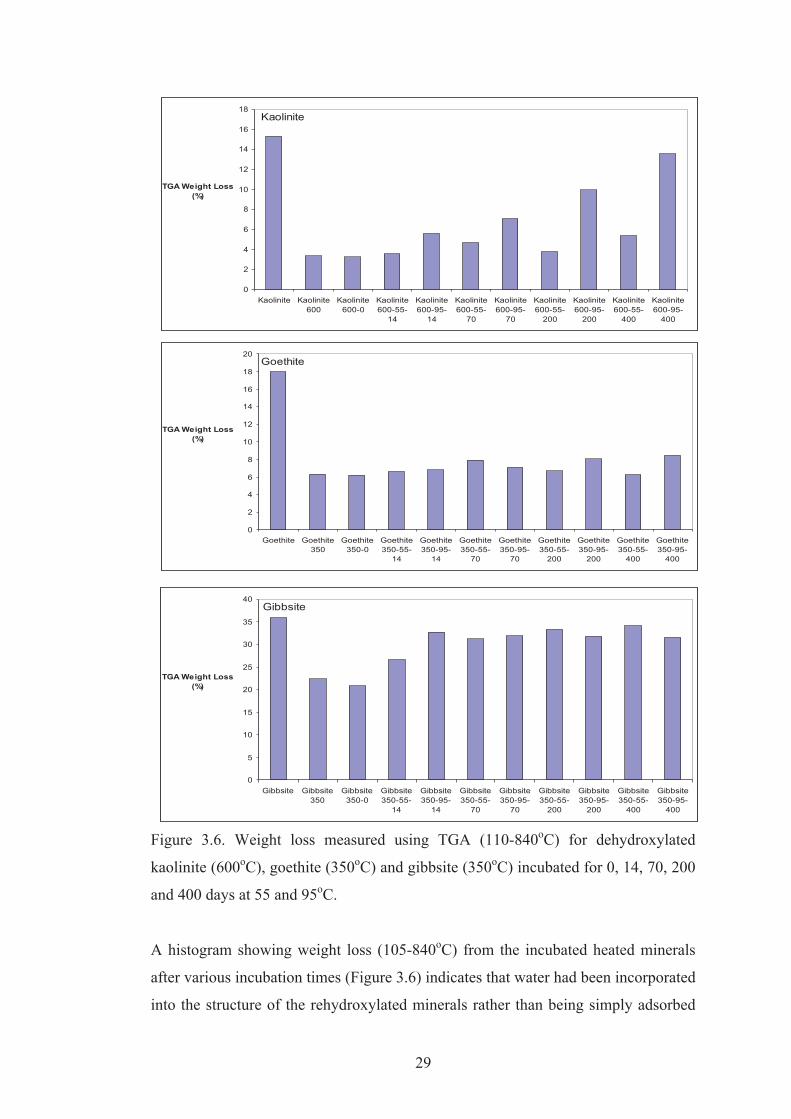
3.6 Weight loss measured using TGA (110-840oC) for dehydroxylated kaolinite (600oC), goethite (350oC) and gibbsite (350oC) incubated for 0, 14, 70, 200 and 400 days at 55 and 95oC.
29
3.7 Specific surface area (SSA) of variously dehydroxylated kaolinite, goethite and gibbsite samples incubated for 0, 14, 70, 200 and 400 days at 55 and 95oC.
32
3.8 Langmuir P sorption maxima for variously dehydroxylated kaolinite, goethite and gibbsite incubated for 0, 14, 70, 200 and 400 days at 55 and 95oC.
33
3.9 P sorption maximum versus specific surface area for variously dehydroxylated kaolinite (A), goethite (B) and gibbsite (C) incubated for 0, 14, 70, 200 and 400 days at 55 and 95oC.
34
3.10 Infrared spectra of original, dehydroxylated and rehydrated kaolinite, goethite and gibbsite incubated for 400 days at 55 and 95oC.
39
3.11 Electron micrographs of original, dehydroxylated and rehydroxylated kaolinite, goethite and gibbsite incubated for 400 days at 95 oC.
40
xi
4.1 Conventional XRD patterns (Cu Kα radiation), with inset for the clay fraction (a) and synchrotron XRD (SXRD) patterns (b) of original Bakers Hills (BH) soil and soil heated to 250oC, 350oC and 500oC. Q = quartz, K = kaolinite, Gi = gibbsite and Go = goethite. The broad background scattering for the SXRD patterns is due to the glass capillary containing the sample.
45
4.2 Scanning electron micrographs (SEM) and X-ray spectra of the indicated particles for original Bakers Hills (BH) soil and soil heated to 250oC, 350oC and 500oC.
49
4.3 Mean (n = 3) soil pH (a), EC (b) and plant available soil phosphorus (Bic P) (c) after the last harvest versus rate of P applied. Means having different letters are significantly different at P ≤ 0.05.
50
4.4 Mean (n = 3) data for the effect of heating on extractable soil Al, Fe and Si for BH, BH250, BH350 and BH500 after the last harvest for zero P applied. Ox = ammonium oxalate, SP = sodium pyrophosphate, and DCB = dithionite-citrate-bicarbonate.
54
4.5 Relationships between plant yield and rate of P applied for harvests 1, 2, and 3 for ryegrass grown on variously heated Bakers Hill soil (n = 3). Representative standard error values are shown in Fig. 4.5b.
55
4.6 Relationships between plant phosphorus concentration and rate of P applied for harvests 1, 2, and 3 for ryegrass grown on variously heated Bakers Hill soil (n = 3). Representative standard error values are shown in Fig. 6b.
58
4.7 Internal efficiency curves (yield versus plant P content) for three harvests of ryegrass grown on variously heated Bakers Hill soil (n = 3).
59
5.1 View of the study site one day after the Wundowie bushfire showing scorched eucalyptus and grass trees (a) and the position of a burnt eucalyptus log showing ash and charcoal (b).
63
5.2 Flow chart of analyses performed during the study. 64 5.3 Mean values of carbon and nitrogen concentrations (%) for 0-
1cm soil, gravel, ash and charcoal under and adjacent to burnt grass tree (GT) and eucalyptus (EU) logs.
69
5.4 Mean values of bicarbonate soluble P and K for soil (a) and gravel (b) under and adjacent to burnt grass tree (GT) and eucalyptus (EU) logs.
70
5.5 Conventional XRD patterns (a= fine soil fraction and b=gravel) and Synchrotron XRD (c=whole soil) of soil under and adjacent to a burnt grass tree (GT) log (Q=quartz, K=kaolinite, Gi=gibbsite, H=hematite and C=calcite).
75
5.6 Conventional XRD patterns (a=fine soil fraction and b=gravel) and Synchrotron XRD (c=whole soil) of soil under and adjacent to a burnt eucalyptus (EU) log (Q=quartz, K=kaolinite, Gi=gibbsite, H=hematite and C=calcite).
76
5.7 Conventional (a, b) and Synchrotron XRD (c) patterns of ash and charcoal for burnt grass tree (GT) and eucalyptus (EU)
77

xii
logs (Q=quartz, A= apatite, and C=calcite). 5.8 Scanning electron micrograph (SEM) and X-ray spectra of the
indicated particles for grass tree ash, where large rhombic calcite crystal (CaCO3) (a), microcrystalline apatite (Ca10(PO4)6(OH)2) with calcite (b) and mixed potassium and calcium salts (c and d) are present.
79
5.9 Scanning electron micrograph (SEM) and X-ray spectra of the indicated particles for eucalyptus ash where rhombic calcite (CaCO3) (a), microcrystalline mixed calcium and magnesium carbonates and sulphates (b), an alumino-silicate, possibly K-feldspar (KAlSi3O8) with calcite (c) and phosphorous enriched calcite (d) (possibly calcite with apatite) are present.
80
6.1 Principal component analysis of log total element concentration for native plant ash, variables (elements) (a) and plant material (b). Silver wattle wood (SW), silver wattle leaf (SL), prickly moses leaf and twig (PM), wandoo wood (WW), wandoo leaf (WL), red gum wood (RW), red gum leaf (RL), grass tree leaf (GT), jarrah leaf (JL), and harsh hakea leaf and twig (HH).
90
6.2 Principal component analysis of log water soluble element concentrations, variables (a) and cases (b) and log proportion that is water soluble, variables (c) and plant material (d) for native plant ash. Silver wattle wood (SW), silver wattle leaf (SL), prickly moses leaf and twig (PM), wandoo wood (WW), wandoo leaf (WL), red gum wood (RW), red gum leaf (RL), grass tree leaf (GT), jarrah leaf (JL), and harsh hakea leaf and twig (HH).
91
6.3 Mean (n=3) values with standard error bars of carbon (C) and nitrogen (N) concentrations (%) for native plant materials (original and ash). Silver wattle wood (SW), silver wattle leaf (SL), prickly moses leaf and twig (PM), wandoo wood (WW), wandoo leaf (WL), red gum wood (RW), red gum leaf (RL), grass tree leaf (GT), jarrah leaf (JL), and harsh hakea leaf and twig (HH).
93
6.4 (a) Synchrotron XRD patterns for SW, SL, PM, WW and WL. (b) Enlargements of part of the SXRD patterns (F=fairchildite (K2Ca(CO3)2), N=nesquehonite (MgCO3.H2O), C=calcite (CaCO3), S=sylvite (KCl), A=apatite (Ca5(PO4)3(OH), L=lime (CaO), E=scolecite (CaAl2Si3O10.3(H2O), Q=quartz (SiO2), Po=portlandite (Ca(OH)2 and P=periclase (MgO).
97
6.5 (a) Synchrotron XRD patterns for RW, RL, GT, JL, and HH. (b) Enlargements of parts of the SXRD patterns (F=fairchildite (K2Ca(CO3)2), N=nesquehonite (MgCO3.H2O), C=calcite (CaCO3), S=sylvite (KCl), A=apatite (Ca5(PO4)3(OH)), L=lime (CaO), E=scolecite (CaAl2Si3O10.3(H2O)), Q=quartz (SiO2), Po=portlandite (Ca(OH)2 and P=periclase (MgO).
98
6.6 Scanning electron micrograph (SEM) and X-ray spectra of the indicated ash particles for SW, SL, PM, WW and WL ash. Calcite crystals (CaCO3), microcrystalline hydroxyl apatite and mixed potassium, magnesium and calcium salts are present.
99
xiii
6.7 Scanning electron micrograph (SEM) and X-ray spectra of indicated ash particles for RW, RL, GT, JL, and HH ash. Calcrystals (CaCO3), microcrystalline hydroxyl apatite and mixpotassium, magnesium and calcium salts are present.
100
6.8 Principal component analyses of log SEM EDS elemental analyses results for native plant ash particles. Variables (a) and plant material (b). Silver wattle wood (SW), silver wattle leaf (SL), prickly moses leaf and twig (PM), wandoo wood (WW), wandoo leaf (WL), red gum wood (RW), red gum leaf (RL), grass tree leaf (GT), jarrah leaf (JL), and harsh hakea leaf and twig (HH).
101
6.9 Mean (n=3) values with standard error bars of pH (a), EC (b) and bicarbonate P (c) for unburnt soil incubated with native plant ash. Silver wattle wood (SW), silver wattle leaf (SL), prickly moses leaf and twig (PM), wandoo wood (WW), wandoo leaf (WL), red gum wood (RW), red gum leaf (RL), grass tree leaf (GT), jarrah leaf (JL), and harsh hakea leaf and twig (HH).
102
6.10 Mean (n=3) values with standard error bars of pH (a), EC (b) and bicarbonate P (c) for burnt soil incubated with native plant ash. Silver wattle wood (SW), silver wattle leaf (SL), prickly moses leaf and twig (PM), wandoo wood (WW), wandoo leaf (WL), red gum wood (RW), red gum leaf (RL), grass tree leaf (GT), jarrah leaf (JL), and harsh hakea leaf and twig (HH).
103
7.1 Flow chart for the dehydration and rehydration of kaolinite, gibbsite and goethite
106
7.2 Flow chart for the glasshouse study conducted on heated lateritic soil.
107
7.3 Flow chart for the field study of soil minerals heated in a bushfire at Wundowie, Darling Range, Western Australia.
109
7.4 Flow chart for the Australian native plants ash study. 111

xiv
LIST OF APPENDICES
Appendix Page 1 Thermal analysis results for kaolinite previously heated at 500oC:
wet incubated at 55 and 95oC for 14, 70 and 200 days 127
2 Thermal analysis results for kaolinite previously heated at 550oC: wet incubated at 55 and 95oC for 14, 70 and 200 days
128
3 Thermal analysis results for goethite previously heated at 250oC: wet incubated at 55 and 95oC for 14, 70 and 200 days
129
4 Thermal analysis results for goethite previously heated at 300oC: wet incubated at 55 and 95oC for 14, 70 and 200 days
130
5 Thermal analysis results for gibbsite previously heated at 250oC: wet incubated at 55 and 95oC for 14, 70 and 200 days
131
6 Thermal analysis results for gibbsite previously heated at 300oC: wet incubated at 55 and 95oC for 14, 70 and 200 days
132
7 Analyses of dry plant tops (leaves and shoots) of annual ryegrass (Lolium rigidum Gaud) for Harvest 1.
133
8 Analyses of dry plant tops (leaves and shoots) of annual ryegrass (Lolium rigidum Gaud) for Harvest 2.
134
9 Analyses of dry plant tops (leaves and shoots) of annual ryegrass (Lolium rigidum Gaud) for Harvest 3.
135
10 Conventional XRD patterns for (a) silver wattle wood (SW), silver wattle leaf (SL), prickly moses leaf and twig (PM), wandoo wood (WW), wandoo leaf (WL); (b) red gum wood (RW), red gum leaf (RL), grass tree leaf (GT), jarrah leaf (JL), and harsh hakea leaf and twig (HH), (N=nesquehonite (MgCO3.H2O), C=calcite (CaCO3), S=sylvite (KCl), A=apatite (Ca5(PO4)3(OH)), E=scolecite (CaAl2Si3O10.3(H2O)), Q=quartz (SiO2), Po=portlandite (Ca(OH)2) and P=periclase (MgO).
136
1
Chapter 1
1.0 Introduction
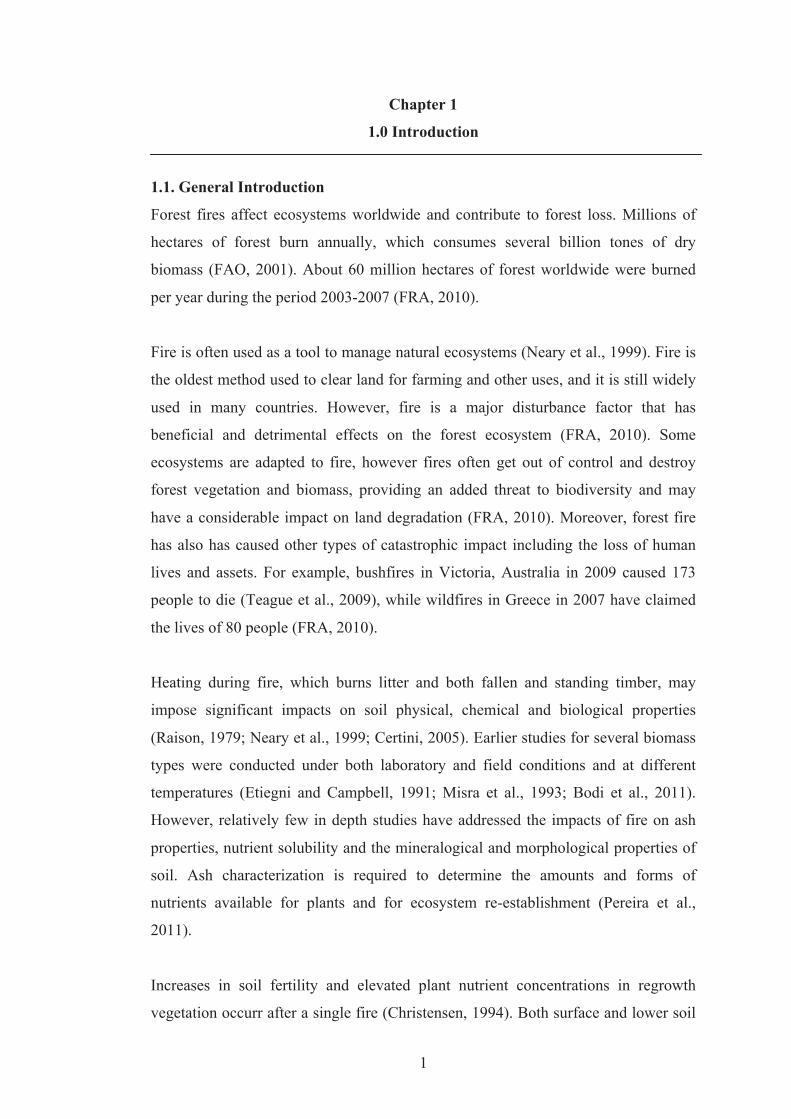
1.1. General Introduction
Forest fires affect ecosystems worldwide and contribute to forest loss. Millions of
hectares of forest burn annually, which consumes several billion tones of dry
biomass (FAO, 2001). About 60 million hectares of forest worldwide were burned
per year during the period 2003-2007 (FRA, 2010).
Fire is often used as a tool to manage natural ecosystems (Neary et al., 1999). Fire is
the oldest method used to clear land for farming and other uses, and it is still widely
used in many countries. However, fire is a major disturbance factor that has
beneficial and detrimental effects on the forest ecosystem (FRA, 2010). Some
ecosystems are adapted to fire, however fires often get out of control and destroy
forest vegetation and biomass, providing an added threat to biodiversity and may
have a considerable impact on land degradation (FRA, 2010). Moreover, forest fire
has also has caused other types of catastrophic impact including the loss of human
lives and assets. For example, bushfires in Victoria, Australia in 2009 caused 173
people to die (Teague et al., 2009), while wildfires in Greece in 2007 have claimed
the lives of 80 people (FRA, 2010).
Heating during fire, which burns litter and both fallen and standing timber, may
impose significant impacts on soil physical, chemical and biological properties
(Raison, 1979; Neary et al., 1999; Certini, 2005). Earlier studies for several biomass
types were conducted under both laboratory and field conditions and at different
temperatures (Etiegni and Campbell, 1991; Misra et al., 1993; Bodi et al., 2011).
However, relatively few in depth studies have addressed the impacts of fire on ash
properties, nutrient solubility and the mineralogical and morphological properties of
soil. Ash characterization is required to determine the amounts and forms of
nutrients available for plants and for ecosystem re-establishment (Pereira et al.,
2011).
Increases in soil fertility and elevated plant nutrient concentrations in regrowth
vegetation occurr after a single fire (Christensen, 1994). Both surface and lower soil
2
horizons may be affected in high intensity fires. The effects of burning on soil
characteristics varies with the duration and intensity of fire, fuel and soil types,
including the amount of soil organic matter present at the time of fire (Raison et al.,
1985). The effects of fire on plant nutrient cycles have been widely studied (Raison,
1979; Certini, 2005). In contrast, the effect of heating on soil mineralogy and the
growth of plants after heating of soil have not been extensively studied although
modest (200-600oC) temperatures cause mineral transformations and may influence
the availability of several nutrients (Ketterings et al., 2000).
Kaolinite alters into metakaolinite at temperatures between 500oC and 700oC
(Richardson, 1972; Ulery and Graham, 1993) losing lattice water. Gibbsite
commonly alters to an amorphous phase on heating at 200oC (Rooksby, 1972), and
goethite is transformed to hematite at ≈300 oC (Cornell and Schwertmann, 1996).
The majority of research on the stability of minerals under heating conditions has
been conducted in the laboratory with both synthetic and purified pure minerals and
not on soils. The persistence of the dehydroxylated compounds in heated soils in the
field, which may affect the availability of nutrients for plants, is unknown and
deserves further investigation.
1.2 Objectives of this study
The specific aim of the study was to investigate the potential impacts of forest fire on
a highly weathered Western Australian soil containing heat sensitive hydroxylated
minerals. The study investigated soil and ash properties, including chemistry,
mineralogy and morphology that may affect the growth of plants after fire.
Experiments on how heating impacts on soil minerals including subsequent mineral
reversion by rehydroxylation were also conducted. The research involved studies on
ideal mineral samples as well as soil samples. The research was carried out under
laboratory, glasshouse and field conditions.
1.3. Structure of the thesis
This thesis consists of 7 chapters in which each chapter specifies and discusses
different aspects of the research and also discusses the related literature. Justification
and objectives of the research are introduced in Chapter 1. A general literature
review is given in Chapter 2. Chapter 3, 4, 5 and 6 have been written in journal

3
format and the manuscripts are currently under review, in press or published in high
impact journals.
Rehydration of heated gibbsite, kaolinite and goethite: an assessment of properties
and environmental significance is Chapter 3. Short term effects of heating a lateritic
podzolic soil on the availability to plants of native and added phosphate is in Chapter
4. Changes in the mineralogy and chemistry of a lateritic soil due to a bushfire at
Wundowie, Darling Range, Western Australia is Chapter 5. Minerals in the ash of
Australian native plants is Chapter 6. General discussion and conclusions, limitations
of this work and suggestions for further work are presented in Chapter 7. Tables and
figures are placed within the text and all the references cited are listed at the end of
the thesis followed by the appendices.

4
Chapter 2
2.0 Literature Review
2.1 Forest fires issues in the world
Fire is one of major disturbances on forest management where millions of hectares
of forest are affected by fire each year (FAO, 2001). An average of 60 million
hectares of forest were burned per year during the period of 2003-2007 worldwide.
This data only reflected 63% of global forest area as the information on forest fires
continues to be poorly reported. During the same period, an average of 156 000
forest fires occurred per year. The largest number of fires were in United States of
America, the Russian Federation, India, Poland and China where in total about
10000 fires occurred per year (FRA, 2010).
The major causes of fire are lightning, volcanoes and human action. Human activity
is now believed to be the main reason of forest fire (Shakesby et al., 2003; Turekian
et al., 1998). Forest fire affects the ecosystem and biodiversity patterns along with
the landscape (Myers et al., 2004). It affects the existence of individual plants and
animal species within the area of fire. Some other impacts of forest fires are
economic losses, destruction of the biological environment of the forest and hence
man’s natural environment (Karlikowski, 1982). Fires affect the ecosystem in several
ways (FRA, 2000): regulating plant succession, regulating fuel accumulation,
controlling age, structure and species composition of vegetation, affecting insect and
disease populations, influencing nutrient cycles and energy flows, regulating biotic
productivity, diversity and stability, and determining habitats for wildlife. Moreover,
fires have reduced the amount of some soil animals in the topsoil (Malmstrom,
2008). The top layer soil animals are killed immediately during fires, while animals
that live in deeper layers may survive or be killed (Wikars and Schimmel, 2001).

5
Table 2.1. Example of a fire intensity and an associated severity rating for eucalypt-
dominated sclerophyll vegetation communities in south eastern Australia based on
Cheney (1981), Jasper (1999) and (Shakesby et al, 2003). Fire intensity and severity
are broadly related.
Fire intensity (a)
(kW/m)
Max flame height
(m)
Severity
rating
Post-fire vegetation
characteristics
≤ 500 1.5 Low Only ground fuel and
shrubs <2m high burnt
501-3000 5.0 Moderate All ground fuel and shrub
vegetation <4m high
consumed
3001-7000 10.0 High All ground and shrub
vegetation consumed and
lower tree canopy <10m
high scorched
7001-70,000 10-30 Very high All green vegetation
including tree canopy up to
30m and woody vegetation
<5mm diameter consumed
70,001-100,000+ 20-40 Extreme All green and woody
vegetation <10mm
diameter consumed a The fire intensity index as defined by Byram (1959).
While fire has been the primary agent of forest degradation, some forest ecosystems
depend on fire for their regeneration and to retain their vigour and reproductive
capacity (FRA, 2010). Several tree species may take advantage of fire and periodic
controlled burns can contribute to overall forest health. Fire normally moves through
forests burning lower branches and clearing dead wood from the forest floor, which
improves restoration by providing ideal growing conditions for many plant species.
It may also provide a better forest floor habitat for some species that favor relatively
open spaces. Ketterings et al. (1999) stated in their recent survey that fire is

6
commonly used for forest clearing to provide an easy and economical means of
increasing access. Fire is also commonly used to burn logging slash and facilitate
seedbed formation for agricultural practises (Rab, 1996).
Shakesby et al. (2006) mentioned that the impacts of forest fire are influenced by the
frequency and severity of the fire itself. Frequencies of fire are determined by the
types of vegetation and climate. On the other hand, fire severity relies on the
interactions of burning intensity and duration, as well as the characteristics of fuels
(biomass), soil and local climate. Myers et al. (2004) stated that a landscape fire
regime is established by several factors, including:
- The human, physical, and biological properties of the landscape; these along
with weather and fuel characteristics, which influence the chance of ignition
and the speed and extent of spread
- The sequence of individual fires, including the characteristics and timing of
each fire
- The time elapsed between fires, which influences the recovery of the
landscape and its species composition
- The spectrum of potential different fire regimes as determined by the number
and size of fires and also the weather.
There are two main type of forest fires: controlled (prescribed) and wildfires
(Certini, 2005). Prescribed fires are controlled application of fire under specified
environmental conditions to reduce fuel levels and to avoid the severity of wildfires.
This type of fire is normally at low intensity and applied when soil is moderately
moist. Wildfires in general, are uncontrolled fire with the presence of massive fuel
loads and have high severity.
There are several different schemes use to classify the fire regimes. According to
Shakesby et al. (2006), forest fire is classified into three different types: ground fires
that influence the organic layer such as leaves and other parts of the plants, surface
fires which affect plants and bushes and burn the bases and crowns of trees, and
canopy fires that flame the higher leaves and branches. Shakesby et al. (2006)
summarised the fire regimes based on the intensity and severity (Table 2.1). The

7
scheme of fire development is described by Viegas (1998) in Figure 2.1. Brown and
Smith (2000) on the other hand, classify fire regimes as follows:
- Understorey fire (occur on forests and woodlands). Fires are generally non-
lethal to the dominant vegetation and do not substantially change the
structure of the dominant vegetation.
- Stand replacement fire (occur on forests, woodlands, shrublands, and
grasslands). Fires destroy the dominant vegetation and alters the structure of
aboveground vegetation. Approximately 80% or more of the top layer
dominant vegetation is either consumed or destroyed as a result of fires.
- Mixed severity fire (occur on forests and woodlands). Severity of fire either
causes selective mortality in dominant vegetation, depending on different tree
species susceptibility to fire, or varies between understorey and stand
replacement.
- Non-fire regime. There is a little possibility that it will experience natural
fire.
Clearly with increasing severity of fire, there is a greater probability of the soil being
heated and altered.
2.2 Forest fires issues in Australia
Fire has been part of the Australian natural ecosystem for millions of years. Fire has
been used as the most powerful land-use tool by the Indigenous Australians to
manage grasslands, forest and fauna (Gill and Moore, 1990). Australia is one of the
most fire prone continents with a huge variety of vegetation and fire regimes (FRA,
2000). Eucalyptus, acacias and grasses are well-adapted to fire regimes. Many
Australian plants and animals have evolved to survive fire events and most
Australian ecosystems have developed very strong relationships with fire. However,
fire also has caused fatalities in Australia where it has claimed over 800 lives since
1851 (Haynes et al., 2008). The recent devastating “Black Saturday” bushfires in
Victoria in 2009 caused 173 people to lose their lives
Based on Australian fire reports, about 115,000-230,000 fires were observed per year
by remote sensing during fire periods between 1998-2000. A map of fires detection
for one day in late 2000 is presented in Figure 2.2. Earlier reports stated that wildfire

8
has caused about 1million hectares of the forestland to be burned during the 1956-
1971 period.
Fire Growth Fire Decay
Secondary growth Decay
Initial growth Flame
extinction
Flaming
Glowing Glow
extinction
Ignition Extinction
Pyrolysis
Pre-heating Cooling
Figure 2.1 Scheme of fire development phases and fire spread regimes (Viegas,
1998).
Fire regimes in Australia are driven by climate and land use (Myers et al., 2004).
Figure 2.3. shows distribution of fire danger over seasons in Australia. Myers et al.
(2004) summarised that there are three major fire regions:
- The wet-dry tropical savanna region. Landscape-scale fires occur annually.
Fuels, such as grasses and herbs, accumulate during the wet season. During
the dry season, the fuels cure and there are spells of moderate to extreme fire
weather. Fires can also be ignited by people and by lightning. Fires tend to
occur in the dry season months of May to December.
Crown Fire
Surface Fire Surface Fire
Ground Fire Ground Fire
Initial state Final state
9
- The semi arid and arid interior. Landscape-scale fires occur episodically,
typically at intervals of up to a decade. Extensive fires only happen after
periods of exceptional growth when fuel is increased by the growth of
annuals between Spinifex hummocks, due to above average rainfall. The hot,
dry climate promotes curing of fuels every year. Fires usually occur in
spring-summer, from September to January.
- The southern temperate zone. Landscape-scale fires occur episodically, and
at intervals of decades. Major fires occur in those rare years when there is
both drought and severe fire weather. These fires are usually associated with
forests where fuels are woody rather than grassy. Fires typically occur from
October to March. (The present research relates to vegetation and fire in this
zone).
Figure 2.2. Fire detection map for 15th December 2000 in Australia, overlaid
on a pan-Australian vegetation cover map. Note that Eastern Australia
experiences a wet climate in this season. Source: Satellite Remote Sensing
Services Department of Land Administration (DOLA).

10
Figure 2.3. The times of peak fire danger in Australia (Australian Climate Extreme
Fires, 2008).
2.3 Impacts of forest fire on soil properties
Soil heating may eliminate the beneficial effects of surface organic layer on soil
properties. The effects of burning on soil characteristic may vary within the duration
and intensity of fire, fuel and soil types, and also the amount of soil organic matter
present at the time of fire (Flinn et al., 1984). Certini (2005) in his review on the
effects of forest fire on soil properties points out that fire alteration of soil properties
depends on several factors. The major factor is severity that is controlled by the
amount, nature and moisture of live and dead fuel, air temperature and humidity,
wind speed and also the topography of the area. Fire severity reflects both the
intensity and duration of fire (Certini, 2005; Keely, 2009).
Substantial amounts of organic matter are lost during fire at temperatures above
300oC thus affecting soil properties (Terefe et al., 2008). Fires increase soil
temperature, which can considerably disturb ecosystem dynamics by changing
nutrient quantity and cycling by affecting soil chemical, biological and physical
properties. The nutrients particularly N, S and P may experience oxidation to
gaseous form, organic matter volatilisation, ash particles convection, and water
transport both by leaching and residue transport (Binkley et al., 1992).

11
Heat transferred to soil depends on surface temperature and exposure duration
(Steward et al., 1990). Overall, soil heating during a fire occurs in topsoil to depths
of 10-15 cm (Ketterings et al., 2000). Ghuman and Lal (1989) conducted research on
soil temperature during a fire. They measured the soil temperature at 1cm depth in a
tropical rainforest during burning at 218oC. The temperature reached 150, 104 and
70oC at 5, 10 and 20cm depths respectively.
The effects of fire on plant nutrient cycles have been widely studied in native and
managed forests as well as for slash and burn agriculture in tropical forest
(Kauffman et al., 1993; Ketterings et al., 1999). However, the impacts of burning of
vegetation for several different temperatures have not been widely investigated.
Some studies reported increase in soil fertility and plant nutrient concentrations
shortly after a single fire (Christensen, 1994). Soils heated during a fire may
experience significant impacts on several soil properties (Raison, 1979). The effects
occur in both surface and lower horizons for both low and high fire intensities.
Commonly, burning raises the pH of surface soil (approximately 0-3cm),
exchangeable Ca2+, extractable P and other nutrients. These increases take place
quickly and the elevated concentrations may continue for up to 1 year or more
(Tomkins et al., 1991). Nitrogen and phosphorus are the nutrient elements that are
most affected by fire (Ferran et al., 2005). The fire interval needed to enable
recovery for these elements has been calculated to be in the order of 10-12 years for
N and 20 for P (Raison et al., 1985). Fire may be the dominant factor affecting C and
N losses from some forests (Cadwell et al., 2002).
Fire may cause P loss by volatilisation when temperatures exceed 360oC and during
burning P is also removed as ash in smoke (Cotton and Wilkinson, 1988). Raison et
al. (1985) found that P exported to the atmosphere may constitute 50% of the total P
in the combusted fuels. In contrast, many researchers believe that there is a large
increase of P in the soil surface shortly after fire as much plant P is retained on site
in ash (Wilbur and Christensen, 1985). Ferran et al (1991) reported an increase of
total P in the topsoil (0-5cm) after a wildfire.

12
Bauhus et al. (1993) analysed the effect of fire on carbon and nitrogen mineralisation
and nitrification in an Australian forest soil. In an incubation experiment they
determined the occurrence of nitrification in ash-beds and unburnt soils in native
eucalypt forests. In contrast to such detailed information on the forms and fate of
nitrogen in burnt soil, there are few observations on the chemistry, mineralogy and
morphology of other nutrient elements in soil.
2.4. Studies on ash
Burning creates ash-bed as fire removes some or all of the vegetation and litter
cover. The presence of ash may influence hydrological behaviour and soil erosion
processes (Woods and Balfour, 2008).
Khanna and Raison (1986) have conducted experiment on the function of ash as a
nutrient source and the process involved in the alteration of forms of elements
present near the soil surface. They found that the availability of plant nutrients
increased during the first year after fire.
Burning is used to remove plant residues in forestry and agricultural areas and also
for natural vegetation management (Khanna and Raison, 1986). Burning plant
materials may have beneficial and harmful effects on soil properties and the growth
of plants (Raison, 1979). Beneficial effects may include the increased availability of
plant nutrients, while harmful effects on the other hand could be associated with
organic matter losses and nutrient transport in smoke during the burning (Khanna
and Raison, 1994).
Nutrient losses due to fire depend on fuel utilization, fire behaviour, microclimate,
plant composition and structure, fire severity, fuel moisture content and fuel
compactness (Raison, 1979; Kauffman et al., 1993). Vegetation burning has resulted
in nutrient losses to the atmosphere (Kauffman et al., 1993). Both the black carbon
remaining after fire and nutrients are deposited on the soil surface in the form of ash,
which may be lost by wind or water erosion or leached through the soil (Raison et
al., 1985; Kauffman et al., 1993).

13
Several researchers have investigated the variability of ash layer thickness (Cerdá
and Doerr, 2008; Woods and Balfour, 2008), which normally ranges from less than 1
to 10 cm (Goforth et al., 2005). Gabet and Sternberg (2008) identified up to 20cm
thick ash layers in heavy fuel combustion areas. The amount of ash and its chemical
composition varied with the combustion temperatures (Etiegni and Campbell, 1991).
The major elements present in ash are calcium, potassium, magnesium, silicon,
manganese, aluminium, iron, phosphorus, sodium and zinc (Etiegni and Campbell,
1991; Misra et al., 1993; Liodakis et al., 2005). Misra et al., (1993) studied the
chemical and mineralogical composition of various types of wood ash and found that
for 600oC combustion, ash mainly consists of calcite (CaCO3) and fairchildite
(K2Ca(CO3)2) and for 1300oC lime (CaO) and periclase (MgO) dominate. Liodakis et
al., (2005) observed that the main compounds present in the ash of several forest
species were oxides, carbonates and sulfates of calcium, magnesium and potassium.
Combustion above 600oC resulted in decomposition of dolomite ((CaMg)CO3),
fairchildite (K2Ca(CO3)2), sylvite (KCl), arcanite (K2SO4) and potash (K2CO3). Lime
(CaO) and periclase (MgO) were present in wood ash combusted at 600oC.
Published information on ash properties is mainly for wood ash; little information is
available for the ash of leaves, bark and other parts of plants. However, Ulery and
Graham (1993) stated that ash composition depends on several factors, including
plant species, part of plant (wood, leaves, bark), plant age, soil type, climate and
condition of combustion.
2.5 Heating Effect on Soil Mineralogy
We will consider some soil minerals with structural (OH) that are affected by heating
(dehydroxylation) at quite low temperatures. Kaolinite is a dioctahedral 1:1 layer
silicate with the crystal chemical formula Si2Al2O5(OH)4. The structure contains
hydroxyl groups (Rocha, 1999). Goethite (α-FeOOH) is widespread soil mineral.
Gibbsite is one of the forms of aluminum hydroxide (Al(OH3) that occur in soils.
Little is known on the impact of soil heating on mineralogical properties of the soil
although modest (250-500oC) fires and extreme fires (>500oC) cause various mineral
transformations. Ketterings et al. (2000) investigated the effect of heat intensity on

14
the mineralogy of Oxisols in the Sepunggur area, Jambi Province, Sumatra,
Indonesia where slash and burn agriculture is commonly used. They evaluated the
effect of fire on mineralogy and soil texture in field and laboratory experiments.
They found that changes in soil properties with burning mostly affect the top layer
(0-5cm). The soil texture became coarser after burning, and heating soil reduced
gibbsite and kaolinite concentrations converting goethite into ultra fine maghemite.
The majority of the research on the stability of minerals under heating condition has
been conducted in the laboratory with both synthetic and purified natural minerals.
However, Ulery et al. (1996) observed effects of heating in the field environment.
Fire caused the collapse of some 2:1 phllyosilicates and destroyed kaolinite. The
occurrence of maghemite in soils has often been related to the dehydroxylation of
goethite or lepidocrocite by heating in fires in the presence of organic matter (Anand
and Gilkes, 1987).
Heating kaolinite alters it to metakaolinite, the Si-O arrangement remains intact and
the Al-O network reorganises itself. Frost et al. (2003) summarised thermal reactions
of kaolinite as shown in Fig. 2.4.
predehydroxylation state
Thermal Reactions of Kaolinite
Al2(OH)4Si2O5
450-550oC
Metakaolinite Spinel
Mullite
950-980oC
1000-1100oC
Figure 2.4. A summary of the thermal reactions of kaolinite (Frost et al, 2003).
Many studies have been conducted on the transformation of goethite into hematite
(Gonzalez et al., 2000) by heating and mechanochemical (dry) grinding. Those

15
studies were related based on the wide interest of the technological applications of
iron oxides. The transformation reactions can be either: (a) a direct change from
goethite into hematite, 2 α-FeOOH α-Fe2O3+ H2O, or (b) a transformation with
the formation of an intermediate superstructure phase before final formation into
hematite; α-FeOOH superstructure (FeOOH) α-Fe2O3 (Watari et al., 1979).
Fan et al. (2006) showed that goethite may transform into protohematite and then
hydrohematite and finally into hematite on heating.
Heating will transform gibbsite into an amorphous material (MacKenzie et al.,
1999). During thermal treatment, gibbsite may transform into chi alumina, then
progressively into gamma, theta and alpha alumina (corundum) (Bokhimi et al.,
2002). Wang et al. (2006) summarized dehydration of gibbsite as a complex process
depending on particle size and heating rate as follows:
Gibbsite amorphous phase
Gibbsite boehmite amorphous phase
Clearly there are several possible transformations that reflect the nature of the
gibbsite and heating regime.
2.6 Studies on Minerals Reversion
As discussed above, there have been many studies on the transformations of
kaolinite, gibbsite and goethite on heating. However, very few studies have
considered the reversion of heated kaolinite and gibbsite and there are no published
data on the reversion of heated goethite.
Rocha et al. (1990) studied rehydroxylation of metakaolinite to kaolinite using Solid
State NMR and cognate techniques. They measured specific surface area and weight
loss of the mineral based on reaction times for several hydrothermal treatments
(Table 2.2). Metakaolinite was transformed back into kaolinite by suitable
experimental conditions. Rocha et al., (1990) achieved rehydroxylation of
metakaolinite to kaolinite by heating in an autoclave at 155oC for 1, 2, 7 and 14 days,
at 200oC for 1 and 2 days, and at 250oC for 3 and 6 days. Infrared spectra and XRD
results showed that at 155oC for 14 days, 250oC for 3 days or more the
characteristics of kaolinite reappeared. The electron microscopy and specific surface
area (SSA) measurements support their finding. Hydrothermally treated
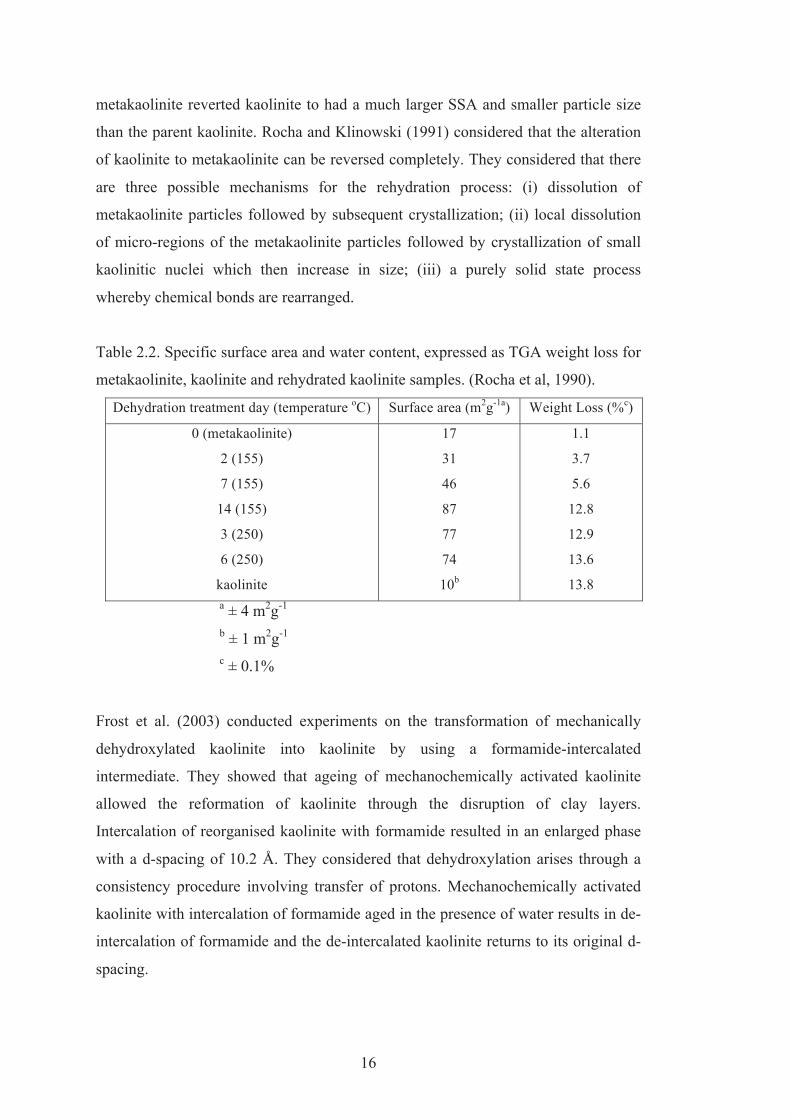
16
metakaolinite reverted kaolinite to had a much larger SSA and smaller particle size
than the parent kaolinite. Rocha and Klinowski (1991) considered that the alteration
of kaolinite to metakaolinite can be reversed completely. They considered that there
are three possible mechanisms for the rehydration process: (i) dissolution of
metakaolinite particles followed by subsequent crystallization; (ii) local dissolution
of micro-regions of the metakaolinite particles followed by crystallization of small
kaolinitic nuclei which then increase in size; (iii) a purely solid state process
whereby chemical bonds are rearranged.
Table 2.2. Specific surface area and water content, expressed as TGA weight loss for
metakaolinite, kaolinite and rehydrated kaolinite samples. (Rocha et al, 1990).
Dehydration treatment day (temperature oC) Surface area (m2g-1a) Weight Loss (%c)
0 (metakaolinite)
2 (155)
7 (155)
14 (155)
3 (250)
6 (250)
kaolinite
17
31
46
87
77
74
10b
1.1
3.7
5.6
12.8
12.9
13.6
13.8
a ± 4 m2g-1
b ± 1 m2g-1
c ± 0.1%
Frost et al. (2003) conducted experiments on the transformation of mechanically
dehydroxylated kaolinite into kaolinite by using a formamide-intercalated
intermediate. They showed that ageing of mechanochemically activated kaolinite
allowed the reformation of kaolinite through the disruption of clay layers.
Intercalation of reorganised kaolinite with formamide resulted in an enlarged phase
with a d-spacing of 10.2 Å. They considered that dehydroxylation arises through a
consistency procedure involving transfer of protons. Mechanochemically activated
kaolinite with intercalation of formamide aged in the presence of water results in de-
intercalation of formamide and the de-intercalated kaolinite returns to its original d-
spacing.

17
Miśta and Wrzyszcz (1999) studied the rehydration of transition aluminas prepared
by flash calcination of gibbsite. The results show the relation of the phase transitions
associated with the recrystallization of amorphous alumina that are produced through
the contact of water with the alumina surface. The final rehydration product was
crystalline Al(OH)3, mainly bayerite, which was observed by XRD and TEM after
100 hours of rehydration at 25oC. XRD results illustrated the alteration of an
amorphous phase that transform into pseudoboehmite then into Al(OH)3, mainly
bayerite. After rehydration at 216 hours at 50oC, small amounts of gibbsite were
detected.
In this review of the literature, it has been established that soil is heated by forest fire
and that:
(a) hydroxylated soil minerals (particularly kaolinite, gibbsite and goethite) may
become dehydroxylated creating diverse, sometimes disordered minerals.
These minerals may exhibit increased chemical reactivity and so affect
adsorption of plant nutrient and other ions. The dehydroxylated minerals may
rehydroxylate under ambient conditions.
(b) ash deposited during bushfires may contains diverse compounds that will
variously affect soil properties. The nature of ash compounds is poorly
understood and more detailed information will help with the prediction of the
extent and rate of dissolution of plant nutrient ions in ash.
This thesis is focussed on these two important issues.

18
Chapter 3
3.0 Rehydration of heated gibbsite, kaolinite and goethite: an assessment of
properties and environmental significance
3.1. Introduction
Several common micrometric minerals in soils contain structural hydroxyl ions that
are lost on heating. Kaolinite (Si2O5(OH)4Al2), goethite (α-FeOOH) and gibbsite (Al
(OH)3) are major constituents of highly weathered soils (Schwertmann and Taylor,
1989). These minerals will be affected by heating during managed and natural forest
fires. Forest fires may heat topsoils to temperatures in excess of 500oC (Sertsu and
Sanchez, 1978; Chandler et al., 1983). The effects of fire on soil mineralogy are
poorly known, although these heating temperatures will dehydroxylate several
minerals (Ketterings et al., 2000).
There have been numerous laboratory studies of the dehydroxylation of kaolinite,
goethite and gibbsite (Rocha et al., 1990; Ruan et al., 2002; De Faria and Lopes,
2007; Landers and Gilkes, 2007). Kaolinite dehydroxylates to form metakaolinite at
temperatures between 450oC to 600oC (Grim, 1968; Richardson, 1972; Babuskhin et
al., 1985). Gibbsite is dehydroxylated at about 200oC to produce a mixture of
boehmite and amorphous alumina (Rooksby, 1972) and goethite transforms to
hematite at about 300oC (Cornell and Schwertmann, 1996). The question arises as to
whether rehydroxylation of these three dehydroxylated minerals is possible. Heated
gibbsite does rehydroxylate readily in the laboratory (Miśta and Wrzyszcz, 1999)
and a small amount of kaolinite may be regenerated from metakaolinite although the
process is slow (Grim and Bradley, 1948; Rocha et al., 1990). There are no
corresponding studies of the rehydroxylation of heated goethite. Dehydroxylation of
these minerals may affect their specific surface area and surface reactions, which
will be of significance to chemical reactions in soils that involve adsorption of ions
such as phosphate (Ketterings et al., 2002).
Soils mostly provide a humid environment so that minerals that have been
dehydroxylated in a bush fire may tend to rehydroxylate in the soil. The apparent
absence of large amounts of dehydroxylated minerals in frequently burnt soils
19
supports this proposition but the topic has not been adequately investigated. This
chapter investigates the rehydration of dehydroxylated kaolinite, goethite and
gibbsite in the laboratory to identify if rehydroxylation is likely to occur under soil-
like conditions.
3.2. Material and methods
We investigated how heating impacts three soil minerals (kaolinite, goethite and
gibbsite) and their subsequent rehydroxylation.
3.2.1. Pure minerals and heating procedures
A pure synthetic gibbsite sample was supplied by Alcoa, Western Australia,
kaolinite came from the McNamee Pit Bath, South Carolina, United States and
goethite from a lateritic soil at Koniambo, New Caledonia. The three minerals were
heated for one hour at temperatures above and below their DTA dehydroxylation
maxima. Kaolinite (K) was heated at 500oC (K500), 550oC (K550) and 600oC
(K600); gibbsite (Gi) was heated at 250oC (Gi250), 300oC (Gi300) and 350oC
(Gi350); and goethite (Go) at 250oC (Go250), 300oC (Go300) and 350oC (Go350).
For the rehydration experiment, 6.5 g of the heated mineral were mixed with 26 cm3
of water before heating in a sealed container in an oven for 0, 14, 70, 200 and 400
days at two temperatures (55 and 95oC).
3.2.2. Chemical and morphological analysis
Mineral properties were investigated using several techniques. Conventional XRD
analysis was conducted with a Philips PW3020 diffractometer with a graphite
diffracted beam monochromator (CuKα, 50kV, 20 mA) and scans from 4 to 70o 2θ.
Synchrotron XRD (SXRD) analysis was performed at the Australian Synchrotron,
where powder samples were mounted into glass capillaries and scanned from 4-60o
2θ. The wavelength for SXRD was set at ~1.0 Å to provide a high peak/background
in order to identify minor constituents. Thermal analysis (TGA, DTGA, DTA) was
done on a STA 6000 instrument (Perkin-Elmer, Norwalk, CT, USA), and
transmission electron microscopy on a JEOL 3000 FEG electron microscope
equipped with an Oxford Instruments INCA 200 Energy Dispersive Spectrometer
(EDS). Specific surface area (SSA) was measured using a Micrometrics Gemini
2375 instrument with VacPrep 061 using a five point B. E. T. method with N2 as the
20
absorbate. Phosphate (P) adsorption (x) was measured following the Ozanne and
Shaw (1967) method with the P concentration in the filtrate (c) being determined by
the molybdate blue method (Murphy and Riley 1962). The P adsorption data were
fitted to the linear form of the Langmuir equation as follows, where xm is the P
adsorption maximum:
c/x = (bxm)-1 +(c/xm) (Barrow 1978)
Fourier transform infrared (FTIR) spectra were obtained with a Perkin Elmer
Spectrum One spectrometer with samples dried at 105oC for 24 hours prior to
analysis. Samples were prepared in KBr disks with sample to KBr ratio of 1: 300.
Elemental composition of the minerals (Table 3.1) was determined using an
inductively coupled plasma optical emission spectrometer (ICP-OES) (Perkin-Elmer,
Norwalk, CT, USA) after perchloric acid digestion where minerals were completely
dissolved. This acid digestion procedure was validated using standard minerals and
rocks.
Table 3.1. Properties of mineral samples used in the study.
Properties Kaolinite Goethite Gibbsite
pH (1:5 H2O) 4.54 4.81 7.80
EC (1:5 H2O) μS/cm 79.3 48.1 53.4
Total P (mg/kg) 249 nd nd
Total Ca (mg/kg) 948 37 nd
Total Mg (mg/kg) 1180 1271 nd
Total K (mg/kg) 34 nd 45
Total Na (mg/kg) 204 nd 100
Total S (mg/kg) 62 2132 8
Total Cd (mg/kg) 0.2 nd nd
Total Ni (mg/kg) 19 10270 nd
Total As (mg/kg) 3 nd 2
Total Pb (mg/kg) 27 nd nd
Total Cu (mg/kg) 15 12 nd
Total Mn (mg/kg) 42 4131 nd
Total Zn (mg/kg) 13 255 nd
Total Fe (%) 0.39 54.7 0.04
Total Al (%) 12 2 36
Note: nd-Not detected.

21
3.3. Results and Discussion
3.3.1. X-ray diffraction and chemical data
Examples of conventional XRD random powder patterns of original and variously
dehydroxylated kaolinite, goethite and gibbsite are shown in Figure 3.1. Original
kaolinite contains minor amounts of illite and anatase. The quite high Mg content
represents exchangeable Mg (Table 3.1). The high Ni and quite high Mg and Mn
content of the goethite are a consequence of its origin in a weathered ultramafic rock.
Soil goethite commonly contains substantial amounts of Al (Cornell and
Schwertmann, 1996).
On heating at 500-600oC, kaolinite dehydroxylated to form metakaolinite (Figure
3.1A), a compound where the two dimensional Si-O arrangement remains but the
Al-O network is disorganised (Yokozeki et al., 2004). Heating at 300 and 350oC
transformed goethite into poorly ordered hematite (Figure 3.1C). Goethite only
partly dehydroxylates at these temperatures so that the hematite is more
appropriately described as hydrohematite (Pomies et al., 1998). Fan et al. (2006)
considered that goethite progressively transforms into protohematite, then into
hydrohematite and finally into hematite on heating.
Gibbsite heated at 350oC altered to an amorphous phase and minor boehmite (Figure
3.1E). Wang et al. (2006) showed that the structural transformations during
dehydration of gibbsite is a complex process that is affected by crystal size and
heating conditions as follows:
Gibbsite amorphous phase and simultaneously
Gibbsite boehmite amorphous phase
Synchrotron XRD patterns of original and heated kaolinite goethite and gibbsite in a
glass capillary were also obtained as they offer better resolution of weak and
adjacent reflections than conventional XRD (Williams et al., 2003), but the glass of
the capillaries contributed to the broad scattering characteristic of amorphous
compounds so that conventional XRD was also used (Figure 3.1).
22
A. Kaolinite, Conventional XRD.
5 15 25 35 45 55 65
2θ Cu Kα
Kaolinite
K500
Metakaolinite K600
K550 I
A
B. Goethite, Conventional XRD.
5 15 25 35 45 55 65
2θ Cu Kα
Go350 Hematite
Goethite
Go300
Go250
C. Gibbsite Conventional XRD.
5 15 25 35 45 55 65
2θ Cu Kα
Gi350
Gibbsite
Boehmite and amorphous material
Gi250
Gi300
Boehmite
Figure 3.1. Conventional XRD patterns for original and dehydroxylated kaolinite
(A), goethite (B) and gibbsite (C) heated at the indicated temperatures.

23
A. Kaolinite heated at 600oC.
5 15 25 35 45 55 65
2θ Cu Kα
Kaolinite
K600
K600-0
K600-55-14
K600-95-14
K600-95-70
K600-55-70
K600-55-200
K600-95-200
Metakaolinite
K600-55-400
K600-95-400 Metakaolinite I I A
B. Goethite heated at 350oC.
5 15 25 35 45 55 65
2θ Cu Kα
Goethite
Go350
Go350-0
Go350-55-14
Go350-95-14
Go350-95-70
Go350-55-70
Go350-55-200
Go350-95-200
Hydrohematite
Go350-55-400
Go350-95-400 H
H H
C. Gibbsite heated at 350oC.
5 15 25 35 45 55 65
2θ Cu Kα
Gi350-55-14 Gi350-95-14
Gi350 Gibbsite
Gi350-0
Gi350-95-70 Gi350-55-70
Gi350-55-200 Gi350-95-200
Bo Gi
Ba
Ba
Ba
Gi
Gi Ba Ba Gi Bo Bo
Gi Ba
Boehmite and amorphous material
Bo
Gi350-55-400
Gi350-95-400
Figure 3.2. XRD patterns for heated kaolinite (A), goethite (B) and gibbsite (C), wet
incubated at 55/95 oC, 0-400 days, Cu Kα radiation. I=illite, A=anatase, H=hematite,
Bo=boehmite, Gi=gibbsite, and Ba=bayerite.
24
Figure 3.2 and 3.3 show XRD and SXRD patterns respectively for heated kaolinite,
goethite and gibbsite after wet incubation for various times and temperatures. SXRD
showed a much better peak to background discrimination than conventional XRD
but the broad scattering maximum due to glass was dominant for SXRD patterns
(Figure 3.3). Both techniques showed that metakaolinite formed from kaolinite at
600oC (Fig. 3.2 A and 3.3 A) persisted during wet incubation, and rehydration of this
material to reform kaolinite did not occur for up to 400 days of incubation, at 55 or
95oC. This results contrasts with findings of Rocha and Klinowski (1991) and Frost
et al. (2003) who considered that dehydration of kaolinite to form metakaolinite is
completely reversible. They state that there are three possible mechanisms for this
rehydration process: (i) dissolution of metakaolinite particles followed by
crystallization; (ii) local dissolution of micro-regions of the metakaolinite particles
followed by crystallization of small kaolinitic nuclei, which then increase in size;
(iii) a purely solid state process whereby chemical bonds are rearranged. However
under the condition of the present experiment, which more closely resembles
ambient conditions than those used by the cited authors, none of these changes were
observed.
Hydrohematite formed from goethite at 350oC (Figure 3.2 B and 3.3 B) also showed
no reversion during wet incubation so that after 400 days of incubation at 55 and
95oC, the broad hematite reflections persisted. There are no published studies on the
rehydroxylation of hematite into goethite. Heated gibbsite (initially boehmite and
amorphous material) rapidly recrystallised during wet incubation and after 14 days at
95oC, boehmite (Bo), bayerite (Ba) and gibbsite (Gi) had formed (Figure 3.2C and
3.3C). The rehydroxylation process was much slower at 55oC but was extensive after
400 days.

25
5 15 25 35 45 55 65
2θ angle
Kaolinite
K600-95-400
K600
K600-95-200
Metakaolinite
5 15 25 35 45 55 65
2θ angle
Go350
Go350-95-200
Go350-95-400
Hydrohematite
Goethite
5 15 25 35 45 55 65
2θ angle
Gibbsite
Gi350-95-400
Gi350
Gi350-95-200
Boehmite and amorphous material
Figure 3.3. Synchrotron XRD patterns for unheated and 600oC heated kaolinite (A),
350oC heated goethite (B) and 350oC heated gibbsite (C), wet incubated at 95oC, for
200 and 400 days, Cu Kα radiation.
A
B
C

26
3.3.2. Thermal analysis
TGA and DTA plots for kaolinite are shown in Figure 3.4A. The endotherm at
520oC corresponds to dehydroxylation of kaolinite. The sample weight was reduced
by 15.3 wt.% during the dehydroxylation process, which is close to the theoretical
value of 14 wt.% (Ptáček et al., 2010). The additional 1.3 wt.% presumably
corresponds to strongly adsorbed water that was lost between 110 and 400oC.
Goethite dehydroxylation is shown in Figure 3.5B with an endotherm and associated
water loss peaking at 280oC (Prasad et al., 2006). TGA and DTA data for gibbsite
(Figure 3.4C) show a strong endotherm at 300oC (Pereira et al., 2009). This
endothermic peak is due to gibbsite dehydroxylation to boehmite and amorphous
material. A small endotherm at 530oC is associated with the dehydroxylation of
boehmite (MacKenzie, 1957).
The TGA and DTA results for the three minerals after the rehydration treatment are
shown in Figure 3.5. The complete thermal analysis results for kaolinite, goethite
and gibbsite, wet incubated at 55 and 95oC are presented in Appendix 1, 2, 3, 4, 5
and 6. All three minerals had acquired structural water (we define this as water lost
at T > 110oC) during the rehydration treatment. Neither rehydrated heated kaolinite
nor goethite provided the sharp DTGA/DTA dehydroxylation peaks that would
indicate that crystalline minerals had formed. This result is consistent with XRD data
that indicated that the metakaolinite formed from kaolinite heated at 600oC and
hematite formed from goethite at 350oC had not developed an ordered structure
during the wet incubation. However thermal analysis data show that rehydroxylation
and recrystallisation of heated gibbsite was extensive at 95oC and both DTA/TGA
and XRD results indicate that boehmite (Bo), bayerite (Ba) and gibbsite (Gi) had
formed (Figure 3.2C).

27
A
B
C
Figure 3.4. Thermal analysis results for original kaolinite (A), goethite (B) and
gibbsite (C) showing dehydroxylation peaks.
DTGA
DTA
TGA
520oC
DTGA
DTA
TGA
520oC
TGA
DTA
DTGA
280oC
TGA
DTA
DTGA
280oC
DTGA
DTA
TGA
300oC
510oC
DTGA
DTA
TGA
300oC
510oC
28
A
B
C
Figure 3.5. Thermal analysis results for kaolinite (A) previously heated at 600oC,
goethite (B) and gibbsite previously heated at 350oC (C): then wet incubated at 95oC
for 400 days.
DTGA
DTA
TGA
DTGA
DTA
TGA
DTGA
DTA
TGA
DTGA
DTA
TGA
DTGA
DTA
TGA
DTGA
DTA
TGA
300oC
510oC
DTGA
DTA
TGA
300oC
510oC
29
Figure 3.6. Weight loss measured using TGA (110-840oC) for dehydroxylated
kaolinite (600oC), goethite (350oC) and gibbsite (350oC) incubated for 0, 14, 70, 200
and 400 days at 55 and 95oC.
A histogram showing weight loss (105-840oC) from the incubated heated minerals
after various incubation times (Figure 3.6) indicates that water had been incorporated
into the structure of the rehydroxylated minerals rather than being simply adsorbed
0
2
4
6
8
10
12
14
16
18
Kaolinite Kaolinite600
Kaolinite600-0
Kaolinite600-55-
14
Kaolinite600-95-
14
Kaolinite600-55-
70
Kaolinite600-95-
70
Kaolinite600-55-
200
Kaolinite600-95-
200
Kaolinite600-55-
400
Kaolinite600-95-
400
TGA Weight Loss(%)
Kaolinite
0
5
10
15
20
25
30
35
40
Gibbsite Gibbsite350
Gibbsite350-0
Gibbsite350-55-
14
Gibbsite350-95-
14
Gibbsite350-55-
70
Gibbsite350-95-
70
Gibbsite350-55-
200
Gibbsite350-95-
200
Gibbsite350-55-
400
Gibbsite350-95-
400
TGA Weight Loss(%)
Gibbsite
0
2
4
6
8
10
12
14
16
18
20
Goethite Goethite350
Goethite350-0
Goethite350-55-
14
Goethite350-95-
14
Goethite350-55-
70
Goethite350-95-
70
Goethite350-55-
200
Goethite350-95-
200
Goethite350-55-
400
Goethite350-95-
400
TGA Weight Loss(%)
Goethite
30
(i.e. adsorbed water is assumed lost at <105oC). Rehydrated kaolinite that had been
first heated at 600oC and then incubated for 400 days at 95oC contained nearly 14%
water, which is 11% more than the 3% water that remained in the heated kaolinite.
We consider that the water incorporated into metakaolinite during incubation may
represent an initial step towards the eventual recrystallisation of kaolinite, although
this water is not lost during a distinct dehydroxylation endotherm at 520oC as occurs
for kaolinite. Hematite (hydrohematite) formed at 350oC contained about 6%
residual water and only gained a small amount (up to 2%) of additional water during
incubation. This water was lost over a wide range of temperatures rather than at
280oC as occurred for dehydroxylation of goethite. Gibbsite heated at 350oC retained
about 21% H2O in boehmite and amorphous alumina and acquired up to 10% water
during incubation, some of which was incorporated into the structures of boehmite,
bayerite and gibbsite that recrystallised during incubation. The distinct
dehydroxylation endotherms at 300 and 510oC correspond to these minerals.
3.3.3. Specific surface area and phosphate adsorption
Dehydroxylation of goethite at 300 and 350oC caused substantial increases in
specific surface area (SSA) with no corresponding systematic effect for kaolinite and
gibbsite (Figure 3.7). Landers et al. (2009) observed a 1.5-2.6-fold increase in
specific surface area due to dehydroxylation of goethite that reflected the
development of micropores in the newly formed OH-hematite. The SSA of
dehydroxylated goethite (0, 250, 300, 350oC) was not systematically affected by
rehydration (0-400 days) at 55 and 95oC. The SSA of dehydroxylated kaolinite (500,
550, 600oC) increased substantially with rehydration period (0-400 days) at 55 and
95oC. This result is consistent with observations of Rocha et al. (1990) who found
that the SSA of metakaolinite treated at 155oC for 2-14 days in an autoclave
increased from 10 to 87 m2/g with increasing reaction time. The SSA of heated (250,
300, 350oC) gibbsite initially increased with incubation times of 14 or 70 days for
both incubation temperatures (55, 95oC) then decreased substantially due to the
growth of crystals of gibbsite, boehmite and bayerite. These changes were
particularly large for 350oC heated gibbsite.
The increase of specific surface area and reduced crystalline order of heated and
rehydroxylated minerals is likely to affect some soil chemical reactions. Sanchez
31
(1976) states that minerals have a higher P sorption capacity in the order: 2:1
minerals < kaolinite < gibbsite = goethite < amorphous oxides. Ketterings et al.
(2002) considered that the loss of sorption sites due to the dehydroxylation of
kaolinite, gibbsite and goethite is offset by the formation of amorphous phases with a
higher specific surface area.
Phosphate adsorption maxima (Xm) values for kaolinite (Figure 3.8) were increased
to a minor extent by dehydroxylation at 500-600 oC. There were mostly systematic
increases in P adsorption maxima with incubation treatment for heated kaolinite. The
largest increase was by 697 μg P/g for 600oC heated kaolinite incubated at 95oC for
70 days. Dehydroxylation of goethite at 250-350oC did not affect P adsorption
maximum but the P adsorption maximum (μg/g) of dehydroxylated goethite (0, 250,
300, 350oC) increased substantially (up to 596 μg P/g) with rehydroxylation at 55oC
for 400 days (Figure 3.8). The P adsorption maximum of gibbsite was increased
slightly (≈ 166 μg P/g) by dehydroxylation at 250 to 350oC (Figure 3.8) and mostly
did not change systematically with rehydration time (0-400 days) at 55 and 95oC.
The relationships between P adsorption maximum and specific surface area of the
rehydroxylated minerals are shown in Figure 3.9. There is no clear systematic
relationship between specific surface area and P adsorption maximum for any
mineral or rehydroxylation treatment. Presumably the nature of the exposed surfaces
has a greater effect on P adsorption than does the SSA.
3.3.4. Infrared analysis
Infrared spectra for kaolinite, goethite, gibbsite and their dehydroxylated and
rehydrated products are shown in Figure 3.10. The complexity of the infrared spectra
with many of the peaks being due to ordered arrays of ions was reduced by heating
as three dimensional ordering was decreased or destroyed. The loss of peaks and
development of broad bands for all three minerals coincided with the loss of sharp
XRD reflections. Heating causes those bands due to lattice modes to generally shift
to lower wavenumbers (Freund, 1974). Tables 3.2, 3.3 and 3.4 show infrared
absorption peaks for kaolinite, goethite, gibbsite and their various dehydroxylated
and rehydrated products compared with published assignments for the absorption
peaks.

32
0
10
20
30
40
50
60
70
80
K
K-5
5-14
K
-95-
14
K-5
5-70
K
-95-
70
K-5
5-20
0 K
-95-
200
K-5
5-40
0 K
-95-
400
K50
0 K
500-
0 K
500-
55-1
4 K
500-
95-1
4 K
500-
55-7
0 K
500-
95-7
0 K
500-
55-2
00
K50
0-95
-200
K
500-
55-4
00
K50
0-95
-400
K
550
K55
0-0
K55
0-55
-14
K55
0-95
-14
K55
0-55
-70
K55
0-95
-70
K55
0-55
-200
K
550-
95-2
00
K55
0-55
-400
K
550-
95-4
00
K60
0 K
600-
0 K
600-
55-1
4 K
600-
95-1
4 K
600-
55-7
0 K
600-
95-7
0 K
600-
55-2
00
K60
0-95
-200
K
600-
55-4
00
K60
0-95
-400
SS
A (
sq m
/g)
500 oC heated
550 oC heated
600 oC heated
Kaolinite
Original
0
20
40
60
80
100
120
140
160
Go
Go-
55-1
4 G
o-95
-14
Go-
55-7
0 G
o-95
-70
Go-
55-2
00
Go-
95-2
00
Go-
55-4
00
Go-
95-4
00
Go2
50
Go2
50-0
G
o250
-55-
14
Go2
50-9
5-14
G
o250
-55-
70
Go2
50-9
5-70
G
o250
-55-
200
Go2
50-9
5-20
0 G
o250
-55-
400
Go2
50-9
5-40
0 G
o300
G
o300
-0
Go3
00-5
5-14
G
o300
-95-
14
Go3
00-5
5-70
G
o300
-95-
70
Go3
00-5
5-20
0 G
o300
-95-
200
Go3
00-5
5-40
0 G
o300
-95-
400
Go3
50
Go3
50-0
G
o350
-55-
14
Go3
50-9
5-14
G
o350
-55-
70
Go3
50-9
5-70
G
o350
-55-
200
Go3
50-9
5-20
0 G
o350
-55-
400
Go3
50-9
5-40
0
SS
A (s
q m
/g)
Goethite
Original
250 oC heated 300 oC heated 350 oC heated
0
10
20
30
40
50
60
70
80
Gi
Gi-5
5-14
G
i-95-
14
Gi-5
5-70
G
i-95-
70
Gi-5
5-20
0 G
i-95-
200
Gi-5
5-40
0 G
i-95-
400
Gi2
50
Gi2
50-0
G
i250
-55-
14
Gi2
50-9
5-14
G
i250
-55-
70
Gi2
50-9
5-70
G
i250
-55-
200
Gi2
50-9
5-20
0 G
i250
-55-
400
Gi2
50-9
5-40
0 G
i300
G
i300
-0
Gi3
00-5
5-14
G
i300
-95-
14
Gi3
00-5
5-70
G
i300
-95-
70
Gi3
00-5
5-20
0 G
i300
-95-
200
Gi3
00-5
5-40
0 G
i300
-95-
400
Gi3
50
Gi3
50-0
G
i350
-55-
14
Gi3
50-9
5-14
G
i350
-55-
70
Gi3
50-9
5-70
G
i350
-55-
200
Gi3
50-9
5-20
0 G
i350
-55-
400
Gi3
50-9
5-40
0
SS
A (s
q m
/g)
Gibbsite
Original 250 oC heated
300 oC heated
350 oC heated
Figure 3.7. Specific surface area (SSA) of variously dehydroxylated kaolinite,
goethite and gibbsite samples incubated for 0, 14, 70, 200 and 400 days at 55 and
95oC.
Original 250oC heated
Original
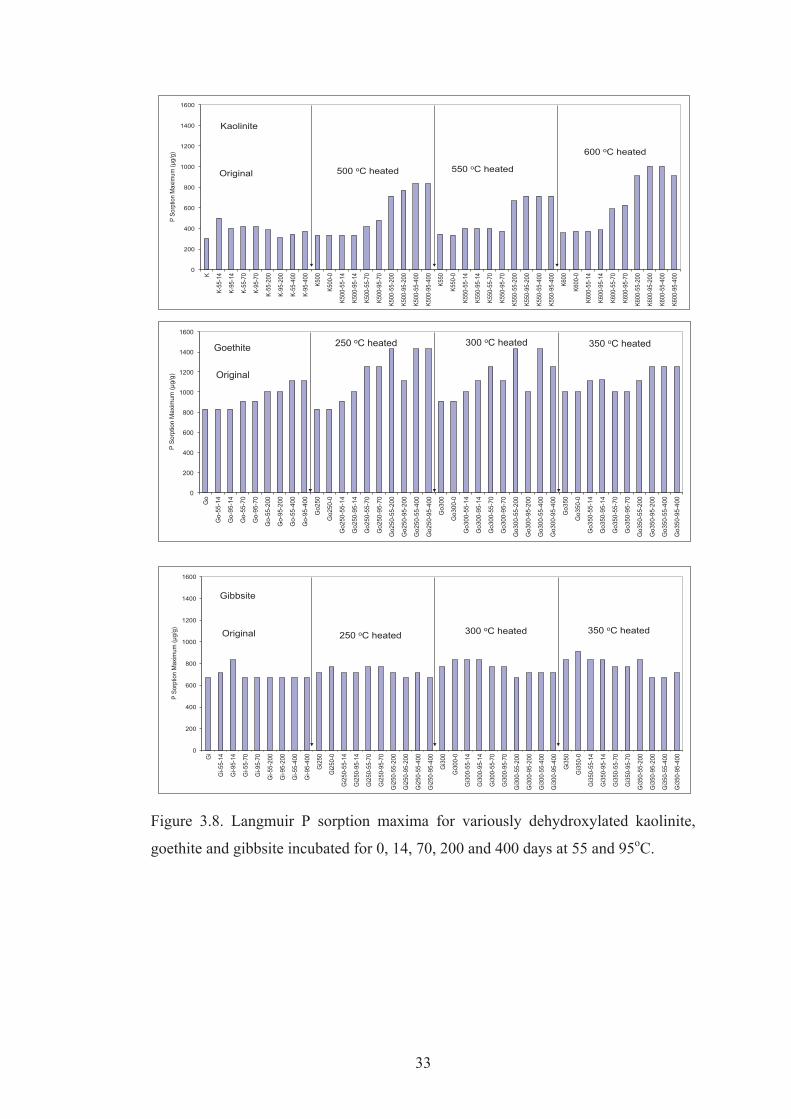
33
0
200
400
600
800
1000
1200
1400
1600
K
K-55
-14
K-95
-14
K-55
-70
K-95
-70
K-55
-200
K-95
-200
K-55
-400
K-95
-400
K500
K500
-0
K500
-55-
14
K500
-95-
14
K500
-55-
70
K500
-95-
70
K500
-55-
200
K500
-95-
200
K500
-55-
400
K500
-95-
400
K550
K550
-0
K550
-55-
14
K550
-95-
14
K550
-55-
70
K550
-95-
70
K550
-55-
200
K550
-95-
200
K550
-55-
400
K550
-95-
400
K600
K600
-0
K600
-55-
14
K600
-95-
14
K600
-55-
70
K600
-95-
70
K600
-55-
200
K600
-95-
200
K600
-55-
400
K600
-95-
400
P So
rptio
n M
axim
um (μ
g/g)
Kaolinite
Original 500 oC heated 550 oC heated
600 oC heated
0
200
400
600
800
1000
1200
1400
1600
Go
Go-
55-1
4
Go-
95-1
4
Go-
55-7
0
Go-
95-7
0
Go-
55-2
00
Go-
95-2
00
Go-
55-4
00
Go-
95-4
00
Go2
50
Go2
50-0
Go2
50-5
5-14
Go2
50-9
5-14
Go2
50-5
5-70
Go2
50-9
5-70
Go2
50-5
5-20
0
Go2
50-9
5-20
0
Go2
50-5
5-40
0
Go2
50-9
5-40
0
Go3
00
Go3
00-0
Go3
00-5
5-14
Go3
00-9
5-14
Go3
00-5
5-70
Go3
00-9
5-70
Go3
00-5
5-20
0
Go3
00-9
5-20
0
Go3
00-5
5-40
0
Go3
00-9
5-40
0
Go3
50
Go3
50-0
Go3
50-5
5-14
Go3
50-9
5-14
Go3
50-5
5-70
Go3
50-9
5-70
Go3
50-5
5-20
0
Go3
50-9
5-20
0
Go3
50-5
5-40
0
Go3
50-9
5-40
0
P So
rptio
n M
axim
um (μ
g/g)
Goethite
Original
250 oC heated 300 oC heated 350 oC heated
0
200
400
600
800
1000
1200
1400
1600
Gi
Gi-5
5-14
Gi-9
5-14
Gi-5
5-70
Gi-9
5-70
Gi-5
5-20
0
Gi-9
5-20
0
Gi-5
5-40
0
Gi-9
5-40
0
Gi2
50
Gi2
50-0
Gi2
50-5
5-14
Gi2
50-9
5-14
Gi2
50-5
5-70
Gi2
50-9
5-70
Gi2
50-5
5-20
0
Gi2
50-9
5-20
0
Gi2
50-5
5-40
0
Gi2
50-9
5-40
0
Gi3
00
Gi3
00-0
Gi3
00-5
5-14
Gi3
00-9
5-14
Gi3
00-5
5-70
Gi3
00-9
5-70
Gi3
00-5
5-20
0
Gi3
00-9
5-20
0
Gi3
00-5
5-40
0
Gi3
00-9
5-40
0
Gi3
50
Gi3
50-0
Gi3
50-5
5-14
Gi3
50-9
5-14
Gi3
50-5
5-70
Gi3
50-9
5-70
Gi3
50-5
5-20
0
Gi3
50-9
5-20
0
Gi3
50-5
5-40
0
Gi3
50-9
5-40
0
P So
rptio
n M
axim
um (μ
g/g)
Gibbsite
Original 250 oC heated 300 oC heated 350 oC heated
Figure 3.8. Langmuir P sorption maxima for variously dehydroxylated kaolinite,
goethite and gibbsite incubated for 0, 14, 70, 200 and 400 days at 55 and 95oC.
250oC heated
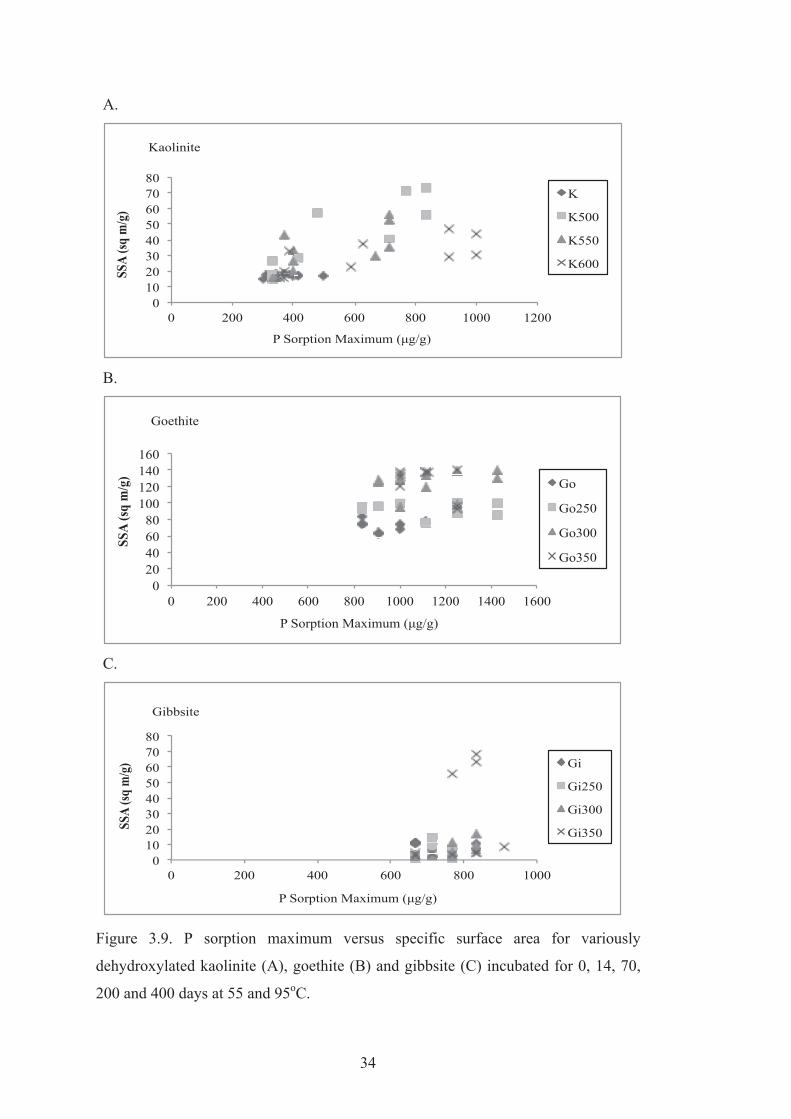
34
A.
0 10 20 30 40 50 60 70 80
0 200 400 600 800 1000 1200
SSA
(sq m
/g)
P Sorption Maximum (μg/g)
Kaolinite
K
K500
K550
K600
B.
0 20 40 60 80
100 120 140 160
0 200 400 600 800 1000 1200 1400 1600
SSA
(sq
m/g
)
P Sorption Maximum (μg/g)
Goethite
Go
Go250
Go300
Go350
C.
0 10 20 30 40 50 60 70 80
0 200 400 600 800 1000
SSA
(sq m
/g)
P Sorption Maximum (μg/g)
Gibbsite
Gi
Gi250
Gi300
Gi350
Figure 3.9. P sorption maximum versus specific surface area for variously
dehydroxylated kaolinite (A), goethite (B) and gibbsite (C) incubated for 0, 14, 70,
200 and 400 days at 55 and 95oC.
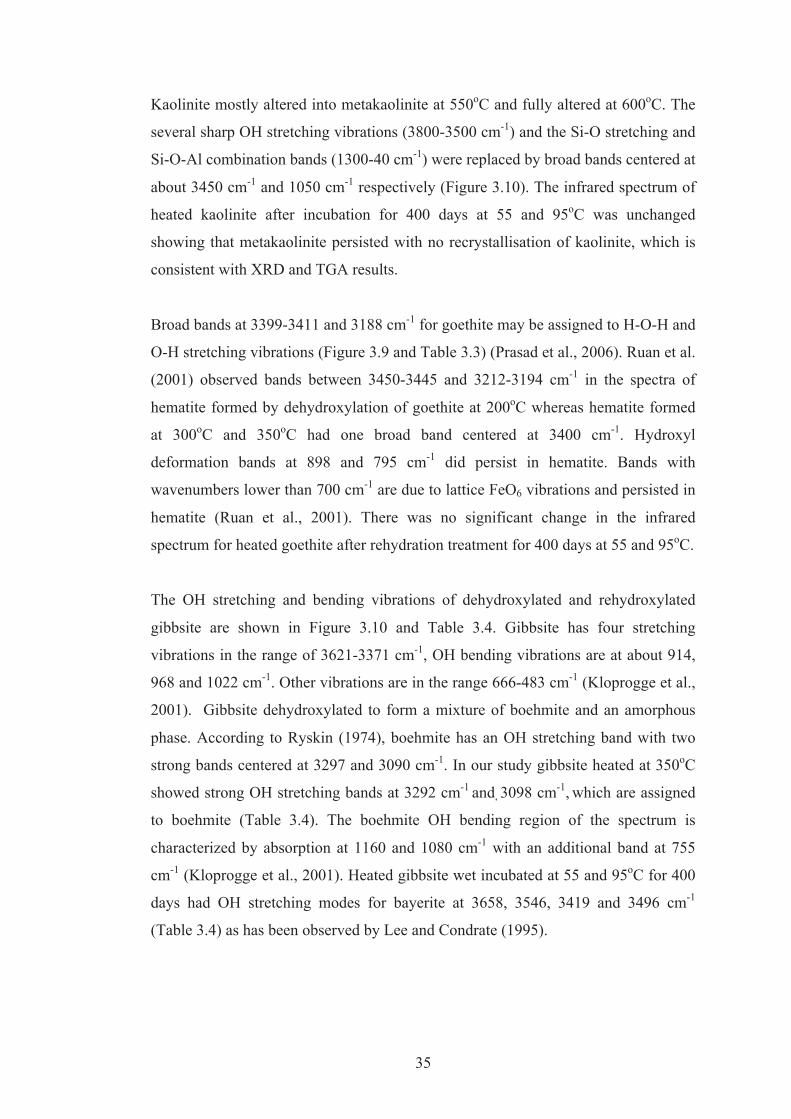
35
Kaolinite mostly altered into metakaolinite at 550oC and fully altered at 600oC. The
several sharp OH stretching vibrations (3800-3500 cm-1) and the Si-O stretching and
Si-O-Al combination bands (1300-40 cm-1) were replaced by broad bands centered at
about 3450 cm-1 and 1050 cm-1 respectively (Figure 3.10). The infrared spectrum of
heated kaolinite after incubation for 400 days at 55 and 95oC was unchanged
showing that metakaolinite persisted with no recrystallisation of kaolinite, which is
consistent with XRD and TGA results.
Broad bands at 3399-3411 and 3188 cm-1 for goethite may be assigned to H-O-H and
O-H stretching vibrations (Figure 3.9 and Table 3.3) (Prasad et al., 2006). Ruan et al.
(2001) observed bands between 3450-3445 and 3212-3194 cm-1 in the spectra of
hematite formed by dehydroxylation of goethite at 200oC whereas hematite formed
at 300oC and 350oC had one broad band centered at 3400 cm-1. Hydroxyl
deformation bands at 898 and 795 cm-1 did persist in hematite. Bands with
wavenumbers lower than 700 cm-1 are due to lattice FeO6 vibrations and persisted in
hematite (Ruan et al., 2001). There was no significant change in the infrared
spectrum for heated goethite after rehydration treatment for 400 days at 55 and 95oC.
The OH stretching and bending vibrations of dehydroxylated and rehydroxylated
gibbsite are shown in Figure 3.10 and Table 3.4. Gibbsite has four stretching
vibrations in the range of 3621-3371 cm-1, OH bending vibrations are at about 914,
968 and 1022 cm-1. Other vibrations are in the range 666-483 cm-1 (Kloprogge et al.,
2001). Gibbsite dehydroxylated to form a mixture of boehmite and an amorphous
phase. According to Ryskin (1974), boehmite has an OH stretching band with two
strong bands centered at 3297 and 3090 cm-1. In our study gibbsite heated at 350oC
showed strong OH stretching bands at 3292 cm-1 and, 3098 cm-1, which are assigned
to boehmite (Table 3.4). The boehmite OH bending region of the spectrum is
characterized by absorption at 1160 and 1080 cm-1 with an additional band at 755
cm-1 (Kloprogge et al., 2001). Heated gibbsite wet incubated at 55 and 95oC for 400
days had OH stretching modes for bayerite at 3658, 3546, 3419 and 3496 cm-1
(Table 3.4) as has been observed by Lee and Condrate (1995).
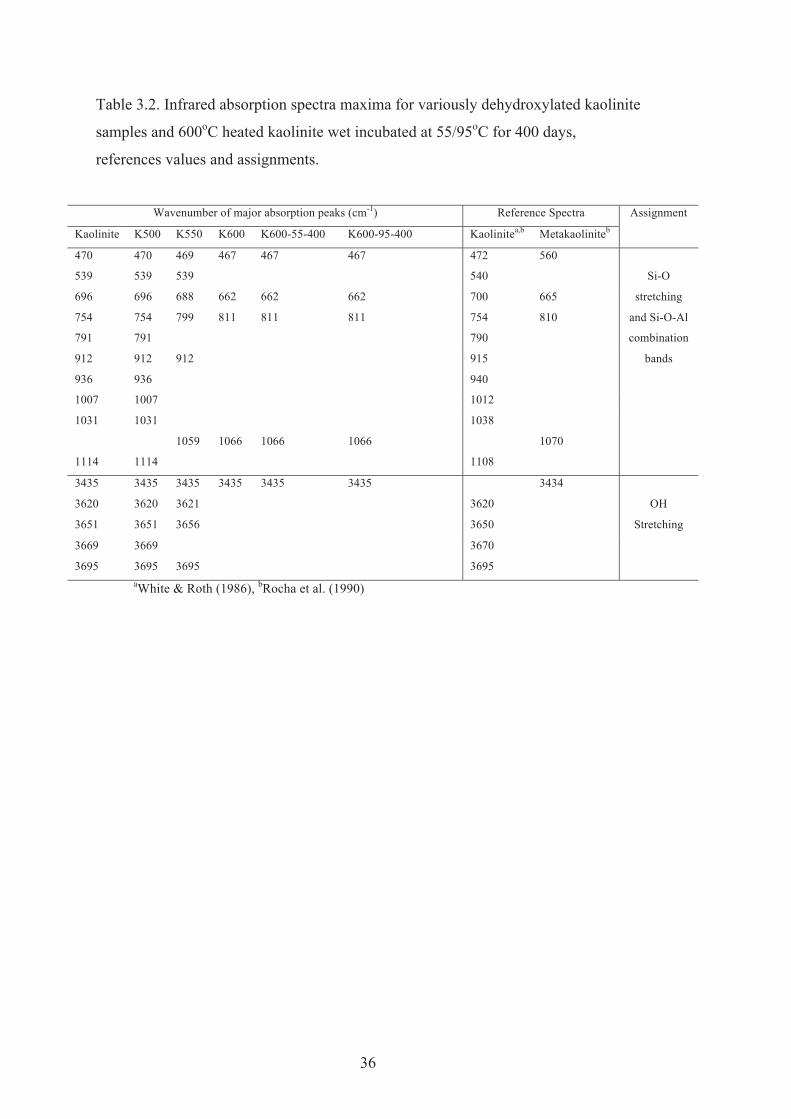
36
Table 3.2. Infrared absorption spectra maxima for variously dehydroxylated kaolinite
samples and 600oC heated kaolinite wet incubated at 55/95oC for 400 days,
references values and assignments.
Wavenumber of major absorption peaks (cm-1) Reference Spectra Assignment
Kaolinite K500 K550 K600 K600-55-400 K600-95-400 Kaolinitea,b Metakaoliniteb
470
539
470
539
469
539
467 467 467 472
540
560
Si-O
stretching
and Si-O-Al
combination
bands
696
754
791
696
754
791
688
799
662
811
662
811
662
811
700
754
790
665
810
912
936
912
936
912 915
940
1007 1007 1012
1031
1114
1031
1114
1059
1066
1066
1066
1038
1108
1070
3435
3620
3651
3435
3620
3651
3435
3621
3656
3435 3435 3435
3620
3650
3434
OH
Stretching
3669
3695
3669
3695
3695
3670
3695
aWhite & Roth (1986), bRocha et al. (1990)

37
Table 3.3. Infrared absorption spectra maxima for variously dehydroxylated goethite
samples and 350oC heated goethite wet incubated at 55/95oC for 400 days,
references values and assignments.
Wavenumber of major absorption peaks (cm-1) Reference Spectra Assignment Band
Component Goethite Go250 Go300 Go350 Go350-55-400 Go350-95-400 Goethite a,b Hematite a
460 455 454
538
454
538
454
538
454
538
461 454
536
Fe-O
Fe-O
Low-
frequency
region
618 618 619 619 Fe-O-H
795 797 799 800 γ(O-H) Hydroxyl
deformation
898 898 930 930 929 929 893 884 δ(O-H)
1630 1630
1637
1686
1640
1674
γ'(O-H)
δ'(O-H)
Water
bending
region
3188 3188 3206 3235 ν(O-H) Hydroxyl
stretching
3411 3399 3411 3411 3429 3429 3450 3446 ν(H-O-H) region
aRuan et al. (2001), bRussell and Fraser (1994).
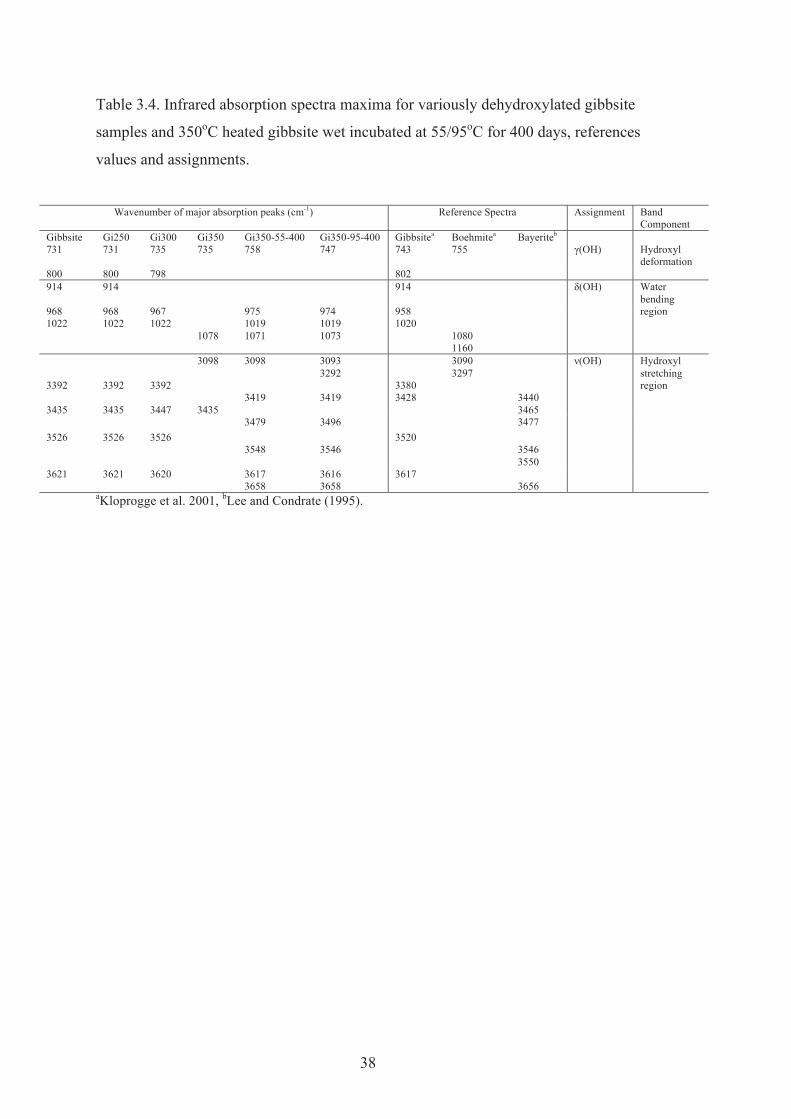
38
Table 3.4. Infrared absorption spectra maxima for variously dehydroxylated gibbsite
samples and 350oC heated gibbsite wet incubated at 55/95oC for 400 days, references
values and assignments.
Wavenumber of major absorption peaks (cm-1) Reference Spectra Assignment Band
Component Gibbsite Gi250 Gi300 Gi350 Gi350-55-400 Gi350-95-400 Gibbsitea Boehmitea Bayeriteb 731 731 735 735 758 747 743 755 γ(OH) Hydroxyl
deformation 800 800 798 802 914 914 914 δ(OH) Water
bending 968 968 967 975 974 958 region 1022 1022 1022
1078 1019 1071
1019 1073
1020 1080 1160
3392 3435
3392 3435
3392 3447
3098 3435
3098 3419
3093 3292 3419
3380 3428
3090 3297
3440 3465
ν(OH) Hydroxyl stretching region
3479 3496 3477 3526 3526 3526
3548 3546
3520 3546 3550
3621 3621 3620 3617 3658
3616 3658
3617 3656
aKloprogge et al. 2001, bLee and Condrate (1995).

39
K500
K550
K600
Go250
450950145019502450295034503950
Wavenumber
Ab
so
rban
ce
Goethite
Goe-250
Goe-250-55-400
Goe-250-95-400
Go300
450950145019502450295034503950
Wavenumber
Ab
so
rban
ce
Goethite
Goe-300
Goe-300-55-400
Goe-300-95-400
Go350
450950145019502450295034503950
Wavenumber
Ab
so
rban
ce
Goethite
Goe-350
Goe-350-55-400
Goe-350-95-400
Gi250
Gi300
Gi350
Figure 3.10. Infrared spectra of original, dehydroxylated and rehydrated kaolinite,
goethite and gibbsite incubated for 400 days at 55 and 95oC.
3.3.5. Electron microscopy
Figure 3.11 shows TEM micrographs for original, dehydroxylated and rehydrated
kaolinite, goethite and gibbsite with particles ranging from <10 to >200 nm.
Metakaolinite obtained from kaolinite heated at 600oC had pseudohexagonal
platelets and remained unchanged after the incubation for 400 days at 95oC. TEM
micrographs of heated goethite indicate that the materials consist of particles with
diverse shapes and sizes with many particles being lathes. Gibbsite heated to 350oC
had a microporous, granular appearance due to rapid loss of structural water forming
voids. After incubation for 14 days at 95oC a complex intergrowth of more finely
divided hexagonal crystals had formed, which is consistent with XRD results that
450950145019502450295034503950
Wavenumber
Ab
so
rban
ce
Kaolinite
K500
K500-55-400
K500-95-400
OH Stretching
Si-O strectching and Si-O-Al combination bands
450950145019502450295034503950
Wavenumber
Ab
so
rban
ce
Kaolinite
K550
K550-55-400
K550-95-400
Si-O strectching and Si-O-Al combination bandsOH Stretching
450950145019502450295034503950
Wavenumber
Ab
sorb
ance
Kaolinite
K600
K600-55-400
K600-95-400
Si-O strectching and Si-O-Al combination bandsOH Stretching
450950145019502450295034503950
Wavenumber
Ab
so
rban
ce
Gib250
Gibbsite
Gib250-55-400
Gib250-95-400
γ(OH) ð(OH)
ν(OH)
Boehmite
450950145019502450295034503950
Wavenumber
Ab
so
rban
ce
Gib300
Gibbsite
Gib300-55-400
Gib300-95-400
ð(OH)
γ(OH) ν(OH)
Boehmite
450950145019502450295034503950
Wavenumber
Ab
so
rban
ce
Gib350
Gibbsite
Gib350-55-400
Gib350-95-400
ν(OH)
ð(OH)
γ(OH)
Boehmite

40
show that a mixture of boehmite, bayerite and gibbsite had replaced the amorphous
alumina.
Figure 3.11. Electron micrographs of original, dehydroxylated and rehydroxylated
kaolinite, goethite and gibbsite incubated for 400 days at 95oC.
240 nm K240 nm240 nm K 240 nm K600oC240 nm240 nm K600oC 240 nm K600-95-400240 nm240 nm K600-95-400
240 nm Go240 nm Go 240 nm Go350240 nm Go350 240 nm Go350-95-400240 nm Go350-95-400
240 nm Gi240 nm Gi 240 nm Gi350240 nm Gi350 240 nm Gi350-95-400240 nm Gi350-95-400

41
3.4. Conclusions
Kaolinite, goethite and gibbsite dehydroxylated to form metakaolinite, hematite and
boehmite and amorphous material respectively. This process may also occur in
natural environments such as in soils heated by bushfires. Dehydroxylation of these
three minerals caused structural changes and slight to moderate increases in both
specific surface area and phosphate adsorption maxima. The greater P adsorption
could be associated with the greater surface reactivity. Dehydroxylated kaolinite and
goethite showed no change in conventional and synchrotron XRD patterns due to
rehydration treatment. However, rehydration of 350oC heated gibbsite was extensive
at 95oC and after 14 days boehmite, bayerite and gibbsite had formed, the process
was slower at 55oC.
Infrared spectra of metakaolinite and hematite subjected to rehydration did not
change but thermal analysis indicated that the structural water content (>105oC)
increased substantially for metakaolinite. We propose that dehydroxylated minerals
such as kaolinite, goethite and gibbsite and their fully or partially rehydrated forms
may be present in naturally heated soils and may exert significant effects on the
chemical behaviour of soils. The effects may include changes in the availability of
phosphate and other nutrients.
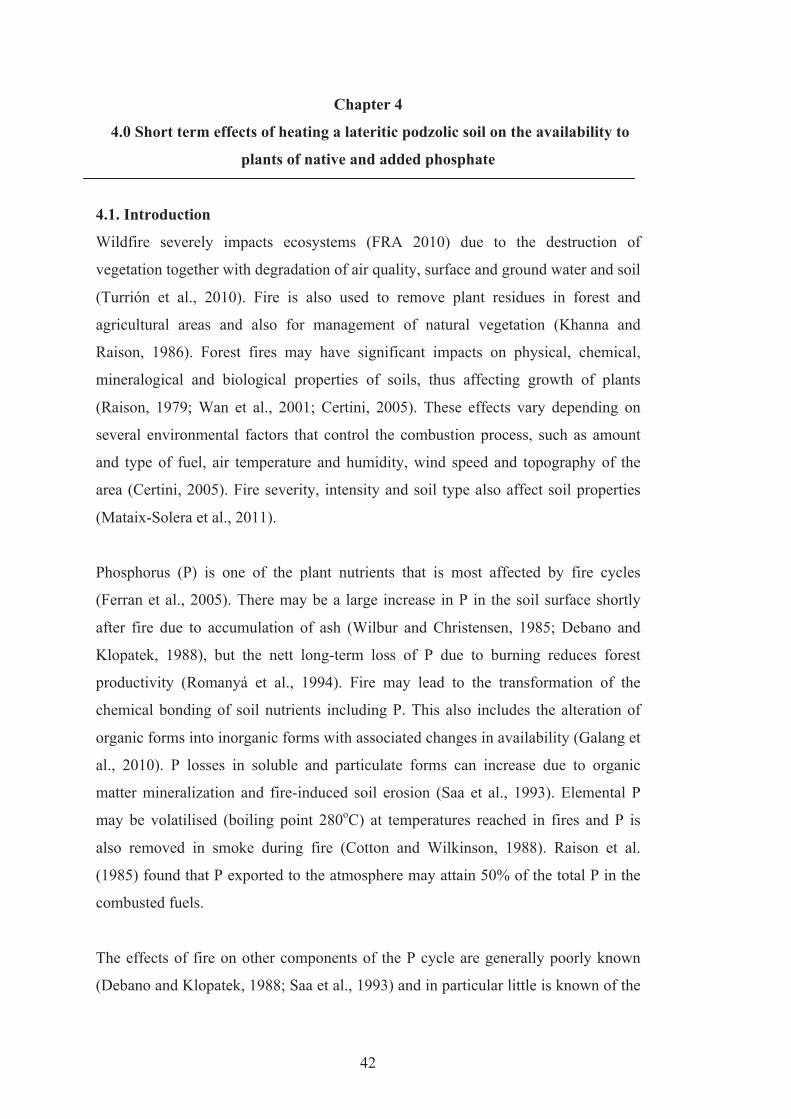
42
Chapter 4
4.0 Short term effects of heating a lateritic podzolic soil on the availability to
plants of native and added phosphate
4.1. Introduction
Wildfire severely impacts ecosystems (FRA 2010) due to the destruction of
vegetation together with degradation of air quality, surface and ground water and soil
(Turrión et al., 2010). Fire is also used to remove plant residues in forest and
agricultural areas and also for management of natural vegetation (Khanna and
Raison, 1986). Forest fires may have significant impacts on physical, chemical,
mineralogical and biological properties of soils, thus affecting growth of plants
(Raison, 1979; Wan et al., 2001; Certini, 2005). These effects vary depending on
several environmental factors that control the combustion process, such as amount
and type of fuel, air temperature and humidity, wind speed and topography of the
area (Certini, 2005). Fire severity, intensity and soil type also affect soil properties
(Mataix-Solera et al., 2011).
Phosphorus (P) is one of the plant nutrients that is most affected by fire cycles
(Ferran et al., 2005). There may be a large increase in P in the soil surface shortly
after fire due to accumulation of ash (Wilbur and Christensen, 1985; Debano and
Klopatek, 1988), but the nett long-term loss of P due to burning reduces forest
productivity (Romanyá et al., 1994). Fire may lead to the transformation of the
chemical bonding of soil nutrients including P. This also includes the alteration of
organic forms into inorganic forms with associated changes in availability (Galang et
al., 2010). P losses in soluble and particulate forms can increase due to organic
matter mineralization and fire-induced soil erosion (Saa et al., 1993). Elemental P
may be volatilised (boiling point 280oC) at temperatures reached in fires and P is
also removed in smoke during fire (Cotton and Wilkinson, 1988). Raison et al.
(1985) found that P exported to the atmosphere may attain 50% of the total P in the
combusted fuels.
The effects of fire on other components of the P cycle are generally poorly known
(Debano and Klopatek, 1988; Saa et al., 1993) and in particular little is known of the

43
effects of heating on the transformation of dominant soil minerals and consequent
effects on P availability to plants.
Fire affects the nature of soil minerals and presumably their interactions with plant
nutrients. Soil temperatures in excess of 500oC can be reached during fires, which
will alter many hydroxylated soil minerals thereby changing their nature and nutrient
retention properties. This process may be of particular importance for
kaolinite/sesquioxide dominated soils as these minerals are particularly sensitive to
dehydroxylation (Ketterings et al., 2000).
Dehydroxylation of kaolinite, gibbsite and goethite by heating produces highly
reactive minerals. Dehydroxylation between 500oC and 700oC will destroy kaolinite
and form metakaolinite (Babuskhin et al., 1985). Gibbsite alters to complex
amorphous and crystalline mineral assemblages on heating at about 200oC (Rooksby,
1972) and goethite transforms to partly ordered hematite at about 300oC (Cornell and
Schwertmann, 1996). The existence and persistence of these reactive dehydroxylated
minerals in heated soils is unknown but they have markedly different properties from
the precursor minerals. They commonly exhibit greatly reduced structural order and
increased surface reactivity while retaining their original particle morphology
(Rooksby, 1972; Babuskhin et al., 1985; Cornell and Schwertmann, 1996). The
interactions of plant nutrients with the reactive minerals present in heated soils
clearly requires investigation and has not been evaluated by other workers. Most
previous work on the effects of fire on soils has focussed on plant nutrients in ash
and not on the presence and roles of heated soil minerals. The objective of this
glasshouse study was to evaluate the effects of heating soil containing kaolinite,
goethite and gibbsite on the availability to plants of native and added phosphate
which is known to be strongly sorbed by these minerals. Wild and managed fires
affect large areas of soil so that knowledge of the effects of heating on plant nutrient
availability is clearly of value.
4.2. Material and methods
4.2.1 Soil and Glasshouse experiment
The top soil (0-10 cm) of the Yalanbee, lateritic podzolic soil which is an Alfisol
(USDA, 2010) was collected from a virgin eucalypt forest site at Bakers Hill, 73 km
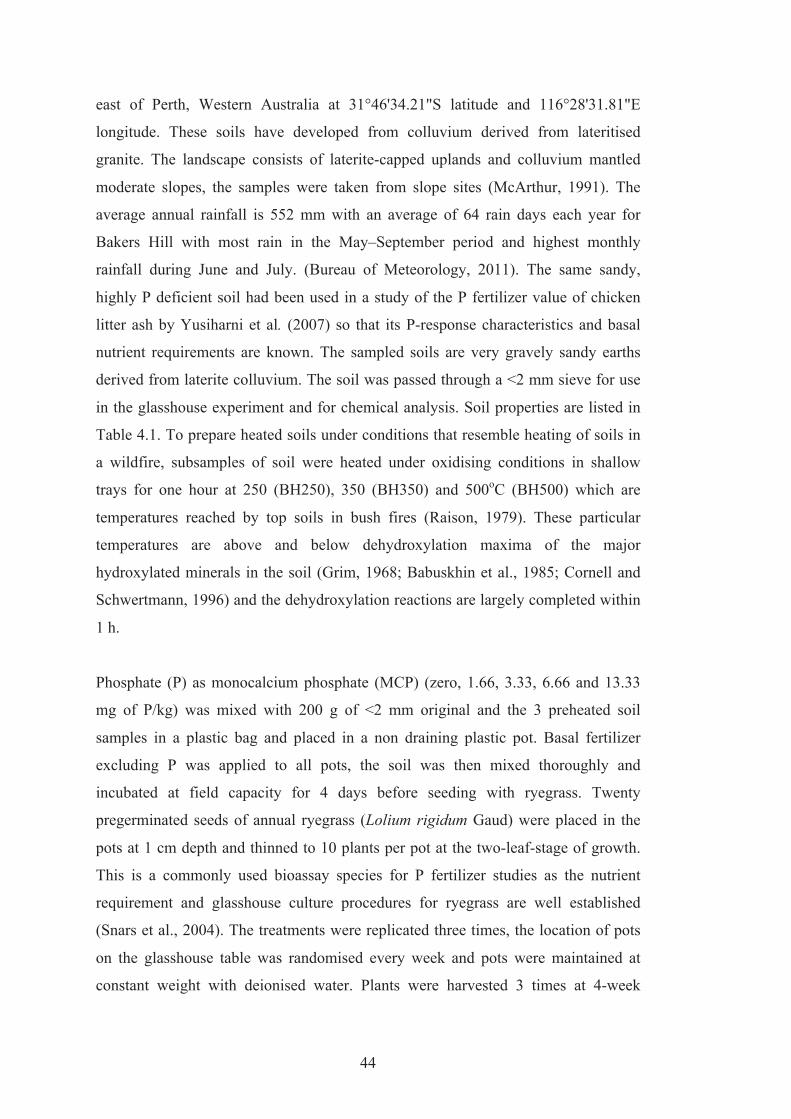
44
east of Perth, Western Australia at 31°46'34.21"S latitude and 116°28'31.81"E
longitude. These soils have developed from colluvium derived from lateritised
granite. The landscape consists of laterite-capped uplands and colluvium mantled
moderate slopes, the samples were taken from slope sites (McArthur, 1991). The
average annual rainfall is 552 mm with an average of 64 rain days each year for
Bakers Hill with most rain in the May–September period and highest monthly
rainfall during June and July. (Bureau of Meteorology, 2011). The same sandy,
highly P deficient soil had been used in a study of the P fertilizer value of chicken
litter ash by Yusiharni et al. (2007) so that its P-response characteristics and basal
nutrient requirements are known. The sampled soils are very gravely sandy earths
derived from laterite colluvium. The soil was passed through a <2 mm sieve for use
in the glasshouse experiment and for chemical analysis. Soil properties are listed in
Table 4.1. To prepare heated soils under conditions that resemble heating of soils in
a wildfire, subsamples of soil were heated under oxidising conditions in shallow
trays for one hour at 250 (BH250), 350 (BH350) and 500oC (BH500) which are
temperatures reached by top soils in bush fires (Raison, 1979). These particular
temperatures are above and below dehydroxylation maxima of the major
hydroxylated minerals in the soil (Grim, 1968; Babuskhin et al., 1985; Cornell and
Schwertmann, 1996) and the dehydroxylation reactions are largely completed within
1 h.
Phosphate (P) as monocalcium phosphate (MCP) (zero, 1.66, 3.33, 6.66 and 13.33
mg of P/kg) was mixed with 200 g of <2 mm original and the 3 preheated soil
samples in a plastic bag and placed in a non draining plastic pot. Basal fertilizer
excluding P was applied to all pots, the soil was then mixed thoroughly and
incubated at field capacity for 4 days before seeding with ryegrass. Twenty
pregerminated seeds of annual ryegrass (Lolium rigidum Gaud) were placed in the
pots at 1 cm depth and thinned to 10 plants per pot at the two-leaf-stage of growth.
This is a commonly used bioassay species for P fertilizer studies as the nutrient
requirement and glasshouse culture procedures for ryegrass are well established
(Snars et al., 2004). The treatments were replicated three times, the location of pots
on the glasshouse table was randomised every week and pots were maintained at
constant weight with deionised water. Plants were harvested 3 times at 4-week
45
intervals by cutting the tops at about 1 cm above the soil surface. Plant material was
dried at 60oC until constant weight occurred then ground and analysed.
a)
b)
5 10 15 20 25 30 35
2θ angle
BH
BH250
BH350
BH500
Figure 4.1. Conventional XRD patterns Cu Kα radiation, with inset for the clay
fraction (a) and synchrotron XRD (SXRD) patterns (b) of original Bakers Hills
(BH) soil and soil heated to 250oC, 350oC and 500oC. Q = quartz, K = kaolinite, Gi =
gibbsite and Go = goethite. The broad background scattering for the SXRD patterns
is due to the glass capillary containing the sample.
5 10 15 20 25 30 35 40 45
2θ Cu Kα
BH
BH250
BH350
BH500 K
Q
Q
Q, Gi, GoQ, K, Go Q Q
Gi Go
F
10 15 20 25
2θ Cu Kα
BH250
BH350
BH500
BHK
Gi Go K
5 10 15 20 25 30 35 40 45
2θ Cu Kα
BH
BH250
BH350
BH500 K
Q
Q
Q, Gi, GoQ, K, Go Q Q
Gi Go
F
10 15 20 25
2θ Cu Kα
BH250
BH350
BH500
BHK
Gi Go K

46
Table 4.1. Properties of original and heated Bakers Hill (BH) soil samples (n= 1).
4.2.2 Soil and plant analysis techniques
XRD analysis of unheated and heated soil samples was carried out using two
techniques. Conventional XRD analysis was conducted with a Philips PW3020
diffractometer and synchrotron XRD (SXRD) analysis was performed at the
Australian Synchrotron. Samples of soil for scanning electron microscopy and
energy dispersive X-ray spectrometry (EDS) using a JEOL 6400 instrument were
placed on metal stubs. Total carbon and nitrogen were determined on an Elementar
CNS (Vario Macro) analyzer.
Soil samples were analysed for pH and electrical conductivity (EC) (1:5 H2O) and
available P (Bic P) using 0.01M sodium bicarbonate extractant at pH 8.5 followed by
colorimetric determination of dissolved P (Colwell, 1963). To determine poorly
ordered minerals in heated soils, extractable forms of (iron) Fe, aluminium (Al) and
Properties Unheated BH Soil
BH 250oC
BH 350oC
BH 500oC
pH (1:5 H2O) 4.63 4.67 5.40 5.45 EC (1:5 H2O) μS/cm 39.9 119.1 91.8 77.1 Total P (mg/kg) 54 45 46 51 Bic P (mg/kg) 1.55 2.17 3.27 1.93 Total N (%) 0.080 0.078 0.072 0.023 Total C (%) 1.64 1.56 0.75 0.015 Total Ca (mg/kg) 471 Total Mg (mg/kg) 437 Total K (mg/kg) 498 Total Na (mg/kg) 53 Total S (mg/kg) 56 Total Fe (mg/kg) 9115 Total Ni (mg/kg) 7 Total Pb (mg/kg) 20 Total Cu (mg/kg) 2 Total Mn (mg/kg) 55 Total Zn (mg/kg) 7 Total Al (mg/kg) 39,840 Total Ba (mg/kg) 40 Clay Percentage (%) 4 Silt Percentage (%) 6 Sand Percentage (%) 90

47
silicon (Si) in the soil were dissolved in dithionite-citrate-bicarbonate (DCB),
ammonium oxalate (Ox) and sodium pyrophosphate (SP) solutions (Rayment and
Higginson 1992) and elements were determined by inductively coupled plasma
optical emission spectroscopy (ICP-OES) (Perkin-Elmer, Norwalk, CT, USA). Soils
were analysed before planting and after the last harvest.
The harvested plant tops were digested in perchloric acid and analysed for P,
calcium (Ca), magnesium (Mg), potassium (K), sodium (Na), sulphur (S) and trace
elements by inductively coupled plasma optical emission spectrometry (ICP-OES)
(Perkin-Elmer, Norwalk, CT, USA) (Rayment and Higginson, 1992).
Replicate (3) plant data were averaged and statistically analysed including fitting of
internal efficiency curves. An analysis of variance followed by Tukey’s Honestly
Significant Differences test were performed to identify the effects of different levels
of P added and heating treatments using SAS (SAS Institute, 1999). Differences for
levels of P added in values of pH, EC and available P after the last harvest were
assessed using one way-ANOVA. All results are presented as significant differences
at p < 0.05.
4.3. Results and discussions
4.3.1 XRD and SEM
Conventional and synchrotron XRD patterns of heated and unheated Yalanbee soil
show the effect of heating on soil mineralogical properties (Fig 4.1). The SXRD
patterns had much better sensitivity and peak to background discrimination than
conventional XRD. Both techniques showed that the main crystalline compounds of
unheated soils are quartz and kaolinite together with minor amounts of gibbsite and
goethite, which were more clearly revealed by conventional XRD of the clay
fraction. After heating at 250oC gibbsite reflections had disappeared (Rooksby,
1972; Kloprogge et al., 2002). Wang et al. (2006) observed similar results and
considered that dehydroxylation caused gibbsite to alter into an amorphous phase
and boehmite. After heating at 350oC, gibbsite and goethite reflections had
substantially disappeared as amorphous alumina (no reflections) and hematite
respectively had formed (Zanelli et al., 2006). Nornberg et al. (2009) found that

48
when soil temperature reaches about 320oC, goethite transforms to hematite as
observed in this work. After heating at 500oC the kaolinite peak intensity was greatly
reduced due to the formation of metakaolinite (Grim, 1968). Quartz was unaltered
for all the heating temperatures as would be anticipated for a high temperature
igneous mineral (Ketterings et al., 2000).
Phyllosilicate and iron oxides minerals are affected by the high temperatures
generated at the soil surface during heating (Sertsu and Sanchez, 1978; Ulery et al.,
1996). Fires altered topsoil in 1 to 2% of the land area studied by Ulery et al. (1996)
and destroyed kaolinite. Ketterings et al. (2000) have reported that mineralogical
analyses of clay fractions from field-burned soil in Indonesia showed that the
amount of kaolinite was significantly reduced, gibbsite was partially decomposed
(<300oC) while goethite was transformed to ultra-fine maghemite as a result of soil
heating. The formation of highly reactive compounds (amorphous alumina, hematite
and metakaolinite) by heating might be expected to increase sorption of P from soil
solution (Kwari and Batey, 1991) and this would reduce the agronomic effectiveness
of both native and added P. Ketterings et al. (2002) described an increase of
maximum P-sorption capacity of the top soil layer (0-5 cm) exposed to fire (450+ oC)
from 2200 mg P kg-1 to 2800 mg P kg-1 but this may not occur for soil types with a
different mineralogy. Furthermore, increased P retention may be a reflection of the
presence of calcite in ash within soil and the precipitation/sorption of P due to calcite
and high pH.
SEM micrographs and EDS spectra of unheated Bakers Hills soil and soil heated at
250, 350 and 500oC show the diverse particle sizes, shapes and compositions present
in this material (Fig. 4.2). Apart from quartz crystals, most grains seen in the
micrographs are kaolin-rich aggregates and consequently consist mostly of
aluminium and silicon, and contain only a little P, Fe and other elements. For
example, the grain shown for BH250 (indicated in Fig. 2) contains much Si and Al
and is probably kaolinite. The Al and Si rich grains remain after heating at 350oC
and 500oC but are now metakaolinite rather than kaolinite. The indicated grain for
BH350 contains P and S in addition to Al and Si, which may indicate a mixture of
kaolinite and plant ash.
49
BH BH250
BH analysed grain
1 3 5 7 9 Energy (keV)
Al Si
K Ti Fe
BH250 analysed grain
1 3 5 7 9 Energy (keV)
Al Si
K Ti Fe
BH350 BH500
BH350 analysed grain
1 3 5 7 9 Energy (keV)
Al
Si
K Fe
P
BH500 analysed grain
1 3 5 7 9 Energy (keV)
Al Si
K Fe Ti
Figure 4.2. Scanning electron micrographs (SEM) and X-ray spectra of the indicated
particles for original Bakers Hills (BH) soil and soil heated to 250oC, 350oC and
500oC.
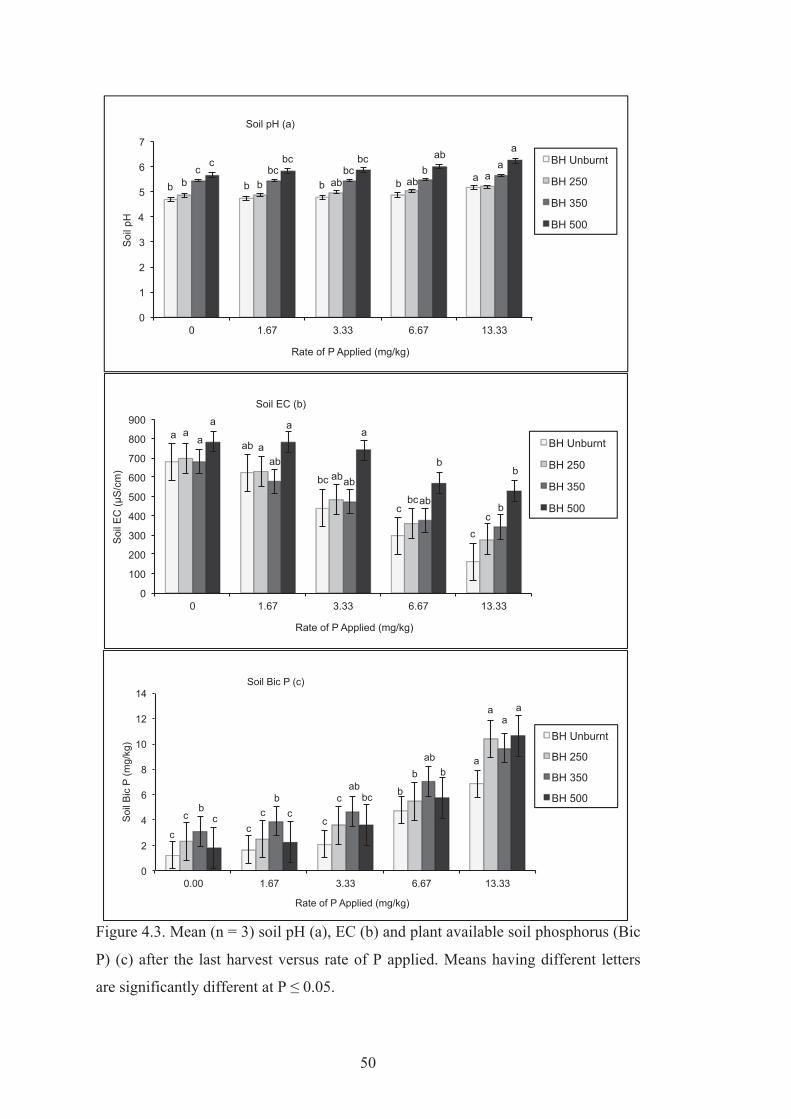
50
0
1
2
3
4
5
6
7
0 1.67 3.33 6.67 13.33
Soi
l pH
Rate of P Applied (mg/kg)
Soil pH (a)
BH Unburnt
BH 250
BH 350
BH 500
b b ab ab a a b bc bc c
a ab bc bc c a b b b b
0
100
200
300
400
500
600
700
800
900
0 1.67 3.33 6.67 13.33
Soil
EC (μ
S/cm
)
Rate of P Applied (mg/kg)
Soil EC (b)
BH Unburnt
BH 250
BH 350
BH 500
a a
ab
bc
c
a
ab
ab
ab b
a a a
b b
a ab
bc
c
c
0
2
4
6
8
10
12
14
0.00 1.67 3.33 6.67 13.33
Soi
l Bic
P (m
g/kg
)
Rate of P Applied (mg/kg)
Soil Bic P (c)
BH Unburnt
BH 250
BH 350
BH 500
a
c c c
b
a
ab
ab b
b
a
b
bc c c
a
b
c c c
Figure 4.3. Mean (n = 3) soil pH (a), EC (b) and plant available soil phosphorus (Bic
P) (c) after the last harvest versus rate of P applied. Means having different letters
are significantly different at P ≤ 0.05.

51
4.3.2 Heating impacts on chemical properties
Other characteristics of the unheated and heated soil used in the study are provided
in Table 4.1. The very low concentrations of plant nutrient elements are evident and
are typical of unfertilised lateritic soils in this region (Robson and Gilkes, 1981).
Total soil carbon and N decreased with the increasing heating temperature due to
combustion of soil organic matter and loss of gaseous oxides of C and N at 250oC
and higher temperatures. These results agree with findings by Terefe et al. (2008)
where little change in total carbon occurred when soil was heated to 100oC but
amounts significantly decreased for soil heated at 200oC, 300oC and eventually all
carbon was lost from soil heated at 500oC. Soil nitrogen decreased simultaneously
with carbon. Gonzàlez-Pérez et al. (2004) stated that C/N ratio in soil after burning
is usually lower than in the original soil.
Table 4.2. p-values for significant difference with level of P added (0, 1.66, 3.33,
6.66, and 13.33 mg P/kg) and heating temperature.
The initial pH of unheated soil was 4.63 and pH increased to 4.67, 5.40 and 5.45 for
BH250, BH350 and BH500 respectively (Table 4.1), which may indicate that
oxidised organic matter released alkali cations (Terefe et al., 2008) and heating also
caused the loss of organic acids (Certini, 2005; Fernandez et al., 1997). Electrical
conductivity (EC) of the heated soil increased substantially for BH250 then
decreased for BH350 and BH500. Combustion of organic compounds in soils and
litter produces soluble salts (e.g. CaCO3, CaSO4, KCl) and at 350oC and 500oC these
may have reacted with soil constituents to produce insoluble compounds (e.g.
calcium silicates) thereby reducing EC (Terefe et al., 2008). Ùbeda et al. (2009) also
observed decreasing EC of soil solution for soil heated above 450oC due to the high
amount of calcite (CaCO3) that formed. Earlier studies also documented the decrease
of EC in soil solution after heating above 400oC to 500oC (Iglesias et al., 1997;
Heating Temperature pH EC Bic-P Unburnt 0.0019 0.0010 0.0001
250 0.0389 0.0012 0.0001 350 0.0001 0.0338 0.0201 500 0.0062 0.0002 0.0002
52
Badía and Martí, 2003). It is unlikely that the quite small changes in pH and EC
observed in the present research would have a major effect on P retention by the
heated soils.
Total P concentration of the various soil samples was almost constant (49± 4.2 mg/g
P) whereas plant available P (Bic P) increased substantially on heating the soil to
350oC and then decreased on heating at 500oC. This increase reflects inter alia the
conversion of organic P to soluble inorganic forms on combustion as indicated in Fig
2. Changes in soil pH and additionally the dehydroxylation and recrystallisation of
minerals may liberate adsorbed P (Ketterings et al., 2002). At 500oC chemical
reactions with soil constituents may cause some P to become unavailable (insoluble).
The impacts of P additions to heated soils on soil pH, EC and Bic-P measured at the
end of the plant growth experiment are shown in Fig. 4.3 and a list of p-values for
associated correlations is shown in Table 4.2. There was no systematic effect of level
of P added on the pH of heated and unheated soil. Soil heated at 250, 350 and 500oC
showed a systematic increase in pH. The values of soil pH with increasing heating
temperature are statistically different p≤0.05 (Table 4.2). This increment in pH was
not affected by P fertilisation. Earlier studies also observed the increase of soil pH
for heated soil (Kutiel and Naveh, 1987; Iglesias et al., 1997). These increases could
be associated with the incorporation of ash into soil from the combustion of soil
organic constituents. According to Ulery et al. (1993) the higher pH values of burned
soil are possibly produced by the formation of oxides, hydroxides and potassium and
sodium carbonates. The EC of unfertilised soil at the end of pot experiment was not
affected by heating (Fig 4.3) in contrast to the substantial differences in EC existing
at the beginning of pot experiment. EC of soil for the highest P level differed
significantly for unheated, 250, 350 and 500oC heated soil (p values of 0.0010,
0.0012, 0.00338, and 0.0002 respectively). The EC values decreased with increasing
rate of P application for all heating temperatures. The decrease is due to increasing
uptake of salts by the progressively larger plants produced by higher P applications
(Fig. 4.5). Yusiharni et al. (2007) also observed a decrease in EC with increasing
MCP application rate and plant weight in a similar glasshouse experiment on the
same soil. Available P after the last harvest increased with level of P applied but did
53
not differ systematically between unheated and heated soils. Most added P was
recovered by the bicarbonate extractant. Ketterings et al. (2002) found that for low
intensity fires, phosphorus is more available because of mineralisation of litter P and
because soil temperatures are generally too low to affect soil minerals. However in
the present work, soil P sorption increased for medium to high fire intensity and this
resulted in P being less available for the growth of plants. The present results do not
show a systematic effect of heating on the availability of soil P as measured by
bicarbonate extraction.
Analyses of the plant tops (Appendix 7,8 and 9) indicate that the concentrations of
plant nutrient elements (Na, Mg, K, Ca, Si, P, S, Cl, Mn, Cu, and Zn) were within
the normal range for ryegrass (Reuter and Robinson 1997) so that it is likely that no
element toxicity or deficiency other than P occurred during the experiment.
4.3.3 Forms of Fe, Al and Si in the heated soils
Crystalline, amorphous and organic compounds of Fe, Al and Si in soil were
measured by selective extraction methods. Dithionite-citrate-bicarbonate (DCB)
extractant removes clay size oxides of Fe and associated Al/Si including crystalline
and poorly crystalline, amorphous and organic forms. Ammonium oxalate (Ox)
dissolves poorly crystalline and organically bound Fe, Al and Si. sodium
pyrophosphate (SP) extracts organically bound Fe, Al and possibly Si (McKeague et
al., 1971).
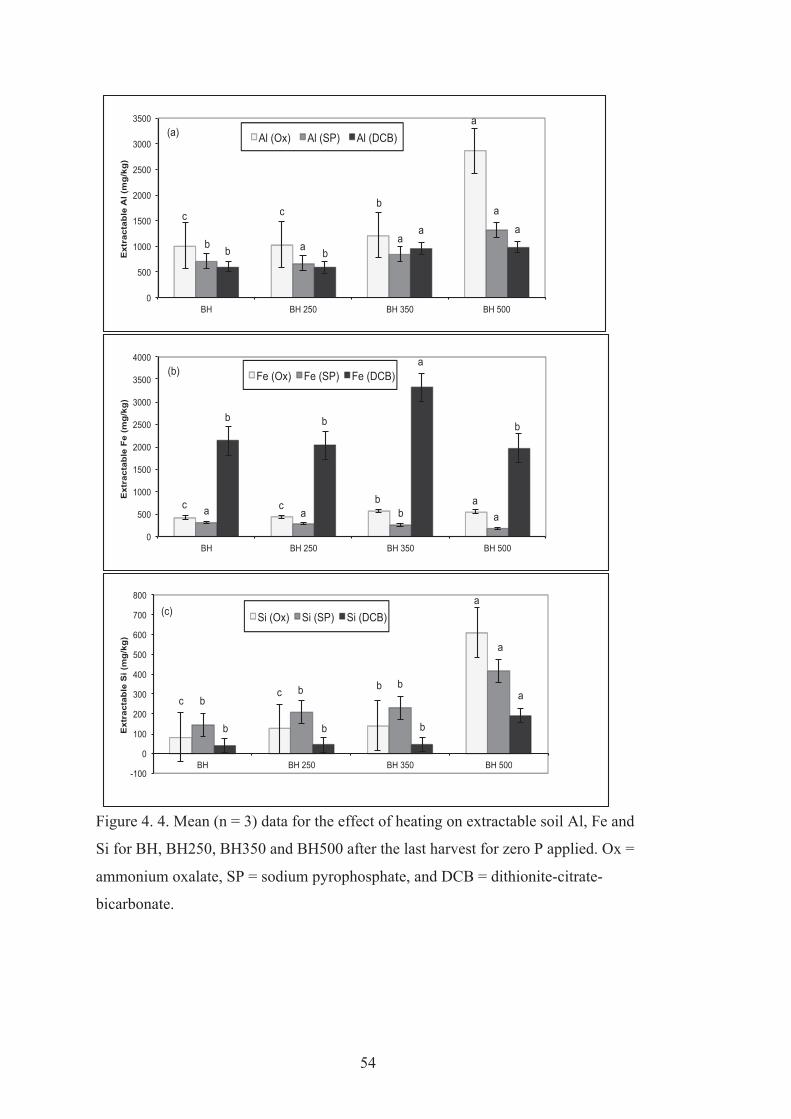
54
0
500
1000
1500
2000
2500
3000
3500
BH BH 250 BH 350 BH 500
Ext
ract
able
Al (
mg/
kg)
Al (Ox) Al (SP) Al (DCB)
a a
b b
b
a
c c a
b a a
(a)
0
500
1000
1500
2000
2500
3000
3500
4000
BH BH 250 BH 350 BH 500
Ext
ract
able
Fe
(mg/
kg)
Fe (Ox) Fe (SP) Fe (DCB)
b b b
a
c c b a a a b a
(b)
-100
0
100
200
300
400
500
600
700
800
BH BH 250 BH 350 BH 500
Ext
ract
able
Si (
mg/
kg)
Si (Ox) Si (SP) Si (DCB)
b b b
a c c b
a
a
b b b
(c)
Figure 4. 4. Mean (n = 3) data for the effect of heating on extractable soil Al, Fe and
Si for BH, BH250, BH350 and BH500 after the last harvest for zero P applied. Ox =
ammonium oxalate, SP = sodium pyrophosphate, and DCB = dithionite-citrate-
bicarbonate.

55
0
100
200
300
400
500
600
0 5 10 15
Yield
(mg/k
g)
Rate of P Applied (mg/kg)
Harvest 1 (a)
BH Unburnt BH 250 BH 350 BH 500
0
100
200
300
400
500
600
0 5 10 15
Yield
(mg/
kg)
Rate of P Applied (mg/kg)
Harvest 2 (b)
BH Unburnt BH 250 BH 350 BH 500
0
100
200
300
400
500
600
0 5 10 15
Yield
(mg/k
g)
Rate of P Applied (mg/kg)
Harvest 3 (c)
BH Unburnt BH 250 BH 350 BH 500
Figure 4.5. Relationships between plant yield and rate of P applied for harvests 1, 2,
and 3 for ryegrass grown on variously heated Bakers Hill soil (n = 3). Representative
standard error values are shown in Fig. 4.5b.

56
The mean values of the three forms of extractable Al, Fe and Si for unheated and
heated soil after the last harvest are shown in Fig 4.4. For each heating temperature,
there was no systematic difference in the amounts of Al, Fe and Si extracted for the
several levels of P added so only data for zero P added are shown in Fig 4.4.
Extractable Al values for the three extractants mostly increased with heating
temperature. Oxalate Al was the most abundant form of Al and may be present in
amorphous aluminium compounds and in particular amorphous alumina and
metakaolinite. Thus heating at 500oC created substantial additional amounts (2.8
g/kg) of oxalate soluble Al that presumably mostly originates in amorphous
metakaolinite and alumina that form at this temperature (Ulery et al., 1996). The
amount of iron extracted with dithionite-citrate-bicarbonate (DCB) is considerably
higher than for the other extractants and this come mostly from crystalline iron
oxides. The small increase in DCB-Fe for BH350 presumably reflects the increased
solubility of disordered hematite created from goethite at this temperature. For all
three extractants relatively little Si dissolved but amounts increased substantially for
soil heated at 500oC, presumably reflecting the greater solubility of Si in
metakaolinite. Quartz, the dominant Si mineral in these soils is not soluble in these
solutions and is not affected by heating at these temperatures (Ketterings et al.,
2000).
4.3.4 Plant dry matter
For all three harvests dry matter yield generally decreased for plants grown on
unfertilised heated soil reflecting changes in the forms of native organic and
inorganic P discussed above. For harvest I, there was a large negative response of
plant dry matter yield to soil heating for each rate of fertiliser P addition (Fig 4.5).
The effectiveness of fertilizer (yield increment/added P) decreased with heating
temperature (i.e response curves diverge with increasing rate of P application). For
the second and third harvests, the decrease in yield due to heating the soil persisted
but there was no systematic change in fertilizer effectiveness for the three lowest
heating temperatures (i.e response curves are approximately coincident). The
response curve for BH500 soil is systematically below those for lower heating
temperatures and has a lower initial slope value for all three harvests. This result
may indicate the major effect of metakaolinite in increasing P-retention as this

57
compound only formed at 500oC. Other workers have suggested that P deficient soils
with a large sorption capacity as a result of heating above 420oC can retain large
quantities of added P (Ketterings et al., 2002), which may be unavailable for the
growth of plants.
4.3.5 Plant analysis
Heating the soil reduced P concentration in plants for the non P fertilized heated
soils indicating that heating soil reduced the availability of native P. The P
concentration in plants increased with increasing rate of P application and heating
soil decreased the P concentration in plants for all three harvests, with the response
curve for BH500 being substantially lowered relative to the other heated soils for all
three harvests (Fig. 4.6). Kwari and Batey (1991) found that heating soil
significantly reduced the P concentration in maize for fertilized soils but there was
no significant difference in plant P concentration for unfertilized soils. The
concentration of P in ryegrass for all the harvests ranged from 0.03% to 0.26%. The
lower concentrations are indicative of P deficiency based on criteria of Reuter and
Robinson (1997), however, the cultivar of ryegrass (Lolium rigidum Gaud) used in
this experiment has a particularly low demand for P and produces substantial plant
growth at nominally deficient concentrations of P (Snars et al., 2004; Yusiharni et
al., 2007).
Plots of internal efficiency of P utilisation by plants (i.e plant dry matter yield v. the
P content of plants) for each harvest (Fig. 4.7) showed a single internal efficiency
curve for all heated soils. This result indicates that for each harvest the differences in
yield were primarily due to differences in the P content of the plants and not to the
supply of other nutrients or differences in other soil conditions (Palmer and Gilkes,
1983). These plant data (Fig. 4.6 and Fig. 4.7) clearly indicate that heating the soil
greatly decreased the amount of plant available P for both unfertilized and fertilized
soil.

58
0.00 0.10 0.20 0.30 0.40 0.50 0.60 0.70 0.80 0.90 1.00
0 5 10 15
P C
once
ntra
tion
(%)
P Applied (mg/kg)
Harvest 1 (a)
BH Unburnt BH 250 BH 350 BH 500
-0.10 0.00 0.10 0.20 0.30 0.40 0.50 0.60 0.70 0.80 0.90 1.00
0 5 10 15
P C
once
ntra
tion
(%)
P Applied (mg/kg)
Harvest 2 (b)
BH Unburnt BH 250 BH 350 BH 500
0.00 0.10 0.20 0.30 0.40 0.50 0.60 0.70 0.80 0.90 1.00
0 5 10 15
P C
once
ntra
tion
(%)
P Applied (mg/kg)
Harvest 3 (c)
BH Unburnt BH 250 BH 350 BH 500
Figure 4.6. Relationships between plant phosphorus concentration and rate of P
applied for harvests 1, 2, and 3 for ryegrass grown on variously heated Bakers Hill
soil (n = 3). Representative standard error values are shown in Fig. 6b.

59
y = 0.078Ln(x) + 0.31 R2 = 0.98
0
0.1
0.2
0.3
0.4
0.5
0.6
0.0 0.2 0.4 0.6 0.8 1.0
Yiel
d (g
/pot
)
Plant P Content (mg/pot)
Harvest 1 (a)
BH Unburnt
BH 250
BH 350
BH 500
y = 0.16Ln(x) + 0.58 R2 = 0.97
0
0.1
0.2
0.3
0.4
0.5
0.6
0.0 0.1 0.2 0.3 0.4 0.5 0.6 0.7 0.8 0.9 1.0
Yiel
d (g
/pot
)
Plant P Content (mg/pot)
Harvest 2 (b)
BH Unburnt
BH 250
BH 350
BH 500
y = 0.12Ln(x) + 0.50 R2 = 0.98
0
0.1
0.2
0.3
0.4
0.5
0.6
0.00 0.20 0.40 0.60 0.80 1.00
Yiel
d (g
/pot
)
Plant P Content (mg/pot)
Harvest 3 (c)
BH Unburnt
BH 250
BH 350
BH 500
Figure 4.7. Internal efficiency curves (yield versus plant P content) for three harvests
of ryegrass grown on variously heated Bakers Hill soil (n = 3).

60
4.4. Conclusions
Heating the soil increased Bic-P and had little effect on the retention of added P as
indicated by bicarbonate extraction. However heating soil decreased the agronomic
effectiveness of both native and applied P with smaller reductions occurring for
lower heating temperatures. We ascribe this change to the presence of reactive
dehydroxylated minerals in the heated soils that adsorb P. Heating at 500oC greatly
increased reactive Si and Al due to the formation of reactive metakaolinite and
amorphous alumina, which are highly reactive compounds and are presumably
responsible for the reduced effectiveness of the added P fertilizers.
This research has indicated that soil heating during a bushfire may have significant
impacts on soil mineralogical and chemical properties. The availability to plants of
native and added P may be substantially affected. These effects of fire on soil
characteristics will vary with the duration and intensity of fire, fuel and soil type and
these topics deserve further investigation. The lateritic podzolic soil used in this
research has a fine fraction dominated by three readily dehydroxylated minerals
(kaolinite, gibbsite and goethite) and consequently is particularly sensitive to
heating. Phosphate sorption by soils that are predominantly composed of more
thermally stable minerals (e.g quartz, illite , hematite) is unlikely to be so strongly
affected by heating. Similarly for soils where much P resides in organic matter and
litter, the impact of fire on P availability may be more strongly affected by the forms
of P in ash than the transformations of minerals.

61
Chapter 5
5.0 Changes in the mineralogy and chemistry of a lateritic soil due to a bushfire
at Wundowie, Darling Range, Western Australia
5.1. Introduction
Australia has a history of severe bush fires. Fire was used as a powerful land-use tool
by indigenous Australians to manage grasslands, forest and fauna (Gill and Moore,
1990) and this practice persists under contemporary management regimes. The
nature of the Australian environment, which is generally hot, dry and prone to
drought and with a dominance of volatile natural vegetation, makes Australian
landscapes particularly vulnerable to wildfires.
Heating of soil by burning plant materials during bushfires may have significant
impacts on soil properties and consequently the growth of plants (Raison, 1979; Wan
et al., 2001). The effects of burning on soil vary with the duration and intensity of
fire and soil type. The amount of fuel present at the time of fire affects the
temperature reached by heated soil, which influences the degree of alteration of soil
properties (Raison, 1979). Durán et al. (2008) found that P availability to plants
declined after fire although it tended to recover over time. Some studies have
reported an increase in soil fertility and nutrient concentrations in plants grown
shortly after a single fire (Christensen, 1994). Ferran et al. (2005) observed an
increase in total P in the topsoil (0-5 cm) after a wildfire and the available P in
surface horizons can rise immediately after fire (Debano and Klopatek, 1988). These
effects are at least partly due to the accelerated recycling of nutrients present in the
ash of combusted plant materials and soil organic matter (Shakesby and Doerr, 2006)
but the contribution of heated soil minerals is not known.
Some soil minerals are affected by heating in natural and managed fires.
Temperatures during forest fire typically ranging from 100 to 300oC and may be in
excess of 1500oC (Neary et al., 1999). Higher temperatures occur during high
intensity forest fire, especially under concentrated fuel sources such as logs, slash
piles or in a tree stump and these temperatures could decompose soil minerals (Ulery
et al., 1996). Heating of soil by both modest (250-500oC) fires and extreme fires
(>500oC) will cause some hydroxylated soil minerals to dehydroxylate (Ketterings et

62
al., 2000). Laboratory studies have shown that kaolinite decomposes at temperatures
between 450oC and 700oC losing lattice hydroxyl and forming metakaolinite
(Babuskhin et al., 1985; Frost, 2003). Ulery et al. (1996) found that kaolinite in a
topsoil was destroyed by fire. Gibbsite commonly alters to a mixture of an
amorphous phase and boehmite on heating at about 200oC (Wang et al., 2006) and
goethite is transformed to a disordered mineral known as hydro-hematite at about
300oC (Watari et al., 1979). Eggleton and Taylor (2008) studied the impact of fire on
the Weipa Bauxite, northern Australia and they found that gibbsite dehydrated to
boehmite or alumina and Fe-oxyhydroxides were converted to maghemite. Several
other studies also reported that soil heating may also alter goethite into maghemite
(Ketterings et al., 2000; Terefe et al., 2008; Nørnberg et al., 2009). The possibility
that these various dehydroxylated minerals may form and persist in soils heated in
bushfires in Southwest Australia is the subject of this investigation.
5.2. Material and Methods
5.2.1 Soil samples burnt in forest fires
Samples were obtained from soils that had been heated under burnt logs at
Wundowie in the Eastern Darling Range, Western Australia. Samples were removed
as a 1cm thick layer from under burnt eucalyptus (Eucalyptus marginata) and grass
tree (Xanthorrhoea pressii) logs from replicate sites on a soil formed from lateritic
colluvium (Fig. 5.1a). The soil is known locally as the Yalanbee gravel and is
classified as a lateritic podzolic soil, which is an Alfisol (USDA, 2010). Sampling
took place shortly after the fire in early March 2009 (Fig. 5.1b). Samples were taken
from a 1 cm deep and 10 cm wide strip below a burnt log and from strips 10-20 cm
and 20-30 cm away from the log (Table 5.1). Soil samples were also taken from 10-
20 cm depth to represent unheated soil. The soils are very gravelly and were sieved
to obtain the <2 mm fraction. Ash and charcoal derived from the burnt eucalyptus
and grass tree trunks were also collected. Eckmeier et al. (2010) defined
macrocharcoals as carbonized wood fragments that are visible by naked eye with >2
mm in diameter. To remove macroscopic charcoal prior to analysis of the ash, it was
sieved through <2 mm mesh. A flow chart of analysis performed during the study is
given in Fig.5.2.

63
a)
b)
Figure 5.1. View of the study site one day after the Wundowie bushfire showing
scorched eucalyptus and grass trees (a) and the position of a burnt eucalyptus log
showing ash and charcoal (b).

64
Table 5.1. The nomenclature for the samples of heated soil from under burnt
eucalyptus (Eucalyptus marginata) and grass tree (Xanthorrhoea preissii) logs at the
Wundowie bush fire site.
Figure 5.2. Flow chart of analyses performed during the study.
Key Explanation GT 0-10 cm Heated 0-1cm soil, 0-10cm from burnt grass tree log GT 10-20 cm Heated 0-1cm soil, 10-20cm from burnt grass tree log GT 20-30 cm Heated 0-1cm soil, 20-30cm from burnt grass tree log EU Unburnt Unburnt soil 0-10cm depth EU 0-10 cm Heated 0-1cm soil, 0-10cm from burnt eucalyptus log EU 10-20 cm Heated 0-1cm soil, 10-20cm from burnt eucalyptus log EU 20-30 cm Heated 0-1cm soil, 20-30cm from burnt eucalyptus log
Samples collected from field Under burnt logs
Soil <2 mm
Gravel >2 mm
Charcoal >2 mm
Ash <2 mm
Chemical Analysis: pH EC Bic P and K C and N Extractable Fe, Al and Si
Mineralogy Analysis: XRD and SXRD
SEM Analysis
Grind

65
5.2.2 Analytical techniques
The soil samples were analyzed for bicarbonate extractable P (Bic P) (Colwell 1963)
and for pH and electrical conductivity (EC) in a 1:5 deionised water extract using
methods from Rayment and Higginson (1992). The amounts of carbon and nitrogen
were determined on an Elementar CNS (Vario Macro) analyzer.
Whole soil samples, the fine earth fraction (<2 mm) and ground gravels were
analyzed as random powders by Conventional XRD and Synchrotron XRD (SXRD).
Conventional XRD was conducted on a Philips PW3020 diffractometer with a
diffracted beam monochromator (CuKα, 50kV, 20mA). Powder samples were
scanned from 4 to 70o 2θ, using a step size of 0.02o 2θ and a scan speed of 0.04o 2θ
sec-1. SXRD analysis was performed at the Australian Synchrotron where powder
samples were mounted into glass capillaries with a 1.0Å wavelength set for this
analysis in order to provide a high peak/background and adequate resolution for
identifying minor constituents.
Major and minor elements were analyzed using a PE ELAN 600 inductively coupled
plasma with optical emission spectroscopy (ICP-OES) instrument (Perkin-Elmer,
Norwalk, CT, USA) after concentrated perchloric acid (HClO4) digestion. 0.2 g
samples were pretreated drop wise with concentrated nitric acid until the reaction
became less vigorous because of the high amounts of carbonate that were present in
some samples.
Extractable forms of iron (Fe), aluminum (Al) and silica (Si) in <2 mm fraction of
the soils and ground gravels were dissolved in solutions of dithionite-citrate-
bicarbonate (DCB) (Mehra and Jackson 1960), ammonium oxalate and sodium
pyrophosphate (Rayment and Higginson 1992) and concentrations were determined
by inductively coupled plasma optical emission spectroscopy (ICP-OES) (Perkin-
Elmer, Norwalk, CT, USA). For DCB extraction, one gram of sample was placed
into a 50 mL centrifuge tube to which 45 mL of solution (0.3M Na-citrate + 0.1 M
Na bicarbonate) was added. The centrifuge tube then placed in a water bath at 70oC
and one gram of sodium-dithionite was added. The mixture was then stirred
constantly for one minute and occasionally during the next 15 minutes. The tubes
were then centrifuged at 2000 rpm for 15 minutes. The extraction was repeated twice
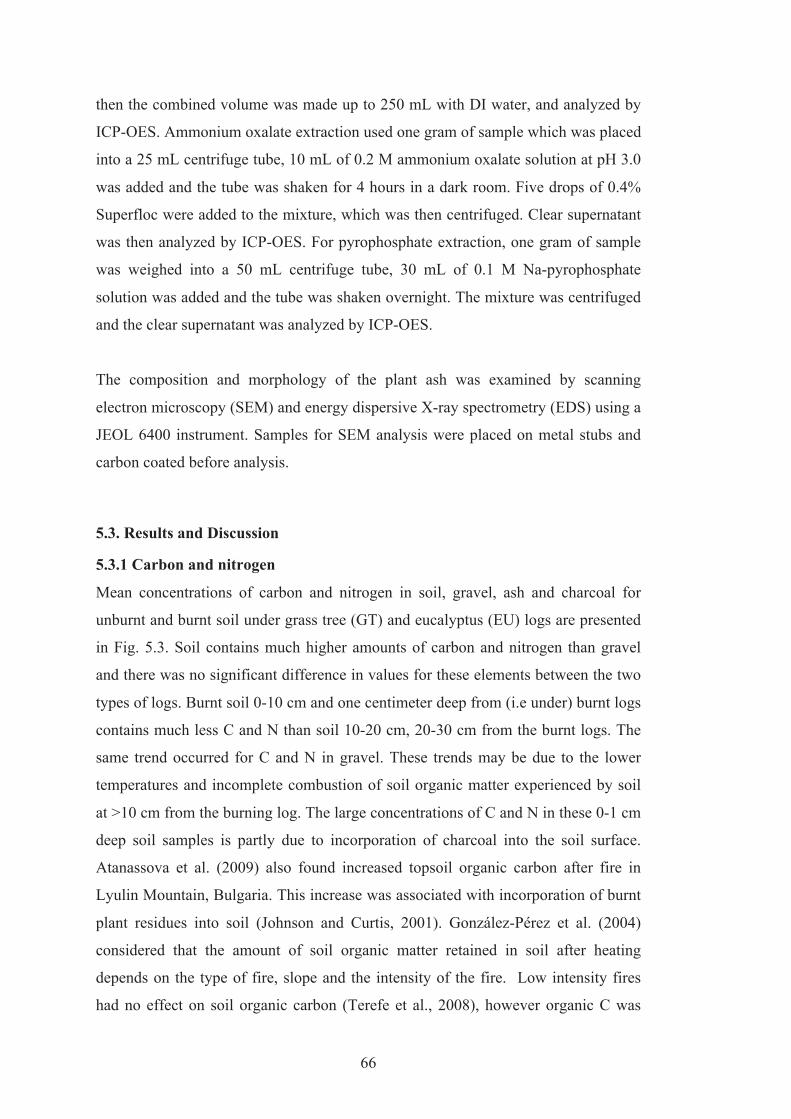
66
then the combined volume was made up to 250 mL with DI water, and analyzed by
ICP-OES. Ammonium oxalate extraction used one gram of sample which was placed
into a 25 mL centrifuge tube, 10 mL of 0.2 M ammonium oxalate solution at pH 3.0
was added and the tube was shaken for 4 hours in a dark room. Five drops of 0.4%
Superfloc were added to the mixture, which was then centrifuged. Clear supernatant
was then analyzed by ICP-OES. For pyrophosphate extraction, one gram of sample
was weighed into a 50 mL centrifuge tube, 30 mL of 0.1 M Na-pyrophosphate
solution was added and the tube was shaken overnight. The mixture was centrifuged
and the clear supernatant was analyzed by ICP-OES.
The composition and morphology of the plant ash was examined by scanning
electron microscopy (SEM) and energy dispersive X-ray spectrometry (EDS) using a
JEOL 6400 instrument. Samples for SEM analysis were placed on metal stubs and
carbon coated before analysis.
5.3. Results and Discussion
5.3.1 Carbon and nitrogen
Mean concentrations of carbon and nitrogen in soil, gravel, ash and charcoal for
unburnt and burnt soil under grass tree (GT) and eucalyptus (EU) logs are presented
in Fig. 5.3. Soil contains much higher amounts of carbon and nitrogen than gravel
and there was no significant difference in values for these elements between the two
types of logs. Burnt soil 0-10 cm and one centimeter deep from (i.e under) burnt logs
contains much less C and N than soil 10-20 cm, 20-30 cm from the burnt logs. The
same trend occurred for C and N in gravel. These trends may be due to the lower
temperatures and incomplete combustion of soil organic matter experienced by soil
at >10 cm from the burning log. The large concentrations of C and N in these 0-1 cm
deep soil samples is partly due to incorporation of charcoal into the soil surface.
Atanassova et al. (2009) also found increased topsoil organic carbon after fire in
Lyulin Mountain, Bulgaria. This increase was associated with incorporation of burnt
plant residues into soil (Johnson and Curtis, 2001). González-Pérez et al. (2004)
considered that the amount of soil organic matter retained in soil after heating
depends on the type of fire, slope and the intensity of the fire. Low intensity fires
had no effect on soil organic carbon (Terefe et al., 2008), however organic C was
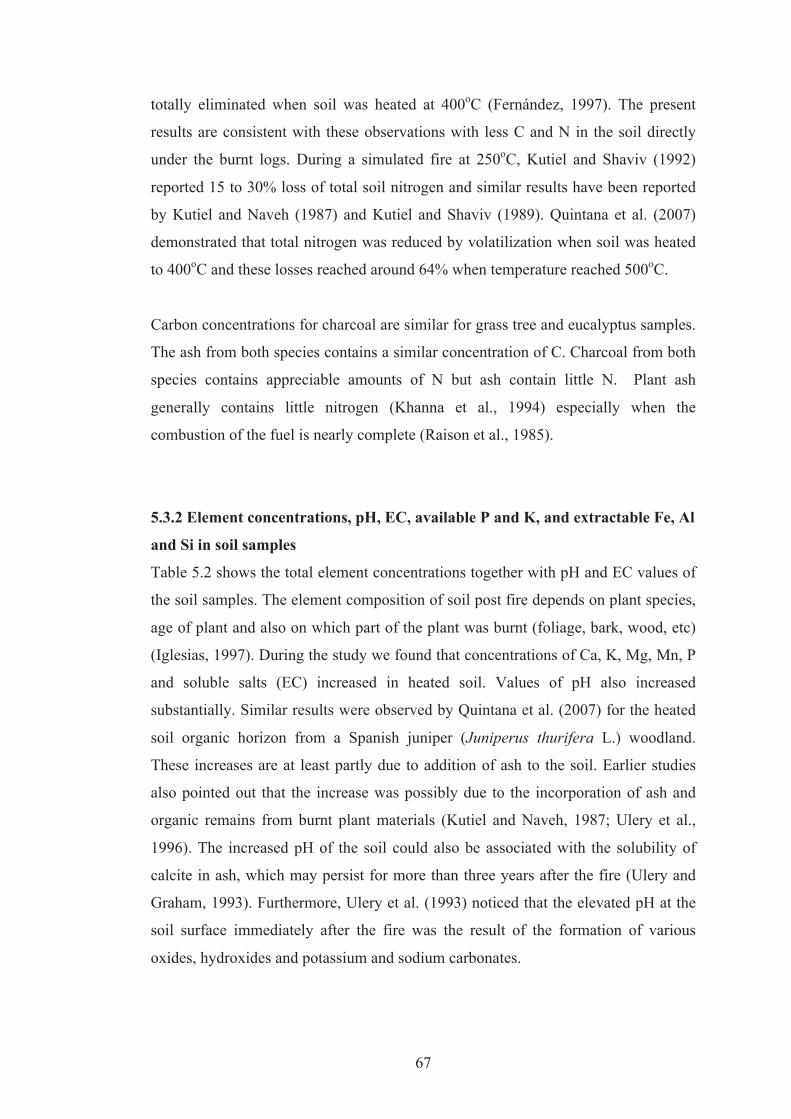
67
totally eliminated when soil was heated at 400oC (Fernández, 1997). The present
results are consistent with these observations with less C and N in the soil directly
under the burnt logs. During a simulated fire at 250oC, Kutiel and Shaviv (1992)
reported 15 to 30% loss of total soil nitrogen and similar results have been reported
by Kutiel and Naveh (1987) and Kutiel and Shaviv (1989). Quintana et al. (2007)
demonstrated that total nitrogen was reduced by volatilization when soil was heated
to 400oC and these losses reached around 64% when temperature reached 500oC.
Carbon concentrations for charcoal are similar for grass tree and eucalyptus samples.
The ash from both species contains a similar concentration of C. Charcoal from both
species contains appreciable amounts of N but ash contain little N. Plant ash
generally contains little nitrogen (Khanna et al., 1994) especially when the
combustion of the fuel is nearly complete (Raison et al., 1985).
5.3.2 Element concentrations, pH, EC, available P and K, and extractable Fe, Al
and Si in soil samples
Table 5.2 shows the total element concentrations together with pH and EC values of
the soil samples. The element composition of soil post fire depends on plant species,
age of plant and also on which part of the plant was burnt (foliage, bark, wood, etc)
(Iglesias, 1997). During the study we found that concentrations of Ca, K, Mg, Mn, P
and soluble salts (EC) increased in heated soil. Values of pH also increased
substantially. Similar results were observed by Quintana et al. (2007) for the heated
soil organic horizon from a Spanish juniper (Juniperus thurifera L.) woodland.
These increases are at least partly due to addition of ash to the soil. Earlier studies
also pointed out that the increase was possibly due to the incorporation of ash and
organic remains from burnt plant materials (Kutiel and Naveh, 1987; Ulery et al.,
1996). The increased pH of the soil could also be associated with the solubility of
calcite in ash, which may persist for more than three years after the fire (Ulery and
Graham, 1993). Furthermore, Ulery et al. (1993) noticed that the elevated pH at the
soil surface immediately after the fire was the result of the formation of various
oxides, hydroxides and potassium and sodium carbonates.
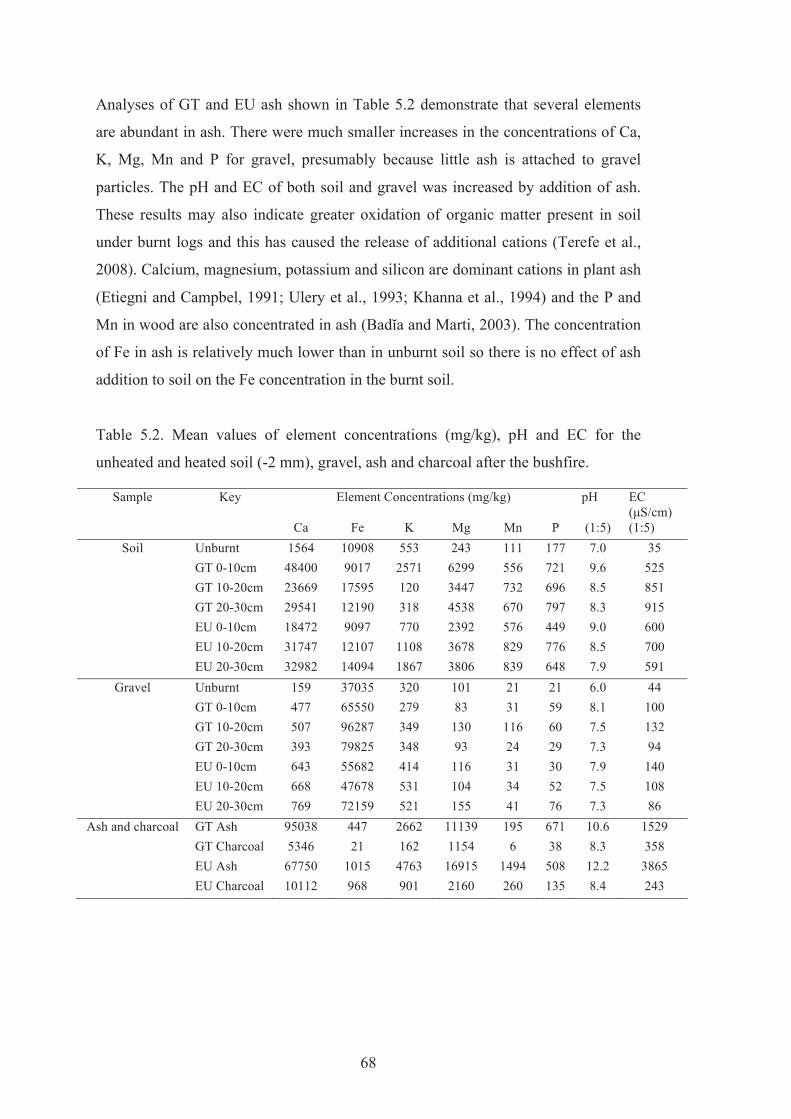
68
Analyses of GT and EU ash shown in Table 5.2 demonstrate that several elements
are abundant in ash. There were much smaller increases in the concentrations of Ca,
K, Mg, Mn and P for gravel, presumably because little ash is attached to gravel
particles. The pH and EC of both soil and gravel was increased by addition of ash.
These results may also indicate greater oxidation of organic matter present in soil
under burnt logs and this has caused the release of additional cations (Terefe et al.,
2008). Calcium, magnesium, potassium and silicon are dominant cations in plant ash
(Etiegni and Campbel, 1991; Ulery et al., 1993; Khanna et al., 1994) and the P and
Mn in wood are also concentrated in ash (Badĭa and Marti, 2003). The concentration
of Fe in ash is relatively much lower than in unburnt soil so there is no effect of ash
addition to soil on the Fe concentration in the burnt soil.
Table 5.2. Mean values of element concentrations (mg/kg), pH and EC for the
unheated and heated soil (-2 mm), gravel, ash and charcoal after the bushfire.
Sample Key Element Concentrations (mg/kg) pH EC (μS/cm)
Ca Fe K Mg Mn P (1:5) (1:5) Soil Unburnt 1564 10908 553 243 111 177 7.0 35
GT 0-10cm 48400 9017 2571 6299 556 721 9.6 525 GT 10-20cm 23669 17595 120 3447 732 696 8.5 851 GT 20-30cm 29541 12190 318 4538 670 797 8.3 915 EU 0-10cm 18472 9097 770 2392 576 449 9.0 600 EU 10-20cm 31747 12107 1108 3678 829 776 8.5 700 EU 20-30cm 32982 14094 1867 3806 839 648 7.9 591
Gravel Unburnt 159 37035 320 101 21 21 6.0 44 GT 0-10cm 477 65550 279 83 31 59 8.1 100 GT 10-20cm 507 96287 349 130 116 60 7.5 132 GT 20-30cm 393 79825 348 93 24 29 7.3 94 EU 0-10cm 643 55682 414 116 31 30 7.9 140 EU 10-20cm 668 47678 531 104 34 52 7.5 108 EU 20-30cm 769 72159 521 155 41 76 7.3 86
Ash and charcoal GT Ash 95038 447 2662 11139 195 671 10.6 1529 GT Charcoal 5346 21 162 1154 6 38 8.3 358 EU Ash 67750 1015 4763 16915 1494 508 12.2 3865 EU Charcoal 10112 968 901 2160 260 135 8.4 243
69
a)
0
5
10
15
20
25
0-10cm 10-20cm 20-30cm
C %
C Soil, GT C Soil, Eu
b)
0
2
0-10cm 10-20cm 20-30cm
C %
C Gravel, GT C Gravel, Eu
c)
0
1
0-10cm 10-20cm 20-30cm
N %
N Soil, GT N Soil, Eu
d)
0.0
0.1
0-10cm 10-20cm 20-30cm
N %
N Gravel, GT N Gravel, Eu
e)
0
20
40
60
80
100
120
GT Ash GT Charcoal EU Ash EU Charcoal
C %
f)
0
1
GT Ash GT Charcoal EU Ash EU Charcoal
N %
Figure 5.3. Mean values of carbon and nitrogen concentrations (%) for 0-1cm soil,
gravel, ash and charcoal under and adjacent to burnt grass tree (GT) and eucalyptus
(EU) logs.

70
a)
0
5
10
15
20
25
30
Unburnt GT 0-10cm GT 10-20cm GT 20-30cm EU 0-10cm EU 10-20cm EU 20-30cm
mg
/kg
Soil Available P and K (mg/kg)
Bic P
Bic K
b)
0
2
4
6
8
10
12
Unburnt GT 0-10cm GT 10-20cm GT 20-30cm EU 0-10cm EU 10-20cm EU 20-30cm
mg
/kg
Gravel Available P and K (mg/kg)
Bic P
Bic K
Figure 5.4. Mean values of bicarbonate soluble P and K for soil (a) and gravel (b)
under and adjacent to burnt grass tree (GT) and eucalyptus (EU) logs.
The concentrations of available (bicarbonate soluble) P and K in soil and gravel after
the bushfire are shown in Fig. 5.4. Available P and K were increased substantially by
burning (Giardina et al., 2000) for both soil and gravel. These increases are a result
of the combustion of organic P in the soil (Galang et al., 2010) and especially the
addition of substantial amount of P and K to the soil in ash (Kutiel and Shaviv,

71
1989), with a possible contribution from the transformation of soil minerals (Table
5.2).
The amounts of Fe, Al and Si in soils removed by the three extractants (Table 5.3)
are commonly taken to indicate particular forms of these elements in soil (Zanelli et
al., 2007). Sodium pyrophosphate (p) is assumed to extract organically bound
elements and also hydroxyl-like Al in the interlayers of clay minerals (Kleber et al.,
2004). Heated soil contained more Al-p than unburnt soil. Amounts of Fe-p and Si-p
showed no systematic effect of heating the soil. There were no systematic
differences due to heating on levels of Al, Fe, and Si-p in gravels. The considerable
amounts of Al-p and Si-p in GT and EU ash may be from heated kaolinite
incorporated into the ash and are also possibly due to oxidation of organic-mineral
complexes during combustion.
Sodium oxalate (o) is assumed to dissolve poorly ordered and amorphous minerals in
soils. Amount of Al-o and Si-o were greatly increased for heated soil relative to
unburnt soil with some increase in Fe-o. These changes probably reflect the
dissolution of poorly ordered and amorphous compounds formed by dehydroxylation
of kaolinite (an aluminosilicate), gibbsite (aluminum hydroxide) and goethite (iron
oxyhydroxide). There were no comparable trends for Al-o, Fe-o, Si-o in gravel and
the substantial value of Al-o and Si-o for ash may be due to heated soil minerals
being incorporated into the ash during collection. Plants generally contain little Al so
that the high Al-o values for ash are indicative of contamination with heated
kaolinite and gibbsite from the soil.
The DCB (d) extractant dissolves free iron oxides and some proportions of free
aluminum oxides and Si minerals depending on their composition and crystal size
(McKeague et al., 1971). DCB extractant dissolves several forms of organic and
inorganic Al and Fe, some Al in hydroxy interlayers and allophane (Wada, 1977;
Eckmeier et al., 2010). Heating increased both Al-d and Si-d but there was no
systematic effect of heating on Fe-d. There was no systematic effect of heating on
Al-d, Fe-d and Si-d in gravel.

72
Eckmeier et al. (2010) investigated the amount of Al and Fe extracted with
dithionite, pyrophosphate and oxalate extractants for heated black soils in the
Southern Switzerland. They found that the high amount of charred organic matter
was presumably responsible for the darker soil color and is closely related to Fe-p
and Al-p concentrations.
Table 5.3. Mean values of extractable Al, Fe and Si for soil, gravel, ash and charcoal
under and adjacent to burnt grass tree (GT) and eucalyptus (EU) logs. SP = sodium
pyrophosphate extractant, Oxalate = sodium oxalate extractant and DCB =
dithionite-citrate-bicarbonate extractant.
Sample Key SP Oxalate DCB
Al Fe Si Al Fe Si Al Fe Si mg/kg mg/kg mg/kg mg/kg mg/kg mg/kg mg/kg mg/kg mg/kg
Soil Unburnt 2498 792 378 4711 1380 773 4007 10908 413
GT 0-10cm 6494 477 420 12274 3265 3806 11329 9017 1517
GT 10-20cm 6604 1275 406 10103 3074 1945 10479 17595 1123
GT 20-30cm 5043 938 414 7456 2293 1737 6492 12190 858
EU 0-10cm 4055 743 327 10516 3680 3538 5393 9097 861
EU 10-20cm 3109 721 354 6034 2218 1741 5347 12107 966
EU 20-30cm 2804 676 398 4531 1801 1172 5121 14094 835
Gravel Unburnt 2764 480 337 7401 4598 3763 8029 5704 1455
GT 0-10cm 2898 894 344 9940 6756 3119 7910 6555 1713
GT 10-20cm 2596 409 370 7979 4809 2378 9636 9629 1687
GT 20-30cm 3245 442 385 8706 4988 2446 9167 7982 1552
EU 0-10cm 2570 929 347 7979 5039 2029 7083 5568 1106
EU 10-20cm 1984 405 234 5111 5836 1281 6157 4768 836
EU 20-30cm 3423 534 294 6386 6647 2937 6134 7216 707
Ash and charcoal GT Ash 919 8 809 1221 341 1199 545 447 433
GT Charcoal 34 20 79 51 28 39 25 21 29
EU Ash 1981 8 2036 3190 775 2603 1011 1015 703
EU Charcoal 368 85 168 407 161 118 370 968 140
5.3.3. Mineralogical and morphological effects of bushfire heating on soil
minerals
There have been numerous laboratory studies of the dehydroxylation mechanisms of
kaolinite, goethite and gibbsite (De Faria and Lopes, 2007; Landers and Gilkes,
2007; Yusiharni and Gilkes, 2011). These are the major hydroxylated minerals in the
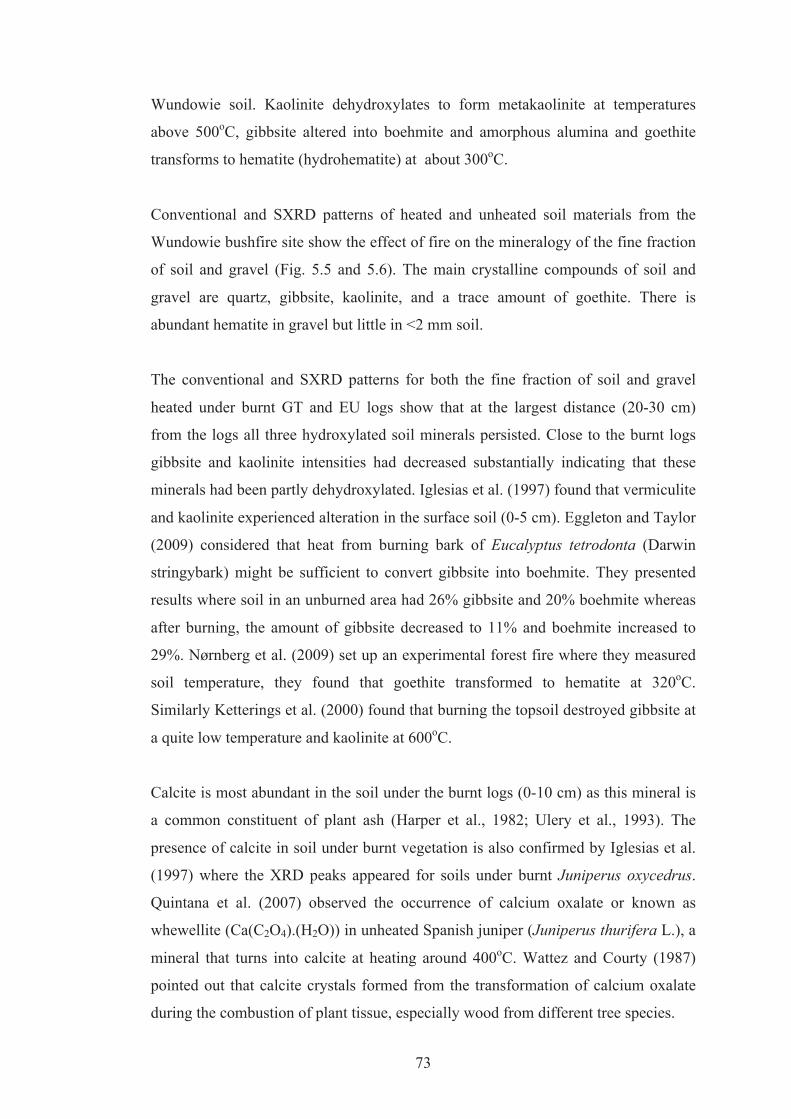
73
Wundowie soil. Kaolinite dehydroxylates to form metakaolinite at temperatures
above 500oC, gibbsite altered into boehmite and amorphous alumina and goethite
transforms to hematite (hydrohematite) at about 300oC.
Conventional and SXRD patterns of heated and unheated soil materials from the
Wundowie bushfire site show the effect of fire on the mineralogy of the fine fraction
of soil and gravel (Fig. 5.5 and 5.6). The main crystalline compounds of soil and
gravel are quartz, gibbsite, kaolinite, and a trace amount of goethite. There is
abundant hematite in gravel but little in <2 mm soil.
The conventional and SXRD patterns for both the fine fraction of soil and gravel
heated under burnt GT and EU logs show that at the largest distance (20-30 cm)
from the logs all three hydroxylated soil minerals persisted. Close to the burnt logs
gibbsite and kaolinite intensities had decreased substantially indicating that these
minerals had been partly dehydroxylated. Iglesias et al. (1997) found that vermiculite
and kaolinite experienced alteration in the surface soil (0-5 cm). Eggleton and Taylor
(2009) considered that heat from burning bark of Eucalyptus tetrodonta (Darwin
stringybark) might be sufficient to convert gibbsite into boehmite. They presented
results where soil in an unburned area had 26% gibbsite and 20% boehmite whereas
after burning, the amount of gibbsite decreased to 11% and boehmite increased to
29%. Nørnberg et al. (2009) set up an experimental forest fire where they measured
soil temperature, they found that goethite transformed to hematite at 320oC.
Similarly Ketterings et al. (2000) found that burning the topsoil destroyed gibbsite at
a quite low temperature and kaolinite at 600oC.
Calcite is most abundant in the soil under the burnt logs (0-10 cm) as this mineral is
a common constituent of plant ash (Harper et al., 1982; Ulery et al., 1993). The
presence of calcite in soil under burnt vegetation is also confirmed by Iglesias et al.
(1997) where the XRD peaks appeared for soils under burnt Juniperus oxycedrus.
Quintana et al. (2007) observed the occurrence of calcium oxalate or known as
whewellite (Ca(C2O4).(H2O)) in unheated Spanish juniper (Juniperus thurifera L.), a
mineral that turns into calcite at heating around 400oC. Wattez and Courty (1987)
pointed out that calcite crystals formed from the transformation of calcium oxalate
during the combustion of plant tissue, especially wood from different tree species.
74
Ulery et al. (1996) estimated about 1 to 2% of the land area she investigated had
concentrated fuel such as logs which burnt at higher temperatures resulting in soil
mineral alteration. Kaolinite was completely destroyed within 1 to 8 cm of topsoil.
We estimate that at Wundowie, about 0.1% of the forest floor is occupied by fallen
trees with each fallen tree trunk occupying about 4 m2. This estimate includes trees
that fall during fires. At Wundowie fires occur every 10 years on average so that for
each hectare of forest floor, 10 m2 of topsoil will be strongly heated under a burning
log. The landscape is extremely ancient and stable (McArthur, 1991) with soil ages
in excess of 104 years so that on average 104 m2/ha (ie 100%) of soil will have been
strongly heated. Bioturbation, minor colluviation, etc will have caused some mixing
of heated soil materials into the subsoil but clearly heating under a burning log is
likely to have significantly affected topsoil in this forest.
X-ray diffraction patterns of grass tree and eucalyptus ash and charcoal are shown in
Fig 5.7. The major crystalline compounds present for both ashes are calcite, apatite
and quartz. SXRD patterns show strong and sharp apatite reflections. Charcoal
contains abundant amorphous material (mostly carbon) as indicated by the broad
background scatter centered at 15o and 44o 2θ together with calcite in grass tree
charcoal and quartz impurity in eucalyptus charcoal. Harper et al. (1982) also
reported that calcite, apatite and quartz may are present in the ash of plant materials
with quartz being an impurity. Ulery et al. (1993) identified calcite together with
minor unidentified peaks in XRD patterns of wood ash. Calcite, lime, portlandite and
calcium silicate have been identified in wood ash from several tree species (Wattez
and Courty, 1987; Etiegni and Campbell, 1991).

75
a) Fine soil fraction
b) Gravel
c) Whole soil
Figure 5.5. Conventional XRD patterns (a= fine soil fraction and b=gravel) and
Synchrotron XRD (c=whole soil) of soil under and adjacent to a burnt grass tree
(GT) log (Q=quartz, K=kaolinite, Gi=gibbsite, H=hematite and C=calcite).
GT Soil 20-30cm
GT Soil 0-10cm
GT Soil 10-20cm
K K
Q
Q
H
GoGi C
10 20 30
2θ (degrees)
K KQ K
Q
GT Gravel 0-10cm
GT Gravel 10-20cm
GT Gravel 20-30cm
H
Gi CGo
10 20 30
2θ (degrees)
K K
QK
Q
GT Soil 0-10cm
GT Soil 10-20cm
GT Soil 20-30cm
K
C
Gi HGo
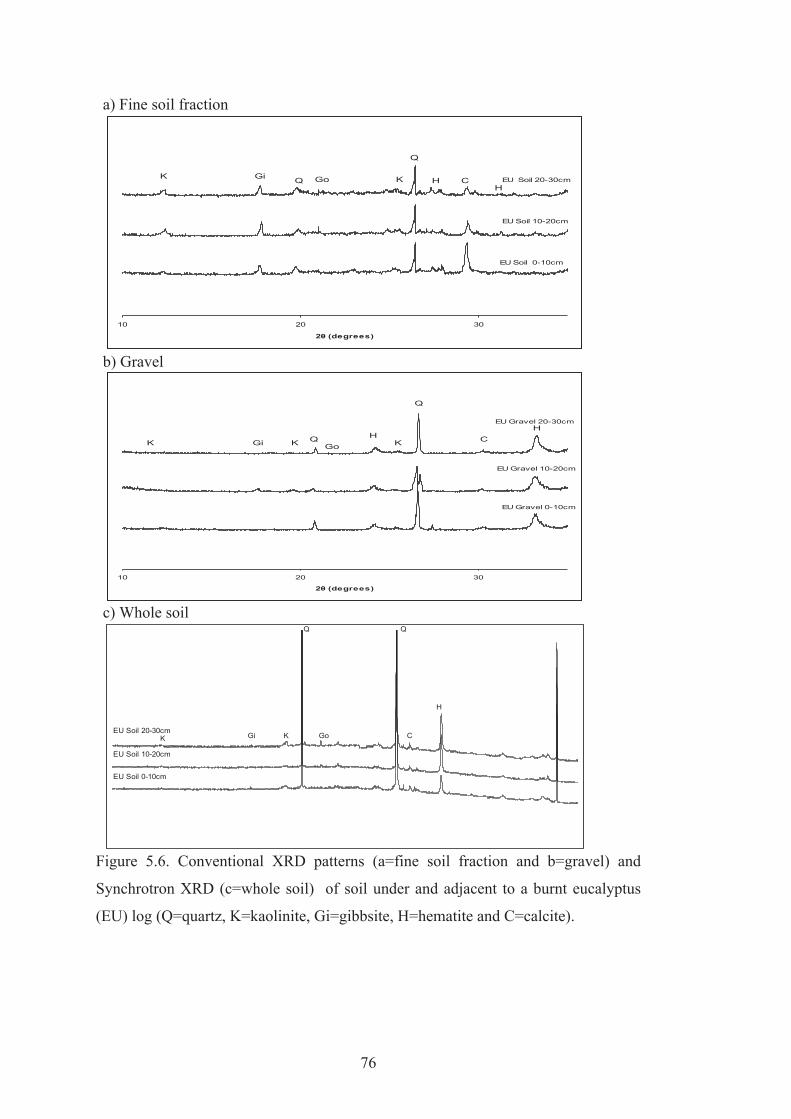
76
a) Fine soil fraction
b) Gravel
c) Whole soil
Figure 5.6. Conventional XRD patterns (a=fine soil fraction and b=gravel) and
Synchrotron XRD (c=whole soil) of soil under and adjacent to a burnt eucalyptus
(EU) log (Q=quartz, K=kaolinite, Gi=gibbsite, H=hematite and C=calcite).
EU Soil 20-30cm
EU Soil 0-10cm
EU Soil 10-20cm
K
Q
Gi K Go
Q
C
H
10 20 30
2θ (degrees)
K Q H
Q
EU Gravel 0-10cm
EU Gravel 10-20cm
EU Gravel 20-30cm
CH
Gi K KGo
10 20 30
2θ (degrees)
K GoQ K
Q
EU Soil 0-10cm
EU Soil 10-20cm
EU Soil 20-30cmCGiH
H

77
a) Ash-CXRD
15 20 25 30 35 40 45 50 55 60 65
EU Ash
GT Ash
Q
C
C
C C C C
C
A A A A A
b) Charcoal-CXRD
15 20 25 30 35 40 45 50 55 60 65
EU Charcoal
GT Charcoal
C
Carbon
Q Carbon
Carbon
Carbon
c) Ash-SXRD
EU ASH Synchrotron
GT ASH Synchrotron Q
Q
A
C
A A
C
Q
C C C
Q
C C
A Q A
Figure 5.7. Conventional (a, b) and Synchrotron XRD (c) patterns of ash and
charcoal for burnt grass tree (GT) and eucalyptus (EU) logs (Q=quartz, A= apatite,
and C=calcite).

78
Scanning electron microscopy of grass tree ash (Fig. 5.8) indicates that the ash
contains particles of inorganic compunds with sizes ranging from <1 μm to 100 μm
with both euhedral and irregular shapes. Many calcite (CaCO3) (5.8a) particles range
from <10 μm to 100 μm and have a rhombic shape, Ca and P-rich particles are
apatite (Ca10(PO4)6(Cl,OH)2) (5.8b) with sizes <10 μm and an irregular shape.
Potassium rich particles (5.8c and 5.8d) are <10 μm and the potassium salt(s) may
include sulfates, which are mixed with calcite and possible calcium sulfate. SEM
micrographs and associated EDS X-ray spectra of eucalyptus ash (Fig. 5.9) shows
rhombic and microcrystalline calcite (5.9a), mixed calcium-magnesium carbonate
(5.9b), silt-size grains of the soil minerals, quartz and K-feldspar (KAlSi3O8) (5.8c,
5.8d) mixed or coated with calcite. Humphreys et al., (1987) and Yusiharni et al.
(2007) also found that plant ash mainly consisted of calcite however Etiegni and
Campbell (1991) observed that quicklime (CaO) and calcium silicate (Ca2SiO4)
could also be present. The present results indicate the complex nature of ash, with a
high diversity of composition, shape and size of particles.
5.4. Conclusion
The Wundowie bushfire added calcite and other salts in plant ash to the soil, which
considerably increased soil pH and EC values. Plant ash also increased
concentrations of Ca, K, Mg, Mn, and P in the heated soil. The amount of C and N in
burnt soil and gravel were less closer to center of burnt logs. Soil heated under burnt
logs experienced alteration of some soil minerals (Ulery et al., 1996) and amorphous
compounds may have formed. These compounds are generally chemically reactive
with a high capacity to adsorb ions and thus, may affect soil fertility (Ketterings et
al., 2000). Gibbsite, goethite and kaolinite in the topsoil were partly dehydroxylated
by heating in the bushfire. Dehydroxylation of kaolinite and gibbsite created
amorphous compounds, which increased oxalate extractable Al and Si. Clearly
dehydroxylated minerals and possibly their rehydroxylated forms must be present in
naturally heated soils and these complex minerals may have a significant effect on
the chemical behaviour of the soil.

79
0
5000
10000
15000
20000
25000
1 2 3 4 5 6 7 8 9 10
Energy (keV)
Ca
Ca
a)
0
2000
4000
6000
8000
10000
12000
14000
16000
18000
1 2 3 4 5 6 7 8 9 10
Energy (keV)
Ca
Ca
P
b)
0 500
1000 1500 2000 2500 3000 3500 4000 4500 5000
1 2 3 4 5 6 7 8 9 10
Energy (keV)
Ca
Ca
K
S
c)
0
2000
4000
6000
8000
10000
12000
1 2 3 4 5 6 7 8 9 10 Energy (keV)
Ca
Ca
K
S d)
Figure 5.8. Scanning electron micrograph (SEM) and X-ray spectra of the indicated
particles for grass tree ash, where large rhombic calcite crystal (CaCO3) (a),
microcrystalline apatite (Ca10(PO4)6(OH)2) with calcite (b) and mixed potassium and
calcium salts (c and d) are present.
A
B
CD
A
B
CD
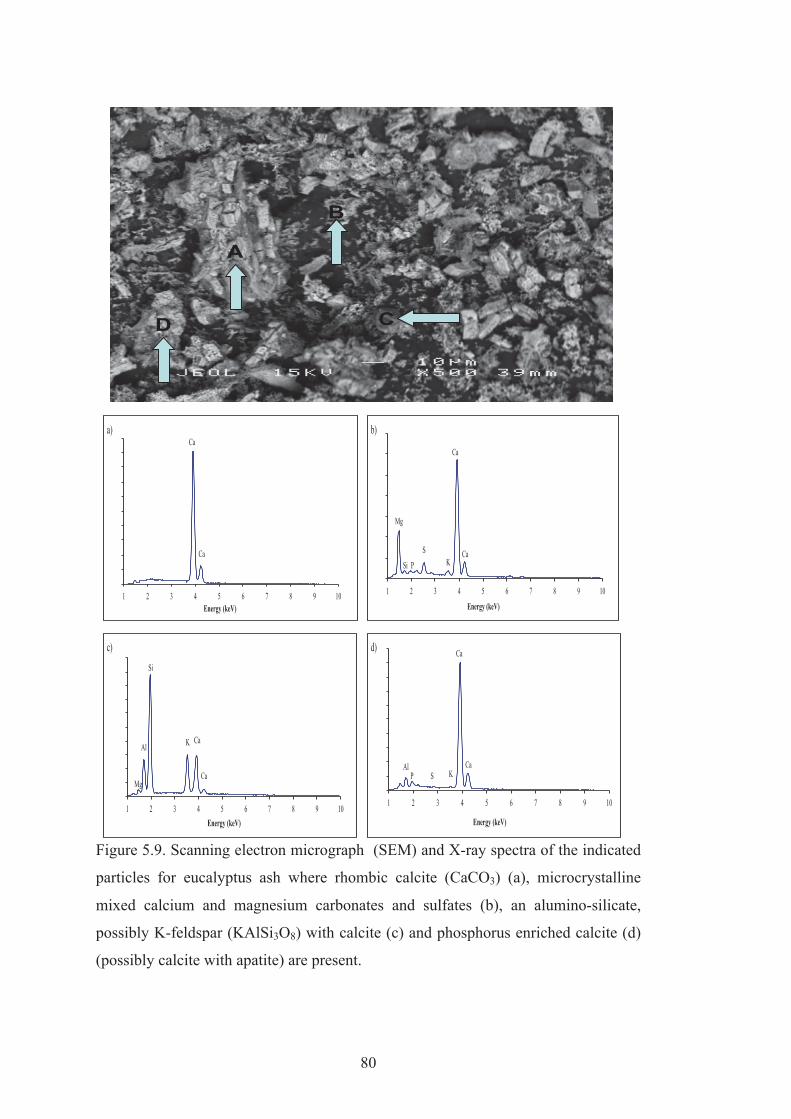
80
0 2000 4000 6000 8000
10000 12000 14000 16000 18000 20000
1 2 3 4 5 6 7 8 9 10 Energy (keV)
Ca
Ca a)
0
2000
4000
6000
8000
10000
12000
14000
1 2 3 4 5 6 7 8 9 10 Energy (keV)
Ca
Ca
Mg
S K Si P
b)
0 1000 2000 3000 4000 5000 6000 7000 8000 9000
10000
1 2 3 4 5 6 7 8 9 10 Energy (keV)
Ca
Ca
K
Si
Al
Mg
c)
0 2000 4000 6000 8000
10000 12000 14000 16000 18000 20000
1 2 3 4 5 6 7 8 9 10
Energy (keV)
Ca
Ca K S P
Al
d)
Figure 5.9. Scanning electron micrograph (SEM) and X-ray spectra of the indicated
particles for eucalyptus ash where rhombic calcite (CaCO3) (a), microcrystalline
mixed calcium and magnesium carbonates and sulfates (b), an alumino-silicate,
possibly K-feldspar (KAlSi3O8) with calcite (c) and phosphorus enriched calcite (d)
(possibly calcite with apatite) are present.
A
B
CD
A
B
CD

81
Chapter 6
6.0 Minerals in the ash of Australian native plants
6.1. Introduction
Wild and managed fires burn many thousands of hectares of forest annually and
consume some or all of the vegetation and litter (Ulery et al., 1996). The intensity of
forest burning is related to weather conditions, amount of fuel available and the
condition of the fuel. Fires create ash consisting of organic and inorganic residues
from the combustion process (Ùbeda et al., 2009). Ash may be defined as a complex
mixture of charcoal, char and minerals (i.e inorganic compounds) (Scott, 2010). The
characteristics and the amount of forest plant ash produced under natural or
controlled conditions depend on several factors, including the species and the part of
plant that was combusted (leaves, fruit, bark or wood), plant age and combustion
degree (Clapham and Zibilske, 1992; Ulery et al., 1993; Vance and Mitchell 2000;
Demeyer et al., 2001).
Most elements in plants are retained in the ash with most N and some S being lost
(Perkiomaki, 2004). Consequently the N content in ash is usually small, particularly
where fuels are completely combusted (Khanna et al., 1994). The carbon (C) content
of ash varies with combustion degree, with C remaining as unburnt plant material,
charcoal and carbonate minerals (Vance and Mitchell, 2000). The color of ash varies
from black through grey, brown to white with the type of plant and combustion
process influencing ash color. Dark colored (black) ash contains higher amounts of
charred organic material compared to the light colored ash that is mostly composed
of crystalline or amorphous inorganic compounds (Knicker, 2007). Recent studies
have proposed that ash color could be use as an indicator of fire severity (Keeley,
2009; Pereira et al., 2011; Bodí et al., 2011) but the nature and amount of inorganic
compounds need to be considered and differ with vegetation type. Several laboratory
studies have examined the relationship between ash color and fire severity for
various biomass types and combustion temperatures (Misra et al., 1993; Liodakis et
al., 2005; Liodakis et al., 2009). For combustion at 600oC, CaCO3 and K2Ca(CO3)2
were present while for 1300oC combustion, CaO and MgO were the dominant
compounds (Misra et al., 1993). However, in general the nature of minerals in plant
ash is poorly understood and is the subject of this study.

82
Ash is generally an alkaline material with pH ranging from 9.0 to 13.5 (Khanna et
al., 1994; Liodakis et al., 2005) and ash has been used as a combined liming agent
and nutrient source (Etiegni and Campbell, 1991; Yusiharni et al., 2007). For
example, application of ash to an acid soil increased soil pH, and levels of
extractable Ca, Mg and SO4 (Voundi Nkana et al., 2002). Ash generally contains
significant amounts of most plant nutrient elements and thus can be regarded as a
multi nutrient fertilizer (Vance and Mitchell, 2000). Furthermore addition of ash to
soil may increase the availability of some soil nutrients to plants because of
exchange with ions dissolved from ash (Voundi Nkana et al., 2002).
Several studies have investigated the physical and chemical properties of ash from
diverse plant species (Etiegni and Campbell, 1991; Khanna et al., 1994; Ùbeda et al.,
2009; Gabet and Bookter, 2011). However, the forms of plant nutrients in ash
including the forms of water-soluble elements and their interactions with soils have
received little attention. The research described in this paper determined the amounts
and mineral forms of elements in ash derived from several Australian native plant
species and evaluated the reactions of plant ash with heated and unheated soil.
Table 6.1. The nomenclature for plant ash and some properties of the ash. SSA= specific surface area (m2/g), EC= electrical conductivity (mS/cm), Bic P= bicarbonate P (mg/kg). Key Species and plant material Ash % Ash Color SSA
(m2/g)
pH
(1:5)
EC (1:5)
(mS/cm)
Bic P
(mg/kg)
SW
SL
PM
WW
WL
RW
RL
GT
JL
HH
Silver wattle wood
Silver wattle leaf
Prickly moses leaf and twig
Wandoo wood
Wandoo leaf
Red gum wood
Red gum leaf
Grass tree leaf
Jarrah leaf
Harsh hakea leaf and twig
1.72
3.39
2.81
3.07
3.02
4.71
4.07
3.40
3.27
4.01
G1 8/N
G1 5/N
G1 4/N
2.5Y 7/2
G1 5/N
G1 7/N
G1 6/N
G1 3/N
2.5Y 6/2
G1 4/N
5.8
4.2
8.3
9.2
2.4
2.4
2.5
2.7
2.9
7.7
13.8
12.8
13.1
13.6
13.3
13.8
13.4
13.5
13.2
12.3
18.9
13.9
8.5
15.1
14.3
23.2
18.4
22.9
18.9
16.3
145
198
199
176
32
183
30
145
196
164
83
6.2. Material and Methods
6.2.1. Ash preparation
The Australian native plants used for the study are major constituents of forest
vegetation at Bakers Hills, Darling Range, Western Australia: silver wattle (Acacia
retinodes), prickly moses (Acacia pulchella), wandoo/white gum (Eucalyptus
wandoo), red gum or marri (Corymbia calophylla), grass tree (Xanthorrhoea
preissii), jarrah (Eucalyptus marginata) and harsh hakea (Hakea prostrata). The
leaves and wood samples were dried in an oven at 60oC until the weight was
constant (up to 7 days) and then cut to 1-2 cm to make the sample homogenous. A
subsample of approximately 50 g then placed in an aluminum oven tray and burned
in open air for about 15 min with agitation to maximize burning, to simulate
combustion in a forest fire in the field. Temperature was not recorded during the
combustion process. Combustion was almost complete for each material with only
small amounts of charcoal remaining in the ash. A key to the materials investigated
and the abbreviations used to identify these materials are given in Table 6.1.
6.2.2. Characterization of the ash
Ash color was classified using a Munsell Color Chart (Munsell Color Co., 1998).
Specific surface area (SSA) was measured using a Micrometrics Gemini 2375
instrument with VacPrep 061 using a five point BET method with N2 as the
absorbate. The pH of the ash was determined in a 1:5 deionized water extract. The
samples were analyzed for bicarbonate extractable P (Bic P) (Colwell, 1963). Total
carbon and nitrogen were determined on an Elementar CNS (Vario Macro) analyzer.
Water-soluble elements in ash were determined using Association of Official
Analytical Chemistry (AOAC) standard methods (AOAC, 1975). 0.5 g of ash was
mixed with 100 ml of DI water and placed on a mechanical shaker for 24 h. Extracts
were then filtered through a 0.22 μm Millipore filter. Water-soluble elements were
then measured using an inductively coupled plasma optical emission spectrometer
(ICP-OES) (Perkin-Elmer, Norwalk, CT, USA). Ash content of plant material was
determined by a separate dry combustion in a muffle furnace at 550oC for 2 hours
(Rayment and Higginson, 1992).
Total elements were determined in duplicate with a model PE ELAN 600 inductively
coupled plasma – atomic emission spectroscopy (ICP-OES) instrument (Perkin-

84
Elmer, Norwalk, CT, USA) after concentrated perchloric acid digestion of the ash
(Rayment and Higginson, 1992). Conventional XRD of the ash was conducted on a
Philips PW3020 diffractometer with a diffracted beam monochromator (CuKα,
50kV, 20mA). Powder samples were scanned from 4 to 70o 2θ, using a step size of
0.02o 2θ and a scan speed of 0.04o 2θ sec-1. Synchrotron XRD (SXRD) analysis was
performed at the Australian Synchrotron where powder samples were mounted into
glass capillaries with a 1.0Å wavelength set for this analysis in order to provide a
high peak/background and adequate resolution for identifying minor constituents.
The composition and morphology of the plant ash was examined by scanning
electron microscopy (SEM) and energy dispersive X-ray spectrometry (EDS) using a
JEOL 6400 instrument. Samples for SEM analysis were placed on metal stubs and
carbon coated before analysis. Principal component analysis was carried out on the
bulk chemical data and on element concentrations of ash particles derived from SEM
EDS spectra using STATISTICA (STATISTICA, 2011).
6.2.3. Incubation of ash-soil mixture
Topsoil (0-10 cm) from Bakers Hills, (Yalanbee soil, a lateritic podzolic soil, which
is an Alfisol (USDA, 2010)) was used in the incubation study. The same acid sandy,
highly P-deficient soil had been used in a study of the P fertilizer value of chicken
litter ash by Yusiharni et al. (2007). Soil properties (<2 mm fraction) are as follow;
pH (1:5 H2O) 4.5, Electrical conductivity (EC) (1:5 H2O) 0.04 mS/cm, total P 0.25
%, bicarbonate extractable P 0.49 ppm (Colwell 1963), total carbon 1.64%, total
nitrogen 0.08%, clay, silt and sand were 4%, 6%, and 90% respectively (Yusiharni,
2007). Subsamples of unheated soil were air dried and passed through a 2 mm sieve
for use in the incubation experiment and for chemical analysis, while other soil
subsamples were first heated at 200oC in a muffle furnace for one hour to simulate
heating in a bushfire. 100 g of unheated and heated soil were thoroughly mixed with
each ash (SW, SL, PM, WW, WL, RW, RL, GT, JL and HH) in vials at rates of 0
and 1 g/100g soil. Each mixture was replicated two times, wetted to about 20% water
content with addition of toluene as a microbial inhibitor. The tops were firmly
screwed onto the vials, which were placed in the dark at 20oC for 0, 1 and 5 weeks.
After each incubation period a subsample was removed for analysis for Bic-P, EC
and pH as described above.
85
6.3. Results and Discussion
6.3.1. Characteristics of the ashes
The ash content of the plant materials as the result of furnace burning ranged from
1.7 to 4.7%. Properties of plant ash produced by open-air burning are shown in Table
6.1. Ash was white (G1 8/N, G1 7/N, G1 6/N, G1 5/N, or G1 4/N) and grey (G1 3/N,
2.5Y 7/2 or 2.5Y 6/2). Grey ash contains more carbon (charred organic material)
than white ash possibly reflecting differences in the intensity of combustion (Khanna
et al., 1994; Neary et al., 1999; Lentile et al., 2006; Roy et al., 2010). White ash
generally contains abundant calcite (CaCO3) (Ulery and Graham, 1993) as will be
discussed subsequently.
All the ashes were alkaline with pH ranging from 12.3 to 13.8. These high values are
associated with the presence of carbonates, oxides and hydroxides of base cations in
ash (Ulery et al., 1993). The electrical conductivity of the ash extracts (1:5) was
high, indicating that the ash contains considerable amounts of soluble salts, with red
gum wood ash containing the highest amount (23.2 mS/cm) and prickly moses
leaf/twig ash the least (8.5 mS/cm). Other workers have made similar observations
(Kutiel and Naveh, 1987; Iglesias et al., 1997; Badía and Martií, 2003). The specific
surface area of the ashes ranges from 2 to 9 m2/g indicating that ash particles
(crystals) are very small (micron size) and are thus likely to be quite reactive.
Amounts of available phosphorus (P) in the ash ranged from 29 to 198 mg/kg
reflecting the combustion of organic P compounds and the presence of partly soluble
P minerals in ash (Kutiel and Shaviv, 1989; Galang et al., 2010).
The ash produced by open-air combustion in this study may not be identical to ash
produced during wildfires, prescribed fires or ash derived from laboratory ignition at
controlled temperatures. Raison (1979) mentioned that ash generated in a muffle
furnace would be different from ash produced during a wildland fire. Bodí et al.
(2011) also found in their recent study that ash derived at several temperatures in a
laboratory study may not have effectively replicated ash created by a bushfire.

86
Table 6.2. Total element concentrations in plant ash (mg/kg). Silver wattle wood (SW), silver wattle leaf (SL), prickly moses leaf and twig (PM), wandoo wood (WW), wandoo leaf (WL), red gum wood (RW), red gum leaf (RL), grass tree leaf (GT), jarrah leaf (JL), and harsh hakea leaf and twig (HH).
Element (mg/kg)
Ash Type SW SL PM WW WL RW RL GT JL HH
Al 1014 1802 3499 2028 1375 840 2540 1085 3689 6091 As 3 5 4 3 2 0 0 1 3 5 B 242 282 164 197 1215 153 657 135 936 248 Ba 494 372 1092 913 842 169 149 561 55 60 Be 0.2 0.4 0.3 0.3 0.5 0.1 0.1 0.1 0.3 0.2 Ca 289300 206800 134200 248300 177600 219400 147900 162801 149800 158600 Ce 6 27 51 43 23 4 6 11 9 15 Co 3 2 3 1 1 2 6 2 3 2 Cr 42 24 44 18 41 11 30 131 62 45 Cu 122 453 92 71 104 97 97 88 131 99 Fe 2688 4098 13792 4067 2920 1518 4473 4177 14850 22870 K 32370 41660 37400 29380 42110 32660 35810 45790 33000 34080 La 6 30 58 31 15 2 4 10 3 8 Mg 58670 76801 21570 49760 60940 43420 66990 69610 111300 33920 Mn 387 1005 522 2998 3150 694 822 890 3494 3955 Mo 1 1 3 1 1 1 1 4 3 4 Na 1792 10080 6319 26520 92980 24340 60220 9406 83140 47990 Nb 5 5 8 5 5 3 5 4 8 8 Ni 7 9 15 8 20 10 16 30 35 14 P 4986 11190 6097 2649 7715 9940 13470 10750 8867 7074 Pb 3 3 23 14 5 0 13 21 35 8 Rb 148 210 179 187 170 205 196 229 92 107 S 1842 6046 5086 2437 5490 2121 5489 8738 6454 23820 Si 5610 10010 15870 11450 9140 9090 18300 10600 17220 7010 Ta 26 23 26 28 23 22 22 23 32 35 Ti 168 291 764 242 226 119 375 206 887 706 U 16 11 8 13 9 13 9 10 9 9 Y 1 8 17 6 6 1 1 3 2 7 Zn 61 322 273 92 1039 292 335 149 131 317 Zr 4 5 12 3 4 3 5 4 3 7
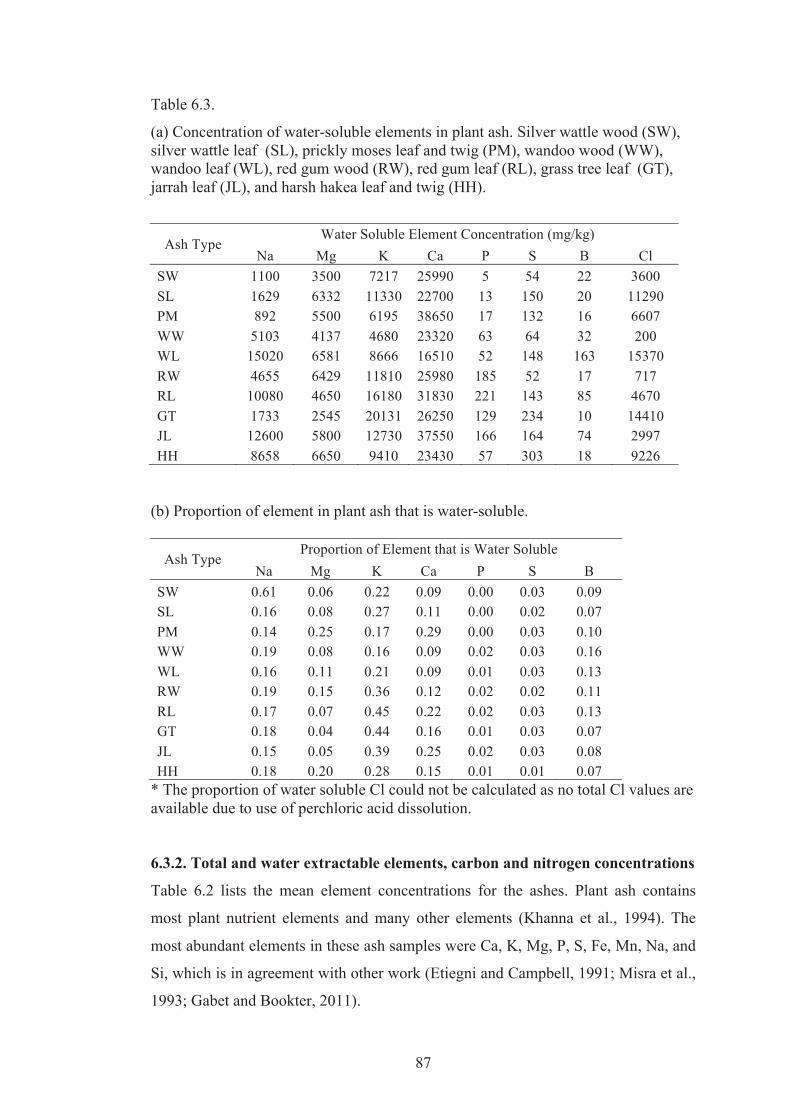
87
Table 6.3.
(a) Concentration of water-soluble elements in plant ash. Silver wattle wood (SW), silver wattle leaf (SL), prickly moses leaf and twig (PM), wandoo wood (WW), wandoo leaf (WL), red gum wood (RW), red gum leaf (RL), grass tree leaf (GT), jarrah leaf (JL), and harsh hakea leaf and twig (HH).
Ash Type Water Soluble Element Concentration (mg/kg)
Na Mg K Ca P S B Cl SW 1100 3500 7217 25990 5 54 22 3600 SL 1629 6332 11330 22700 13 150 20 11290 PM 892 5500 6195 38650 17 132 16 6607 WW 5103 4137 4680 23320 63 64 32 200 WL 15020 6581 8666 16510 52 148 163 15370 RW 4655 6429 11810 25980 185 52 17 717 RL 10080 4650 16180 31830 221 143 85 4670 GT 1733 2545 20131 26250 129 234 10 14410 JL 12600 5800 12730 37550 166 164 74 2997 HH 8658 6650 9410 23430 57 303 18 9226
(b) Proportion of element in plant ash that is water-soluble.
Ash Type Proportion of Element that is Water Soluble
Na Mg K Ca P S B SW 0.61 0.06 0.22 0.09 0.00 0.03 0.09 SL 0.16 0.08 0.27 0.11 0.00 0.02 0.07 PM 0.14 0.25 0.17 0.29 0.00 0.03 0.10 WW 0.19 0.08 0.16 0.09 0.02 0.03 0.16 WL 0.16 0.11 0.21 0.09 0.01 0.03 0.13 RW 0.19 0.15 0.36 0.12 0.02 0.02 0.11 RL 0.17 0.07 0.45 0.22 0.02 0.03 0.13 GT 0.18 0.04 0.44 0.16 0.01 0.03 0.07 JL 0.15 0.05 0.39 0.25 0.02 0.03 0.08 HH 0.18 0.20 0.28 0.15 0.01 0.01 0.07
* The proportion of water soluble Cl could not be calculated as no total Cl values are available due to use of perchloric acid dissolution.
6.3.2. Total and water extractable elements, carbon and nitrogen concentrations
Table 6.2 lists the mean element concentrations for the ashes. Plant ash contains
most plant nutrient elements and many other elements (Khanna et al., 1994). The
most abundant elements in these ash samples were Ca, K, Mg, P, S, Fe, Mn, Na, and
Si, which is in agreement with other work (Etiegni and Campbell, 1991; Misra et al.,
1993; Gabet and Bookter, 2011).
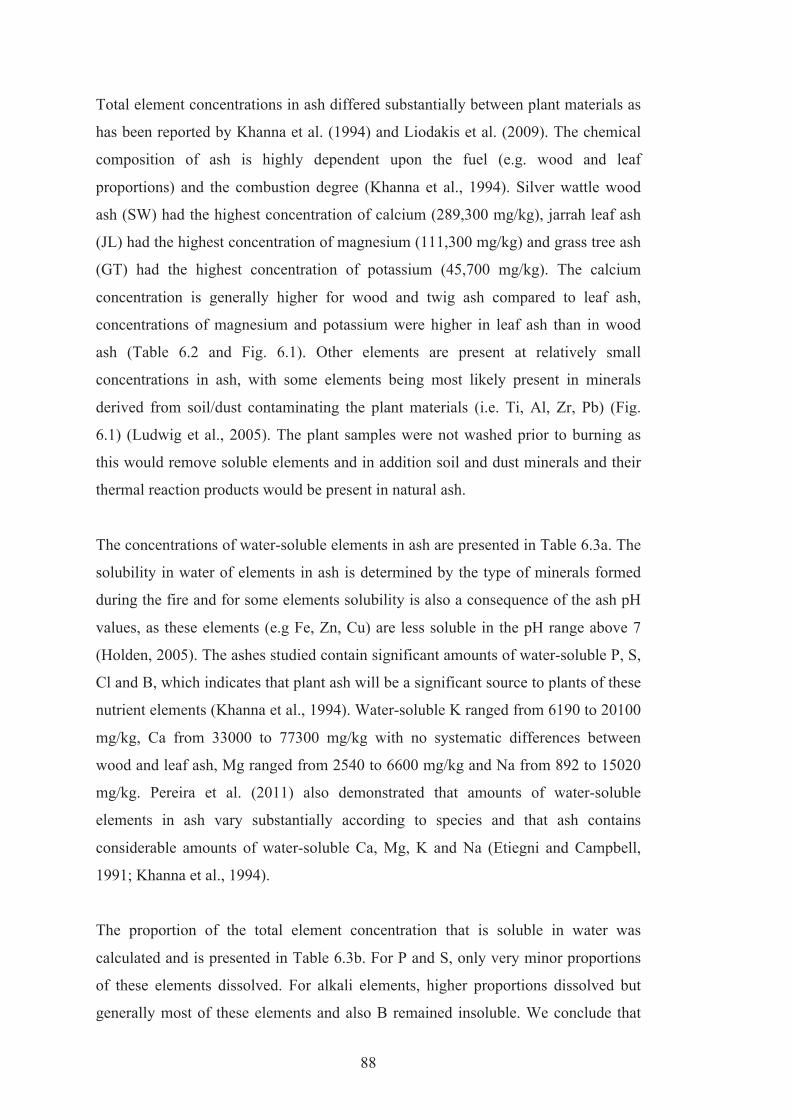
88
Total element concentrations in ash differed substantially between plant materials as
has been reported by Khanna et al. (1994) and Liodakis et al. (2009). The chemical
composition of ash is highly dependent upon the fuel (e.g. wood and leaf
proportions) and the combustion degree (Khanna et al., 1994). Silver wattle wood
ash (SW) had the highest concentration of calcium (289,300 mg/kg), jarrah leaf ash
(JL) had the highest concentration of magnesium (111,300 mg/kg) and grass tree ash
(GT) had the highest concentration of potassium (45,700 mg/kg). The calcium
concentration is generally higher for wood and twig ash compared to leaf ash,
concentrations of magnesium and potassium were higher in leaf ash than in wood
ash (Table 6.2 and Fig. 6.1). Other elements are present at relatively small
concentrations in ash, with some elements being most likely present in minerals
derived from soil/dust contaminating the plant materials (i.e. Ti, Al, Zr, Pb) (Fig.
6.1) (Ludwig et al., 2005). The plant samples were not washed prior to burning as
this would remove soluble elements and in addition soil and dust minerals and their
thermal reaction products would be present in natural ash.
The concentrations of water-soluble elements in ash are presented in Table 6.3a. The
solubility in water of elements in ash is determined by the type of minerals formed
during the fire and for some elements solubility is also a consequence of the ash pH
values, as these elements (e.g Fe, Zn, Cu) are less soluble in the pH range above 7
(Holden, 2005). The ashes studied contain significant amounts of water-soluble P, S,
Cl and B, which indicates that plant ash will be a significant source to plants of these
nutrient elements (Khanna et al., 1994). Water-soluble K ranged from 6190 to 20100
mg/kg, Ca from 33000 to 77300 mg/kg with no systematic differences between
wood and leaf ash, Mg ranged from 2540 to 6600 mg/kg and Na from 892 to 15020
mg/kg. Pereira et al. (2011) also demonstrated that amounts of water-soluble
elements in ash vary substantially according to species and that ash contains
considerable amounts of water-soluble Ca, Mg, K and Na (Etiegni and Campbell,
1991; Khanna et al., 1994).
The proportion of the total element concentration that is soluble in water was
calculated and is presented in Table 6.3b. For P and S, only very minor proportions
of these elements dissolved. For alkali elements, higher proportions dissolved but
generally most of these elements and also B remained insoluble. We conclude that
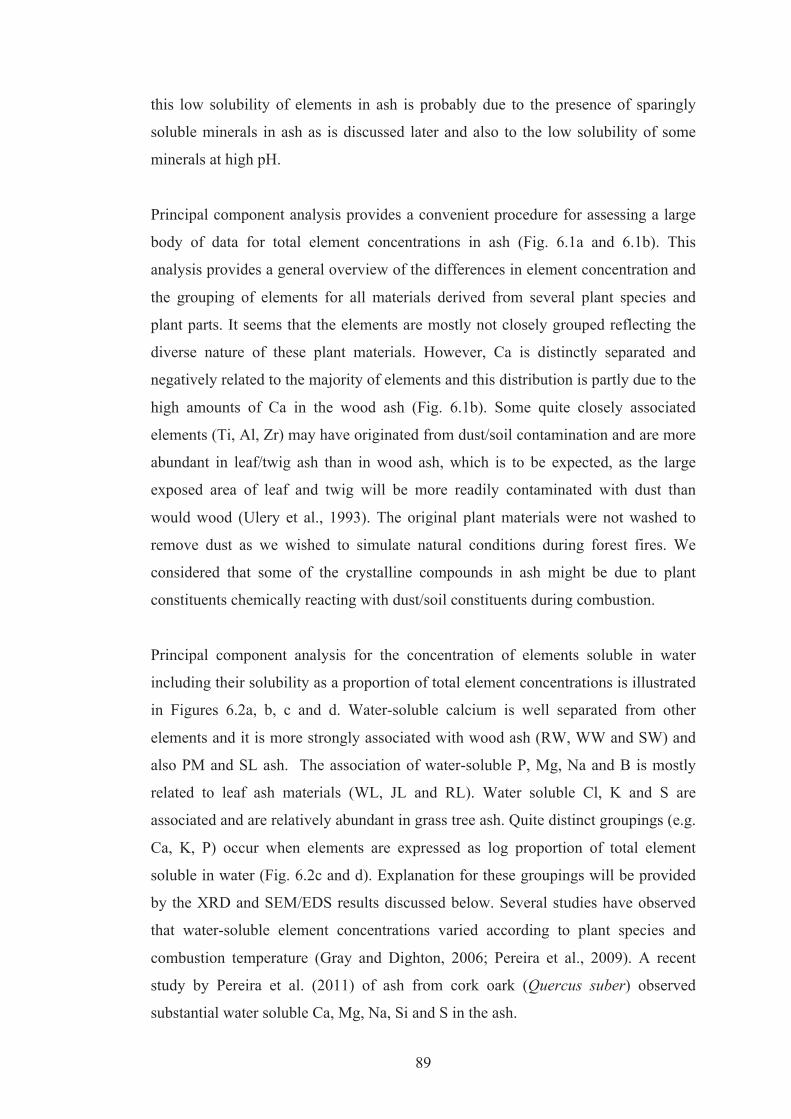
89
this low solubility of elements in ash is probably due to the presence of sparingly
soluble minerals in ash as is discussed later and also to the low solubility of some
minerals at high pH.
Principal component analysis provides a convenient procedure for assessing a large
body of data for total element concentrations in ash (Fig. 6.1a and 6.1b). This
analysis provides a general overview of the differences in element concentration and
the grouping of elements for all materials derived from several plant species and
plant parts. It seems that the elements are mostly not closely grouped reflecting the
diverse nature of these plant materials. However, Ca is distinctly separated and
negatively related to the majority of elements and this distribution is partly due to the
high amounts of Ca in the wood ash (Fig. 6.1b). Some quite closely associated
elements (Ti, Al, Zr) may have originated from dust/soil contamination and are more
abundant in leaf/twig ash than in wood ash, which is to be expected, as the large
exposed area of leaf and twig will be more readily contaminated with dust than
would wood (Ulery et al., 1993). The original plant materials were not washed to
remove dust as we wished to simulate natural conditions during forest fires. We
considered that some of the crystalline compounds in ash might be due to plant
constituents chemically reacting with dust/soil constituents during combustion.
Principal component analysis for the concentration of elements soluble in water
including their solubility as a proportion of total element concentrations is illustrated
in Figures 6.2a, b, c and d. Water-soluble calcium is well separated from other
elements and it is more strongly associated with wood ash (RW, WW and SW) and
also PM and SL ash. The association of water-soluble P, Mg, Na and B is mostly
related to leaf ash materials (WL, JL and RL). Water soluble Cl, K and S are
associated and are relatively abundant in grass tree ash. Quite distinct groupings (e.g.
Ca, K, P) occur when elements are expressed as log proportion of total element
soluble in water (Fig. 6.2c and d). Explanation for these groupings will be provided
by the XRD and SEM/EDS results discussed below. Several studies have observed
that water-soluble element concentrations varied according to plant species and
combustion temperature (Gray and Dighton, 2006; Pereira et al., 2009). A recent
study by Pereira et al. (2011) of ash from cork oark (Quercus suber) observed
substantial water soluble Ca, Mg, Na, Si and S in the ash.
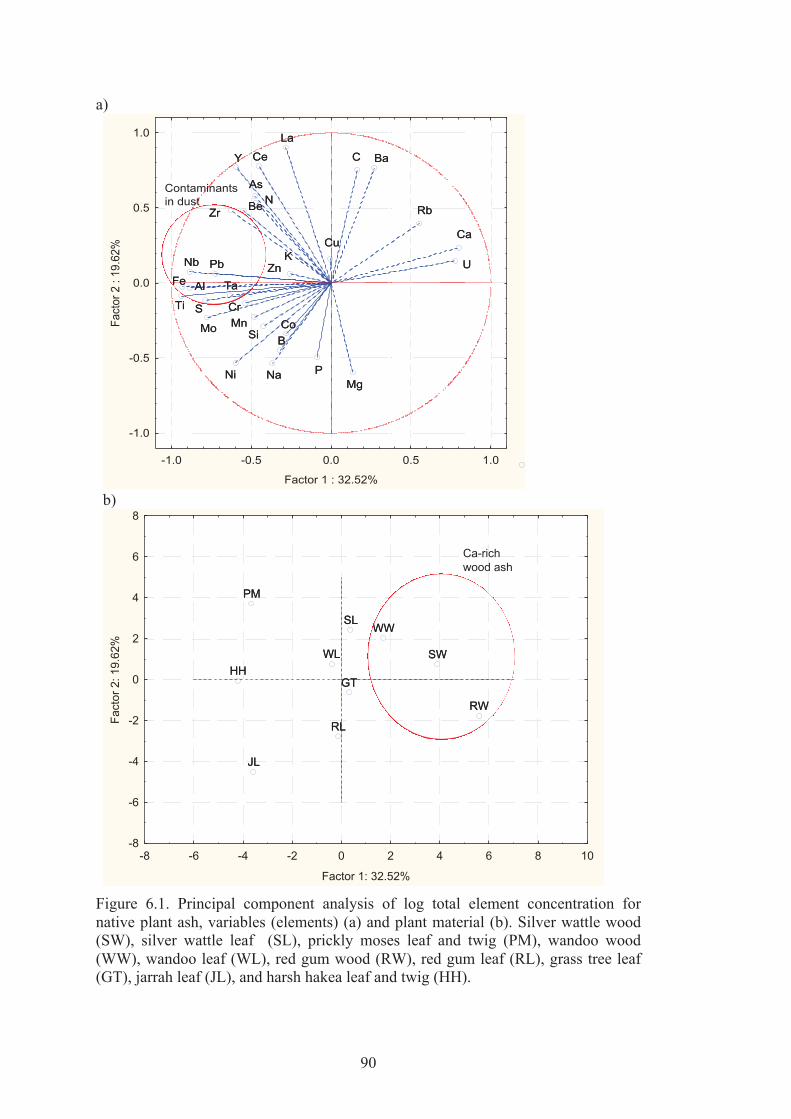
90
a)
Al
As
B
Ba
Be
C
Ca
Ce
Co Cr
Cu
Fe
K
La
Mg
Mn Mo
N
Na
Nb
Ni P
Pb
Rb
S
Si
Ta
Ti
U
Y
Zn
Zr
-1.0 -0.5 0.0 0.5 1.0
Factor 1 : 32.52%
-1.0
-0.5
0.0
0.5
1.0Fa
ctor
2 :
19.6
2%
Al
As
B
Ba
Be
C
Ca
Ce
Co Cr
Cu
Fe
K
La
Mg
Mn Mo
N
Na
Nb
Ni P
Pb
Rb
S
Si
Ta
Ti
U
Y
Zn
Zr
Contaminants in dust
b)
SW
SL
PM
WW
WL
RW
RL
GT
JL
HH
-8 -6 -4 -2 0 2 4 6 8 10
Factor 1: 32.52%
-8
-6
-4
-2
0
2
4
6
8
Fact
or 2
: 19.
62%
SW
SL
PM
WW
WL
RW
RL
GT
JL
HH
Ca-richwood ash
Figure 6.1. Principal component analysis of log total element concentration for native plant ash, variables (elements) (a) and plant material (b). Silver wattle wood (SW), silver wattle leaf (SL), prickly moses leaf and twig (PM), wandoo wood (WW), wandoo leaf (WL), red gum wood (RW), red gum leaf (RL), grass tree leaf (GT), jarrah leaf (JL), and harsh hakea leaf and twig (HH).

91
(a)
Na Mg
K
Ca
P
S
B
Cl
-1.0 -0.5 0.0 0.5 1.0
Factor 1 : 32.33%
-1.0
-0.5
0.0
0.5
1.0Fa
ctor
2 :
25.5
0%
Na Mg
K
Ca
P
S
B
Cl
(b)
SW
SL PM
WW
WL RW
RL
GT
JL
HH
-4 -3 -2 -1 0 1 2 3 4 5
Factor 1: 32.33%
-5
-4
-3
-2
-1
0
1
2
3
4
Fact
or
2: 25.5
0% SW
SL PM
WW
WL RW
RL
GT
JL
HH
(c)
Na
Mg
K
Ca
P
S
B
-1.0 -0.5 0.0 0.5 1.0
Factor 1 : 29.87%
-1.0
-0.5
0.0
0.5
1.0
Fact
or 2
: 25
.33%
Na
Mg
K
Ca
P
S
B
(d)
SW
SL
PM
WW WL
RW
RL
GT
JL
HH
-5 -4 -3 -2 -1 0 1 2 3 4
Factor 1: 29.87%
-4
-3
-2
-1
0
1
2
3
4F
act
or
2: 25.3
3%
SW
SL
PM
WW WL
RW
RL
GT
JL
HH
Figure 6.2. Principal component analysis of log water soluble element concentrations, variables (a) and cases (b) and log proportion that is water soluble, variables (c) and plant material (d) for native plant ash. Silver wattle wood (SW), silver wattle leaf (SL), prickly moses leaf and twig (PM), wandoo wood (WW), wandoo leaf (WL), red gum wood (RW), red gum leaf (RL), grass tree leaf (GT), jarrah leaf (JL), and harsh hakea leaf and twig (HH).
Mean values of total carbon and nitrogen concentrations in raw plant materials and
ash are presented in Fig. 6.3. Total carbon was above 40% for all the raw plant
materials and decreased to below 10% for their ash. Total carbon concentrations are
similar for all the plant samples. The reduced concentrations of total carbon in plant
ash are due to the almost complete removal of organic material from the ash with
92
remaining carbon being mostly present as carbonates (Misra et al., 1993; Gabet and
Bookter, 2011). Wandoo leaf ash (WL) and harsh hakea ash (HH) had the highest
total carbon and their ash color was considered to be white (G1 5/N and G1 4/N
respectively) rather than grey. Burning plant materials greatly reduced the nitrogen
concentration in the ashes. Almost complete loss of N occurs where combustion of
the fuel is nearly complete (Khanna et al., 1994; Raison et al., 1985). The N content
of ash produced at temperatures above 600 oC is normally low, which is presumably
due to the conversion of most plant nitrogen to NH3, NOx and N2 gases during the
combustion process (Misra et al., 1993).
6.3.3. Mineralogy and Morphology of ash (XRD and SEM)
Conventional XRD patterns of SW, SL, PM, WW, WL, RW, RL, GT, JL and HH
showed that the major compounds present in the ashes are calcite, apatite and quartz
(Appendix 10). Harper et al. (1982) also found that calcite, apatite and quartz were
present in the ash of plant materials where quartz was identified as being an impurity
from dust or soil. Ulery et al. (1993) observed calcite and some minor unidentified
peaks in plant ash. The sensitivity of conventional XRD is insufficient to identify
trace amounts of minerals, therefore synchrotron XRD (SXRD) patterns of ashes
(Fig. 6.4a, b and 6.5a, b) in a glass capillary were also obtained. These patterns offer
better detection and resolution of weak and adjacent reflections than is provided by
conventional XRD (Williams et al., 2003). However the glass of the capillary
contributes to the broad background scattering seen in Fig. 6.4 and 6.5 so that
amorphous silica (e.g. phytoliths) can not be detected.
The main compounds identified by SXRD in the plant ashes were various oxides,
carbonates and hydroxides of Ca, Mg and K as has also been reported by Misra et al.
(1993). The minerals present were fairchildite (K2Ca(CO3)2), nesquehonite
(MgCO3.H2O), calcite (CaCO3), sylvite (KCl), lime (CaO), scolecite
(CaAl2Si3O10.3(H2O),), portlandite (Ca(OH)2, periclase (MgO), apatite group
minerals probably resembling hydroxyl-apatite (Ca5(PO4)3(OH)) and wilkeite
(Ca5((P, S, Si)O4)3(OH,CO3)) and quartz (SiO2 (Table 6.4). Fairchildite,
nesquehonite, scolecite, portlandite and periclase were not identified using
conventional XRD. As discussed above, the proportion of water-soluble elements in
93
ash (Table 6.3.b) is low, which may be attributed to the presence of these mostly
poorly soluble minerals. Hydroxide minerals form when the ash is exposed to air as
oxides of Ca, Mg and K react with atmospheric water (Misra et al. 1993). Liodakis et
al. (2005) detected periclase (MgO), lime (CaO) and portlandite (Ca(OH)2 in wood
ash prepared at 600oC. Reaction of these oxides with atmospheric carbon dioxide
results in the formation of calcite and other carbonates. However, carbonates also
form during combustion. Periclase and lime probably formed directly via the
combustion of magnesium- and calcium-containing organic matter rather than via
decomposition of MgCO3 and CaCO3 (Liodakis et al., 2005).
0
10
20
30
40
50
60
SW SL PM WW WL RW RL GT JL HH
C %
% C in Original Plant % C in Ash
0
1
2
3
SW SL PM WW WL RW RL GT JL HH
N %
% N in Original Plant % N in Ash
Figure 6.3. Mean (n=3) values with standard error bars of carbon (C) and nitrogen (N) concentrations (%) for native plant materials (original and ash). Silver wattle wood (SW), silver wattle leaf (SL), prickly moses leaf and twig (PM), wandoo wood (WW), wandoo leaf (WL), red gum wood (RW), red gum leaf (RL), grass tree leaf (GT), jarrah leaf (JL), and harsh hakea leaf and twig (HH).

94
SXRD could not detect the present of halite (sodium chloride) in the ash, even
though ICPO-ES data showed abundant sodium (up to 93000 mg/kg of total Na) and
chloride (up to 15370 mg/kg water soluble Cl) in the ash so these ions may not be
present as halite. This interpretation is consistent with the low proportion (0.15-0.29)
of total Na that was soluble in water (Table 6.3b).
Scanning electron microscopy of particles and associated EDS X-ray spectra for all
the ashes show that diverse particle sizes, shapes and compositions occur (Fig. 6.6
and 6.7). Ash contains particles with sizes ranging from <1 μm to 100 μm. Apart
from distinct mostly prismatic, large calcite crystals, most grains seen in the
micrographs are K- and Mg-rich aggregates of very small particles often containing
Cl and they commonly contain little P, Fe, S and Si. The sensitivity of EDS for Na is
extremely poor, so that Na peak is not visible in EDS spectra. Liodakis et al. (2009)
found that SEM spectra of particles of plant ash contained lines due to Ca, Mg, K, P
and Si as observed in this work. The present results indicate the complex nature of
ash, with a high diversity of composition, shape and size of particles.
Table 6.4. Crystalline compounds in plant ash identified by SXRD. Silver wattle wood (SW), silver wattle leaf (SL), prickly moses leaf and twig (PM), wandoo wood (WW), wandoo leaf (WL), red gum wood (RW), red gum leaf (RL), grass tree leaf (GT), jarrah leaf (JL), and harsh hakea leaf and twig (HH).
Compound Ash Type SW SL PM WW WL RW RL GT JLA HH
Calcite *** *** *** *** *** *** *** *** *** *** Sylvite ** *** *** * *** ** *** *** *** *** Fairchildite ** *** ** - - - - ** - - Nesquehonite - - - * *** * - - - - Scolecite - ** ** - - - *** - *** ** Periclase * ** * *** ** * ** ** ** * Apatite ** *** ** ** *** ** ** ** ** *** Lime ** * * ** ** * * * * * Portlandite - - - *** - ** *** - ** ** Quartz - - *** * * - * - * ***
The EDS spectra and XRD results indicate that grains are mostly complex mixture of
extremely small crystals including calcite, fairchildite, nesquehonite, sylvite, lime,
scolecite, quartz, portlandite, periclase, apatite (hydroxyl-apatite and wilkeite).
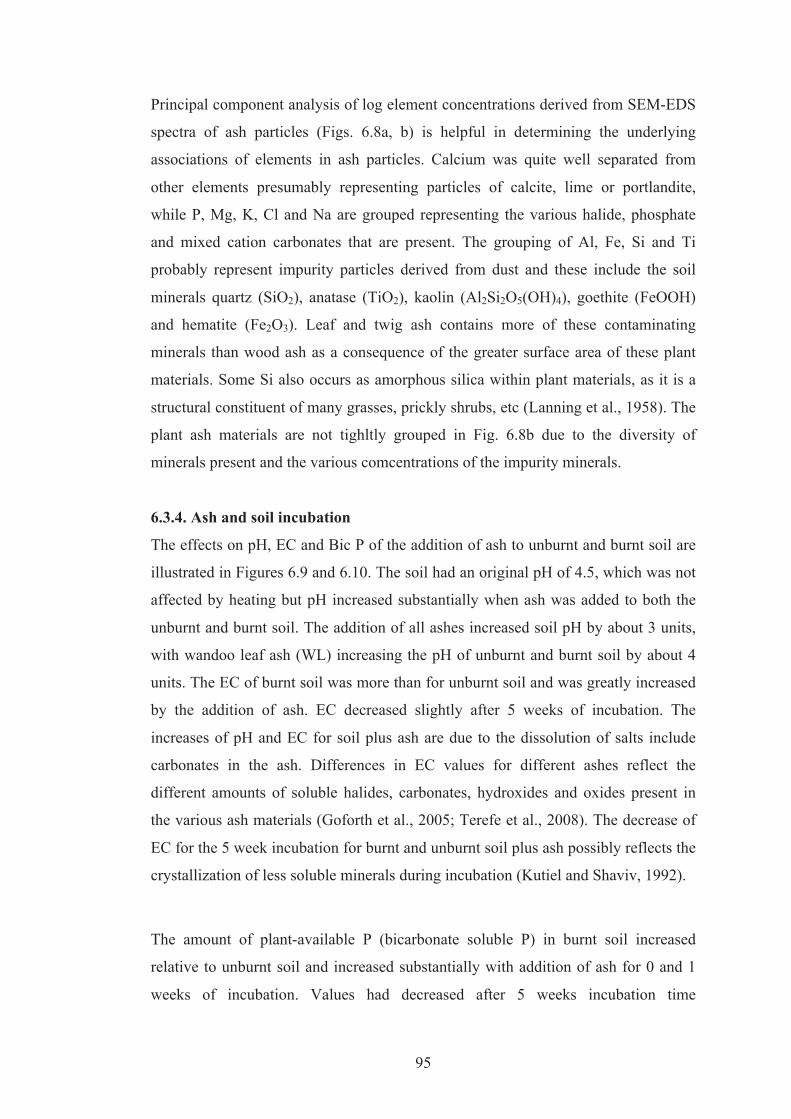
95
Principal component analysis of log element concentrations derived from SEM-EDS
spectra of ash particles (Figs. 6.8a, b) is helpful in determining the underlying
associations of elements in ash particles. Calcium was quite well separated from
other elements presumably representing particles of calcite, lime or portlandite,
while P, Mg, K, Cl and Na are grouped representing the various halide, phosphate
and mixed cation carbonates that are present. The grouping of Al, Fe, Si and Ti
probably represent impurity particles derived from dust and these include the soil
minerals quartz (SiO2), anatase (TiO2), kaolin (Al2Si2O5(OH)4), goethite (FeOOH)
and hematite (Fe2O3). Leaf and twig ash contains more of these contaminating
minerals than wood ash as a consequence of the greater surface area of these plant
materials. Some Si also occurs as amorphous silica within plant materials, as it is a
structural constituent of many grasses, prickly shrubs, etc (Lanning et al., 1958). The
plant ash materials are not tighltly grouped in Fig. 6.8b due to the diversity of
minerals present and the various comcentrations of the impurity minerals.
6.3.4. Ash and soil incubation
The effects on pH, EC and Bic P of the addition of ash to unburnt and burnt soil are
illustrated in Figures 6.9 and 6.10. The soil had an original pH of 4.5, which was not
affected by heating but pH increased substantially when ash was added to both the
unburnt and burnt soil. The addition of all ashes increased soil pH by about 3 units,
with wandoo leaf ash (WL) increasing the pH of unburnt and burnt soil by about 4
units. The EC of burnt soil was more than for unburnt soil and was greatly increased
by the addition of ash. EC decreased slightly after 5 weeks of incubation. The
increases of pH and EC for soil plus ash are due to the dissolution of salts include
carbonates in the ash. Differences in EC values for different ashes reflect the
different amounts of soluble halides, carbonates, hydroxides and oxides present in
the various ash materials (Goforth et al., 2005; Terefe et al., 2008). The decrease of
EC for the 5 week incubation for burnt and unburnt soil plus ash possibly reflects the
crystallization of less soluble minerals during incubation (Kutiel and Shaviv, 1992).
The amount of plant-available P (bicarbonate soluble P) in burnt soil increased
relative to unburnt soil and increased substantially with addition of ash for 0 and 1
weeks of incubation. Values had decreased after 5 weeks incubation time
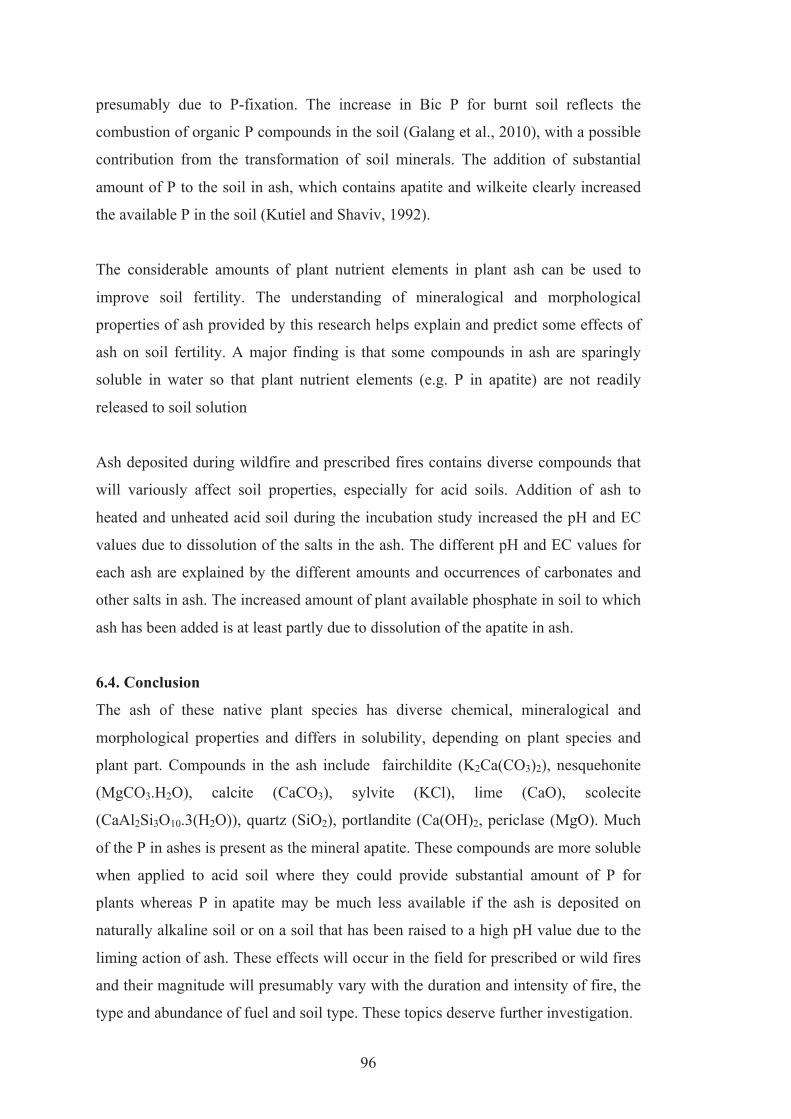
96
presumably due to P-fixation. The increase in Bic P for burnt soil reflects the
combustion of organic P compounds in the soil (Galang et al., 2010), with a possible
contribution from the transformation of soil minerals. The addition of substantial
amount of P to the soil in ash, which contains apatite and wilkeite clearly increased
the available P in the soil (Kutiel and Shaviv, 1992).
The considerable amounts of plant nutrient elements in plant ash can be used to
improve soil fertility. The understanding of mineralogical and morphological
properties of ash provided by this research helps explain and predict some effects of
ash on soil fertility. A major finding is that some compounds in ash are sparingly
soluble in water so that plant nutrient elements (e.g. P in apatite) are not readily
released to soil solution
Ash deposited during wildfire and prescribed fires contains diverse compounds that
will variously affect soil properties, especially for acid soils. Addition of ash to
heated and unheated acid soil during the incubation study increased the pH and EC
values due to dissolution of the salts in the ash. The different pH and EC values for
each ash are explained by the different amounts and occurrences of carbonates and
other salts in ash. The increased amount of plant available phosphate in soil to which
ash has been added is at least partly due to dissolution of the apatite in ash.
6.4. Conclusion
The ash of these native plant species has diverse chemical, mineralogical and
morphological properties and differs in solubility, depending on plant species and
plant part. Compounds in the ash include fairchildite (K2Ca(CO3)2), nesquehonite
(MgCO3.H2O), calcite (CaCO3), sylvite (KCl), lime (CaO), scolecite
(CaAl2Si3O10.3(H2O)), quartz (SiO2), portlandite (Ca(OH)2, periclase (MgO). Much
of the P in ashes is present as the mineral apatite. These compounds are more soluble
when applied to acid soil where they could provide substantial amount of P for
plants whereas P in apatite may be much less available if the ash is deposited on
naturally alkaline soil or on a soil that has been raised to a high pH value due to the
liming action of ash. These effects will occur in the field for prescribed or wild fires
and their magnitude will presumably vary with the duration and intensity of fire, the
type and abundance of fuel and soil type. These topics deserve further investigation.
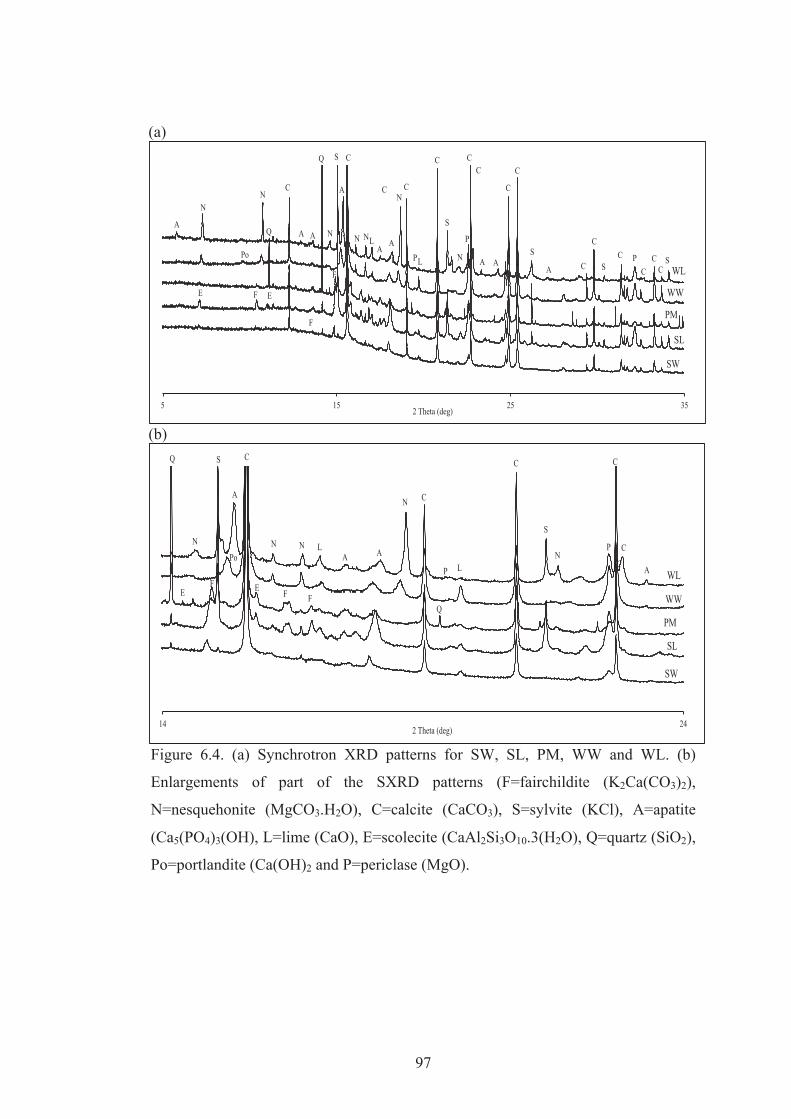
97
(a)
5 15 25 35 2 Theta (deg)
N
C
N
SW
F
N
S
A
L N
F
C
L
N
S
P L
C
C Q
Po
C
C N
C
A N A S
A
C
C
SL
PM
WW
WL
A
Q A
A A
C P
C C
S C
C C S
P A
E
F
E
(b)
14 24 2 Theta (deg)
N
C
N
SW
F
N
S
L
F
P L
Q
Po
C
P
N
A
S
N
Q
C
SL
PM
WW
WL
A
A A
C
C
C
E F E
Figure 6.4. (a) Synchrotron XRD patterns for SW, SL, PM, WW and WL. (b)
Enlargements of part of the SXRD patterns (F=fairchildite (K2Ca(CO3)2),
N=nesquehonite (MgCO3.H2O), C=calcite (CaCO3), S=sylvite (KCl), A=apatite
(Ca5(PO4)3(OH), L=lime (CaO), E=scolecite (CaAl2Si3O10.3(H2O), Q=quartz (SiO2),
Po=portlandite (Ca(OH)2 and P=periclase (MgO).
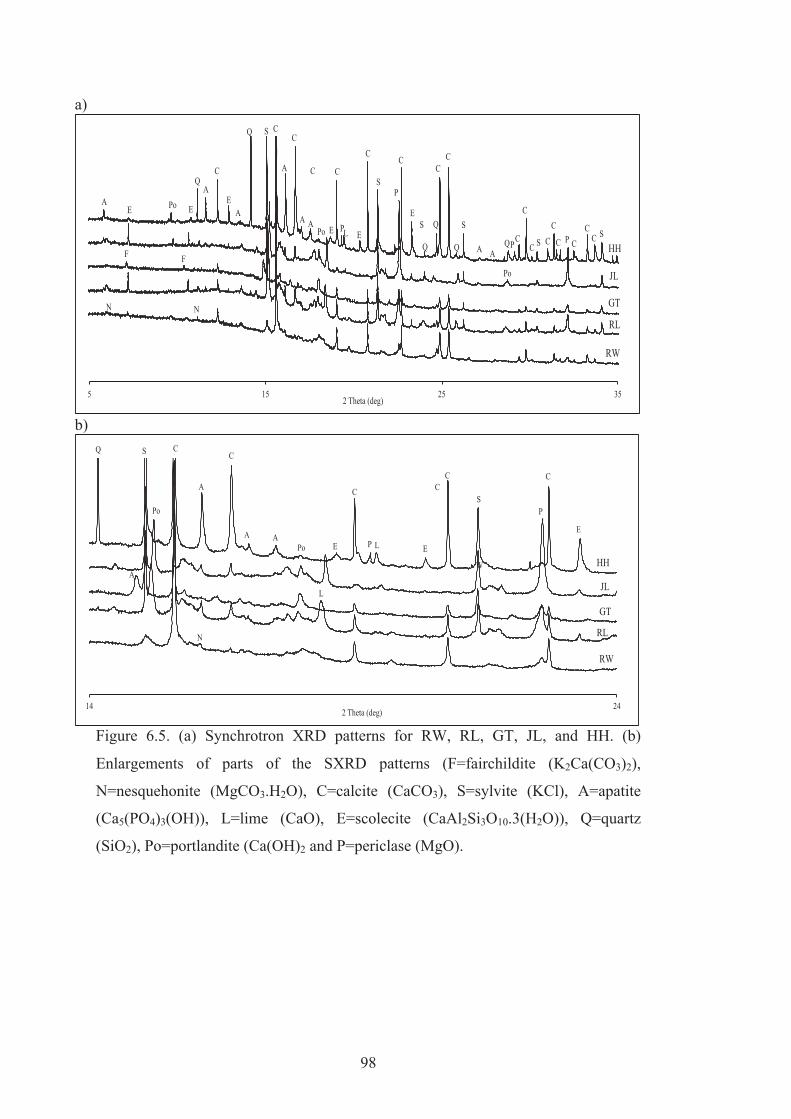
98
a)
5 15 25 35 2 Theta (deg)
E
C
E
RW
A
S
A
A
C
N
C
E
S
Po
C Q
Po
C
C
P
E
C
Q A
S S
C
P
RL
GT
JL
HH
Q
E
A P
Po
P
C
C C C C
A
F
A
N
L E
A Q Q
C S C
C
C C S
Q
F
b)
14 24 2 Theta (deg)
C
RW
A
S C
E Po
Q
L
C
P E
C
W
S C
RL
GT
JL
HH
L
P
A
A
A
N
E
C
Po
Figure 6.5. (a) Synchrotron XRD patterns for RW, RL, GT, JL, and HH. (b)
Enlargements of parts of the SXRD patterns (F=fairchildite (K2Ca(CO3)2),
N=nesquehonite (MgCO3.H2O), C=calcite (CaCO3), S=sylvite (KCl), A=apatite
(Ca5(PO4)3(OH)), L=lime (CaO), E=scolecite (CaAl2Si3O10.3(H2O)), Q=quartz
(SiO2), Po=portlandite (Ca(OH)2 and P=periclase (MgO).

99
SW
SW enlarged grain
SW analysed grain
1 3 5 7 Energy (keV)
Ca
K Mg
P
Mg = 7.5% P = 0.96% K = 4.7% Ca = 19.18%
SL
SL enlarged grain
SL analysed grain
1 3 5 7 Energy (keV)
Cl Ca
K
Mg P
Mg = 3.45% P = 2.48% Cl = 7.58% K = 24.28% Ca = 18.87%
PM
PM enlarged grain
PM analysed grain
1 3 5 7 Energy (keV)
Ca K
Cl
P
Mg Mg = 17.61% Al = 0.18% Si = 0.25% P = 2.76% Cl = 7.37% K = 11.9% Ca = 10.87%
Al Si
WW
WW enlarged grain
WW analysed grain
1 3 5 7 Energy (keV)
Ca K
Cl Si
Mg
P
Mg = 12.02% Si = 0.59% P = 0.83% Cl = 0.22% K = 0.64% Ca = 4.19%
WL
WL enlarged grain
WL analysed grain
1 3 5 7 Energy (keV)
Ca K
Cl S P
Si
Mg
Mg = 12.95% Si = 0.94% P = 2.02% Cl = 4.24% K = 6.55% Ca = 9.61%
Figure 6.6. Scanning electron micrograph (SEM) and X-ray spectra of the indicated ash
particles for SW, SL, PM, WW and WL ash. Calcite crystals (CaCO3), microcrystalline
hydroxyl apatite and mixed potassium, magnesium and calcium salts are present.

100
RW
RW enlarged grain
RW analysed grain
1 3 5 7 Energy (keV)
Ca K
Cl P
Mg
Mg = 5.74% P = 1.07% Cl = 0.51% K = 8.02% Ca = 7.57%
RL
RL enlarged grain
RL analysed grain
1 3 5 7 Energy (keV)
Ca
K
Cl P Mg
Mg = 6.22% P = 3.22% Cl = 2.8% K = 17.3% Ca = 12.9%
GT
GT enlarged grain
GT analysed grain
1 3 5 7 Energy (keV)
Ca
K
Cl P Si
Mg
Mg = 5.72% Si = 1.76% P = 2.95% Cl = 4.28% K = 17.62% Ca = 12.86%
JL
JL enlarged grain
JL analysed grain
1 3 5 7 Energy (keV)
Ca
K
Cl P
Si Al
Mg
Mg = 4.45% Al = 6.34% Si = 3.24% P = 1.36% Cl = 0.67% K = 5.6% Ca = 14.28%
HH
HH enlarged grain
HH analysed grain
1 3 5 7 Energy (keV)
Fe
Ca K
Cl P
Si
Al Al = 10.67% Si = 3.23% P = 0.6% Cl = 2.79% K = 6.41% Ca = 8.67% Fe = 4.27%
Figure 6.7. Scanning electron micrograph (SEM) and X-ray spectra of the indicated ash
particles for RW, RL, GT, JL, and HH ash. Calcite crystals (CaCO3), microcrystalline hydroxyl
apatite and mixed potassium, magnesium and calcium salts are present.

101
a)
Na
Mg
Al
Si
P
Cl
K
Ca
Ti Fe
-1.0 -0.5 0.0 0.5 1.0
Factor 1 : 33.99%
-1.0
-0.5
0.0
0.5
1.0
Facto
r 2 :
21.9
1%
Na
Mg
Al
Si
P
Cl
K
Ca
Ti Fe
Calcite
Possible Soil Contamination
Other Salts(Ca also present but minor)
b)
SW SL PM GT RL JL HH WL RW WW-8 -6 -4 -2 0 2 4 6 8
Factor 1: 33.99%
-8
-6
-4
-2
0
2
4
6
8
Fact
or 2
: 21.
91%
Figure 6.8. Principal component analyses of log SEM EDS elemental analyses
results for native plant ash particles. Variables (a) and plant material (b). Silver
wattle wood (SW), silver wattle leaf (SL), prickly moses leaf and twig (PM),
wandoo wood (WW), wandoo leaf (WL), red gum wood (RW), red gum leaf (RL),
grass tree leaf (GT), jarrah leaf (JL), and harsh hakea leaf and twig (HH).

102
0
1
2
3
4
5
6
7
8
9
10
0 1 5
pH
Incubation Time (week)
pH Unburnt (a)
Control SW SL PM WW WL RW RL GT JL HH
0
20
40
60
80
100
120
140
0 1 5
EC (μ
S/cm
)
Incubation Time (week)
EC Unburnt (b)
Control SW SL PM WW WL RW RL GT JL HH
-10
0
10
20
30
40
50
0 1 5
Bic P
(mg/k
g)
Incubation Time (week)
Bic P Unburnt (c)
Control SW SL PM WW WL RW RL GT JL HH
Figure 6.9. Mean (n=3) values with standard error bars of pH (a), EC (b) and bicarbonate P (c) for unburnt soil incubated with native plant ash. Silver wattle wood (SW), silver wattle leaf (SL), prickly moses leaf and twig (PM), wandoo wood (WW), wandoo leaf (WL), red gum wood (RW), red gum leaf (RL), grass tree leaf (GT), jarrah leaf (JL), and harsh hakea leaf and twig (HH).

103
0
1
2
3
4
5
6
7
8
9
10
0 1 5
pH
Incubation Time (week)
pH Burnt (a)
Control SW SL PM WW WL RW RL GT JLA HH
0
20
40
60
80
100
120
140
160
0 1 5
EC (μ
S/cm)
Incubation Time (week)
EC Burnt (b)
Control SW SL PM WW WL RW RL GT JL HH
-10
0
10
20
30
40
50
60
0 1 5
Bic P
(mg/k
g)
Incubation Time (week)
Bic P Burnt (c)
Control SW SL PM WW WL RW RL GT JL HH
Figure 6.10. Mean (n=3) values with standard error bars of pH (a), EC (b) and bicarbonate P (c) for burnt soil incubated with native plant ash. Silver wattle wood (SW), silver wattle leaf (SL), prickly moses leaf and twig (PM), wandoo wood (WW), wandoo leaf (WL), red gum wood (RW), red gum leaf (RL), grass tree leaf (GT), jarrah leaf (JL), and harsh hakea leaf and twig (HH).

104
Chapter 7
7.0 General Summary, Limitations and Future Work
7.1 Introduction
A main objective of the study as stated in the general introduction was to
investigated changes in soil and ash properties due to heating: these properties
include chemistry, mineralogy and morphology and include changes that may affect
plant growth in forests after a fire has occured. Several studies were conducted
including:
• dehydration (dehydroxylation) and subsequent rehydration of the three soil
minerals (gibbsite, kaolinite and goethite) that are most commonly and
severely affected by heating during natural fires. Significant changes in
mineral properties were discovered and the environmental significance of
these changes has been considered.
• a glasshouse study assessing the impacts of soil heating on the availability of
native and added phosphate for a lateritic soil.
• a field study of soil mineralogy and chemistry immediately after a bushfire at
Wundowie, Darling Range, Western Australia
• a thorough chemical, mineralogical and morphological investigation of ash
derived from several Australian native plant species. The reactions of ash
with unheated and heated soil were also considered.
Many studies have been conducted on the effect of fire on soil properties and have
focussed variously on nutrient availability, pH and EC, organic matter content,
texture, structural stability, cation exchange capacity, water repellence and soil
erosion immediately after fire (Raison et al., 1979; Khanna and Raison, 1986;
Etiegni and Campbell, 1991; Ulery et al., 1993; Iglesias et al., 1997; Neary et al.,
1999; Goforth et al., 2005; Cerdá and Doerr, 2008; Galang et al., 2010; Pereira et al.,
2011). There have been few prior studies on the chemistry, mineralogy and
morphology of heated soil and plant ash which are addressed in this thesis. Past
studies highlight the complexity of the effects of fire on soil properties but have not
focussed on the detail of the processes that change morphological, mineralogical and
chemical properties of soil and consequently the growth of plants, land stability, etc.
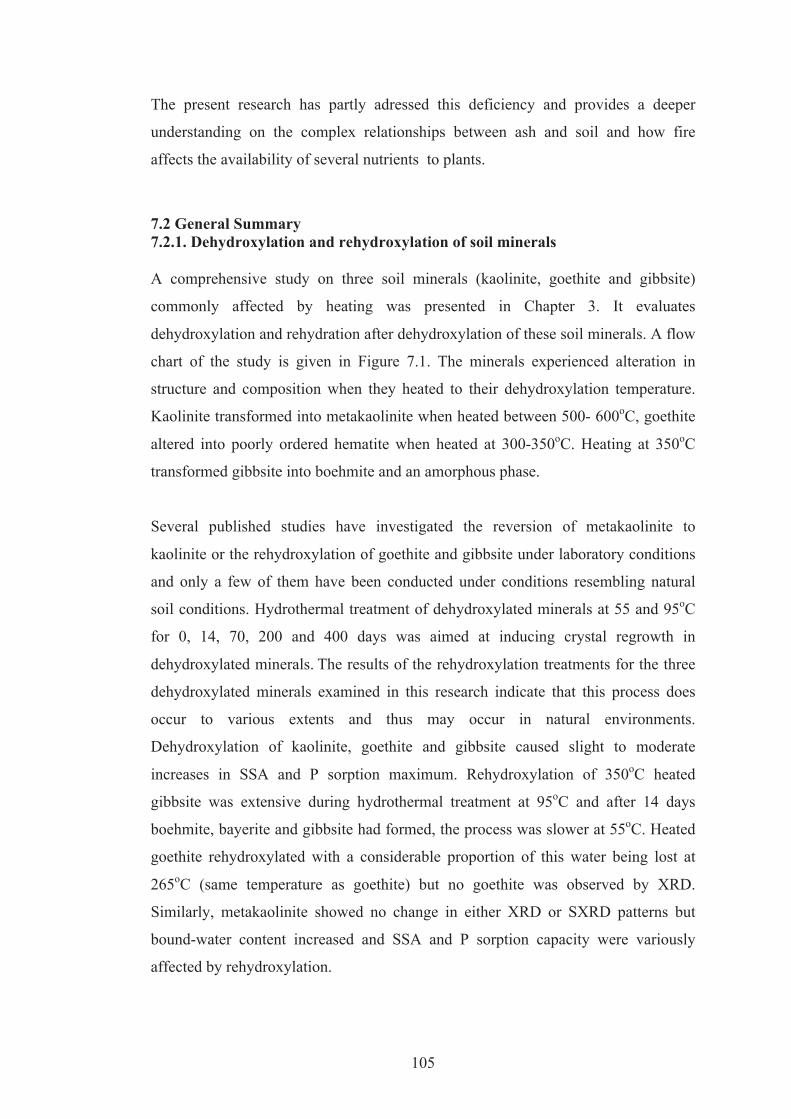
105
The present research has partly adressed this deficiency and provides a deeper
understanding on the complex relationships between ash and soil and how fire
affects the availability of several nutrients to plants.
7.2 General Summary 7.2.1. Dehydroxylation and rehydroxylation of soil minerals A comprehensive study on three soil minerals (kaolinite, goethite and gibbsite)
commonly affected by heating was presented in Chapter 3. It evaluates
dehydroxylation and rehydration after dehydroxylation of these soil minerals. A flow
chart of the study is given in Figure 7.1. The minerals experienced alteration in
structure and composition when they heated to their dehydroxylation temperature.
Kaolinite transformed into metakaolinite when heated between 500- 600oC, goethite
altered into poorly ordered hematite when heated at 300-350oC. Heating at 350oC
transformed gibbsite into boehmite and an amorphous phase.
Several published studies have investigated the reversion of metakaolinite to
kaolinite or the rehydroxylation of goethite and gibbsite under laboratory conditions
and only a few of them have been conducted under conditions resembling natural
soil conditions. Hydrothermal treatment of dehydroxylated minerals at 55 and 95oC
for 0, 14, 70, 200 and 400 days was aimed at inducing crystal regrowth in
dehydroxylated minerals. The results of the rehydroxylation treatments for the three
dehydroxylated minerals examined in this research indicate that this process does
occur to various extents and thus may occur in natural environments.
Dehydroxylation of kaolinite, goethite and gibbsite caused slight to moderate
increases in SSA and P sorption maximum. Rehydroxylation of 350oC heated
gibbsite was extensive during hydrothermal treatment at 95oC and after 14 days
boehmite, bayerite and gibbsite had formed, the process was slower at 55oC. Heated
goethite rehydroxylated with a considerable proportion of this water being lost at
265oC (same temperature as goethite) but no goethite was observed by XRD.
Similarly, metakaolinite showed no change in either XRD or SXRD patterns but
bound-water content increased and SSA and P sorption capacity were variously
affected by rehydroxylation.
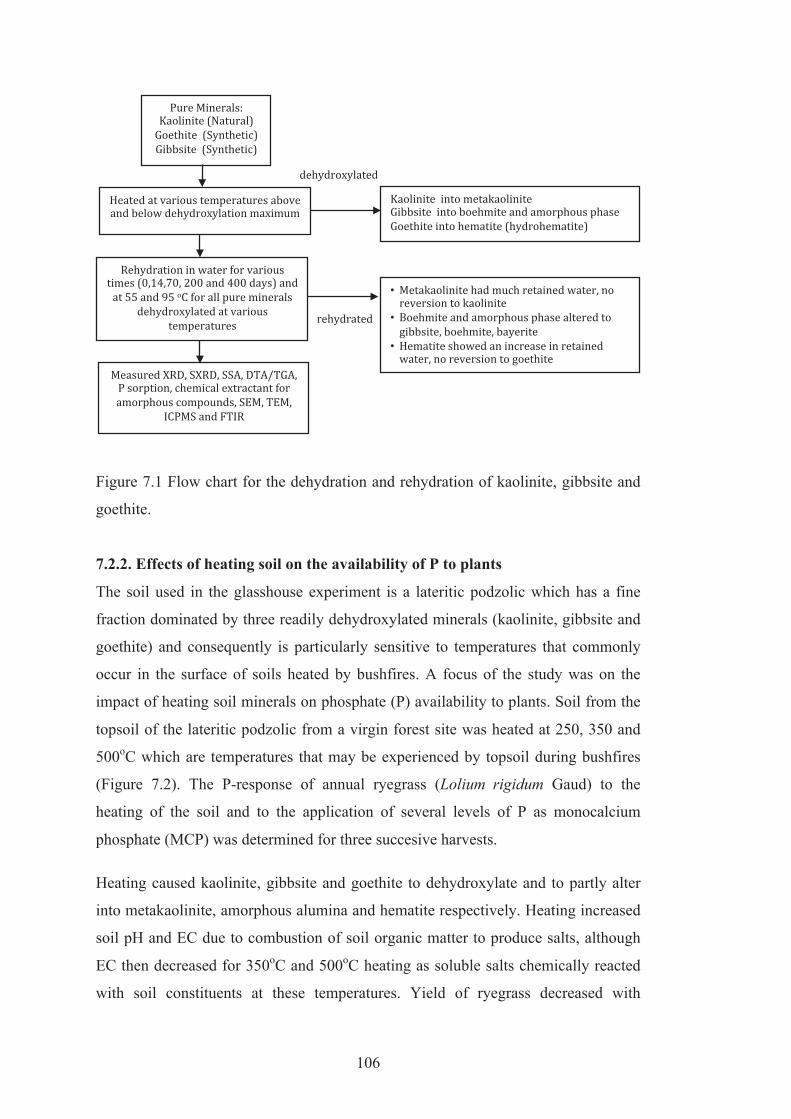
106
•
•
•
Figure 7.1 Flow chart for the dehydration and rehydration of kaolinite, gibbsite and
goethite.
7.2.2. Effects of heating soil on the availability of P to plants
The soil used in the glasshouse experiment is a lateritic podzolic which has a fine
fraction dominated by three readily dehydroxylated minerals (kaolinite, gibbsite and
goethite) and consequently is particularly sensitive to temperatures that commonly
occur in the surface of soils heated by bushfires. A focus of the study was on the
impact of heating soil minerals on phosphate (P) availability to plants. Soil from the
topsoil of the lateritic podzolic from a virgin forest site was heated at 250, 350 and
500oC which are temperatures that may be experienced by topsoil during bushfires
(Figure 7.2). The P-response of annual ryegrass (Lolium rigidum Gaud) to the
heating of the soil and to the application of several levels of P as monocalcium
phosphate (MCP) was determined for three succesive harvests.
Heating caused kaolinite, gibbsite and goethite to dehydroxylate and to partly alter
into metakaolinite, amorphous alumina and hematite respectively. Heating increased
soil pH and EC due to combustion of soil organic matter to produce salts, although
EC then decreased for 350oC and 500oC heating as soluble salts chemically reacted
with soil constituents at these temperatures. Yield of ryegrass decreased with

107
increasing temperature of heating for unfertilized soil and for heated soils supplied
with P fertilizer. The P concentration in ryegrass for each of three harvests ranged
from 0.03% to 0.3% and decreased in the same sequence as for yield (i.e unheated
soil>250oC>350oC>500oC heated soil). Heating the soil increased Bic-P and had
little effect on the retention of added P as indicated by bicarbonate extraction.
Heating the soil at 500oC greatly increased amounts of reactive Si and Al in the soil
due to the formation of metakaolinite and amorphous alumina, which are highly
reactive compounds, which are presumably responsible for the reduced effectiveness
of the added P fertilizers. Clearly heating of soil by bushfires can reduce the
availability to plants of native and added soil phosphate and forest managers should
be aware of this process.
•
• •
Figure 7.2. Flow chart for the glasshouse study conducted on heated lateritic soil.
7.2.3. The properties of soil heated in bushfire
Heating of soil during a fire, which burns abundant surface litter and fallen timber,
can raise surface soil temperature to 500oC or more and may significantly impact on
soil properties. Several soil minerals are likely to be affected by heating in natural
and managed fires. The effects of soil heating on the mineralogy of soil have not
been extensively studied although quite modest (250oC and above) temperatures

108
affect minerals. Kaolinite decomposes at temperatures between 450oC and 600oC
losing lattice water and forms metakaolinite. Gibbsite alters to an amorphous phase
and boehmite on heating at ≈200oC, and goethite is transformed to a disordered
mineral known as hydro-hematite at ≈300oC. The possibility that these
dehydroxylated compounds persist in soils heated in bush fires has received little
attention and this investigation was aimed at providing additional understanding of
the behaviour of hydroxylated soil minerals heated in a bushfire.
Samples were collected the day after a bushfire at Wundowie in the Darling Range,
Western Australia in early March 2009. Samples were removed as a 1cm thick soil
layer from under burnt Eucalyptus and grass tree (Xanthorrhoea pressii) logs from
up-slope and down slope sites in a lateritic colluvium catena. The soils are very
gravelly and were sieved to obtain the <2mm fraction for analysis (Figure 7.3).
Conventional and synchrotron XRD patterns of heated and unheated soil samples
from the Wundowie bushfire site show the effect of fire on soil minerals. The main
crystalline compounds of unheated soil are quartz, kaolinite, gibbsite and goethite.
The XRD patterns of heated soil show that kaolinite had dehydroxylated to form
metakaolinite, gibbsite had altered into an amorphous phase, while goethite had
transformed into hematite (hydrohematite) but quartz was unaltered. The bushfire
added calcite in plant ash to the soil. The addition of ash during the fire considerably
increased the pH of all soil samples. Soil EC values for the heated soil also being
considerably higher than for unburnt soil. The increases in EC simply reflect the
addition to the soil of soluble salts in plant ash. Heating had increased amounts of
extractable Al, Fe and Si due to crystalline minerals becoming amorphous or poorly
ordered. Clearly dehydroxylated minerals and possibly their rehydroxylated forms
must be present in naturally heated soils and may exert significant effects on the
chemical behaviour of the soil.
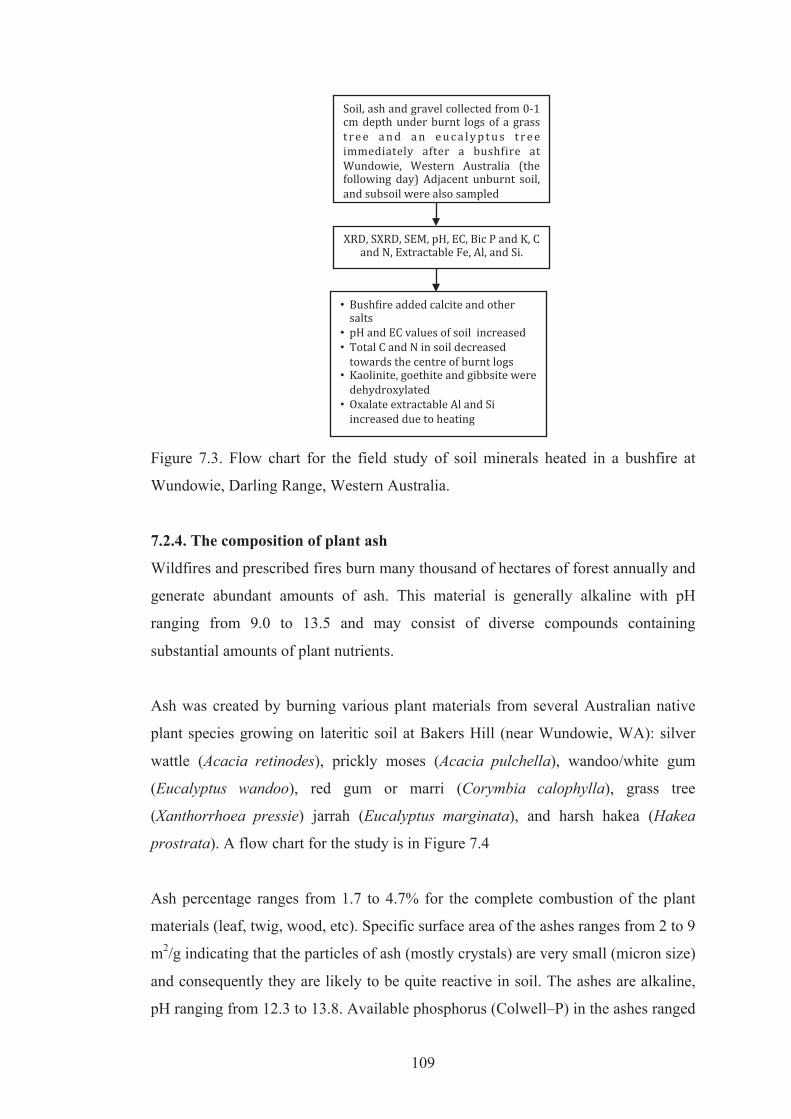
109
•
• •
•
•
Figure 7.3. Flow chart for the field study of soil minerals heated in a bushfire at
Wundowie, Darling Range, Western Australia.
7.2.4. The composition of plant ash
Wildfires and prescribed fires burn many thousand of hectares of forest annually and
generate abundant amounts of ash. This material is generally alkaline with pH
ranging from 9.0 to 13.5 and may consist of diverse compounds containing
substantial amounts of plant nutrients.
Ash was created by burning various plant materials from several Australian native
plant species growing on lateritic soil at Bakers Hill (near Wundowie, WA): silver
wattle (Acacia retinodes), prickly moses (Acacia pulchella), wandoo/white gum
(Eucalyptus wandoo), red gum or marri (Corymbia calophylla), grass tree
(Xanthorrhoea pressie) jarrah (Eucalyptus marginata), and harsh hakea (Hakea
prostrata). A flow chart for the study is in Figure 7.4
Ash percentage ranges from 1.7 to 4.7% for the complete combustion of the plant
materials (leaf, twig, wood, etc). Specific surface area of the ashes ranges from 2 to 9
m2/g indicating that the particles of ash (mostly crystals) are very small (micron size)
and consequently they are likely to be quite reactive in soil. The ashes are alkaline,
pH ranging from 12.3 to 13.8. Available phosphorus (Colwell–P) in the ashes ranged

110
from 30 to 199 mg/kg and EC values were high for all the ashes, indicating that the
ashes contain substantial amounts of soluble salts. Minerals present in the ashes
include calcite (CaCO3), fairchildite (K2Ca(CO3)2),, nesquehonite (MgCO3.H2O),
sylvite (KCl), lime (CaO), scolecite (CaAl2Si3O10.3(H2O)), quartz (SiO2) (derived
from dust), portlandite (Ca(OH)2), periclase (MgO), and apatite, probably
resembling hydroxyl-apatite (Ca5(PO4)3(OH)) and wilkeite (Ca5((P, S,
Si)O4)3(OH,CO3)). The amount of carbon was above 40% for all the raw plant
materials and significantly reduced to below 15% for their ashes where carbon was
mostly present as carbonates. Burning plants resulted in loss of most nitrogen with
low nitrogen concentrations in ash.
Scanning electron microscopy and associated X-ray spectra of particles in the ashes
show the diverse particle sizes, shapes and compositions present in these materials.
Apart from distinct calcite crystals, most grains seen in the micrographs are K and
Mg-rich aggregates often of sub-micron-size particles (the above mentioned
minerals) containing alkali elements and chlorine and commonly also containing a
little P, Fe and S. These results indicate the complex nature of ash, with a high
diversity in composition, shape and size of particles.
Addition of ash to heated and unheated soil increased the pH and EC values due to
dissolution of the salts in the ash. The different pH and EC values for each ash can
be explained by the diverse amounts and occurences of carbonates and other salts in
ash. The increased amount of plant available phosphate in soil to which ash has been
added is at least partly due to dissolution of the apatite and possibly wilkeite present
in ash.

111
•
•
Figure 7.4. Flow chart for the Australian native plants ash study.
7.3 Limitations to this research and suggested future work
This research has contributed to understanding relationships between the chemical,
mineralogical and morphological properties of heated soil, the nature of ash and P
availability to plants for soils affected by bushfire. The research has shown how a
knowledge of soil and ash materials may allow us to explain and predict some
effects of fire on soils. However, there are several limitations to this work and
further research is needed, as follows:
1) The study of soil materials focused on laboratory, glasshouse and field work
shortly after a bushfire or laboratory heating; there is a need to extend the
study to several years after the bushfire or heating to determine the
persistence of the various effects on soils and minerals described in this
thesis.
2) Kaolinite, goethite and gibbsite in natural soil have been shown to be affected
by heating during a bushfire. Additional soil minerals may also be sensitive
to heating such as the hydroxylated and hydrated minerals: allophane,
halloysite, lepidicrocite and gypsum. The various soil carbonate minerals
(calcite, dolomite, magnesite) may lose carbon dioxide if heated to a
sufficient temperatures (>800oC)

112
3) Minerals in ash were studied using chemical analysis, XRD, SXRD and
SEM. Because particles of ash are often very small (<1μm) and they occur in
aggregates, further work is required to characterise single crystals in ash.
This can be achieved using a combination of TEM EDS, electron
diffraction/lattice imaging and EELS although specimen preparation of these
materials for TEM will be difficult.
4) Ryegrass was used in the glasshouse experiment to assess the impacts of
addition of ash on phosphate uptake by plants from soil. In the field, the fate
of plant nutrients in ash is likely to be more complex than simulated in this
experiment and will reflect several interacting properties and processes in the
ash-soil-plant continuum. For example, the availability of element (e.g. Ca)
in ash to plants will depend (inter alia) on:
• the chemical form of Ca (which minerals) in the ash
• the particle size of these minerals
• the extent to which these minerals are protected from dissolution by
the presence of other ash constituents through occlusion, elevated pH
due to carbonates, etc
• the reaction of dissolved Ca (possibly as a complex with CO3 or other
anion) with reactive heated minerals (e.g. adsorption and possibly
specific sorption (chemisorption)
• the location of Ca in ash at the soil surface where direct contact with
subsurface roots and their exudates will be limited.

113
Chapter 8 8.0 Publications from this thesis
8.1. Conferences Publications
Yusiharni, E., Gilkes, R.J., 2009. Rehydroxylation of heated gibbsite, kaolinite and
goethite: an assesment of properties and environmental significance. Proceedings,
XIV International Clay Conference, June 14-20, 2009 Castellaneta Marina, Italy.
pp:545-545
Yusiharni, E., Gilkes, R.J. 2009. Investigating the effects of bushfire on soil minerals
using thermal analysis. Proceedings, The Asian Conference on Thermal Analysis and
Applications, December 17-18, 2009 Bangkok, Thailand. pp: 115-119
Yusiharni, E., Gilkes, R.J., 2010. Do soil minerals recover after they are damaged by
bushfires? Proceedings, The 19th World Congress of Soil Science (WCSS) August
1-6, 2010, Brisbane, Queensland, Australia. pp:104-107
Yusiharni, E., Gilkes, R.J., 2010. Do dehydroxylated gibbsite, kaolinite and goethite
rehydroxylate? Proceedings, Australian Clay Minerals Society’s 21st Conference
August 7-8, 2010, Brisbane, Queensland, Australia. pp: 131-134
Gilkes, R.J., Yusiharni, E., 2011. The effects of heating a lateritic podzolic soil on
soil phosphate availability, a glasshouse study? Proceedings, III International
Meeting of Fire Effects on Soil Properties, March 15-19, 2011, University of
Minho, Guimaraes, Portugal. pp: 44-44
Yusiharni, E., Gilkes, R.J., 2011. Mineralogical and chemical changes in a lateritic
soil due to a bushfire in the Darling Range, Western Australia. Proceeding, III
International Meeting of Fire Effects on Soil Properties (15-19 March 2011),
University of Minho, Guimaraes, Portugal. pp: 49-49
114
8.2. Journal Publications
Yusiharni, E., Gilkes, R.J., 2012. Rehydration of heated gibbsite, kaolinite and
goethite: an assessment of properties and environmental significance. Applied Clay
Science (In press, Corrected Proof, Available online 25 January 2012 ).
http://dx.doi.org/10.1016/j.clay.2011.12.005
Yusiharni, E., Gilkes, R.J., 2012. Short term effects of heating a lateritic podzolic
soil on the availability to plants of native and added phosphate. Geoderma (In press,
Corrected Proof, Available online 1 February 2012).
http://dx.doi.org/10.1016/j.geoderma.2012.01.002
Yusiharni, E., Gilkes, R.J., 2012. Changes in the mineralogy of a lateritic soil due to
a bushfire at Wundowie, Darling Range, Western Australia. Geoderma (In press,
Corrected Proof, Available online 2 March 2012).
http://dx.doi.org/10.1016/j.geoderma.2012.01.030
Yusiharni, E., Gilkes, R.J., 2012. Minerals in the ash of Australian native plants.
Geoderma (In Press).
8.3. Other Publications
Yusiharni, B. E., H. Ziadi., and Gilkes, R. J., 2007. A laboratory and glasshouse
evaluation of the byproducts; chicken litter ash, wood ash and iron smelting slag as
liming agents and P fertilizers. Aust. J. of Soil. Res. 45(5) 374–389.
Kuligowski, K., Gilkes, R.J., Poulsen, T.G., Yusiharni, B.E., 2010. The composition
and dissolution in citric extractants of ash from the thermal gasification of pig
manure. Chemical Engineering Journal 163, 1–9.
Kuligowski, K., Gilkes, R.J., Poulsen, T.G., Yusiharni, B.E., 2012. Ash from the
thermal gasification of pig manure - effects on ryegrass yield, element uptake and
soil properties. Soil Res. (In Press).

115
References
Anand, R.R., Gilkes, R.J., 1987. The association of maghemite and corundum in Darling Range laterites, Western Australia. Aust. J. Soil Res. 35, 303-311. Association of Official Agricultural Chemists, official methods of analysis, 15th ed., AOAC, Virginia, 1990. Atanassova, I., Teoharov, M., Ivanov, P., 2009. Characterisation of a fire affected catena sequence from Lyulin Mountain Bulgaria. Bulg. J. Agric. Sci. 15, 333-340. Australian Climate Extreme Fires, 2008. Fire. Accessed online at http://www.bom.gov.au/climate/c20thc/fire.shtml. 4 May 2008. Babushkin, V.I., Matveyev, G.W., Mchedlov-Petrossyan, O.P., 1985. Thermodynamics of Silicates. Springer, Berlin, pp. 165-167. Badĭa, D., Marti, C., 2003. Plant ash and heat intensity effects on chemical and physical properties of two contrasting soils. Arid Land Res. Manage. 17, 23-41. Barrow, N.J., 1978. The description of phosphate adsorption curves. J. Soil Sci. 29, 447-462. Bauhus, J., Khanna, P.K., Raison, R.J., 1993. The effect of fire on carbon and nitrogen mineralization and nitrification in an Australian forest soil. Aust. J. Soil Res. 31, 621–639. Binkley, D., D, R., David, M. B., Caldwell, B., 1992. Soil chemistry in a loblolly/longleaf pine forest with interval burning. Ecol. Applic. 2, 157-164. Bodí, M.B., Mataix-Solera, J., Doerr, S.H., Cerdá, A., 2011. The wettability of ash from burned vegetation and its relationship to Mediterranean plant species type, burn severity and total organic carbon content. Geoderma 160, 599-607. Bokhimi, X., Sanchez-Valente, J., Pedraza, F., 2002. Crystallization of sel-gel boehmite via hydrothermal annealing. J. Solid State Chem. 166: 182-190. Brown, J. K., Smith J.K., 2000. Wildland fire in ecosystems: effects of fire on flora. Gen. Tech. Rep. RMRS_GTR-42. Ogden, Utah, US. Department of Agriculture, Forest service, Rocky Mountain Station: 257pp. Bureau of Meteorology, 2011. http://www.bom.gov.au/wa. Burrows, N.D., 2008. Linking fire ecology and fire management in south-west Australian forest landscapes. Forest Fire Manage. 255, 2394-2406 Byram, G.M., 1959. Combustion of forest fuels. In: Forest fire: Control and use. K. P. Davis (Ed). New York, McGraw-Hill: 61-89.

116
Cadwell, T. G, Johnson, D. W., Miller, W. W., Qualls, R.G., 2002. Forest floor carbon and nitrogen losses due to prescription fire. Soil Sci. Soc. Am. J. 66, 262-267. Cerdá, A., Doerr, S.H., 2008. The effect of ash and needle cover on surface runoff and erosion in the immediate post-fire period. Catena 74, 256-263. Certini, G., 2005. Effects of fire on properties of forest soils: a review. Oecologia 143, 1-10. Chandler, C., Cheney, P., Thomas, L., Trabaud, L., Willimas, D., 1983. Fire in forestry. Vol. 1. Forest fire behaviour and effects. John Wiley & Sons, New York. Cheney, N.P., 1981. Fire behaviour. In: Fire and the Australian biota. A. M. Gill, R. H. Groves and I. R. Noble (Eds). Canberra, Australian Academy of Science. Choromanska, U., DeLuca, T.H., 2001. Prescribed fire alters the impact of wildfire on soil biochemical properties in a Ponderosa Pine Forest. Soil Sci. Soc. Am. J. 65, 232-238. Christensen, N.L., 1994. The effects of fire on physical and chemical properties of soils in Mediterranean climate shrublands. In. The role of fire in Mediterranean type ecosystems. J. M. Moreno and W. C. Oechel (Eds). New York, USA, Springer-Verlag: 79-95. Clapham, W. M., and Zibilske, L. M., 1992, Wood ash as a liming amendment, Commun., Soil Sci. Plant Anal. 23, 1209-1227. Colwell, J.D., 1963. The estimation of the phosphorus fertilizer requirements of wheat in southern New South Wales by soil analysis. Aust. J. Exp. Agric. Animal Husbandry. 3, 190-197. Cornell, R.M., Schwertmann, U., 1996. The iron oxides: Structure, properties, reactions, occurence and uses. Berlin, VCH Weinheim. Cotton, F.A., Wilkinson, G., 1988. Advanced inorganic chemistry. 5th edn. Wiley, New York. DeBano, L.F., Klopatek, J.M., 1988. Phosphorus dynamics of Pinyon-Juniper soils following simulated burning. Soil Sci. Soc. Am. J. 52, 271-277. De Faria, D.L.A., Lopes, F.N., 2007. Heated goethite and natural hematite: Can Raman spectroscopy be used to differentiate them? Vibrational Spectroscopy. 45, 117-121. Demeyer, A., Voundi Nkana, J.C., Verloo, M.G., 2001. Characteristics of wood ash and influence on soil properties and nutrient uptake: an overview. Bioresour. Technol. 77, 287-295.

117
Durán, J., Rodrĭguez, A., Fernández-Palacios, J.M., Gallardo, A. Changes in soil N and P availability in a Pinus canariensis fire chronosequence. For. Ecol. Manag. 256, 384-387. Eckmeier, E., Egli, M., Schmidt, M.W.I., Schlumpf, N., Nötzli, M., Minikus-Stary, N., Hagedorn, F., 2010. Preservation of fire-derived carbon compounds and sorptive stabilisation promote the accumulation of organic matter in black soils of the Southern Alps. Geoderma, 159, 147-155. Eggleton, R. A., Taylor, G. G., 2008. Impact of fire on the Weipa Bauxite, northern Australia. Australian Journal of Earth Sciences, 55, S83-S86. Etiegni, L., Campbell, A.G., 1991. Physical and chemical characteristics of wood ash. Bioresour. Technol. 37, 173-178. Etiegni, L., Campbell, A.G., Mahler, R.L., 1991. Evaluation of wood ash disposal on agricultural land. I. Potential as a soil additive and liming agent, Commun. Soil Sci. Plant Anal, 22, 243-256. Fan, H., Song, B., Li, Q., 2006. Thermal behavior of goethite during transformation to hematite. Materials Chemistry and Physics 98, 148-153. FAO, 2001. Global forest fire assesment 1999-2000. Rome, Food and Agriculture Organization of the United Nations, Forestry Department, Forest Resources Assessment Programme 55. Fernandez, I., Cabaneiro, A., Carballas, T., 1997. Organic matter changes immediately after a wildfire in an Atlantic forest soil: comparison with laboratory soil heating. Soil Biol. Biochem. 29, 1-11. Ferran, A., Delitti, W., Vallejo, V.R., 2005. Effects of fire reccurence in Quercus coccifera L. shrublands of the Valencia Region (Spain): II. plant and soil nutrients. Plant Ecology 177, 71-83. Ferran, A., Serrasolsas, I., and Valejo, V. R., 1991. Soil evolution after fire in Quercus ilex and Pinus halepensis forests. In A. Teller (Ed). Responses of forest ecosystems to environmental changes. Elsevier Applied Science, London. Flinn, D. W., Farrell, P.W., Stewart, H.T.L., Leitch, C.J., Hopmans, P., 1984. The effects of fire in eucalyptus forests on soils, nutrient cycling, tree growth, and catchment hydrology: A review with particular reference to fuel reduction burning. Res. Bran. Rep. 44pp. FRA, 2000. Global forest fire assessment. Forest Resources Assessment. Rome, Forestry Department, Food and Agriculture Organization of the United nations. FRA, 2010. Global forest fire assessment. Forest Resources Assessment. Main Report, Forestry Department, Food and Agriculture Organization of the United Nations paper 163, 340 pp.

118
Freund, F., 1974. Ceramics and thermal transformations of minerals. In: Farmer, V.C. (Ed), The Infrared Spectra of Minerals. Vol. Monograph 4. Mineralogical Society London, pp. 465-482. Frost, R.L., Horvarth, E., Mako, E., Kristof, J., Redey, A., 2003. Slow transformation of mechanically dehydroxylated kaolinite to kaolinite- an aged mechanochemically activated formamide-intercalated kaolinite study. Thermoch. Acta 408, 103-113. Gabet, E.J., Bookter, A., 2011. Physical, chemical and hydrological properties of Ponderosa pine ash. Int. J. Wildland Fire 20, 443-452. Gabet, E.J., Sternberg, P., 2008. The effects of vegetative ash on infiltration capacity, sediment transport, and the generation of progressively bulked debris flows. Geomorphology 101, 666-673. Galang, M.A., Markewitz, D., Morris, L.A., 2010. Soil phosphorous transformations under forest burning and laboratory heat treatments. Geoderma. 155, 1959-1970. Ghuman, B.S., Lal, R., 1989. Soil temperature effects of biomass burning in windrows after clearing a tropical rainforest. Field Crops Res. 22, 1-10. Giardina, C.P., Sandford Jr., R.L., Dockersmith, I.C., 2000. Changes in soil phosphorus and nitrogen during slash-and-burn clearing of a dry tropical forest. Soil.Sci.Amer.J. 64, 399-405. Gill, A.M., Moore, P.H.R., 1990. Fire intensities in eucalypt forests of south eastern Australia. International Conference on Forest Fire Research, Coimbra, Portugal. Goforth, B.R., Graham, R.C., Hubbert, K.R., Zanner, C.W., Minnich, R.A., 2005. Spatial distribution and properties of ash and thermally altered soils after high severity forest fire, southern California. Int. J. Wildland Fire 14, 343-354. González-Pérez, J.A., González-Vila, F.J., Almendros, G., Knicker H., 2004. The effect of fire on soil organic matter-a review. Environ. Int. 30, 855-870. Gonzalez, G., Sagarzazu, A., and Vilalba, R. (2000). Study of mechano-chemical transformation of goethite to hematite by TEM and XRD. Materials Research Bulletin, 35, 2295-2308 Grim, R., 1968.Clay mineralogy. New York, McGraw-Hill. Grim, R.E., Bradley, W.F., 1948. Rehydration and dehydration of the clay minerals: American Mineralogist 33, 50-59. Harper, R.J., Gilkes, R.J., Robson, A.D., 1982. Biocrystallization of quartz and calcium phosphates in plants- a re-examination of the evidence. Aust. J. Agric. Res 33, 565-571.
119
Haynes, K., Tibbits, A., Coates, L, Ganewatta, G., Handmer, J., McAneney, J., 2008. 100 years of Australian Civilian bushfire fatalities: exploring the trends in relation to the ’stay or go’ policy. Report prepared for the Bushfire Co-operative Research Centre, Risk Frontiers, Sydney, Australia. Holden, J., 2005. An introduction to physical geography and the environment. Pearson Education Limited. Essex. Humphreys, G.S., Hunt, P.A., Buchanan, R., 1987. Wood ash stone near Sydney, N. S. W.: A carbonate pedological feature in an acidic soil. Aust J. Soil Research 25, 115-124. Iglesias, T. Cala, V., González, J. 1997. Mineralogical and chemical modifications in soils affected by a forest fire in the Mediterranean area. Sci. of the Tot. Environ. 204, 89-96. Jasper, R., 1999. The changing direction of land managers in reducing the threat from major bushfires on the urban interface of Sydney. Australian Bushfire Conference. Albury, NSW, Bushfire 99: 175-185. Johnson, D.W., Curtis, P.S., 2001. Effects of forest management on soil C and N storage: meta analysis. For. Ecol. Manag. 140, 227-238. Karlikowski, T., 1982. Forest fire detection system. Proceedings of an International Seminar organized by the Timber Committee of the Unite Nations Economic Commission for Europe, warsaw, Poland, Martinus Nijhoff/Dr W. Junk Publisher. Kauffman, J.B., Sanford, R.L., Cummings, D.L., Salcedo, I.H., Sampaio, E.V.S.B., 1993. Biomass and nutrient dynamics associated with slash fires in Neotropical dry forests. Ecology 74, 140-151. Keeley, J.E., 2009. Fire intensity, fire severity and burn severity: a brief review and suggested usage. Int. J. Wildland Fire 18, 116-126. Ketterings, Q. M., T. T. Wibowo, Noordwijk, M.V., Penot, E., 1999. Farmers perspectives on slash and burn as a land clearing method for small scale rubber producers in Sepunggur, jambi Province, Sumatra, Indonesia. For. Ecol. Manage. 120, 158-169. Ketterings, Q.M., Bigham, J.M., Valerie, L., 2000. Changes in soil mineralogy and texture caused by slash and burn fires in Sumatra Indonesia. Soil Sci. Soc. Amer. J. 64, 1108-1117. Ketterings, Q.M., Noordwijk, M.V., Bigham, J.M., 2002. Soil phosphorous availability after slash-and burn fires of different intensities in rubber agroforests in Sumatra, Indonesia. Agric. Eco. Environ. 92, 37-48. Khanna, P.K., Raison, R.J., 1986. Effect of fire intensity on solution chemistry of surface soil under a Eucalyptus pauciflora forest. Aust. J. Soi Res. 24, 423-434.

120
Khanna, P.K., Raison, R.J., Falkiner, R.A., 1994. Chemical properties of ash derived from Eucalyptus litter and its effects on forest soils. For. Ecol. Manage. 66, 107-125. Kleber, M., Mikutta, C., Jahn, R., 2004. Andosols in Germany- pedogenesis and properties. Catena. 56, 67-83. Kloprogge, J.T., Ruan, H.D., Frost, R.L., 2001. Thermal decomposition of bauxite minerals: infrared emission spectroscopy of gibbsite, boehmite and diaspore. J. Mat. Sci. 37, 1121-1129. Knicker, H., 2007. How does fire affect the nature and stability of soil organic nitrogen and carbon? A review. Biogeochemistry 85, 91-118. Kutiel, P., Naveh, Z., 1987. The effect of fire on nutrients in a pine forest soil. Plant Soil. 104, 269-274. Kutiel, P., Shaviv, A., 1989. Changes of soil N-P status in a laboratory simulated forest fire. Plant Soil. 120, 57-63. Kutiel, P., Shaviv, A., 1992. Effects of soil type, plant composition and leaching on soil nutrients following a simulated forest fire. For. Ecol. Manag. 53, 329-343. Kwari, J.D., Batey, T., 1991. Effect of heating on phosphate sorption and availability in some northeast Nigerian soils. Euro. J. Soil Sci. 52, 97-102. Landers, M., Gilkes, R.J., 2007. Dehydroxylation and dissolution of nickeliferous goethite in New Caledonian lateritic Ni ore. App. Clay Sci. 35, 162-172. Landers, M., Gilkes, R.J., Wells, M., 2009. Dissolution kinetics of dehydroxylated nickeliferous goethite from limonitic lateritic nickel ore. Applied Clay Science 42, 615-624. Lanning, F.C., Ponnaiya, B.W.X., Crumpton, C.F., 1958. The chemical nature of silica in plants. Plant Phys. 33, 339-343. Lee, D.H., Condrate, R.A. Sr., 1995. An FTIR spectral investigation of the structural species found on alumina surfaces. Materials Letters 23, 241-246. Lentile, L.B., Holden, A.Z., Smith, A.M.S., Flakiwski, M.J., Hudak, A.T., Morgan, P., Lewis, S.A., Gessler, P.E., Benson, N.C., 2006. Remote sensing techniques to asses active fire characteristics and post-fire effects. Int. J. Wildland Fire 15, 319-354. Liodakis, S., Katsigiannis, G., Kakali, G., 2005. Ash properties of some dominant Greek forest species. Thermochimic. Acta 437, 158-176. Liodakis, S., Tsoukala, M., Katsigiannis, G., 2009. Laboratory study of leaching properties of Mediterranean forest species ashes. Water Air Soil Pollut. 203, 99-107.
121
Ludwig, B., Khanna, P., Prenzel, J., Beese, F., 2005. Heavy metal release from different ashes during serial batch tests using water and acid. Waste Manage. 25, 1055-1066. MacKenzie, K.J.D., Temujin, J., and Okada, K., 1999. Thermal decomposition of mechanically activated gibbsite. Thermo. Acta. 327:103-108. MacKenzie, R.C., 1957. The Differential Thermal Investigation of Clays. Mineralogical Society, Clay Minerals Group. London. Malmstrom, A., 2008. Temperature tolerance in soil microarthropods: Simulation of forest fire heating in the laboratory. Pedobiologia. 51, 419-426. Mataix-Solera, J., Cerda, A., Arcenegui, V., Jordán, A., Zavala, L.M., 2011. Fire effects on soil aggregation: A review. Earth-Science Rev. 109, 44-60. McArthur, W.M., 1991. Reference soils of south-western Australia. Australian Society of Soil Science, WA Branch Inc. Perth. Australia. McKeague, J.A., Brydon, J.E., Miles, N.M., 1971. Differentiation of forms of extractable iron and aluminium in soils. Soil Sci. Soc. Amer. J. 35, 8-33. Mehra, O.P., Jackson, M.L., 1960. Iron oxide removal from soils and clays by a dithionite-citrate system buffered with sodium bicarbonate. Clays Clay Miner. 7, 317-327. Misra, M.K., Ragland, K.W., Baker, A.J., 1993. Wood ash composition as a function of furnace temperature. Biomass Bioenergy 4, 103-116. Miśta, W., Wrzyszcz, J., 1999. Rehydration of transition aluminas obtained by flash calcination of gibbsite. Thermochimica Acta 331, 67-72. Munsell Colour Co., 1998. Munsell and Soil Colour Charts. Munsell Colour Co., Maryland, USA. Murphy, J., Riley, J.P., 1962. A modified single solution method for the determination of phosphate in natural waters. Analytical Chemistry Acta 27, 31-36. Myers, B., G., A., Bradstock, R., Dias, L., Duff, G., Jacklyn, P., Landsberg, J., Morrison, J., Russel-Smith, J., Williams, R., 2004. Managing for biodiversity in the rangelands In Fire Management. Australian Government Department of the Environment and Heritage, Australia, pp. 6-9. Neary, D.G., Klopatek, C.C., DeBano, L.F., Ffolliot, P.F., 1999. Fire effects on belowground sustainability: a review and synthesis. For. Ecol. Manage. 122, 51-71. Nornberg, P., Vendelboe, A.L., Gunnlaugsson, H.P., Merrison, J.P., Finster, K., Jensen, S.K., 2009. Comparison of the mineralogical effects of an experimental forest fire on a goethite/ferryhydrite soil with a topsoil that contains hematite, maghemite and goethite. Clay Min. 44, 239-247.

122
Ozanne, P.G., Shaw, T.C., 1967. Phosphate sorption by soils as a measure of the phosphate requirement for pasture growth. Aust. J. Agric. Res. 19, 601-612. Palmer, B., Gilkes, R.J., 1983. The influence of application rate on the relative effectiveness of calcined Christmas Island C-grade rock phosphate and super phosphate when applied as mixtures. Fert. Res. 4, 45-50. Pereira, J.A.M., Schwaab, M., Dell’Oro, E., Carlos Pinto, J., Monteiro, J.L.F., Henriques, C.A., 2009. The kinetics of gibbsite dissolution in NaOH. Hydrometallurgy 96, 6-13. Pereira, P., Ũbeda, X., Martin, D., Mataix-Solera, J., Guerrero, C., 2011. Effects of low severity prescribed fire on water-soluble elements is ash from a cork oak (Quercus suber) forest located in the northeast of the Iberian Peninsula. Environ. Res. 111, 237-247. Perkiömakï, J., 2004. Wood ash use in coniferous forests, a soil microbiological study into the potential risk of cadmium release, Metsantutkimuslaitoksen Tiedonantoja 917, Finish Forest Research Institute, Research Papers 917. Pomies, M.P., Morin, G., Vignaud, C., 1998. XRD study of the goethite-hematite transformation: application to the identification of heated prehistoric pigments. Euro. J. Solid State Inorg. Chem. 35, 9-25. Prasad, P.S.R., Sviva Parasad, K., Krishna Chaitanya, V., Babu, E.V.S.S.K., Sreedhar, B., Ramana Murthy, S., 2006. In situ FTIR study on the dehydration of natural goethite. J. Asian Earth Sci. 27, 503-511 Ptáček, P., Kubátova, D., Havlica, J., Brandštetr, J., Šoukal, F., Opravil, T., 2010. Isothermal kinetic analysis of the thermal decomposition of kaolinite: The thermogravimetric study. Thermochimica Acta 501, 24-29. Quintana, J.R., Cala, V., Moreno, A.M. & Parra, J.G., 2007. Effect of heating on mineral components of the soil organic horizon from a Spanish juniper, (Juniperus thurifera L.) woodland. J. Arid Environ. 71, 45-56. Rab, M. A., 1996. Soil physical and hydrological properties following logging and slash burning in the Eucalyptus regnans forest of southeastern Australia. Forest Ecol. Manage. 84, 159-176. Raison, R.J., 1979. Modification of the soil environment by vegetation fires, with particular reference to nitrogen transformations: a review. Plant Soil. 51, 73-108. Raison, R.J., Khanna, P.K., Woods, P.V., 1985. Transfer of elements to the atmosphere during low intensity prescribed fires in three Australian subalpine eucalypt forest. Can. J. For. Res. 15, 657-664. Rayment, G.E., Higginson, F.R., 1992. Australian Laboratory Handbook of Soil and Water Chemical Methods. Melbourne, Inkata Press.

123
Reuter, D.J., Robinson, J.B., 1997. Plant analysis: an interpretation manual. 2nd edn. Melbourne, CSIRO Publishing. Richardson, H.M., 1972. Phase changes which occur on heating kaolin clays. In: Brown, G. (Ed). The x-ray identification and crystal structures of clay minerals. Mineralogical Society London, pp. 132-142. Robson, A.D., Gilkes, R.J., 1981. Fertilizer responses (N, P, K, S, micronutrients) on lateritic soils in southwestern Australia, a review. In: Balkema AA, (Ed) Laterisation Processes. Rotterdam. Rocha, J., 1999. Single and triple quantum 27Al MAS NMR study of the thermal transformation of kaolinite. J. Phys. Chem. 103, 9801-9804. Rocha, J., Adams, J.M., Klinowski, J., 1990. The rehydration of metakaolinite to kaolinite: Evidence from Solid State NMR and Cognate techniques. J. Solid State Chem. 89, 260-274. Rocha, J., Klinowski, J., 1991. The rehydration of metakaolinite to kaolinite. J. Chem. Soc., Chem. Commun. 582-584. Romanyà, J., Khanna, P. K., Raison, R. J., 1994. Effects of slash burning on soil phosphorus fractions and sorption and desorption of phosphorus. For. Ecol. Manag. 65, 89-103. Rooksby, H.P., 1972. Oxides and hydroxides of aluminium and iron. In: Brown, G. (Ed). The x-ray identification and crystal structures of clay minerals. Mineralogical Society London. Roy, D.P., Boschetti, L., Maier, S.W., Smith, A.M.S., 2010. Field estimation of ash and char colour-lightness using a standard grey scale. Int. J. Wildland Fire 19, 698-704. Ruan, H.D., Frost, R.L., Kloprogge, J.T., 2001. The behaviour of hydroxyl units of synthetic goethite and its dehydroxylated product hematite. Spectrochimica Acta Part A 57, 2575-2586. Ruan, H.D., Frost, R.L., Kloprogge, J.T., Duong, L., 2002. Far-infrared spectroscopy of alumina phases. Spectrochimica Acta Part A 58, 265-272. Russel, J.D., Fraser, A.R., 1994. Infrared methods. In: Wilson, M.J. (Ed), Clay Mineralogy: Spectroscopic and Chemical determinative Methods. Chapman & Hall, London, pp. 49-52. Ryskin, Y.I., 1974. The vibrations of protons in minerals: hydroxyl, water and ammonium. In: Farmer, V.C. (Ed), The Infrared Spectra of Minerals. Vol. Monograph 4. Mineralogical Society London, pp. 137-181.
124
Saa, A., Trasar-Cepeda, M.C., Gil-Sotres, F., Carballas, T., 1993. Changes in soil phosphorus and acid phosphatase activity immediately following forest fires. Soil Biol. Biochem. 25 (9), 1223-1230. Sanchez, P.A., 1976. Properties and management of soils in the tropics. Wiley/Interscience, London. SAS Institute, 1999. SAS/STAT User’s guide. V 8. SAS Inst, Car, NC. Schwertmann, U., Taylor, R.M., 1989. Iron Oxides. In: Dixon, J.B., Weed, S.B., (Eds.), Minerals in Soil Environments, 2nd Edition pp. 379-438. Scott, A.C., 2010. Charcoal recognition, taphonomy and uses in palaeoenvironmental analysis. Palaeogeogr. Palaeclimatol. Palaeocol. 291, 11-39. Sertsu, S.M., Sanchez, P.A., 1978. Effects of heating on some changes in soil properties in relation to an Ethiopian land management practice. Soil Sci. Am. J. 42, 940-944. Shakesby, R.A., Chafer, C.J., Doerr, S.H., Blake, W.H., Humphreys, G.S., Wallbrink, P., Harrington, B.H., 2003. Fire severity, water repellency characteristics and hydrogeomorphological changes following the Christmas 2001 forest fires. Aust. Geog. 34, 147-175. Shakesby, R.A., Doerr, S.H., 2006. Wildfire as a hydrological and geomorphological agent. Earth Sci. 74, 269-307. Snars, K., Hughes, J.C., Gilkes, R.J., 2004. The effects of addition of bauxite red mud to soil on P uptake by plants. Aust. J. Agric. Res. 55:25–31. STATISTICA 10, 2011. Electronic Statistics Textbook. StatSoft, Inc., Tulsa, OK, USA. WEB: http://www.statsoft.com/textbook/stathome.html. Steward, F.R., Peter, S., Richan J.B., 1990. A method for predicting the depth of lethal heat penetration into mineral soils exposed to fires of various intensities. Can. J. For. Res. 20, 919-926. Teague, B., McClead, R., Pascoe, S., 2009. 2009 Victorian Bushfire Royal Commission Interim Report. Australia: Government Printer for the State of Victoria. Terefe, T., Mariscal-Sancho, I., Peregrina, F., Espejo R., 2008. Influence of heating on various properties of six Mediterranean soils. A laboratory study. Geoderma. 143, 273-280. Tomkins, I.B., Kellas, J.D., Tolhurst, K.G., Oswin, D.A. 1991. Effects of fire intensity on soil chemistry in a Eucalypt forest. Aust. J. Soil. Res. 29, 25-47. Turekian, V.C., Macko, S., Ballentine, D., Swap, R.J., Garstang, M., 1998. Causes of bulk carbon and nitrogen isotopic fractionations in the products of vegetation burns: laboratory studies. Chem. Geol. 152, 181-192.

125
Turrión, M.B., Lafuente, F., Aroca, M.J., López, O., Mulas, R., Ruipérez, C., 2010. Characterization of soil phosphorus in a fire-affected forest cambisol by chemical extractions and 31P-NMR spectroscopy analysis. Sci. Tot. Environ. 408, 3342-3348. Ùbeda, X., Pereira, P., Outeiro, L., Martin, D.A., 2009. Effects of fire temperature on the physical and chemical characteristics of the ash from two plots of cork oak (Quercus suber). Land Degrad. and Dev. 20, 589-608. Ulery, A.L., Graham, R.C., 1993. Forest fire effects on soil color and texture. Soil Sci. Soc. Amer. J. 57, 135-140. Ulery, A.L., Graham, R.C., Amrhein, C., 1993. Wood-ash composition and soil pH following intense burning. Soil Sci. 156, 358-364. Ulery, A.L., Graham, R.C., Bowen, L.H., 1996. Forest fire effects on soil phyllosilicates in California. Soil Sci. Soc. Amer. J. 60, 309-315. Underwood, R.J., Christensen, P.E.S., 1981. Forest fire management in Western Australia. Perth, Western Australia. USDA, 2010. Keys to Soil Taxonomy, Eleventh Edition. United States Department of Agriculture, Natural Resources Conservation Service. Vance, E. D., and Mitchell, C. C., 2000. Beneficial use of wood ash as an agricultural soil amendment: case studies from the United States forests products industry. In Land Application of Agricultural, Industrial, and Municipal By-Products, (Eds. J. F. Power and W. A. Dick), Soil Science Society of America, Book series no 6, pp 567-582. Viegas, D.X., 1998. Weather, fuel status and fire occurrence: predicting large fires. In Large Forest Fires. J. M. Moreno (Ed). Leiden, The Netherlands, Backhuys publisher: 31-48. Voundi Nkana, J.C., Demeyer, A., Verloo, M.G., 2002. Effect of wood ash application on soil solution chemistry of tropical acid soils: incubation study. Bioresour. Technol. 85, 323-325. Wada, K., 1977. Allophane and imogolite. In: Dixon, J.B., Weed, S.B. (Eds), Minerals in Soil Environment. Soil Science Society of America, Madison, Wis., USA, pp. 603-638. Wan, S., Hui, D., Luo, Y., 2001. Fire effects on nitrogen pools and dynamics in terrestrial ecosystems : a meta analysis. Ecol. Appl. 11, 1349-1365. Wang, H., Xu, B., Smith, P., Davies, M., Desilva, L., Wingate, C., 2006. Kinetic modeling of gibbsite dehydration/amorphization in the temperature range 823-923K. J. Phys. Chem. Solid. 67, 2567-2582.
126
Watari, F., Landuyt, J.V., Delavignette, P., and Amelinckx, S., 1979. Electron microscopy study of dehydration transformations 1. Twin formation and Mosaic structure hematite derived goethite. J. Solid State Chemis. 29, 137-150. Wattez, J., Courty, M.A., 1987. Morphology of ash of some plant materials. Soil micromorphology. In: Fedoroff, N., Bresson, L.M., Courty, M.A. (Eds.). Proceedings of the Seventh International Working Meeting on Soil Micromorpholgy, Paris, pp. 677-683. White, J.L., Roth, C.B., 1986. Infared Spectrometry. In: Klute, A. (Ed) Methods of soil analysis. Part 1. Physical and Mineralogical Methods Second Edition. Soil Science Society of America, Inc. Madison, Wisconsin USA, pp. 291-330. Wikars, L.O., Scmimmel, J., 2001. Immediate effects of fire severity on soil invertebrates in cut and uncut pine forests. Forest Ecol. Manage. 141, 189-200. Wilbur, R.B., Christensen, N.L., 1985. Effects of fire on nutrient availability in a North Carolina coastal plain pocosin. Am. Midl. Nat. 110, 54-61. Williams, J.P., Biernacki, J.J., Bai, J., Rawn, C.J., 2003. Assesment of a synchrotron X-ray method for quantitative analysis of calcium hydroxide. Cement and Concrete Research 33, 1553-1559. Woods, S.W., Balfour, V., 2008. The effect of as on runoff and erosion after a forest wildfire, Montana, U.S.A. Int. J. Wildland Fire 17, 535-548. Yokozeki, K., Watanabe, K., Sakata, N., Otsuki, N., 2004. Modeling of leaching from cementitious materials used in underground environment. Applied Clay Sci. 26, 293-308. Yusiharni, B.E., Gilkes, R.J., 2011. Rehydration of heated gibbsite, kaolinite and goethite: an assessment of properties and environmental significance. Appl. Clay Sci. In Press.
Yusiharni, B.E., Ziadi, H., Gilkes, R.J., 2007. A laboratory and glasshouse evaluation of chicken litter ash, wood ash and iron smelting slag as liming agents and P fertilisers. Aust. J. Soil Res. 45, 374-389. Zanelli, R., Egli, M., Mirabella, A., Plőtze, M., Abdelmoula, M., 2006. ‘Black’ soils in the Southern Alps: clay mineral formation and transformation, amorphous phases and Fe forms. Clay and Clay Min. 54, 705-722. Zanelli, R., Egli, M., Mirabella, A., Giaccai, D., Abdelmoula, M., 2007. Vegetation effects on pedogenetic forms of Fe, Al and Si and on clay minerals in soils in southern Switzerland and northern Italy. Geoderma. 141, 119-129.
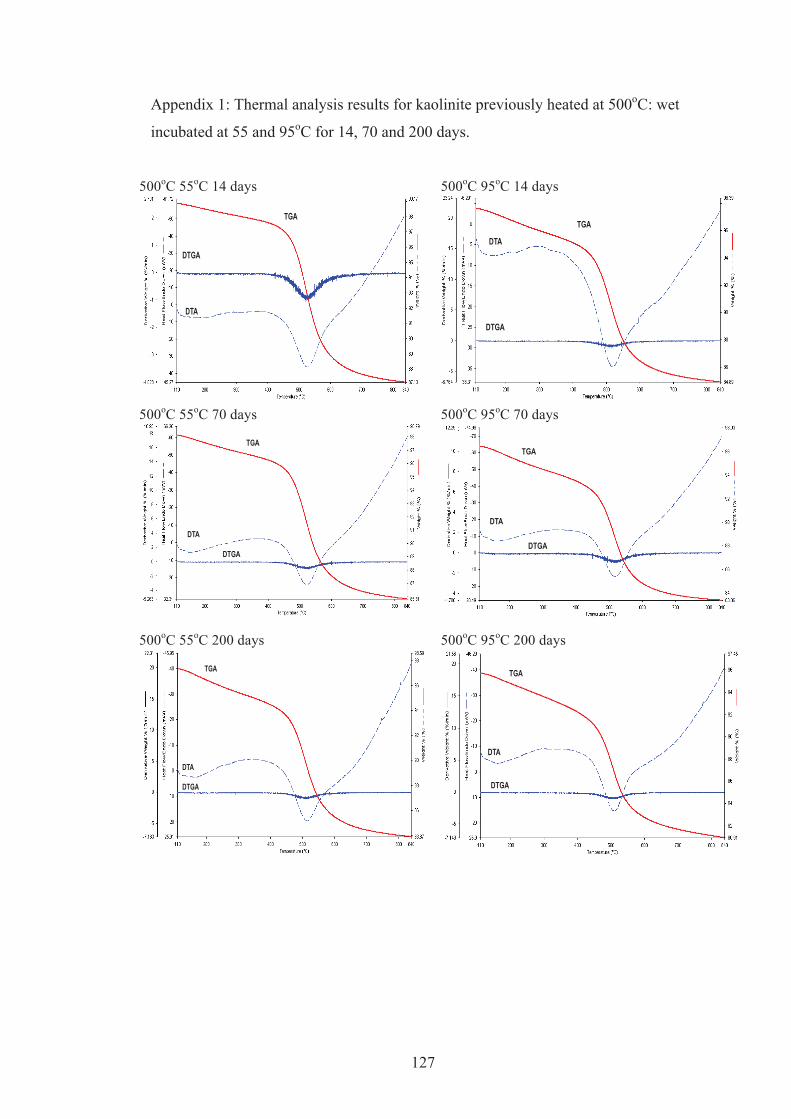
127
Appendix 1: Thermal analysis results for kaolinite previously heated at 500oC: wet
incubated at 55 and 95oC for 14, 70 and 200 days.
500oC 55oC 14 days
TGA
DTA
DTGA
500oC 95oC 14 days
DTA
DTGA
TGA
500oC 55oC 70 days
DTGA
DTA
TGA
500oC 95oC 70 days
DTGA
DTA
TGA
500oC 55oC 200 days
DTA
DTGA
TGA
500oC 95oC 200 days
DTGA
DTA
TGA

128
Appendix 2: Thermal analysis results for kaolinite previously heated at 550oC: wet incubated at 55 and 95oC for 14, 70 and 200 days.
550oC 55oC 14 days
DTA DTGA
TGA
550oC 95oC 14 days
DTGA DTA
TGA
550oC 55oC 70 days
DTGA DTA
TGA
550oC 95oC 70 days
DTA
TGA
DTGA
550oC 55oC 200 days
DTGA DTA
TGA
550oC 95oC 200 days
DTGA
DTA
TGA
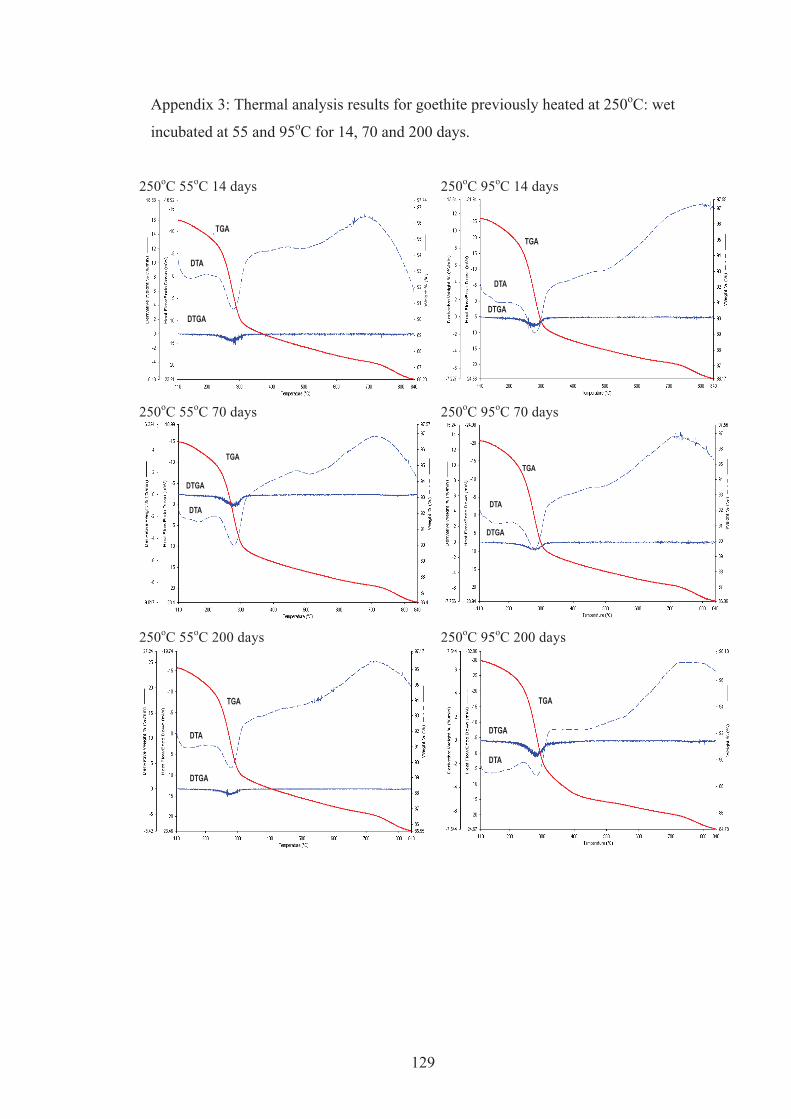
129
Appendix 3: Thermal analysis results for goethite previously heated at 250oC: wet
incubated at 55 and 95oC for 14, 70 and 200 days.
250oC 55oC 14 days
DTGA
DTA
TGA
250oC 95oC 14 days
DTGA
DTA
TGA
250oC 55oC 70 days
TGA
DTGA
DTA
250oC 95oC 70 days
TGA
DTGA
DTA
250oC 55oC 200 days
DTGA
DTA
TGA
250oC 95oC 200 days
TGA
DTA
DTGA

130
Appendix 4: Thermal analysis results for goethite previously heated at 300oC: wet incubated at 55 and 95oC for 14, 70 and 200 days.
300oC 55oC 14 days
DTGA
TGA
DTA
300oC 95oC 14 days
DTGA
DTA
TGA
300oC 55oC 70 days
TGA
DTA
DTGA
300oC 95oC 70 days
TGA
DTA
DTGA
300oC 55oC 200 days
TGA
DTGA
DTA
300oC 95oC 200 days
DTGA
TGA
DTA
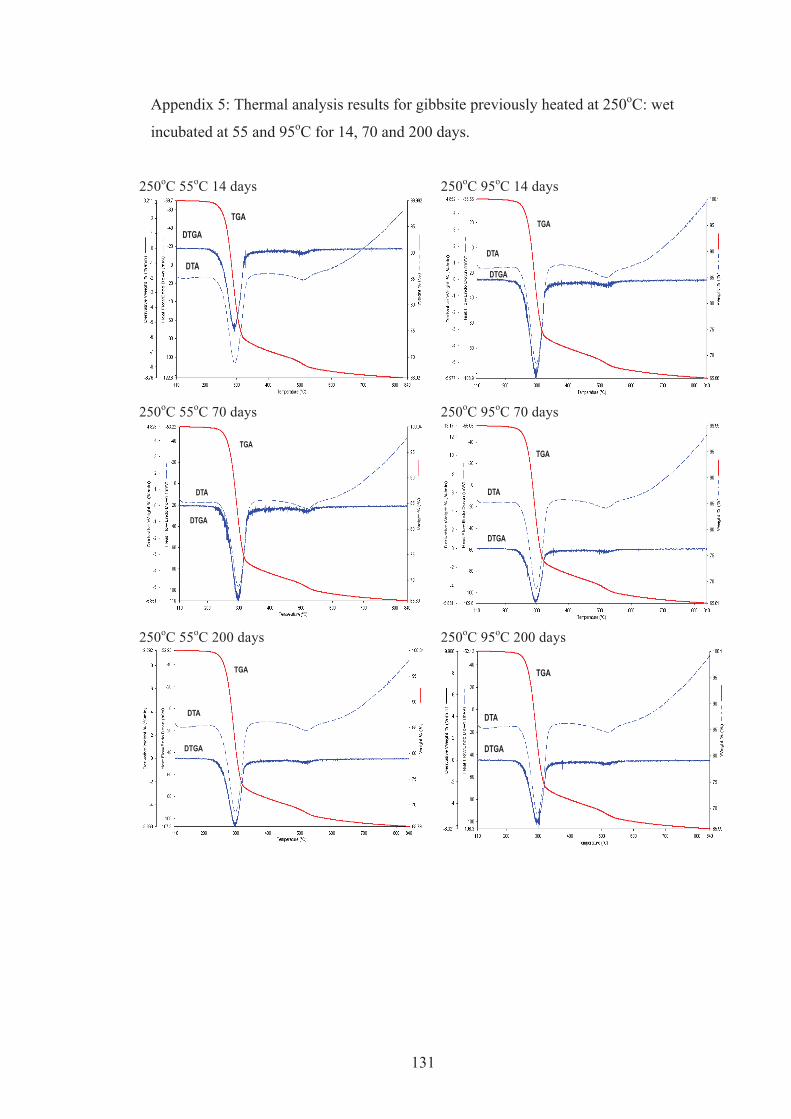
131
Appendix 5: Thermal analysis results for gibbsite previously heated at 250oC: wet
incubated at 55 and 95oC for 14, 70 and 200 days.
250oC 55oC 14 days
DTA
DTGA
TGA
250oC 95oC 14 days
DTA
DTGA
TGA
250oC 55oC 70 days
TGA
DTGA
DTA
250oC 95oC 70 days
DTA
DTGA
TGA
250oC 55oC 200 days
TGA
DTGA
DTA
250oC 95oC 200 days
TGA
DTA
DTGA

132
Appendix 6: Thermal analysis results for gibbsite previously heated at 300oC: wet incubated at 55 and 95oC for 14, 70 and 200 days.
300oC 55oC 14 days
DTGA
DTA
TGA
300oC 95oC 14 days
DTGA
DTA
TGA
300oC 55oC 70 days TGA
DTA
DTGA
300oC 95oC 70 days
TGA DTGA
DTA
300oC 55oC 200 days
TGA
DTA
DTGA
300oC 95oC 200 days
TGA
DTA
DTGA

133
Appendix 7: Analyses of dry plant tops (leaves and shoots) of annual ryegrass (Lolium rigidum Gaud) for Harvest 1.
Rate of P Na Mg Al S K Ca Mn Fe Cu Zn Mo Pb applied (mg/kg) % % mg/kg % % % mg/kg mg/kg mg/kg mg/kg mg/kg mg/kg BH Unburnt 0 0.11 0.31 377 0.41 2.68 1.34 172 84 6.8 53.9 2.8 0.8 BH Unburnt 1.67 0.11 0.26 343 0.37 3.02 1.51 140 82 6.8 49.4 1.2 0.7 BH Unburnt 3.33 0.07 0.25 148 0.30 3.04 1.52 113 59 3.9 28.9 0.9 0.5 BH Unburnt 6.67 0.08 0.31 68 0.23 2.97 1.49 110 47 3.4 24.8 0.9 0.6 BH Unburnt 13.33 0.06 0.27 84 0.20 3.28 1.64 92 46 3.2 19.9 0.5 0.4 BH 250 0 0.13 0.29 192 1.01 3.23 1.62 190 73 9.3 53.2 1.4 1.1 BH 250 1.67 0.20 0.31 349 1.09 4.28 2.14 209 105 11.4 62.9 1.4 0.8 BH 250 3.33 0.14 0.24 60 0.82 3.20 1.60 107 52 6.3 33.9 0.5 0.5 BH 250 6.67 0.14 0.24 102 0.85 4.53 2.26 137 91 6.4 42.5 0.6 0.4 BH 250 13.33 0.18 0.23 42 0.56 3.87 1.94 116 55 4.6 27.1 0.4 0.7 BH 350 0 0.16 0.32 320 0.69 2.56 1.28 219 155 3.8 34.6 4.9 0.4 BH 350 1.67 0.15 0.35 187 1.04 4.19 2.10 252 196 4.1 44.5 3.0 0.4 BH 350 3.33 0.17 0.36 93 1.03 4.53 2.26 273 324 3.9 57.5 3.3 0.6 BH 350 6.67 0.20 0.32 269 0.77 4.58 2.29 265 377 3.6 35.0 2.9 0.5 BH 350 13.33 0.11 0.29 83 0.62 4.31 2.16 208 196 2.4 36.2 1.9 0.5 BH 500 0 0.03 0.28 226 0.26 2.66 1.33 197 111 3.7 29.0 5.9 0.5 BH 500 1.67 0.02 0.22 123 0.19 2.30 1.15 173 104 2.8 33.9 5.9 0.4 BH 500 3.33 0.02 0.24 201 0.22 2.82 1.41 195 121 4.4 33.1 8.2 0.3 BH 500 6.67 0.01 0.23 138 0.18 2.75 1.38 233 2610 2.0 46.0 4.9 0.2 BH 500 13.33 0.01 0.26 139 0.18 2.42 0.81 253 84 2.9 22.9 5.0 0.6

134
Appendix 8: Analyses of dry plant tops (leaves and shoots) of annual ryegrass (Lolium rigidum Gaud) for Harvest 2.
Rate of P Na Mg Al S K Ca Mn Fe Cu Zn Mo Pb applied (mg/kg) % % mg/kg % % % mg/kg mg/kg mg/kg mg/kg mg/kg mg/kg BH Unburnt 0 0.64 1.12 626 0.53 2.17 1.76 1166 172 8.3 191.8 2.1 1.0 BH Unburnt 1.67 0.56 0.80 672 0.61 2.60 1.38 894 211 7.3 171.3 1.0 0.9 BH Unburnt 3.33 0.15 0.37 218 0.34 3.22 0.53 285 85 4.9 65.8 1.6 0.6 BH Unburnt 6.67 0.10 0.47 318 0.35 2.80 0.88 241 103 5.0 44.3 1.4 0.6 BH Unburnt 13.33 0.14 0.42 192 0.34 2.69 0.64 250 53 3.8 31.7 1.0 0.3 BH 250 0 0.91 0.72 240 0.87 3.14 0.94 594 45 8.7 91.1 2.3 0.7 BH 250 1.67 0.99 0.67 287 0.95 3.32 1.14 804 83 3.1 103.1 0.6 0.4 BH 250 3.33 0.72 0.61 67 1.03 3.35 0.98 422 30 7.4 91.8 1.7 0.3 BH 250 6.67 0.41 0.48 240 0.59 2.49 0.69 306 91 4.7 45.0 1.1 0.4 BH 250 13.33 0.33 0.48 288 0.49 2.43 0.82 251 133 4.8 56.7 1.4 0.4 BH 350 0 0.47 0.52 666 0.41 1.98 0.92 580 287 2.3 46.9 3.9 1.6 BH 350 1.67 0.31 0.49 228 0.55 3.18 0.80 499 142 3.0 42.3 3.5 0.2 BH 350 3.33 0.29 0.43 271 0.46 3.04 0.70 465 160 2.8 48.0 3.0 0.4 BH 350 6.67 0.27 0.43 398 0.36 2.43 0.69 499 156 1.8 23.3 1.4 0.3 BH 350 13.33 0.13 0.36 83 0.33 1.90 0.51 391 67 1.2 17.2 0.9 0.2 BH 500 0 0.18 0.57 804 0.30 1.88 1.79 749 326 4.1 64.3 11.6 0.4 BH 500 1.67 0.15 0.59 1158 0.22 1.94 1.76 981 363 3.7 79.6 12.3 0.6 BH 500 3.33 0.07 0.42 1036 0.22 2.03 1.14 690 331 3.4 63.0 14.7 0.5 BH 500 6.67 0.04 0.33 340 0.27 2.26 0.95 592 142 2.7 50.6 13.4 0.1 BH 500 13.33 0.03 0.27 129 0.22 2.49 0.81 426 78 2.4 29.7 9.6 0.1

135
Appendix 9: Analyses of dry plant tops (leaves and shoots) of annual ryegrass (Lolium rigidum Gaud) for Harvest 3.
Rate of P Na Mg Al S K Ca Mn Fe Cu Zn Mo Pb applied (mg/kg) % % mg/kg % % % mg/kg mg/kg mg/kg mg/kg mg/kg mg/kg BH Unburnt 0 1.37 1.18 1940 1.14 2.11 3.23 1074 340 9.3 191.6 6.0 1.9 BH Unburnt 1.67 1.10 1.24 3130 1.01 2.16 3.15 1170 694 9.3 223.3 0.9 3.8 BH Unburnt 3.33 0.52 0.49 659 0.44 2.51 0.83 477 116 6.4 105.1 1.0 1.1 BH Unburnt 6.67 0.42 0.50 269 0.38 2.40 0.62 400 75 5.9 67.7 1.2 0.7 BH Unburnt 13.33 0.40 0.42 493 0.31 2.04 0.51 290 99 5.5 43.1 1.0 0.5 BH 250 0 1.50 1.39 3829 2.07 2.14 4.05 992 559 9.9 105.6 1.1 4.0 BH 250 1.67 1.51 1.09 2651 1.57 2.10 3.32 1163 1240 8.2 84.8 0.8 4.6 BH 250 3.33 1.28 0.90 397 0.99 2.41 2.18 637 100 8.0 123.5 1.3 0.8 BH 250 6.67 0.81 0.57 243 0.62 2.32 0.94 476 70 6.8 73.3 1.2 0.5 BH 250 13.33 0.49 0.52 553 0.49 1.99 0.71 347 105 5.8 46.6 1.2 0.6 BH 350 0 1.59 1.15 3260 1.50 1.66 3.95 1058 496 4.4 42.9 2.8 2.5 BH 350 1.67 1.30 0.74 440 0.82 1.98 2.05 925 125 3.7 53.5 2.0 0.4 BH 350 3.33 0.99 0.58 771 0.63 1.87 1.34 793 174 3.9 59.4 2.1 0.8 BH 350 6.67 0.56 0.45 265 0.42 2.19 0.82 736 92 2.3 33.7 1.2 0.6 BH 350 13.33 0.39 0.41 157 0.36 1.73 0.61 552 80 2.1 20.7 1.0 0.4 BH 500 0 0.61 0.94 1039 0.94 1.38 3.55 824 232 6.6 83.8 14.0 0.5 BH 500 1.67 0.62 1.05 542 0.39 1.68 3.23 1333 205 5.5 115.8 8.6 1.4 BH 500 3.33 0.47 0.92 736 0.54 1.84 3.24 988 134 3.1 89.8 7.8 0.9 BH 500 6.67 0.25 0.41 479 0.40 1.85 1.37 768 105 3.2 65.7 10.7 0.3 BH 500 13.33 0.12 0.31 45 0.22 1.89 0.72 707 46 2.1 34.7 5.2 0.1
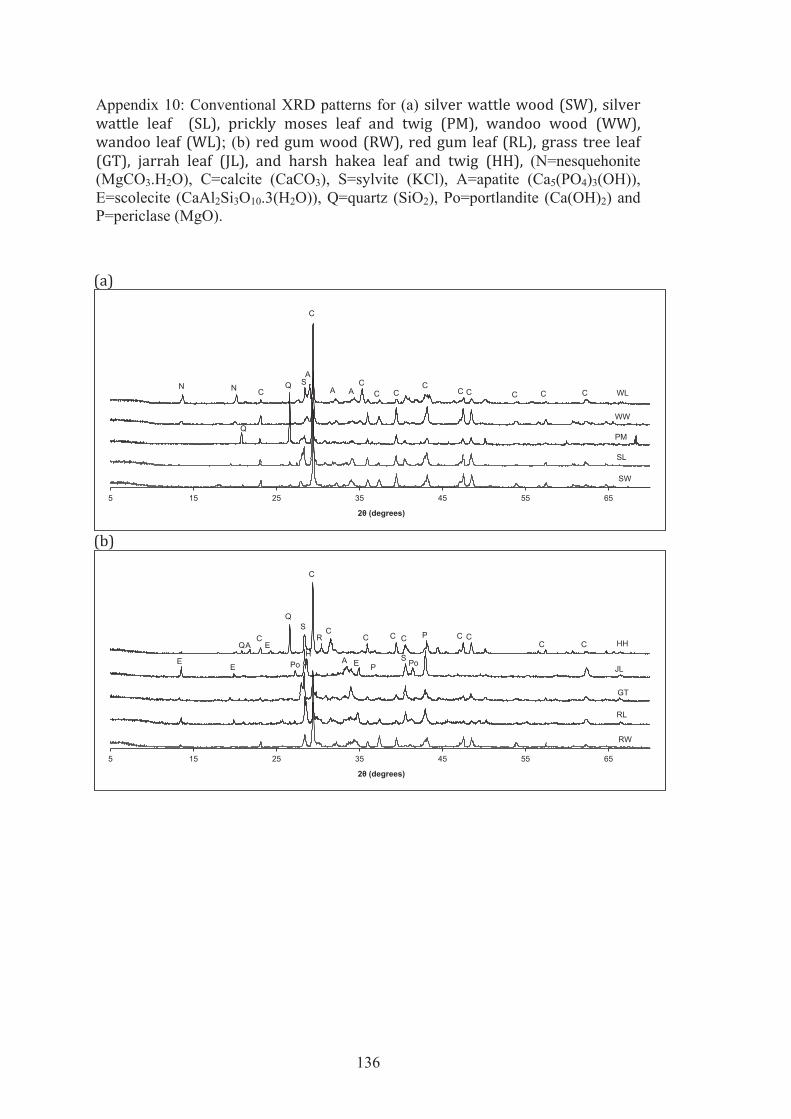
136
Appendix 10: Conventional XRD patterns for (a)
; (b) (N=nesquehonite
(MgCO3.H2O), C=calcite (CaCO3), S=sylvite (KCl), A=apatite (Ca5(PO4)3(OH)), E=scolecite (CaAl2Si3O10.3(H2O)), Q=quartz (SiO2), Po=portlandite (Ca(OH)2) and P=periclase (MgO).
5 15 25 35 45 55 65
2θ (degrees)
SW
SL
PM
WW
WL C
C
S C C C C
C C C C C
Q
Q N N A A
A
5 15 25 35 45 55 65
2θ (degrees)
RW
RL
GT
JL
HH
C
C
E E
S Q
Q R
C
A E
A
C C C P C C C C
Po E P S Po
H


