Solving multiplication and division problems
161
Solving multiplication and division problems Latent variable modeling of students’ solution strategies and performance
Transcript of Solving multiplication and division problems

Solving multiplication and division problems
Latent variable modeling of students’ solution strategies
and performance

Fagginger Auer, Marije F.
Solving multiplication and division problems:
Latent variable modeling of students’ solution strategies and performance
Copyright c© 2016 by Marije Fagginger Auer
Cover design by Joran A. Kuijper
Printed by Ridderprint BV
All rights reserved. No part of this book may be reproduced, stored in a retrieval
system, or transmitted, in any form or by any means, electronically, mechanically, by
photocopy, by recording, or otherwise, without prior written permission from the author.
ISBN 978-94-6299-343-3

Solving multiplication and division problems
Latent variable modeling of students’ solution strategies
and performance
PROEFSCHRIFT
ter verkrijging van de graad van doctor aan de Universiteit Leiden,
op gezag van de Rector Magnificus prof. mr. C. J. J. M. Stolker,
volgens besluit van het College voor Promoties
te verdedigen op woensdag 15 juni 2016
klokke 16.15 uur
door Marije Femke Fagginger Auer
geboren op 8 mei 1988 te Utrecht
Promotor:
prof. dr. W. J. Heiser
Copromotores:
dr. C. M. van Putten (Universiteit Leiden)
dr. M. Hickendorff (Universiteit Leiden)
dr. A. A. Beguin (Cito Instituut voor Toetsontwikkeling)
Promotiecommissie:
prof. dr. M. E. J. Raijmakers (Universiteit van Amsterdam)
prof. dr. M. J. de Rooij (Universiteit Leiden)
dr. S. H. G. van der Ven (Universiteit Utrecht)
prof. dr. L. Verschaffel (KU Leuven)
Acknowledgement:
The research described in this thesis was financed by the Netherlands
Organisation for Scientific Research (NWO), as the project ’Mathematics
instruction in the classroom and students’ strategy use and achievement in
primary education’ with project number 411-10-706.
Contents
List of Figures vi
List of Tables vi
1 General introduction 1
1.1 Solution strategies in cognitive psychology . . . . . . . . . . . . . . . 2
1.2 Solution strategies in mathematics education . . . . . . . . . . . . . 4
1.3 Contents of this dissertation . . . . . . . . . . . . . . . . . . . . . . . 7
2 Multilevel latent class analysis for large-scale educational assess-
ment data: Exploring the relation between the curriculum and
students’ mathematical strategies 11
2.1 Introduction . . . . . . . . . . . . . . . . . . . . . . . . . . . . . . . . 11
2.2 Method . . . . . . . . . . . . . . . . . . . . . . . . . . . . . . . . . . 18
2.3 Results . . . . . . . . . . . . . . . . . . . . . . . . . . . . . . . . . . . 22
2.4 Discussion . . . . . . . . . . . . . . . . . . . . . . . . . . . . . . . . . 28
3 Using LASSO penalization for explanatory IRT: An application
on covariates for mathematical achievement in a large-scale as-
sessment 33
3.1 Introduction . . . . . . . . . . . . . . . . . . . . . . . . . . . . . . . . 33
3.2 Method . . . . . . . . . . . . . . . . . . . . . . . . . . . . . . . . . . 41
3.3 Results . . . . . . . . . . . . . . . . . . . . . . . . . . . . . . . . . . . 45
3.4 Discussion . . . . . . . . . . . . . . . . . . . . . . . . . . . . . . . . . 49
3.A Teacher survey questions . . . . . . . . . . . . . . . . . . . . . . . . . 52
v

vi CONTENTS
4 Solution strategies and adaptivity in multidigit division in a
choice/no-choice experiment: Student and instructional factors 57
4.1 Introduction . . . . . . . . . . . . . . . . . . . . . . . . . . . . . . . . 57
4.2 Method . . . . . . . . . . . . . . . . . . . . . . . . . . . . . . . . . . 63
4.3 Results . . . . . . . . . . . . . . . . . . . . . . . . . . . . . . . . . . . 66
4.4 Discussion . . . . . . . . . . . . . . . . . . . . . . . . . . . . . . . . . 71
5 Affecting students’ choices between mental and written solution
strategies for division problems 77
5.1 Introduction . . . . . . . . . . . . . . . . . . . . . . . . . . . . . . . . 77
5.2 Method . . . . . . . . . . . . . . . . . . . . . . . . . . . . . . . . . . 82
5.3 Results . . . . . . . . . . . . . . . . . . . . . . . . . . . . . . . . . . . 88
5.4 Discussion . . . . . . . . . . . . . . . . . . . . . . . . . . . . . . . . . 95
5.A Student questionnaire . . . . . . . . . . . . . . . . . . . . . . . . . . 99
5.B Teacher questionnaire . . . . . . . . . . . . . . . . . . . . . . . . . . 100
6 Single-task versus mixed-task mathematics performance and strat-
egy use: Switch costs and perseveration 103
6.1 Introduction . . . . . . . . . . . . . . . . . . . . . . . . . . . . . . . . 103
6.2 Method . . . . . . . . . . . . . . . . . . . . . . . . . . . . . . . . . . 107
6.3 Results . . . . . . . . . . . . . . . . . . . . . . . . . . . . . . . . . . . 111
6.4 Discussion . . . . . . . . . . . . . . . . . . . . . . . . . . . . . . . . . 113
7 General discussion 117
7.1 Substantive conclusions . . . . . . . . . . . . . . . . . . . . . . . . . 118
7.2 Methodological conclusions . . . . . . . . . . . . . . . . . . . . . . . 121
7.3 Future directions . . . . . . . . . . . . . . . . . . . . . . . . . . . . . 123
References 127
Nederlandse samenvatting 141
Opzet van dit proefschrift . . . . . . . . . . . . . . . . . . . . . . . . . . . 143
Bevindingen . . . . . . . . . . . . . . . . . . . . . . . . . . . . . . . . . . . 144
Dankwoord 149
Curriculum vitae 151

List of Figures
1.1 Use of the different multiplication and division strategies on the assess-
ments in 1997, 2004 and 2011 (percentage correct per strategy in 2011
is given between brackets). The lines are broken because the items that
are compared for 1997 and 2004 are different from those compared for
2004 and 2011. . . . . . . . . . . . . . . . . . . . . . . . . . . . . . . . . 8
3.1 Penalized regression coefficients and BICs for the different settings of
λ in the LASSO penalized IRT model (dashed vertical line at optimal
λ = 35). . . . . . . . . . . . . . . . . . . . . . . . . . . . . . . . . . . . . 47
5.1 The step-by-step plans (the lower one for students using the digit-based
algorithm, and the upper one for students using the whole-number-based
algorithm). . . . . . . . . . . . . . . . . . . . . . . . . . . . . . . . . . . 85
List of Tables
1.1 Examples of written work for different multiplication and division strate-
gies for the problems 23× 56 and 544÷ 34. . . . . . . . . . . . . . . . . 6
vii

viii List of Tables
2.1 Examples of the digit-based algorithms, whole-number-based algorithms,
and non-algorithmic strategies applied to the multiplication problem
23× 56 and the division problem 544÷ 34. . . . . . . . . . . . . . . . . 15
2.2 The content of the thirteen multidigit multiplication problems and eight
multidigit division problems in the assessment, and the strategy use
frequency on each item. . . . . . . . . . . . . . . . . . . . . . . . . . . . 19
2.3 Fit statistics for the non-parametric and parametric multilevel latent
class models. . . . . . . . . . . . . . . . . . . . . . . . . . . . . . . . . . 23
2.4 The mean probabilities of choosing each of the six strategies for the
multiplication and division problems for each latent class. . . . . . . . . 24
2.5 The latent student class probabilities in each of the four latent teacher
classes. . . . . . . . . . . . . . . . . . . . . . . . . . . . . . . . . . . . . . 25
2.6 Fit statistics for the latent class models with successively added predictors. 26
2.7 Students’ probabilities of membership of the four latent student classes
for different levels of the student characteristics and the intended and
enacted curriculum predictors. . . . . . . . . . . . . . . . . . . . . . . . 27
3.1 Examples for the multiplication and division strategy categories. . . . . 39
3.2 The content of the thirteen multidigit multiplication items and eight
multidigit division items in the assessment and the percentage of correct
solutions. . . . . . . . . . . . . . . . . . . . . . . . . . . . . . . . . . . . 43
3.3 Use and (observed and estimated) accuracy of the multiplication and
division strategies. . . . . . . . . . . . . . . . . . . . . . . . . . . . . . . 45
3.4 Effects of the student characteristics and selected teacher covariates. . . 48
4.1 Examples of applications of the different strategies on 850÷ 25. . . . . . 60
4.2 The three versions of the eight problems in the division problem set. . . 63
4.3 The questions from the values questionnaire for the students’ teachers. . 64
4.4 Strategy use in the choice, NC-mental and NC-written calculation con-
dition. . . . . . . . . . . . . . . . . . . . . . . . . . . . . . . . . . . . . . 67
4.5 Efficiency of required mental and written calculation in the respective
no-choice conditions. . . . . . . . . . . . . . . . . . . . . . . . . . . . . . 68
4.6 Performance in terms of accuracy and speed with free strategy choice
and NC-written calculation, split by strategy choice in the choice con-
dition. . . . . . . . . . . . . . . . . . . . . . . . . . . . . . . . . . . . . . 71

List of Tables ix
5.1 Examples of the digit-based algorithm, whole-number-based algorithm,
and non-algorithmic strategies applied to the division problem 544÷ 34. 80
5.2 The division problems that students had to solve at the pretest and
posttest. . . . . . . . . . . . . . . . . . . . . . . . . . . . . . . . . . . . . 84
5.3 Explanatory IRT models for training effects on written strategy choices
and accuracy (all comparisons are to Mn−1). . . . . . . . . . . . . . . . 92
5.4 Strategy use proportions on the pretest and posttest in the intervention,
control and no training conditions. . . . . . . . . . . . . . . . . . . . . . 93
6.1 The twelve division and twelve other problems (order shown for the
mixed condition). . . . . . . . . . . . . . . . . . . . . . . . . . . . . . . . 109
6.2 Examples for the different strategy coding categories for the division
problem 544÷ 34. . . . . . . . . . . . . . . . . . . . . . . . . . . . . . . 110
6.3 Performance in the single and mixed task condition in terms of accuracy
and speed. . . . . . . . . . . . . . . . . . . . . . . . . . . . . . . . . . . . 111
6.4 Strategy use in the single-task and mixed-task condition. . . . . . . . . 111

1
General introduction
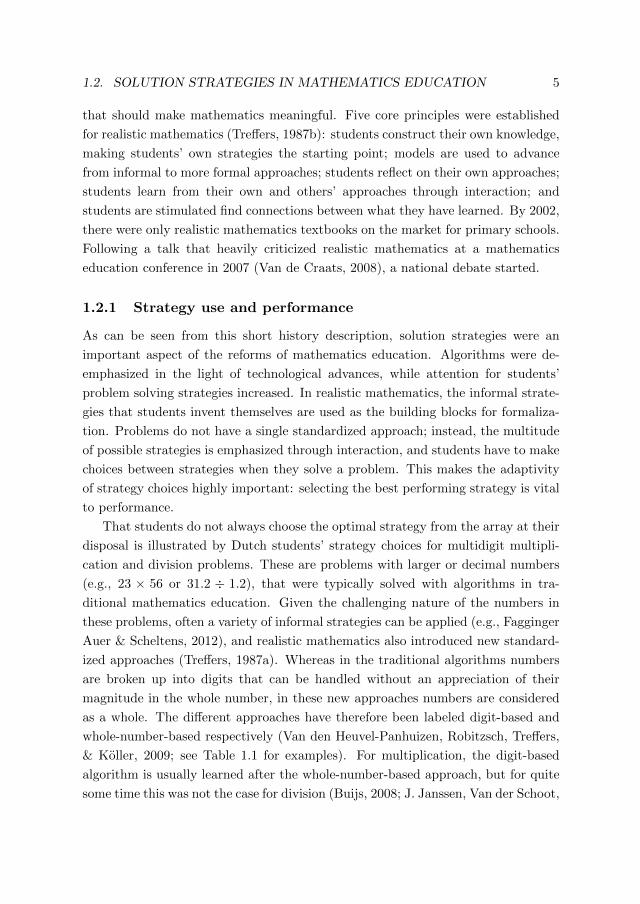
This dissertation concerns the mathematical strategies and performance of students
and what factors affect these different aspects of problem solving. Before delving
into the research on this point, I would like to invite you to take a moment to solve
the multiplication and division problem presented below:
23× 56 544÷ 34
Were you successful in obtaining the answers? For the multiplication problem,
you should have found the answer 1288, and for the division problem the answer
16. And how did you go about obtaining the answers? Did you diligently take up
paper and pencil and perform the algorithms you were taught in primary school,
or did you perhaps take a less formal approach? Given that you are reading a
dissertation, you probably enjoyed quite some years of education or even have a
PhD, which means that according to Goodnow (1976), you are especially likely to
solve mathematical problems using a mental approach without any external aids.
In taking such an approach, you would not be alone. The line of research that
gave rise to this dissertation, comes from the observation of simultaneously declining
performance in multiplication and division at the end of Dutch primary school and
increasing amounts of problems that are answered without any calculations that
are written down (Fagginger Auer, Hickendorff, & Van Putten, 2013; Hickendorff,
Heiser, Van Putten, & Verhelst, 2009; Van Putten, 2005). In this dissertation,
factors that affect students’ solution strategy use and performance are therefore
investigated, as well as the statistical techniques that may be used to conduct
such an investigation. This introduction provides a framework for this research by
discussing solution strategies from a cognitive psychology point of view, and the
1

2 CHAPTER 1. GENERAL INTRODUCTION
place of strategies in developments in mathematics education. The introduction is
concluded with an outline of how the different chapters of this dissertation each
contribute to the larger theme.
1.1 Solution strategies in cognitive psychology
Learning and problem solving are characterized by the use of a variety of strategies
at every developmental stage (Siegler, 2007). This is already evident in children as
young as infants: for example, some infants who are in their first weeks of inde-
pendent walking use a stepping strategy, while others use a twisting strategy, and
still others a falling strategy (Snapp-Childs & Corbetta, 2009). First graders who
are asked to spell words use strategies as varied as retrieval, sounding out, drawing
analogies, relying on rules, and visual checking (Rittle-Johnson & Siegler, 1999).
Older children who solve transitive reasoning problems differ in their use of deduc-
tive and visual solution strategies (Sijtsma & Verweij, 1999). Solution strategies
of children and adults have been a topic of continued investigation for cognitive
tasks concerning diverse topics, such as mental rotation and transformation (e.g.,
Arendasy, Sommer, Hergovich, & Feldhammer, 2011), counting (e.g., Blote, Van
Otterloo, Stevenson, & Veenman, 2004), class inclusion (e.g., Siegler & Svetina,
2006), analogical reasoning (e.g., Tunteler, Pronk, & Resing, 2008), and digital
gaming (e.g., Ott & Pozzi, 2012).
A popular topic in solution strategy research is strategy use for arithmetic prob-
lems. Many studies have been conducted on elementary addition, subtraction, mul-
tiplication and division (e.g. Barrouillet & Lepine, 2005; Barrouillet, Mignon, &
Thevenot, 2008; Beishuizen, 1993; Bjorklund, Hubertz, & Reubens, 2004; Campbell
& Fugelsang, 2001; Campbell & Xue, 2001; Carr & Davis, 2001; Davis & Carr, 2002;
Geary, Hoard, Byrd-Craven, & DeSoto, 2004; Imbo & Vandierendonck, 2007; Laski
et al., 2013; Mulligan & Mitchelmore, 1997; Van der Ven, Boom, Kroesbergen, &
Leseman, 2012), which concern operations in the number domain up to 100 that
are taught in the lower grades of primary school. However, while this elementary
arithmetic is the subject of a rich body of literature that has identified the strategies
that are used and described their characteristics, there is less research on strategy
use by higher grade students on more complex arithmetic problems (though there
is some; e.g., Hickendorff, 2013; Van Putten, Van den Brom-Snijders, & Beishuizen,
2005; Selter, 2001; Torbeyns, Ghesquiere, & Verschaffel, 2009). This more advanced
arithmetic is called multidigit arithmetic, as it involves larger numbers and decimal

1.1. SOLUTION STRATEGIES IN COGNITIVE PSYCHOLOGY 3
numbers.
When solving mathematical problems, especially more complex multidigit prob-
lems, there is an array of possible solution strategies. Lemaire and Siegler (1995)
proposed a general framework for charting the strategy use for a given domain, con-
sisting of four aspects of strategic competence. The first aspect of the framework
is the strategy repertoire, or in other words, which strategies are used. The second
aspect concerns the frequency with which each of the strategies in that repertoire
is chosen for use. The third aspect is strategy efficiency, which describes the per-
formance of each strategy. The fourth aspect is the adaptivity of the choices that
are made between strategies, which can be judged based on task, subject and con-
text variables. Combining these different factors, Verschaffel, Luwel, Torbeyns, and
Van Dooren (2009) defined the choice for a strategy as adaptive when the chosen
strategy is most appropriate for a particular problem for a particular individual, in
a particular sociocultural context.
An important aspect of adaptivity is the degree to which choices between strate-
gies are adapted to the relative performance of those strategies. This performance
entails both accuracy and speed, which can be considered simultaneously by defin-
ing the best performing strategy as the one that results in the correct solution the
fastest (Luwel, Onghena, Torbeyns, Schillemans, & Verschaffel, 2009; Torbeyns, De
Smedt, Ghesquiere, & Verschaffel, 2009; Kerkman & Siegler, 1997). Performance
depends on both the person using the strategy and on the problem the strategy
is applied to. In the Adaptive Strategy Choice Model (ASCM; Siegler & Ship-
ley, 1995), a strategy is selected for a problem using individual strategy accuracy
and speed information for both problems in general and problems with the spe-
cific features of the problem at hand. Another important aspect of adaptivity is
the degree to which strategy choices are adapted to the context in which they are
made (Verschaffel et al., 2009). Both the direct task context (e.g., demands on
working memory, time restrictions, or the characteristics of preceding items) and
the sociocultural context can be considered. Examples of influential aspects of the
sociocultural context are whether mental strategies are valued over using external
aids, whether speed or accuracy is more important, whether using conventional pro-
cedures or original approaches is preferred, and whether asking for help in problem
solving is desirable (Ellis, 1997).

4 CHAPTER 1. GENERAL INTRODUCTION
1.2 Solution strategies in mathematics education
An essential element of the context for mathematical solution strategies is of course
the educational system. The educational systems for mathematics underwent quite
some changes in the second half of the twentieth century in many Western coun-
tries, among which the Netherlands, where the research for this dissertation took
place (see descriptions by Klein, 2003, and the Royal Netherlands Academy of Arts
and Sciences, 2009). Already prior to this period, there was discontent with mathe-
matics education and its outcomes, but no real changes occurred until the U.S.S.R.
launched the first space satellite Sputnik in 1957. This caused a shock in the West-
ern world and an international conference was held in Royaumont in 1959, with the
aim of reforming education to advance economical and technological development.
Here, a radically different approach to mathematics education was envisioned with
the name of ’New Math’, which de-emphasized algorithms in light of the uprise of
computers and calculators, and focused on set theory and logic instead.
New Math was adopted in various European countries and in the U.S., and
mathematics education followed its own course of development after that in each
country. For example, in the U.S. (Klein, 2003), New Math’s scant attention for
basic skills and applications and its sometimes overly formal and abstract nature
led to criticisms, and by the early 1970s, New Math programs were discontinued
there. During the 1980s, progressivist changes to the curriculum were proposed in
the U.S., that revolved around student-centered, discovery-based learning through
’real world’ problem solving. Increased attention was prescribed for topics such
as cooperative work, mental computation and use of calculators, whereas direct
teacher instruction, algorithms (long division in particular) and paper-and-pencil
computations were to receive decreased attention (National Council of Teachers of
Mathematics, 1989). In the 1990s, these changes were implemented throughout
the country, but they also met with resistance from parents and mathematicians,
resulting in so-called ’math wars’.
In the Netherlands (Royal Netherlands Academy of Arts and Sciences, 2009),
a committee was set to work in 1961 to translate the ideas of New Math into
changes of the curriculum, which resulted in publications on a new curriculum in
the late 1970s. Though New Math was the starting point for the committee, the
end result was something quite different: basic skills remained important (though
algorithms to a lesser extent), and clever strategies, estimation, measurement, and
geometry were added to the curriculum (Freudenthal, 1973). This new curriculum
was labeled ’realistic mathematics’, because contexts familiar to students were used
1.2. SOLUTION STRATEGIES IN MATHEMATICS EDUCATION 5
that should make mathematics meaningful. Five core principles were established
for realistic mathematics (Treffers, 1987b): students construct their own knowledge,
making students’ own strategies the starting point; models are used to advance
from informal to more formal approaches; students reflect on their own approaches;
students learn from their own and others’ approaches through interaction; and
students are stimulated find connections between what they have learned. By 2002,
there were only realistic mathematics textbooks on the market for primary schools.
Following a talk that heavily criticized realistic mathematics at a mathematics
education conference in 2007 (Van de Craats, 2008), a national debate started.
1.2.1 Strategy use and performance
As can be seen from this short history description, solution strategies were an
important aspect of the reforms of mathematics education. Algorithms were de-
emphasized in the light of technological advances, while attention for students’
problem solving strategies increased. In realistic mathematics, the informal strate-
gies that students invent themselves are used as the building blocks for formaliza-
tion. Problems do not have a single standardized approach; instead, the multitude
of possible strategies is emphasized through interaction, and students have to make
choices between strategies when they solve a problem. This makes the adaptivity
of strategy choices highly important: selecting the best performing strategy is vital
to performance.
That students do not always choose the optimal strategy from the array at their
disposal is illustrated by Dutch students’ strategy choices for multidigit multipli-
cation and division problems. These are problems with larger or decimal numbers
(e.g., 23 × 56 or 31.2 ÷ 1.2), that were typically solved with algorithms in tra-
ditional mathematics education. Given the challenging nature of the numbers in
these problems, often a variety of informal strategies can be applied (e.g., Fagginger
Auer & Scheltens, 2012), and realistic mathematics also introduced new standard-
ized approaches (Treffers, 1987a). Whereas in the traditional algorithms numbers
are broken up into digits that can be handled without an appreciation of their
magnitude in the whole number, in these new approaches numbers are considered
as a whole. The different approaches have therefore been labeled digit-based and
whole-number-based respectively (Van den Heuvel-Panhuizen, Robitzsch, Treffers,
& Koller, 2009; see Table 1.1 for examples). For multiplication, the digit-based
algorithm is usually learned after the whole-number-based approach, but for quite
some time this was not the case for division (Buijs, 2008; J. Janssen, Van der Schoot,

6 CHAPTER 1. GENERAL INTRODUCTION
Table 1.1: Examples of written work for different multiplication and division strate-
gies for the problems 23× 56 and 544÷ 34.
digit-based
algorithm
whole-number-
based algorithm
non-algorithmic
written
no written
work
23× 56 56 56 1120 + 3× 56 1288
23 × 23 × 1120 + 168
168 18 1288
1120 + 150
1288 120
1000 +
1288
544÷ 34 34/544\16 544 : 34 = 10 × 34 = 340 16
34 340 - 10× 15 × 34 = 510
204 204 16 × 34 = 544
204 102 - 3×0 102
102 - 3×+
0 16×
& Hemker, 2005). The newest editions of some textbooks do include digit-based
division.
The development of students’ strategy use in a context of changing mathematics
education can be followed through national large-scale assessments, of which five
have taken place in the Netherlands since the late 1980s (Wijnstra, 1988; Bokhove,
Van der Schoot, & Eggen, 1996; J. Janssen, Van der Schoot, Hemker, & Verhelst,
1999; J. Janssen et al., 2005; Scheltens, Hemker, & Vermeulen, 2013). Students
write down their calculations in the assessment booklets, and from this written work
strategy use can be inferred (Fagginger Auer, Hickendorff, & Van Putten, 2015).
Analyses of strategy use (Fagginger Auer et al., 2013; Hickendorff et al., 2009)
showed that from 1997 to 2004, the use of digit-based algorithms for multidigit
multiplication and division decreased considerably, as might be expected given the
changes in the curriculum (see Figure 1.1 for strategy use in the assessments of 1997,
2004 and 2011; Table 1.1 provides an example of each of the strategies). However,
use of the whole-number-based algorithms and more informal written approaches
did not increase accordingly; instead, there was a large increase in the number of
problems that were solved without any calculations that were written down. From
2004 to 2011 strategy use remained largely stable, with high levels of answering

1.3. CONTENTS OF THIS DISSERTATION 7
without written work. Follow-up research indicated that this answering without
any written work should be interpreted as mental calculation (Hickendorff, Van
Putten, Verhelst, & Heiser, 2010).
The accuracy of mental strategies was found to be much lower than that of writ-
ten strategies (see percentage correct rates in Figure 1.1). The increasing choices for
an inaccurate strategy rather than for the much more accurate alternatives suggest
that the important educational goal of adaptivity is not attained for a substantial
part of the students. Especially lower ability students and boys appear at risk in
this respect (Hickendorff et al., 2009). The changing strategy choices also appear to
have had considerable consequences for performance: the overall performance level
for the domain of multidigit multiplication and division decreased sharply from
1997 to 2004 (J. Janssen et al., 2005), and remained at that lower level in 2011
(Scheltens et al., 2013).
This also raises the question of how instruction affects students’ performance. As
illustrated by the endings of the paragraphs on the history of mathematics reforms
in the U.S. and the Netherlands, this is a topic that inspires (sometimes heated)
debate. An important contribution to the discussion can be made by empirical
investigations that evaluate the actual effects that the prescribed curriculum and
different instructional practices have on performance. The existing research on the
effects of the curriculum (usually operationalized as the mathematics textbook that
is used) finds those effects to be very limited, though studies often lack proper ex-
perimental design (Royal Netherlands Academy of Arts and Sciences, 2009; Slavin
& Lake, 2008). However, there are considerable effects of teachers’ actual instruc-
tional behaviors (e.g., positive effects of cooperative learning methods and programs
targeting teachers’ skills in classroom management, motivation, and effective time
use; Slavin & Lake, 2008).
1.3 Contents of this dissertation
This dissertation is an investigation of factors that affect students’ mathemati-
cal strategy use and performance. Both instruction (in daily practice and special
interventions) and students’ and teachers’ characteristics are considered. This in-
vestigation is carried out in the context of multidigit multiplication and division at
the end of Dutch primary school. This context has special theoretical and practical
relevance: theoretical because it is an interesting case of developments in strategy
use in reform mathematics; and practical because it constitutes a direct problem in

8 CHAPTER 1. GENERAL INTRODUCTION
1997 2004 20110
25
50
75
assessment year
per
centa
geu
sest
rate
gy
multiplication
digit algorithm (68%)
number algorithm (68%)
non-algorithmic (59%)
no written work (51%)
other (3%)
1997 2004 20110
25
50
75
assessment year
per
centa
geu
sest
rate
gy
division
digit algorithm (61%)
number algorithm (63%)
non-algorithmic (50%)
no written work (22%)
other (4%)
Figure 1.1: Use of the different multiplication and division strategies on the as-
sessments in 1997, 2004 and 2011 (percentage correct per strategy in 2011 is given
between brackets). The lines are broken because the items that are compared for
1997 and 2004 are different from those compared for 2004 and 2011.

1.3. CONTENTS OF THIS DISSERTATION 9
students’ mathematical performance that needs to be addressed. Two approaches
to investigating relations with strategy use and performance are taken: secondary
analyses of large-scale assessment data and experiments in primary schools.
The first approach is taken in Chapter 2 and Chapter 3, which contain secondary
analyses of data from the most recent Dutch large-scale assessment of mathemati-
cal ability at the end of primary school. Many of the students participating in this
assessment solved several multidigit multiplication and division problems, and the
accuracy and strategy use for each of these solutions was coded based on students’
written work. The students’ teachers filled out a questionnaire on their mathemat-
ics instruction: both on general aspects of this instruction and on multiplication and
division instruction more specifically. These teacher reports, and student character-
istics, were related to students’ strategy use (Chapter 2) and to their performance
(Chapter 3).
Investigating these relations posed several statistical challenges: how to deal
with the large number of items from the teacher questionnaire; the multilevel
structure of the data (item responses within students, who are within classes);
the nominal measurement level of the strategies; and the incomplete assessment
design, in which students do not complete all items but only systematically varying
subsets of items. These issues are addressed with latent variable models. In Chap-
ter 2, a first application of multilevel latent class analysis (MLCA) to large-scale
assessment data is demonstrated, and several issues in applying this technique are
discussed. In Chapter 3, a new combination of LASSO penalization and explana-
tory item response theory (IRT) is introduced to deal with the large number of
teacher variables.
The second approach to investigating the relation between instruction and strat-
egy use and performance is taken in Chapter 4 and Chapter 5, which describe
experiments in primary schools. Whereas analyses of large-scale assessments only
allow for the investigation of correlational relations, experiments enable causal in-
ference. The experiments in both chapters focus on mental versus written strategy
use, given the large performance difference between the two, and consider the effects
of student characteristics.
In Chapter 4, it is investigated whether instructing students to write down their
calculations actually improves their performance. In a choice/no-choice experiment
(Siegler & Lemaire, 1997), students first solved a set of division problems with free
strategy choice as usual, but this choice phase of the experiment was followed by
a no-choice phase, in which students were required to write down calculations for

10 CHAPTER 1. GENERAL INTRODUCTION
another version of the set of division problems, and to not do so for a third version.
This experimental set-up allowed for an unbiased assessment of the differences in
accuracy and speed between mental and written strategies, and for an investigation
of the adaptivity of students’ strategy choices. In Chapter 5, it is evaluated what
the effects on spontaneous strategy choices and performance are of a training pro-
gram that features instruction in writing down calculations, using a pretest-posttest
design with a control training condition and a no training condition.
Finally, in Chapter 6, a particular aspect of the comparability of results from the
first approach in Chapters 2 and 3 and the second approach in Chapters 4 and 5 is
considered. It is investigated to which extent strategy and performance results can
be generalized from tasks that only concern one mathematical operation (typical
in experiments) to tasks in which multiple operations are mixed together (typical
in assessments and educational practice). This generalization could be hindered
by task switching costs and strategy perseveration, and the occurrence of these
phenomena is investigated with an experimental comparison of a single-task and a
mixed-task condition.
2
Multilevel latent class analysis for large-scale educational assessment
data: Exploring the relation between the curriculum and students’
mathematical strategies
Abstract
A first application of multilevel latent class analysis (MLCA) to educa-
tional large-scale assessment data is demonstrated. This statistical technique
addresses several of the challenges that assessment data offers. Importantly,
MLCA allows modeling of the often ignored teacher effects and of the joint
influence of teacher and student variables. Using data from the 2011 assess-
ment of Dutch primary schools’ mathematics, this study explores the relation
between the curriculum as reported by 107 teachers and the strategy choices
of their 1619 students, while controlling for student characteristics. Consider-
able teacher effects are demonstrated, as well as significant relations between
the intended as well as enacted curriculum and students’ strategy use. Im-
plications of these results for both more theoretical and practical educational
research are discussed, as are several issues in applying MLCA and possibili-
ties for applying MLCA to different types of educational data.
2.1 Introduction
Latent class analysis (LCA) is a powerful tool for classifying individuals into groups
based on their responses on a set of nominal variables (Hagenaars & McCutcheon,
This chapter has been published as: Fagginger Auer, M. F., Hickendorff, M., Van Putten, C.M., Beguin, A. A., & Heiser, W. J. (2016). Multilevel latent class analysis for large-scale educa-tional assessment data: Exploring the relation between the curriculum and students’ mathematicalstrategies. Applied Measurement in Education.
The research was made possible by the Dutch National Institute for Educational MeasurementCito, who made the assessment data available to us. We would also like to thank Jeroen Vermunt,Anita van der Kooij and Zsuzsa Bakk for their statistical advice.
11

12 CHAPTER 2. MLCA FOR LARGE-SCALE ASSESSMENTS
2002; McCutcheon, 1987). LC models have a categorical latent (unobserved) vari-
able, and every class or category of this latent variable has class-specific probabilities
of responses in the categories of the different observed response variables. As such,
each latent class has a specific typical response pattern where some responses have
a higher and others have a lower probability, and different response profiles of indi-
viduals may be discerned based on this. For example, for a test covering language,
mathematics and science, one latent class of students may have a high probability
of correct responses for mathematics and science items but a lower probability for
language items, while for an other latent class the probability of a correct response
is high for language items and lower for mathematics and science items. These two
classes then reflect different performance profiles.
Relatively recently, the technique of LCA has been extended to accommodate
an additional hierarchical level (Vermunt, 2003): not only the nesting of variables
within individuals is included in the model, but also the nesting of individuals
in some higher level group (e.g., students within school classes). This multilevel
LCA (MLCA) is beginning to be applied more and more in various areas, such as
psychiatry (Derks, Boks, & Vermunt, 2012), political science (Morselli & Passini,
2012), and education (Hsieh & Yang, 2012; Mutz & Daniel, 2011; Vermunt, 2003).
In the current investigation, we describe a first application of MLCA to educational
large-scale assessment data.
2.1.1 MLCA for educational large-scale assessment data
MLCA can address several of the challenges of large-scale assessment data. A
first challenge that many large-scale assessments offer is that they employ so-called
incomplete designs: the complete item set is too large to be administered in full to
students, and is therefore decomposed into smaller subsets. Relating these subsets
to each other is difficult using traditional techniques, but is possible using a latent
variable to which all items are related (Embretson & Reise, 2000; Hickendorff et al.,
2009), such as the latent class variable in LCA. No imputation of missing responses
on the items that were not administered is necessary, as the likelihood function
of the analysis is only based on cases’ observed responses (Vermunt & Magidson,
2005). A second challenge is the complexity of modeling cognitive phenomena that
are not measured on an interval but on a nominal level (such as solution strategy
use, item correctness or error types). Nominal response variables are naturally
accommodated by (M)LCA.
The third challenge that MLCA addresses is the inherent multilevel structure of

2.1. INTRODUCTION 13
educational data (items nested within students, who are nested within teachers and
schools). Previous applications of LCA (and also of other techniques) to students’
responses on cognitive tests have generally ignored the teacher (or school) level in
their modeling (e.g., Geiser, Lehman, & Eid, 2010; Hickendorff et al., 2009, 2010;
Lee Webb, Cohen, & Schwanenflugel, 2008; Yang, Shaftel, Glasnapp, & Poggio,
2005). Yet, the context of learning is vital to its outcomes. Zumbo et al. (2015)
recently proposed an ecological model of item responding where responses are in-
fluenced by contextual variables at various levels: characteristics of the test, of the
individual, of the teacher and school, of the family and ecology outside of school,
and of the larger community. Based on this model, the authors demonstrate eco-
logically moderated differential item functioning (DIF) where different factors in
this broader context play a role.
The consideration of a broader context fits in very well with MLCA, as its mul-
tilevel aspect makes it especially suited for the incorporation of contextual factors
in models of students’ item responses. Predictors at different hierarchical levels
can be included in the model, a feature that is naturally called for in modeling the
effects of both student and teacher characteristics on students’ item solving.
In the current investigation, we therefore demonstrate the use of MLCA for
educational large-scale assessment data, by applying it to data from the most recent
large-scale assessment of Dutch sixth graders’ mathematics. We investigate the
relation between the curriculum on the one hand and students’ use of solution
strategies on the other (while controlling for student characteristics), and describe
the technique of MLCA and some of the challenges in its application in more detail.
2.1.2 Curriculum effects on students’ mathematical
achievement and strategies
Recent reviews of research on the effects of mathematics teaching have concluded
that the influence of the intended curriculum (as it is formally laid down in cur-
riculum guides and textbooks; Remillard, 2005) on achievement is very small, while
changes in the enacted curriculum of daily teaching practices have a much larger
influence (Slavin & Lake, 2008). These findings are based mainly on small experi-
ments, and can be supplemented using large-scale assessment data, which does not
allow for causal inference but does offer much larger samples and representative
descriptions of the natural variation in daily teaching practices (Slavin, 2008).
Previous research has indicated that this variation in instruction has substan-
tial effects on students’ achievement growth (Nye, Konstantopoulos, & Hedges,

14 CHAPTER 2. MLCA FOR LARGE-SCALE ASSESSMENTS
2004; Rowan, Correnti, & Miller, 2002). In identifying the factors that determine
teachers’ influence on students’ mathematical achievement, a line of research called
’education production function research’ has focused on the effects of available re-
sources. Generally, routinely collected information on teachers’ resources (such as
their education level) has failed to show consistent, sizable effects (e.g., Jepsen,
2005; Nye et al., 2004; Wenglinsky, 2002), while more in-depth teacher resource
measurements (such as knowledge for mathematical teaching) show more consis-
tent positive effects (Hill, Rowan, & Ball, 2005; Wayne & Youngs, 2003). The more
process-focused line of ’process-product research’ has most notably found positive
effects of active teaching, which involves teachers’ direct instruction of students in
formats such as lecturing, leading discussions, and interaction during individual
work (as described by Hill et al., 2005, and Rowan et al., 2002), as contrasted
with frequent independent work of students and working on nonacademic subjects.
Also, positive effects have been found of reform-oriented classroom practice, which
involves activities such as exploring possible methods to solve a mathematical prob-
lem (Cohen & Hill, 2000).
These results all concern curriculum effects on students’ mathematical achieve-
ment, but the mathematical strategies of students that are the focus of this inves-
tigation are also of great interest. The various reforms in mathematics education
that have taken place in a number of countries in the past decades (Kilpatrick,
Swafford, & Findell, 2001) share a view on strategy use that moves away from
product-focused algorithmic approaches towards process-focused approaches with
more space for students’ own strategic explorations (Gravemeijer, 1997). Investigat-
ing which instructional practices elicit particular patterns of strategy choices may
shed light on how reforms actually affect students’ behavior. On a more theoretical
level, the literature on children’s choices between and performance with mathemati-
cal strategies has so far focused on the effects of children’s individual characteristics
and of the nature of the mathematical problems that are offered (e.g., Hickendorff
et al., 2010; Imbo & Vandierendonck, 2008; Lemaire & Lecacheur, 2011; Lemaire
& Siegler, 1995), and may therefore be extended by also exploring the effects of
instruction.
2.1.3 Multidigit multiplication and division strategies in the
Netherlands
An illustration of the connection between mathematics reforms and changes in
strategy choices is provided by previous research on multidigit multiplication and

2.1. INTRODUCTION 15
Table 2.1: Examples of the digit-based algorithms, whole-number-based algorithms,
and non-algorithmic strategies applied to the multiplication problem 23 × 56 and
the division problem 544÷ 34.
strategy multiplication division
digit-based algorithm 56
23×168
1120+
1288
34/544\16
34
204
204
0
whole-number-based algorithm 56
23×18
150
120
1000+
1288
544 : 34 =
340 - 10×204
102 - 3×10²
102 - 3×+
0 16×non-algorithmic written strategies 1120 + 3 × 56
1120 + 168
1288
10 × 34 = 340
13 × 34 = 442
16 × 34 = 544
division strategies in the Dutch situation (Hickendorff, 2011; J. Janssen et al., 2005).
Multidigit multiplication and division go beyond simple multiplication table facts
(such as 5×6 or 72÷8) and require operations on larger numbers or decimal numbers
(such as 56×23 or 544÷16). The Dutch mathematics education reform introduced
new algorithmic ’whole-number-based’ approaches for these multidigit operations,
where every step towards obtaining the solution requires students to understand the
magnitude of the numbers they are working with (Treffers, 1987a). This approach
deviates from the more traditional ’digit-based’ algorithms, where the numbers
are broken up into digits that can be handled without an appreciation of their
magnitude in the whole number (see Table 2.1 for examples of both algorithms).
In general, Dutch children’s learning trajectory consists of first learning the whole-
number-based multiplication and division algorithms, and later switching to the
digit-based algorithm for multiplication (and in some schools, also for division;
Buijs, 2008).
Using data from large-scale assessments, it was demonstrated that with grow-
ing adoption of reform-based mathematics textbooks in Dutch elementary schools,
many primary school students abandoned the digit-based algorithms for multidigit
16 CHAPTER 2. MLCA FOR LARGE-SCALE ASSESSMENTS
multiplication and division and switched to answering without writing down any
calculations (mental calculation; Hickendorff et al., 2010) instead. These mental
calculation strategies were found to be much less accurate than written strategies
(digit-based or other) (Hickendorff, 2011; Hickendorff et al., 2009), and were used
more by boys, students with low mathematical proficiency, and lower SES students.
2.1.4 The present study
In the present study, MLCA is used to investigate the relation between both the
intended and enacted curriculum and the use of solution strategies for multidigit
multiplication and division items by 1619 Dutch sixth graders (11-12-year-olds).
The intended curriculum is operationalized as the mathematics textbook and the
enacted curriculum as the self-reports on mathematics teaching practices of the stu-
dents’ 107 teachers. The data are from the most recent (2011) large-scale national
assessment of the mathematical abilities of Dutch students at the end of primary
school (Scheltens et al., 2013).
Hypotheses
Based on previous research on Dutch students’ multiplication and division strategy
use by Hickendorff (2011), we expect to find a considerable group of students who
mostly answer without written calculations (with relatively many boys, students
with low mathematical proficiency, and lower SES students), one group where stu-
dents mostly use the digit-based algorithm, and one group where students mostly
use the whole-number-based algorithm or non-algorithmic approaches. Hickendorff
(2011) considered multiplication and division in isolation, but we consider them si-
multaneously and can therefore analyze the relation between individual differences
in strategy use on multiplication and division items. For example, there may be a
group of students who prefer the digit-based algorithm for multiplication and the
whole-number-based algorithm for division, matching the most common end points
of the respective learning trajectories.
The lack of research on the effects of the curriculum on strategy use makes
it hard to make strong predictions in that area, but a tentative generalization of
curriculum effects on achievement suggests that the effects of the enacted curricu-
lum might be greater than those of the intended curriculum - though this could be
countered by the fact that the mathematics textbooks which form the intended cur-
riculum are an important direct source of strategy instruction. As for the particular

2.1. INTRODUCTION 17
effects of the enacted curriculum, the previously discussed achievement literature
described positive effects of direct instruction rather than independent work, so
these activities might affect choices for more accurate (written) or less accurate
(mental) strategies. Differentiated instruction might also have such effects, espe-
cially because of the association between ability and strategy choices. Furthermore,
we expect effects of teachers’ strategy instruction in algorithms, mental calculation,
and strategy flexibility, because of the apparent direct connection to students’ strat-
egy use.
Issues in applying MLCA
The application of MLCA with predictors which is the focus of the present study
comes with several practical issues that require attention. The first is the speci-
fication of the multilevel effect in the model. The common parametric approach
specifies a normal distribution for group (in our case, teacher) deviations from the
overall parameter value, but this distributional assumption is strong and the inter-
pretation of such group effects is abstract. The nonparametric approach proposed
by Vermunt (2003) instead creates a latent class variable for the groups (in addition
to the latent class variable for the individuals), requiring less strong distributional
assumptions, making computations less intensive, and allowing for easier substan-
tive interpretation. Therefore, we will use the nonparametric approach.
The second issue is the inclusion of predictors in the model, as discussed by
Bolck, Croon, and Hagenaars (2004). In the so-called one-step approach, the mea-
surement part of the model (the part of the model without predictors) and the
structural part (the predictor part) are estimated simultaneously. While this leads
to unbiased effect estimates, the number of models that needs to be fitted and com-
pared can quickly become unfeasible (all combinations of lower level and higher
level latent class structures, combined with all predictor structures). In addition,
the structural part of the model may influence the measurement part: individuals’
class membership may be different with and without predictors. These problems do
not occur in the three-step approach, where the measurement model without any
predictors is fitted first, then individual class membership predictions are computed,
and finally these class membership predictions are treated as observed variables in
an analysis with the predictors. However, this approach treats class membership
as deterministic and leads to systematic underestimation of the effects of the pre-
dictors. This can be corrected by taking into account the misclassification in the
second step during the final third step (Asparouhov & Muthen, 2014). Therefore,

18 CHAPTER 2. MLCA FOR LARGE-SCALE ASSESSMENTS
we will use this corrected three-step approach.
The third issue is the selection of the best model. This is usually done based on
information criteria that consider model fit and complexity simultaneously, such as
the popular Aikaike en Bayesian Information Criterion (AIC and BIC). However,
these criteria penalize model complexity differently and therefore often identify
different models as optimal (Burnham & Anderson, 2004). The issue is further
complicated with the introduction of a multilevel effect, because the BIC penaliza-
tion depends on sample size, and it is then unclear whether to use the number of
individuals or groups for that (Jones, 2011). Lukociene and Vermunt (2010) inves-
tigated this issue and demonstrate optimal performance of the group-based BIC,
and underestimation of complexity by the individual-based BIC and overestimation
by the AIC. In our analyses, model selection with all three criteria is compared.
2.2 Method
2.2.1 Sample
For our data from the most recent large-scale assessment of the mathematical abil-
ities of Dutch students, 107 schools from the entire country were selected according
to a random sampling procedure stratified by socioeconomic status. From a total
of 2548 participating sixth graders (11-12-year-olds) in those schools, 1619 students
from the classes of 107 teachers (one teacher per school, between 5 and 25 students
per school in most cases) solved multidigit multiplication and division problems
(because of the incomplete assessment design, not all students solved this type of
problems). Of the 1619 children, 49 percent were boys and 51 percent were girls.
Fifty percent of the children had a relatively higher general scholastic ability level,
as they were to go to secondary school types after summer that would prepare them
for higher education, while the other 50 percent were to go to vocational types of
secondary education. In terms of SES, most children (88 percent) had at least one
parent who completed at least two years of secondary school, while 12 percent did
not.
Different mathematics textbooks were used on which the children’s mathemat-
ics instruction was based. These textbooks are part of a textbook series that is
used for mathematics instruction throughout the various grades of primary school,
and are therefore not (solely) determined by the sixth grade teacher. All textbooks
in our sample could be considered reform-based, but they differ in instruction ele-
ments such as lesson structure, differentiation, and assessment. Textbooks from six

2.2. METHOD 19
Table 2.2: The content of the thirteen multidigit multiplication problems and eight
multidigit division problems in the assessment, and the strategy use frequency on
each item.
strategy use (percent)
problem context DA WA NA NW U O N
M01 9 × 48 = 432 yes 39 4 24 30 2 2 368
M02 23 × 56 = 1288 yes 45 6 21 17 5 6 358
M03 209 × 76 = 15884 no 49 5 24 12 7 3 344
M04 35 × 29 = 1015 yes 40 4 28 23 3 2 353
M05 35 × 29 = 1015 no 43 4 23 24 3 3 352
M06 24 × 37.50 = 900 no 39 2 31 18 6 5 352
M07 9.8 × 7.2 = 70.56 no 40 3 17 27 10 3 352
M08 8 × 194 = 1552 yes 43 3 25 27 2 1 355
M09 6 × 192 = 1152 no 33 2 33 23 4 5 352
M10 1.5 × 1.80 = 2.70 yes 1 0 13 79 3 4 353
M11 0.18 × 750 = 135 no 41 2 16 27 12 2 356
M12 6 × 14.95 = 89.70 yes 32 1 29 34 2 2 359
M13 3340 × 5.50 = 18370 yes 41 3 23 18 10 5 359
D01 544 ÷ 34 = 16 yes 18 32 5 27 10 7 368
D02 31.2 ÷ 1.2 = 26 no 9 10 6 50 18 7 369
D03 11585 ÷ 14 = 827.5 yes 17 30 4 32 10 7 345
D04 1470 ÷ 12 = 122.50 yes 19 25 11 31 12 3 350
D05 1575 ÷ 14 = 112.50 no 17 30 16 22 12 3 355
D06 47.25 ÷ 7 = 6.75 yes 17 25 10 33 10 5 352
D07 6496 ÷ 14 = 464 yes 16 24 5 36 12 7 354
D08 2500 ÷ 40 = 62 yes 12 15 11 45 6 11 359
total multiplication 37 3 24 28 5 3 4613
total division 16 24 9 35 11 6 2852
Note: Parallel versions of problems not yet released for publication are in ital-
ics. DA=digit-based algorithm, WA=whole-number-based algorithm, NA=non-
algorithmic written, NW=no written work, U=unanswered, O=other
different methods were used in our sample: Pluspunt (PP; used by 37% percent of
the teachers in our sample); Wereld in Getallen (WiG; 30%); Rekenrijk (RR; 14%);
Alles Telt (AT; 11%); Wis en Reken (6%); and Talrijk (2%).

20 CHAPTER 2. MLCA FOR LARGE-SCALE ASSESSMENTS
2.2.2 Materials
Multiplication and division problems
The assessment contained thirteen multidigit multiplication and eight division prob-
lems, of which students solved systematically varying subsets of three or six prob-
lems according to an incomplete design (see Hickendorff et al., 2009, for more de-
tails on such designs). The problems are given in Table 2.2, including whether the
problem to be solved was provided in a realistic context (such as determining how
many bundles of 40 tulips can be made from 2500 tulips). Students were allowed
to write down their calculations in the ample blank space in their test booklets,
and these calculations were coded for strategy use. Six categories were discerned:
the aforementioned digit-based and whole-number-based algorithms, written work
without an algorithmic notation (such as only writing down intermediate steps), no
written work, unanswered problems, and other (unclear) solutions (see Table 2.1
for examples). The coding was carried out by the first and third author and three
undergraduate students, and interrater agreement was high (Cohen’s κ’s (J. Cohen,
1960) of .90 for the multiplication and .89 for the division coding on average, based
on 112 multiplication and 112 division solutions categorized by all).
Teacher survey about classroom practice
The teachers of the participating students filled out a survey about their mathemat-
ics teaching practices. The 14 questions in the survey that concerned multiplication,
division, and mental calculation strategy instruction were used to create four scores
(by taking the mean of the standardized responses to the questions), as were the 10
questions that concerned instruction formats, and the 10 questions that concerned
instruction differentiation. The Appendix gives the questions that were used to
create each score.
2.2.3 Multilevel latent class analysis
We estimated latent classes of students reflecting particular strategy choice pro-
files using MLCA, which classifies respondents in latent classes that are each char-
acterized by a particular pattern of response probabilities for a set of problems
(Goodman, 1974; Hagenaars & McCutcheon, 2002). For our case, let Yijk denote
the strategy choice of student i of teacher j for item k. A particular strategy choice
on item k is denoted by sk. The latent class variable is denoted by Xij , a particular
latent class by t, and the number of latent classes by T . The full vector of strategy

2.2. METHOD 21
choices of a student is denoted by Yij and a possible strategy choice pattern by s.
This makes the model:
P (Yij = s) =
T∑t=1
P (Xij = t)
K∏k=1
P (Yijk = sk|Xij = t). (2.1)
In this model, the general probability of a particular pattern of strategy choices,
P (Yij = s), is decomposed into T class-dependent probabilities,K∏k=1
P (Yijk =
sk|Xij = t). These class-dependent probabilities are each weighted by the proba-
bility of being in that latent class, P (Xij = t). The interpretation of the nature of
the latent classes is based on the class-dependent probabilities of strategy choices
on each of the problems, P (Yijk = sk|Xij = t). The model is extended with a
multilevel component by adding a latent teacher class variable, on which students’
probability of being in each latent student class (P (Xij = t)) is dependent. Predic-
tors at the teacher and student level that influence class probabilities can also be
added, as described by Vermunt (2003, 2005). For such a multilevel model with one
teacher-level predictor Z1j and one student-level predictor Z2ij , let Wj denote the
latent teacher class that that teacher j is in, with m denoting a particular teacher
class. The model then becomes:
P (Xij = t|Wj = m) =exp(γtm + γ1tZ1j + γ2tZ2ij)T∑r=1
exp(γrm + γ1rZ1j + γ2rZ2ij)
. (2.2)
See Henry and Muthen (2010) for graphical representations of this type of mod-
els.
The MLCA was conducted with version 5.0 of the Latent GOLD program
(Vermunt & Magidson, 2013). All thirteen multiplication and eight division strat-
egy choice variables were entered as observed response variables and a teacher
identifier variable as the grouping variable for the multilevel effect. Models with
latent structures with up to eight latent student classes and eleven latent teacher
classes were fitted, and the model with the optimal structure was selected using the
AIC and BICs. Using the three-step approach (Bakk, Tekle, & Vermunt, 2013),
this measurement model was then fixed and curriculum and student predictors
were added to the model in groups, because of the high number of predictors. The
successive models were compared using information criteria and the best model
was investigated in more detail by evaluating the statistical significance of each of
the predictors with a Wald test. The practical significance of the predictors was

22 CHAPTER 2. MLCA FOR LARGE-SCALE ASSESSMENTS
evaluated based on the magnitude of the changes in the probability of class mem-
berships associated with different levels of the predictors. Effect coding was used
for all predictors.
2.3 Results
2.3.1 The latent class measurement model
For the LC measurement models fitted on the strategy data, both the AIC and BICs
(see Table 2.3) show that adding a multilevel structure greatly improves model fit,
signifying a considerable within-teacher dependency of observations. While the AIC
identifies a very complex model as optimal (ten latent teacher classes and six latent
student classes), the BICs are in near agreement on a more simple model (four
latent teacher classes and three or four latent student classes). Of these simpler
models, the model with four student classes has a much clearer interpretation and
is also favored by the group-based BIC that is optimal according to Lukociene and
Vermunt (2010). This model has an entropy R2 of .87 for the latent student classes
and .82 for the teacher classes, which both indicate a high level of classification
certainty (Dias & Vermunt, 2006).
We also estimated measurement models with a parametric rather than a non-
parametric teacher effect (see the bottom part of Table 2.3). The parametric model
with the lowest group-based BIC also had four student classes, and the class-specific
probabilities of these classes were very similar to those of the classes in the non-
parametric model (indicating very similar nature of the classes), but the classes
differed considerably in size in the two approaches (by 13, 4, 25, and 15 percentage
points respectively). Latent teacher classes cannot be compared as there are none in
the parametric approach, which also prevents later easy substantive interpretation
of the multilevel effect. The fit of the best parametric model was not better than
that of the best non-parametric model according to the information criteria, and
the entropy R2 for the student classes of the parametric model was lower (.80).
Latent student classes
Overall, students solved multiplication problems most often with the digit-based
algorithm, while solutions without written work were most frequent for division (see
Table 2.2 for frequencies for each strategy). The class-dependent probabilities of
choosing each strategy in each of the four latent student classes are given in Table

2.3. RESULTS 23
Table 2.3: Fit statistics for the non-parametric and parametric multilevel latent
class models.
latent classes BIC
teachers students LL parameters AIC individual group
1 (no multi- 2 -9801 209 20020 21146 20587
level effect) 3 -9388 314 19403 21096 20242
4 -9165 419 19169 21427 20289
5 -8964 524 18976 21800 20376
2 2 -9717 211 19856 20993 20419
3 -9253 317 19141 20849 19988
4 -8912 423 18670 20950 19800
5 -8713 529 18484 21335 19898
3 2 -9707 213 19839 20987 20408
3 -9207 320 19054 20779 19910
4 -8819 427 18491 20792 19632
5 -8614 534 18295 21173 19723
4 2 -9705 215 19840 20999 20415
3 -9178 323 19002 20743 19865
4 -8790 431 18441 20764 19593
5 -8585 539 18248 21153 19688
5 2 -9705 217 19844 21013 21965
3 -9220 326 19092 20849 19963
4 -8866 435 18257 21189 19711
5 -8584 544 18234 21167 19689
parametric 2 -9708 210 19836 20968 20397
3 -9205 316 19042 20745 19887
4 -8861 422 18566 20841 19694
5 -8661 528 18377 21223 19789
Note: The lowest BICs are bold. The lowest AIC was for 10 teacher and 6 student
classes.

24 CHAPTER 2. MLCA FOR LARGE-SCALE ASSESSMENTS
Table 2.4: The mean probabilities of choosing each of the six strategies for the
multiplication and division problems for each latent class.
strategy probability (proportion students in class)
NW class (.31) MA class (.29) NA class (.21) DA class (.20)
strategy × ÷ × ÷ × ÷ × ÷DA .06 .01 .71 .01 .04 .03 .68 .70
WA .01 .02 .02 .54 .14 .37 .02 .01
NA .25 .03 .15 .10 .68 .21 .16 .03
NW .52 .65 .10 .24 .08 .22 .10 .17
U .13 .23 .02 .06 .03 .08 .03 .03
O .04 .05 .02 .05 .04 .10 .02 .06
Note: The highest probability per operation within a class is in boldface. MA=mixed
algorithm, see Table 2.2 for other abbreviations.
2.4, which shows that every latent student class is dominated by high probabilities
of choosing one or two strategies.
The largest student class (with a class probability of .31, i.e., containing 31
percent of students) is characterized by a high probability of answering without
written work for every item, and also a considerable probability of leaving prob-
lems unanswered (especially division problems). Because of this, we label this class
the ’no written work class’. The second largest student class (probability of .29)
is characterized by a high probability of solving multiplication problems with the
digit-based algorithm and a high probability of solving division problems with the
number-based algorithm (the ’mixed algorithm class’). The third largest student
class (probability of .21) is characterized by a high probability of solving multi-
plication problems with non-algorithmic written strategies and a mixture of the
number algorithm, non-algorithmic written strategies and no written work for the
division problems (the ’non-algorithmic written class’). The smallest student class
(probability of .20) is characterized by a high probability of solving both multiplica-
tion and division problems with digit-based algorithms (the ’digit-based algorithm
class’.)
Latent teacher classes
The latent student class probabilities (or sizes) from Table 2.4 are the mean for all
the teachers. Within the four latent teacher classes, the student class probabilities
differ greatly. As can be seen in Table 2.5, the probability of the digit algorithm

2.3. RESULTS 25
Table 2.5: The latent student class probabilities in each of the four latent teacher
classes.
latent student class probability
latent teacher class NW MA NA DA
1 (P = .39) .27 .61 .11 .00
2 (P = .30) .38 .08 .51 .02
3 (P = .19) .23 .00 .03 .74
4 (P = .12) .34 .22 .09 .36
total .31 .29 .21 .20
Note: The highest latent student class probability within a latent teacher class is in
boldface. See Table 2.2 and 2.4 for abbreviations.
class varies most over teacher classes (between .00 and .74), followed by that of
the mixed algorithm class (between .00 and .61), and that of the non-algorithmic
written class (between .03 and .51). The probability of the no written work class
varies relatively little over teacher classes (between .23 and .38). The largest teacher
class (size of .39) is characterized by a high probability of the mixed algorithm class,
the second largest teacher class (.30) by a high probability of the non-algorithmic
written strategy class, the third largest teacher class (.19) by a high probability of
the digit-based algorithm class, and the smallest teacher class (.12) by substantial
probabilities for all classes except the non-algorithmic written class.
These insightful results on the magnitude and nature of teachers’ effects illus-
trate one of the advantages of the nonparametric specification of the multilevel
effect.
2.3.2 Adding predictors to the latent class model
Next, the structural part was added to the model: predictors for students’ prob-
ability of being in a particular latent strategy class. First the relation between
the intended and enacted curriculum(textbook and instruction) was investigated,
using a MANOVA with textbook as the between-group independent variable and
the twelve teachers’ instruction scores as the dependent variables. No significant
relation was found, Wilks′ λ = .57, F (48, 322) = 1.05, p = .39. Next, student
characteristics and intended and enacted curriculum predictors were added to the
model in a stepwise fashion. As can be seen in Table 2.6, according to both BICs
model fit is best with only the student characteristics as predictors, whereas the
AIC identifies the more complex model with all predictors as optimal. The group-

26 CHAPTER 2. MLCA FOR LARGE-SCALE ASSESSMENTS
Table 2.6: Fit statistics for the latent class models with successively added predic-
tors.
BIC
predictors added to the model LL pars AIC individual group
none -1651 15 3333 3414 3373
student char. gender, ability, SES -1569 24 3186 3315 3250
intended curr. textbook -1550 36 3172 3366 3268
enacted curr. strategy instruction -1517 48 3129 3388 3257
instruction formats -1500 60 3120 3443 3280
instruction diff. -1479 72 3103 3491 3295
Note: The lowest information criteria are in boldface.
based BIC is nearly as low for the model with the textbook and strategy instruction
predictors added as for the model with only student predictors (3257 vs. 3250).
Since curriculum effects were our primary interest, we chose to proceed with this
more extensive model.
The statistical significance of the covariates in this model was evaluated with
Wald tests, and the magnitude of the effects is illustrated by comparisons of the
probabilities of membership of the latent student classes for individuals at the dif-
ferent levels of the predictors (see Table 2.7). These probabilities were calculated
with all of the other selected predictors in the model set at their mean. For the
interval-level instruction variables, probabilities are compared for students of teach-
ers who score one standard deviation above the mean of that variable and students
of teachers who score one standard deviation below the mean. Probabilities for the
different levels of a predictor that differ by .10 or more are discussed.
Student characteristics
Student gender had a significant effect on class probabilities, W 2 = 107.1, p < .001,
with the probability of being in the no written work class being .33 higher for boys
than for girls. The probability of being in the mixed algorithm class was .17 higher
for girls than for boys. Students’ general scholastic ability also had a significant
effect, W 2 = 53.0, p < .001, with the probability of being in the no written work
class being.25 higher for students with a lower compared to a higher ability, and
the probability of being in the non-algorithmic class .12 lower. SES also had a
significant effect, W 2 = 8.4, p = .04, but class probability differences between
children with a different SES were all smaller than .10.

2.3. RESULTS 27
Tab
le2.
7:S
tud
ents
’p
rob
abilit
ies
of
mem
ber
ship
ofth
efo
ur
late
nt
stu
den
tcl
ass
esfo
rd
iffer
ent
leve
lsof
the
stu
den
t
char
acte
rist
ics
and
the
inte
nd
edan
den
act
edcu
rric
ulu
mp
red
icto
rs.
diff
eren
cein
pro
babilit
yof
class
mem
ber
ship
[95%
confiden
cein
terv
al]
pre
dic
tor
com
pare
dto
no
wri
tten
work
mix
edalg
ori
thm
non-a
lgori
thm
icdig
italg
ori
thm
gen
der
boy
sgir
ls+.33
[+.3
1,+
.34]
−.17
[-.1
7,-
.16]
−.0
9[-
.09,-
.08]
−.0
7[-
.08,-
.07]
abilit
ylo
wer
hig
her
+.25
[+.2
3,+
.26]
−.0
9[-
.09,-
.09]
−.12
[-.1
3,-
.11]
−.0
4[-
.05,-
.04]
SE
Slo
wnot
low
+.0
6[+
.03,+
.09]
−.0
4[-
.05,-
.03]
+.0
3[+
.02,+
.05]
−.0
5[-
.07,-
.04]
textb
ook
PP
tota
l+.0
4[+
.02,+
.06]
−.0
5[-
.06,-
.05]
+.14
[+.1
3,+
.14]
−.13
[-.1
4,-
.12]
WiG
tota
l+.0
6[+
.04,+
.07]
+.0
9[+
.09,+
.10]
−.0
8[-
.07,-
.09]
−.0
8[-
.08,-
.07]
RR
tota
l+.0
6[+
.03,+
.09]
+.0
9[+
.07,+
.11]
+.0
1[+
.00,+
.02]
−.16
[-.1
7,-
.16]
AT
tota
l+.0
3[+
.01,+
.05]
−.16
[-.1
6,-
.16]
+.13
[+.1
2,+
.14]−.0
1[-
.02,+
.00]
oth
erto
tal
−.0
5[-
.08,-
.02]
−.14
[-.1
5,-
.13]
+.0
4[+
.02,+
.06]
+.14
[+.1
1,+
.16]
dig
it×
+1SD
−1SD
−.0
8[-
.12,-
.05]
+.25
[+.1
8,+
.27]
−.14
[-.1
4,-
.12]
−.0
2[-
.03,-
.01]
dig
it÷
+1SD
−1SD
+.0
3[+
.00,+
.07]
−.18
[-.1
8,-
.17]
−.12
[-.1
4,-
.11]
+.26
[+.2
4,+
.29]
men
tal
+1SD
−1SD
−.0
5[-
.09,-
.02]
+.18
[+.1
8,+
.18]
+.0
2[+
.00,+
.04]
−.15
[-.1
7,-
.13]
more
+1SD
−1SD
+.18
[.+
.13,+
.22]
−.35
[-.3
6,-
.33]
+.0
9[+
.08,+
.10]
+.0
8[+
.05,+
.10]
No
te:
Pro
babilit
ies
for
diff
eren
tle
vel
sof
apre
dic
tor
that
diff
erby
.10
or
more
are
inb
old
face
.

28 CHAPTER 2. MLCA FOR LARGE-SCALE ASSESSMENTS
Intended curriculum
Mathematics textbook had a significant effect, W 2 = 123.6, p < .001. Students
being instructed from the Pluspunt (PP) textbook had a probability for the non-
algorithmic class that is .14 higher than than that of the total, and a .13 lower
probability for the digit-based algorithm class. Students with the Rekenrijk (RR)
textbook had a .16 lower probability for the digit algorithm class. Students with
the Alles Telt (AT) textbook had a .16 lower probability of being in the mixed
algorithm class and a .13 higher probability of being in the non-algorithmic written
class. Students with other textbooks had .14 lower probability of being in the mixed
algorithm class and a .14 higher probability of being in the digit algorithm class.
Enacted curriculum
All strategy instruction scores had significant effects. When comparing students
whose teacher scored one standard deviation above the mean in their focus on
the digit-based algorithm for multiplication to students whose teacher scored one
standard deviation below the mean (and who were thus more focused on the
whole-number-based algorithm for multiplication), their probability of being in the
mixed algorithm class was .25 higher, while their probability of being in the non-
algorithmic written class was .14 lower, W 2 = 36.6, p < .001. Students whose
teacher scored above rather than below the mean for digit-based division had a .26
higher probability of being in the digit algorithm class, and a .18 and .12 lower
probability of being in the mixed algorithm and non-algorithmic written class re-
spectively, W 2 = 100.9, p < .001 . Students whose teacher scored above rather
than below the mean in their attention to various aspects of mental calculation
had a .18 higher probability of being in the mixed algorithm class and a .15 lower
probability of being in the digit algorithm class, W 2 = 49.0, p < .001. Students
whose teachers scored above rather than below the mean for the use of multiple
strategies per operation type, had a .35 lower probability of being in the mixed
algorithm class and a .18 higher probability of being in the no written work class,
W 2 = 54.0, p < .001.
2.4 Discussion
The present study demonstrated a first application of MLCA to educational large-
scale assessment data. We argued that this technique is especially suitable for the
challenges of this type of data and for evaluating contextual effects on problem

2.4. DISCUSSION 29
solving (Zumbo et al., 2015). We demonstrated the added value of adequately
modeling the multilevel structure inherent to educational data: though teacher
effects are often ignored by researchers, we found them to be considerable. Model
fit was much better with than without a multilevel structure for the teacher level,
and latent teacher groups were found with large differences in students’ probability
of having a certain strategy choice profile. Ignoring teacher effects therefore seems
to result in the omission of a crucial part of the model, and thereby in an incomplete
representation of reality. The present study also demonstrated the relevance of the
possibility of including predictors at different hierarchical levels in the model by
simultaneously controlling for student characteristics and investigating curriculum
effects, which led to interesting results relevant to both educational practice and
theory.
2.4.1 Substantive conclusions
The results with regard to strategy choice profiles (or latent classes) that were found
were largely in line with our hypotheses: there were profiles dominated by answering
without written work, by the digit-based algorithm, by non-algorithmic approaches
and the whole-number-based algorithm, and by both algorithms depending on the
operation (multiplication or division). Students’ probability of being in each of these
classes was found to depend strongly on the teacher, because it varied considerably
between latent teacher groups. The range was largest for the algorithmic classes
and smallest for the no written work class. Therefore, teachers appear to have
large effects effects on students’ strategy use, but these effects unfortunately seem
smallest for the inaccurate mental strategies without written work.
Intended and enacted curriculum predictors were added, controlling for student
characteristics. Consistent with previous research findings, boys and students who
were going to a lower secondary school level were more likely to answer without writ-
ten work. The intended curriculum and enacted curriculum were not significantly
related to each other, and were both found to be related to strategy choices, despite
the suggestion from the literature of limited effects of the intended curriculum. As
for the intended curriculum, the textbooks mostly appeared to be related to stu-
dents’ probability of using the different algorithmic and non-algorithmic written
strategies.
As for the enacted curriculum, its relation to strategy use appeared somewhat
stronger than that of the intended curriculum. Teaching digit-based algorithms
was associated with an accordingly higher use of these strategies, while teaching
30 CHAPTER 2. MLCA FOR LARGE-SCALE ASSESSMENTS
whole-number-based algorithms appeared to have the unexpected side-effect of a
higher use of non-algorithmic written strategies. Devoting more attention to men-
tal strategies was associated with higher probability of the mixed algorithm class
and lower probability of the digit-based algorithm class. Teaching more than one
strategy per operation was associated with lower probability of the mixed algorithm
class and higher probability of the no written work class. Instruction formats did
not have significant effects on strategy use, thereby not confirming our expectations
regarding the effects of direct instruction versus independent work. Instruction dif-
ferentiation also did not have a significant effect.
2.4.2 Limitations
A limitation of the present study could be the sample size, which is both relevant
for the estimation of the complex MLCA models and the generalizability of the
results. As for the sample size required for the estimation of MLCA models (or
LCA models more generally), there are no general rules of thumb. Our sample
of 1619 students with 107 teachers seems to be of a similar order of magnitude
as those in the examples used by Vermunt (2003) in his introduction of MLCA,
where applications were featured with 886 employees in 41 teams, 2156 students
in 97 schools, and 3584 respondents in 32 countries. A more precise estimate for a
specific situation can be made using Monte Carlo simulations, where factors such
as the number and type of problems, the separation of the classes and their relative
sizes (approximately equal or not) and the amount of missing data play a role
(Muthen & Muthen, 2002; Nylund, Asparouhov, & Muthen, 2007). Nylund et al.
(2007) found particular problems with information criteria when a small sample
(N = 200) was combined with unequal class sizes, as small classes then contain
very few subjects. This is not the case in our sample.
Another limitation is the correlational nature of the large-scale assessment data.
We of course had no influence on the intended or enacted curriculum, and therefore
the causal nature of the found relations between curriculum and strategy use is
uncertain and requires further (experimental) investigation. The present study does
provide a starting point for such follow-up research. It should also be noted that
the intended and enacted curriculum do not reflect (direct) effects of the teachers
in our sample to the same extent, as the enacted curriculum is in the hands of the
teacher, whereas the intended curriculum (the textbook) is determined on a school
level.

2.4. DISCUSSION 31
2.4.3 Implications
The results suggest several implications (though the limited sample size should
be noted). They suggest that models for strategy choices such as the Adaptive
Strategy Choice Model (ASCM; Lemaire & Siegler, 1995) may need to be extended
to include factors beyond the student and the problem (in line with suggestions by
Verschaffel et al., 2009), and the same goes for other investigations of mathematical
strategy use that have overlooked instructional factors so far (e.g., Hickendorff et
al., 2010; Imbo & Vandierendonck, 2008; Lemaire & Lecacheur, 2011). The results
also suggest that the investigations of curriculum effects on achievement may so far
have omitted an important mediator: curriculum affects strategy use, and there are
strong performance differences between strategies (Hickendorff, 2011; Hickendorff
et al., 2009), so the curriculum may (in part) affect achievement through its effect
on strategy use.
For educational reforms, our results suggest that although positive effects on
achievement have been found of instructional practices congruent with reform ideas
(Cohen & Hill, 2000), reform-oriented instruction may also have unexpected side-
effects: teaching that is more oriented towards the whole-number-based algorithms
introduced by the Dutch mathematics education reform, is not only associated with
more use of those algorithms, but also with more use of non-algorithmic strategies
that have previously been shown to be less accurate than algorithms (Hickendorff
et al., 2009). Finally, our finding that the effects of teachers and the curriculum on
the proportion of students who mainly use mental strategies were small suggests
that it might be challenging to reduce students’ use of mental strategies through
means of regular instruction, and that perhaps special interventions are necessary
to promote their use of more accurate written strategies.
2.4.4 Conclusion
We would like to conclude by noting that our application of MLCA is relevant to
applications of this technique to educational data more generally, and that several
generalizations can be thought of: applications to other domains (e.g., strategies
in spelling or reading), other types of nominal response data (e.g., error types),
and also educational data from other sources than large-scale assessments (e.g.,
educational intervention studies with a large enough sample). With this article, we
hope to have increased the attractiveness and accessibility of MLCA for educational
researchers.


3
Using LASSO penalization for explanatory IRT: An application on
instructional covariates for mathematical achievement in a large-scale
assessment
Abstract
A new combination of statistical techniques is introduced: LASSO pe-
nalization for explanatory IRT models. This was made possible by recently
released software for LASSO penalization of GLMMs, as IRT models can be
conceptualized as GLMMs. LASSO penalized IRT shows special promise for
the simultaneous consideration of high numbers of covariates for students’
achievement in large-scale educational assessments. This is illustrated with
an application of the technique on Dutch mathematical large-scale assessment
data from 1619 students, with covariates from a questionnaire filled out by
107 teachers. The various steps in applying the technique are explicated, and
educationally relevant results are discussed.
3.1 Introduction
Data with very high numbers of covariates can be analyzed using regularization
methods that place a penalty on the regression parameters to improve prediction
accuracy and interpretation, making this type of regression known as penalized re-
gression. A popular form of penalized regression is LASSO (least absolute shrinkage
and selection operator), where more and more regression parameters become zero as
the penalty increases, thereby functioning as a covariate selection tool (Tibshirani,
This chapter is currently submitted for publication as: Fagginger Auer, M. F., Hickendorff,M., & Van Putten, C. M. (submitted). Using LASSO penalization for explanatory IRT: Anapplication on covariates for mathematical achievement in a large-scale assessment.
The research was made possible by the Dutch National Institute for Educational MeasurementCito, who made the assessment data available to us.
33

34 CHAPTER 3. LASSO PENALIZATION FOR EXPLANATORY IRT
1996). LASSO has so far been applied in many (generalized) linear models, but has
only recently been extended to generalized linear mixed models (GLMMs), allow-
ing for the modeling of correlated observations (Groll & Tutz, 2014; Schelldorfer,
Meier, & Buhlmann, 2014).
In the present study, we utilize this GLMM extension of LASSO to introduce
penalized regression for explanatory item response theory (IRT) models, making
use of the possibility of conducting IRT analyses with general GLMM software
demonstrated by De Boeck and Wilson (2004). This first use of LASSO penalized
explanatory IRT is demonstrated with an application to a large-scale educational
dataset, a type of data for which this technique promises to be especially useful as
it allows for the simultaneous consideration of high numbers of potentially relevant
covariates while optimally modeling achievement.
3.1.1 Explanatory IRT with LASSO penalization for large-scale
assessment data
In large-scale educational assessments, achievement in an educational domain is
assessed for a large representative sample of students to enable evaluation of the
outcomes of an educational system (often that of a country), and to make compar-
isons to past outcomes or to outcomes of other educational systems. The analysis of
achievement data from assessments usually requires the linking of different subsets
of a total item set. These can be both subsets of the large complete item set within
an assessment and item sets of successive assessments, and can be done using IRT
(e.g, Mullis, Martin, Foy, & Akora, 2012; Mullis, Martin, Foy, & Drucker, 2012;
OECD, 2013; Scheltens et al., 2013). IRT models achievement by placing persons
and items on a common latent scale, and the probability of a correct response de-
pends on the distance between the ability θp of a person p and the difficulty βi
of an item i in a logistic function: P (ypi = 1|θp) =exp(θp−βi)
1+exp(θp−βi). This basic IRT
model is the Rasch model (Rasch, 1960), which can be extended in multiple ways.
One extension is to make it an explanatory model rather than just a measure-
ment model, by including explaining factors for items’ difficulty and persons’ ability
(De Boeck & Wilson, 2004). These explanatory variables can be labeled in vari-
ous ways (e.g., as predictors), but we will refer to them as covariates. Whereas
in a Rasch model a separate difficulty parameter is estimated for each item, in an
item explanatory model (e.g., the linear logistic test model (LLTM); G. H. Fischer,
1973) item covariates that differ across items but not persons (such as number of
operations required in a math item) are used to model item difficulty. Similarly,
3.1. INTRODUCTION 35
person covariates that vary across persons but not items (such as gender) can be
used to explain ability level, and finally, person-by-item covariates that vary across
both persons and items (such as solution strategy use) are also possible. IRT can
therefore be used not only to optimally model achievement in large-scale assess-
ments, but also to gain more insight into the factors that affect achievement (e.g.,
see Hickendorff et al., 2009).
Collection of data on such factors is a part of many assessments, as these assess-
ments include questionnaires on topics such as children’s background and attitudes,
teachers’ characteristics and instructional practices, and the conditions in schools
(Mullis, Martin, Foy, & Akora, 2012; Mullis, Martin, Foy, & Drucker, 2012; OECD,
2013; Scheltens et al., 2013). These many different factors contribute to achieve-
ment jointly, and should be considered simultaneously so that effects are evaluated
while controlling for other covariates, and so that the importance of different co-
variates relative to each other can be determined. However, analyses with very high
numbers of covariates can be challenging, especially with models that are already
complex models such as explanatory IRT models.
Penalized regression
A common way to deal with the challenge of high numbers of covariates is through
so-called penalized regression. As described by Tibshirani (1996), normal regression
with ordinary least squares (OLS) estimates can be improved in terms of prediction
accuracy and interpretation by penalizing regression coefficients by shrinking them
or setting some of them to zero. This can be done in various ways. One way
is subset selection, in which a model with a subset of the covariates is selected
(through forward or backward selection). Though the reduced number of covariates
in this situation facilitates interpretation, small changes in the data can lead to
the selection of very different models, creating the risk of chance capitalization
and compromising prediction accuracy. A second way, ridge regression, is more
stable as regression coefficients are shrunk in a continuous process, but is also
more complex in terms of interpretation as none of the coefficients become zero.
Tibshirani (1996) proposed a third way, LASSO regression, which seeks to combine
stability and interpretability by shrinking some regression coefficients and setting
others to zero.
Both in LASSO and ridge regression, the sum of a specific function of the
regression parameters has to be smaller than or equal to a tuning parameter t.
With ridge regression, this is the sum of the squared coefficients,∑j
β2j ≤ t, and

36 CHAPTER 3. LASSO PENALIZATION FOR EXPLANATORY IRT
with LASSO regression, the sum of the absolute coefficients,∑j
|βj | ≤ t. With this
restriction, the sum of the squared differences between the observed and predicted
y’s,N∑i=1
(yi−∑j
βjxij)2, is minimized. Incorporating the restriction explicitly in the
latter equation, this can be alternatively formulated asN∑i=1
(yi−∑j
βjxij)2 +λ
∑j
β2j
orN∑i=1
(yi−∑j
βjxij)2+λ
∑j
|βj |. This whole equation is minimized, which in the case
of a λ of 0 results in ordinary regression, but with increasing values of λ in a higher
and higher penalization for the sum of the coefficients (until finally all penalized
coefficients are zero). The different restrictions on the regression coefficients in
ridge and LASSO result in shrunken coefficients in both cases, but generally, only
with LASSO coefficients are set to zero (Tibshirani, 1996).
Recently, software has become available that allows for LASSO (but as far as
we know, not ridge) penalization for GLMMs (Groll & Tutz, 2014; Schelldorfer et
al., 2014). Schelldorfer et al. (2014) implemented GLMM LASSO in an R package
entitled glmmixedLASSO, and demonstrated the efficiency and accuracy of their
algorithm using various simulations with both relatively low (e.g., 10 and 50) and
very high numbers of covariates (e.g., 500 and 1500) in logistic and Poisson models.
They note that the mixed aspect of GLMMs causes a problem for LASSO, as the
shrinkage of regression coefficients can severely bias the estimation of the variance
components. They address this issue with a two-stage approach: first the LASSO
is used as a variable selection tool, and then in a second step an unpenalized model
with the selected variables is fitted using a maximum likelihood method, to ensure
accurate estimation of the variance components.
The availability of LASSO for GLMMs makes LASSO penalization for explana-
tory IRT models possible. IRT models were not developed as a special case of
GLMMs but in a separate line of research, with specialized IRT software such as
BILOG, PARSCALE and TESTFACT (Embretson & Reise, 2000). However, more
recently, De Boeck and Wilson (2004) have described how to formulate IRT models
as GLMMs and how to estimate them using general purpose GLMM software, en-
abling a wider application of this class of models. Therefore, LASSO penalization
for explanatory IRT models is now possible, and it can be used for the simultaneous
consideration of high numbers of covariates for achievement in large-scale assess-
ment data. In the present study, we apply this new combination of techniques for
this purpose. We use it to investigate the effects of various factors on mathematical
achievement in a large-scale assessment: children’s and teachers’ characteristics, as-

3.1. INTRODUCTION 37
pects of teachers’ instruction, and the solution strategies that children use to obtain
item answers. The existing literature on the effects of these factors on achievement
will now be succinctly described.
3.1.2 Covariates for mathematical achievement
Children’s characteristics and achievement
Various characteristics of children have been found to be related to mathematical
achievement. As for other achievement measures, children with a lower socioeco-
nomic status (SES) generally perform less well in mathematics than children with
a higher SES (e.g., Sirin, 2005). Children’s general intelligence and mathematical
achievement are also positively related (e.g., Primi, Eugenia Ferrao, & Almeida,
2010). While stereotypes still suggest that girls perform less well in mathematics
than boys, no general gender differences in mathematical achievement for children
are indicated (e.g., J. S. Hyde, Lindberg, Linn, Ellis, & Williams, 2008), though
in some countries such differences do exist (e.g., the Netherlands; Scheltens et al.,
2013).
Effects of teachers on student achievement
There is large amount of research on the effects that teachers and their instruction
methods can have on achievement, in which many different aspects of the teaching
process are considered. One obvious indicator of instruction is the formal curricu-
lum provided by the mathematics textbook that is used. However, as noted by
Remillard (2005), a distinction must be made between this formal curriculum and
what actually takes place in the classroom (i.e., the intended versus the enacted
curriculum). A review of the existing research on effective programs in mathe-
matics by Slavin and Lake (2008) demonstrated very limited effects of textbooks,
but much stronger effects of programs that targeted the instructional processes in
which teachers and children interact in the classroom. Positive effects were found
of interventions that concerned classroom management, keeping children engaged,
promoting cooperation among children, and supplementary tutoring. In another
review, the Royal Netherlands Academy of Arts and Sciences (2009) similarly con-
cludes that there is little support for meaningful effects of the formal curriculum
and more for effects of the actual teaching process.
However, these reviews for an important part concern studies with small sam-
ples, which could bias results as small studies with null or negative results may be
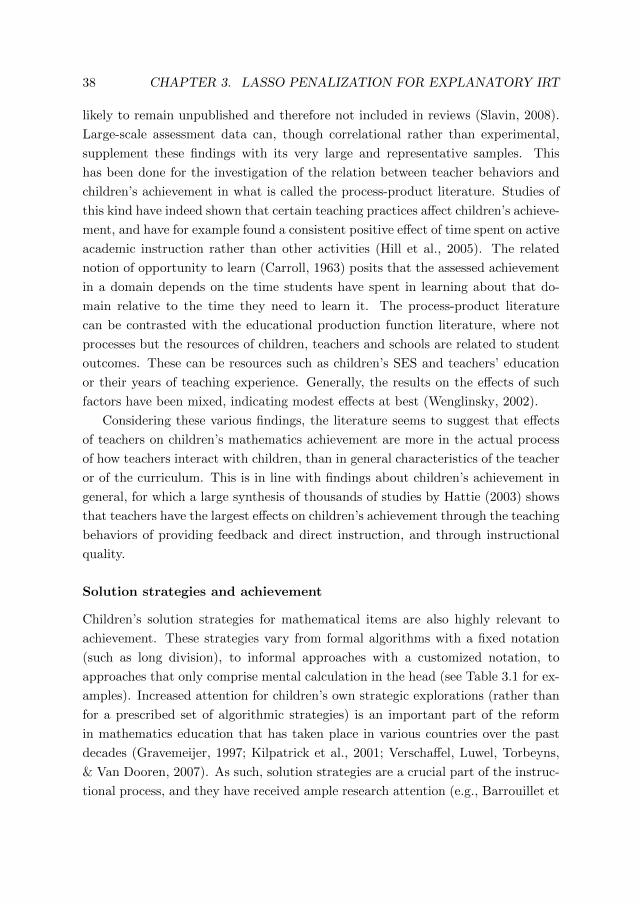
38 CHAPTER 3. LASSO PENALIZATION FOR EXPLANATORY IRT
likely to remain unpublished and therefore not included in reviews (Slavin, 2008).
Large-scale assessment data can, though correlational rather than experimental,
supplement these findings with its very large and representative samples. This
has been done for the investigation of the relation between teacher behaviors and
children’s achievement in what is called the process-product literature. Studies of
this kind have indeed shown that certain teaching practices affect children’s achieve-
ment, and have for example found a consistent positive effect of time spent on active
academic instruction rather than other activities (Hill et al., 2005). The related
notion of opportunity to learn (Carroll, 1963) posits that the assessed achievement
in a domain depends on the time students have spent in learning about that do-
main relative to the time they need to learn it. The process-product literature
can be contrasted with the educational production function literature, where not
processes but the resources of children, teachers and schools are related to student
outcomes. These can be resources such as children’s SES and teachers’ education
or their years of teaching experience. Generally, the results on the effects of such
factors have been mixed, indicating modest effects at best (Wenglinsky, 2002).
Considering these various findings, the literature seems to suggest that effects
of teachers on children’s mathematics achievement are more in the actual process
of how teachers interact with children, than in general characteristics of the teacher
or of the curriculum. This is in line with findings about children’s achievement in
general, for which a large synthesis of thousands of studies by Hattie (2003) shows
that teachers have the largest effects on children’s achievement through the teaching
behaviors of providing feedback and direct instruction, and through instructional
quality.
Solution strategies and achievement
Children’s solution strategies for mathematical items are also highly relevant to
achievement. These strategies vary from formal algorithms with a fixed notation
(such as long division), to informal approaches with a customized notation, to
approaches that only comprise mental calculation in the head (see Table 3.1 for ex-
amples). Increased attention for children’s own strategic explorations (rather than
for a prescribed set of algorithmic strategies) is an important part of the reform
in mathematics education that has taken place in various countries over the past
decades (Gravemeijer, 1997; Kilpatrick et al., 2001; Verschaffel, Luwel, Torbeyns,
& Van Dooren, 2007). As such, solution strategies are a crucial part of the instruc-
tional process, and they have received ample research attention (e.g., Barrouillet et
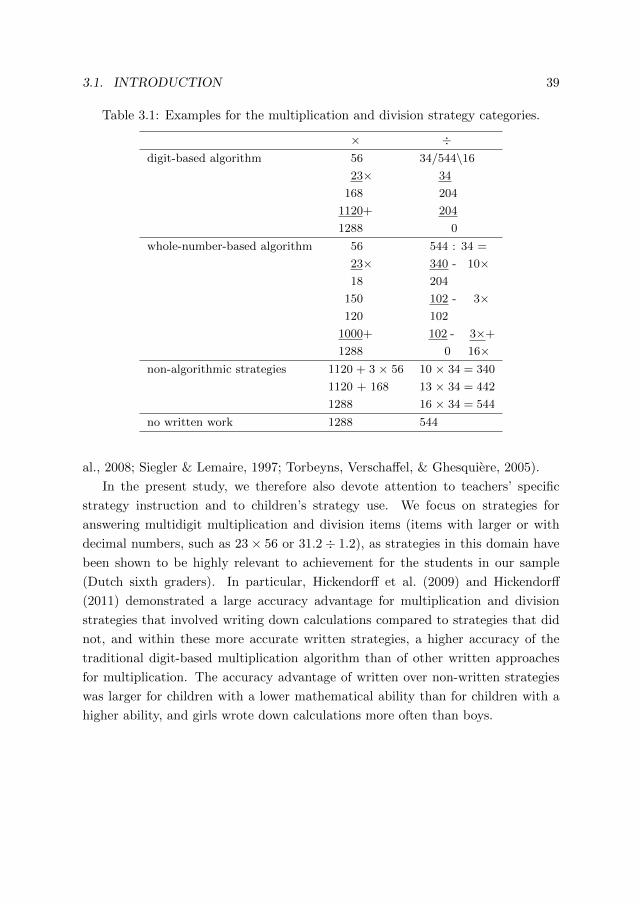
3.1. INTRODUCTION 39
Table 3.1: Examples for the multiplication and division strategy categories.
× ÷digit-based algorithm 56
23×168
1120+
1288
34/544\16
34
204
204
0
whole-number-based algorithm 56
23×18
150
120
1000+
1288
544 : 34 =
340 - 10×204
102 - 3×10²
102 - 3×+
0 16×non-algorithmic strategies 1120 + 3 × 56
1120 + 168
1288
10 × 34 = 340
13 × 34 = 442
16 × 34 = 544
no written work 1288 544
al., 2008; Siegler & Lemaire, 1997; Torbeyns, Verschaffel, & Ghesquiere, 2005).
In the present study, we therefore also devote attention to teachers’ specific
strategy instruction and to children’s strategy use. We focus on strategies for
answering multidigit multiplication and division items (items with larger or with
decimal numbers, such as 23× 56 or 31.2÷ 1.2), as strategies in this domain have
been shown to be highly relevant to achievement for the students in our sample
(Dutch sixth graders). In particular, Hickendorff et al. (2009) and Hickendorff
(2011) demonstrated a large accuracy advantage for multiplication and division
strategies that involved writing down calculations compared to strategies that did
not, and within these more accurate written strategies, a higher accuracy of the
traditional digit-based multiplication algorithm than of other written approaches
for multiplication. The accuracy advantage of written over non-written strategies
was larger for children with a lower mathematical ability than for children with a
higher ability, and girls wrote down calculations more often than boys.
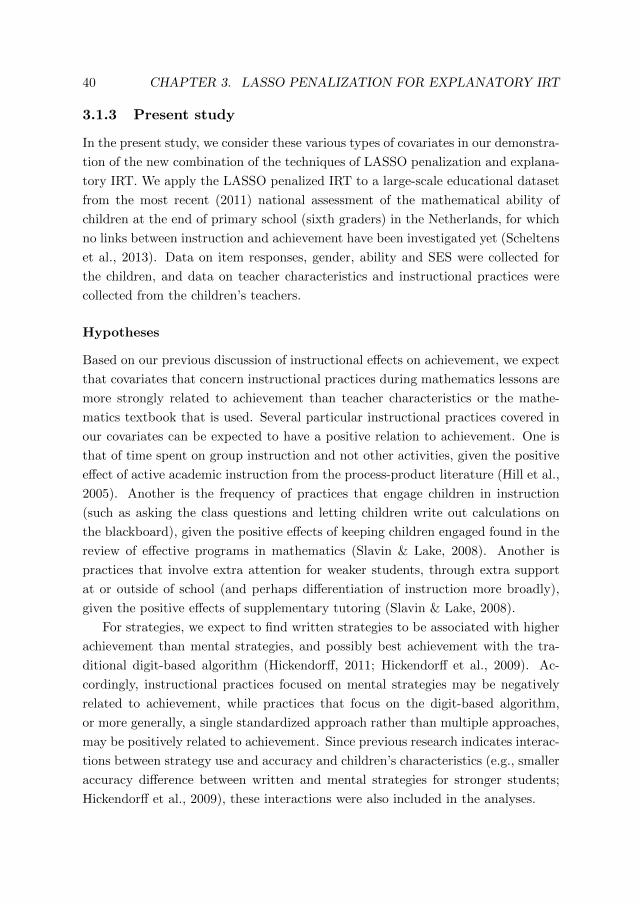
40 CHAPTER 3. LASSO PENALIZATION FOR EXPLANATORY IRT
3.1.3 Present study
In the present study, we consider these various types of covariates in our demonstra-
tion of the new combination of the techniques of LASSO penalization and explana-
tory IRT. We apply the LASSO penalized IRT to a large-scale educational dataset
from the most recent (2011) national assessment of the mathematical ability of
children at the end of primary school (sixth graders) in the Netherlands, for which
no links between instruction and achievement have been investigated yet (Scheltens
et al., 2013). Data on item responses, gender, ability and SES were collected for
the children, and data on teacher characteristics and instructional practices were
collected from the children’s teachers.
Hypotheses
Based on our previous discussion of instructional effects on achievement, we expect
that covariates that concern instructional practices during mathematics lessons are
more strongly related to achievement than teacher characteristics or the mathe-
matics textbook that is used. Several particular instructional practices covered in
our covariates can be expected to have a positive relation to achievement. One is
that of time spent on group instruction and not other activities, given the positive
effect of active academic instruction from the process-product literature (Hill et al.,
2005). Another is the frequency of practices that engage children in instruction
(such as asking the class questions and letting children write out calculations on
the blackboard), given the positive effects of keeping children engaged found in the
review of effective programs in mathematics (Slavin & Lake, 2008). Another is
practices that involve extra attention for weaker students, through extra support
at or outside of school (and perhaps differentiation of instruction more broadly),
given the positive effects of supplementary tutoring (Slavin & Lake, 2008).
For strategies, we expect to find written strategies to be associated with higher
achievement than mental strategies, and possibly best achievement with the tra-
ditional digit-based algorithm (Hickendorff, 2011; Hickendorff et al., 2009). Ac-
cordingly, instructional practices focused on mental strategies may be negatively
related to achievement, while practices that focus on the digit-based algorithm,
or more generally, a single standardized approach rather than multiple approaches,
may be positively related to achievement. Since previous research indicates interac-
tions between strategy use and accuracy and children’s characteristics (e.g., smaller
accuracy difference between written and mental strategies for stronger students;
Hickendorff et al., 2009), these interactions were also included in the analyses.

3.2. METHOD 41
3.2 Method
3.2.1 Sample
Schools were selected for participation in the 2011 mathematics assessment accord-
ing to a random sampling procedure stratified by socioeconomic status, resulting
in a total number of 2548 participating sixth graders (11-12-year-olds) from 107
schools. The children were presented subsets of a large set of mathematical items
on a variety of topics, and subsets containing multidigit multiplication and division
items were presented to 1619 of the children. These children were in the classes of
107 teachers (one teacher per school), which means that an average of 15 children
per teacher participated. Of the 1619 children, 49 percent were boys and 51 percent
were girls. Fifty percent of the children had a relatively higher general scholastic
ability level, as they were to go to secondary school types after summer that would
prepare them for higher education, while the other 50 percent were to go to pre-
vocational secondary education. In terms of SES, most children (88 percent) had
at least one parent who completed at least two years of medium or higher-level
secondary school (SES not low), while 12 percent did not (SES low).
3.2.2 Materials
Multiplication and division items
The assessment contained thirteen multidigit multiplication items and eight multi-
digit division items in total. These items were administered to children according
to an incomplete design (see Hickendorff et al., 2009, for more details on such de-
signs): children were presented systematically varying subsets of either three or six
of these items. Table 3.2 provides information on the content of the items: the
numbers with which the multiplication or division operation had to be performed
and whether these numbers were presented in a realistic context describing a prob-
lem situation (such as determining how many bundles of 40 tulips can be made
from 2500 tulips) or not. The items were presented in booklets in which children
could also write down their calculations and solutions. The children were not given
any other paper to write on and were explicitly instructed that if they wanted to
write down calculations, they could use the (ample) blank space next to the items
in the booklet.
Following the assessment, these calculations were coded for strategy use. For
this, five different categories were distinguished. The first two categories are for

42 CHAPTER 3. LASSO PENALIZATION FOR EXPLANATORY IRT
algorithmic solutions: the more traditional digit-based algorithm and the newer
whole-number-based algorithm. The third category consists of written work with-
out an algorithmic notation, such as writing down only intermediate steps. Table
3.1 gives examples for multiplication and division strategies in these three cate-
gories. The two remaining categories are solutions with no written calculations,
and a small other category, consisting mostly of unanswered items.
The strategy coding was carried out by three undergraduate students and the
first and third author. Parts of the material (112 multiplication and 112 division
solutions) were coded by all coders to determine the interrater reliability. Cohen’s κ
(J. Cohen, 1960) was found to be .90 for the multiplication and .89 for the division
coding on average, which indicates high levels of interrater agreement.
Teacher questionnaire about classroom practice
The teachers of the participating children filled out a questionnaire about their
mathematics teaching. A total of 39 questions were selected from this question-
naire (see the Appendix) that were either relevant to the mathematics lessons in
general (teacher characteristics, mathematics textbook used, and general instruc-
tional practices during the mathematics lessons), or that specifically concerned
multiplication, division, or mental strategies (the latter because of the aforemen-
tioned large achievement difference between strategies with and without written
down calculations). Questions that were excluded specifically concerned mathemat-
ical domains other than multiplication or division (e.g., addition or percentages)
or concerned attitudes or opinions rather than concrete characteristics or instruc-
tional practices (e.g., opinion on class size rather than actual class size). Dummy
variables were made for questions with nominal response categories and scores were
standardized for the other questions (missing values were imputed with the variable
mode, because multiple imputation was not feasible given the complex LASSO IRT
analyses).
3.2.3 Statistical analysis
The R package glmmixedLASSO (Schelldorfer et al., 2014) was used to conduct the
LASSO penalized explanatory IRT analysis. As described by De Boeck and Wilson
(2004), the explanatory IRT model was specified by using a binomial model with
the solution accuracy (incorrect or correct) as the dependent variable, and a ran-
dom person intercept for the latent ability variable and fixed item effects for the

3.2. METHOD 43
Table 3.2: The content of the thirteen multidigit multiplication items and eight
multidigit division items in the assessment and the percentage of correct solutions.
item context N %
9 × 48 = 432 yes 368 76
8 × 194 = 1552 yes 355 72
6 × 192 = 1152 no 352 70
35 × 29 = 1015 yes 353 69
6 × 14.95 = 89.70 yes 359 66
1.5 × 1.80 = 2.70 yes 353 65
35 × 29 = 1015 no 352 64
23 × 56 = 1288 yes 358 58
209 × 76 = 15884 no 344 54
24 × 37.50 = 900 no 352 47
0.18 × 750 = 135 no 356 36
9.8 × 7.2 = 70.56 no 352 26
3340 × 5.50 = 18370 yes 359 21
total multiplication 4613 56
544 ÷ 34 = 16 yes 368 56
47.25 ÷ 7 = 6.75 yes 352 47
1575 ÷ 14 = 112.50 no 355 41
1470 ÷ 12 = 122.50 yes 350 40
2500 ÷ 40 = 62 yes 359 32
31.2 ÷ 1.2 = 26 no 369 30
6496 ÷ 14 = 464 yes 354 29
11585 ÷ 14 = 827.5 yes 345 26
total division 2852 38
Note: The items in italics are slightly modified parallel versions of items that have
not yet been released for publication by Cito because they may be used in subsequent
assessments.

44 CHAPTER 3. LASSO PENALIZATION FOR EXPLANATORY IRT
item easiness parameters. The person covariates that were added were children’s
gender (boy or girl), general scholastic ability level (lower or higher) and SES (not
low or low), and the questions from the teacher questionnaire. The person-by-item
covariate that was added was that for strategy use on the item (with dummy vari-
ables for the aforementioned multiplication and division strategy categories). In
addition, interactions between strategy use and the three student characteristics
(gender, ability and SES) were added. The penalization was not imposed on all
covariates: the fixed item effects were specified as unpenalized, so the IRT part of
the model remained intact regardless of the degree of penalization. The children’s
characteristics (gender, general scholastic ability level and SES) were also unpe-
nalized, so that these were always controlled for in evaluating the effects of the
instruction and strategies.
The final element of the model to be specified is the degree of penalization,
which is determined by λ (as discussed in the introduction). We did this using the
approach taken by Schelldorfer et al. (2014), the authors of the glmmixedLASSO
package: we used the Bayesian Information Criterion (BIC) to select the model
that provided the best balance between model parsimony and fit to the data. The
BIC is calculated by taking the log-likelihood (LL) of the observed data under
the model and imposing a penalty for the number of parameters (k) in the model,
weighed by the logarithm of the number of cases (N) (individuals, in our case):
−2LL + log(N) × k (and asymptotically, the BIC is equivalent to k-fold cross-
validation with some optimal k; Shao, 1997). The lower the BIC, the better the
trade-off between model fit and complexity, so the model with the lowest BIC was
selected.
As recommended by Schelldorfer et al. (2014), we then reran the model with
the selected covariates with the R package lme4 (Bates & Maechler, 2010), for an
unbiased estimation of the random effects. In this model, a random intercept was
also added for the teachers to account for the nesting of children within teachers (see
Doran, Bates, Bliese, & Dowling, 2007), which is not yet possible in glmmixedLASSO.
This model was used for final interpretation of the covariate effects.
Expressed mathematically, the explanatory model for the probability of a correct
response with J person covariates j (which can be both at the child and teacher
level) for child p with teacher t (denoted Zptj with regression parameter ζj), H
person-by-item covariates h for child p of teacher t and item i (denoted Wptih with
regression parameter δih), and I item dummy variables Xi with easiness parameter
βi, is then:

3.3. RESULTS 45
Table 3.3: Use and (observed and estimated) accuracy of the multiplication and
division strategies.
observed estimated P (correct)
use (%) correct (%) × ÷× ÷ × ÷ boys girls
digit-based algorithm 37 16 68 61 .76 .61 .63
number-based algorithm 3 24 68 63 .75 .65 .64
non-algorithmic strategies 24 10 59 50 .62 .51 .45
no written work 28 35 51 22 .50 .22 .16
other 8 15 2 2 .05 .05 .07
P (ypti = 1|Zpt1...ZptJ ,Wpti1...WptiH , X1...XI) =exp(η)
1 + exp(η)(3.1)
with
η = ΣJj=1ζjZptj + ΣHh=1δihWptih + ΣIi=1βiXi + εp + εt (3.2)
3.3 Results
3.3.1 Descriptives
Overall, 56 percent of the multiplication items was solved correctly (varying be-
tween 21 percent correct for the item 3340×5.50 and 76 percent for 9×48), and 39
percent of the division items (varying between 26 percent correct for 11585÷14 and
56 percent for 544÷34) (see Table 3.2). Multiplication items were most often solved
using the digit-based algorithm, which was also (together with the whole-number-
based algorithm) the most accurate strategy with 68 percent of correct solutions
(see Table 3.3 for strategy descriptives). Solutions without written work were also
frequent (and relatively inaccurate, with 51 percent correct solutions), as were non-
algorithmic written strategies (59 percent correct). Division items were most often
solved without written work, an approach that was very inaccurate (22 percent
correct). Application of the whole-number-based algorithm was also frequent, fol-
lowed by application of the digit-based algorithm, and both these strategies were
relatively accurate (63 and 61 percent correct respectively).

46 CHAPTER 3. LASSO PENALIZATION FOR EXPLANATORY IRT
3.3.2 Covariate selection using penalized regression
The LASSO IRT model with penalization on the teacher and strategy covariates
was estimated with different settings of λ. All penalized coefficients were shrunk
to zero for λ ≥ 240, so models with all (integer) λs from 0 (no penalization) to
240 (all penalized covariates dropped from the model) were estimated. Figure 3.1
shows the shrinking of penalized regression coefficients over this range, with each
line representing one coefficient. The optimal amount of penalization indicated
by the BICs (also see Figure 3.1) was found to be at λ = 35. The 18 penalized
covariates with non-zero regression coefficients at this λ are the questions from the
teacher questionnaire marked with asterisks in the Appendix and the multiplication
and division solution strategy use, and the interaction between division strategy use
and student gender.
3.3.3 Effects in the final model
The results of running an explanatory IRT model with the unpenalized and the
selected covariates are given in Table 3.4 (the selected questions from the teacher
questionnaires are numbered as in the Appendix). Of the unpenalized covariates,
performance was found to be significantly related to children’s general scholastic
ability: higher ability children had a significantly higher probability of a correct
response (P = .58) than lower ability children (P = .33), z = 13.1, p < .001.
Gender did not have a significant effect, z = 1.1, p = .29, nor did SES, z = −1.6,
p = .10.
Of the selected teacher covariates, the strongest positive effect was of the amount
of time spent on group instruction in mathematics lessons (P = .40 for 1 SD below
the mean and P = .50 for 1 SD above the mean). The strongest negative effect was
of the amount of support at home (P = .49 for 1 SD below the mean and P = .41
for 1 SD above the mean).
There were strong effects of the employed solution strategy on the probabil-
ity of a correct response, both for multiplication and division (see Table 3.3 for the
estimated probability per strategy). The accuracy of the whole-number-based algo-
rithms was comparable to that of the digit-based algorithms, while non-algorithmic
strategies, strategies without any written work and other strategies (mostly leav-
ing items unanswered) were less accurate (with the smallest accuracy difference
for non-algorithmic strategies and the largest for other strategies). There was also
an interaction between division strategy use and student gender: most notably, the
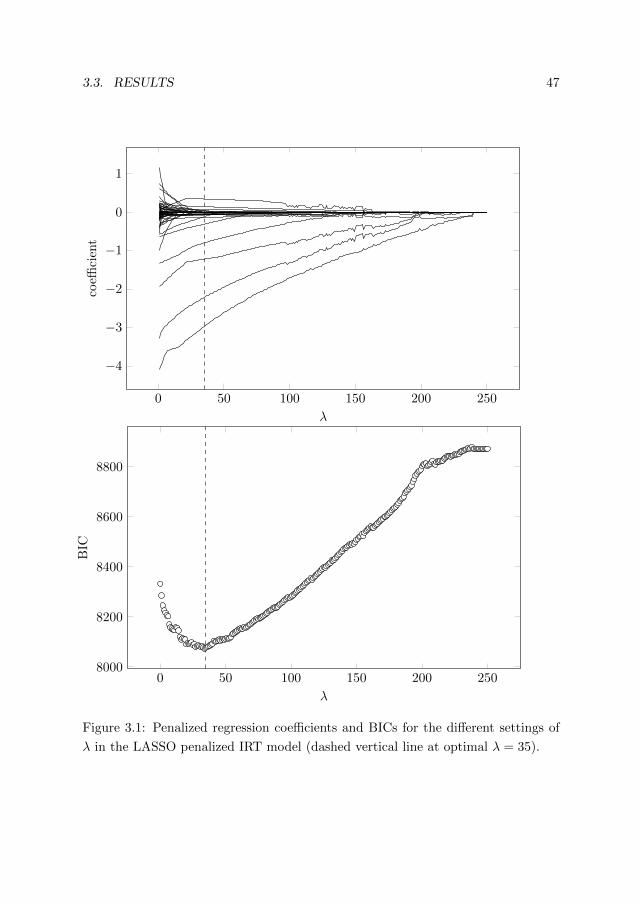
3.3. RESULTS 47
0 50 100 150 200 250
−4
−3
−2
−1
0
1
λ
coeffi
cien
t
0 50 100 150 200 2508000
8200
8400
8600
8800
λ
BIC
Figure 3.1: Penalized regression coefficients and BICs for the different settings of
λ in the LASSO penalized IRT model (dashed vertical line at optimal λ = 35).

48 CHAPTER 3. LASSO PENALIZATION FOR EXPLANATORY IRT
Table 3.4: Effects of the student characteristics and selected teacher covariates.
covariatelevels
estimate (S.E.)reference target
student char.
gender boy girl 0.10 (0.09)
ability lower higher 1.05 (0.08)
SES not low low -0.20 (0.12)
teacher char.
1. age 0.04 (0.06)
2. gender male female -0.16 (0.10)
5. years grade 6 -0.10 (0.05)
general instr.
12. time group instr. 0.18 (0.06)
13. time indiv. instr. -0.08 (0.05)
15. ask class questions 0.01 (0.05)
16. blackboard solutions -0.05 (0.05)
18. discuss errors -0.01 (0.05)
instr. differ.
19. lesson diff. -0.09 (0.05)
22. support at home -0.17 (0.06)
23. external support -0.09 (0.05)
strategy instr.
25. division alg. 0.05 (0.05)
30. strat. multidigit ÷ one multiple -0.11 (0.10)
32. ment. mul. div. -0.07 (0.07)
35. ment. smart strat. -0.12 (0.08)
strategy use
multiplication digit.
number. -0.03 (0.24)
non-alg. -0.63 (0.11)
no writ. -1.14 (0.11)
other -4.07 (0.27)
division digit.
number. 0.19 (0.21)
non-alg. -0.40 (0.26)
no writ. -1.69 (0.18)
other -3.43 (0.33)
gender×division digit.
number. -0.14 (0.21)
non-alg. -0.34 (0.31)
no writ. -0.51 (0.21)
other 0.33 (0.41)
difference in accuracy between the digit-based algorithm and strategies without any
written work was larger for girls (P = .63 vs. P = .16) than for boys (P = .61 vs.
P = .22).

3.4. DISCUSSION 49
3.4 Discussion
In the present study, we introduced LASSO penalization for explanatory IRT mod-
els. This was made possible by recently released software that allows for LASSO
penalization of GLMMs (Groll & Tutz, 2014; Schelldorfer et al., 2014), as IRT
models can be conceptualized as GLMMs (De Boeck & Wilson, 2004). We argued
that this new combination of techniques is especially useful for simultaneous con-
sideration of the effects of the high numbers of covariates for students’ achievement
that are collected in large-scale educational assessments. This was illustrated with
an application of LASSO penalized explanatory IRT to data from the most recent
national large-scale assessment of mathematics at the end of primary school in the
Netherlands. The various steps involved in applying the technique were explicated
and educationally relevant results were discussed.
3.4.1 Substantive conclusions
A first result that was found is that the LASSO did not select formal curriculum co-
variates as important covariates for students’ achievement: at the optimal degree of
penalization, the coefficients for the textbook covariate were shrunk to zero. This
is in accordance with findings of Slavin and Lake (2008) and the Royal Nether-
lands Academy of Arts and Sciences (2009) of very limited effects of the formal
curriculum. A positive effect of the amount of time the teacher spends on group
instruction was found, concordant with the positive effect of time spent on active
academic instruction rather than other activities in the process-product literature
(Hill et al., 2005). Though we expected practices that involve extra attention for
weaker students to be beneficial because of the positive effects of supplementary
tutoring (Royal Netherlands Academy of Arts and Sciences, 2009; Slavin & Lake,
2008), the amount of support that students received at home according to their
teachers was negatively related to achievement. This could suggest that home sup-
port affects achievement negatively, but could also indicate that weaker students
receive more home support. However, the teacher reported on the amount of home
support only at the class level, and a proper investigation of this effect should be
conducted with support measures at the student level.
Children’s use of mathematical strategies was also found to play an important
role. Strategies with written work were found to be much more accurate than those
without written work, as was also found by Hickendorff et al. (2009) and Hickendorff
(2011). Within written strategies, these authors found an accuracy advantage of the

50 CHAPTER 3. LASSO PENALIZATION FOR EXPLANATORY IRT
digit-based algorithm over other written approaches, and we refined this finding by
dividing the other written approaches into the whole-number-based-algorithm and
non-algorithmic written strategies. This showed the accuracy of the whole-number-
based algorithms to be comparable to that of the digit-based-algorithms, while the
non-algorithmic approaches were less accurate. An interaction between gender and
division strategy use was also found: strategies without written work were found
to be relatively more inaccurate for girls than for boys. Fortunately, girls appear
to use strategies without written work less frequently than boys (Fagginger Auer,
Hickendorff, Van Putten, Beguin, & Heiser, in press; Hickendorff et al., 2009). It
should be noted, however, that the accuracy estimations of the strategies could be
biased by the ability of the students using the strategies and the difficulty of the
items the strategies are applied to (bias by selection effects; Siegler & Lemaire,
1997), though a statistical correction for such bias is carried out with the inclusion
of student ability and item easiness parameters in the model.
3.4.2 Limitations and future directions
The present study also has several limitations, some of which provide directions for
future investigation and development.
Mediation student and teacher effects by strategies
A first limitation is substantive in nature. We investigated the effects of student
and teacher covariates on student achievement, but some effects may have been
obscured because they occurred through strategy use. For example, we found no
significant effect of gender per se, but boys do make more use of the inaccurate strat-
egy of answering without any written work (Fagginger Auer et al., in press). As for
teacher effects, the sociocultural context is an important determinant of strategy
use (Verschaffel et al., 2009), and teacher covariates are significantly related to stu-
dents’ strategy use (Fagginger Auer et al., in press). Given the large differences in
students’ achievement with different strategies, this means that teacher covariates
can exert effects on achievement through strategy use, and these effects may go un-
detected when strategy use is also in the model. Though hard to incorporate in our
current LASSO penalized explanatory IRT analysis, a more thorough investigation
of this chain of effects could be done with a mediation analysis. However, it should
also be noted that the impact of this issue may be limited, as teachers appear to
exert relatively little influence over the strategy that has the largest negative con-

3.4. DISCUSSION 51
sequences for achievement - answering without any written work (Fagginger Auer
et al., in press).
LASSO for correlated covariates
A second limitation is that when LASSO is used for covariates that are (highly)
correlated, the selection of covariates can be to some extent random: when there
is a near perfect correlation between two covariates, selection of either covariate
results in nearly equal prediction of the dependent variable. This limitation is
true for LASSO in general and not particular to our LASSO penalized explanatory
IRT. However, in their successful simulation tests of the glmmixedLASSO procedure,
Schelldorfer et al. (2014) included correlations among the covariates of up to .20,
and the vast majority (90 percent) of correlations among our teacher covariates
fell within that range. Less than one percent of the correlations was large (≥ .50),
none of which concerned covariates that were found to be significant. Therefore,
our results should not be affected too much by correlations among the covariates.
More random effects
A third limitation is that only one random effect could be specified for the LASSO
penalization. While this is enough for a basic IRT model, in an educational context
(with students nested in classes in schools) a random effect for the teacher or
school level is also called for. In addition, in some contexts it makes more sense to
model the item effects as random than as fixed - for example when items can be
considered random draws from a domain, such as the items in this study from the
domain of multidigit multiplication and division (De Boeck, 2008). A larger number
of possible random effects (e.g., as in the package lme4; Bates & Maechler, 2010)
would therefore be an important improvement for LASSO penalized explanatory
IRT.
Cross-validation
A fourth limitation is the way in which the optimal degree of LASSO penalization
was determined. We did this using the BIC (as in Schelldorfer et al., 2014), but a
more common approach is to use cross-validation (e.g., it is a standard option the R
package penalized; Goeman, 2010). With cross-validation, overfitting is prevented
through fitting the model on one part of the data, and evaluating the prediction
error of the model on another part of the data (Colby & Bair, 2013). Implement-

52 CHAPTER 3. LASSO PENALIZATION FOR EXPLANATORY IRT
ing cross-validation in LASSO GLMM packages would provide an important tool
for selecting the amount of penalization in LASSO penalized IRT. One problem
with implementing this, however, is that the LASSO penalized IRT is already very
computationally intensive with the estimation of just one model for each value of
λ, but this should be resolved with ongoing improvements in computational power.
Another problem is that cross-validation for GLMMs is not straightforward, but
several approaches have been proposed to deal with this issue (Colby & Bair, 2013).
Other IRT models
A final limitation is that not all IRT models can be specified as GLMMs (De
Boeck & Wilson, 2004), and therefore that our currently outlined procedure for
LASSO penalized explanatory IRT does not apply to all types of IRT models.
For example, models that cannot be specified as univariate GLMMs are the popu-
lar two-parameter (2PL) model (with item discrimination parameters) and models
for polytomous response data. However, there is still ample flexibility within the
current Rasch (1PL) framework, as any combination of person, item, and person-
by-item covariates that is of interest can be made (e.g., we did not include item
covariates, but LLTM-like models that include many potential sources of item diffi-
culty are possible). Therefore, with our current demonstration of LASSO penalized
explanatory IRT, we aimed to introduce a new combination of techniques that is
versatile and that can lead to insightful results regarding the factors that influence
achievement.
3.A Teacher survey questions
(when the same response options apply to multiple questions, those options are
given under the last question they apply to for brevity; and the questions selected
with the LASSO are marked with asterisks)
3.A.1 Teacher characteristics
1. ?What is your age? (. . . years)
2. ?What is your gender? (male / female)
3. From which teacher education did you graduate? (PABO (after 1985) / PA,
kweekschool or kindergarten training (before 1985) / other)
4. In which grade do you have most teaching experience? (sixth grade / other grade)

3.A. TEACHER SURVEY QUESTIONS 53
5. ?At the end of this school year, how many successive years have you been teaching in
the sixth grade? (. . . years)
6. Have you received extra training in the past five years? (yes / no)
7. If so, in what areas have you received extra training? (optimizing the learning
opportunities of students with different backgrounds / evaluating the level of progress
of a class / school self evaluation / subject-specific / other)
3.A.2 Textbook
8. Which textbook do you use (predominantly) for mathematics instruction? (Pluspunt
/ Wereld in Getallen / Rekenrijk / Alles Telt / other)
3.A.3 General instruction
9. How many students are in your class? (. . . students)
10. How much time do you spend on mathematics lessons in an average week? (. . . hours)
11. How many minutes do you spend on multiplication and division in your mathematics
lessons in a week? (<30 minutes / 30-60 minutes / 60-90 minutes / 90-120 minutes
/ >120 minutes)
12. ?How many minutes do you on average spend on group instruction in a mathematics
lesson?
13. ?How many minutes do you on average spend on individual instruction in a
mathematics lesson?
14. How many minutes do your students on average spend on individual work in a
mathematics lesson? (<10 minutes / 10-20 minutes / 20-30 minutes / 30-40 minutes
/ >40 minutes)
15. ?How often do you ask the class questions during instruction?
16. ?How often do you let students write out calculations on the blackboard?
17. How often do you ask students how they found an answer they gave?
18. ?How often do you discuss frequent errors with the class? (less than once a month /
once a month / twice a month / once every two weeks / at least once a week)
3.A.4 Instruction differentiation
19. ?To what extent do you differentiate in your mathematics teaching by level or pace?
(generally no differentiation / differentiation in practice materials but not instruction
/ differentiation in instruction and materials for different groups / individual
instruction and selection of materials)
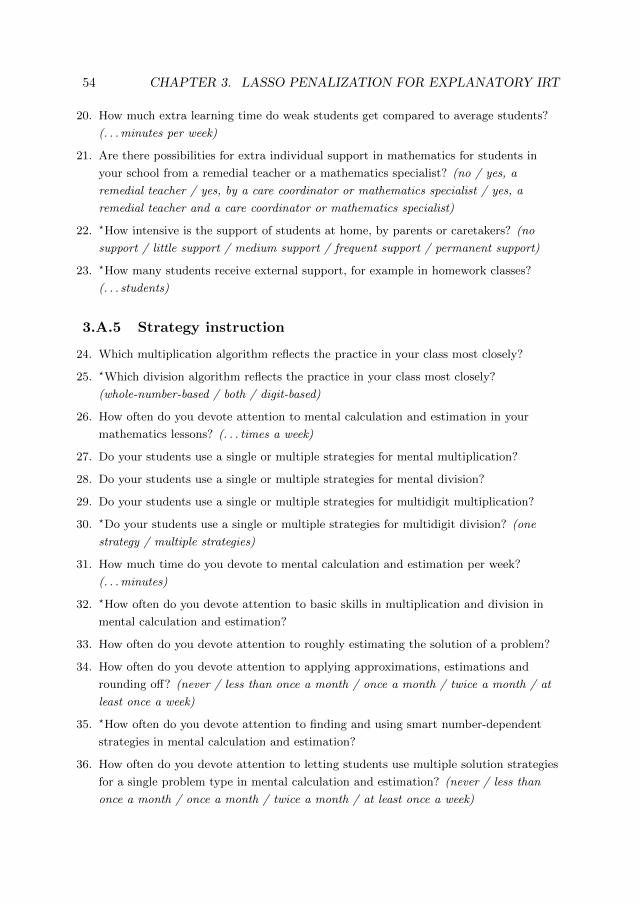
54 CHAPTER 3. LASSO PENALIZATION FOR EXPLANATORY IRT
20. How much extra learning time do weak students get compared to average students?
(. . . minutes per week)
21. Are there possibilities for extra individual support in mathematics for students in
your school from a remedial teacher or a mathematics specialist? (no / yes, a
remedial teacher / yes, by a care coordinator or mathematics specialist / yes, a
remedial teacher and a care coordinator or mathematics specialist)
22. ?How intensive is the support of students at home, by parents or caretakers? (no
support / little support / medium support / frequent support / permanent support)
23. ?How many students receive external support, for example in homework classes?
(. . . students)
3.A.5 Strategy instruction
24. Which multiplication algorithm reflects the practice in your class most closely?
25. ?Which division algorithm reflects the practice in your class most closely?
(whole-number-based / both / digit-based)
26. How often do you devote attention to mental calculation and estimation in your
mathematics lessons? (. . . times a week)
27. Do your students use a single or multiple strategies for mental multiplication?
28. Do your students use a single or multiple strategies for mental division?
29. Do your students use a single or multiple strategies for multidigit multiplication?
30. ?Do your students use a single or multiple strategies for multidigit division? (one
strategy / multiple strategies)
31. How much time do you devote to mental calculation and estimation per week?
(. . . minutes)
32. ?How often do you devote attention to basic skills in multiplication and division in
mental calculation and estimation?
33. How often do you devote attention to roughly estimating the solution of a problem?
34. How often do you devote attention to applying approximations, estimations and
rounding off? (never / less than once a month / once a month / twice a month / at
least once a week)
35. ?How often do you devote attention to finding and using smart number-dependent
strategies in mental calculation and estimation?
36. How often do you devote attention to letting students use multiple solution strategies
for a single problem type in mental calculation and estimation? (never / less than
once a month / once a month / twice a month / at least once a week)

3.A. TEACHER SURVEY QUESTIONS 55
37. Are calculators or computer software used during mathematics lessons? (only
calculators / both calculators and computer software / only computer software /
neither)
38. Do you instruct your students in the multiplication function of the calculator? (yes /
no)
39. Do you instruct your students in the division function of the calculator? (yes / no)


4
Solution strategies and adaptivity in multidigit division in a
choice/no-choice experiment: Student and instructional factors
Abstract
Adaptive expertise in choosing when to apply which solution strategy is
a central element of current day mathematics, but may not be attainable for
all students in all mathematics domains. In the domain of multidigit division,
the adaptivity of choices between mental and written strategies appears to
be problematic. These solution strategies were investigated with a sample
of 162 sixth graders in a choice/no-choice experiment. Children chose freely
when to apply which strategy in the choice condition, but not in the no-choice
conditions for mental and written calculation, so strategy performance could
be assessed unbiasedly. Mental strategies were found to be less accurate but
faster than written ones, and lower ability students made counter-adaptive
choices between the two strategies. No teacher effects on strategy use were
found. Implications for research on individual differences in adaptivity and
the feasibility of adaptive expertise for lower ability students are discussed.
4.1 Introduction
Learning and problem solving are characterized by the use of a variety of strategies
at every developmental stage (Siegler, 2007). Children’s and adults’ strategy use
has been investigated for cognitive tasks concerning diverse topics such as class
inclusion (Siegler & Svetina, 2006), analogical reasoning (Tunteler et al., 2008),
and digital gaming (Ott & Pozzi, 2012). A well-studied area of investigation in
This chapter has been published as: Fagginger Auer, M. F., Hickendorff, M., & Van Putten,C. M. (2016). Solution strategies and adaptivity in multidigit division in a choice/no-choiceexperiment: Student and instructional factors. Learning and Instruction, 41, 52-59.
We would like to thank the schools and students for their participation in the experiment.
57

58 CHAPTER 4. CHOICE/NO-CHOICE EXPERIMENT ADAPTIVITY
solution strategy research is strategy use for arithmetic problems. Many studies
have been conducted on strategies in elementary addition, subtraction, multiplica-
tion and division (e.g., Barrouillet & Lepine, 2005; Imbo & Vandierendonck, 2007;
Mulligan & Mitchelmore, 1997; Van der Ven et al., 2012), which concern operations
in the number domain up to 100 that are taught in the lower grades of primary
school. However, there is a notable scarcity of research on strategy use of higher
grade students on more complex arithmetic problems (though not an absence; see
for example Van Putten et al., 2005; Selter, 2001; Torbeyns, Ghesquiere, & Ver-
schaffel, 2009). This more advanced arithmetic is called multidigit arithmetic, as it
involves larger numbers and decimal numbers. Multidigit arithmetic is particularly
interesting with regard to strategy use, as the higher complexity of the problems
allows for the use of a wider range of strategies.
4.1.1 Solution strategies and adaptivity
To chart strategy use for a given domain, Lemaire and Siegler (1995) proposed
a general framework consisting of four aspects of strategic competence: strategy
repertoire (which strategies are used); frequency (how often each strategy in that
repertoire is chosen for use); efficiency (performance with use of each strategy); and
adaptivity (the appropriateness of a choice for a strategy given its relative perfor-
mance). While the first three aspects of the framework are quite straightforward,
the aspect of adaptivity has been conceptualized in various ways by different re-
searchers. Verschaffel et al. (2009) reviewed the existing literature on this topic and
identified three factors that play central roles in the different conceptualizations.
First there is the role of task variables, which concern the adaptation of strategy
choices to problem characteristics. For example, for a problem such as 62− 29 the
adaptive strategy choice could be defined as compensation (Blote, Van der Burg,
& Klein, 2001): the problem can be greatly simplified by rounding the subtrahend
29 to 30, and then compensating for this after the subtraction (62− 30 + 1). Sec-
ond there is the role of subject variables, which concern the adaptation of strategy
choices to strategies’ relative performance for a particular individual (for a partic-
ular problem), such as in the Adaptive Strategy Choice Model (ASCM; Siegler &
Shipley, 1995). Third there is the role of context variables, which can be both in
the direct context of the task (such as time restrictions) and in the broader socio-
cultural context (such as the value placed on accuracy versus speed). Verschaffel
et al. (2009) combine all three factors (calling for more research attention for con-
text variables especially) in defining a strategy choice as adaptive when it is most

4.1. INTRODUCTION 59
appropriate for a particular problem for a particular individual, in a particular
sociocultural context.
A second issue in determining adaptivity is that often there is not one unequiv-
ocal best performing strategy, as the most accurate strategy is not always also the
fastest. This can be addressed by combining speed and accuracy in a definition of
the best performing strategy as the one that leads to the correct solution the fastest
(e.g., Luwel, Onghena, et al., 2009; Torbeyns, De Smedt, et al., 2009; Kerkman &
Siegler, 1997). Yet, even with this definition, researchers tend to consider accuracy
and speed separately in their statistical analyses in practice (with the exception of
Torbeyns et al., 2005).
4.1.2 Adaptive expertise in mathematics education
Debates of its exact definition aside, adaptivity has become more and more im-
portant in the educational practice of primary school mathematics. Reforms in
mathematics education have taken place in various countries over the past decades
(Kilpatrick et al., 2001) and they have reshaped the didactics for multidigit arith-
metic from prescribing a fixed algorithmic strategy per problem type to building on
students’ own strategic explorations (Gravemeijer, 1997). For students, this means
that performing well now requires more than perfecting the execution of a limited
set of algorithmic strategies, because choosing the best performing strategy for solv-
ing a problem is also necessary. Adaptive expertise has become a central element of
education: students should have an array of strategies at their disposal, that they
can use efficiently, flexibly and creatively when they solve problems (Verschaffel et
al., 2009). Investigations differ in their findings of whether such adaptivity is at-
tainable for everyone: some have found evidence of a general adaptivity of strategy
choices (e.g., Siegler & Lemaire, 1997; Torbeyns et al., 2005), while others found it
only for students with a high mathematical ability (e.g., Hickendorff et al., 2010;
Torbeyns, Verschaffel, & Ghesquiere, 2006), and some not at all (e.g., Torbeyns,
De Smedt, et al., 2009).
In addition to providing more space for informal strategies, the reforms in-
troduced new standardized approaches for the more complex multidigit problems.
With traditional algorithms the large numbers in such problems are considered one
or two digits at a time, without an appreciation of the magnitude of those digits in
the whole number being necessary, while new approaches place more focus on the
whole number (as such, the former approaches have been labeled ’digit-based’ and
the latter ’whole-number-based’; Van den Heuvel-Panhuizen et al., 2009). Espe-
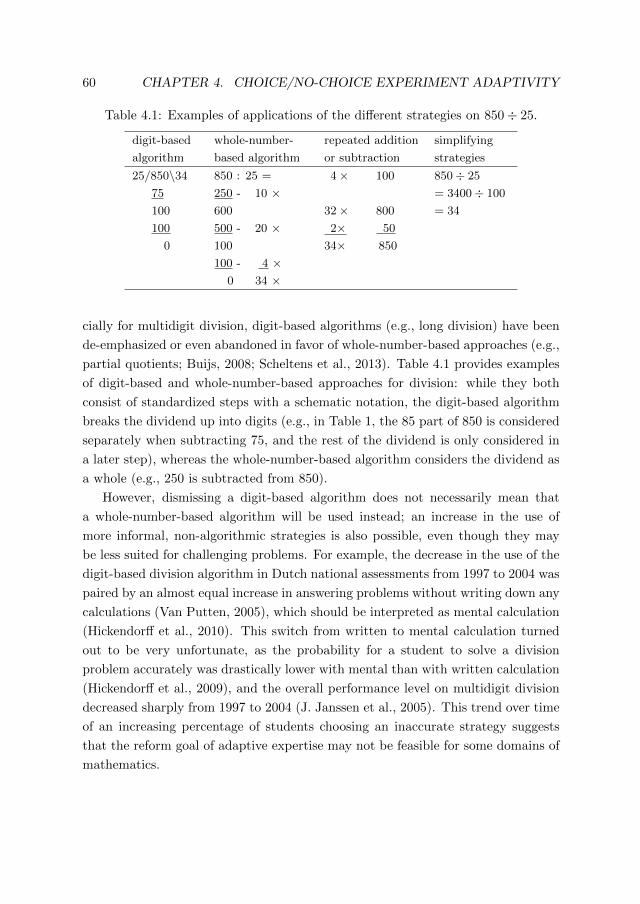
60 CHAPTER 4. CHOICE/NO-CHOICE EXPERIMENT ADAPTIVITY
Table 4.1: Examples of applications of the different strategies on 850÷ 25.
digit-based
algorithm
whole-number-
based algorithm
repeated addition
or subtraction
simplifying
strategies
25/850\34 850 : 25 = 4× 100 850÷ 25
75 250 - 10 × = 3400÷ 100
100 600 32× 800 = 34
100 500 - 20 × 2× 50
0 100 34× 850
100 - 4 ×0 34 ×
cially for multidigit division, digit-based algorithms (e.g., long division) have been
de-emphasized or even abandoned in favor of whole-number-based approaches (e.g.,
partial quotients; Buijs, 2008; Scheltens et al., 2013). Table 4.1 provides examples
of digit-based and whole-number-based approaches for division: while they both
consist of standardized steps with a schematic notation, the digit-based algorithm
breaks the dividend up into digits (e.g., in Table 1, the 85 part of 850 is considered
separately when subtracting 75, and the rest of the dividend is only considered in
a later step), whereas the whole-number-based algorithm considers the dividend as
a whole (e.g., 250 is subtracted from 850).
However, dismissing a digit-based algorithm does not necessarily mean that
a whole-number-based algorithm will be used instead; an increase in the use of
more informal, non-algorithmic strategies is also possible, even though they may
be less suited for challenging problems. For example, the decrease in the use of the
digit-based division algorithm in Dutch national assessments from 1997 to 2004 was
paired by an almost equal increase in answering problems without writing down any
calculations (Van Putten, 2005), which should be interpreted as mental calculation
(Hickendorff et al., 2010). This switch from written to mental calculation turned
out to be very unfortunate, as the probability for a student to solve a division
problem accurately was drastically lower with mental than with written calculation
(Hickendorff et al., 2009), and the overall performance level on multidigit division
decreased sharply from 1997 to 2004 (J. Janssen et al., 2005). This trend over time
of an increasing percentage of students choosing an inaccurate strategy suggests
that the reform goal of adaptive expertise may not be feasible for some domains of
mathematics.

4.1. INTRODUCTION 61
4.1.3 The present study
The present study therefore constitutes an in-depth experimental investigation of
adaptivity in this domain of mathematics that was particularly affected by the
reforms: multidigit division. An experimental approach is necessary, because per-
formance estimates of strategies may be biased by so-called selection effects (Siegler
& Lemaire, 1997): for example, though mental strategies produce a low percentage
of correct solutions for multidigit division problems, this performance estimate may
be biased because of the mathematical ability level of the students who choose to
use this strategy or because of the difficulty of the problems it is applied to. If men-
tal calculation were used equally by all types of students on all types of problems,
then a different estimation of its performance could very well result. Hickendorff et
al. (2010) experimentally compared a condition in which students freely chose when
to write down calculations and one in which they had to write down calculations for
every problem, and found that written calculation was at least as accurate or more
accurate than mental calculation, especially for weak students. Mental calculation,
however, was only observed in this study when spontaneously chosen and therefore
performance estimates were biased by selection effects. In addition, only accuracy
and not solution times were measured, so the role of speed in strategy choices and
adaptivity remained unclear.
The present study addresses these two issues by experimentally investigating
students’ spontaneous strategy choices for multidigit division and both their accu-
racy and speed with required written and required mental calculation. The partic-
ipants are sixth graders, because the radical changes in performance and strategy
use were demonstrated for this age group in the aforementioned large-scale assess-
ment. The aim of the present study is to systematically chart the four aspects
of strategic competence of Lemaire and Siegler (1995) - repertoire, frequency, ef-
ficiency and adaptivity - with special attention to adaptivity, because of its high
relevance to mathematics education and to multidigit division specifically. This
was done using the choice/no-choice paradigm introduced by Siegler and Lemaire
(1997) to allow for the unbiased assessment of strategy performance characteristics,
that has since been applied in numerous solution strategy investigations (e.g., Imbo
& Vandierendonck, 2007; Lemaire & Lecacheur, 2002; Torbeyns et al., 2005).
This design consists first of a choice phase in which participants freely choose
between strategies in solving a set of problems. This phase provides information on
strategy repertoire and the frequency with which strategies in that repertoire are
chosen. The choice phase is followed by a no-choice (NC) phase, with a separate

62 CHAPTER 4. CHOICE/NO-CHOICE EXPERIMENT ADAPTIVITY
NC-condition for each strategy under investigation, in which participants have to
solve (parallel versions of) the problems from the choice phase with that strategy.
This provides strategy efficiency estimates unbiased by selection effects, as every
participant has to solve each problem with each strategy. Adaptivity can be judged
based on the two phases combined: it can be evaluated whether the strategies that
the participant chose in the choice phase were the most accurate and fastest in the
no-choice phase for him or her.
Hypotheses
There were several hypotheses regarding the four aspects of students’ strategic com-
petence in multidigit division. As for strategy repertoire and frequency, previous
research indicates that a majority of the students predominantly use written calcu-
lation for multidigit division, sometimes with mental calculation for particular prob-
lems, while around one third predominantly uses mental calculation (Hickendorff
et al., 2009). Girls may use more written calculation than boys, as girls use more
algorithmic strategies, while boys tend to use more intuitive, less formal strategies
(Carr & Jessup, 1997; Davis & Carr, 2002; Hickendorff et al., 2009). As for strategy
efficiency, mental calculation was expected to be less accurate than written calcu-
lation (see section 1.2). The fact that mental calculation is used frequently despite
its apparent inaccuracy, suggests that it may offer advantages in terms of speed.
As for adaptivity, it was expected that counter-adaptive choices with regard
to accuracy would be made for mental rather than written calculation, given the
apparent role of increased mental calculation in the Dutch performance decline.
Considering the previously described differences in adaptivity for different levels
of mathematical ability, this counter-adaptivity may occur particularly in lower
ability students. Adaptivity with regard to the sociocultural context was expected,
given the large influence on strategy choices that the sociocultural context exerts
by defining what choices are appropriate, as described in a review on this topic by
Ellis (1997). Among other factors, Ellis (1997) describes cultural values regarding
the use of mental strategies and the originality of employed strategies as influential.
In the present study, these values (and values regarding the digit-based versus the
whole-number-based algorithm) were measured in the students’ teachers, and we
expected students’ strategy choices to be related to these cultural values of the
teacher.

4.2. METHOD 63
Table 4.2: The three versions of the eight problems in the division problem set.
problem
1 2 3 4 5 6 7 8
47÷ 2 93÷ 4 810÷ 30 850÷ 25 136÷ 32 308÷ 14 216÷ 6 861÷ 7
87÷ 2 77÷ 4 510÷ 30 675÷ 25 175÷ 28 414÷ 18 231÷ 7 732÷ 6
67÷ 2 85÷ 4 720÷ 30 925÷ 25 189÷ 36 336÷ 16 306÷ 9 976÷ 8
4.2 Method
4.2.1 Sample
A sample of 162 sixth graders (11-12-year-olds) from 25 different primary schools
participated, of whom 81 were boys (50 percent) and 81 were girls (50 percent).
Seventy-two of these students had a mathematical ability score below the national
median (44 percent) and the remaining 90 a score above the median (56 percent),
as measured by standardized national tests that are administered at most Dutch
primary schools (J. Janssen, Verhelst, Engelen, & Scheltens, 2010).
4.2.2 Materials
Division problems
Three comparable versions of a set of eight multidigit division problems were con-
structed (see Table 4.2). The characteristics of the dividends and divisors were
varied systematically: there were two problems with a two-digit dividend and one-
digit divisor (e.g., 93 ÷ 4); two problems with a relatively easy combination of a
three-digit dividend and two-digit divisor (e.g., 850 ÷ 25); two problems with a
more challenging combination of a three-digit dividend and two-digit divisor (e.g.,
308 ÷ 14); and two problems with a three-digit dividend and a one-digit divisor
(e.g., 861÷ 7).
Teacher questionnaire
A questionnaire for the students’ teachers was constructed to assess the values re-
garding arithmetic in the sociocultural context formed by the teacher (see Table
4.3). Two questions in the questionnaire concerned teachers’ values regarding the
type of division algorithm (digit-based or whole-number-based). The rest of the
questionnaire focused on two values described as influential by Ellis (1997): men-
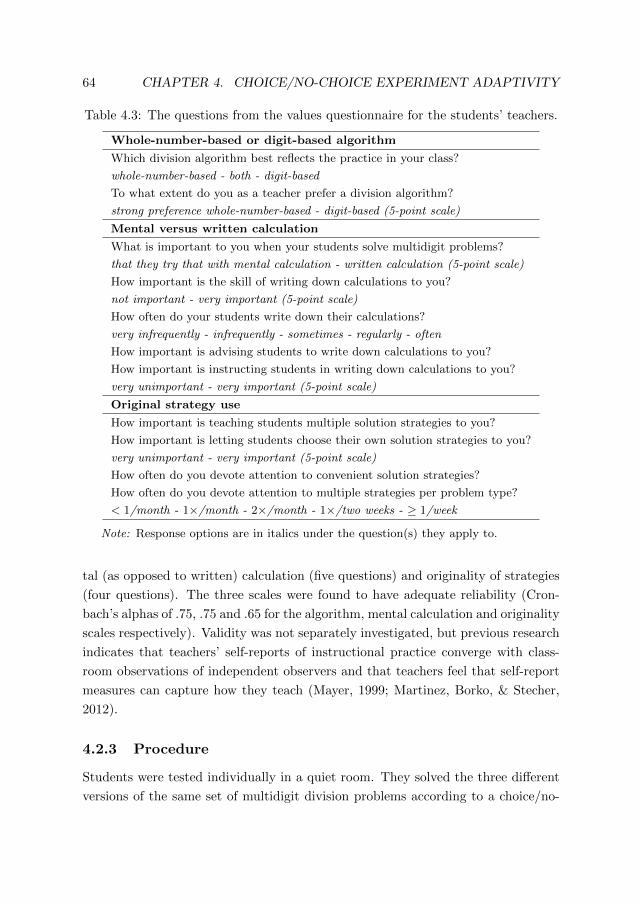
64 CHAPTER 4. CHOICE/NO-CHOICE EXPERIMENT ADAPTIVITY
Table 4.3: The questions from the values questionnaire for the students’ teachers.
Whole-number-based or digit-based algorithm
Which division algorithm best reflects the practice in your class?
whole-number-based - both - digit-based
To what extent do you as a teacher prefer a division algorithm?
strong preference whole-number-based - digit-based (5-point scale)
Mental versus written calculation
What is important to you when your students solve multidigit problems?
that they try that with mental calculation - written calculation (5-point scale)
How important is the skill of writing down calculations to you?
not important - very important (5-point scale)
How often do your students write down their calculations?
very infrequently - infrequently - sometimes - regularly - often
How important is advising students to write down calculations to you?
How important is instructing students in writing down calculations to you?
very unimportant - very important (5-point scale)
Original strategy use
How important is teaching students multiple solution strategies to you?
How important is letting students choose their own solution strategies to you?
very unimportant - very important (5-point scale)
How often do you devote attention to convenient solution strategies?
How often do you devote attention to multiple strategies per problem type?
< 1/month - 1×/month - 2×/month - 1×/two weeks - ≥ 1/week
Note: Response options are in italics under the question(s) they apply to.
tal (as opposed to written) calculation (five questions) and originality of strategies
(four questions). The three scales were found to have adequate reliability (Cron-
bach’s alphas of .75, .75 and .65 for the algorithm, mental calculation and originality
scales respectively). Validity was not separately investigated, but previous research
indicates that teachers’ self-reports of instructional practice converge with class-
room observations of independent observers and that teachers feel that self-report
measures can capture how they teach (Mayer, 1999; Martinez, Borko, & Stecher,
2012).
4.2.3 Procedure
Students were tested individually in a quiet room. They solved the three different
versions of the same set of multidigit division problems according to a choice/no-

4.2. METHOD 65
choice design (Siegler & Lemaire, 1997). The students solved the first set of prob-
lems in the choice condition, in which they were free to choose whether they wanted
to write down calculations or not. The second and the third problem set were of-
fered in two NC-conditions: one in which the entire set had to be solved without
writing down any calculations (the NC mental calculation condition), and one in
which calculations had to be written down for every problem in the set (the NC
written calculation condition). Both the order in which the different versions of the
problem set were presented and the order of the NC-conditions were counterbal-
anced.
The solution time for each problem was recorded by the experimenter using
a stopwatch. Student’s strategy use on the division problems was inferred from
their written work, and when no calculations were written down for a problem,
students were interviewed on their solution strategy. Five different strategy cate-
gories were discerned (both within mental and written calculation; see Table 4.1
for examples): the digit-based algorithm; the whole-number-based algorithm (both
algorithms were discussed in section 1.2); non-algorithmic strategies that involve re-
peated addition (or subtraction) of multiples of the divisor; strategies that involve
a simplification of the problem (such as the compensation strategy discussed in
section 1.1); and remaining solution strategies (unclear strategies, misconceptions
such as multiplying rather than dividing, and guessing).
The students’ teachers filled out the questionnaire on the day that the experi-
menter was present at the school for testing, and also solved one of the sets of eight
division problems so that their free strategy use and performance could be assessed.
4.2.4 Statistical analysis
Binary logistic mixed models (e.g., Molenberghs & Verbeke, 2006) were used for an-
alyzing the accuracy scores for each problem (correct or incorrect), strategy choices
on each problem (mental or written calculation), and students’ overall strategy
choices in the choice condition (at least once or never mental calculation). Linear
mixed models were used for analyzing the proportion of correct solutions with each
version of the problem set, and the time students took to obtain the solution to
each problem. This solution time was log-transformed to normalize its strongly
skewed distribution (as in Klein Entink, Fox, & Van der Linden, 2009).
For analyses at the problem level, random effects were added for the students
and the schools, to account for the dependencies of problem solving within students
and within schools. For analyses at the student level, only random school effects

66 CHAPTER 4. CHOICE/NO-CHOICE EXPERIMENT ADAPTIVITY
were added. All mixed model analyses were carried out using the SAS procedure
GLIMMIX (Schabenberger, 2005). Ninety-five percent confidence intervals (95% CIs)
are reported for the regression coefficient estimates (which equal the log of the
odds ratio (OR) in the logistic models) and differences in estimated means for an
indication of the magnitude of the effects. In addition, the standardized versions
of these mean differences (SMDs) are reported as effect sizes for the linear models
(where values of 0.2, 0.5 and 0.8 can be considered to reflect small, medium and
large effects respectively; J. Cohen, 1988), and ORs for the logistic models (where
values of 1.5, 3.5 and 9.0 can be considered small, medium and large respectively;
J. Cohen, 1988).
4.3 Results
The difficulty of the three versions of the problem set (aggregated over all con-
ditions) was comparable: students did not differ significantly in their proportion
of correct solutions for the first (M = .62) and second version (M = .62) of the
problem set, z = −0.37, p = .71, 95% CI [-0.04, 0.03], SMD = −0.01, or for the
first and third version (M = .59), z = −1.84, p = .07, 95% CI [-0.07, -0.01], SMD
= −0.07, (and given the intermediate difficulty of the second version, also not for
the second and third version).
4.3.1 Strategy repertoire and frequency
Table 4.4 provides information on students’ strategy repertoire and the frequency
of use of strategies in that repertoire in the three conditions of the choice/no-choice
experiment. In the choice condition, students solved 29 percent of the problems
using mental calculation, but this varied both between problems (from 18 percent
of mental calculation for problem 6 to 56 percent for problem 1) and between
students: 40 percent of the students never used mental calculation in the choice
condition, 30 percent used it at least once but for less than half of the problems,
and 30 percent applied it to half of the problems or more. There were no significant
differences between students who did and did not use any mental calculation in the
choice condition in terms of gender, z = 0.24, p = .81, 95% CI [-0.86, 1.10], OR
= 1.13, or mathematical ability level, z = 1.22, p = .22, 95% CI [-0.36, 1.54], OR
= 1.80, or interaction between gender and ability, z = 0.78, p = .43, 95% CI [-0.82,
1.90], OR = 1.72.

4.3. RESULTS 67
Table 4.4: Strategy use in the choice, NC-mental and NC-written calculation con-
dition.
condition mental/written dig. alg. num. alg. rep. +/− simp. rem.
choicemental (.29) .01 .14 .46 .20 .18
written (.71) .13 .55 .22 .08 .02
NCmental .03 .23 .43 .19 .13
written .11 .49 .24 .11 .04
Note: dig. alg. = digit-based algorithm; num. alg. = whole-number-based algorithm;
rep. +/− = non-algorithmic repeated addition or subtraction; simp. = simplifying
strategies; rem. = remaining strategies
In the free strategy choice condition, algorithms (both digit-based and whole-
number-based) were used much more often in written than in mental solutions. In
contrast, non-algorithmic repeated addition or subtraction and simplifying strate-
gies (and also remaining strategies) were more frequent in mental solutions. The
strategy use within mental and within written solutions was similar in the choice
and NC-conditions.
4.3.2 Strategy efficiency
We investigated the relative efficiency of mental and written calculation strategies
by comparing students’ performance in the NC-mental and NC-written calculation
conditions (see Table 4.5 for accuracy and speed averages per condition). Students
had a higher probability of solving a problem correctly in the NC-written calculation
condition (probability of a correct solution (P ) of .70) than in the NC-mental
calculation condition (P = .54), z = −7.48, p < .001, 95% CI [-1.57, -0.92], OR
= 3.48. For below median ability students, the difference in accuracy between NC-
written and NC-mental calculation was much larger (∆P = .26) than for above
median ability students (∆P = .06), z = 3.72, p < .001, 95% CI [0.34, 1.08], OR
= 2.03. The accuracy difference did not depend significantly on student gender,
z = 1.80, p = .07, 95% CI [-0.03, 0.71], OR = 1.40.
As for speed: students solved problems faster in the NC-mental calculation
condition ( estimated mean problem solving time of 38 s) than in the NC-written
calculation condition (M = 50 s), z = −5.52, p < .001, 95% CI [-0.29, -0.14], SMD
= −0.39. This speed difference was larger for boys (∆M = 15 s) than for girls
(∆M = 11 s), z = −2.47, p = .01, 95% CI [-0.19, -0.02], SMD = −0.20, but did not
depend significantly on students’ ability level, z = −1.15, p = .25, 95% CI [-0.14,

68 CHAPTER 4. CHOICE/NO-CHOICE EXPERIMENT ADAPTIVITY
Table 4.5: Efficiency of required mental and written calculation in the respective
no-choice conditions.
accuracy speed
(proportion correct) (problem solving time (s))
NC-mental NC-written NC-mental NC-written
gendergirls .51 .67 48 51
boys .56 .65 44 53
abilitybelow median .36 .56 49 58
above median .68 .74 44 48
total .53 .66 46 52
0.04], SMD = −0.09.
4.3.3 Strategy adaptivity
Student-level correlations
A first indication of adaptivity is a positive relation between the frequency with
which a student chooses to use a strategy and the relative performance of that
strategy for that student (e.g., more choices for written calculation by students for
whom this strategy is generally more accurate and faster than mental calculation).
To investigate whether such an adaptive association between strategy choices and
performance exists, the total number of choices for written calculation by students
was correlated with their relative accuracy with written calculation (number correct
with NC-written minus that with NC-mental) and their relative speed (average
solution time with NC-mental minus that with NC-written) using Spearman’s rho.
Students were found to adaptively choose more written calculation when it was
relatively more accurate for them than mental calculation, ρ = .35, df = 156,
p < .001, but not significantly so when it was relatively faster, ρ = .08, df = 154,
p = .32 (though adaptivity with regard to speed was shown by the subgroup of
higher ability students, ρabove = .24, df = 87, p = .03).
Problem level adaptivity scores
However, such correlation analyses - though common in adaptivity investigations
(e.g., Kerkman & Siegler, 1997; Siegler & Lemaire, 1997; Torbeyns, Ghesquiere, &
Verschaffel, 2009; Torbeyns, De Smedt, et al., 2009; Torbeyns et al., 2006) - only
reveal general trends at the student level and do not utilize the information that is

4.3. RESULTS 69
available at the problem level in a choice/no-choice experiment, where comparisons
can be made between the different strategy conditions in which parallel versions
of a single problem are presented. In addition, correlation analyses consider ac-
curacy and speed in isolation, while it is more educationally relevant to consider
them simultaneously and define a choice as adaptive when it is for the strategy that
produces the correct solution the fastest (as in Luwel, Onghena, et al., 2009; Tor-
beyns, De Smedt, et al., 2009; Kerkman & Siegler, 1997). Following this definition,
the following problem-level adaptivity judgments can be made: when one no-choice
strategy was accurate and the other no-choice strategy inaccurate on parallel ver-
sions of the same problem for a student (e.g., NC-written correct and NC-mental
incorrect on two of the versions of problem 5), a choice for the accurate strategy
(in this example, written) on the other version of the problem by that student
in the choice condition was defined as adaptive, and a choice for the inaccurate
strategy (in this example, mental) as counter-adaptive. When both strategies were
accurate, a choice for the faster strategy was defined as adaptive and a choice for
the slower strategy as counter-adaptive. The case of two incorrect NC-solutions is
undetermined, as then there is no ’best’ choice to speak of.
Disregarding the undetermined trials (34 percent of all trials), 62 percent of
choices were found to be adaptive using these criteria (of which 67 percent were for
written strategies) and 38 percent counter-adaptive. This considerable percentage
of counter-adaptive strategy choices was found to hardly vary over gender and abil-
ity subgroups (between 61 to 66 percent), though the percentage of undetermined
trials was considerably higher in lower (40 percent) compared to higher ability stu-
dents (29 percent) because of the larger proportion of incorrect answers in the lower
ability students.
Relative performance with free strategy choice and required written
calculation
In the introduction, it was suggested that requiring students to write down cal-
culations might improve their performance. Therefore, we also investigated the
adaptivity of students’ strategy choices at the problem level in the following way:
we examined whether students performed better in solving a problem when they
were required to write down calculations, compared to when they were free to choose
whether they wanted to. Table 4.6 shows students’ accuracy and speed in the choice
and NC-written conditions, separately for mental and written strategy choices in
the choice condition. There was no general significant effect of condition on accu-

70 CHAPTER 4. CHOICE/NO-CHOICE EXPERIMENT ADAPTIVITY
racy, z = 1.26, p = .21, 95% CI [-0.15, 0.67], OR = 1.30, but condition did interact
with students’ strategy choice in the choice condition, z = 2.15, p = .03, 95% CI
[0.07, 1.53], OR = 2.23. There was also an interaction of condition, strategy choice
and ability level, z = −1.95, p = .05, 95% CI [-1.62, 0.00], OR = 2.25: when be-
low median ability students chose mental calculation, their accuracy improved with
NC-written calculation (increase in probability of a correct solution of .14), which
was not the case for students with an above median ability (∆P = −.02). When
students chose written calculation in the choice condition, accuracy was largely
unaffected by condition, both for below median ability students (∆P = .01) and
above median ability students (∆P = .03). Condition, strategy choice and gender
did not interact significantly, z = −1.33, p = .18, 95% CI [-1.36, 0.26], OR = 1.73.
Requiring written calculation affected speed, z = −2.42, p = .02, 95% CI [-0.19,
-0.02], SMD = −0.22, and this condition effect interacted with strategy choice,
z = 7.51, p < .001, 95% CI [0.43, 0.74], SMD = 1.23: when students chose mental
calculation in the choice condition they were slower in the NC-written condition
(∆M = 19 s), which did not hold when students chose written calculation (∆M =
−2 s). This slowing effect of NC-written calculation when students chose mental
calculation was stronger for higher ability students (∆M = 21 s) than for lower
ability students (∆M = 17 s), z = 2.59, p = .01, 95% CI [0.05, 0.39], SMD = 0.46.
Condition, strategy choice and gender did not interact significantly , z = −0.65,
p = .51, 95% CI [-0.22, 0.11], SMD = −0.11.
Teachers’ effects on strategy choices
No significant teacher effects on students’ choices between mental and written cal-
culation in the choice condition were found. Firstly, there were no significant effects
of teacher’s responses on the teacher questionnaire. To investigate this, mean scores
were calculated for the responses per category (with one question transformed to a
five-point scale). For the questions on the whole-number-based versus digit-based
algorithm, these mean scores showed that teachers were on average more oriented
towards the whole-number-based approach (M = 2.20, SD = 1.33), but these
scores had no significant effect on students’ use of mental calculation, z = −0.42,
p = .68, 95% CI [-0.53, 0.34], OR = 1.10. Mean scores for the questions on mental
versus written computation showed that teachers on average considered written
computation more important (M = 4.27, SD = .49), but these scores also had
no significant effect, z = 0.26, p = .80, 95% CI [-0.96, 1.25], OR = 1.16. Mean
scores for the questions on originality showed that teachers on average found orig-

4.4. DISCUSSION 71
Table 4.6: Performance in terms of accuracy and speed with free strategy choice
and NC-written calculation, split by strategy choice in the choice condition.
accuracy (proportion correct)
mental choice written choice
choice NC-written choice NC-written
gendergirls .52 .64 .68 .68
boys .66 .59 .68 .68
abilitylower .40 .50 .57 .58
higher .73 .69 .73 .76
total .60 .62 .66 .68
speed (problem solving time (s))
mental choice written choice
choice NC-written choice NC-written
gendergirls 29 48 60 52
boys 25 46 59 57
abilitylower 33 51 64 60
higher 23 44 55 49
total 27 47 59 54
inality important (M = 4.04, SD = .76), but these scores also had no significant
effect, z = −0.21, p = .84, 95% CI [-0.95, 0.76], OR = 1.09. Secondly, there were
no significant effects of how the teachers solved the eight problems: neither for
the number of times a teacher used mental calculation (M = 2.13, SD = 2.03),
z = 0.10, p = .92, 95% CI [-0.27, 0.30], OR = 1.01; nor for the number of correctly
solved problems (M = 6.61, SD = 1.12), z = −0.99, p = .33, 95% CI [-0.79, 0.26],
OR = 1.30.
4.4 Discussion
In this study, students’ mental and written solution strategies for multidigit division
problems were investigated. Using the choice/no-choice paradigm, the four dimen-
sions of strategy use proposed by Lemaire and Siegler (1995) were charted: reper-
toire, frequency, efficiency, and adaptivity. The repertoire that students demon-
strated contained mental strategies for more than half of the students, half of
whom applied it to a majority of the problems. In line with the more informal
nature of mental strategies (Blote, Klein, & Beishuizen, 2000), mental strategies
were found to be non-algorithmic and simplifying more often than written strate-

72 CHAPTER 4. CHOICE/NO-CHOICE EXPERIMENT ADAPTIVITY
gies. As expected, mental strategies were found to be faster but less accurate than
written strategies, and earlier estimates of the inaccuracy of mental strategies (Van
Putten, 2005) were probably even still too optimistic because of selection effects
(Siegler & Lemaire, 1997): the percentage correct difference between mental and
written strategies was smaller in the free strategy choice condition (6 percentage
points) than in the unbiased NC-conditions (13 points).
We first investigated adaptivity by evaluating the degree to which students
adapted their strategy choices to their relative performance with these strategies.
Using student-level correlations, students were found to adaptively choose written
strategies more when these were relatively more accurate for them than mental
strategies, and above median ability students also when written strategies were
relatively faster. However, using problem-level adaptivity scores that labeled a
strategy choice as adaptive when it was for the fastest accurate strategy, we found
that a considerable portion of the strategy choices was counter-adaptive (around a
third), also for higher ability students. Particular counter-adaptivity was indicated
for lower ability students who chose mental calculation, as their accuracy improved
when they were required to write down calculations - which was also found by
Hickendorff et al. (2010), though they did not find the effect to depend on ability
level.
Following the suggestion of Verschaffel et al. (2009) of high importance of the
sociocultural context, we also devoted attention to adaptivity in the sense of adap-
tation of solution strategies to that context in the form of the students’ teachers
attitudes towards various aspects of strategy use and teachers’ own strategy appli-
cation. However, we found no significant effects, suggesting that students’ division
strategy use may not be very sensitive to that context, at least to the extent that
that context is shaped by their current teacher. Other studies of sociocultural
context effects which operationalized that context more broadly did find effects,
for example by including parents in addition to teachers (Carr & Jessup, 1997),
or contrasting vastly different contexts in which Brazilian children functioned as a
street vendor or as a student (Nunes, Schliemann, & Carraher, 1993). Sociocul-
tural effects on mental division strategy use might therefore be found by taking
broader approaches such as also including teachers from earlier stages of mathe-
matics learning instead of only the teacher from the final year of primary school,
or by also including less formal sociocultural influences such as parents and peers.
Contrasting distinct contexts could be achieved by comparing mental strategy use
in different countries.

4.4. DISCUSSION 73
Several interesting individual differences were found. Mental strategies offered
boys a larger speed advantage relative to written strategies than they did for girls,
which could contribute to the finding of Hickendorff et al. (2009) that boys use
mental strategies more than girls (though we did not replicate that finding). As for
ability level, while the rate of choices for mental strategies did not differ significantly
between levels, the accuracy advantage of written compared to mental strategies
was larger for lower than for higher ability students, and lower ability students
demonstrated less adaptivity (as in several other studies, e.g., Foxman & Beishuizen,
2003; Hickendorff et al., 2010; Torbeyns et al., 2006). These results indicate that
mental strategies are especially risky for lower ability students: not only are these
strategies especially inaccurate for this group, these weaker students also appear
to have problems with determining when they should and should not be applied.
What makes this especially worrisome, is that lower ability students nonetheless
appear to use mental strategies as often as higher ability students (or even more
often, as found by Hickendorff et al., 2009).
The finding that lower ability students benefit from being required to write
down calculations while higher ability students do not (who instead are slowed
down more) is in line with the expertise reversal effect in cognitive load theory,
which states that instructional techniques can have differential (and even reversed)
effects on cognitive load (and thereby, performance) depending on the expertise of
the learner (Kalyuga, Ayres, Chandler, & Sweller, 2003). In low-expertise students,
writing down calculations may free working memory resources for division problems
that otherwise pose a cognitive load that is too high, whereas in high-expertise
students, writing down calculations may be a redundant activity that places an
unnecessary extra load on those resources. Such an expertise reversed effect implies
that this technique of requiring writing down calculations should only be used for
expertise levels for which it is effective: lower ability students.
4.4.1 Methodological considerations
Two aspects of the methodology of the current investigation warrant further atten-
tion. The first is the strategies evaluated in the choice/no-choice experiments. The
choice/no-choice paradigm is often employed to compare specific strategies such
as direct subtraction and indirect addition (Torbeyns, Ghesquiere, & Verschaffel,
2009), but in our case broader categories of strategies are compared. As criticized
by Luwel, Onghena, et al. (2009), such broad categories can in turn consists of sev-
eral strategies, which is indeed the case here (both written and mental strategies are

74 CHAPTER 4. CHOICE/NO-CHOICE EXPERIMENT ADAPTIVITY
further classified into five categories). However, we argue that our comparison of
mental and written strategies is very meaningful in light of their large performance
difference and the apparently important role of this difference in performance level
changes (as discussed in the introduction), and note that in their introduction of
the choice/no-choice paradigm, Siegler and Lemaire (1997) also compared mental
and written strategies. In addition, comparing more specific division strategies in
the Dutch situation is complicated, as the division strategies that Dutch students
are taught differ and therefore not all students can be expected to be able to execute
particular strategies.
The second methodological aspect is the statistical conceptualization of adap-
tivity. In this study different approaches were taken, that each shed their own light
on the degree of adaptivity displayed by (subgroups of) students. A first consid-
eration is the level at which adaptivity is evaluated. Performance on individuals
problems may be unreliable, making aggregating over problems necessary for sta-
ble results Luwel, Onghena, et al. (2009), but this discards a lot of information
and treats problems as if they are interchangeable, which even within a domain as
specific as multidigit division seems unreasonable (e.g., see Table 4.2). The ASCM
posits that strategy choices are based on a weighted combination of global data
averaged over all problems, featural data per particular structural problem feature,
and local data per particular problem, and that the weighing depends on the fa-
miliarity of the problem (Siegler & Shipley, 1995). Therefore, it might be argued
that aggregating over all problems is more suitable when problems are relatively
unfamiliar, and less so when problems or problem features are more familiar. The
present study appears to lie somewhere in between, as multidigit division should
by a very familiar domain for students, but particular problems are typically not
repeatedly encountered, and both problem and individual approaches were taken.
A second consideration in determining adaptivity - also touched upon in the
introduction - is whether to consider accuracy and speed in isolation or to combine
them. In this study both approaches were taken, and for the combination speed
was only considered when both strategies were accurate, defining choices for the
fastest accurate strategy as adaptive (as in Luwel, Onghena, et al., 2009; Torbeyns,
De Smedt, et al., 2009; Kerkman & Siegler, 1997). Trials where both NC-solutions
were inaccurate remained undetermined, which is not the case when speed is con-
sidered in isolation, but one could question whether speed differences for inaccurate
strategies are as relevant as those for accurate strategies. All in all, we urge investi-
gators of adaptivity to be aware that different choices with regard to analysis level

4.4. DISCUSSION 75
and accuracy and speed can highlight different aspects of adaptivity.
4.4.2 Implications
The findings of this study have implications for cognitive psychological research
on solution strategies and for educational practice. As for cognitive research, we
found that written strategies appear to be chosen more for their accuracy, while
mental strategies appear to be chosen more for their speed. These considerations
did not play in equal measure in everyone: the strength of the accuracy effect
depended on mathematical ability level and the strength of the speed effect on
gender, and differences in adaptivity indicated that students differ in the extent to
which they adapt their strategy choices to strategies’ accuracy and speed. Choices
between mental and written calculation may therefore in part be determined by
individual differences in the relative value assigned to accuracy and speed, and
therefore in part reflect students’ speed-accuracy tradeoff (MacKay, 1982). Factors
that may play a role in the relative favoring of accuracy and speed are traits which
are traditionally associated with academic success (Bembenutty, 2009): academic
delay of gratification (which is generally higher in girls) parallels sacrificing speed for
accuracy, and self-efficacy (higher in boys) could determine the speed that students
allow themselves while still feeling confident about their accuracy. Future research
on adaptivity could extend existing models such as the ASCM (Siegler & Shipley,
1995) to accommodate individual differences in preferences for accuracy and speed,
and provide more insight into the sources of these individual differences by relating
them to other factors such as the ones discussed.
As for educational practice, results suggest that for some students it may be too
ambitious to strive for what is a central element of mathematics reforms: adaptive
expertise in choosing from an array of formal and informal strategies, rather than
mastery of a limited set of algorithmic strategies. We found that lower ability
students appear to use mental strategies as often as higher ability students, while
mental strategies are especially inaccurate for them and adaptivity in choosing when
to apply these strategies appears problematic. Lower ability students’ performance
may therefore be improved by providing them with more direction in their strategy
choices. The present study provided support for beneficial effects of doing this
directly by simply requiring students to write down calculations, and a broader
change in strategy behavior might be accomplished by targeting the sociocultural
context (Verschaffel et al., 2009).
As described in a review by Ellis (1997), cultural values in this context concern-

76 CHAPTER 4. CHOICE/NO-CHOICE EXPERIMENT ADAPTIVITY
ing various aspects of problem solving exert an important influence on children’s
strategy choices. She discusses values regarding speed and accuracy, mental strate-
gies, originality, and independent performance, and contrasts these values in differ-
ent cultures (such as Western cultures as apposed to Navajo, Asian and aborigine
cultures). Given the results of the present study, values for speed and accuracy
and mental strategies appear especially relevant to performance in multidigit arith-
metic. The suboptimal choices for mental strategies that we have observed may be
related to typical Western values in these areas: the favoring of fast performance
(rather than error-free performance, as for example in the Navajo culture), and
of solutions constructed in the head without any external aids. Therefore, perfor-
mance might be improved by making efforts to adjust these norms so that accuracy
is more important than speed, and that solutions constructed in the head are not
more desirable than those constructed with the external aids of paper and pencil.
The results of the present study suggest that such an adjustment may require a
broader approach of sociocultural effects than just the students’ current teacher.
All in all, we feel that it would be highly relevant for mathematics education to de-
vote more research efforts to investigating the feasibility of the educational goal of
adaptive expertise for lower ability students, and evaluating sociocultural influences
more broadly to see how strategy choices may be favorably influenced.
5
Affecting students’ choices between mental and written solution
strategies for division problems
Abstract
Making adaptive choices between strategies is a central element of cur-
rent day mathematics, but not all students may be able to do so. Suboptimal
choices between mental and written division strategies are indicated for lower
mathematical ability students. Strategy choices in this domain were related
to student and teacher factors for 323 sixth graders, and for 224 lower abil-
ity students an intervention promoting choices for relatively accurate written
strategies was evaluated using a pretest-posttest design. Written strategy
choices and performance increased considerably for students receiving inter-
vention or control training, but not for students who did not receive any
training. Results suggest that students’ strategy choices may also be affected
by targeting their motivation and the sociocultural context for strategy use.
5.1 Introduction
Tasks are executed using a variety of strategies during all phases of development
(Siegler, 2007). For example, infants vary in their use of walking strategies (Snapp-
Childs & Corbetta, 2009), first graders in their use of spelling strategies (Rittle-
Johnson & Siegler, 1999), and older children in their use of transitive reasoning
strategies (Sijtsma & Verweij, 1999). This large variance in strategies goes together
with widely differing performance rates of the different strategies, thereby having
This chapter is currently submitted for publication as: Fagginger Auer, M. F., Van Putten,C. M., & Hickendorff, M. (submitted). Affecting students’ choices between mental and writtensolution strategies for division problems.
We would like to thank the schools and students for their participation in the experiment, andthe Dutch National Institute for Educational Measurement Cito for allowing use of the assessmentitems.
77
78 CHAPTER 5. AFFECTING STUDENTS’ STRATEGY CHOICES
profound effects on performance levels. As such, strategies have been a topic of
continued investigation.
Children’s and adults’ solution strategy use has been investigated for many
cognitive tasks, such as mental rotation (A. B. Janssen & Geiser, 2010), class
inclusion (Siegler & Svetina, 2006), and analogical reasoning (Stevenson, Touw,
& Resing, 2011). A cognitive domain that has featured prominently in strategy
research is arithmetic. Many studies have been conducted on elementary addition
(e.g., Barrouillet & Lepine, 2005; Geary et al., 2004), subtraction (e.g., Barrouillet
et al., 2008), multiplication (e.g., Van der Ven et al., 2012) and division (e.g.,
Mulligan & Mitchelmore, 1997), which concern operations in the number domain
up to 100 that are taught in the lower grades of primary school. Some studies
have also addressed strategy use on the more complex multidigit (involving larger
numbers and decimal numbers) arithmetical tasks in the higher grades (e.g., Van
Putten et al., 2005; Selter, 2001; Torbeyns, Ghesquiere, & Verschaffel, 2009).
5.1.1 Determinants of strategy choices
Different aspects of strategy use for both elementary and multidigit arithmetical
problems can be discerned (Lemaire & Siegler, 1995): individuals’ strategy reper-
toire (which strategies are used); frequency (how often each strategy is used); effi-
ciency (the accuracy and speed of each strategy); and adaptivity (whether the most
suitable strategy for a given problem is used). These four aspects together shape
arithmetical performance. With reforms that have taken place in various countries
over the past decades (Kilpatrick et al., 2001), the aspect of adaptivity has become
particularly important. Building on students’ own strategic explorations and devel-
oping adaptive expertise in flexibly using an array of strategies now take a central
place, instead of perfecting the execution of a single algorithm per problem type
(Gravemeijer, 1997; Verschaffel et al., 2009). This makes choosing the most suitable
strategy for a given problem (i.e., making an adaptive strategy choice) crucial.
There are several ways in which the adaptivity of a strategy choice can be
defined, as described by Verschaffel et al. (2009). One way is to define adaptivity
purely based on task variables: the characteristics of a problem determine which
strategy is adaptive (e.g., the adaptive strategy choice for a problem like 1089÷ 11
is compensation: 1100 ÷ 11 − 1). However, individuals differ in their mastery of
different strategies, and the strategy that is most effective for one person does not
have to be that for another person. Therefore, a second way to define adaptivity
also takes subject variables into account: the strategy that is the adaptive choice
5.1. INTRODUCTION 79
is the one that is most effective for a given problem for a particular person. A
third way looks even further and includes context variables in the definition. These
can be variables both in the direct context of the test (e.g., time restrictions and
characteristics of preceding items) and in the broader sociocultural context. In their
discussion of adaptive expertise in elementary mathematics education, Verschaffel
et al. (2009) stress the importance of more educational research attention to these
sociocultural context variables.
Ellis (1997) reviewed research on this topic and argues that the sociocultural
context is very important in shaping individuals’ strategy repertoire and choices.
Students have an implicit understanding of which ways of problem solving are val-
ued by their community: whether speed or accuracy is more important; whether
mental strategies are valued over using external aids; whether using conventional
procedures or original approaches is preferred; and whether asking for help in prob-
lem solving is desirable. Ellis (1997) describes examples of existing differences in
strategy use between different cultures (e.g., Western, Asian, aborigine and Navajo
cultures). What is also interesting, and moreover, highly practically relevant, is
to investigate in what way the context may be manipulated to favorably influence
strategy choices.
5.1.2 Influencing students’ choices between mental and written
division strategies
A case in which influencing students’ strategy choices could have large beneficial
effects for performance, is that of mental and written strategies for multidigit di-
vision problems. As previously described, the attention to traditional algorithms
decreased during the reforms of mathematics education. In the Netherlands, this
was most extreme for the operation of division, for which the traditional algorithm
was abandoned in favor of a new standardized approach (Buijs, 2008; J. Janssen et
al., 2005). The traditional and newer approach (see Table 5.1 for examples) differ
in that the traditional algorithm is digit-based in the sense that it breaks the div-
idend up into digits (e.g., in Table 5.1, the 54 part of 544 is considered separately
in subtracting 34, and the rest of the dividend is only considered in a later step),
whereas the newer approach is whole-number-based and considers the dividend as
a whole (e.g., in Table 5.1, 340 is subtracted from 544; Van den Heuvel-Panhuizen
et al., 2009). Dutch national assessments in 1997 and 2004 showed the expected
decrease in sixth graders’ use of the digit-based algorithm, but use of the whole-
number-based approach did not increase accordingly; instead, students made more

80 CHAPTER 5. AFFECTING STUDENTS’ STRATEGY CHOICES
Table 5.1: Examples of the digit-based algorithm, whole-number-based algorithm,
and non-algorithmic strategies applied to the division problem 544÷ 34.
digit-based
algorithm
whole-number-
based algorithm
non-algorithmic
written strategies
34/544\16
34
204
204
0
544 : 34 =
340 - 10×204
102 - 3×10²
102 - 3×+
0 16×
10 × 34 = 340
13 × 34 = 442
16 × 34 = 544
use of strategies without any written work (Hickendorff et al., 2009).
These mental strategies turned out to be very inaccurate compared to written
strategies (digit-based or otherwise), suggesting a lack of adaptivity of strategy
choices with regard to accuracy, and a large performance decline for multidigit
division was observed on the assessments (Hickendorff et al., 2009). In follow-up
studies, Fagginger Auer, Hickendorff, and Van Putten (2016) and Hickendorff et
al. (2010) showed that requiring (lower mathematical ability) students who answer
without any written work to write down calculations improved their performance.
This shows that requiring the use of more efficient strategies can affect performance
favorably in the short term, providing a concrete suggestion for educational prac-
tice. A valuable extension of this finding would be an investigation of instructional
contexts that increase students’ choices for efficient strategies in the longer term,
thereby instilling more sustainable improvements in performance.
5.1.3 Present study
The present study is intended as a first step of such an investigation of the de-
terminants of sixth grade students’ choices between mental and written division
strategies. In the first part of the study, existing differences in these strategy
choices are related to students’ motivations and attitudes in mathematics and to
the sociocultural context for mathematics provided by the students’ teachers. In
the second part of the study, an intervention designed to increase students’ free
choices for written rather than mental strategies (and thereby, their performance)
is evaluated. Since mental strategies appear especially inaccurate for lower ability
students (Fagginger Auer et al., 2016; Hickendorff et al., 2010), our intervention

5.1. INTRODUCTION 81
focuses on this group. Using a pretest-posttest design, an intervention training con-
dition consisting of training sessions designed to promote writing down calculations
is compared to a control training condition where strategy use is not targeted, and
to a no training condition.
A meta-analysis by Kroesbergen and Van Luit (2003) on mathematics inter-
ventions for low ability students showed that effect sizes were larger for interven-
tions that featured direct instruction and self-instruction compared to interventions
with mediated instruction, and smaller effect sizes for interventions with computer-
assisted instruction and peer tutoring compared to interventions without those
elements. More specifically, in another meta-analysis on this topic, Gersten et al.
(2009) identified explicit instruction as an important component of effective inter-
ventions. This explicit instruction involves a step-by-step problem solving plan for
a specific type of problems, that is demonstrated by an instructor and that students
are asked to use. In order to maximize the potential efficacy of the intervention
training in the present study, this training therefore involves direct instruction by
a human, adult instructor using a step-by-step plan.
Hypotheses
The investigation of determinants of existing differences in mental versus written
division strategy choices is exploratory in nature, and involves of a number of po-
tentially relevant factors. Several of the aspects of the sociocultural context (as
seen by the teacher) described by Ellis (1997) as influential with regard to strategy
choices are considered: importance of speed versus accuracy, preference for mental
strategies versus use of external aids, and preference for conventional versus orig-
inal approaches. In addition, students’ self-rated functioning in mathematics and
motivation, teachers’ characteristics, and the mathematics textbook and division
algorithm instruction are considered.
As for the effects of the intervention: written strategy choices are expected
to increase more from pretest to posttest in the intervention than in the control
training group, given that they are is only promoted in the former group. Given the
higher accuracy of written compared to mental strategies, performance is therefore
expected to increase more in the intervention than in the control training group
(though the control group should also improve because of the additional practice
and attention that students receive). In the no training group, no large changes in
strategy choices or performance are expected because of the lack of training and
the limited amount of time that passes between the pretest and posttest.

82 CHAPTER 5. AFFECTING STUDENTS’ STRATEGY CHOICES
The effect of the intervention training may depend on students’ characteristics.
As boys appear to use more mental strategies for division than girls (Fagginger Auer
et al., 2013; Hickendorff et al., 2009, 2010), there is more room for improvement
through training in boys than in girls. Mathematical ability level may also be
relevant, as mental strategies are especially inaccurate for lower ability students
(Fagginger Auer et al., 2016; Hickendorff et al., 2010), and therefore increases in
the use of written strategies may affect performance more when ability is lower.
Finally, training may have a larger effect on performance when students’ working
memory capacity is lower, because then the working memory resources freed up
by writing down calculations make more of a difference (in line with cognitive load
theory; Paas, Renkl, & Sweller, 2003). This is especially relevant in our sample,
given that students with a lower mathematical ability tend to have a lower working
memory capacity than higher ability students (Friso-van den Bos, Van der Ven,
Kroesbergen, & Van Luit, 2013).
5.2 Method
5.2.1 Participants
A total of 323 sixth graders (53 percent girls) with a mean age of 11 years and 8
months (SD = 5 months) from 19 different classes at 15 different schools partic-
ipated in the study. For all students, a general mathematical ability score from
a widely used standardized national student monitoring system (J. Janssen et al.,
2010) was available. All students participated in the pretest and posttest, but train-
ing was only given to the 147 students with mathematical ability percentile scores
between 10 and 50. Students scoring in the lowest performing decile (7 percent
in our sample) were excluded, because atypical problems such as dyscalculia could
occur in this group. Of the selected students, 74 received intervention training
and 73 control training. They were assigned to a training condition using random
assignment with gender, ability quartile and school as blocking variables.
For an indication of development independent of training, performance and
strategy choices were also investigated for students who did not receive any train-
ing. However, no students with the same ability level as the students who received
training were available, so data from the 77 students in the adjoining ability groups
(the quartile just above the median and the lowest decile) was used, as in a regres-
sion discontinuity design (Hahn, Todd, & Van der Klaauw, 2001). The ability scale
scores in the untrained group were on average somewhat higher and they were more

5.2. METHOD 83
varied (M = 101.9, SD = 13.4) than in the control training (M = 97.9, SD = 5.3)
and intervention training group (M = 97.3, SD = 5.5).
5.2.2 Materials
Pretest and posttest
The pretest used to asses students’ division strategy choices and performance con-
tained the twelve multidigit division problems given in Table 5.2 (for the problems
not yet released for publication as they will be in future assessments, parallel ver-
sions are given in italics). These problems were taken from the two most recent na-
tional assessments of mathematical ability at the end of primary school (J. Janssen
et al., 2005; Scheltens et al., 2013), so that our results could be interpreted relative
to the national results that called for this line of mathematical strategy research. All
problems were situated in realistic problem solving context (e.g., determining how
many bundles of 40 tulips can be made from 2500 tulips), except for the problem
31.2 ÷ 1.2. The test also contained twelve problems involving other mathematical
operations (all from the most recent national assessment), so that it more closely
resembled a regular mathematics test to students. The posttest was identical to
the pretest to allow for a direct comparison of results, and with the tests being a
month apart and students solving similar problems on a daily basis in mathematics
lessons during that period, it was very unlikely that students remembered any of
the (complex) solutions.
Accuracy (correct or incorrect) and use of written work (yes or no) were scored
for every problem. For solutions with written work, a further distinction was made
between three strategy categories: the digit-based algorithm; the whole-number-
based algorithm; and non-algorithmic written strategies (see Table 5.1 for exam-
ples).
Training problems
The problems used in the three training sessions in between the pretest and posttest
were three sets of parallel versions of the twelve problems in those tests.
Student and teacher questionnaires
The students filled out a questionnaire on their attitude towards mathematics and
mental mathematical strategies consisting of seven questions. The teachers filled
out a questionnaire of fifteen questions on their attitude towards and instruction

84 CHAPTER 5. AFFECTING STUDENTS’ STRATEGY CHOICES
Table 5.2: The division problems that students had to solve at the pretest and
posttest.
problems
1536÷ 16 = 96 872÷ 4 = 218 31.2 ÷ 1.2 = 26 6496 ÷ 14 = 464
544 ÷ 34 = 16 11585 ÷ 14 = 827.5 47.25 ÷ 7 = 6.75 157.50÷ 7.50 = 21
2500 ÷ 40 = 62 1470 ÷ 12 = 122.50 736÷ 32 = 23 16300÷ 420 = 39
Note: Parallel versions of problems not yet released for publication are in italics.
of division algorithms, writing down calculations, and various aspects of flexible
strategy use. Both questionnaires can be found in the Appendix.
Working memory tests
The verbal working memory capacity of students who received training was assessed
using a computerized version (Stevenson, Saarloos, Wijers, & De Bot, in prepara-
tion) of the digit span test from the WISC-III (Wechsler, 1991), and their spatial
working memory using a computerized version (Stevenson et al., in preparation) of
the Corsi block test (Corsi, 1972).
5.2.3 Procedure
The experiment was conducted over a period of five weeks in the fall of 2014.
In the first week, the students first completed the pretest in a maximum of 45
minutes in their classroom. They then did the two working memory tasks on the
computer and filled out the student questionnaire. The teacher also filled out the
teacher questionnaire in this first week. In the following three weeks, the students
participated in three individual training sessions of fifteen minutes each (one per
week) with the experimenter. The experiment was concluded in the fifth week,
in which students did the posttest in again a maximum of 45 minutes in their
classrooms.
The training sessions consisted of the students working on the set of training
problems for that week. The experimenter evaluated each solution when it was
written down and told the student whether it was correct or incorrect. When
correct, the students proceeded to the next problem. When incorrect, the student
tried again. Accuracy feedback was provided again, and regardless of whether the
solution was correct this time, the student proceeded to the next problem. The
session was terminated when fifteen minutes had passed.

5.2. METHOD 85 …
: …
=
1x …
2x …
4x …
8x …
10x
…
5x …
???
:
?? =
…
…
x
?
??
: ?
? =
?
??
- ?
?x
…
?
??
: ?
? =
…
?
??
- ?
?x
??
??
- ?
x +
0
…
x
23
4 :
18
=
23
4 : 1
8 =
18
0-
10
x
5
4
23
4 : 1
8 =
18
0 1
0x
1x 1
8
2x 3
6
4x 7
2
8x 1
44
10x 1
80
5x 9
0
1x 1
8
2x 3
6
4x 7
2
8x 1
44
10x 1
80
5x
90
23
4 : 1
8 =
13
18
0-
10
x
5
4
5
4-
3
x +
0 1
3x
1x
??
2x
??
4x
??
8x
??
10
x ?
?
5x
??
…
/ …
\
1x …
6
x .
..
2x …
7
x …
3x …
8
x …
4x …
9
x …
5x …
5
511
155
?? /
??
? \ …
…
??
/ ?
?? \
?
?
?
…
??
/ ?
?? \
???
?
?
??
??
0
18
/ 2
34
\
18
/ 2
34
\ 1
1
8
54
18
/ 2
34
\ 1
1
8
1x 1
8
2x 3
6
3x 5
4
4x 7
2
5x 9
0
1x 1
8
2x 3
6
3x 5
4
4x 7
2
5x 9
0
18
/ 2
34
\ 1
3
1
8
54
54
0
0
6x 1
08
7x 1
26
8x 1
44
9x 1
72
1x
??
2x
??
3x
??
4x
??
5x
??
6x
??
7x
??
8x
??
9x
??
Figure 5.1: The step-by-step plans (the lower one for students using the digit-
based algorithm, and the upper one for students using the whole-number-based
algorithm).

86 CHAPTER 5. AFFECTING STUDENTS’ STRATEGY CHOICES
Though these elements of the training were the same for the control and training
conditions, two important aspects differed. The first is that students in the control
condition were free in how they solved the problems (just as in the pretest), whereas
the students in the intervention condition had to write down their calculations in
a way that would allow another child to see how they had solved the problem (but
otherwise, strategy choice was free). In addition, while students in the intervention
condition made their first attempt at solving the problem independently (using
a written strategy of their own choice), if they failed, they were provided with
systematic feedback on writing down calculations in a standardized way at the
second attempt. The students in the control condition received no such feedback
and made both their first and second attempt independently.
A step-by-step plan was used for providing the feedback on writing down cal-
culations in the intervention condition, while there was no such plan in the control
training condition. The step-by-step plan was always on the table for the inter-
vention training students so they could use it whenever they wanted, and when
intervention students were stuck in their problem solving, the experimenter used
the plan and standardized instructions to help the students with writing down cal-
culations. No feedback was given on the accuracy of what students wrote down
(e.g., mistakes in the multiplication table), except for the final solution.
There was a version of the plan for students taught the digit-based algorithm and
one for students taught the whole-number-based algorithm (see Figure 5.1). Both
versions consist of five highly similar steps (with step 3 and 4 repeated as often as
necessary): (1) writing down the problem; (2) writing down a multiplication table
(optional step); (3) writing down a number (possibly from that table) to subtract;
(4) writing down the subtraction of that number; and (5) finishing when zero is
reached, which in the case of the whole-number-based algorithm requires a final
addition of the repeated subtractions. Each step is represented by a symbol to
make the step easy to identify and remember (the symbols in the ellipses on the
left side of the scheme). Below this symbol, a general representation of the step
is given, with question marks for problem-specific numbers already present at that
step and dots for the numbers to be written down in that step. On the right-hand
side of the plan, an example of the execution of each step for the particular problem
234 ÷ 18 is given in a thinking cloud. On both sides, the elements to be written
down in the current step are in bold font.

5.2. METHOD 87
5.2.4 Statistical analysis
Correlation analyses
To explore possible relations between the questions on the student and teacher ques-
tionnaires and students’ written strategy choices on the pretest, correlations rather
than formal models were used because of the high number of questions involved.
Point-biserial correlations were used for dichotomous questionnaire responses and
Spearman’s rank correlations for scales.
Explanatory IRT models
More formal tests were conducted using explanatory item response theory (IRT)
models. As argued by Stevenson, Hickendorff, Resing, Heiser, and de Boeck (2013),
measuring learning and change has inherent problems that can be addressed using
explanatory IRT. These are problems such as the dependence of the meaning of
scale units for change on pretest score, because of the non-interval measurement
level of non-IRT scores (e.g., an increase of one in the number correct does not
necessarily mean the same for a person who already had a nearly perfect score as
for someone who had a lower score).
IRT models place persons and items on a common latent scale (Embretson &
Reise, 2000). The distance between the persons and items on that scale determines
the probability of a correct response: if person ability and item difficulty are close
together that probability is around fifty percent, whereas it is lower if ability is
lower than difficulty, and higher if ability is higher than difficulty. In its most basic
form, the (Rasch) model for the probability of a correct response of person p with
ability θp on item i with difficulty βi is P (ypi = 1|θp) =exp(θp−βi)
1+exp(θp−βi). The estimated
ability parameters for persons are more likely to have an interval measurement level
than simple sum scores.
This model becomes explanatory when explanatory factors for items’ difficulty
or persons’ ability are included, which can be item covariates (not used in the
present study), person covariates (condition and student gender, ability score and
working memory in the present study), and person-by-item covariates (solution
strategy choice in the present study). This type of models can be estimated as
multilevel logistic regression models using general purpose generalized linear mixed
model (GLMM) software, by fitting a binomial model with solution accuracy (cor-
rect or incorrect) as the dependent variable, a random intercept for students as
the ability parameter, and the covariates of interest as fixed effects (De Boeck &

88 CHAPTER 5. AFFECTING STUDENTS’ STRATEGY CHOICES
Wilson, 2004).
In the present study, different explanatory IRT models were fitted using the lme4
package in R (Bates, Maechler, Bolker, & Walker, 2014; De Boeck et al., 2011). All
models were random person-random item Rasch models (RPRI; De Boeck, 2008),
with a random intercept for students, and also a random intercept for the item
effects (as they were considered a draw from the larger domain of multidigit divi-
sion). The different covariates were added in stepwise fashion (as in Stevenson et
al., 2013), so that the added value of each addition could be evaluated by comparing
the models based on the Aikaike Information Criterion (AIC), Bayesian Informa-
tion Criterion (BIC), and likelihood ratio tests. The AIC and BIC balance model
fit and parsimony and lower values of these criteria are better, and a significant
likelihood ratio test indicates that of the two models that are compared, the more
complex model fits significantly better. Of the final best fitting model according
to these various criteria, the regression parameters were interpreted. Since our
research question did not only concern accuracy (correct vs. incorrect) but also
strategy choice (written vs. not written), and IRT models accommodate dichoto-
mous variables regardless of content, strategy use was modeled in the same way.
The person parameter θp then reflects individual differences in the tendency to use
written strategies.
For an indication of the size of significant effects, the probability P of a correct
response or of using a written strategy is given for different levels of the covariate,
with all other covariates in the model set at the mean in the sample. For example,
for the effect of testing occasion (pretest or posttest), the probability of a correct
solution for an average student on an average problem on the pretest and on the
posttest is given. For numeric covariates (e.g., ability score) the effects of a differ-
ence of one standard deviation around the mean (M − 0.5SD to M + 0.5SD) are
given.
5.3 Results
5.3.1 Relation between student and teacher factors and written
strategy choices
First, an exploration of pre-existing differences in choices for written strategies
based on students’ attitudes with regard to mathematics and teachers’ strategy
instruction was made using the pretest data. Students used written strategies in 62

5.3. RESULTS 89
percent of their pretest solutions, which varied between 51 percent for the problem
31.2÷ 1.2 and 87 percent for the problem 11585÷ 14.
Student questionnaire
The Appendix shows what all students (N = 323) reported on the student ques-
tionnaire on their mathematical attitudes. The proportion of students choosing
each alternative is given in brackets after the respective alternative. After each
question, the correlation between the question response and the overall proportion
of pretest division problems solved with written strategies is also given.
On average, the students had a slightly positive attitude towards mathematics
(M = 3.2 on a 5-point scale) and were slightly positive about their mathemati-
cal ability (M = 3.3), and the more positive their attitude and the higher their
judgment of ability, the higher their frequency of choices for written strategies
(r(322) = .17 and r(322) = .21 respectively). Students reported putting quite some
effort into math (M = 4.3) and almost all (98 percent) reported valuing accuracy
over speed, but these factors were unrelated to written strategy choices. A majority
of students (72 percent) found it more important to be able to solve mathemat-
ical problems with than without paper, and this was positively related to using
written strategies (r(318) = .19). Students reported sometimes answering without
writing down a calculation (M = 2.8), and indeed, reporting more frequent mental
calculation was negatively related to using written strategies (r(322) = −.17).
Students also reported on reasons they had for not writing down calculations,
on the occasions that they used this approach (which were less frequent for some
students and more frequent for others). The most popular reason (chosen by 60
percent of students) was because they did not feel it was necessary, followed by
doing it because it was faster (37 percent), because of not feeling like it (19 percent),
and because of guessing the solution instead of calculating it (19 percent). Some
students also reported better accuracy with mental strategies (13 percent) and
finding it smarter to be able to solve a problem mentally (11 percent). Virtually no
students (1 percent) perceived mental calculation as cooler. Indicating not finding
writing down calculations necessary as a reason for not doing it was positively
related to written strategy choices (r(322) = .20), whereas indicating not feeling
like writing anything down and considering mental calculation more accurate as
reasons were negatively related to written strategy choices (r(322) = −.12 and
r(322) = −.23).
90 CHAPTER 5. AFFECTING STUDENTS’ STRATEGY CHOICES
Teacher questionnaire
The Appendix also shows what the teachers of the students (N = 19) reported on
the teacher questionnaire on their strategy instruction. As for the student question-
naire, the proportion of teachers choosing each alternative is given, and the mean
is given for the 5-point scales. Correlations were also calculated, but none of them
were significant, possibly due to low power because of the small N .
A small majority of the teachers was male (58 percent) and the teachers were
on average 38 years old. Almost half (47 percent) used the textbook ’Wereld in
Getallen’ and their students solved 54 percent of the problems using written strate-
gies, while the students of teachers using other textbooks (’Pluspunt’, ’Alles telt’
and ’Rekenrijk’) used written strategies on 66 to 69 percent of the problems.
Most teachers taught their students the whole-number-based algorithm exclu-
sively (58 percent) or in combination with the digit-based algorithm (26 percent),
and 16 percent taught their students the digit-based algorithm exclusively. On
average, teachers did not prefer one algorithm over the other (M = 3.0), but did
prefer use of an algorithm to non-algorithmic approaches (M = 2.2). During their
own training, the whole-number-based algorithm (53 percent) or digit-based al-
gorithm (42 percent) was emphasized, and for one teacher both algorithms. On
average, teachers found performing calculations well on paper and mentally equally
important for their students (M = 3.0). They reported instructing their students
in writing down calculations frequently (on average almost daily, M = 4.2).
Concerning multidigit division problems specifically, teachers on average found
writing down calculations somewhat more important for their students than trying
to do it mentally (M = 2.4) and valued accuracy somewhat over speed (M = 2.5).
Making a good estimation of the solution was more important than being able to
determine the exact solution (M = 3.5), as was knowing more solution procedures
than just one (M = 3.4). Teachers considered using an algorithm versus choosing
a custom solution strategy on average equally important (M = 3.0), and valued
convenient shortcut strategies somewhat more than using a method that can always
be applied (M = 3.3).
5.3.2 Content of the training
After the pretest, students with a mathematical ability percentile rank between
10 and 50 (N = 147) received intervention or control training. During the three
training sessions, the students in the intervention condition completed on average
5.3. RESULTS 91
5.1 division problems per session and the students in the control condition 6.1 prob-
lems. The number of problems that students attempted a second time (when the
solution was incorrect the first time) was 1.6 for the intervention and 1.8 for the
control condition. During all the second attempts of a session combined, interven-
tion students received feedback 3.3 times on average. This feedback most often
concerned writing down a multiplication table (0.8 times) and selecting a number
from that table (1.1 times), and less often the writing down of the problem (0.5
times), subtracting the selected number (0.5 times) and finishing the procedure (0.5
times).
As instructed, the students in the intervention condition virtually always wrote
down a calculation (for 98, 99 and 99 percent of the problems in the first, second
and third session respectively). Though not instructed to do so, the students in the
control condition also often wrote down a calculation and this appeared to increase
over sessions, with 81 percent in the first session and 87 and 93 percent in the
second and third session. The use of written calculations that were algorithmic
(digit-based or whole-number-based) increased over sessions in both groups and
appeared higher overall in the intervention condition (84, 93 and 96 percent in the
three sessions in the intervention condition and 63, 71 and 76 percent in the control
condition).
5.3.3 Effects of the intervention and control training
The effects of the training were evaluated using a series of explanatory IRT models
on the pretest and posttest data with successively more predictors (see Table 5.3).
Written strategy choices
First a baseline model for the probability of a written strategy choice was fitted
with only random intercepts for students and problems and no covariates (model
M0). In model M1, main effects were added for the student characteristics gender,
ability and working memory capacity, which improved fit according to all crite-
ria (see Table 5.3). Fit was further improved by adding a main effect for testing
occasion (pretest or posttest; model M2). However, the change in written strat-
egy choices from pretest to posttest did not significantly differ for the control and
intervention training groups (model M3). Adding interactions between condition,
testing occasion and student characteristics also did not improve the model (these
models are not included in Table 5.3 for brevity).

92 CHAPTER 5. AFFECTING STUDENTS’ STRATEGY CHOICEST
ab
le5.3
:E
xp
lan
atoryIR
Tm
od
elsfor
trainin
geff
ectson
written
strateg
ych
oices
an
daccu
racy
(all
comp
arisons
areto
Mn−1 ).
inte
rventio
nvs.
contro
ltra
ining(N
=147)
strat.
added
fixed
effects
LL
#pars
AIC
BIC
LR
T
M0
-1337.6
32681.1
2699.4
M1
gen
der,
ability
and
WM
-1315.7
62643.3
2679.8
χ2(3
)=
43.8
,p<.0
01
M2
testing
occa
sion
-1216.5
72447.0
2489.5
χ2(1
)=
198.3
,p<.0
01
M3
conditio
n×occa
sion
-1215.6
92449.2
2503.9
χ2(2
)=
1.7
,p
=.4
2
acc.
added
fixed
effects
LL
#pars
AIC
BIC
LR
T
M0
-1801.0
33607.9
3626.1
M1
gen
der,
ability
and
WM
-1785.3
63582.5
3619.0
χ2(3
)=
31.4
,p<.0
01
M2
testing
occa
sion
-1711.1
73436.3
3478.8
χ2(1
)=
148.3
,p<.0
01
M3
conditio
n×occa
sion
-1710.8
93439.6
3494.2
χ2(2
)=
0.7
,p
=.7
0
trainingvs.
notra
ining(N
=224)
strat.
added
fixed
effects
LL
#pars
AIC
BIC
LR
T
M0
-2107.4
34220.8
4240.3
M1
gen
der
and
ability
-2069.2
54148.3
4180.8
χ2(2
)=
76.5
,p<.0
01
M2
testing
occa
sion
-2016.9
64045.8
4084.8
χ2(1
)=
104.6
,p<.0
01
M3
conditio
n×occa
sion
-1962.8
83941.7
3993.7
χ2(2
)=
108.1
,p<.0
01
M4a
gen
der×
conditio
n×occa
sion
-1962.2
11
3946.5
4018.0
χ2(3
)=
1.2
,p
=.7
6
M4b
ability×
conditio
n×occa
sion
-1961.5
11
3945.0
4016.4
χ2(3
)=
2.7
,p
=.4
3
acc.
added
fixed
effects
LL
#pars
AIC
BIC
LR
T
M0
-2724.1
35454.2
5473.7
M1
gen
der
and
ability
-2668.5
55347.0
5379.4
χ2(2
)=
111.2
,p<.0
01
M2
testing
occa
sion
-2610.9
65233.8
5272.8
χ2(1
)=
115.2
,p<.0
01
M3
conditio
n×occa
sion
-2593.2
85202.4
5254.4
χ2(2
)=
35.4
,p<.0
01
M4a
gen
der×
conditio
n×occa
sion
-2592.7
11
5207.4
5278.9
χ2(3
)=
1.0
,p
=.8
1
M4b
ability×
conditio
n×occa
sion
-2591.6
11
5205.2
5276.7
χ2(3
)=
3.2
,p
=.3
6
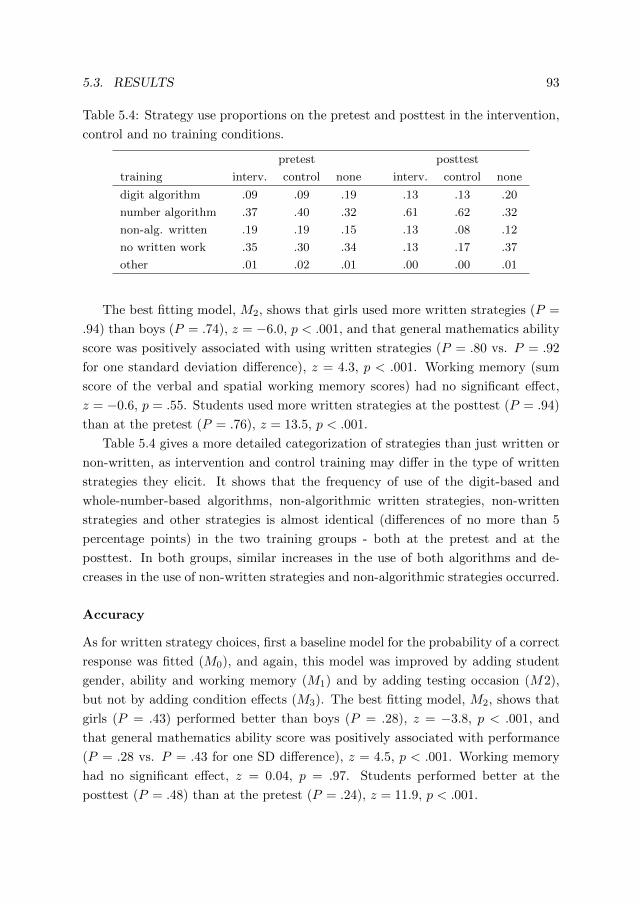
5.3. RESULTS 93
Table 5.4: Strategy use proportions on the pretest and posttest in the intervention,
control and no training conditions.
pretest posttest
training interv. control none interv. control none
digit algorithm .09 .09 .19 .13 .13 .20
number algorithm .37 .40 .32 .61 .62 .32
non-alg. written .19 .19 .15 .13 .08 .12
no written work .35 .30 .34 .13 .17 .37
other .01 .02 .01 .00 .00 .01
The best fitting model, M2, shows that girls used more written strategies (P =
.94) than boys (P = .74), z = −6.0, p < .001, and that general mathematics ability
score was positively associated with using written strategies (P = .80 vs. P = .92
for one standard deviation difference), z = 4.3, p < .001. Working memory (sum
score of the verbal and spatial working memory scores) had no significant effect,
z = −0.6, p = .55. Students used more written strategies at the posttest (P = .94)
than at the pretest (P = .76), z = 13.5, p < .001.
Table 5.4 gives a more detailed categorization of strategies than just written or
non-written, as intervention and control training may differ in the type of written
strategies they elicit. It shows that the frequency of use of the digit-based and
whole-number-based algorithms, non-algorithmic written strategies, non-written
strategies and other strategies is almost identical (differences of no more than 5
percentage points) in the two training groups - both at the pretest and at the
posttest. In both groups, similar increases in the use of both algorithms and de-
creases in the use of non-written strategies and non-algorithmic strategies occurred.
Accuracy
As for written strategy choices, first a baseline model for the probability of a correct
response was fitted (M0), and again, this model was improved by adding student
gender, ability and working memory (M1) and by adding testing occasion (M2),
but not by adding condition effects (M3). The best fitting model, M2, shows that
girls (P = .43) performed better than boys (P = .28), z = −3.8, p < .001, and
that general mathematics ability score was positively associated with performance
(P = .28 vs. P = .43 for one SD difference), z = 4.5, p < .001. Working memory
had no significant effect, z = 0.04, p = .97. Students performed better at the
posttest (P = .48) than at the pretest (P = .24), z = 11.9, p < .001.

94 CHAPTER 5. AFFECTING STUDENTS’ STRATEGY CHOICES
The difference in accuracy between written and non-written strategies was inves-
tigated by fitting a model for accuracy with main effects for all previous predictors
(student characteristics, testing occasion, and condition) and strategy choice (writ-
ten or not), and all first-order interactions between strategy choice and the other
predictors. This showed that written strategies were much more accurate (P = .40)
than non-written strategies (P = .19), z = 4.1, p < .001, and that this did not de-
pend significantly on testing occasion, z = 1.1, p = .27, gender, z = 0.0, p = .99,
ability, z = 1.0, p = .32, working memory, z = 0.3, p = .75, or condition, z = −1.0,
p = .33.
5.3.4 Differences with no training group
Given the similar changes in strategy choices and accuracy in both training groups,
it was investigated whether these changes also occurred in students who did not
receive any training. The previous analyses were repeated, this time comparing
trained students (N = 147) to untrained students from adjoining ability groups
(N = 77). Working memory was omitted from these models, as this was only
assessed for the children who received training.
Written strategy choices
This time, the fit of the models for written strategy choices was best for model
M3 (which also included an effect of condition; see Table 5.3). The effect of the
intervention did not differ significantly by gender or ability level (models M4a and
M4b). Model M3 once more showed more written strategy choices for girls (P = .90)
than boys (P = .63), z = −6.9, p < .001, and a positive association with ability
(P = .72 vs. P = .86 for a difference of one SD), z = 6.9, p < .001. There
was no significant effect of testing occasion, z = −1.4, p = .15, and no overall
difference between the trained and untrained students, z = 0.5, p = .64. However,
the change in use of written strategies from pretest to posttest was different for
trained (P = .75 to P = .93) than for untrained students (P = .73 to P = .69),
z = 9.8, p < .001.
Comparisons of more specific strategies in Table 5.4 show that at pretest, the
untrained students appear to have used the digit-based algorithm somewhat more
often and the whole-number-based algorithm somewhat less often than the trained
students. Most notably, however, strategy choices on the pretest and posttest are
almost identical for the untrained children, whereas the trained children increased

5.4. DISCUSSION 95
their use of algorithms and decreased their use of non-written strategies and non-
algorithmic strategies.
Accuracy
The fit of the models for accuracy was also best for model M3 with the condition
effect (see Table 5.3). This model again showed higher accuracy for girls (P = .41)
than boys (P = .28), z = −4.3, p < .001, and a positive association with ability
(P = .26 vs. P = .44 for one SD difference), z = 10.1, p < .001. There was no
significant effect of testing occasion, z = −1.4, p = .15, and no overall difference
between the trained and untrained students, z = −1.8, p = .07. However, the
increase in accuracy from pretest to posttest was higher for trained (P = .25 to
P = .49) than for untrained students (P = .31 to P = .35), z = 5.9, p < .001.
Written strategies were again found to be much more accurate (P = .41) than
non-written strategies (P = .21), z = 3.0, p = .002, and this did not depend
significantly on testing occasion, z = 1.6, p = .12, gender, z = 0.2, p = .88, ability,
z = 0.8, p = .44, or condition, z = 1.1, p = .28.
5.4 Discussion
The determinants of students’ choices between mental and written division strate-
gies were investigated. First, an exploration was carried out of the relation be-
tween existing differences in these choices and students’ motivations and attitudes
in mathematics and the sociocultural context for mathematics provided by the
students’ teachers. For an important part, students’ choices for mental strategies
appear to be related to their motivation: mental strategies are used more by stu-
dents who report liking mathematics less and being less good at it, and who report
not writing down calculations because they do not feel like it. Mental strategies are
also used more by students reporting higher accuracy with these strategies. Though
this higher accuracy could be true for high ability students (Fagginger Auer et al.,
2016), it mostly appears to be a misjudgment as the reporting of it is negatively
correlated with ability level, r(322) = −.24, p < .001.
No statistically significant relations between teacher reports and students’ strat-
egy choices were found, even though several aspects of the sociocultural context de-
scribed as influential on mathematical strategies by Ellis (1997) were investigated,
but this could very well be due to a lack of power (there were only 19 teachers in
our sample). Overall, teachers reported frequent instruction in writing down cal-

96 CHAPTER 5. AFFECTING STUDENTS’ STRATEGY CHOICES
culations, preferred use of an algorithm to non-algorithmic approaches, and valued
written strategies somewhat over mental strategies and accuracy somewhat over
speed. These reports suggest a sociocultural context in which there is room for
written strategies, but where it is not the highest priority.
In the second part of the study, an intervention training designed to promote
lower mathematical ability students’ choices for written rather than mental strate-
gies (and thereby, their performance) was evaluated. As intended, written strategy
choices and accuracy were considerably higher after training than before training.
However, similar changes occurred in the control training condition. This means
that the extra elements of the intervention training specifically targeted at strategy
use did not add to the effect of the training. The common elements of the control
and intervention training do appear to be responsible for the observed changes in
strategy choices and accuracy, as no such changes occurred in the students who
received no training (though these students were of a different ability level, limiting
the comparison). An important question is therefore which of the training elements
not specifically targeted at strategy use nonetheless affected it.
5.4.1 Elements of the intervention and control training
Practicing written strategies
While writing down calculations was not required during control training (it was a
specific part of the intervention training), it did occur frequently in this condition.
During the first control training session, calculations were written down for 81
percent of the problems - considerably more than the 70 percent during the pretest.
This increased up to 93 percent in the third training session. As such, students
practiced written calculations almost as much in the control training as in the
intervention training condition, reducing the contrast between the two conditions.
The generally higher level of written strategy choices in the control training
compared to the pretest may be due to the different settings in which the pretest
and training occurred: in a classroom versus one-on-one with an experimenter. An
individual setting is likely to increase students’ motivation to do well, and since the
student questionnaire suggested that an important reason for using mental strate-
gies is a lack of motivation, this increased motivation may cause the students to
use less mental strategies. Another possibility is that students use written strate-
gies because they think the experimenter may expect or prefer that (i.e., demand
characteristics; Orne, 1962), in line with the students’ teachers’ light inclination

5.4. DISCUSSION 97
towards written rather than mental strategies. Supporting the explanation of the
higher level of written strategy choices by setting (individual versus classroom),
the increase in written strategy choices from pretest to first training session was
followed by a decrease from final training session to posttest (93 to 87 percent).
A possible cause of the further increase in the use of written strategies over
sessions in the control training group is the direct accuracy feedback after each
solution, and the requirement to do a problem again when the first solution was
incorrect. Direct accuracy feedback allows for an immediate evaluation of the suc-
cess of the strategy that was applied, and this evaluation should often be in favor
of written rather than mental strategies given the considerably higher accuracy of
the former. Combined with the extra effort associated with an incorrect solution
(redoing the problem), this is likely to be an important incentive for written strat-
egy choices. The possibility of accuracy feedback promoting mathematical strategy
change was also demonstrated by Ellis, Klahr, and Siegler (1993).
Step-by-step plan
The only training element that was truly unique to the intervention condition was
the step-by-step plan for writing down calculations. Though the meta-analysis on
mathematics interventions for low ability students by Gersten et al. (2009) iden-
tified such plans as an important component of effective interventions, the lack of
differences between the training conditions shows that the plan did not make a
significant contribution in our study. Indeed, students turned out to require little
feedback based on the plan, and the feedback that was given mostly concerned
an optional element of written division algorithms (the multiplication table). This
suggests that by sixth grade, even lower ability students do not require further in-
struction in the notation of the division algorithm (even though the algorithm was
introduced only one or two years earlier).
Given that the only real difference between the control and intervention training
turned out to be mostly redundant, there was no chance for student characteristics
to interact with type of training in the effect on changes from pretest to posttest.
Our hypotheses regarding the effects of gender, ability and working memory were
therefore not confirmed. An interaction with having training or not could have
been detected if present given the differences found between these two conditions,
but was also not found. Working memory was not included in these analyses, as
it was only measured in the children who received training, and ability scores were
different in the training and no training conditions. Gender, however, could very

98 CHAPTER 5. AFFECTING STUDENTS’ STRATEGY CHOICES
well have interacted with condition: as expected from the literature (Fagginger
Auer et al., 2013; Hickendorff et al., 2009, 2010), boys used written strategies far
less frequently than girls, and therefore had more room to improve with training
than girls. However, training may not eliminate boys’ general preference for more
intuitive, less formal strategies (Carr & Jessup, 1997; Davis & Carr, 2002), which
may therefore continue to limit their choices for (formal) written strategies to some
extent.
5.4.2 Future directions
The results of the present study provide several suggestions for future research on
strategy training programs. Firstly, they underline the necessity of very careful
consideration of the content of the control condition(s). With regard to control
groups, U. Fischer, Moeller, Cress, and Nuerk (2013) stress the importance of
these groups being performance-matched to the intervention group, as learning
trajectories are highly dependent on ability level, and equal in motivational appeal
and training time, as these two non-specific factors also contribute to performance.
The untrained group in the present study does not meet these demands, which may
have inflated the effects we found (U. Fischer et al., 2013), but the control training
group certainly does. In fact, the control training even matched the intervention
training too closely, which shows that attention should also be devoted to which
control training elements may be (unintentionally) effective.
Some of the elements of the present study are promising for future training
investigations. The results suggest that direct accuracy feedback (possibly with
some cost involved in incorrect solutions) may be conducive to beneficial changes
in strategy choices. They also show that considerable changes in strategy choices
and improvements in performance may be achieved with as few as three training
sessions of fifteen minutes (in line with the finding of Kroesbergen & Van Luit,
2003, that longer mathematics interventions are not necessarily more effective). A
follow-up test after a longer period of time (e.g., several months) should be used to
establish whether the changes are lasting.
The results also provide two suggestions for other possible ways to influence stu-
dents’ choices between mental and written strategies. A first possibility is to target
students’ motivation: since strategy choices appear to be related to motivation, in-
creasing students’ motivation may also increase their choices for written strategies.
In a review, Middleton and Spanias (1999) concluded that students’ motivation
in mathematics depends for an important part on their perception of success in

5.A. STUDENT QUESTIONNAIRE 99
this area, but also that it can be positively affected by instruction. This may be
achieved with teacher practices such as asking students to make daily recordings of
what they learned or excelled at, and prompting them to attribute failures to lack
of effort and encouraging them to try harder (Siegle & McCoach, 2007). However,
the relation found in the present study was purely correlational, so it should be
established experimentally whether changes in motivation actually lead to changes
in strategy choices.
A second possibility for increasing students’ choices for written strategies lies
in the sociocultural context for mathematical strategy use provided by the teacher.
The results from the teacher questionnaire show that while teachers generally give
instruction on writing down calculations frequently, they only have a slight prefer-
ence for written over mental strategies and for accuracy over speed. Since cultural
values regarding the use of external aids (e.g., paper and pencil) in constructing
solutions and regarding accuracy versus speed can have large effects on students’
strategy choices (Ellis, 1997), targeting these aspects of the sociocultural context
could affect written strategy choices beneficially. This might be done by having
teachers express more appreciation of the use of external aids in problem solving,
and of accuracy compared to speed, since written strategies offer more accuracy
and mental strategies more speed (Fagginger Auer et al., 2016).
5.A Student questionnaire
The proportion of students choosing each alternative is given in between brackets,
and for five-point scales, the mean is also given. The correlations are between the
question response and the frequency of written strategy choices on the pretest.
1. How much do you like math? (M = 3.24) (r(322) = .17, p = .002)
not at all (.06) / not so much (.13) / it’s okay (.40) / quite a bit (.32) / a lot (.08)
2. How much effort do you put into doing math? (M = 4.29) (r(323) = .08, p = .17)
none (.00) / not so much (.02) / a bit (.06) / quite a lot (.54) / a lot (.39)
3. How good do you think you are at math? (M = 3.27) (r(322) = .21, p < .001)
not good at all (.04) / not so good (.17) / okay (.31) / quite good (.44) / very good
(.04)
4. What is more important to you when you solve a mathematics problem?
(r(320) = .06, p = .28)
solving the problem quickly (.02) / finding the correct solution (.98)

100 CHAPTER 5. AFFECTING STUDENTS’ STRATEGY CHOICES
5. What is more important to you when you solve a mathematics problem?
(r(318) = .19, p = .001)
being able to do it mentally (.28) / being able do it using paper (.72)
6. How often do you solve problems without writing down a calculation? (M = 2.80)
(r(322) = −.17, p = .002)
almost never (.11) / not often (.24) / sometimes (.43) / often (.19) / very often (.03)
7. When you do not write down a calculation, why is that? (tick boxes that apply)
• because it is faster (.37) (r(322) = −.04, p = .52)
• because then you get a correct solution more often (.13) (r(322) = −.23,
p < .001)
• because doing mental calculation shows you are smart (.11) (r(322) = −.02,
p = .71)
• because it is cooler to do mental calculation (.01) (r(322) = −.18, p = .001)
• because you do not feel like writing anything down (.19) (r(322) = −.12,
p = .03)
• because you guessed the solution (.19) (r(322) = −.05, p = .37)
• because it is not necessary to write down a calculation (.60) (r(322) = .20,
p < .001)
5.B Teacher questionnaire
The proportion of teachers choosing each alternative is given in between brackets, and for
five-point scales, the mean is also given. The correlations are between the question response
and the frequency of the teachers’ students’ written strategy choices on the pretest.
1. What is your gender? male (.58) / female (.42) (r(19) = .03, p = .91)
2. What is your birth year? . . . (M = 1976) (r(19) = −.23, p = .35)
3. Which mathematics textbook do you use in sixth grade? Alles Telt (.21) (M = .66)/
Wereld in Getallen (.47) (M = .54) / Pluspunt (.26) (M = .69) / Rekenrijk (.05)
(M = .69)
4. Do you teach your students the whole-number-based algorithm, digit-based algorithm
or non-algorithmic approaches for solving multidigit problems (such as 544÷ 34 or
12.6÷ 1.4)? When multiple approaches apply, tick multiple boxes.
whole-number-based algorithm (.58) / both whole-number-based and digit-based
algorithm (.26) / digit-based algorithm (.16) (r(19) = .07, p = .77)
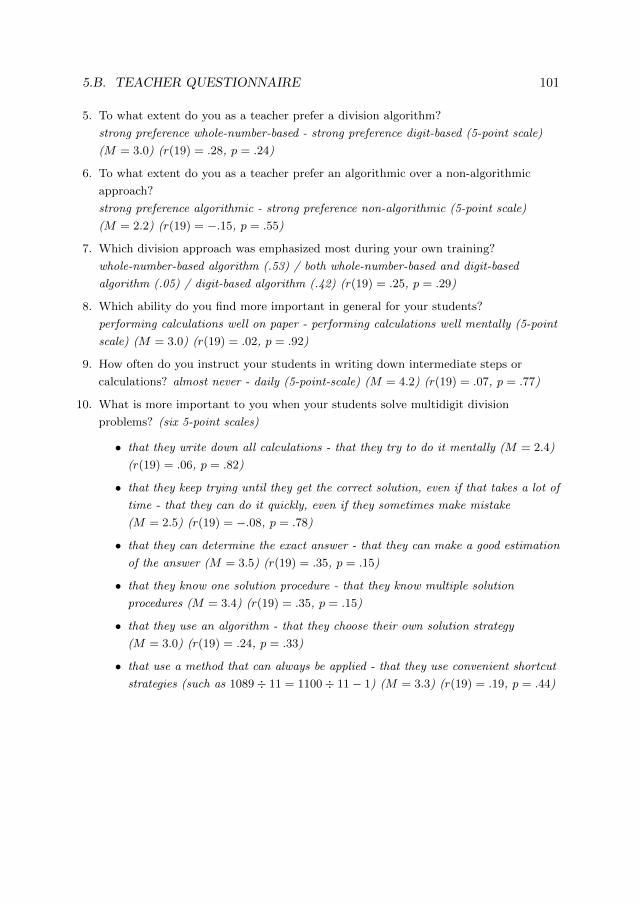
5.B. TEACHER QUESTIONNAIRE 101
5. To what extent do you as a teacher prefer a division algorithm?
strong preference whole-number-based - strong preference digit-based (5-point scale)
(M = 3.0) (r(19) = .28, p = .24)
6. To what extent do you as a teacher prefer an algorithmic over a non-algorithmic
approach?
strong preference algorithmic - strong preference non-algorithmic (5-point scale)
(M = 2.2) (r(19) = −.15, p = .55)
7. Which division approach was emphasized most during your own training?
whole-number-based algorithm (.53) / both whole-number-based and digit-based
algorithm (.05) / digit-based algorithm (.42) (r(19) = .25, p = .29)
8. Which ability do you find more important in general for your students?
performing calculations well on paper - performing calculations well mentally (5-point
scale) (M = 3.0) (r(19) = .02, p = .92)
9. How often do you instruct your students in writing down intermediate steps or
calculations? almost never - daily (5-point-scale) (M = 4.2) (r(19) = .07, p = .77)
10. What is more important to you when your students solve multidigit division
problems? (six 5-point scales)
• that they write down all calculations - that they try to do it mentally (M = 2.4)
(r(19) = .06, p = .82)
• that they keep trying until they get the correct solution, even if that takes a lot of
time - that they can do it quickly, even if they sometimes make mistake
(M = 2.5) (r(19) = −.08, p = .78)
• that they can determine the exact answer - that they can make a good estimation
of the answer (M = 3.5) (r(19) = .35, p = .15)
• that they know one solution procedure - that they know multiple solution
procedures (M = 3.4) (r(19) = .35, p = .15)
• that they use an algorithm - that they choose their own solution strategy
(M = 3.0) (r(19) = .24, p = .33)
• that use a method that can always be applied - that they use convenient shortcut
strategies (such as 1089÷ 11 = 1100÷ 11− 1) (M = 3.3) (r(19) = .19, p = .44)

6
Single-task versus mixed-task mathematics performance and strategy
use: Switch costs and perseveration
Abstract
The generalization of educational research to educational practice often
involves the generalization of results from a single-task setting to a mixed-
task setting. Performance and strategy use could differ in these two settings
because of task switching costs and strategy perseveration, which are both
phenomena that have yet to be studied with more complex educational tasks.
Therefore, the problem solving of 323 primary school students in a single-task
and mixed-task condition was investigated. The tasks that students had to
do were typical educational tasks from the domain of mathematics that are
especially interesting with regard to strategy use: solving twelve multidigit
division problems that were intended to be solved with written, algorithmic
strategies, and twelve non-division mathematical problems that do not call for
such strategies. The results indicated no condition differences in performance
or strategy use. This suggests that generalization of problem solving in single-
task setting to a mixed-task setting is not necessarily problematic.
6.1 Introduction
An important challenge for educational research is its generalization to educational
practice. The present study addresses a possible issue in generalization that does
This chapter is currently submitted for publication as: Fagginger Auer, M. F. (submitted).Single-task versus mixed-task mathematics performance and strategy use: Switch costs and per-severation.
I would like to thank the schools and students for their participation in the experiment,Anton Beguin and Floor Scheltens for their assistance in conceptualizing the study, and the DutchNational Institute for Educational Measurement Cito for allowing use of the assessment items.
103

104 CHAPTER 6. SINGLE-TASK VS. MIXED-TASK MATHEMATICS
not appear to have been investigated so far: the generalization of single-task re-
search to mixed-task practice. In the daily educational practice of lessons and tests,
students generally do not work on one task exclusively, but switch between different
tasks as they go from problem to problem: for example, a mathematics test usually
does not concern only a single mathematical operation (e.g., multiplication), but
consists of different types of problems that require different operations. Also at the
higher level of evaluating educational achievement in (inter)national assessments,
tasks are presented mixed with each other rather than in isolation (e.g., Mullis &
Martin, 2014; Scheltens et al., 2013).
Yet, much of educational research consists of single-task experiments, such
as multiplication (Siegler & Lemaire, 1997), addition (Torbeyns et al., 2005), or
spelling (Rittle-Johnson & Siegler, 1999). Sometimes, single-task experiments are
even used for explanation of results of mixed-task assessments (e.g., Hickendorff et
al., 2010). The use of single-task designs for experiments is logical, given the nature
of experiments: the evaluation of the effects of controlled manipulation of only one
or a few factors at once. However, when using single-task designs, it is important
to know to what extent this may limit the generalizability of results to educational
practice. Therefore, in the present study two aspects of problem solving are con-
sidered that may differ for single-task versus mixed-task designs: performance and
solution strategy use.
6.1.1 Possible causes of differences between single-task en
mixed-task results
Two phenomena could play a role in creating differences in problem solving.
Switch costs
The first is the well-established phenomenon of task switching costs in terms of
accuracy and speed. A long line of research has established in increasingly advanced
experiments that switching between tasks incurs costs. Various explanations for
this phenomenon have been proposed (Kiesel et al., 2010). One is that costs occur
because of active preparation for the upcoming task, while another posits passive
decay of the previous task. Another explanation is interference from the other task
(that was previously performed or is expected to be performed) in performing the
current task. The research on task switching usually concerns very simple tasks,
such as determining whether a number is even or odd or whether a stimulus is a

6.1. INTRODUCTION 105
number or a letter, and describes switch costs in terms of milliseconds. In contrast,
most tasks in education are much more complex, and therefore the extent to which
switch costs will occur in an educational context is not self-evident and has yet to
be investigated.
Strategy perseveration
The second phenomenon that could play a role is that of strategy perseveration.
This topic has not been studied widely yet, but has received recent research at-
tention (Lemaire & Lecacheur, 2010; Luwel, Schillemans, Onghena, & Verschaffel,
2009; Luwel, Torbeyns, Schillemans, & Verschaffel, 2009; Schillemans, Luwel, Bulte,
Onghena, & Verschaffel, 2009; Schillemans, Luwel, Onghena, & Verschaffel, 2011a,
2011b). Strategy perseveration is the continuing use of the same strategy as in
previous solutions, even though another strategy may be more suitable or efficient
for the problem at hand. Schillemans (2011) has described several explanations for
this perseveration. One is the Einstellung effect, which is individuals’ tendency to
become blinded to other strategies, even though they may be more suitable than the
previously applied strategy. A second explanation is priming, where the strategy
that was previously used is more highly activated and therefore more likely to be
selected. A third explanation is strategy switch costs, which are the costs involved
in switching between strategies (which may occur through similar mechanisms as
task switching costs; Lemaire & Lecacheur, 2010).
Perseveration has been shown to occur in single-task settings (Lemaire & Lecacheur,
2010; Luwel, Schillemans, et al., 2009; Luwel, Torbeyns, et al., 2009; Schillemans
et al., 2009, 2011a, 2011b), but what occurs in a mixed-task setting has yet to be
investigated: the mixing would seem to prevent perseveration as the alternation
of tasks makes it impossible to keep applying the same strategy, but possibly per-
severation in a similar but not identical strategy could occur (e.g., an algorithmic
approach on one task might increase the probability of a (different) algorithmic
approach on a subsequent other task).
6.1.2 The present study
Given these possible and as of yet unknown effects of task switching costs and
strategy perseveration in an educational setting, the present study compares per-
formance and strategy use in a single-task versus a mixed-task condition. The task
used is the solving of mathematical problems in the domain of multidigit division

106 CHAPTER 6. SINGLE-TASK VS. MIXED-TASK MATHEMATICS
(division with larger numbers or decimal numbers, such as 1536÷ 16 or 31.2÷ 1.2).
This task is a typical educational task, making it suitable for the goal of investi-
gating task switching and strategy perseveration in an educational context, and is
also especially interesting with regard to the latter strategy phenomenon.
This is because multidigit division problems are traditionally associated with
solution strategies that involve writing down calculations (especially algorithmic
strategies), or even defined as problems that make such an approach necessary
of desirable (J. Janssen et al., 2005; Scheltens et al., 2013). However, in mixed-
task large-scale assessments only around half of students’ solutions involve written
(mostly algorithmic) strategies (Scheltens et al., 2013), even though these strate-
gies are much more accurate than non-written strategies (Hickendorff et al., 2009).
Possibly, the mixing of multidigit division problems with other problems that do
not call for written, algorithmic strategies makes students persevere in using men-
tal, non-algorithmic strategies, or conversely, prevents students from persevering in
written algorithmic strategies on the division problems. The comparison of single-
task and mixed-task division problem solving in the present study could shed light
on the extent to which this is the case.
The division problems are contrasted with other mathematical problems that
do not involve division and that were selected to elicit mental, or at least non-
algorithmic strategy use. Rather than contrasting division with a single other task,
non-division problems from (nearly) all regularly assessed mathematics domains
were included, to more closely approximate educational practice. Division and
non-division problems from the two most recent national large-scale assessments
of mathematics at the end of primary school in the Netherlands were used, be-
cause they reflect typical problems in Dutch primary school mathematics and were
rigorously pretested.
Research questions
The first research question addressed by this study was the following: to what extent
does mathematical performance differ in single-task and mixed-task conditions?
Given the well-established existence of switch costs, it was expected that in the case
of any differences between conditions, performance (whether in accuracy or speed)
would be worse in the mixed-task than in the single-task conditions. However,
because the task of multidigit division problem solving is much more complex than
the elementary tasks usually employed in task switching, it could be that so many
facets are already involved in performing just the mathematics task, that additional

6.2. METHOD 107
costs in switching between different mathematical tasks are negligible. In that case,
performance in both conditions would be comparable.
The second research question that was addressed was: to what extent does
the occurrence of strategy perseveration differ in single-task and mixed-task con-
ditions? Two types of perseveration could occur. One is perseveration in applying
the mental, non-algorithmic strategies suitable for the non-division problems to
the division problems in the mixed-task condition, where division problems always
occur directly or shortly after non-division problems (which is not the case in the
single-task condition). The other is perseveration in applying written, algorithmic
strategies to the division problems when they are presented together in the single-
task condition (which is not possible when the division problems are interspersed
with non-division problems that cannot be solved with a division algorithm in the
mixed-task condition).
6.2 Method
6.2.1 Participants
A total of 323 students at the end of primary school (sixth grade; 11-12-year-
olds) from 15 different schools participated in the experiment, of whom 53 percent
were girls and 47 percent were boys. Data on students’ mathematical ability was
available from standardized national tests that are administered at most Dutch
primary schools (J. Janssen et al., 2010). Students were assigned to the single-task
(50 percent of students) and mixed-task condition (the other 50 percent) according
to a randomized block design (with blocking based on gender, ability quartile and
school).
6.2.2 Materials
Students made a test consisting of twelve multidigit division problems and twelve
problems of other types (see Table 6.1 for the problems). The problems came from
the two most recent (2004 and 2011) national large-scale assessments of mathemat-
ics performance at the end of primary school (Scheltens et al., 2013; J. Janssen et
al., 2005). All problems were open-ended, and all problems except 31 ÷ 1.2 and38 + 1
4 were presented in a realistic problem solving context (such as determining
how many bundles of 40 tulips can be made from 2500 tulips). The non-division
problems were from (nearly) all mathematics domains investigated in the assess-

108 CHAPTER 6. SINGLE-TASK VS. MIXED-TASK MATHEMATICS
ments except addition, subtraction, multiplication and division, as these problems
were intended to evoke non-algorithmic, mental strategies.
The problems were printed in A4-booklets with two problems per page, so that
there was ample space for writing down calculations. In the single-task condition,
the first twelve problems in the test booklet were the division problems and the
next twelve the non-division problems (or vice versa for half of the students that
condition), whereas in the mixed-task condition, every time one or two non-division
problems were followed by one or two division problems in an unpredictable way
(see Table 6.1). The single task did not consist of solely division problems so that
the total difficulty and time required for the test was the same in both conditions.
6.2.3 Procedure
Students made the tests in their classroom in the presence of the experimenter and
had 45 minutes to do so. Students were instructed that if they wanted to write
down calculations, they should do so in the test booklet. When a student had
finished, the test completion time in minutes for that student was written down by
the experimenter.
After students had made the test, their solutions were scored for accuracy and
strategy use. For division problems, four categories of strategy use were discerned:
the digit-based algorithm (a more traditional approach, where numbers are broken
up into digits that can be handled without an appreciation of their magnitude in the
whole number); the whole-number-based algorithm (a newer approach where every
step towards obtaining the solution requires students to understand the magnitude
of the numbers they are working with; Treffers, 1987a); non-algorithmic written
solutions (such as only writing down intermediate steps); and no written work
(see Table 6.2 for examples). For the non-division problems, the two algorithm
categories were merged into one category, as whole-number-based algorithms are
very infrequent for other operations than division (Buijs, 2008), and the other
categories were the same.
6.2.4 Statistical analysis
Mixed models
The effects of condition (single-task or mixed-task) and student gender (boy or girl)
and mathematical ability score and their interactions on speed and accuracy were
investigated using mixed models: linear mixed models for test completion time and
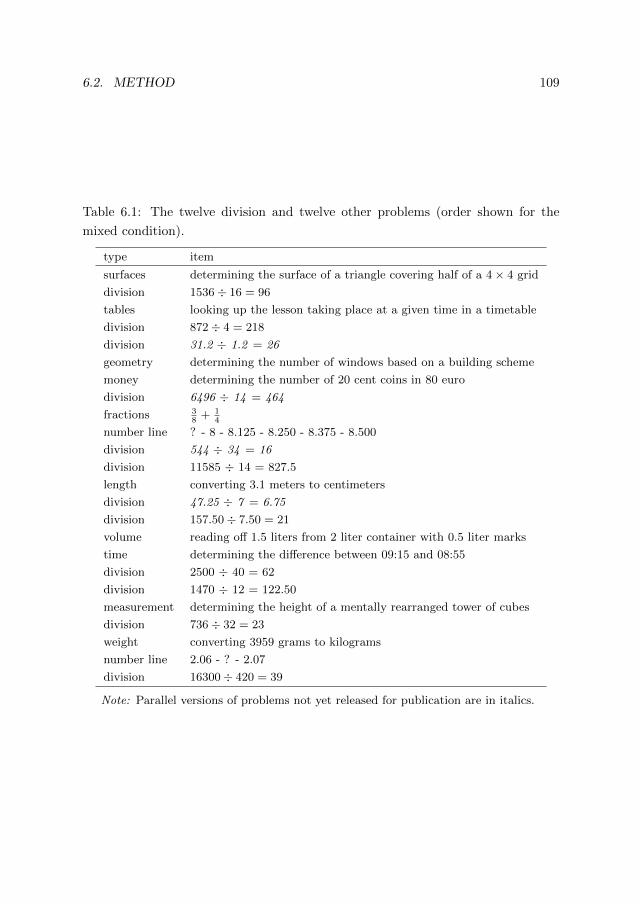
6.2. METHOD 109
Table 6.1: The twelve division and twelve other problems (order shown for the
mixed condition).
type item
surfaces determining the surface of a triangle covering half of a 4× 4 grid
division 1536÷ 16 = 96
tables looking up the lesson taking place at a given time in a timetable
division 872÷ 4 = 218
division 31.2 ÷ 1.2 = 26
geometry determining the number of windows based on a building scheme
money determining the number of 20 cent coins in 80 euro
division 6496 ÷ 14 = 464
fractions 38
+ 14
number line ? - 8 - 8.125 - 8.250 - 8.375 - 8.500
division 544 ÷ 34 = 16
division 11585 ÷ 14 = 827.5
length converting 3.1 meters to centimeters
division 47.25 ÷ 7 = 6.75
division 157.50÷ 7.50 = 21
volume reading off 1.5 liters from 2 liter container with 0.5 liter marks
time determining the difference between 09:15 and 08:55
division 2500 ÷ 40 = 62
division 1470 ÷ 12 = 122.50
measurement determining the height of a mentally rearranged tower of cubes
division 736÷ 32 = 23
weight converting 3959 grams to kilograms
number line 2.06 - ? - 2.07
division 16300÷ 420 = 39
Note: Parallel versions of problems not yet released for publication are in italics.

110 CHAPTER 6. SINGLE-TASK VS. MIXED-TASK MATHEMATICS
Table 6.2: Examples for the different strategy coding categories for the division
problem 544÷ 34.
digit-based
algorithm
whole-number-
based algorithm
non-algorithmic
strategies
no written work
34/544\16
34
204
204
0
544 : 34 =
340 - 10×204
102 - 3×10²
102 - 3×+
0 16×
10 × 34 = 340
15 × 34 = 510
16 × 34 = 544
16
logistic mixed models for accuracy (correct or incorrect). Both types of models
included a random effect for schools, and the accuracy model also random effects
for students and items (De Boeck, 2008) since it modeled data at the item level.
The analyses were conducted using the package lme4 in the statistical computing
software R (Bates & Maechler, 2010).
Latent class analysis
Students’ patterns of strategy use on the twelve division items were investigated
using multilevel latent class analysis (MLCA). In LCA, individuals are classified
in latent classes that are each characterized by a particular pattern of response
probabilities for a set of items (Goodman, 1974; Hagenaars & McCutcheon, 2002).
The multilevel aspect makes individuals’ probability of being in latent classes de-
pendent on the group they are in (in this study, the groups that are formed by the
classes of the different teachers). Covariates can also be added to predict latent
class membership. The multilevel latent class analysis was conducted with version
5.0 of the Latent GOLD program (Vermunt & Magidson, 2013). All twelve division
strategy variables were entered as observed response variables and a teacher iden-
tifier variable as the grouping variable for a nonparametric multilevel effect. The
optimal number of latent students and teacher classes was determined based on the
Bayesian Information Criterion (BIC; Schwarz, 1978) and the effects of covariates
were evaluated using Wald tests.

6.3. RESULTS 111
Table 6.3: Performance in the single and mixed task condition in terms of accuracy
and speed.
accuracy (percentage correct) speed (minutes)
condition non-division problems division problems whole test
single-task 69 44 37
mixed-task 70 45 36
total 70 45 36
Table 6.4: Strategy use in the single-task and mixed-task condition.
non-division problems division problems
condition A NA NW DA WA NA NW
single-task 2 7 91 13 36 20 32
mixed-task 3 7 90 17 34 19 30
total 2 7 91 14 35 19 31
Note: A=algorithm, NA=non-algorithmic, NW=no written work, DA=digit-based
algorithm, WA=whole-number-based algorithm
6.3 Results
As can be seen from the performance descriptives in Table 6.3, students provided
correct solutions to 70 percent of the non-division and 45 percent of the division
problems, and completed the test in 36 minutes on average (SD = 8 minutes). Ta-
ble 6.4 gives the frequencies of students’ use of the different strategies. As intended,
students almost never applied an algorithmic strategy to non-division problems (2
percent), and most often solved such problems without writing down any calcula-
tions (91 percent). For the division problems, students used an algorithmic strategy
approximately half of the time: they applied the whole-number-based algorithm to
35 percent of the problems and the digit-based algorithm to 15 percent of the prob-
lems. Solutions without any written work were also frequent (31 percent), as were
non-algorithmic written strategies (19 percent).
6.3.1 Task switching costs
To investigate whether the switching between division and non-division problems in
the mixed-task condition incurred switch costs that did not occur in the single-task
condition, accuracy and speed in the two conditions were compared.

112 CHAPTER 6. SINGLE-TASK VS. MIXED-TASK MATHEMATICS
Accuracy
Table 6.3 shows that the observed percentage of correct answers to division problems
was nearly identical in the two conditions: 44 percent in the single-task and 45
percent in the mixed-task condition. A comparison of models using likelihood ratio
tests confirmed a lack of differences between the conditions: the null model for the
accuracy of division solutions (with only an intercept) was significantly improved
by adding the student characteristics gender and ability (and their interaction) as
predictors, χ2(3) = 231.4, p < .001, but adding a condition effect (and condition
interactions with gender and ability) did not provide further improvement, χ2(4) =
6.7, p = .15. In the model with student characteristics, accuracy was found to be
lower for boys than for girls, z = −3.41, p < .001, and accuracy was found to be
positively related to ability score, z = 10.25, p < .001. The interaction between
gender and ability was non-significant, z = 1.75, p = .08.
Speed
Table 6.3 also shows that average time in which students completed the whole test
was nearly identical in the two conditions: 37 minutes in the single-task and 36
minutes in the mixed-task condition. Again, a comparison of models confirmed a
lack of differences between the conditions: the null model for test completion time
(with only an intercept) was significantly improved by adding student gender and
ability, χ2(3) = 27.3, p < .001, but adding condition effects provided no further
improvement, χ2(4) = 4.4, p = .36. In the model with student characteristics, boys
were found to be faster than girls, z = −5.23, p < .001. Ability score did not have
a significant effect, z = −0.31, p = .38, nor did the interaction between gender and
ability, z = 0.49, p = .31.
6.3.2 Strategy perseveration
To investigate the effects of mixing division and non-division problems on strategy
use, patterns of strategy use in the two conditions were compared. Table 6.4 shows
that the overall percentage of division problems solved with each strategy was
nearly identical in the single-task and mixed-task conditions: 13 and 17 percent
respectively for the digit-based algorithm; 36 and 34 percent for the whole-number-
based algorithm; 20 and 18 percent for non-algorithmic written strategies; and 32
and 30 percent for strategies without any written work.

6.4. DISCUSSION 113
A latent class analysis identified four different patterns of strategy use on the
division problems (the BIC was lowest for a model with four latent student and
three latent teacher classes): 44 percent of the students predominantly used the
whole-number-based algorithm (mean probability of using that strategy on the
different items of .72); 23 percent of students used mainly non-algorithmic written
strategies (mean probability of .55) and answering without written work (mean
probability of .28); 18 percent mostly answered without any written work (mean
probability of .87); and 15 percent predominantly used the digit-based algorithm
(mean probability of .71).
Again, adding student characteristics to the null model improved it, χ2(9) =
58.4, p < .001, while the subsequent addition of condition effects did not pro-
vide further improvement, χ2(12) = 15.3, p = .23. In the model with student
characteristics, gender was significantly related to strategy use (the probability of
the whole-number-based algorithm pattern was lower for boys than for girls, while
the probability of the answering without any written work pattern was higher),
W 2 = 18.0, p < .001. Ability score also had a significant effect (it was positively
related to the probability of the algorithm patterns and negatively to the proba-
bility of the non-algorithmic written and no written work patterns), W 2 = 10.4,
p = .02. The interaction between gender and ability was not significant, W 2 = 6.9,
p = .07.
6.4 Discussion
As the generalization of educational research to educational practice often involves
the generalization of results from a single-task setting to a mixed-task setting, the
present study compared students’ problem solving in these two conditions. The
tasks that students had to do were typical educational tasks from the domain of
mathematics that are especially interesting with regard to strategy use: solving
multidigit division problems that are intended to be solved with written, algorith-
mic strategies, and non-division mathematical problems that do not call for such
strategies. Differences in performance and strategy use on these tasks in the single-
task and mixed-task conditions could occur because of task switching costs (both
in terms of accuracy and speed) and because of strategy perseveration.
However, no differences between conditions were found: accuracy and speed did
not differ, and though different patterns of strategy use were identified, students
were equally likely to have those patterns in both conditions. There were gender

114 CHAPTER 6. SINGLE-TASK VS. MIXED-TASK MATHEMATICS
and ability level differences in accuracy, speed and strategy use, but there were
no significant interaction effects of these student characteristics with condition.
Therefore, no support was found for task switching costs with these educational
tasks. Possibly, the larger complexity of educational tasks compared to typical
tasks from the task switching literature (such as deciding whether a number is odd
or even) makes switching costs negligible, as the task itself already requires the
switching between many different sub-tasks.
There was also no indication of strategy perseveration. There was a group of
students who quite consistently answered without any written work on not only
the non-division, but also the division problems. This might have indicated per-
severation if this strategy choice pattern occurred more often in the mixed-task
condition (where the division problems were preceded by non-division problems
that elicited this strategy) than in the single-task condition, but this was not the
case. There were also two groups of students who quite consistently used the digit-
based or whole-number-based algorithms for division, which might have indicated
perseveration if this pattern occurred more often in the single-task (where all divi-
sion problems were presented in a row) than in the mixed-task condition, but this
was also not the case.
All in all, the results of the present study therefore suggest that a generalization
of performance and strategy use in a single-task setting to a mixed-task setting is
not necessarily problematic.
6.4.1 Limitations
However, the detection of possible task switching costs and strategy perseveration
may have been hindered by some limitations in the design of the present study.
Task switching costs
A limitation that may have prevented the finding of task switching costs is that a
comparison of complete single-task blocks with mixed-task blocks is quite crude. A
more refined comparison could be made between problems directly after a switch
(switch trials) and problems not directly after a switch (repeat trials; Kiesel et al.,
2010). This is not possible with the current data, however, as a fair comparison
requires that each problem features as often in a switch as in a repeat trial (other-
wise, type of trial and problem difficulty are confounded). This would necessitate
extra versions of the problem set.

6.4. DISCUSSION 115
Another limitation is that switching costs in terms of speed were investigated
using the amount of minutes it took students to solve all (division and non-division)
problems combined, rather than the much more precise amount of seconds per
problem. The latter could be assessed by making students do the test on a computer
or individually in the presence of an experimenter who records the time, but both
these situations are likely to affects students’ performance and strategy use.
Another issue is the type of tasks that were used. The tasks in the present
study may have been so complex that switching costs became negligible, but ed-
ucational practice also involves simpler tasks where this may not be the case. In
addition, division problems were mixed with many other tasks from the domain
of mathematics, whereas in the task switching literature usually just two tasks
are contrasted. Doing the latter could make differences between conditions more
pronounced, though it would also reduce the similarity to educational practice.
Strategy perseveration
There are also two factors that may have prevented us from finding strategy perse-
veration effects. One is that strategy perseveration has only been demonstrated in
the context of a single task for which different strategies are most appropriate de-
pending on the characteristics of the problem at hand (Lemaire & Lecacheur, 2010;
Luwel, Schillemans, et al., 2009; Schillemans et al., 2009, 2011b). In contrast, in the
present study mental, non-algorithmic strategy use was elicited with non-division
problems and the effect of this on strategy use on division problems was evaluated.
Perseveration within the division problems could still have occurred in the single-
task condition, but presumably in the form of repeated use of a written algorithm,
and since this strategy is most accurate for this type of problem (Fagginger Auer
et al., 2013) that would not constitute persevering in using a suboptimal strategy.
In addition, both Schillemans et al. (2009) and Lemaire and Lecacheur (2010)
did not find perseveration or strategy switch costs generally, but only for problems
with specific characteristics. Lemaire and Lecacheur (2010) found strategy switch
costs particularly for easier problems, while the division problems in the present
study were difficult (45 percent correct solutions), so strategy perseveration may
be found with easier educational tasks.

116 CHAPTER 6. SINGLE-TASK VS. MIXED-TASK MATHEMATICS
6.4.2 Conclusion
It can be concluded that the results of the present study do not indicate particu-
lar problems for the generalization of performance and strategy use in single-task
experiments to mixed-task educational practice. However, less complex tasks may
induce more switch costs and strategy perseveration, and several adjustments to
the experimental set-up would allow for a more thorough investigation (though
possibly at the cost of similarity of the experiment to educational practice).

7
General discussion
The previous five chapters of this dissertation described investigations of what
factors affect students’ mathematical solution strategy use and performance, and
of techniques that can be used to conduct such investigations. This research was
carried out in the domain of multidigit multiplication and division at the end of
Dutch primary school, in which large changes in students’ solution strategy use
and performance have taken place, and in which the educational goal of adaptive
strategy choices appears not to be achieved by a considerable amount of students.
In Chapters 2 and 3 of this dissertation, the relation between the instruction that
takes place in classrooms and students’ multiplication and division solution strat-
egy choices and performance was investigated, by the means of secondary analyses
of large-scale assessment data using latent variable models. Instruction was con-
sidered both as the formal curriculum provided by mathematics textbooks and the
instructional practices. In Chapters 4 and 5, students’ division strategy choices
(and through these, performance) were targeted in experiments in schools. Specif-
ically, choices between relatively accurate written and inaccurate mental strategies
were manipulated: students had to write down calculations (Chapter 4) or received
a training intended to encourage them to do so (Chapter 5). In Chapter 6, a com-
parison was made of strategy choices and performance in tasks in which multiple
operations are mixed together (as in Chapters 2 and 3) versus tasks that only
concern one mathematical operation (as in Chapters 4 and 5), and no particular
problems for generalization of results from one setting to another were indicated.
In all the chapters, the effects of different student characteristics were considered
(gender, mathematical ability, SES, working memory and attitudes with regard to
mathematics and mathematical strategy use).
117

118 CHAPTER 7. GENERAL DISCUSSION
7.1 Substantive conclusions
Various findings with regard to students’ solution strategy choices and performance
were described in Chapters 2 to 6.
7.1.1 Solution strategy choices
In line with previous research on division alone (Hickendorff et al., 2009), around
one third of students was found to predominantly answer both multiplication and
division problems without writing down any caculations (Chapter 2). Also simi-
larly, one fifth of students predominantly used the digit-based algorithm. However,
following the suggestion of Van den Heuvel-Panhuizen et al. (2009), the remain-
ing written strategies were not classified into a single ’realistic’ strategy category.
Instead, a distinction was made between the whole-number-based algorithm and
more informal non-algorithmic approaches. The results described in Chapter 2 and
3 indicate that this is an important distinction: different latent classes for whole-
number-based algorithm use and non-algorithmic written approaches were found,
and the digit-based and whole-number-based algorithms did not differ significantly
in accuracy, while the digit-based algorithm and non-algorithmic approaches for
multiplication did (and a similar, though non-significant difference was found for
division). These results suggest that it may be more relevant to distinguish be-
tween non-algorithmic and algorithmic approaches, than to distinguish between
’traditional’ and ’realistic’ approaches. This is in line with a review by the Royal
Netherlands Academy of Arts and Sciences (2009) that concluded that achievement
differences between traditional and realistic curricula are smaller than differences
between methods of the same type. Of course, the category of non-algorithmic
written approaches is still very heterogeneous, but further splitting it up results in
categories with very low numbers of observations in them (Fagginger Auer et al.,
2013).
In Chapters 2, 4, 5 and 6, factors affecting choices between the strategies were
investigated. With the multilevel latent class analysis in Chapter 2, it was found
that while students’ probability of using the different written strategies depended
strongly on the teacher, this was not the case for the strategies without any written
work. Teachers’ responses to the questionnaires on their strategy instruction and
attitudes in Chapters 4 and 5 were also not significantly related to students’ choices
between mental and written strategies. On the other hand, a relation was found
between students’ characteristics and the frequency of choices for mental strategies

7.1. SUBSTANTIVE CONCLUSIONS 119
in Chapters 2, 5 and 6 (but not 4): this frequency was higher for boys and for
students with a lower mathematical ability. For boys, this appears to be mainly at
the cost of algorithmic strategies, while for lower mathematical ability the picture
is less clear (Chapters 2 and 6). This tendency of boys to use less algorithmic
and more mental strategies than girls is also described in the literature (Carr &
Jessup, 1997; Davis & Carr, 2002; Fennema, Carpenter, Jacobs, Franke, & Levi,
1998). Lack of motivation (that does not appear to be more common in boys)
appears to be a reason for choosing mental strategies (Chapter 5). These results
suggest that the characteristics of students may be more relevant to mental strategy
choices than common variations in teacher behaviors. However, intervening in these
common teaching practices can be effective: Chapter 5 shows that an instructional
intervention can reduce mental strategy choices (both for boys and girls).
Findings on the adaptivity of strategy choices were also described. Adaptivity
was considered as the degree to which students adapt their choices between strate-
gies to the relative accuracy and speed with which they can execute those strategies
for the type of problem at hand (Siegler & Lemaire, 1997). In mathematics instruc-
tion that builds on the variety of students’ own strategic explorations rather than
focusing on a few specific algorithmic strategies (Treffers, 1987b), adaptivity is vital
to performance. However, Chapter 4 indicated that weaker students may not al-
ways be able to make adaptive choices between strategies, as was also found in some
previous research (e.g., Hickendorff et al., 2010; Torbeyns et al., 2006), but not all
(e.g., Siegler & Lemaire, 1997; Torbeyns et al., 2005). Accuracy and speed were
considered both separately and simultaneously (the adaptive strategy being the
one that leads to the correct solution the fastest; Kerkman & Siegler, 1997; Luwel,
Onghena, et al., 2009; Torbeyns, De Smedt, et al., 2009), and the relative rele-
vance of accuracy and speed in choices between mental and written strategies was
found to depend on students’ gender and mathematical ability: mental strategies
appeared to be especially inaccurate for lower ability students and offered a larger
speed advantage relative to written strategies for boys than for girls. These and
other potentially relevant factors to students’ speed-accuracy tradeoff (MacKay,
1982) could therefore be included in models for strategy choices such as the Adap-
tive Strategy Choice Model (ASCM; Siegler & Shipley, 1995). Verschaffel et al.
(2009) also stressed the importance of the sociocultural context for the adaptivity
of strategy choices, and in this dissertation, the part of the sociocultural context
formed by the teacher was considered. As described in the first part of this sec-
tion, many teacher behaviors and attitudes that were expected to be relevant were

120 CHAPTER 7. GENERAL DISCUSSION
not found to be related to students’ choices between mental and written strategies
(whereas Ellis, 1997, did describe sociocultural effects on such choices), but there
was a considerable teacher effect on choices between different written strategies.
7.1.2 Performance
The effects of instruction on performance were also investigated; both direct ef-
fects and effects occurring indirectly through strategy use. The indirect effects can
occur because of the large accuracy differences between strategies: as in previous
research (Hickendorff, 2013; Hickendorff et al., 2009, 2010; Van Putten, 2005), writ-
ten strategies were found to be much more accurate than mental strategies. This
was not only the case when potentially biasing strategy selection effects (Siegler &
Lemaire, 1997) of student and problem characteristics were statistically corrected
for (Chapters 3 and 5), but also when they were eliminated through experimen-
tal design (with the choice/no-choice design of Siegler & Lemaire, 1997; Chapter
4). Within written strategies, the digit-based and whole-number-based algorithms
were found to be comparable in accuracy, while non-algorithmic approaches ap-
peared less accurate than the algorithms (as discussed previously). This suggests
that while attention to informal strategies may be very fruitful in earlier stages of
the educational process (Treffers, 1987b), performance may benefit from a focus on
standardized procedures at the end of the instructional trajectory. This may be
especially relevant to students with a lower mathematical ability, who appear to
benefit less from more free forms of instruction with attention to multiple solution
strategies than from more direct forms of instruction (Royal Netherlands Academy
of Arts and Sciences, 2009).
Given the strategy accuracy differences, the associations between instruction
and strategy choices discussed in the previous section also indirectly affect per-
formance (though it should be noted that a thorough investigation of the chain
of effects would involve a mediation analysis). The effects of teachers’ instruc-
tion on students’ choices between relatively inaccurate mental and accurate written
strategies were limited, and thereby also the indirect effects of that on perfor-
mance. However, teachers’ strategy instruction was found to be related to choices
between written strategies. Choices for the somewhat less accurate non-algorithmic
strategies were associated with instruction in the whole-number-based algorithms
for multiplication and division, in line with the link between such algorithms and
informal approaches envisioned in the development of these algorithms (Treffers,
1987a). These results concern the effects of normal variations in instructional be-

7.2. METHODOLOGICAL CONCLUSIONS 121
haviors reported by teachers. In Chapters 4 and 5, interventions in this daily
teaching practice were described. In Chapter 4, it was shown that instructing stu-
dents with a below (but not above) average mathematical ability to write down
calculations results in an immediate improvement in their performance, whereas
Hickendorff et al. (2010) found such an improvement regardless of ability level. In
Chapter 5, it was shown that a training for lower ability students that increases
choices for written strategies also improves performance.
In Chapter 2, direct effects of instruction on performance were investigated.
Teaching practices turned out to be more relevant to multiplication and division
performance than the formal curriculum (as it is laid down in mathematics text-
books) and teacher characteristics, as had also been found for mathematics more
generally (Royal Netherlands Academy of Arts and Sciences, 2009; Slavin & Lake,
2008; Wenglinsky, 2002). Particularly, the amount of time that teachers spend on
instruction to the whole class was found to be positively related to students’ perfor-
mance, in line with the positive effect of time spent on active academic instruction
rather than other activities reported in the process-product literature (Hill et al.,
2005). This may be in conflict with the trend of decreasing whole class instruction
and increasing differentiation of instruction based on students’ mathematical ability
level (Scheltens et al., 2013).
7.2 Methodological conclusions
To obtain these substantive conclusions, several methods were used that are not
very commonly applied in educational research, but that have great potential for
other investigations of this type.
7.2.1 Latent variable models
Firstly, latent variable models were used. Advanced modeling techniques were nec-
essary because the data posed several statistical challenges (depending on the chap-
ter), many of which frequently play a role in educational investigations: the multi-
level structure of the data (item responses within students, who are within classes);
the nominal measurement level of the strategies; the measurement of change; the
large number of items in the teacher questionnaire in the large-scale assessment; and
the incomplete design of the large-scale assessment, in which students do not com-
plete all items but only systematically varying subsets of items. These challenges
were met with two statistical techniques that model item responses as dependent on

122 CHAPTER 7. GENERAL DISCUSSION
a latent variable: latent class analysis (LCA) and item response theory (IRT). The
latent variable reflects individual differences between students, and these differences
can be more quantitative or more qualitative (De Boeck, Wilson, & Acton, 2005).
In IRT, the latent variable is dimensional and students are modeled as differing
from each other only in degree, whereas in LCA, the latent variable is categorical
and students in different latent classes are modeled as qualitatively different from
one another.
In this dissertation, LCA was used to discern qualitatively different strategy
choice profiles (latent classes) based on students’ strategy choices on items. Chap-
ters 2 and 6 show that this is a very insightful way to deal with nominal strategy
data that is richer than just a dichotomization (e.g., mental versus written strate-
gies), and its merit has also been demonstrated in previous educational research
(e.g., Geiser et al., 2010; Hickendorff et al., 2009, 2010; Lee Webb et al., 2008;
Yang et al., 2005). However, what previous studies usually lacked, is the mod-
eling of teacher effects that was implemented in this dissertation through use of
multilevel LCA (MLCA; Vermunt, 2003). Given the central role of teachers in the
educational process, such multilevel effects are theoretically of high importance in
educational research, and Chapter 2 also shows that the effects are so large that
not modeling them results in a serious misspecification of the latent class model. In
addition, it was shown that modeling the multilevel effect as nonparametric (cre-
ating latent classes of teachers as well as of students; Vermunt, 2003) allows for
interesting substantive interpretations of teacher effects. Finally, Chapters 2 and 6
illustrated the versatility of MLCA: it can be used to deal with the challenges of
large-scale assessment data, but can also easily be applied to data from a cognitive
experiment.
IRT models were employed in Chapters 3, 4, 5, and 6; not as measurement
models that only describe individual differences in performance, but as explana-
tory models that include factors that explain performance (De Boeck & Wilson,
2004). Different approaches were taken that illustrate the flexibility of the explana-
tory IRT framework: person covariates (e.g., gender and ability level) as well as
person-by-item covariates (strategy use) were used as explanatory factors, item dif-
ficulties were modeled as fixed and as random effects (De Boeck, 2008), different
response variables (accuracy and mental versus written strategy choices) were mod-
eled, and teacher effects were included. IRT was used to evaluate condition effects
in experiments, both in designs where children were only tested once (Chapters 4
and 6) and in a pretest-posttest design (Chapter 5). IRT offers special benefits in
7.3. FUTURE DIRECTIONS 123
the latter case, as it addresses problems inherent to measuring learning and change
(Stevenson et al., 2013). Finally, a new application of explanatory IRT was intro-
duced (Chapter 3): a combination with LASSO penalization (Tibshirani, 1996),
that enables the simultaneous consideration of high numbers of potentially relevant
covariates while optimally modeling achievement differences (making it especially
suitable for large-scale assessments).
7.2.2 Strategy coding
A second methodological approach in this dissertation that could benefit other
educational investigations is not statistical, but concerns the way in which the so-
lution strategies that students use are determined. In all chapters, strategy use was
inferred from the calculations that students wrote down while solving problems.
As discussed by Fagginger Auer et al. (2015), a more common approach is to use
students’ verbal reports, but this approach has important disadvantages: verbal re-
ports can be inaccurate and the reporting can influence students’ strategy choices
and performance (Crutcher, 1994; Ericsson & Simon, 1993; Kirk & Ashcraft, 2001).
This plays a lesser role when written work is used, as students write down calcu-
lations as a natural part of the problem solving process. In addition, much larger
sample sizes can be achieved with written strategy identification, as verbal reports
can only be obtained in an individual setting with a trained interviewer, whereas
written work can be collected using group administration and can be efficiently
coded for strategy use afterwards. An important disadvantage of written identifi-
cation is that parts of the problem solving process that have not been written down
cannot be recovered, and that no written work could reflect anything from guess-
ing to mental execution of an algorithm. However, with supplementary interviews
it has been found that in cases of no written work students most frequently use
non-algorithmic approaches (such as clever shortcut strategies like compensation),
while guessing and estimation are very infrequent (Fagginger Auer & Scheltens,
2012; Hickendorff et al., 2010).
7.3 Future directions
The findings in this dissertation on factors affecting strategy choices and perfor-
mance and on methods that can be used to study this, provide several directions
for future research in this area and educational research more generally. For the
domain under study, results indicate that what teachers are currently doing has a

124 CHAPTER 7. GENERAL DISCUSSION
relatively limited effect on the strategy choices that matter most to performance
(mental versus written strategies). These results are based purely on self-reports
of the teachers, so it would be valuable to include actual observations of teach-
ing practices in future investigations. However, results may be quite similar in
both cases according to Desimone (2009), who has argued that early studies that
suggested low correlations between classroom observations and teacher self-reports
were flawed, and that more methodologically rigorous studies (with self-reports on
concrete teaching behaviors, as was the case for many of the teacher reports in this
dissertation) have demonstrated moderate to high correlations.
Aside from apparently limited teacher effects, the findings in this dissertation
indicate that instructional interventions targeted at the desired strategy use can
be effective. The most fruitful direction for future research therefore appears to
be to develop interventions targeting students’ strategy use, with careful attention
for exactly which investigation elements are effective (e.g., direct accuracy feed-
back; Ellis et al., 1993), and possibly with training in making strategy choices that
are adaptive at the student-level rather than promoting use of one generally well-
performing strategy (for example, Chapter 4 indicated that written strategies are
not necessarily more accurate than mental strategies for stronger students). When
further research on the effects of the sociocultural context on strategy use is con-
ducted (as recommended by Verschaffel et al., 2009), the present results indicate
that this context should be considered more broadly than just in terms of the cur-
rent teacher: parents and peers could be considered (Carr & Jessup, 1997), and
teachers from earlier grades in which strategies were first encountered.
Larger than the effects of teachers on strategy choices, were the effects of student
characteristics. Gender differences were found multiple times, with girls being more
likely to use algorithmic, written strategies, and boys more likely to use mental
strategies. Such gender differences have been found already at younger ages (Carr
& Jessup, 1997; Davis & Carr, 2002; Fennema et al., 1998) and an interesting
direction for future research would be to investigate how they may be explained by
other traits in which boys and girls differ. For example, girls’ lower self-confidence
in math (J. A. Hyde, Fennema, Ryan, Frost, & Hopp, 1990; Mullis, Martin, & Foy,
2008) and their higher potential for academic delay of gratification (Bembenutty,
2009) may cause them to choose the less risky written strategies, at the cost of
speed. Students’ motivation also appears to be related to their strategy choices, so
it may be fruitful to investigate the effects of a motivation intervention (e.g., Siegle
& McCoach, 2007) on strategy use.

7.3. FUTURE DIRECTIONS 125
Students’ working memory also seems a highly relevant factor for choices for
mental strategies: for students with a lower working memory capacity, the working
memory resources freed up by writing down calculations should be especially im-
portant (in line with cognitive load theory; Paas et al., 2003). No effects of working
memory were found in this dissertation, but this factor was only investigated once,
with a new computerized version of existing instruments of which the reliability and
validity has not been established yet (Stevenson et al., in preparation), and only for
lower ability students. Since mathematical ability and working memory are related
(Friso-van den Bos et al., 2013), it may be that a restriction of range of working
memory prevented the finding of effects. So, working memory seems to be a very
important factor for mental strategy use to investigate, but a proper investigation
should be done with an appropriate measurement instrument and enough variance
in memory capacities.
In addition to providing specific substantive suggestions for research on strate-
gies, this dissertation illustrates an approach more generally applicable in educa-
tional research. The starting point of this dissertation was a large-scale assessment
finding, and the dissertation itself consists of secondary analyses of assessment data
and follow-up experiments. This approach combines the best of two worlds: it uses
the wealth of data obtained from a large, representative sample for a large-scale
assessment to scout for factors correlated with outcomes, which then enables tar-
geted follow-up experiments in which the causality of the found correlations can
be established, potentially resulting in interventions beneficial to educational prac-
tice. There is a very large amount of assessment data (e.g., TIMSS, PIRLS, PISA;
Mullis, Martin, Foy, & Akora, 2012; Mullis, Martin, Foy, & Drucker, 2012; OECD,
2013), and secondary analyses help to make full use of this data. The discussed
multilevel LCA and variations of explanatory IRT can be used to analyze the com-
plex assessment data, as well as the data from follow-up experiments. And finally,
to conclude with the central theme of this dissertation, solution strategies can be
coded from readily available written work and are very important to performance,
so including these in educational investigations is both easy and vital to obtaining
a complete picture of students’ learning.

126

References
Arendasy, M., Sommer, M., Hergovich, A., & Feldhammer, M. (2011). Evaluating
the impact of depth cue salience in working three-dimensional mental rota-
tion tasks by means of psychometric experiments. Learning and Individual
Differences, 21 , 403-408.
Asparouhov, T., & Muthen, B. (2014). Auxiliary variables in mixture modeling:
3-step approaches using Mplus. Mplus web notes, 15 , 1-24.
Bakk, Z., Tekle, F. B., & Vermunt, J. K. (2013). Estimating the association between
latent class membership and external variables using bias-adjusted three-step
approaches. Social Methodology , 43 , 272-311.
Barrouillet, P., & Lepine, R. (2005). Working memory and children’s use of retrieval
to solve addition problems. Journal of Experimental Child Psychology , 91 ,
183-204.
Barrouillet, P., Mignon, M., & Thevenot, C. (2008). Strategies in subtraction
problem solving in children. Journal of Experimental Child Psychology , 99 ,
233-251.
Bates, D., & Maechler, M. (2010). lme4: Linear mixed modeling us-
ing S4 classes. (Computer program and manual). Available from
http://cran.r-project.org/web/packages/lme4/index.html.
Bates, D., Maechler, M., Bolker, B., & Walker, S. (2014). lme4: Linear mixed-
effects models using Eigen and S4 [Computer software manual]. Retrieved
from http://cran.r-project.org/package=lme4 (R package version 1.1-
7)
Beishuizen, M. (1993). Mental strategies and materials or models for addition
and subtraction up to 100 in Dutch second grades. Journal for Research in
Mathematics Education, 24 , 294-323.
Bembenutty, H. (2009). Academic delay of gratification, self-regulation of learning,
127

gender differences, and expectancy-value. Personality and Individual Differ-
ences, 46 , 347-352.
Bjorklund, D. F., Hubertz, M. J., & Reubens, A. C. (2004). Young children’s
arithmetic strategies in social context: How parents contribute to children’s
strategy development while playing games. International Journal of Behav-
ioral Development , 28 , 347-357.
Blote, A. W., Klein, A. S., & Beishuizen, M. (2000). Mental computation and
conceptual understanding. Learning and Instruction, 10 , 221-247.
Blote, A. W., Van der Burg, E., & Klein, A. S. (2001). Students’ flexibility in solving
two-digit addition and subtraction problems: Instruction effects. Journal of
Educational Psychology , 93 , 627-638.
Blote, A. W., Van Otterloo, S. G., Stevenson, C. E., & Veenman, M. V. J. (2004).
Discovery and maintenance of the many-to-one counting strategy in 4-year-
olds: A microgenetic study. British Journal of Developmental Psychology ,
22 , 83-102.
Bokhove, J., Van der Schoot, F., & Eggen, T. (1996). Balans van het rekenonder-
wijs aan het einde van de basisschool 2 [Second assessment of mathematics
education at the end of primary school]. Arnhem, The Netherlands: Cito.
Bolck, A., Croon, M., & Hagenaars, J. (2004). Estimating latent structure models
with categorical variables: One-step versus three-step estimators. Political
Analysis, 12 , 3-27.
Buijs, C. (2008). Leren vermenigvuldigen met meercijferige getallen [Learning
to multiply with multidigit numbers]. Unpublished doctoral dissertation,
Utrecht University.
Burnham, K. P., & Anderson, D. R. (2004). Multimodel inference: Understanding
AIC and BIC in model selection. Sociological Methods & Research, 33 , 261-
304.
Campbell, J. I. D., & Fugelsang, J. (2001). Strategy choice for arithmetic verifica-
tion: effects of numerical surface form. Cognition, 80 , 21-30.
Campbell, J. I. D., & Xue, Q. (2001). Cognitve arithmetic acorss cultures. Journal
of Experimental Psychology: General , 130 , 299-315.
Carr, M., & Davis, H. (2001). Gender differences in arithmetic strategy use: A
function of skill and preference. Contemporary Educational Psychology , 26 ,
330-347.
Carr, M., & Jessup, D. L. (1997). Gender differences in first-grade mathematics
strategy use: Social and metacognitive influences. Journal of Educational
128
Psychology , 89 , 318-328.
Carroll, J. B. (1963). A model of school learning. Teachers College Record , 64 ,
723-733.
Cohen, & Hill, H. C. (2000). Instructional policy and classroom performance: The
mathematics reform in California. Teachers College Record , 102 , 292-343.
Cohen, J. (1960). A coefficient of agreement for nominal scales. Educational and
Psychological Measurement , 20 , 37-46.
Cohen, J. (1988). Statistical power analysis for the behavioral sciences (2nd ed.).
Hillsdale, NJ: Lawrence Erlbaum Associates.
Colby, E., & Bair, E. (2013). Cross-validation for nonlinear mixed effect models.
Journal of Pharmacokinetics and Pharmacodynamics, 40 , 243-252.
Corsi, P. (1972). Human memory and the medial temporal region of the brain.
Dissertation Abstracts International , 34 .
Crutcher, R. J. (1994). Telling what we know: the use of verbal report methodolo-
gies in psychological research. Psychological Science, 5 , 241-244.
Davis, H., & Carr, M. (2002). Gender differences in mathematics strategy use; the
influence of temperament. Learning and Individual Differences, 13 , 83-95.
De Boeck, P. (2008). Random item models. Psychometrika, 73 , 533-559.
De Boeck, P., Bakker, M., Zwitser, R., Nivard, M., Hofman, A., Tuerlinckx, F., &
Partchev, I. (2011). The estimation of item response models with the lmer
function from the lme4 package in R. Journal of Statistical Software, 39 ,
1-28.
De Boeck, P., & Wilson, M. (Eds.). (2004). Explanatory item response models: A
generalized linear and nonlinear approach. New York, NY: Springer.
De Boeck, P., Wilson, M., & Acton, G. S. (2005). A conceptual and psychome-
tric framework for distinguishing categories and dimensions. Psychological
Review , 112 , 129-158.
Derks, E. M., Boks, M. P. M., & Vermunt, J. K. (2012). The identification of
family subtype based on the assessment of subclinical levels of psychosis in
relatives. BMC Psychiatry , 12 .
Desimone, L. M. (2009). Improving impact studies of teachers’ professional de-
velopment: Toward better conceptualizations and measures. Educational Re-
searcher , 38 , 181-199.
Dias, J. G., & Vermunt, J. K. (2006). Bootstrap methods for measuring classifica-
tion uncertainty in latent class analysis. COMPSTAT 2006 - Proceedings in
Computational Statistics, part I , 31-41.
129

Doran, H., Bates, D., Bliese, P., & Dowling, M. (2007). Estimating the multilevel
Rasch model: With the lme4 package. Journal of Statistical Software, 20 .
Ellis, S. (1997). Strategy choice in sociocultural context. Developmental Review ,
17 , 490-524.
Ellis, S., Klahr, D., & Siegler, R. (1993). Effects of feedback and collaboration on
changes in children’s use of mathematical rules. Paper presented at the bien-
nial meeting of the Society for Research in Child Development, New Orleans.
Embretson, S. E., & Reise, S. P. (2000). Item response theory for psychologists.
Mahwah, NJ: Lawrence Erlbaum Associates.
Ericsson, K. A., & Simon, H. A. (1993). Protocol analysis: Verbal reports as data
(rev. ed.). Cambridge, MA: MIT Press.
Fagginger Auer, M. F., Hickendorff, M., & Van Putten, C. M. (2013). Strategiege-
bruik bij het oplossen van vermenigvuldig- en deelopgaven [Strategy use in
solving multiplication and division problems]. In F. Scheltens, B. Hemker, &
J. Vermeulen (Eds.), Balans van het reken-wiskundeonderwijs aan het einde
van de basisschool 5 (p. 158-167). Arnhem: Cito.
Fagginger Auer, M. F., Hickendorff, M., & Van Putten, C. M. (2015). Strategiege-
bruik bij rekenen afleiden uit het schriftelijk werk van basisschoolleerlingen
[Inferring mathematical strategy use from primary school students’ written
work]. Pedagogische Studien, 92 , 9-23.
Fagginger Auer, M. F., Hickendorff, M., & Van Putten, C. M. (2016). Solution
strategies and adaptivity in multidigit division in a choice/no-choice experi-
ment: Student and instructional factors. Learning and Instruction, 41 , 52-59.
Fagginger Auer, M. F., Hickendorff, M., Van Putten, C. M., Beguin, A. A., & Heiser,
W. J. (in press). Multilevel latent class analysis for large-scale educational
assessment data: exploring the relation between the curriculum and students’
mathematical strategies. Applied Measurement in Education.
Fagginger Auer, M. F., & Scheltens, F. (2012). Oplossingsstrategieen voor deel- en
vermenigvuldigopgaven in groep 8 [Solution strategies voor division and multi-
plication problems in sixth grade]. In M. Van Zanten (Ed.), Opbrengstgericht
onderwijs - rekenen!-wiskunde? (p. 137-150). Utrecht: FIsme, Universiteit
Utrecht.
Fennema, E., Carpenter, T. P., Jacobs, V. R., Franke, M. L., & Levi, L. W. (1998).
A longitudinal study of gender differences in young children’s mathematical
thinking. Eductional Researcher , 27 , 6-11.
Fischer, G. H. (1973). Linear logistic test model as an instrument in educational
130
research. Acta Psychologica, 37 , 359-374.
Fischer, U., Moeller, K., Cress, U., & Nuerk, H. (2013). Interventions supporting
children’s mathematics school success: A meta-analytic review. European
Psychologist , 18 , 89-113.
Foxman, D., & Beishuizen, M. (2003). Mental calculation methods used by 11-
year-olds in different attainment bands: A reanalysis of data from the 1987
APU survey in the UK. Educational Studies in Mathematics, 51 , 41-69.
Freudenthal, H. (1973). Mathematics as an educational task. Dordrecht, The
Netherlands: Reidel.
Friso-van den Bos, I., Van der Ven, S. H. G., Kroesbergen, E. H., & Van Luit,
J. E. H. (2013). Working memory and mathematics in primary school children:
A meta-analysis. Educational Research Review , 10 , 29-44.
Geary, D. C., Hoard, M. K., Byrd-Craven, J., & DeSoto, M. C. (2004). Strategy
choices in simple and complex addition: Contributions of working memory
and counting knowledge for children with mathematical disability. Journal of
Experimental Child Psychology , 88 , 121-151.
Geiser, C., Lehman, W., & Eid, M. (2010). Separating ”rotators” from ”non-
rotators” in the mental rotations test: A multigroup latent class analysis.
Multivariate Behavioral Research, 41 , 261-293.
Gersten, R., Chard, D. J., Jayanthi, M., Baker, S. K., Morphy, P., & Flojo, J.
(2009). Mathematics instruction for students with learning disabilities: A
meta-analysis of instructional components. Review of Educational Research,
79 , 1202-1242.
Goeman, J. J. (2010). L-1 penalized estimation in the Cox proportional hazards
model. Biometrical Journal , 52 , 70-84.
Goodman, L. A. (1974). Exploratory latent structure analysis using both identifi-
able and unidentifiable models. Biometrika, 61 , 215-231.
Goodnow, J. J. (1976). The nature of intelligent behavior: Questions raised by
cross-cultural studies. In L. B. Resnick (Ed.), The nature of intelligence
(p. 83-102). Hillsdale, NJ: Erlbaum.
Gravemeijer, K. P. E. (1997). Instructional design for reform in mathematics edu-
cation. In M. Beishuizen, K. P. E. Gravemeijer, & E. C. D. M. Van Lieshout
(Eds.), The role of contexts and models in the development of mathematical
strategies and procedures (p. 13-34). Utrecht, The Netherlands: Freudenthal
Institute.
Groll, A., & Tutz, G. (2014). Variable selection for generalized linear mixed models
131

by L1-penalized estimation. Statistics and Computing , 24 , 137-154.
Hagenaars, J. A., & McCutcheon, A. L. (Eds.). (2002). Applied latent class analysis.
Cambridge, England: Cambridge University Press.
Hahn, J., Todd, P., & Van der Klaauw, W. (2001). Identification and estimation of
treatment effects with a regression-discontinuity design. Econometrica, 69 ,
201-209.
Hattie, J. (2003). Teachers make a difference: What is the research evidence?
Paper presented at the Australian Council for Educational Research Annual
Conference on Building Teacher Quality, Melbourne.
Henry, K. L., & Muthen, B. (2010). Multilevel latent class analysis: An application
of adolescent smoking typologies with individual and contextual predictors.
Structural Equation Modeling , 17 , 193-215.
Hickendorff, M. (2011). Explanatory latent variable modeling of mathematical ability
in primary school: Crossing the border between psychometrics and psychology.
Unpublished doctoral dissertation, Leiden University.
Hickendorff, M. (2013). The effects of presenting multidigit mathematics prob-
lems in a realistic context on sixth graders’ problem solving. Cognition and
Instruction, 31 , 314-344.
Hickendorff, M., Heiser, W. J., Van Putten, C. M., & Verhelst, N. D. (2009).
Solution strategies and achievement in Dutch complex arithmetic: Latent
variable modeling of change. Psychometrika, 74 , 331-350.
Hickendorff, M., Van Putten, C. M., Verhelst, N. D., & Heiser, W. J. (2010).
Individual differences in strategy use on division problems: Mental versus
written computation. Journal of Educational Psychology , 102 , 439-452.
Hill, H. C., Rowan, B., & Ball, D. L. (2005). Effects of teachers’ mathemati-
cal knowledge for teaching on student achievement. American Educational
Research Journal , 42 , 371-406.
Hsieh, T.-C., & Yang, C. (2012). Do online learning patterns exhibit regional
and demographic differences? The Turkish Online Journal of Educational
Technology , 11 , 60-70.
Hyde, J. A., Fennema, E., Ryan, M., Frost, L. A., & Hopp, C. (1990). Gen-
der comparisons of mathematics attitudes and affect. Psychology of Women
Quarterly , 14 , 299-324.
Hyde, J. S., Lindberg, S. M., Linn, M. C., Ellis, A. B., & Williams, C. C. (2008).
Gender similarities characterize math performance. Science, 321 , 494-495.
Imbo, I., & Vandierendonck, A. (2007). The development of strategy use in elemen-
132
tary school children: Working memory and individual differences. Journal of
Experimental Child Psychology , 96 , 284-309.
Imbo, I., & Vandierendonck, A. (2008). Effects of problem size, operation, and
working-memory span on simple-arithmetic strategies: differences between
children and adults? Psychological Research, 72 , 331-346.
Janssen, A. B., & Geiser, C. (2010). On the relationship between solution strategies
in two mental rotation tasks. Learning and Individual Differences, 20 , 473-
478.
Janssen, J., Van der Schoot, F., & Hemker, B. (2005). Balans van het reken-
wiskundeonderwijs aan het einde van de basisschool 4 [Fourth assessment of
mathematics education at the end of primary school]. Arnhem, The Nether-
lands: Cito.
Janssen, J., Van der Schoot, F., Hemker, B., & Verhelst, N. D. (1999). Balans
van het reken-wiskundeonderwijs aan het einde van de basisschool 3 [Third
assessment of mathematics education at the end of primary school]. Arnhem,
The Netherlands: Cito.
Janssen, J., Verhelst, N., Engelen, R., & Scheltens, F. (2010). Wetenschappelijke
verantwoording van de toetsen LOVS rekenen-wiskunde voor groep 3 tot en
met groep 8 [Technical report for the student monitoring system mathematics
tests for grade 1 to 6]. Arnhem, The Netherlands: Cito.
Jepsen, C. (2005). Teacher characteristics and student achievement: evidence from
teacher surveys. Journal of Urban Economics, 57 , 302-319.
Jones, R. H. (2011). Bayesian information criterion for longitudinal and clustered
data. Statistics in Medicine, 30 , 3050-3056.
Kalyuga, S., Ayres, P., Chandler, P., & Sweller, J. (2003). The expertise reversal
effect. Educational Psychologist , 38 , 23-31.
Kerkman, D. D., & Siegler, R. S. (1997). Measuring individual differences in
children’s addition strategy choices. Learning and Individual Differences, 9 ,
1-18.
Kiesel, A., Steinhauser, M., Wendt, M., Falkenstein, M., Jost, K., Philipp, A. M.,
& Koch, I. (2010). Control and interference in task switching - a review.
Psychological Bulletin, 136 , 849-874.
Kilpatrick, J., Swafford, J., & Findell, B. (2001). Adding it up. Helping children
learn mathematics. Washington, D.C.: National Academy Press.
Kirk, E. P., & Ashcraft, M. H. (2001). Telling stories: The perils and promise
of using verbal reports to study math strategies. Journal of Experimental
133

Psychology: Learning, Memory and Cognition, 27 , 157-175.
Klein, D. (2003). A brief history of K-12 mathematics education in the 20th century.
In J. M. Royer (Ed.), Mathematical cognition (p. 175-225). Greenwich, CT:
Information Age Publishing.
Klein Entink, R. H., Fox, J.-P., & Van der Linden, W. J. (2009). A multivariate
multilevel approach to the modeling of accuracy and speed of test takers.
Psychometrika, 74 , 21-48.
Kroesbergen, E. H., & Van Luit, J. E. H. (2003). Mathematics interventions
for children with special educational needs: A meta-analysis. Remedial and
Special Education, 24 , 97-114.
Laski, E. V., Casey, B. M., Yu, Q., Dulaney, A., Heyman, M., & Dearing, E. (2013).
Spatial skills as a predictor of first grade girls’ use of higher level arithmetic
strategies. Learning and Individual Differences, 23 , 123-130.
Lee Webb, M.-Y., Cohen, A. S., & Schwanenflugel, P. J. (2008). Latent class
analysis of differential item functioning on the Peabody Picture Vocabulary
Test III. Educational and Psychological Measuremen, 68 , 335-351.
Lemaire, P., & Lecacheur, M. (2002). Applying the choice/no-choice methodology:
the case of children’s strategy use in spelling. Developmental Science, 5 ,
42-47.
Lemaire, P., & Lecacheur, M. (2010). Strategy switch costs in arithemetic problem
solving. Memory & Cognition, 38 , 322-332.
Lemaire, P., & Lecacheur, M. (2011). Age-related changes in children’s execu-
tive functions and strategy selection: A study in computational estimation.
Cognitive Development , 26 , 282-294.
Lemaire, P., & Siegler, R. S. (1995). Four aspects of strategic change: Contributions
to children’s learning of multiplication. Journal of Experimental Psychology:
General , 124 , 83-97.
Lukociene, O., & Vermunt, J. K. (2010). Determining the number of components
in mixture models for hierarchical data. In A. Fink, L. Berthold, W. Seidel,
& A. Ultsch (Eds.), Advances in data analysis, data handling and business
intelligence (p. 241-249). Berlin-Heidelberg: Springer.
Luwel, K., Onghena, P., Torbeyns, J., Schillemans, V., & Verschaffel, L. (2009).
Strengths and weaknesses of the choice/no-choice method in research on strat-
egy choice and strategy change. European Psychologist , 14 , 351-362.
Luwel, K., Schillemans, V., Onghena, P., & Verschaffel, L. (2009). Does switching
between strategies within the same task involve a cost? The British Journal
134

of Psychology , 100 , 753-771.
Luwel, K., Torbeyns, J., Schillemans, V., & Verschaffel, L. (2009). Primingseffecten
in het strategiekeuzeproces bij wiskundetaken onderzocht en bekeken vanuit
het perspectief van Sieglers theorie van ’strategic change’ [Priming effects
on the process of strategy selection in mathematics tasks: An investigation
and interpretation from Siegler’s theory of strategic change]. Pedagogische
Studien, 86 , 369-384.
MacKay, D. G. (1982). The problems of flexibility, fluency, and speed-accuracy
trade-off in skilled behavior. Psychological Review , 89 , 483-506.
Martinez, J. F., Borko, H., & Stecher, B. M. (2012). Measuring instructional prac-
tice in science using classroom artifacts: Lessons learned from two validation
studies. Journal of Research in Science Teaching , 49 , 38-67.
Mayer, D. P. (1999). Measuring instructional practice: Can policymakers trust
survey data? Educational Evaluation and Policy Analysis, 21 , 29-45.
McCutcheon, A. L. (1987). Latent class analysis. Beverly Hills, CA: Sage Publica-
tions.
Middleton, J. A., & Spanias, P. A. (1999). Motivation for achievement in mathe-
matics: Findings, generalizations, and criticisms of the research. Journal for
Research in Mathematics Education, 30 , 65-88.
Molenberghs, G., & Verbeke, G. (2006). Models for discrete longitudinal data. New
York, NY: Springer.
Morselli, D., & Passini, S. (2012). Disobedience and support for democracy: Evi-
dences from the world values survey. The Social Science Journal , 49 , 284-294.
Mulligan, J. T., & Mitchelmore, M. C. (1997). Young children’s intuitive models of
multiplication and division. Journal for Research in Mathematics Education,
28 , 309-330.
Mullis, I. V. S., & Martin, M. O. (2014). TIMSS advanced 2015 assessment frame-
works. Boston: Boston College, TIMSS & PIRLS International Study Center.
Mullis, I. V. S., Martin, M. O., & Foy, P. (2008). TIMSS 2007 international math-
ematics report. Findings from IEA’s Trends in International Mathematics
and Science Study at the fourth and eighth grades. Boston: Boston College,
TIMSS & PIRLS International Study Center.
Mullis, I. V. S., Martin, M. O., Foy, P., & Akora, A. (2012). TIMSS 2011 interna-
tional results in mathematics. Chestnuthill, MA: TIMSS & PIRLS Interna-
tional Study Center, Boston College.
Mullis, I. V. S., Martin, M. O., Foy, P., & Drucker, K. T. (2012). PIRLS 2011 inter-
135

national results in reading. Chestnuthill, MA: TIMSS & PIRLS International
Study Center, Boston College.
Muthen, L. K., & Muthen, B. O. (2002). How to use a Monte Carlo study to
decide on sample size and determine power. Structural Equation Modeling: A
Multidisciplinary Journal , 9 , 599-620.
Mutz, R., & Daniel, H.-D. (2011). University and student segmentation: Multi-
level latent-class analysis of students’ attitudes towards research methods and
statistics. The British Psychological Society .
National Council of Teachers of Mathematics. (1989). Curriculum and evaluation
standards for school mathematics. Reston, VA: NCTM.
Nunes, T., Schliemann, A., & Carraher, D. (1993). Street mathematics and school
mathematics. Cambridge, UK: Cambrige University Press.
Nye, B., Konstantopoulos, S., & Hedges, L. V. (2004). How large are teacher
effects? Educational Evaluation and Policy Analysis, 26 , 237-257.
Nylund, K. L., Asparouhov, T., & Muthen, B. O. (2007). Deciding on the number
of classes in latent class analysis and growth mixture modeling: A Monte
Carlo simulation study. Structural Equation Modeling: A Multidisciplinary
Journal , 14 , 535-569.
OECD. (2013). PISA 2012 technical report. Paris: Author.
Orne, M. T. (1962). On the social psychology of the psychological experiment:
With particular reference to demand characteristics and their implications.
American Psychologist , 17 , 776-783.
Ott, M., & Pozzi, F. (2012). Digital games as creativity enablers for children.
Behaviour & Information Technology , 31 , 1011-1019.
Paas, F., Renkl, A., & Sweller, J. (2003). Cognitive load theory and instructional
design: Recent developments. Educational Psychologist , 38 , 1-4.
Primi, R., Eugenia Ferrao, M., & Almeida, L. S. (2010). Fluid intelligence as a
predictor of learning: A longitudinal multilevel approach applied to math.
Learning and Individual Differences, 20 , 446-451.
Rasch, G. (1960). Probabilistic models for some intelligence and attainment tests.
Chicago: University of Chicago Press.
Remillard, J. T. (2005). Examining key concepts in research on teachers’ use of
mathematics curricula. Review of Educational Research, 75 , 211-246.
Rittle-Johnson, B., & Siegler, R. S. (1999). Learning to spell: Variability, choice,
and change in children’s strategy use. Child Development , 70 , 332-348.
Rowan, B., Correnti, R., & Miller, R. (2002). What large-scale, survey research tells
136

us about teacher effects on student achievement: Insights from the Prospects
study of elementary schools. Teachers College Record , 104 , 1525-1567.
Royal Netherlands Academy of Arts and Sciences. (2009). Rekenonderwijs op de
basisschool. Analyse en sleutels tot verbetering [Mathematics education in pri-
mary school. Analysis and recommendations for improvement]. Amsterdam,
The Netherlands: KNAW.
Schabenberger, O. (2005). Introducing the GLIMMIX procedure for generalized
linear mixed models. Cary, NC: SAS Institute.
Schelldorfer, J., Meier, L., & Buhlmann, P. (2014). GLMMLasso: an algorithm for
high-dimensional generalized linear models using L1-penalization. Journal of
Computational and Graphical Statistics, 23 , 460-477.
Scheltens, F., Hemker, B., & Vermeulen, J. (2013). Balans van het reken-
wiskundeonderwijs aan het einde van de basisschool 5 [Fifth assessment of
mathematics education at the end of primary school]. Arnhem, The Nether-
lands: Cito.
Schillemans, V. (2011). The perseveration effect in individuals’ strategy choices.
Unpublished doctoral dissertation, University of Leuven.
Schillemans, V., Luwel, K., Bulte, I., Onghena, P., & Verschaffel, L. (2009). The
influence of previous strategy use on individuals’ strategy choice: Findings
from a numerosity judgement task. Psychologica Belgica, 49 , 191-205.
Schillemans, V., Luwel, K., Onghena, P., & Verschaffel, L. (2011a). The influence
of the previous strategy on individuals’ strategy choices. Studia Psychologica,
53 , 339-350.
Schillemans, V., Luwel, K., Onghena, P., & Verschaffel, L. (2011b). Strategy
switch cost in mathematical thinking: Empirical evidence for its existence and
importance. Mediterranean Journal for Research in Mathematics Education,
10 , 1-22.
Schwarz, G. (1978). Estimating the dimension of a model. Annals of Statistics, 6 ,
461-464.
Selter, C. (2001). Addition and subtraction of three-digit numbers: German ele-
mentary children’s success, methods and strategies. Educational Studies in
Mathematics, 47 , 145-173.
Shao, J. (1997). An asymptotic theory for linear model selection. Statistica Sinica,
7 , 221-264.
Siegle, D., & McCoach, D. B. (2007). Increasing student mathematics self-efficacy
through teacher training. Journal of Advanced Academics, 18 , 278-312.
137

Siegler, R. S. (2007). Cognitive variability. Developmental Science, 10 , 104-109.
Siegler, R. S., & Lemaire, P. (1997). Older and younger adults’ strategy choices
in multiplication: Testing predictions of ASCM using the choice/no-choice
method. Journal of Experimental Psychology: General , 126 , 71-92.
Siegler, R. S., & Shipley, C. (1995). Variation, selection, and cognitive change.
In G. Halford & T. Simon (Eds.), Developing cognitive competence: New
approaches to process modeling (p. 31-76). Hillsdale, NJ: Erlbaum.
Siegler, R. S., & Svetina, M. (2006). What leads children to adopt new strategies?
A microgenetic/cross-sectional study of class inclusion. Child Development ,
77 , 997-1015.
Sijtsma, K., & Verweij, A. C. (1999). Knowledge of solution strategies and IRT
modeling of items for transitive reasoning. Applied Psychological Measure-
ment , 23 , 55-68.
Sirin, S. R. (2005). Socioeconomic status and academic achievement: A meta-
analytic review of research. Review of Educational Research, 75 , 417-453.
Slavin, R. (2008). Perspectives on evidence-based research in education - what
works? Issues in synthesizing educational program evaluations. Educational
Researcher , 37 , 5-14.
Slavin, R., & Lake, C. (2008). Effective programs in elementary mathematics: A
best-evidence synthesis. Review of Educational Research, 78 , 427-515.
Snapp-Childs, W., & Corbetta, D. (2009). Evidence of early strategies in learning
to walk. Infancy , 14 , 101-116.
Stevenson, C. E., Hickendorff, M., Resing, W. C. M., Heiser, W. J., & de Boeck,
P. A. L. (2013). Explanatory item response modeling of children’s change on
a dynamic test of analogical reasoning. Intelligence, 41 , 157-168.
Stevenson, C. E., Saarloos, A., Wijers, J.-W., & De Bot, K. (in preparation). A
bilingual advantage for young beginning EFL learners?
Stevenson, C. E., Touw, K. W. J., & Resing, W. C. M. (2011). Computer or paper
analogy puzzles: Does assessment mode influence young children’s strategy
progression? Educational & Child Psychology , 28 , 67-84.
Tibshirani, R. (1996). Regression shrinkage and selection via the lasso. Journal of
the Royal Statistical Society , 58 , 267-288.
Torbeyns, J., De Smedt, B., Ghesquiere, P., & Verschaffel, L. (2009). Jump or
compensate? Strategy flexibility in the number domain up to 100. ZDM
Mathematics Education, 41 , 581-590.
Torbeyns, J., Ghesquiere, P., & Verschaffel, L. (2009). Efficiency and flexibility
138

of indirect addition in the domain of multi-digit subtraction. Learning and
Instruction, 19 , 1-12.
Torbeyns, J., Verschaffel, L., & Ghesquiere, P. (2005). Simple addition strate-
gies in a first-grade class with multiple strategy instruction. Cognition and
Instruction, 23 , 1-21.
Torbeyns, J., Verschaffel, L., & Ghesquiere, P. (2006). The development of chil-
dren’s adaptive expertise in the number domain 20 to 100. Cognition and
Instruction, 24 , 439-465.
Treffers, A. (1987a). Integrated column arithmetic according to progressive schema-
tisation. Educational Studies in Mathematics, 18 , 125-145.
Treffers, A. (1987b). Three dimensions: A model of goal and theory description in
mathematics instruction. Dordrecht: Kluwer.
Tunteler, E., Pronk, C. M. E., & Resing, W. C. M. (2008). Inter- and intra-
individual variability in the process of change in the use of analogical strategies
to solve geometric tasks in children: A microgenetic analysis. Learning and
Individual Differences, 18 , 44-60.
Van de Craats, J. (2008). Waarom Daan en Sanne niet kunnen rekenen: Zwartboek
rekenonderwijs.
Van den Heuvel-Panhuizen, M., Robitzsch, A., Treffers, A., & Koller, O. (2009).
Large-scale assessments of change in student achievement: Dutch primary
school students’ results on written division in 1997 and 2004 as an example.
Psychometrika, 74 , 351-365.
Van der Ven, S. H. G., Boom, J., Kroesbergen, E. H., & Leseman, P. P. M. (2012).
Microgenetic patterns of children’s multiplication learning: Confirming the
overlapping waves model by latent growth modeling. Journal of Experimental
Child Psychology , 113 , 1-19.
Van Putten, C. M. (2005). Strategiegebruik bij het oplossen van deelsommen
[Strategy use for solving division problems]. In J. Janssen, F. Van der Schoot,
& B. Hemker (Eds.), Balans [32] van het reken-wiskundeonderwijs aan het
einde van de basisschool 4 (p. 125-131). Arnhem: Cito.
Van Putten, C. M., Van den Brom-Snijders, P. A., & Beishuizen, M. (2005). Pro-
gressive mathematization of long division strategies in Dutch primary schools.
Journal for Research in Mathematics Education, 36 , 44-73.
Vermunt, J. K. (2003). Multilevel latent class models. Social Methodology , 33 ,
213-239.
Vermunt, J. K. (2005). Mixed-effects logistic regression models for indirectly ob-
139

served discrete outcome variables. Multivariate Behavioral Research, 40 , 281-
301.
Vermunt, J. K., & Magidson, J. (2005). Latent GOLD 4.0 User’s Guide. Belmont,
Massachusetts: Statistical Innovations Inc.
Vermunt, J. K., & Magidson, J. (2013). Latent GOLD 5.0 Upgrade Manual. Bel-
mont, Massachusetts: Statistical Innovations Inc.
Verschaffel, L., Luwel, K., Torbeyns, J., & Van Dooren, W. (2007). Developing
adaptive expertise: A feasible and valuable goal for (elementary) mathematics
education? Ciencias Psicologicas, 1 , 27-35.
Verschaffel, L., Luwel, K., Torbeyns, J., & Van Dooren, W. (2009). Conceptualizing,
investigating, and enhancing adaptive expertise in elementary mathematics
education. European Journal of Psychology of Education, 24 , 335-359.
Wayne, A. J., & Youngs, P. (2003). Teacher characteristics and student achievement
gains: A review. Review of Educational Research, 73 , 89-122.
Wechsler, D. (Ed.). (1991). The Wechsler intelligence scale for children - third
edition. San Antonio, TX: The Psychological Corporation.
Wenglinsky, H. (2002). How schools matter: The link between teacher class-
room practices and student academic performance. Education Policy Analysis
Archives, 10 .
Wijnstra, J. M. (Ed.). (1988). Balans van het rekenonderwijs in de basisschool [As-
sessment of mathematics education in primary school]. Arnhem, The Nether-
lands: Cito.
Yang, X. D., Shaftel, J., Glasnapp, D., & Poggio, J. (2005). Qualitative or quan-
titative differences? Latent class analysis of mathematical ability for special
education students. Journal of Special Education, 38 , 194-207.
Zumbo, B. D., Liu, Y., Wu, A. D., Shear, B. R., Olvera Astivia, O. L., & Ark, T. K.
(2015). A methodology for Zumbo’s third generation DIF analyses and the
ecology of item responding. Language Assessment Quarterly , 12 , 136-151.
140

Nederlandse samenvatting
De afgelopen decennia zijn de prestaties van leerlingen aan het einde van de basiss-
chool bij bewerkingen met vermenigvuldigen en delen sterk gedaald (J. Janssen et
al., 1999, 2005; Scheltens et al., 2013). Het gaat hierbij om opgaven met grotere
getallen en kommagetallen, zoals 23 × 56 en 31.2 ÷ 1.2. Deze prestatiedaling ging
samen met een verandering in de strategieen die leerlingen gebruiken om dergelijke
opgaven op te lossen: het gebruik van relatief accurate algoritmes (zoals de staart-
deling) nam af, terwijl het relatief inaccurate beantwoorden van opgaven zonder
daarbij een berekening op te schrijven toenam (Fagginger Auer et al., 2013; Hick-
endorff et al., 2009; Van Putten, 2005). De verschuiving in strategiegebruik lijkt
daarmee (deels) de waargenomen prestatiedaling te verklaren. In dit proefschrift
wordt getracht meer inzicht te krijgen in deze ontwikkelingen (en hoe ze mogelijk
ten goede te keren) door de factoren die invloed hebben op het rekenstrategiege-
bruik en de prestaties van leerlingen te onderzoeken. Ook wordt er dieper ingegaan
op de statistische technieken die bij dergelijk onderzoek kunnen worden gebruikt.
Strategiegebruik is een belangrijk onderzoeksgebied binnen de cognitieve psy-
chologie en speelt een rol bij zeer diverse taken en ontwikkelingsfasen (Siegler,
2007): bijvoorbeeld de manieren waarop peuters een speeltje proberen te pakken
dat buiten hun bereik ligt, waarop basisschoolkinderen woorden spellen, en waarop
oudere kinderen transitieve redeneerproblemen oplossen. Een populair onderwerp
van onderzoek zijn rekenstrategieen. Vaak worden strategieen onderzocht voor re-
latief simpele optel-, aftrek-, vermenigvuldig- en deelopgaven met getallen onder de
100 die worden onderwezen in de de lagere groepen van de basisschool (zie bijvoor-
beeld Barrouillet et al., 2008; Blote et al., 2001; Mulligan & Mitchelmore, 1997),
maar er bestaat minder onderzoek naar strategiegebruik voor complexere opgaven.
Dit strategiegebruik is juist interessant omdat er bij dit soort opgaven vaak veel
verschillende aanpakken mogelijk zijn. De adaptiviteit (Lemaire & Siegler, 1995)
141

van de keuzes die leerlingen maken tussen die verschillende aanpakken is heel be-
langrijk: kiest de leerling de strategie die voor hem of haar het meest geschikt is
voor de opgave? De accuratesse (kans op een goed antwoord) en snelheid van de
verschillende mogelijke strategieen voor een leerling zijn hierbij belangrijk (Siegler
& Shipley, 1995), maar ook de socioculturele context waarin de strategie wordt
gebruikt (Verschaffel et al., 2009).
Het belang van strategiekeuzes in het rekenonderwijs is in de loop der jaren
toegenomen. Zoals beschreven door de Koninklijke Nederlandse Academie van
Wetenschappen (KNAW; 2009), schokte de lancering van de satelliet Spoetnik door
de Sovjet-Unie in 1957 het Westen en volgden daarop hervormingen van het onder-
wijs die moesten zorgen voor snellere technologische vooruitgang. De uitwerking
van deze hervormingen verschilde per land, maar een belangrijk aspect was vermin-
derde nadruk op algoritmes gezien de opkomst van computers en rekenmachines. In
Nederland ontstond het ’realistisch rekenen’, met vijf karateristieke grondprincipes
(Treffers, 1987b): het zelf kennis construeren door leerlingen; het gebruik van mod-
ellen en schema’s; reflectie van leerlingen op hun eigen producties; leren van elkaar
door interactie; en het stimuleren van het ontdekken van verbanden binnen de leer-
stof. Zo nam dus de nadruk op een vaste algoritmische aanpak af en werden de vele
informele strategieen van leerlingen belangrijker. In 2002 waren er alleen nog real-
istische rekenboeken voor het basisonderwijs op de markt (KNAW, 2009; inmiddels
is er een meer traditioneel georienteerde methode bijgekomen).
Naast de verscheidenheid aan informele strategieen die in het realistisch rekenen
wordt benadrukt, werd er ook een nieuwe, niet-cijferende aanpak met vaste stappen
en een schematische notatie geıntroduceerd, als tussenvorm tussen hoofdrekenen en
cijferen: het kolomsgewijs rekenen (Treffers, 1987a). Bij deze kolomsgewijze al-
goritmes blijft de getalwaarde van de cijfers intact (bijvoorbeeld dat bij 23 × 56
de 2 voor 20 staat), wat bij cijferen niet het geval is. Met de opkomst van het
realistisch rekenen nam dan ook het gebruik van cijferalgoritmes af. Het gebruik
van kolomsgewijze algoritmes en strategieen met een minder formele notatie nam
echter niet in dezelfde mate toe: in plaats daarvan was er een grote toename van
het aantal opgaven dat werd beantwoord zonder dat daarbij een berekening werd
genoteerd (Fagginger Auer et al., 2013; Hickendorff et al., 2009). Vervolgonder-
zoek liet zien dat leerlingen in dit geval veelal hoofdrekenen (Hickendorff et al.,
2010). Antwoorden zonder schriftelijke uitwerking bleken veel minder vaak goed
dan antwoorden met uitwerking, en verschuivingen in het strategiegebruik tussen
nationale peilingen van het rekenniveau in 1997 en 2004 gingen dan ook samen met
142

een sterke prestatiedaling (Hickendorff et al., 2009). Tussen 2004 en 2011 bleef het
strategiegebruik grotendeels stabiel en bleven de prestaties op het lage niveau van
2004 (Fagginger Auer et al., 2013; Scheltens et al., 2013).
Opzet van dit proefschrift
Naar aanleiding van deze ontwikkelingen richt dit proefschrift zich op onderzoek
naar de factoren die het strategiegebruik en de prestaties van groep-8-leerlingen bij
het oplossen van vermenigvuldig- en deelopgaven beınvloeden. Zowel de invloed van
de instructie die leerlingen krijgen (dagelijks in de klas en bij speciale interventies)
als van kenmerken van leerlingen en leerkrachten wordt onderzocht. Dit onderzoek
wordt op twee manieren uitgevoerd: door middel van aanvullende analyses van
bestaande data van een grote nationale rekenpeiling van Cito (Scheltens et al.,
2013) en door middel van experimenten op basisscholen.
De eerste aanpak - aanvullende analyses van peilingsdata - wordt gebruikt in
hoofdstuk 2 en 3, waar respectievelijk het strategiegebruik en de prestaties van
groep-8-leerlingen worden gerelateerd aan kenmerken van de leerlingen en aan rap-
portages van de leerkrachten van deze leerlingen over de inhoud van hun reken-
lessen. De rekenpeilingsdata die wordt gebruikt in deze hoofdstukken zorgt voor
verschillende statistische complicaties: het grote aantal items in de leerkrachtvra-
genlijst; de multilevelstructuur van de data (opgaven, leerlingen, leerkrachten); het
nonimale meetniveau van de strategieen; en het zogenaamde ’onvolledige design’
van de peiling, waarbij elke leerling slechts een klein deel van de grote totale item-
set maakt. Met latente-variabele-modellen wordt hiervoor een oplossing gezocht.
In hoofdstuk 2 wordt een eerste toepassing van multilevel latente-klassen-analyse
(MLCA; Vermunt, 2003) op peilingsdata beschreven en in hoofdstuk 3 wordt een
nieuwe combinatie van LASSO-penalisatie (Tibshirani, 1996) en explanatory item-
respons-theorie (IRT; De Boeck & Wilson, 2004) geıntroduceerd.
De tweede aanpak - experimenteel onderzoek op basisscholen - wordt gebruikt
in hoofdstuk 4 en 5. Terwijl met de eerste aanpak alleen de samenhang tussen
instructie en uitkomsten in kaart kan worden gebracht (correlationele verbanden),
kan met de tweede aanpak daadwerkelijk worden onderzocht wat de gevolgen zijn
van instructiepraktijken (causale verbanden). De nadruk ligt bij de experimenten
qua strategieen op het wel versus niet noteren van berekeningen, vanwege het eerder
beschreven grote verschil in prestaties tussen schriftelijke en hoofdrekenstrategieen,
en op de effecten van de leerkracht en van leerlingkenmerken. In hoofdstuk 4
143
wordt met een choice/no-choice-experiment (Siegler & Lemaire, 1997) onderzocht
of leerlingen beter presteren wanneer ze worden geınstrueerd berekeningen op te
schrijven en in welke mate ze verstandige (adaptieve) keuzes maken tussen wel en
niet berekeningen opschrijven wat betreft accuratesse en snelheid. In hoofdstuk 5
wordt het effect van een training in het opschrijven van berekeningen op spontane
strategiekeuzes en prestaties onderzocht. Dit wordt gedaan door verschillen hierin
voor en na de training te meten (pretest-posstest-design) bij drie groepen leerlingen:
een groep die de training krijgt, een groep die een controletraining krijgt en een
groep die geen training krijgt.
Tenslotte wordt in hoofdstuk 6 met een experiment onderzoek gedaan naar de
vergelijkbaarheid van resultaten verkregen met de aanpak in hoofdstuk 2 en 3 en de
aanpak in hoofdstuk 4 en 5. Er wordt hierbij gekeken naar de mate waarin strate-
giegebruik en prestaties vergelijkbaar zijn wanneer verschillende soorten rekenop-
gaven door elkaar gemengd worden afgenomen (zoals doorgaans bij peilingen en
in de onderwijspraktijk) versus wanneer alleen maar opgaven van een type worden
afgenomen (zoals vaak bij experimenten). Er zou sprake kunnen zijn van verschillen
door de cognitieve kosten van het wisselen tussen taken (Kiesel et al., 2010) en door
perseveratie in het gebruik van strategieen (Lemaire & Lecacheur, 2010; Luwel,
Schillemans, et al., 2009).
Bevindingen
Deze onderzoeken hebben geresulteerd in verschillende bevindingen over het strate-
giegebruik en de prestaties van leerlingen en de methoden die kunnen worden ge-
bruikt om dit te onderzoeken.
Strategiegebruik en prestaties
Ongeveer een derde deel van de leerlingen bleek voornamelijk opgaven te beantwo-
orden zonder daarbij berekeningen te noteren, terwijl een vijfde deel vooral cijfer-
algoritmes gebruikte (hoofdstuk 2). Om tegemoet te komen aan de opmerkingen
van Van den Heuvel-Panhuizen, Robitzsch, Treffers en Koller (2009) werd in de
overige ’realistische’ oplossingen verder onderscheid gemaakt tussen kolomsgewijze
algoritmes en meer informele, non-algoritmische schriftelijke strategieen. Net als
in eerder onderzoek (Hickendorff, 2013; Hickendorff et al., 2009, 2010; Van Putten,
2005) bleken leerlingen een veel grotere kans te hebben op een goed antwoord wan-
neer zij wel dan wanneer zij niet een berekening noteerden (hoofdstuk 3, 4 en 5).
144

Binnen de schriftelijke strategieen bleken de cijferende en kolomsgewijze algoritmes
vergelijkbaar in hun accuratesse, terwijl non-algoritmische strategieen wat minder
accuraat leken (hoofdstuk 3).
De dagelijkse onderwijspraktijken van leerkrachten bleken vooral samen te hangen
met de keuzes die leerlingen maken tussen schriftelijke strategieen, en minder
met de keuzes tussen schriftelijke en hoofdrekenstrategieen (hoofdstuk 2, 4 en 5).
Daarmee lijkt het indirecte effect van die praktijken op prestaties via strategiege-
bruik beperkt. Wel bleken speciale interventies gericht op strategieen de prestaties
en strategiekeuzes van zwakkere rekenaars positief te kunnen beınvloeden, zowel op
de korte termijn (als leerlingen werden geınstrueerd hun berekeningen op te schri-
jven; hoofdstuk 4) als op de wat langere termijn (als leerlingen over een langere
periode werden getraind met het doel hun spontane strategiekeuzes en prestaties te
veranderen; hoofdstuk 5). Er werd ook een direct, positief effect van de hoeveelheid
klassikale instructie op prestaties gevonden (hoofdstuk 3).
Kenmerken van leerlingen bleken sterk samen te hangen met het kiezen voor
hoofdrekenen: dit werd vaker gedaan door jongens (vooral in plaats van het ge-
bruiken van algoritmes) en door zwakkere rekenaars (hoofdstuk 2, 5 en 6). Hoof-
drekenen bood een groter snelheidsvoordeel ten opzichte van schriftelijke strategieen
voor jongens dan voor meisjes en was extra inaccuraat voor zwakkere rekenaars
(hoofdstuk 4). Deze zwakkere rekenaars bleken op basis van hun prestaties met
schriftelijke en hoofdrekenstrategieen ook niet altijd verstandige keuzes tussen deze
twee aanpakken te maken, terwijl sterkere rekenaars niet per se (direct) baat hebben
bij gedwongen worden hun berekeningen op te schrijven (hoofdstuk 4). Motivatie
lijkt een rol te spelen bij keuzes voor hoofdrekenen (hoofdstuk 5).
Het wel of niet mengen van deelopgaven met andere opgaven hing niet samen
met het strategiegebruik en de prestaties van leerlingen (hoofdstuk 6).
Methoden
Deze conclusies over het strategiegebruik en de prestaties van leerlingen werden
getrokken met behulp van analyses van de data met latente-variabele-modellen. In
deze modellen worden de responsen van leerlingen op opgaven (goed/fout of de
gebruikte strategie) gemodelleerd als zijnde afhankelijk van een niet-geobserveerde
(dus latente) variable. Bij item-respons-modellen is deze latente variabele een con-
tinue schaal waarop je hoger of lager kan scoren, die bijvoorbeeld kan staan voor
rekenvaardigheid. Bij latente-klassen-modellen is de latente variabele categorisch
en bestaat hij uit verschillende groepen met elk een karakteristiek responspatroon
145

op een reeks items, bijvoorbeeld groepen leerlingen die elk een specifiek patroon
van strategiekeuzes hebben. Deze modellen kunnen op een beschrijvende manier
worden gebruikt, als er bijvoorbeeld alleen interesse is in wat de rekenvaardighei-
dsscore van individuele leerlingen is, maar ook op een verklarende manier, waarbij
de scores op de latente variabele worden verklaard aan de hand van andere vari-
abelen. Dit laatste stond centraal in dit proefschrift: er werd steeds gekeken naar
hoe instructiepraktijken en leerlingkenmerken samenhangen met rekenvaardigheid
en met de kans om in een bepaalde latente strategieklasse te komen.
Latente-variabele-modellen werden in dit proefschrift op veel verschillende manieren
toegepast, waarvan sommige manieren nieuw waren. Zo worden in latente-klassen-
modellen meestal maar twee niveaus (bijvoorbeeld opgaven en leerlingen) gemod-
elleerd, maar in hoofdstuk 2 werd een eerste toepassing van multilevel-latente-
klassen-analyse (met een extra niveau voor de leerkrachten) op peilingsdata beschreven.
In hoofdstuk 3 werd een nieuwe combinatie van item-respons-theorie met verk-
larende variabelen voor de rekenscores (explanatory IRT) met LASSO-penalisatie
geıntroduceerd. Deze penalisatie is een manier om uit een grote groep voorspel-
lende variabelen de variabelen te selecteren die het sterkst samenhangen met de
uitkomstvariabele (rekenscores in dit geval). Deze nieuwe toepassingen werden
gedaan op peilingsdata, waarvoor vaker latente-variable-modellen worden gebruikt
vanwege de uitdagingen die dit type data biedt. In hoofdstuk 4, 5 en 6 werden
de modellen ook ingezet voor de data van de experimenten en ze boden daar ook
belangrijke voordelen, bijvoorbeeld bij het modelleren van de groei in prestaties bij
het trainingsonderzoek (hoofdstuk 5).
Naast deze statistische methoden stond ook een andere methodologische be-
nadering in dit proefschrift centraal: het in kaart brengen van het strategiegebruik
van leerlingen aan de hand van de berekeningen die ze hebben genoteerd. Zoals
besproken door Fagginger Auer, Hickendorff en Van Putten (2015), wordt strate-
giegebruik normaal vaak bepaald door de gebruikers van de strategieen daar ver-
baal over te laten rapporteren. Dit rapporteren kan echter het strategiegebruik
zelf beınvloeden, en het verzamelen van de rapportages is erg arbeidsintensief en
vereist de aanwezigheid van een getrainde interviewer. Het noteren van berekenin-
gen is daarentegen een natuurlijk onderdeel van het oplossen van opgaven en de
berekeningen kunnen op grote schaal worden verzameld, waarna achteraf kan wor-
den bepaald welke strategieen zijn gebruikt. Een belangrijk nadeel van het ge-
bruiken van berekeningen is wel dat in het geval van het ontbreken van genoteerde
berekeningen onbekend blijft wat een leerling precies heeft gedaan.
146
Dit proefschrift als geheel genomen illustreert een meer algemeen toepasbare
methode voor onderwijsonderzoek. Het bouwt voort op bevindingen bij onder-
wijspeilingen en bestaat uit aanvullende analyses van bestaande peilingsdata en
daarop gebaseerd experimenteel vervolgonderzoek. Deze aanpak combineert het
beste van twee werelden: de grote hoeveelheid data van een grote, representatieve
steekproef van een rekenpeiling wordt gebruikt om factoren te vinden die gerela-
teerd zijn aan onderwijsopbrengsten, en de causaliteit van die relaties kan vervolgens
worden vastgesteld met gericht experimenteel vervolgonderzoek, dat mogelijk resul-
teert in interventies waar de onderwijspraktijk baat bij heeft. Er is nationaal en
internationaal een grote hoeveelheid bestaande peilingsdata die nog beter kan wor-
den benut door er aanvullende analyses op uit te voeren. De besproken multilevel-
latente-klassen-analyse en variaties van item-respons-theorie-modellen kunnen wor-
den gebruikt om de complexe peilingsdata te analyseren, evenals de data van ver-
volgexperimenten. En ten slotte, om af te sluiten met het centrale thema van dit
proefschrift: de oplossingsstrategieen van leerlingen kunnen veelal worden afgeleid
uit beschikbaar schriftelijk werk en zijn een cruciaal onderdeel van hoe leerlingen
rekenen, dus deze opnemen in onderwijsonderzoek is zowel relatief eenvoudig als
essentieel voor het verkrijgen van een compleet beeld van het leren van leerlingen.
147

Dankwoord
Er zijn veel mensen die ik wil bedanken voor hun hulp bij het tot stand komen van
dit proefschrift en voor het veraangenamen van dat proces.
Ten eerste natuurlijk mijn begeleiders: Willem Heiser, Anton Beguin, Kees van
Putten en Marian Hickendorff. Willem, bedankt voor je wijze raad over de grotere
lijnen en voor de mooie anekdotes. Anton, bedankt voor het prettige contact en
de hulp als het nodig was, ondanks de afstand die toch wat groot bleek. Kees en
Marian, bedankt voor de vele keren dat jullie mijn werk van nuttig commentaar
hebben voorzien, jullie altijd open deur en de positieve woorden wanneer ik die
nodig had. Kees, ik heb veel gehad aan je zorgvuldige overwegingen en grote
kennis over rekenen, en kijk met genoegen terug op onze gesprekken over muziek
en de borrel in je prachtige tuinhuisje. Marian, zowel persoonlijk als in manier van
denken en aanpak vond ik het altijd heel prettig om met je te werken. Door jou
kwam ik als bachelorstudent in het rekenen en de psychometrie terecht en voorlopig
blijf ik daar met veel plezier.
De leden van mijn promotiecommissie, Lieven Verschaffel, Maartje Raijmakers,
Sanne van der Ven en Mark de Rooij, wil ik graag bedanken voor het lezen van
mijn proefschrift en voor hun positieve commentaar.
De studenten en basisscholen die hebben meegewerkt aan het onderzoek waarop
dit proefschrift is gebaseerd, ben ik grote dank verschuldigd voor de geınvesteerde
tijd en energie.
Voor mijn promotie zat ik dagelijks op de Faculteit der Sociale Wetenschappen
van Universiteit Leiden en hoewel het onderzoek me soms wat zwaar viel, was dat
altijd een prettige plek om te zijn door mijn M&T-collega’s, met hun behulpza-
amheid bij praktische en statistische zaken en de gezelligheid bij lunches, borrels en
spontane gesprekken op de derde verdieping. Mijn kamergenoten in 3B23, bedankt
voor het delen in de dagelijkse ups, downs en onzinnigheden. Monika en Jolien,
149
Leiden moest helaas een tijdje geleden afscheid van jullie nemen, maar nu gaan we
gezellig samen aan de slag in Den Haag!
Naast mijn werkzaamheden in Leiden was ik regelmatig bij Cito in Arnhem. De
mensen daar wil ik bedanken voor de vruchtbare samenwerking wat betreft PPON
en de gezelligheid op congressen. In het bijzonder wil ik Floor Scheltens bedanken,
die me heeft geholpen met vele PPON-zaken en met wie ik heel wat uren strategieen
heb gecodeerd en mogelijk nog meer heb gelachen.
Iedereen bij IOPS wil ik bedanken voor de vele leerzame en gezellige momenten.
De congressen en cursussen waren altijd hoogtepunten in het jaar, waar ik veel heb
opgestoken over de verschillende takken van de psychometrie en kroegen in oorden
als Groningen, Enschede en Leuven. Ook mijn tijd in het bestuur was erg leuk en
interessant. Edith Ruisch, bedankt voor de prettige samenwerking.
Tenslotte wil ik mijn vrienden en familie bedanken voor het luisteren naar mijn
verhalen en voor de relativering. Nonetters en Spotters, jullie zorgden voor de
muzikale schwung in elke week. Peter en Berty, bedankt voor jullie steun al die jaren
en jullie vertrouwen in mijn capaciteiten en doorzettingsvermogen. En dan nog mijn
paranimf Bas, bedankt voor je humor in elke situatie, en natuurlijk mijn paranimf
Sjoerd, voor je technische, statistische en boven alles liefdevolle ondersteuning.
150

Curriculum vitae
Marije Fagginger Auer werd op 8 mei 1988 te Utrecht geboren. In 2006 behaalde zij
haar vwo-diploma op R.S.G. Broklede te Breukelen. Hierna deed zij haar bachelor
Psychologie aan de Universiteit Leiden, die zij combineerde met keuzevakken bij de
studie Wiskunde en een bestuursjaar bij het Leids Studentenkoor en -Orkest Col-
legium Musicum. In 2009 rondde zij haar bachelor cum laude af en begon zij met
een onderzoeksmaster Developmental Psychology aan dezelfde universiteit, die zij
in 2011 eveneens cum laude afrondde. Direct hierop volgend werd zij aangesteld als
promovenda bij de afdeling Methodologie en Statistiek van het Instituut Psycholo-
gie aan de Universiteit Leiden, op een project in samenwerking met Cito Instituut
voor Toetsontwikkeling te Arnhem. In deze rol leverde zij een bijdrage aan de rap-
portage van de nationale Periodieke Peiling van het Onderwijsniveau (PPON) voor
rekenen-wiskunde in 2011 en was zij lid van de Interuniversitaire Onderzoeksschool
voor Psychometrie en Sociometrie (IOPS), waar zij in het bestuur de promovendi
vertegenwoordigde. Daarnaast construeert ze sinds 2009 bij Cito toetsopgaven voor
rekenen-wiskunde, en beoordeelt ze sinds 2015 psychodiagnostische instrumenten
voor de Commissie Testaangelegenheden Nederland (COTAN).
151