SOLUTIONS TO INTEGRATED CASE APPLICATIONS—PINNACLE...
25
Copyright © 2011 Pearson Canada Inc. SOLUTIONS TO INTEGRATED CASE APPLICATIONS—PINNACLE MANUFACTURING Chapter 6 Integrated Case Application—Pinnacle Manufacturing: Part I a. Amounts (in thousands) Ratios 2009 2008 2007 Current assets 44,497 36,196 36,005 Current liabilities 25,926 17,605 16,341 Current ratio: 1.72 2.06 2.20 Debt 47,161 37,033 35,801 Equity 55,826 52,759 50,873 Debt to equity: 84.5% 70.2% 70.4% Net income before 4,274 3,870 2,660 taxes Sales 149,245 137,580 125,814 Net income before taxes/sales: 2.9% 2.8% 2.1% Gross profit 44,437 40,984 37,129 Sales 149.245 137,579 125,814 Gross margin %: 29.8% 29.8% 29.5% COGS 104,808 96,596 88,685 Average inventory 25,119 22,091 21,975 Inventory turnover: 4.2 4.4 4.0 b. There is a low risk that Pinnacle will fail financially in the next twelve months. The company has been profitable the past three years, is generating significant cash flows and most of the ratios indicate no financial difficulties. The current ratio and debt to equity have deteriorated somewhat, but not enough to cause significant concerns. For example, the current ratio is still over 1.0 in the current year, implying that the company has enough current assets to pay its current obligations. This implies that no unusual obligations will be incurred in the coming year. Debt has increased somewhat, but income remains stable, indicating the ability to cover costs, including interest expenses and debt repayment. Gross profit over the years is stable, which should actually be queried – with the new divisions, we would expect some fluctuation in these figures.
Transcript of SOLUTIONS TO INTEGRATED CASE APPLICATIONS—PINNACLE...

Copyright © 2011 Pearson Canada Inc.
SOLUTIONS TO INTEGRATED CASE APPLICATIONS—PINNACLE MANUFACTURING Chapter 6 Integrated Case Application—Pinnacle Manufacturing: Part I a. Amounts (in thousands) Ratios 2009 2008 2007 Current assets 44,497 36,196 36,005 Current liabilities 25,926 17,605 16,341 Current ratio: 1.72 2.06 2.20 Debt 47,161 37,033 35,801 Equity 55,826 52,759 50,873 Debt to equity: 84.5% 70.2% 70.4% Net income before 4,274 3,870 2,660 taxes Sales 149,245 137,580 125,814 Net income before taxes/sales : 2.9% 2.8% 2.1% Gross profit 44,437 40,984 37,129 Sales 149.245 137,579 125,814 Gross margin %: 29.8% 29.8% 29.5% COGS 104,808 96,596 88,685 Average inventory 25,119 22,091 21,975 Inventory turnover: 4.2 4.4 4.0
b. There is a low risk that Pinnacle will fail financially in the next twelve months. The company has been profitable the past three years, is generating significant cash flows and most of the ratios indicate no financial difficulties. The current ratio and debt to equity have deteriorated somewhat, but not enough to cause significant concerns. For example, the current ratio is still over 1.0 in the current year, implying that the company has enough current assets to pay its current obligations. This implies that no unusual obligations will be incurred in the coming year. Debt has increased somewhat, but income remains stable, indicating the ability to cover costs, including interest expenses and debt repayment. Gross profit over the years is stable, which should actually be queried – with the new divisions, we would expect some fluctuation in these figures.

Copyright © 2011 Pearson Canada Inc.
c. Pinnacle Manufacturing Company
Income Statement - All Divisions For the Year Ended December 31 2009 2009 2008 2008 2007 2007 Dollar
Value % of Sales Dollar Value % of Sales Dollar
Value % of Sales
Sales 149,424,646
100.00% 137,741,766 100.00% 125,982,29
4
100.00%
Sales Returns and Allowances 179,470 0.12% 162,102 0.12% 168,022 0.13% Cost of Sales*
104,807,966 70.14% 96,595,908 70.13%
88,685,361 70.40%
Gross Profit 44,437,210 29.74% 40,983,756 29.75% 37,128,911
29.47%
OPERATING EXPENSES-Allocated
Salaries-Management 2,348,025 1.57% 2,190,819 1.59% 1,995,723 1.58% Salaries-Office 324,392 0.22% 272,185 0.20% 266,831 0.21% Licensing and certification fees 196,229 0.13% 158,608 0.12% 141,112 0.11% Security 566,716 0.38% 584,936 0.42% 548,133 0.44% Insurance 95,924 0.06% 95,268 0.07% 94,340 0.07% Group insurance benefits 24,415 0.02% 27,021 0.02% 25,052 0.02% Advertising 167,268 0.11% 163,311 0.12% 144,068 0.11% Business publications 7,194 0.00% 5,096 0.00% 673 0.00% Property taxes 23,246 0.02% 163,311 0.12% 152,776 0.12% Bad debts 866,330 0.58% 948,679 0.69% 862,690 0.68% Amortization expense 5,492,959 3.68% 4,258,699 3.09% 3,797,885 3.01% Accounting fees 281,973 0.19% 273,190 0.20% 260,684 0.21% Total operating expenses-Allocated 10,394,671 6.96% 9,141,123 6.64% 8,289,967 6.56% OPERATING EXPENSES-Direct Salaries-Sales 15,408,771 10.31% 14,062,181 10.21%
12,960,341 10.29%
Wages Rental 506,186 0.34% 546,228 0.40% 500,630 0.40% Wages-Mechanics 1,146,126 0.77% 1,229,015 0.89% 1,159,488 0.92% Wages-Warehouse 5,034,197 3.37% 4,899,331 3.56% 4,759,347 3.78% Garbage collection 28,458 0.02% 27,313 0.02% 33,017 0.03% Payroll benefits 2,735,670 1.83% 2,695,165 1.96% 2,516,783 2.00% Rent- Warehouse 826,350 0.55% 701,235 0.51% 659,430 0.52% Telephone 33,350 0.02% 41,443 0.03% 50,319 0.04% Utilities 270,072 0.18% 244,959 0.18% 238,578 0.19% Postage 92,390 0.06% 122,494 0.09% 131,546 0.10% Linen service 17,788 0.01% 11,330 0.01% 13,985 0.01% Repairs and maintenance 171,872 0.12% 154,500 0.11% 154,968 0.12% Cleaning service 92,428 0.06% 74,852 0.05% 67,903 0.05% Legal service 407,605 0.27% 174,807 0.13% 132,381 0.11% Fuel 294,933 0.20% 313,020 0.23% 243,054 0.19% Travel and entertainment 106,415 0.07% 95,268 0.07% 87,373 0.07% Pension expense 235,244 0.16% 217,752 0.16% 110,444 0.09% Office supplies 154,213 0.10% 136,092 0.10% 148,790 0.12% Miscellaneous 308,969 0.21% 97,185 0.07% 125,228 0.10% Total operating expenses-Direct 27,871,037 18.65% 25,844,170 18.78%
24,093,605 19.13%
Total Operating Expenses 38,265,708 25.61% 34,985,293 25.42% 32,383,572
25.69%
Operating Income 6,171,502 4.13% 5,998,463 4.33% 4,745,339 3.78% Other Expense-Interest 1,897,346 1.27% 2,128,905 1.55% 2,085,177 1.66% Income Before Taxes 4,274,156 2.86% 3,869,558 2.78% 2,660,162 2.12% Income Taxes 1,013,745 0.68% 1,399,001 1.02% 1,166,553 0.93%
Copyright © 2011 Pearson Canada Inc.
Net Income 3,260,411 2.18% 2,470,557 1.76% 1,493,609 1.19%
*Details of manufacturing expense not incl.
For the overall financial statements, the focus for potential misstatements is on all
accounts except direct expenses. For the direct expenses, it is better to use the disaggregated information.
Account Balance Estimate of $ Amount of Potential Misstatement Property taxes Decrease of $140,000 when property increased. It could be that one or more properties’ real property taxes have not
been included. Bad debts See requirement f for an analysis Depreciation expense Increase of $1.2 million, perhaps partly due to new building
and equipment purchases Income Taxes IT as a % of NIBT was 36% in 2008.
36% of 2009 NIBT is $1.539 million. Actual IT for 2009 was $1.014 million. Difference of $525,000.
Interest expense Short-term plus long-term interest bearing debt increased
by 25%, from $27.3 million to $34. 1 million, but interest expense decreased. If interest rates have not changed, interest expense would be expected to increase by a similar amount to $2,661,000 ($2,129,00 x 1.25). Potential misstatement of $764,000 ($2,661,000 - $1,897,000).
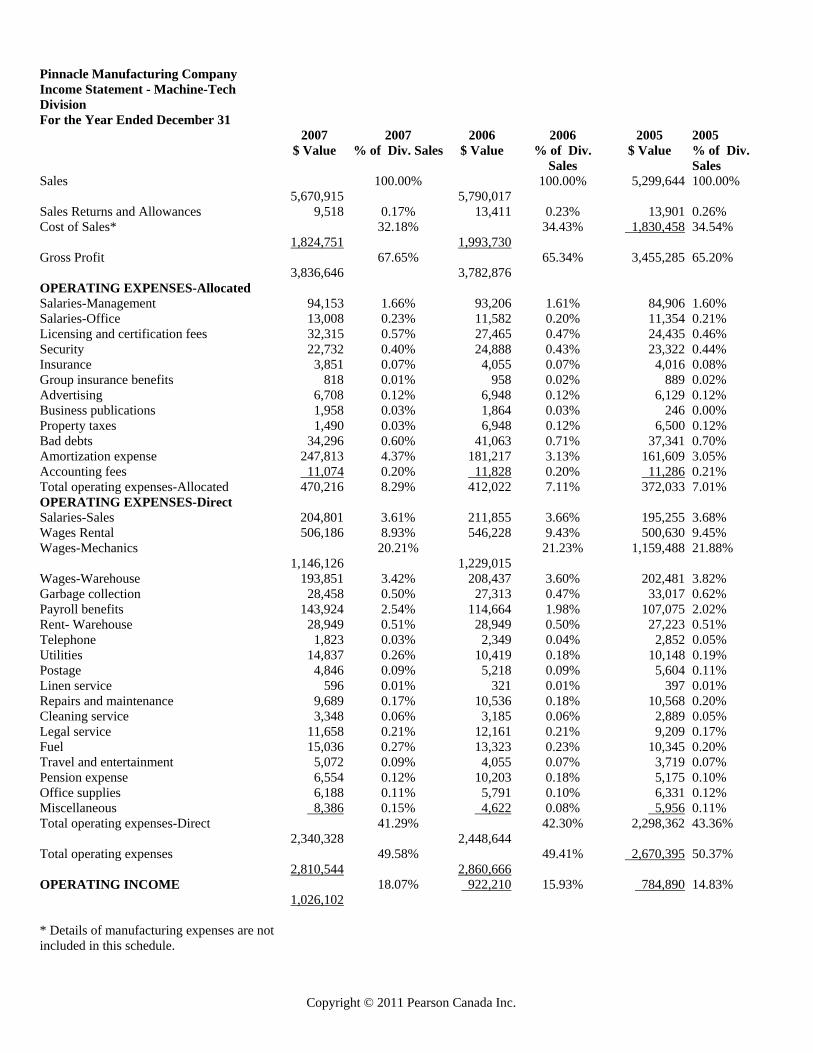
d. Pinnacle Manufacturing Company Income Statement - Welburn Division For the Year Ended December 31 2007 2007 2006 2006 2005 2005 $ Value % of Div.
Sales $ Value % of Div. Sales $ Value % of Div.
Sales Sales 121,371,795 100.00% 111,877,873 100.00% 102,308,887 100.00% Sales Returns and Allowances 126,522 0.10% 113,483 0.10% 117,627 0.11% Cost of Sales* 86,671,580 71.41% 79,914,454 71.43% 73,370,003 71.71%
Gross Profit 34,573,693 28.49% 31,849,936 28.47% 28,821,257 28.18% OPERATING EXPENSES-Allocated Salaries-Management 1,905,965 1.57% 1,774,466 1.59% 1,616,447 1.58% Salaries-Office 263,320 0.22% 220,457 0.20% 216,121 0.21% Licensing and certification fees 144,046 0.12% 117,118 0.10% 104,199 0.10% Security 460,017 0.38% 473,767 0.42% 443,958 0.43% Insurance 77,861 0.06% 77,159 0.07% 76,407 0.07% Group insurance benefits 19,956 0.02% 22,048 0.02% 20,441 0.02% Advertising 135,777 0.11% 132,276 0.12% 116,690 0.11% Business publications 4,336 0.00% 2,735 0.00% 361 0.00% Property taxes 18,396 0.02% 132,276 0.12% 123,743 0.12% Bad debts 708,015 0.58% 762,910 0.68% 693,759 0.68% Amortization expense 4,329,633 3.57% 3,449,347 3.08% 3,076,109 3.01% Accounting fees 230,075 0.19% 220,363 0.20% 210,276 0.21%
Total operating expenses-Allocated 8,297,397 6.84% 7,384,922 6.60% 6,698,511 6.54% OPERATING EXPENSES-Direct Salaries-Sales 12,947,327 10.67% 11,646,277 10.41% 10,733,735 10.49% Wages-Warehouse 4,124,063 3.40% 3,968,235 3.55% 3,854,855 3.77% Payroll benefits 2,099,069 1.73% 2,182,959 1.95% 2,038,477 1.99% Rent- Warehouse 690,375 0.57% 571,916 0.51% 537,821 0.53%

Copyright © 2011 Pearson Canada Inc.
Telephone 26,659 0.02% 33,069 0.03% 40,152 0.04% Utilities 200,398 0.17% 198,409 0.18% 193,240 0.19% Postage 80,204 0.07% 99,207 0.09% 106,538 0.10% Linen service 14,539 0.01% 9,642 0.01% 11,900 0.01% Repairs and maintenance 127,063 0.10% 107,833 0.10% 108,159 0.11% Cleaning service 67,780 0.06% 60,628 0.05% 55,000 0.05% Legal service 119,122 0.10% 120,490 0.11% 91,247 0.09% Fuel 224,342 0.18% 253,526 0.23% 196,858 0.19% Travel and entertainment 82,614 0.07% 77,159 0.07% 70,765 0.07% Pension expense 193,389 0.16% 176,367 0.16% 89,454 0.09% Office supplies 125,176 0.10% 110,228 0.10% 120,513 0.12% Miscellaneous 58,819 0.05% 53,130 0.05% 68,461 0.07%
Total operating expenses-Direct 21,180,939 17.46% 19,669,075 17.60% 18,317,175 17.91% Total operating expenses 29,478,336 24.30% 27,053,997 24.20% 25,015,686 24.45% OPERATING INCOME 5,095,357 4.19% 4,795,939 4.27% 3,805,571 3.73% * Details of manufacturing expenses are not included in this schedule.
Copyright © 2011 Pearson Canada Inc.
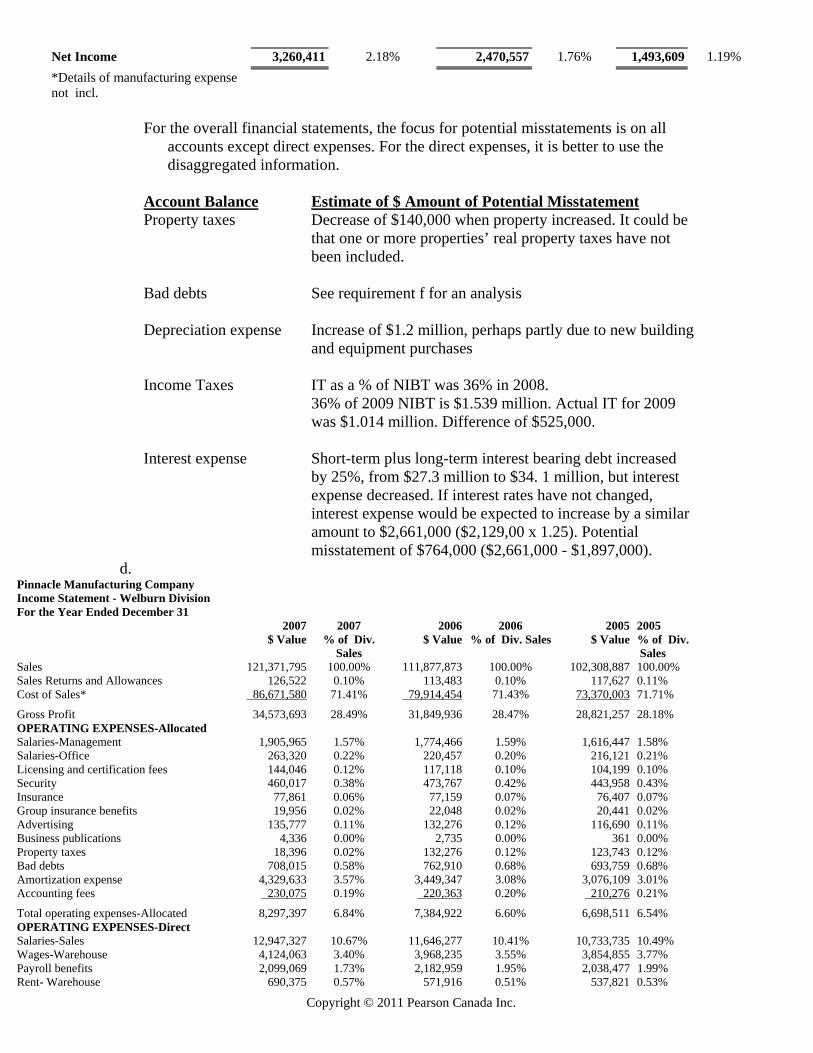
Pinnacle Manufacturing Company Income Statement - Solar-Electro Division
For the Year Ended December 31 2007 2007 2006 2006 2005 2005
$ Value % of Div. Sales
$ Value % of Div. Sales $ Value % of Div Sales
Sales 22,381,936 100.00% 20,073,876 100.00% 18,373,763 100.00% Sales Returns and Allowances 43,430 0.19% 35,208 0.18% 36,494 0.20% Cost of Sales* 16,311,635 72.88% 14,687,724 73.17% 13,484,900 73.39%
Gross Profit 6,026,871 26.93% 5,350,944 26.65% 4,852,369 26.41% OPERATING EXPENSES-Allocated Salaries-Management 347,907 1.55% 323,147 1.61% 294,370 1.60% Salaries-Office 48,064 0.21% 40,146 0.20% 39,356 0.21% Licensing and certification fees 19,868 0.09% 14,025 0.07% 12,478 0.07% Security 83,967 0.38% 86,281 0.43% 80,853 0.44% Insurance 14,212 0.06% 14,054 0.07% 13,917 0.08% Group insurance benefits 3,641 0.02% 4,015 0.02% 3,722 0.02% Advertising 24,783 0.11% 24,087 0.12% 21,249 0.12% Business publications 900 0.00% 497 0.00% 66 0.00% Property taxes 3,360 0.02% 24,087 0.12% 22,533 0.12% Bad debts 124,019 0.55% 144,706 0.72% 131,590 0.72% Amortization expense 915,513 4.09% 628,135 3.13% 560,167 3.05% Accounting fees 40,824 0.18% 40,999 0.20% 39,122 0.21%
Total operating expenses-Allocated 1,627,058 7.26% 1,344,179 6.69% 1,219,423 6.64% OPERATING EXPENSES-Direct Salaries-Sales 2,256,643 10.08% 2,204,049 10.98% 2,031,351 11.06% Wages-Warehouse 716,283 3.20% 722,659 3.60% 702,011 3.82% Payroll benefits 492,677 2.20% 397,542 1.98% 371,231 2.02% Rent- Warehouse 107,026 0.48% 100,370 0.50% 94,386 0.51% Telephone 4,868 0.02% 6,025 0.03% 7,315 0.04% Utilities 54,837 0.25% 36,131 0.18% 35,190 0.19% Postage 7,340 0.03% 18,069 0.09% 19,404 0.11% Linen service 2,653 0.01% 1,367 0.01% 1,688 0.01% Repairs and maintenance 35,120 0.16% 36,131 0.18% 36,241 0.20% Cleaning service 21,300 0.10% 11,039 0.05% 10,014 0.05% Legal service 276,825 1.24% 42,156 0.21% 31,925 0.17% Fuel 55,555 0.25% 46,171 0.23% 35,851 0.20% Travel and entertainment 18,729 0.08% 14,054 0.07% 12,889 0.07% Pension expense 35,301 0.16% 31,182 0.16% 15,815 0.09% Office supplies 22,849 0.10% 20,073 0.10% 21,946 0.12% Miscellaneous 241,764 1.08% 39,433 0.20% 50,811 0.28%
Total operating expenses-Direct 4,349,770 19.44% 3,726,451 18.57% 3,478,068 18.94% Total operating expenses 5,976,828 26.70% 5,070,630 25.26% 4,697,491 25.58% OPERATING INCOME 50,043 0.23% 280,314 1.39% 154,878 0.83% * Details of manufacturing expenses are not included in this schedule.
Copyright © 2011 Pearson Canada Inc.
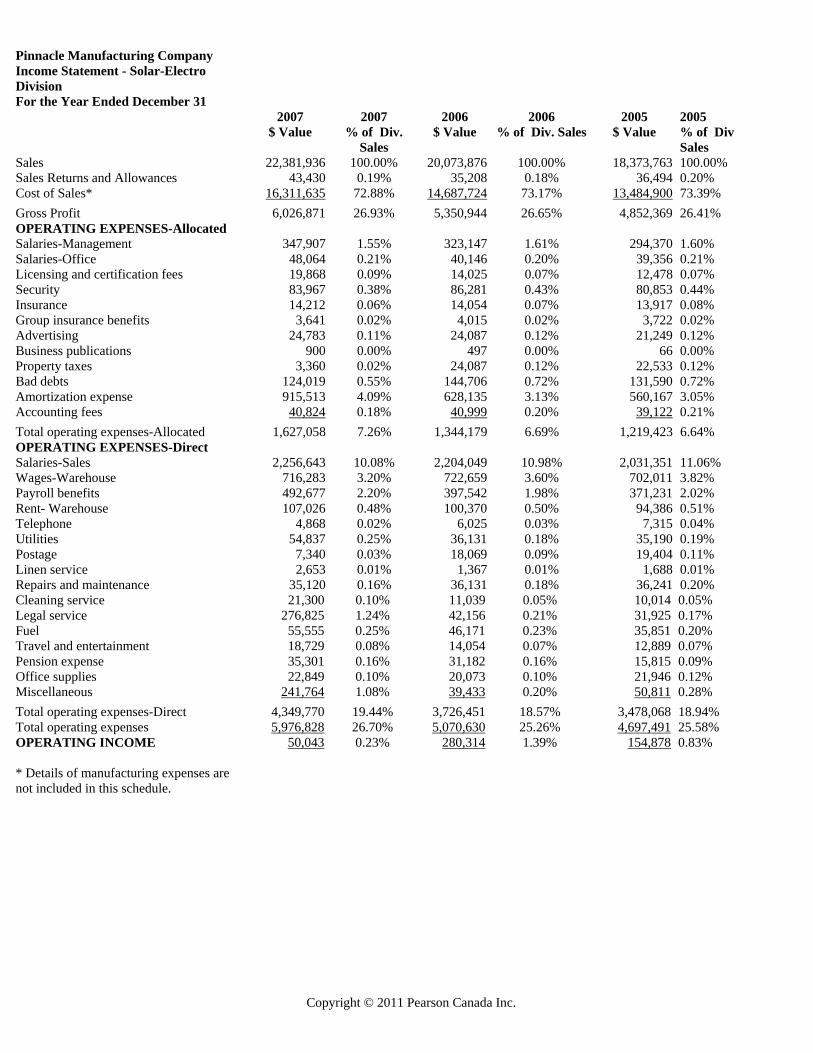
Pinnacle Manufacturing Company Income Statement - Machine-Tech Division
For the Year Ended December 31 2007 2007 2006 2006 2005 2005 $ Value % of Div. Sales $ Value % of Div.
Sales $ Value % of Div.
Sales Sales
5,670,915 100.00%
5,790,017 100.00% 5,299,644 100.00%
Sales Returns and Allowances 9,518 0.17% 13,411 0.23% 13,901 0.26% Cost of Sales*
1,824,751 32.18%
1,993,730 34.43% 1,830,458 34.54%
Gross Profit 3,836,646
67.65% 3,782,876
65.34% 3,455,285 65.20%
OPERATING EXPENSES-Allocated Salaries-Management 94,153 1.66% 93,206 1.61% 84,906 1.60% Salaries-Office 13,008 0.23% 11,582 0.20% 11,354 0.21% Licensing and certification fees 32,315 0.57% 27,465 0.47% 24,435 0.46% Security 22,732 0.40% 24,888 0.43% 23,322 0.44% Insurance 3,851 0.07% 4,055 0.07% 4,016 0.08% Group insurance benefits 818 0.01% 958 0.02% 889 0.02% Advertising 6,708 0.12% 6,948 0.12% 6,129 0.12% Business publications 1,958 0.03% 1,864 0.03% 246 0.00% Property taxes 1,490 0.03% 6,948 0.12% 6,500 0.12% Bad debts 34,296 0.60% 41,063 0.71% 37,341 0.70% Amortization expense 247,813 4.37% 181,217 3.13% 161,609 3.05% Accounting fees 11,074 0.20% 11,828 0.20% 11,286 0.21% Total operating expenses-Allocated 470,216 8.29% 412,022 7.11% 372,033 7.01% OPERATING EXPENSES-Direct Salaries-Sales 204,801 3.61% 211,855 3.66% 195,255 3.68% Wages Rental 506,186 8.93% 546,228 9.43% 500,630 9.45% Wages-Mechanics
1,146,126 20.21%
1,229,015 21.23% 1,159,488 21.88%
Wages-Warehouse 193,851 3.42% 208,437 3.60% 202,481 3.82% Garbage collection 28,458 0.50% 27,313 0.47% 33,017 0.62% Payroll benefits 143,924 2.54% 114,664 1.98% 107,075 2.02% Rent- Warehouse 28,949 0.51% 28,949 0.50% 27,223 0.51% Telephone 1,823 0.03% 2,349 0.04% 2,852 0.05% Utilities 14,837 0.26% 10,419 0.18% 10,148 0.19% Postage 4,846 0.09% 5,218 0.09% 5,604 0.11% Linen service 596 0.01% 321 0.01% 397 0.01% Repairs and maintenance 9,689 0.17% 10,536 0.18% 10,568 0.20% Cleaning service 3,348 0.06% 3,185 0.06% 2,889 0.05% Legal service 11,658 0.21% 12,161 0.21% 9,209 0.17% Fuel 15,036 0.27% 13,323 0.23% 10,345 0.20% Travel and entertainment 5,072 0.09% 4,055 0.07% 3,719 0.07% Pension expense 6,554 0.12% 10,203 0.18% 5,175 0.10% Office supplies 6,188 0.11% 5,791 0.10% 6,331 0.12% Miscellaneous 8,386 0.15% 4,622 0.08% 5,956 0.11% Total operating expenses-Direct
2,340,328 41.29%
2,448,644 42.30% 2,298,362 43.36%
Total operating expenses 2,810,544
49.58% 2,860,666
49.41% 2,670,395 50.37%
OPERATING INCOME 1,026,102
18.07% 922,210 15.93% 784,890 14.83%
* Details of manufacturing expenses are not included in this schedule.

Copyright © 2011 Pearson Canada Inc.
For disaggregated information it is best to ignore the allocated expenses.
Account Balance Estimate of $ Amount of Potential Misstatement Solar Electro:
Payroll benefits Increased almost $100,000 without a similar sized increase in salary and wages. Payroll benefits in Welburn decreased while salary and wages increased in this division. Potential misallocation between divisions.
Legal Service Large increase may be indicative of other issues affecting
disclosures and asset or liability valuation.
Miscellaneous $200,000 increase needs investigation.
Welburn $120,000 increase in warehouse rent even though there is no evidence of any change in facilities.
e. Both the companywide and the divisional income statements are useful, but for
different purposes. The companywide information is useful for identifying material fluctuations in the financial statements. However, the disaggregated information is more helpful in identifying the source of the fluctuations.
f.
Estimate of Potential Understatement in Allowance
A/R Turnover 2009
2008 2007
Sales 149,245 137,580 125,814 Average accounts receivable 9,247 7,888 7,582 Turnover 16.1 17.4 16.6
Days Sales Outstanding 365 365 365 365Turnover 16.1 17.4 16.6Days 22.6 20.9 22.0
Allowance as a Percentage of Gross Receivables Allowance 699 699 682 Gross Receivables 10,300 8,194 7,582 Percentage 6.8% 8.5% 9.0%
Potential understatement in allowance Suggested percent 9.5% Estimate based on decrease in turnover Gross accounts receivable 10,300 Suggested allowance 979 Actual Allowance 699 Potential understatement 280

Copyright © 2011 Pearson Canada Inc.
Chapter 8 Integrated Case Application—Pinnacle Manufacturing: PART II
a. Acceptable Audit Risk and Engagement Risk Issues:
External users’ reliance on financial statements:
1. The company is privately held, but there is a large amount of debt, therefore the
financial statements will be used fairly extensively. Also, management is considering selling the Machine-Tech division, which has the potential to result in extensive use of the statements by the buyers.
2. Item 4 in the planning phase indicates plans for additional debt financing. As both of these items result in potential additional users to the financial statements,
they have the effect of reducing audit risk.
Likelihood of financial difficulties:
1. The solar power engine business revolves around constantly changing technology, thus making it inherently more risky than other businesses, with a better chance of subsequent bankruptcy. Item 1 in the planning issues raises a concern about the viability of the Solar-Electro division, but not necessarily the entire company.
2. The conclusion in Part I of the case was that the likelihood of financial failure is
low, even considering the issue with Solar-Electro. 3. Item 7 in the planning phase indicates there is a debt covenant requiring a current
ratio above 2.0 and a debt-to-equity ratio below 1.0. The current ratio has fallen below 2.0. This could result in the loan being called unless a waiver of the loan covenant is granted, or that management may have a bias towards misstating the financial statements in favour of increasing the debt-to-equity ratio.
Overall, there seems to be little likelihood of financial failure, unless the company is unable to refinance the loan that relates to Item 7.
Management integrity: No major issue exists that would cause the auditor to question management integrity, but the auditor should have done extensive client acceptance procedures before accepting the client. It is possible that Item 6 in the planning phase, turnover of internal audit personnel, could be intentional and increases the risk of fraudulent financial reporting.
b. Acceptable audit risk is likely to be medium to low because of the factors listed in
Part A, especially the planned increase in financing and the potential violation of the debt covenant agreement. Some might prefer the low acceptable risk because it is a first year audit.

Copyright © 2011 Pearson Canada Inc.
c. We look at inherent risks by examining each of the 11 items in the planning phase.
1. No effect on inherent risk. There is a potential effect on going concern of
the division, which was discussed in Part A. 2. The primary concern is the possibility of obsolete inventory, which affects
the valuation of inventory at the lower of cost or market.
Accounts Affected: Inventory, cost of good sold
3. There is a potential related party transaction, which could affect the
valuation of the transaction and may require disclosure as a related party transaction.
Accounts Affected: Manufacturing equipment, footnote disclosures
4. No effect on inherent risk
5. There is a potential related party transaction, which could affect the valuation of the transaction and may require disclosure as a related party transaction.
Accounts Affected: Repairs and maintenance expense and accounts payable.
6. Although this does not directly affect inherent risk, it is possible that
turnover of internal audit personnel could be intentional (for example, due to poor attitudes towards internal audit by management) and increases the risk of fraudulent financial reporting. The turnover may also affect the auditor’s assessment of control risk.
Accounts Affected: All accounts
7. In addition to affecting acceptable audit risk, the auditor should be concerned about the risk of fraudulent financial reporting due to the incentive to make certain that all debt covenants have been met.
Accounts Affected: All accounts
8. A receivable outstanding for several months from a customer making up 15% of the company’s outstanding accounts receivable balance may indicate a major collection problem, which could result in an understatement of the allowance for uncollectible accounts.
Accounts Affected: Accounts receivable, bad debt expense, allowance for uncollectible accounts
9. Inherent Risk: An ongoing dispute with the Internal Revenue Service may
require an adjustment to income tax liability or a disclosure in footnotes for a contingency, depending on the status of the dispute.
Accounts Affected: Income tax expense and income taxes payable

Copyright © 2011 Pearson Canada Inc.
10. This situation involves a related party transaction (Solar-Electro borrowed money from the Welburn division). Because this transaction was not conducted with an outside party, it is possible that the related receivable and payable might not have been properly eliminated on Pinnacle’s consolidated financial statements.
Accounts Affected: Notes payable, notes receivable, interest expense and interest income.
11. This situation involves a nonroutine transaction where there is a risk that materials, labor and/or overhead are incorrectly applied to the property accounts.
Accounts Affected: Property accounts, inventory and cost of sales.
Conclusion: Overall, the auditor may conclude that inherent risks are moderate to high for the accounts affected. In particular, if management has not clearly disclosed the related party transactions, the auditor needs to investigate whether there are additional related party transactions.

Copyright © 2011 Pearson Canada Inc.
Chapter 10 Integrated Case Application—Pinnacle Manufacturing: Part III Following are control risk matrices and related notes that are used to direct a discussion of the requirements of the case. It should be understood that judgment is a critical element in this case, and accordingly, there often is no single right answer. Computer-prepared matrices using Excel are contained on the Companion Website and on the Instructor’s Resource CD-ROM, which is available upon request. They are essentially the same as the matrices on the next two pages. b. 1. Questions to be asked pertaining to access controls: - which employees have access to which functions in the purchasing and accounts payable information systems? - how many different levels of passwords are there in the information systems? - how are passwords and user identification codes assigned? who approves or checks these? - is physical access to computer equipment restricted? - how frequently are passwords changed? Other questions could be asked, but would focus around the quality of the passwords, the type of access that is provided with the passwords, and whether password systems are monitored. 2. Combined controls are those that require information systems to effectively function. Automated controls are those that pertain only to the information systems. Examples of automated controls that might be present at the company and that potentially could be relied upon (refer to the flowchart included with Pinnacle III): - calculations in the purchase order (quantity times unit price) - additions in the accounts payable master file (previous balance plus additional invoice amounts to result in the new accounts payable balance for a particular vendor) - sorting of transactions to indicate which ones are due for payment - cheque or payment preparation based upon stating which invoices or payments are to be paid Examples of potential combined controls would include: - review of outstanding purchase order list by a competent individual to determine which items should be ordered - review of cash requirements report by a competent individual to determine which invoices should be paid
Copyright © 2011 Pearson Canada Inc.
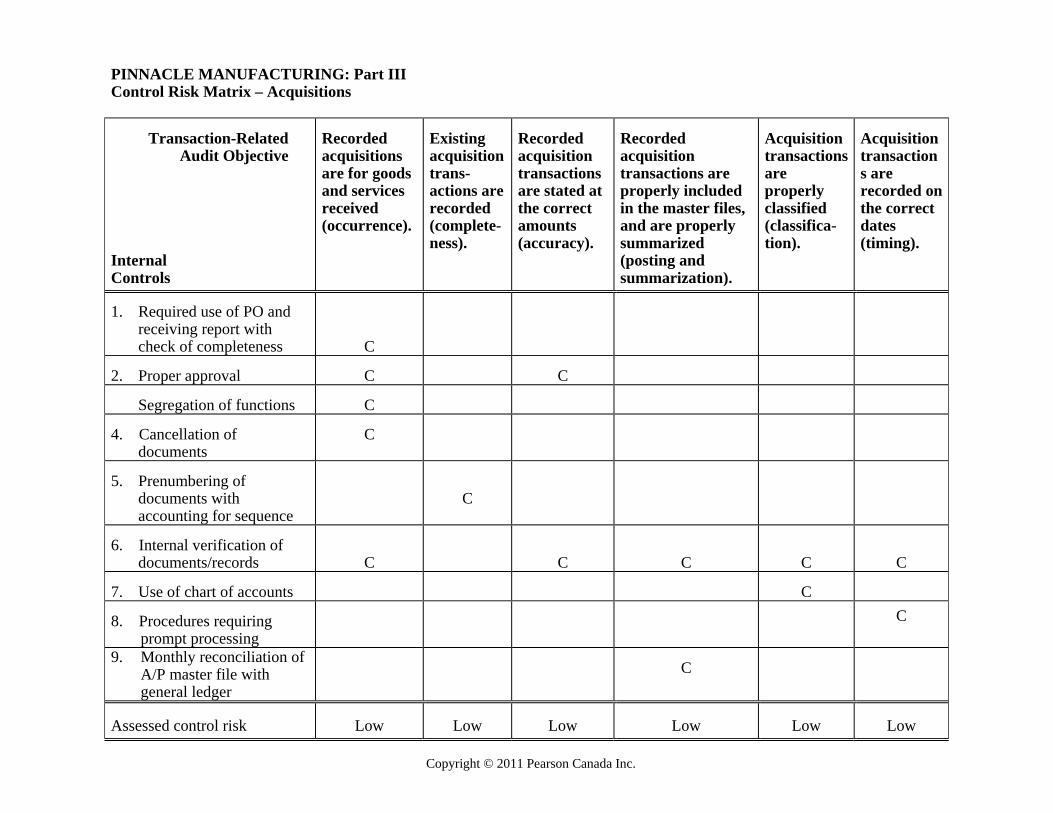
PINNACLE MANUFACTURING: Part III Control Risk Matrix – Acquisitions
Transaction-Related Audit Objective Internal Controls
Recorded acquisitions are for goods and services received (occurrence).
Existing acquisition trans- actions are recorded (complete-ness).
Recorded acquisition transactions are stated at the correct amounts (accuracy).
Recorded acquisition transactions are properly included in the master files, and are properly summarized (posting and summarization).
Acquisition transactions are properly classified (classifica-tion).
Acquisition transactions are recorded on the correct dates (timing).
1. Required use of PO and
receiving report with check of completeness
C
2. Proper approval
C
C
Segregation of functions
C
4. Cancellation of
documents
C
5. Prenumbering of
documents with accounting for sequence
C
6. Internal verification of
documents/records
C
C
C
C
C 7. Use of chart of accounts
C
8. Procedures requiring
prompt processing
C
9. Monthly reconciliation of A/P master file with general ledger
C
Assessed control risk
Low
Low
Low
Low
Low
Low

Copyright © 2011 Pearson Canada Inc.
PINNACLE MANUFACTURING: Part III Control Matrix - Cash Disbursements Transaction-Related Audit Objectives Internal Controls
Recorded cash disbursements are for goods and services actually received (occurrence).
Existing cash disbursement transactions are recorded (complete- ness).
Recorded cash disbursement transactions are stated at the correct amounts (accuracy).
Recorded cash disburse-ment transactions are properly included in the master file and are properly summarized (posting and summarization).
Cash disbursement transactions are properly classified (classification).
Cash disbursement transactions are recorded on the correct dates (timing).
1. Segregation of functions
C
2. Review of support,
signing of checks by authorized person
C
3. Prenumbered checks; accounted for
C
4. Use of chart of accounts
C
5. Procedures for prompt recording
C
6. Monthly reconciliation of A/P master file with G/L
C
Deficiencies 1. Lack of an independent bank
W
W

Copyright © 2011 Pearson Canada Inc.
PINNACLE MANUFACTURING: Part III Control Matrix - Cash Disbursements Transaction-Related Audit Objectives Internal Controls
Recorded cash disbursements are for goods and services actually received (occurrence).
Existing cash disbursement transactions are recorded (complete- ness).
Recorded cash disbursement transactions are stated at the correct amounts (accuracy).
Recorded cash disburse-ment transactions are properly included in the master file and are properly summarized (posting and summarization).
Cash disbursement transactions are properly classified (classification).
Cash disbursement transactions are recorded on the correct dates (timing).
1. Segregation of functions
C
reconciliation (Done by Treasurer) 2. Lack of internal
verification of documentation package by cash disbursements clerk.
W
W
W
3. Lack of internal
verification of key entry into cash disbursements file.
W
W
W
Assessed control risk
Medium
Medium
High
Low
Low
Low
Copyright © 2011 Pearson Canada Inc.
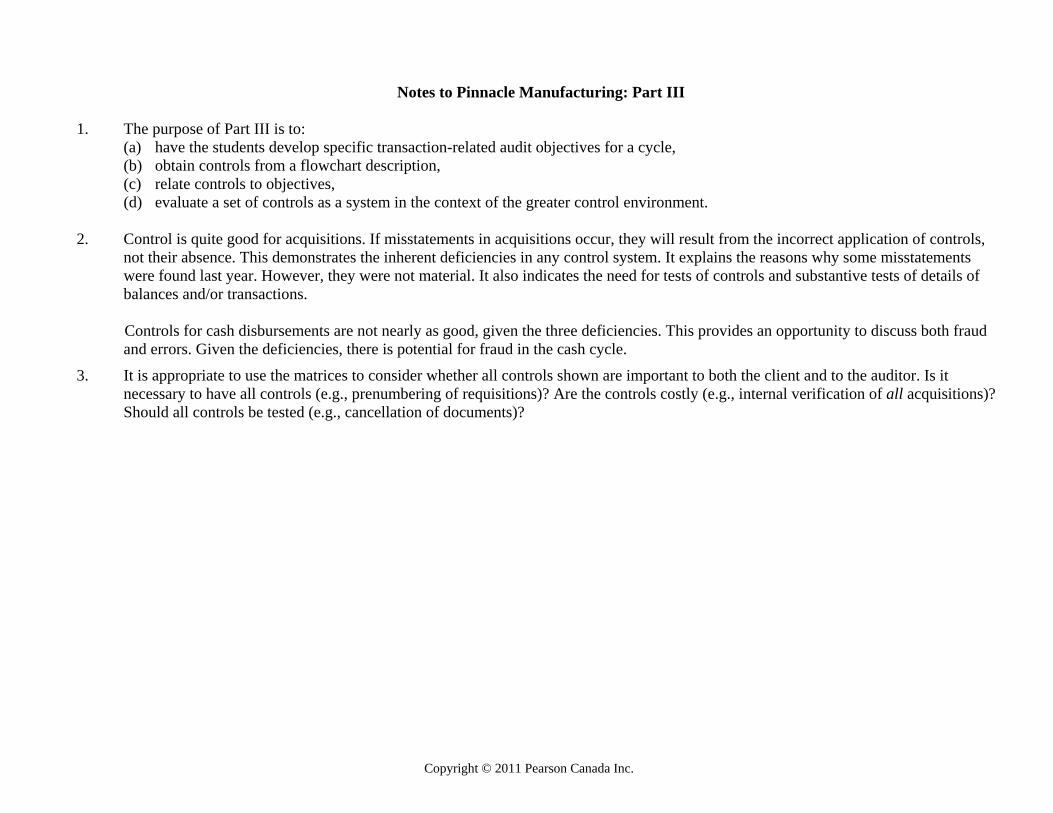
Notes to Pinnacle Manufacturing: Part III
1. The purpose of Part III is to:
(a) have the students develop specific transaction-related audit objectives for a cycle, (b) obtain controls from a flowchart description, (c) relate controls to objectives, (d) evaluate a set of controls as a system in the context of the greater control environment.
2. Control is quite good for acquisitions. If misstatements in acquisitions occur, they will result from the incorrect application of controls, not their absence. This demonstrates the inherent deficiencies in any control system. It explains the reasons why some misstatements were found last year. However, they were not material. It also indicates the need for tests of controls and substantive tests of details of balances and/or transactions.
Controls for cash disbursements are not nearly as good, given the three deficiencies. This provides an opportunity to discuss both fraud and errors. Given the deficiencies, there is potential for fraud in the cash cycle.
3. It is appropriate to use the matrices to consider whether all controls shown are important to both the client and to the auditor. Is it necessary to have all controls (e.g., prenumbering of requisitions)? Are the controls costly (e.g., internal verification of all acquisitions)? Should all controls be tested (e.g., cancellation of documents)?

Copyright © 2011 Pearson Canada Inc.
Chapter 12 Integrated Case Application—Pinnacle Manufacturing: Part IV a., b., and c.
# a. Key Internal Control a. Transaction Related Audit Objectives b. Test of Control c. Substantive Test of Transaction 1. Segregation of the
purchasing, receiving, and cash disbursements functions.
Recorded acquisitions are for goods and services actually received (occurrence).
Recorded cash disbursements are for goods and services actually received (occurrence).
Discuss segregation of duties with personnel and observe activities.
Trace entries in the acquisitions journal to related vendors' invoices, receiving reports, and purchase orders.
2. Independent reconciliation of the monthly bank statements.
Existing cash disbursement transactions are recorded (completeness).
Recorded cash disbursement transactions are stated at the correct amounts (accuracy).
Examine file of completed bank reconciliations.
Reconcile recorded cash disbursements with the cash disbursements on the bank statement (proof of cash disbursements).
3. Use of prenumbered voucher packages, properly accounted for.
Existing acquisition transactions are recorded (completeness).
Account for a sequence of voucher packages.
Trace from a file of vendors' invoices to the acquisitions journal.
4. Use of prenumbered cheques, properly accounted for.
Existing cash disbursement transactions are recorded (completeness).
Account for a sequence of cheques.
Reconcile recorded cash disbursements with the cash disbursements on the bank statement (proof of cash disbursements).
5. Use of prenumbered receiving reports, properly accounted for.
Existing acquisition transactions are recorded (completeness).
Account for a sequence of receiving reports.
Trace from a file of receiving reports to the acquisitions journal.
6. Internal verification of document package before cheque preparation.
Recorded acquisitions are for goods and services actually received (occurrence).
Recorded acquisitions are stated at the correct amounts (accuracy).
Acquisition transactions are properly included in the master files, and are properly summarized (posting and summarization).
Acquisitions are properly classified (classification).
Examine document package for indication of internal verification.
Examine supporting documents for propriety and recompute information on the supporting documents.

Copyright © 2011 Pearson Canada Inc.
Acquisitions are recorded on the correct dates (timing).
7. Review of supporting documents and signing of cheques by an independent, authorized person.
Recorded cash disbursements are for goods and services actually received (occurrence).
Examine cheques for signature.
Trace the cancelled cheque to the related acquisitions journal entry and examine for payee name and amount.
8. Cancellation of documents prior to signing of the cheque.
Recorded acquisitions are for goods and services actually received (occurrence).
Examine indication of cancellation.
Examine the acquisitions journal for duplicate entries to a vendor.
9. Monthly reconciliation of the accounts payable master file with the general ledger.
Acquisition transactions are properly included in the master files, and are properly summarized (posting and summarization).
Cash disbursement transactions are properly included in the master file, and are properly summarized (posting and summarization).
Inquire of client about monthly reconciliation procedures.
Foot acquisitions and cash disbursements journals and trace postings to the general ledger and accounts payable and inventory master files.

Copyright © 2011 Pearson Canada Inc.
d.
Acquisitions Substantive Tests of Transactions Note: More than one audit procedure is listed for certain objectives even though the requirement is for only one procedure.
Transaction-Related Audit Objective
Substantive Audit Procedures
Occurrence Compare prices on vendor invoices with approved price limits established by management. Review the acquisitions journal, general ledger, and accounts payable master file for large or
unusual amounts.
Completeness Trace a sample of receiving reports to the acquisitions journal. Trace from a file of vendors' invoices to the acquisitions journal. Trace from additions in perpetual inventory records to recorded acquisitions.
Accuracy Compare amounts for entries in acquisitions journal to related vendors' invoices, purchase orders and receiving reports.
Recompute information on vendor invoices. Compare prices on vendor invoices with approved price limits established by management.
Posting and Summarization Trace individual entries in accounts payable master file to acquisitions journal. Classification Examine vendors' invoices for proper classification.
Compare classification with chart of accounts by reference to vendors' invoices.
Timing Compare dates of receiving reports and vendors' invoices with dates in the acquisitions journal.
14-25

Copyright © 2011 Pearson Canada Inc.
e.
Cash Disbursements Substantive Tests of Transactions Note: More than one audit procedure is listed for certain objectives even though the requirement is for only one procedure.
Transaction-Related Audit Objective
Substantive Audit Procedures
Occurrence Trace cancelled cheque numbers in the cash disbursements journal to related cancelled cheques and examine for payee, name, and amount.
Examine cancelled cheque for authorized signature, proper endorsement, and cancellation by the bank.
Review the cash disbursements journal, general ledger, and accounts payable master file for large or unusual amounts.
Trace cancelled cheque to the related acquisitions journal entry and examine for payee name and amount.
Completeness Trace entries in acquisitions journal to subsequent payment in cash disbursements journal.
Accuracy Compare cancelled cheques with the related acquisitions journal and cash disbursements journal
entries. Recompute cash discounts.
Posting and Summarization Trace individual entries in accounts payable master file to cash disbursements journal.
Classification Compare classification with chart of accounts by reference to vendors' invoices and acquisitions journal.
Timing Compare dates on cancelled cheques with cash disbursements journal.
Compare dates on cancelled cheques with the bank cancellation date.
14-26
Copyright © 2011 Pearson Canada Inc.
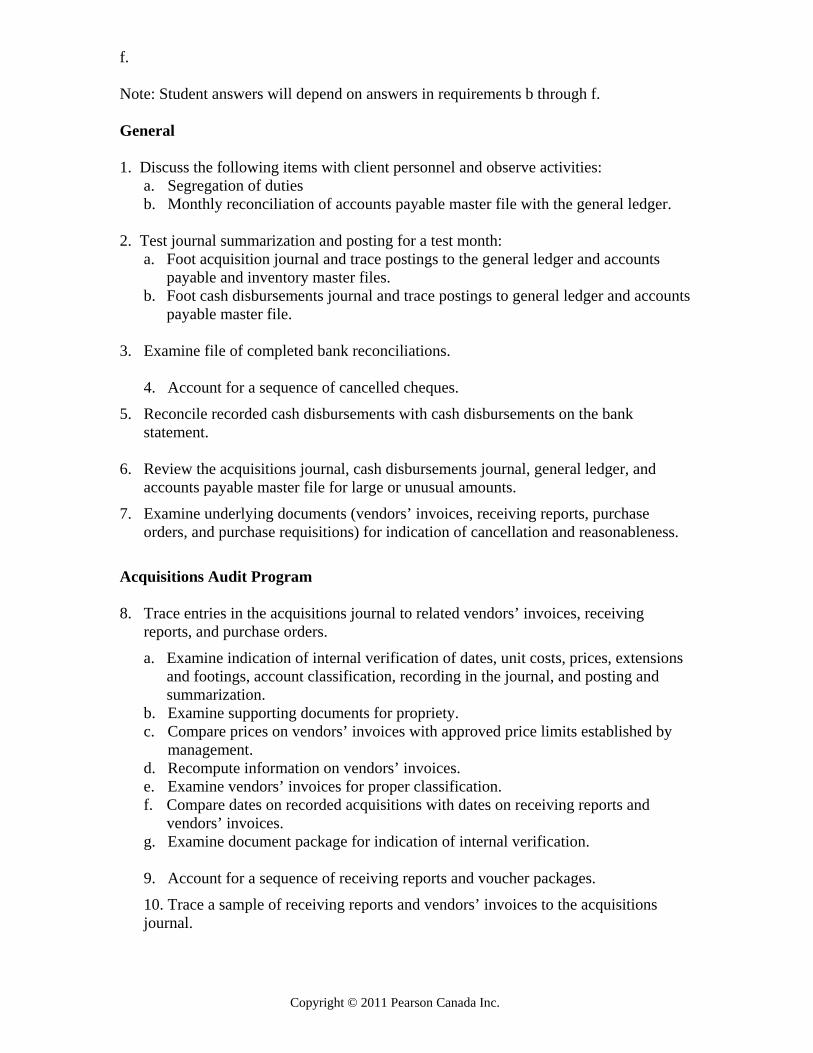
f. Note: Student answers will depend on answers in requirements b through f. General 1. Discuss the following items with client personnel and observe activities:
a. Segregation of duties b. Monthly reconciliation of accounts payable master file with the general ledger.
2. Test journal summarization and posting for a test month: a. Foot acquisition journal and trace postings to the general ledger and accounts
payable and inventory master files. b. Foot cash disbursements journal and trace postings to general ledger and accounts
payable master file. 3. Examine file of completed bank reconciliations.
4. Account for a sequence of cancelled cheques.
5. Reconcile recorded cash disbursements with cash disbursements on the bank statement.
6. Review the acquisitions journal, cash disbursements journal, general ledger, and
accounts payable master file for large or unusual amounts.
7. Examine underlying documents (vendors’ invoices, receiving reports, purchase orders, and purchase requisitions) for indication of cancellation and reasonableness.
Acquisitions Audit Program 8. Trace entries in the acquisitions journal to related vendors’ invoices, receiving
reports, and purchase orders.
a. Examine indication of internal verification of dates, unit costs, prices, extensions and footings, account classification, recording in the journal, and posting and summarization.
b. Examine supporting documents for propriety. c. Compare prices on vendors’ invoices with approved price limits established by
management. d. Recompute information on vendors’ invoices. e. Examine vendors’ invoices for proper classification. f. Compare dates on recorded acquisitions with dates on receiving reports and
vendors’ invoices. g. Examine document package for indication of internal verification. 9. Account for a sequence of receiving reports and voucher packages.
10. Trace a sample of receiving reports and vendors’ invoices to the acquisitions journal.

Copyright © 2011 Pearson Canada Inc.
Cash Disbursements
11. Select a sample of cancelled cheques and:
a. Trace cancelled cheque to the related cash disbursements journal entry and acquisitions journal entry and examine for payee, name, amount, and date.
b. Examine cheque for signature, proper endorsement, and cancellation by the bank. c. Compare date on cancelled cheque with bank cancellation date. d. Recompute cash discounts.

Copyright © 2011 Pearson Canada Inc.
Chapter 13 Integrated Case Application—Pinnacle Manufacturing: Part V a. Two assertions are listed as having a high risk of material misstatement. The student is asked to identify the risk – i.e. what could go wrong, with each of these assertions. Completeness: 1. Some cash disbursements transactions might not be recorded. Practically, this means that either unauthorized payments might be made, duplicate payments might be made for the same invoice (and not recorded), or other forms of unauthorized payments could be made. 2. Some acquisitions transactions might not be recorded. This could mean that a purchase order or an invoice is not recorded. If a purchase order is not recorded, then purchases could be initiated without proper tracking, resulting in the order of goods that the company does not need, or for personal purposes. If an invoice is not recorded, it is likely that the supplier will request payment by sending an additional invoice when payment is late. Timing or Cut-off: 1. Some cash disbursements transactions may be recorded in the incorrect period. Given the potential for violating a debt covenant, management may be inclined to want to overstate cash, so the bias would be that cash disbursements could actually be for the current year but recorded in the subsequent year. 2. Some acquisitions transactions may be recorded in the incorrect period. In line with the above bias, management might want to understate expenses for the current year, overstating income. This means that invoices could be received but recorded in the subsequent year rather than in the current year.

Copyright © 2011 Pearson Canada Inc.
b. Audit step Sampling
applies? Reason sampling applies or does not apply
Type of sampling to be used
Reason for type of sampling selected
1. Discuss the following items with client personnel and observe activities:
1.1 Segregation of duties 1.2 Use of an adequate chart of accounts 1.3 Monthly reconciliation of accounts payable master file with general ledger balance in accounts payable
No Discussion deals with asking about procedures, and occurs once. Observation is done at a point in time, and is not normally sampled.
N/A
2. Foot acquisitions and cash disbursements journals for a test month and trace postings to the general ledger.
Yes The auditor needs to select the month that will be used for the audit test.
Haphazard The auditor will use professional judgment to select one of the twelve months of the year for the sample.
3. Examine file of completed bank reconciliations.
No The auditor will be looking at all of the bank reconciliations.
N/A
4. Account for a sequence of 100 cancelled cheques.
Yes The auditor must select which 100 cancelled cheques will be accounted for.
Block sample combined with haphazard
The auditor will use professional judgment to decide which 100 cheques to track (the haphazard portion), while the actual 100 cheques constitute the block sample.
5. Reconcile recorded cash disbursements with cash disbursements on the bank statement for a test month.
Yes The auditor needs to select the month that will be used for the audit test.
Haphazard The auditor will use professional judgment to select one of the twelve months of the year for the sample.
6. Trace entries in the acquisitions transaction file to related vendors' invoices, receiving reports, and
Yes If the auditor intends to rely upon the controls that affect these actions, then transactions covering the entire period of audit (normally a year) need to be examined.
Attribute sampling or MUS (monetary unit sampling) if dual-purpose tests are considered
Attribute sampling applies to non-dollar tests (such as examining internal verification), while the MUS will allow the auditor to better quantify the potential

Copyright © 2011 Pearson Canada Inc.
purchase orders. Note that this row applies to audit steps 6 and 6.1 to 6.7
effect of errors. The auditor will likely pick one sample using MUS and apply the entire list of audit tests.
7. Account for a sequence of purchase orders and voucher document packages.
Yes The auditor must select how many and which blocks of purchase orders and voucher document packages will be accounted for.
Block sample combined with haphazard
The auditor will use professional judgment to decide how many documents to track (the haphazard portion), while the actual transactions constitute the block sample.
8. Trace a sample of receiving reports to the acquisitions journal.
Yes If the auditor intends to rely upon the controls that affect these actions, then transactions covering the entire period of audit (normally a year) need to be examined.
Attribute sampling
Attribute sampling applies to non-dollar tests (such as tracing the receiving quantities and details) to the purchase records
9. Select a sample of cancelled cheques and conduct audit steps 9.1 to 9.4
Yes If the auditor intends to rely upon the controls that affect these actions, then transactions covering the entire period of audit (normally a year) need to be examined.
Attribute sampling or MUS (monetary unit sampling) if dual-purpose tests are considered
Attribute sampling applies to non-dollar tests (such as examining cheque for signature and endorsement) while the MUS will allow the auditor to better quantify the potential effect of errors. The auditor will likely pick one sample using MUS and apply the entire list of audit tests.
c. Audit Step Potential error or exception
10. Foot acquisitions and cash disbursements journals for a test month and trace postings to the general ledger.
- adding the acquisitions and cash disbursements could result in a different amount than listed in those journals - the total in the journals disagrees with the posting in the general ledger for that period
11. Account for a sequence of 100 cancelled cheques.
- one or more cheques is missing from the sequence - one or more cheque numbers is duplicated (used more than once)
12. Reconcile recorded cash disbursements with cash disbursements on the bank statement for a test month.
- recorded cash disbursements disagree with the bank statement - there are amounts on the cash disbursements listing that are not on the bank statement or vice versa
6.1 Examine indication of internal verification of dates, unit costs, prices, extensions and footings, account classifications, recording in the
- indication of internal verification is absent on the selected invoices

Copyright © 2011 Pearson Canada Inc.
transaction file, and posting and summarization. 6.2 Examine supporting documents for propriety.
- payments are made and there are no supporting documents - supporting documents disagree with the payment amount - supporting documents do not provide valid support for the payment
6.3 Compare prices on vendors' invoices with approved price limits established by management.
- prices on vendors’ invoices exceed approved price limits established by management
6.4 Recompute information on vendors' invoices.
- there are calculation errors on vendors’ invoices that were not detected
6.5 Examine vendors' invoices for proper account classification.
- vendors’ invoices were allocated to the incorrect general ledger accounts
6.6 Compare dates of recorded acquisitions with dates on receiving reports.
- dates of recorded acquisitions are not the same as the receiving reports
6.7 Examine voucher document package for indication of internal verification.
- indication of internal verification is absent on the selected voucher packages
13. Account for a sequence of purchase orders and voucher document packages.
- one or more purchase orders is missing from the sequence - one or more purchase order numbers is duplicated (used more than once) - one or more voucher numbers is missing from the sequence - one or more voucher numbers is duplicated (used more than once)
9.1 Trace the cancelled cheque to the related cash disbursements journal entry and date.
- cheque amounts disagree with the bank cash disbursements amounts or the date is different - there are cheques present that are not on the cash disbursements listing or cheques are duplicated on the cash disbursements listing
9.2 Examine cheque for signature, authorized endorsement, and cancellation by the bank.
- cheques are signed by individuals who are not authorized to sign cheques - endorsements on the back of the cheque do not match the payee - cheques have multiple endorsements - cheques are not stamped by the bank as cancelled
9.3 Compare date on cancelled cheque with bank cancellation date.
- there is a large time lag between the date of the cheque and the bank cancellation date
9.4 Recompute cash discounts. - discounts were not taken when they were entitled to take discounts - the discount amount is incorrect