Solution Combustion Synthesis of Fe2O3-Based Catalyst for ...
11
catalysts Article Solution Combustion Synthesis of Fe 2 O 3 -Based Catalyst for Ammonia Synthesis Binxiang Cai, Huazhang Liu and Wenfeng Han * Institute of Industrial Catalysis, Zhejiang University of Technology, Hangzhou 310014, China; [email protected] (B.C.); [email protected] (H.L.) * Correspondence: [email protected]; Tel.: +86-571-8832-0063 Received: 23 June 2020; Accepted: 2 September 2020; Published: 7 September 2020 Abstract: Fe 2 O 3 -based catalysts were prepared by solution combustion synthesis (SCS) with metal nitrates (Fe, K, Al, Ca) as the precursors and glycine as the fuel. The activities of catalysts were evaluated in terms of ammonia synthesis reaction rate in a fixed bed reactor similar to the industrial reactors. The results indicate that the precursor of catalyst prepared by SCS is Fe 2 O 3 which facilitates the high dispersion of promoters to provide high activity. The catalysts exhibit higher activity for ammonia synthesis than that of traditional catalysts, and the reaction rate reaches 138.5 mmol g -1 h -1 . Fe 2 O 3 prepared by SCS could be favorable precursor for ammonia synthesis catalyst. The present study provides a pathway to prepare catalyst for ammonia synthesis. Keywords: ammonia synthesis; catalyst; Fe 2 O 3 ; solution combustion synthesis 1. Introduction The development of a commercial catalytic process for ammonia synthesis was one of the most significant technological breakthroughs of the 20th century [1]. However, ammonia synthesis via Haber-Bosch process is an energy intensive industry as it requires high operating temperatures (400–500 ◦ C) and high pressures (15–30 MPa) over iron (Fe 3 O 4 or Fe 1-x O) catalysts [1]. Energy saving and emission reduction is the eternal theme of the ammonia synthesis industry, and its core technology is the ammonia synthesis catalyst. Therefore, it is important to search for new and more efficient catalysts for ammonia synthesis. The molten iron catalyst uses iron oxide as a precursor, and iron oxides have three forms, namely Fe 2 O 3 , Fe 3 O 4 , and FeO. The traditional iron catalysts with Fe 3 O 4 as precursor have been widely studied for more than 100 years. By the end of the 1970s, this catalyst was considered to be well consolidated and no special improvement was still expected, forcing people to look for new technological breakthroughs of the jumping type [2]. A new type of wustite-based catalysts (WBC) was discovered by Liu et al. in 1986 [3,4]. WBC is the first significant innovation in the industrial iron-based catalyst for ammonia synthesis after the development of catalysts for the Haber–Bosch process in 1910. Much higher activity and a lower reaction temperature than the traditional magnetite-based catalysts (MBC) were achieved [5]. It was shown that the reaction rate of the new catalyst is 70–90% higher than that of the traditional one. So, WBC appears to be competitive with Ru/C. This is a high energy consumption process for preparing iron catalysts by the melting method. The Fe 1-x O catalyst has been used commercially for many years, but it seems to have encountered a bottleneck in its research. It is very difficult for the Fe 1-x O catalyst to select and optimize the promoters. Fe 2 O 3 will decompose under high temperature melting conditions: 3Fe 2 O 3 = 2Fe 3 O 4 + 0.5O 2 . It cannot be prepared by melting method. Fe 2 O 3 -based ammonia synthesis catalysts prepared by the precipitation method have been reported in many studies, but their activity is the lower than that of Catalysts 2020, 10, 1027; doi:10.3390/catal10091027 www.mdpi.com/journal/catalysts
Transcript of Solution Combustion Synthesis of Fe2O3-Based Catalyst for ...
catalysts
Article
Solution Combustion Synthesis of Fe2O3-BasedCatalyst for Ammonia Synthesis
Binxiang Cai, Huazhang Liu and Wenfeng Han *
Institute of Industrial Catalysis, Zhejiang University of Technology, Hangzhou 310014, China;[email protected] (B.C.); [email protected] (H.L.)* Correspondence: [email protected]; Tel.: +86-571-8832-0063
Received: 23 June 2020; Accepted: 2 September 2020; Published: 7 September 2020�����������������
Abstract: Fe2O3-based catalysts were prepared by solution combustion synthesis (SCS) with metalnitrates (Fe, K, Al, Ca) as the precursors and glycine as the fuel. The activities of catalysts wereevaluated in terms of ammonia synthesis reaction rate in a fixed bed reactor similar to the industrialreactors. The results indicate that the precursor of catalyst prepared by SCS is Fe2O3 which facilitatesthe high dispersion of promoters to provide high activity. The catalysts exhibit higher activity forammonia synthesis than that of traditional catalysts, and the reaction rate reaches 138.5 mmol g−1 h−1.Fe2O3 prepared by SCS could be favorable precursor for ammonia synthesis catalyst. The presentstudy provides a pathway to prepare catalyst for ammonia synthesis.
Keywords: ammonia synthesis; catalyst; Fe2O3; solution combustion synthesis
1. Introduction
The development of a commercial catalytic process for ammonia synthesis was one of the mostsignificant technological breakthroughs of the 20th century [1]. However, ammonia synthesis viaHaber-Bosch process is an energy intensive industry as it requires high operating temperatures(400–500 ◦C) and high pressures (15–30 MPa) over iron (Fe3O4 or Fe1−xO) catalysts [1]. Energy savingand emission reduction is the eternal theme of the ammonia synthesis industry, and its core technologyis the ammonia synthesis catalyst. Therefore, it is important to search for new and more efficientcatalysts for ammonia synthesis.
The molten iron catalyst uses iron oxide as a precursor, and iron oxides have three forms, namelyFe2O3, Fe3O4, and FeO. The traditional iron catalysts with Fe3O4 as precursor have been widely studiedfor more than 100 years. By the end of the 1970s, this catalyst was considered to be well consolidated andno special improvement was still expected, forcing people to look for new technological breakthroughsof the jumping type [2].
A new type of wustite-based catalysts (WBC) was discovered by Liu et al. in 1986 [3,4]. WBC isthe first significant innovation in the industrial iron-based catalyst for ammonia synthesis after thedevelopment of catalysts for the Haber–Bosch process in 1910. Much higher activity and a lowerreaction temperature than the traditional magnetite-based catalysts (MBC) were achieved [5]. It wasshown that the reaction rate of the new catalyst is 70–90% higher than that of the traditional one. So,WBC appears to be competitive with Ru/C. This is a high energy consumption process for preparingiron catalysts by the melting method. The Fe1−xO catalyst has been used commercially for many years,but it seems to have encountered a bottleneck in its research. It is very difficult for the Fe1−xO catalystto select and optimize the promoters.
Fe2O3 will decompose under high temperature melting conditions: 3Fe2O3 = 2Fe3O4 + 0.5O2.It cannot be prepared by melting method. Fe2O3-based ammonia synthesis catalysts prepared by theprecipitation method have been reported in many studies, but their activity is the lower than that of
Catalysts 2020, 10, 1027; doi:10.3390/catal10091027 www.mdpi.com/journal/catalysts
Catalysts 2020, 10, 1027 2 of 11
Fe3O4-based catalysts. The preparation of Fe2O3-based catalysts by solution combustion synthesis(SCS) has been rarely reported.
Solution combustion synthesis (SCS) was reported as an efficient method for the preparation ofnanomaterials [6]. Actually, SCS is allowed for the production of nanosized, homogeneous crystallinepowders without the risk of contamination and is environmentally friendly since the byproductsof the synthesis are CO2, NO2, and H2O. In addition, the yield is high (95%) [7]. During SCS,fuel plays a major role in the formation of nanomaterials. Fuel usually forms complexes with themetal ions facilitating the homogeneous mixing of the metal ions in solution. The SCS yields nano-sizeoxide materials as either volume or layer-by-layer propagating combustion modes depending on thetype of the precursors, as well as the conditions used for the process organization [8–10]. We haveprepared Cr2O3 nanoparticles by SCS which exhibited high performance for dehydrofluorination of1,1,1,3,3-Pentafluoropropane to 1,3,3,3-Tetrafluoropropene [11].
In the present work, we propose that Fe2O3 is also an efficient precursor of the catalyst for ammoniasynthesis. In addition, the effect of the glycine/Fe ratio on the structural-microstructural-morphologicalproperties and on the distribution of promoters of the Fe2O3 prepared by SCS was investigated.The performance of Fe2O3-based catalysts was compared with the WBC catalyst prepared by themelting method.
2. Results and Discussion
2.1. Morphology and Phase Structure of Catalysts
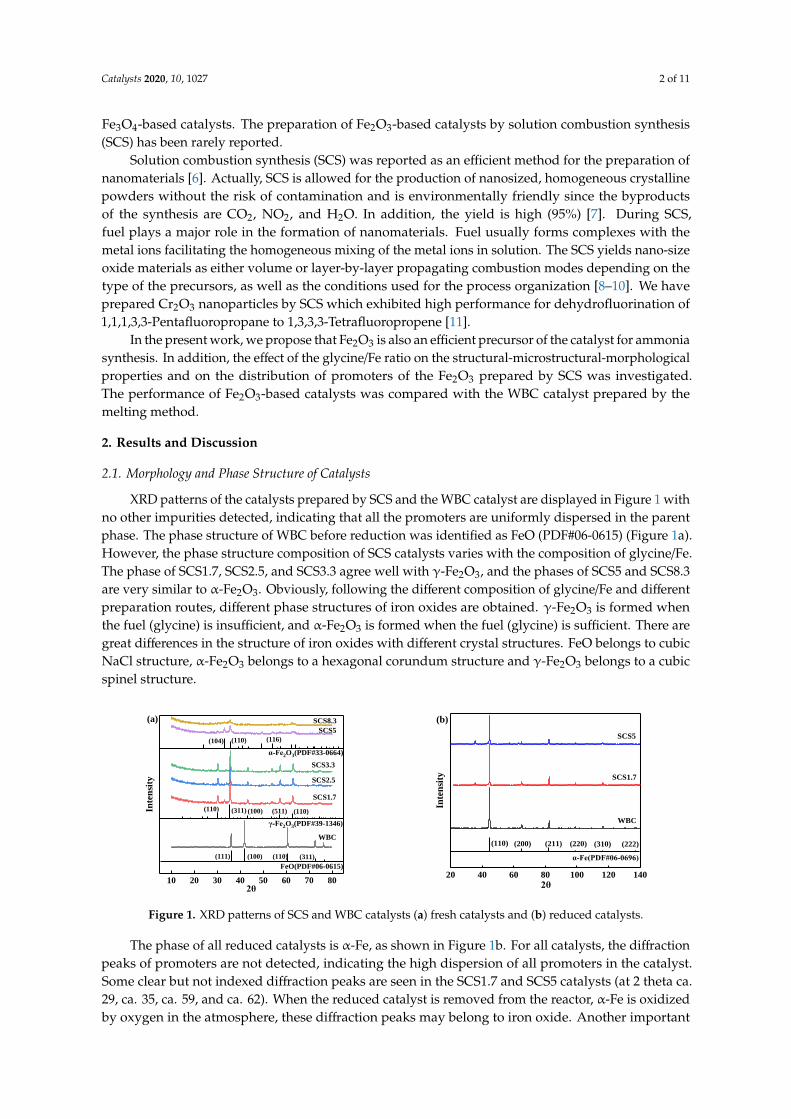
XRD patterns of the catalysts prepared by SCS and the WBC catalyst are displayed in Figure 1 withno other impurities detected, indicating that all the promoters are uniformly dispersed in the parentphase. The phase structure of WBC before reduction was identified as FeO (PDF#06-0615) (Figure 1a).However, the phase structure composition of SCS catalysts varies with the composition of glycine/Fe.The phase of SCS1.7, SCS2.5, and SCS3.3 agree well with γ-Fe2O3, and the phases of SCS5 and SCS8.3are very similar to α-Fe2O3. Obviously, following the different composition of glycine/Fe and differentpreparation routes, different phase structures of iron oxides are obtained. γ-Fe2O3 is formed whenthe fuel (glycine) is insufficient, and α-Fe2O3 is formed when the fuel (glycine) is sufficient. There aregreat differences in the structure of iron oxides with different crystal structures. FeO belongs to cubicNaCl structure, α-Fe2O3 belongs to a hexagonal corundum structure and γ-Fe2O3 belongs to a cubicspinel structure.
Catalysts 2020, 10, x FOR PEER REVIEW 2 of 12
Fe3O4-based catalysts. The preparation of Fe2O3-based catalysts by solution combustion synthesis
(SCS) has been rarely reported.
Solution combustion synthesis (SCS) was reported as an efficient method for the preparation of
nanomaterials [6]. Actually, SCS is allowed for the production of nanosized, homogeneous crystalline
powders without the risk of contamination and is environmentally friendly since the byproducts of
the synthesis are CO2, NO2, and H2O. In addition, the yield is high (95%) [7]. During SCS, fuel plays
a major role in the formation of nanomaterials. Fuel usually forms complexes with the metal ions
facilitating the homogeneous mixing of the metal ions in solution. The SCS yields nano-size oxide
materials as either volume or layer-by-layer propagating combustion modes depending on the type
of the precursors, as well as the conditions used for the process organization [8–10]. We have
prepared Cr2O3 nanoparticles by SCS which exhibited high performance for dehydrofluorination of
1,1,1,3,3-Pentafluoropropane to 1,3,3,3-Tetrafluoropropene [11].
In the present work, we propose that Fe2O3 is also an efficient precursor of the catalyst for
ammonia synthesis. In addition, the effect of the glycine/Fe ratio on the structural-microstructural-
morphological properties and on the distribution of promoters of the Fe2O3 prepared by SCS was
investigated. The performance of Fe2O3-based catalysts was compared with the WBC catalyst
prepared by the melting method.
2. Results and Discussion
2.1. Morphology and Phase Structure of Catalysts
XRD patterns of the catalysts prepared by SCS and the WBC catalyst are displayed in Figure 1
with no other impurities detected, indicating that all the promoters are uniformly dispersed in the
parent phase. The phase structure of WBC before reduction was identified as FeO (PDF#06-0615)
(Figure 1a). However, the phase structure composition of SCS catalysts varies with the composition
of glycine/Fe. The phase of SCS1.7, SCS2.5, and SCS3.3 agree well with γ-Fe2O3, and the phases of
SCS5 and SCS8.3 are very similar to α-Fe2O3. Obviously, following the different composition of
glycine/Fe and different preparation routes, different phase structures of iron oxides are obtained. γ-
Fe2O3 is formed when the fuel (glycine) is insufficient, and α-Fe2O3 is formed when the fuel (glycine)
is sufficient. There are great differences in the structure of iron oxides with different crystal structures.
FeO belongs to cubic NaCl structure, α-Fe2O3 belongs to a hexagonal corundum structure and γ-Fe2O3
belongs to a cubic spinel structure.
The phase of all reduced catalysts is α-Fe, as shown in Figure 1b. For all catalysts, the diffraction
peaks of promoters are not detected, indicating the high dispersion of all promoters in the catalyst.
Some clear but not indexed diffraction peaks are seen in the SCS1.7 and SCS5 catalysts (at 2 theta ca.
29, ca. 35, ca. 59, and ca. 62). When the reduced catalyst is removed from the reactor, α-Fe is oxidized
by oxygen in the atmosphere, these diffraction peaks may belong to iron oxide. Another important
effect observed in Figure 1 is that the intensity of the XRD peaks decreases gradually with glycine/Fe
ratio. This might be due to an increase of the microstrain and/or to a decrease of the crystal size.
Figure 1. XRD patterns of SCS and WBC catalysts (a) fresh catalysts and (b) reduced catalysts.
10 20 30 40 50 60 70 80
Inte
nsi
ty
2θ
FeO(PDF#06-0615)
SCS5
SCS3.3
SCS2.5
SCS1.7
WBC
(116)(110)(104)
(110)(511)(100)(311)(110)
(311)(110)(100)
γ-Fe2O3(PDF#39-1346)
α-Fe2O3(PDF#33-0664)
(111)
(a) SCS8.3
20 40 60 80 100 120 140
Inte
nsi
ty
2θ
α-Fe(PDF#06-0696)
SCS5
SCS1.7
WBC
(222)(310)(220)(211)(200)(110)
(b)
Figure 1. XRD patterns of SCS and WBC catalysts (a) fresh catalysts and (b) reduced catalysts.
The phase of all reduced catalysts is α-Fe, as shown in Figure 1b. For all catalysts, the diffractionpeaks of promoters are not detected, indicating the high dispersion of all promoters in the catalyst.Some clear but not indexed diffraction peaks are seen in the SCS1.7 and SCS5 catalysts (at 2 theta ca.29, ca. 35, ca. 59, and ca. 62). When the reduced catalyst is removed from the reactor, α-Fe is oxidizedby oxygen in the atmosphere, these diffraction peaks may belong to iron oxide. Another important

Catalysts 2020, 10, 1027 3 of 11
effect observed in Figure 1 is that the intensity of the XRD peaks decreases gradually with glycine/Feratio. This might be due to an increase of the microstrain and/or to a decrease of the crystal size.
The crystal size of the catalysts was calculated by Scherer formula as shown in Tables 1 and 2.The crystal size of fresh catalysts is displayed in Table 1. As listed in Table 1, the average crystal size ofSCS5 and SCS8.3 catalysts is 16.3 nm and 16.0 nm, respectively. The average crystal size of WBC isaround 26.9 nm, which is much larger than the SCS.
Table 1. Crystal size of fresh catalysts.
CatalystCrystal Size /nm
D100(FeO) D110(FeO) D110(γ-Fe2O3) D311(γ-Fe2O3) D104(α-Fe2O3) D110(α-Fe2O3)
WBC 28.0 25.7 – – – –SCS1.7 – – 13.9 18.4 – –SCS5 – – – – 18.6 14.0
SCS8.3 – – – – 16.2 15.8
Table 2. Crystal size of reduced catalysts.
CatalystCrystal Size /nm Ratios
D110 D200 D211 D220 D310 D222 D211/ D110
WBC 22.7 15.2 37.2 55.5 45.6 39.5 1.64SCS1.7 33.7 27.2 28.3 32.0 29.0 40.9 0.84SCS5 14.6 20.4 19.8 23.1 17.9 14.2 1.36
The ammonia synthesis reaction is a typical structure sensitive reaction. The catalytic activity isclosely related to particle size, crystal morphology and crystal plane index. It is well accepted that theorder of catalytic activity for ammonia synthesis on the crystal face of α-Fe follows (111) > (211) > (100)> (210) > (110) [12]. Among them, the catalytic activity of the (111) face is 400 times higher than that of(110) face. However, the (111) crystal plane cannot be detected by XRD. Consequently, a (211) crystalplane is adopted to correlate the performance.
Table 2 showed the crystal size in the reduced catalysts calculated by Scherer formula. Clearly,the crystal size of SCS5 catalyst is smallest in all catalysts. In addition, to elaborate the relationshipbetween reaction rate and crystal face growth of catalysts, the ratio of crystal sizes of D211 and D110
which represents the crystal face have the highest and minimum activity, respectively, and is listed inTable 2. The ratio of D211/ D110 in WBC catalyst is the biggest, and this means the best growth of (211)crystal faces. The ratio of crystal sizes is proportional to the activity of the catalyst.
2.2. Textural and Microstructural Properties of Catalysts
N2 physical adsorption experiments were carried out to illustrate the specific surface area,and porosity of reduced catalysts. Table 3 shows the specific surface area, pore volume, and pore sizeof catalysts which were prepared by SCS with the different composition of glycine/Fe as well as WBCcatalyst prepared by a traditional melting method. Clearly, the specific surface areas of the catalystsprepared by SCS reach 21.9 m2 g−1, which is significantly higher than that of WBC. After the hightemperature melting, the WBC catalyst goes into a rapid cooling process and forms a dense solid,which leads to low surface area of the WBC catalyst. As indicated in Figure 2a, all catalysts show atype IV adsorption–desorption isotherm with an evident H3-Type hysteresis loop which suggests anirregular pore structure, implying that the catalysts are slit structure materials [13,14]. The distributionof pore size is plotted in Figure 2b. The most probable pore size is shown in Table 3.
Catalysts 2020, 10, 1027 4 of 11
Table 3. The N2 physical adsorption results of the catalysts prepared by SCS and WBC catalyst.
Catalysts (Reduced) SBET (m2.g−1) Vpore (ccg−1) PD (nm)
WBC 4.9 0.05 30.7SCS1.7 16.2 0.10 17.3SCS5 16.4 0.02 59.2
SCS8.3 21.9 0.02 59.7
Catalysts 2020, 10, x FOR PEER REVIEW 4 of 12
Table 3. The N2 physical adsorption results of the catalysts prepared by SCS and WBC catalyst.
Catalysts (Reduced) SBET (m2.g−1) Vpore (ccg−1) PD (nm)
WBC 4.9 0.05 30.7
SCS1.7 16.2 0.10 17.3
SCS5 16.4 0.02 59.2
SCS8.3 21.9 0.02 59.7
Figure 2. N2 physical adsorption results for (SCS) and WBC catalyst. (a) The isotherms of N2
adsorption-desorption and (b) BJH pore size distribution curves.
The morphology of fresh catalysts was characterized by the scanning electron microscopy
technique (SEM) and the results are displayed in Figure 3. The fresh WBC catalysts are in the form of
a large, grained, and dense solid. By contrast, SCS catalysts exhibit granular structure. Following the
increase in glycine/Fe, the particle size decreases for SCS catalysts. With the ratio of SCS1.7
(glycine/Fe of 1.7), it formed relatively large particles and the particle size is between 500 nm and
1000 nm. This result is ascribed to the insufficient fuel [15]. According to the chemical equation, the
stoichiometric ratio of the SCS1.7 is C2H5NO2/ Fe (NO3)3·9H2O of 1.8. SCS5 and SCS8.3 catalysts
possess the particle sizes of 100 nm to 500 nm [16]. It should be noted that a large amount of gas was
produced during the SCS in a very short time [16–18]. The coarse surface and fine particles prepared
by SCS are attributed to the flushing of gases during SCS.
Figure 3. SEM images of the fresh glycine/Fe (SCS) and WBC catalyst.
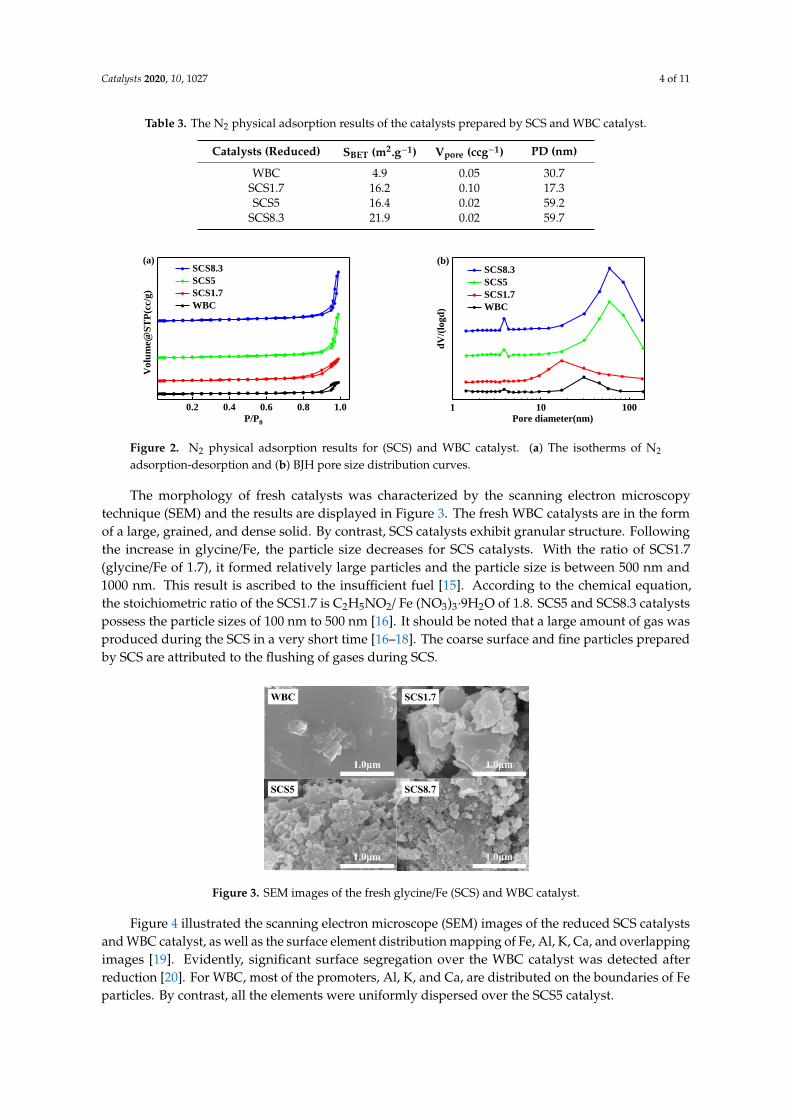
Figure 4 illustrated the scanning electron microscope (SEM) images of the reduced SCS catalysts
and WBC catalyst, as well as the surface element distribution mapping of Fe, Al, K, Ca, and
overlapping images [19]. Evidently, significant surface segregation over the WBC catalyst was
detected after reduction [20]. For WBC, most of the promoters, Al, K, and Ca, are distributed on the
boundaries of Fe particles. By contrast, all the elements were uniformly dispersed over the SCS5
catalyst.
0.2 0.4 0.6 0.8 1.0
Vo
lum
e@S
TP
(cc/
g)
P/P0
SCS8.3
SCS5
SCS1.7
WBC
(a)
1 10 100
dV
/(lo
gd
)
Pore diameter(nm)
SCS8.3
SCS5
SCS1.7
WBC
(b)
Figure 2. N2 physical adsorption results for (SCS) and WBC catalyst. (a) The isotherms of N2
adsorption-desorption and (b) BJH pore size distribution curves.
The morphology of fresh catalysts was characterized by the scanning electron microscopytechnique (SEM) and the results are displayed in Figure 3. The fresh WBC catalysts are in the formof a large, grained, and dense solid. By contrast, SCS catalysts exhibit granular structure. Followingthe increase in glycine/Fe, the particle size decreases for SCS catalysts. With the ratio of SCS1.7(glycine/Fe of 1.7), it formed relatively large particles and the particle size is between 500 nm and1000 nm. This result is ascribed to the insufficient fuel [15]. According to the chemical equation,the stoichiometric ratio of the SCS1.7 is C2H5NO2/ Fe (NO3)3·9H2O of 1.8. SCS5 and SCS8.3 catalystspossess the particle sizes of 100 nm to 500 nm [16]. It should be noted that a large amount of gas wasproduced during the SCS in a very short time [16–18]. The coarse surface and fine particles preparedby SCS are attributed to the flushing of gases during SCS.
Catalysts 2020, 10, x FOR PEER REVIEW 4 of 12
Table 3. The N2 physical adsorption results of the catalysts prepared by SCS and WBC catalyst.
Catalysts (Reduced) SBET (m2.g−1) Vpore (ccg−1) PD (nm)
WBC 4.9 0.05 30.7
SCS1.7 16.2 0.10 17.3
SCS5 16.4 0.02 59.2
SCS8.3 21.9 0.02 59.7
Figure 2. N2 physical adsorption results for (SCS) and WBC catalyst. (a) The isotherms of N2
adsorption-desorption and (b) BJH pore size distribution curves.
The morphology of fresh catalysts was characterized by the scanning electron microscopy
technique (SEM) and the results are displayed in Figure 3. The fresh WBC catalysts are in the form of
a large, grained, and dense solid. By contrast, SCS catalysts exhibit granular structure. Following the
increase in glycine/Fe, the particle size decreases for SCS catalysts. With the ratio of SCS1.7
(glycine/Fe of 1.7), it formed relatively large particles and the particle size is between 500 nm and
1000 nm. This result is ascribed to the insufficient fuel [15]. According to the chemical equation, the
stoichiometric ratio of the SCS1.7 is C2H5NO2/ Fe (NO3)3·9H2O of 1.8. SCS5 and SCS8.3 catalysts
possess the particle sizes of 100 nm to 500 nm [16]. It should be noted that a large amount of gas was
produced during the SCS in a very short time [16–18]. The coarse surface and fine particles prepared
by SCS are attributed to the flushing of gases during SCS.
Figure 3. SEM images of the fresh glycine/Fe (SCS) and WBC catalyst.
Figure 4 illustrated the scanning electron microscope (SEM) images of the reduced SCS catalysts
and WBC catalyst, as well as the surface element distribution mapping of Fe, Al, K, Ca, and
overlapping images [19]. Evidently, significant surface segregation over the WBC catalyst was
detected after reduction [20]. For WBC, most of the promoters, Al, K, and Ca, are distributed on the
boundaries of Fe particles. By contrast, all the elements were uniformly dispersed over the SCS5
catalyst.
0.2 0.4 0.6 0.8 1.0
Vo
lum
e@S
TP
(cc/
g)
P/P0
SCS8.3
SCS5
SCS1.7
WBC
(a)
1 10 100
dV
/(lo
gd
)
Pore diameter(nm)
SCS8.3
SCS5
SCS1.7
WBC
(b)
Figure 3. SEM images of the fresh glycine/Fe (SCS) and WBC catalyst.
Figure 4 illustrated the scanning electron microscope (SEM) images of the reduced SCS catalystsand WBC catalyst, as well as the surface element distribution mapping of Fe, Al, K, Ca, and overlappingimages [19]. Evidently, significant surface segregation over the WBC catalyst was detected afterreduction [20]. For WBC, most of the promoters, Al, K, and Ca, are distributed on the boundaries of Feparticles. By contrast, all the elements were uniformly dispersed over the SCS5 catalyst.
Catalysts 2020, 10, 1027 5 of 11
Catalysts 2020, 10, x FOR PEER REVIEW 5 of 12
Figure 4. SEM images and EDS elemental mapping of SCS and WBC catalyst.
2.3. TEM Results
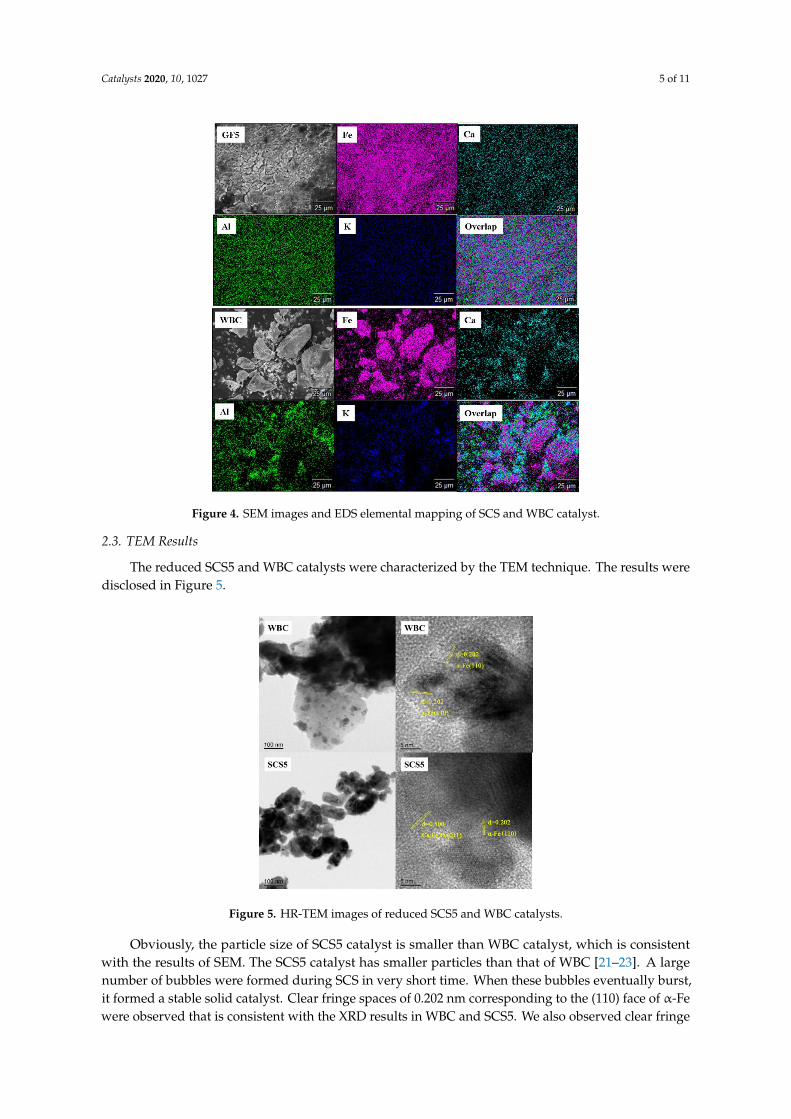
The reduced SCS5 and WBC catalysts were characterized by the TEM technique. The results
were disclosed in Figure 5.
Figure 5. HR-TEM images of reduced SCS5 and WBC catalysts.
Obviously, the particle size of SCS5 catalyst is smaller than WBC catalyst, which is consistent
with the results of SEM. The SCS5 catalyst has smaller particles than that of WBC [21–23]. A large
number of bubbles were formed during SCS in very short time. When these bubbles eventually burst,
it formed a stable solid catalyst. Clear fringe spaces of 0.202 nm corresponding to the (110) face of α-
Fe were observed that is consistent with the XRD results in WBC and SCS5. We also observed clear
fringe spaces of 0.5 nm corresponding to the (011) face of Ca2Fe2O5 indicating the formation of solid
Figure 4. SEM images and EDS elemental mapping of SCS and WBC catalyst.
2.3. TEM Results
The reduced SCS5 and WBC catalysts were characterized by the TEM technique. The results weredisclosed in Figure 5.
Catalysts 2020, 10, x FOR PEER REVIEW 5 of 12
Figure 4. SEM images and EDS elemental mapping of SCS and WBC catalyst.
2.3. TEM Results
The reduced SCS5 and WBC catalysts were characterized by the TEM technique. The results
were disclosed in Figure 5.
Figure 5. HR-TEM images of reduced SCS5 and WBC catalysts.
Obviously, the particle size of SCS5 catalyst is smaller than WBC catalyst, which is consistent
with the results of SEM. The SCS5 catalyst has smaller particles than that of WBC [21–23]. A large
number of bubbles were formed during SCS in very short time. When these bubbles eventually burst,
it formed a stable solid catalyst. Clear fringe spaces of 0.202 nm corresponding to the (110) face of α-
Fe were observed that is consistent with the XRD results in WBC and SCS5. We also observed clear
fringe spaces of 0.5 nm corresponding to the (011) face of Ca2Fe2O5 indicating the formation of solid
Figure 5. HR-TEM images of reduced SCS5 and WBC catalysts.
Obviously, the particle size of SCS5 catalyst is smaller than WBC catalyst, which is consistentwith the results of SEM. The SCS5 catalyst has smaller particles than that of WBC [21–23]. A largenumber of bubbles were formed during SCS in very short time. When these bubbles eventually burst,it formed a stable solid catalyst. Clear fringe spaces of 0.202 nm corresponding to the (110) face of α-Fewere observed that is consistent with the XRD results in WBC and SCS5. We also observed clear fringe

Catalysts 2020, 10, 1027 6 of 11
spaces of 0.5 nm corresponding to the (011) face of Ca2Fe2O5 indicating the formation of solid solutionin the catalysts. The calcium oxide inhibits the disproportionation reaction of wüstite improving thecatalytic activity. There are similar reports on this conclusion [24].
2.4. XPS Results
The XPS technique was adopted to identify the surface chemistry of the reduced catalysts.The whole XPS spectra indicate that the surfaces of both WBC and SCS5 catalysts are composed byFe, O, K, Ca, and Al, according to Figure 6a, which is consistent with the result of SEM images andelemental mapping of EDS. In Figure 6b, the Fe 2p core levels split into 2p 3/2 and 2p 1/2 componentsbecause of the spin–orbit coupling. According to the literature, two peaks at binding energy 706.5 eVand 719.7 eV are related to the binding energies of Fe 2p 3/2 and Fe 2p 1/2 for Fe respectively [25–27].The peaks which are located at 710.2 eV and 723.4 eV are attributed to Fe2O3. Clearly, it suggeststhat the reduced catalyst was oxidized by air during the experiment. The peaks which are located at714.5 eV and 727.7 eV are assigned to a solid solution of Fe [28–30].
Catalysts 2020, 10, x FOR PEER REVIEW 6 of 12
solution in the catalysts. The calcium oxide inhibits the disproportionation reaction of wüstite
improving the catalytic activity. There are similar reports on this conclusion [24].
2.4. XPS Results
The XPS technique was adopted to identify the surface chemistry of the reduced catalysts. The
whole XPS spectra indicate that the surfaces of both WBC and SCS5 catalysts are composed by Fe, O,
K, Ca, and Al, according to Figure 6a, which is consistent with the result of SEM images and elemental
mapping of EDS. In Figure 6b, the Fe 2p core levels split into 2p 3/2 and 2p 1/2 components because
of the spin–orbit coupling. According to the literature, two peaks at binding energy 706.5 eV and
719.7 eV are related to the binding energies of Fe 2p 3/2 and Fe 2p 1/2 for Fe respectively [25–27]. The
peaks which are located at 710.2 eV and 723.4 eV are attributed to Fe2O3. Clearly, it suggests that the
reduced catalyst was oxidized by air during the experiment. The peaks which are located at 714.5 eV
and 727.7 eV are assigned to a solid solution of Fe [28–30].
Figure 6. XPS spectra of reduced SCS5 and WBC catalyst; (a) the analysis of elements, (b) binding
energy of Fe2p.
Compared with WBC, the binding energy of reduced Fe species shifts to a lower position
significantly. It indicates that more electrons are transferred to the surface of Fe. The highest energy
barrier in ammonia synthesis is the dissociative adsorption of N2 molecules [31–33]. Consequently, it
is the rate-limiting step for the iron-based catalyst. Electron rich Fe centers accelerate the dissociative
adsorption of N2 molecules, increasing the reaction rate of synthetic ammonia. According to Table 4,
the peak area of Fe2p in WBC (13025) is much larger than that of SCS5 (6328), which indicates the
content of α-Fe in WBC is two times higher than that of SCS5. The ratios of Fes (solid solution of Fe)
to simple Fe catalyst is 0.39 in SCS5 and this higher than that of WBC (0.35), which indicates more Fe
to be buried in solid solution for SCS5 catalysts.
Table 4. The peak area of Fe, Fe in Solid solution and Fe2O3 species by XPS.
Catalysts Fe2p a Fes/Fe b
Fe Fes
WBC 13025 (706.8eV, 720.2eV) 4537 (714.5eV, 727.7eV) 0.35
SCS5 6328 (706.2eV, 719.9eV) 2445 (714.5eV, 727.7eV) 0.39 a: represent the peak area of Fe and Fes from XPS peak fitting. b: the peak area ratio of Fes and Fe.
2.5. Catalytic Activity of Catalysts for Ammonia Synthesis
The catalytic activity for ammonia synthesis over SCS was evaluated and compared with WSC
catalyst under the same conditions. Figure 7 and Table 5 give the ammonia concentration in the outlet
of the reactor and its reaction rate at 15 MPa, 30,000 h−1 and range of 400–450 °C. For all the catalysts
prepared by SCS, the ammonia synthesis reaction rate increases with fuel quantity before it reaches
1400 1200 1000 800 600 400 200 0
Al 2p
K 2p
Ca 2p
Inte
nsi
ty
Bingding Energy(eV)
WBC
SCS5
Fe 2pO 1s
C 1s
(a)
730 720 710
722.9eV
723.4eV
710.2eV
709.7eV
727.7eV714.5eV
719.9eV
706.2eV
727.7eV 714.5eV720.2eV
SCS5
Inte
nsi
ty
Bingding Energy(eV)
WBC
706.8eV(b)
Figure 6. XPS spectra of reduced SCS5 and WBC catalyst; (a) the analysis of elements, (b) bindingenergy of Fe2p.
Compared with WBC, the binding energy of reduced Fe species shifts to a lower positionsignificantly. It indicates that more electrons are transferred to the surface of Fe. The highest energybarrier in ammonia synthesis is the dissociative adsorption of N2 molecules [31–33]. Consequently,it is the rate-limiting step for the iron-based catalyst. Electron rich Fe centers accelerate the dissociativeadsorption of N2 molecules, increasing the reaction rate of synthetic ammonia. According to Table 4,the peak area of Fe2p in WBC (13,025) is much larger than that of SCS5 (6328), which indicates thecontent of α-Fe in WBC is two times higher than that of SCS5. The ratios of Fes (solid solution of Fe) tosimple Fe catalyst is 0.39 in SCS5 and this higher than that of WBC (0.35), which indicates more Fe tobe buried in solid solution for SCS5 catalysts.
Table 4. The peak area of Fe, Fe in Solid solution and Fe2O3 species by XPS.
Catalysts Fe2p a Fes/Fe b
Fe Fes
WBC 13,025 (706.8 eV, 720.2 eV) 4537 (714.5 eV, 727.7 eV) 0.35SCS5 6328 (706.2 eV, 719.9 eV) 2445 (714.5 eV, 727.7 eV) 0.39
a: represent the peak area of Fe and Fes from XPS peak fitting. b: the peak area ratio of Fes and Fe.
2.5. Catalytic Activity of Catalysts for Ammonia Synthesis
The catalytic activity for ammonia synthesis over SCS was evaluated and compared with WSCcatalyst under the same conditions. Figure 7 and Table 5 give the ammonia concentration in the outletof the reactor and its reaction rate at 15 MPa, 30,000 h−1 and range of 400–450 ◦C. For all the catalysts
Catalysts 2020, 10, 1027 7 of 11
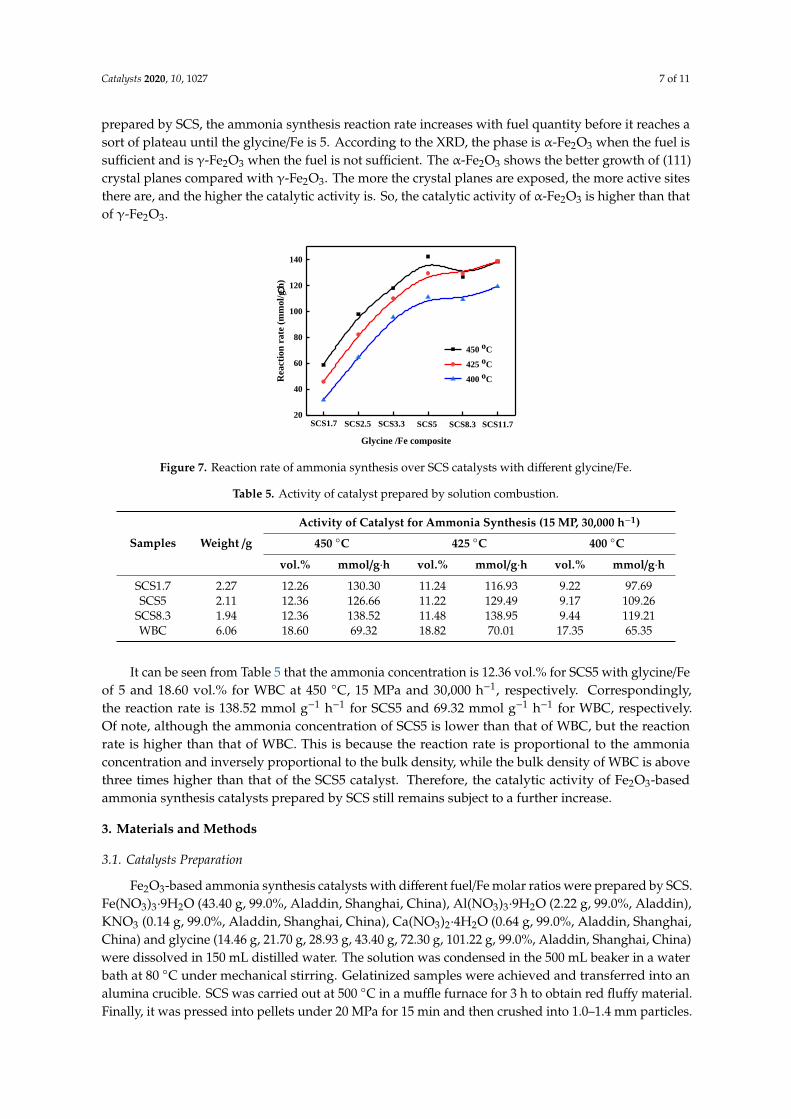
prepared by SCS, the ammonia synthesis reaction rate increases with fuel quantity before it reaches asort of plateau until the glycine/Fe is 5. According to the XRD, the phase is α-Fe2O3 when the fuel issufficient and is γ-Fe2O3 when the fuel is not sufficient. The α-Fe2O3 shows the better growth of (111)crystal planes compared with γ-Fe2O3. The more the crystal planes are exposed, the more active sitesthere are, and the higher the catalytic activity is. So, the catalytic activity of α-Fe2O3 is higher than thatof γ-Fe2O3.
Catalysts 2020, 10, x FOR PEER REVIEW 7 of 12
a sort of plateau until the glycine/Fe is 5. According to the XRD, the phase is α-Fe2O3 when the fuel is
sufficient and is γ-Fe2O3 when the fuel is not sufficient. The α-Fe2O3 shows the better growth of (111)
crystal planes compared with γ-Fe2O3. The more the crystal planes are exposed, the more active sites
there are, and the higher the catalytic activity is. So, the catalytic activity of α-Fe2O3 is higher than
that of γ-Fe2O3.
20
40
60
80
100
120
140
SCS11.7SCS8.3SCS5SCS3.3SCS2.5
Rea
ctio
n r
ate
(m
mol/
gh
)
Glycine /Fe composite
450 oC
425 oC
400 oC
SCS1.7
· ·
Figure 7. Reaction rate of ammonia synthesis over SCS catalysts with different glycine/Fe.
Table 5. Activity of catalyst prepared by solution combustion.
Samples Weight /g
Activity of Catalyst for Ammonia Synthesis (15 MP, 30,000 h−1)
450 °C 425 °C 400 °C
vol.% mmol/g·h vol.% mmol/g·h vol.% mmol/g·h
SCS1.7 2.27 12.26 130.30 11.24 116.93 9.22 97.69
SCS5 2.11 12.36 126.66 11.22 129.49 9.17 109.26
SCS8.3 1.94 12.36 138.52 11.48 138.95 9.44 119.21
WBC 6.06 18.60 69.32 18.82 70.01 17.35 65.35
It can be seen from Table 5 that the ammonia concentration is 12.36 vol.% for SCS5 with
glycine/Fe of 5 and 18.60 vol.% for WBC at 450 °C, 15 MPa and 30,000 h−1, respectively.
Correspondingly, the reaction rate is 138.52 mmol g−1 h−1 for SCS5 and 69.32 mmol g−1 h−1 for WBC,
respectively. Of note, although the ammonia concentration of SCS5 is lower than that of WBC, but
the reaction rate is higher than that of WBC. This is because the reaction rate is proportional to the
ammonia concentration and inversely proportional to the bulk density, while the bulk density of
WBC is above three times higher than that of the SCS5 catalyst. Therefore, the catalytic activity of
Fe2O3-based ammonia synthesis catalysts prepared by SCS still remains subject to a further increase.
3. Materials and Methods
3.1. Catalysts Preparation
Fe2O3-based ammonia synthesis catalysts with different fuel/Fe molar ratios were prepared by
SCS. Fe(NO3)3·9H2O (43.40 g, 99.0%, Aladdin, Shanghai, China), Al(NO3)3·9H2O (2.22 g, 99.0%,
Aladdin), KNO3 (0.14 g, 99.0%, Aladdin, Shanghai, China), Ca(NO3)2·4H2O (0.64 g, 99.0%, Aladdin,
Shanghai, China) and glycine (14.46 g, 21.70 g, 28.93 g, 43.40 g, 72.30 g, 101.22 g, 99.0%, Aladdin,
Shanghai, China) were dissolved in 150 mL distilled water. The solution was condensed in the 500
mL beaker in a water bath at 80 °C under mechanical stirring. Gelatinized samples were achieved
and transferred into an alumina crucible. SCS was carried out at 500 °C in a muffle furnace for 3 h to
obtain red fluffy material. Finally, it was pressed into pellets under 20 MPa for 15 min and then
crushed into 1.0–1.4 mm particles. WBC catalyst is a wustite-based catalyst prepared by melting
Figure 7. Reaction rate of ammonia synthesis over SCS catalysts with different glycine/Fe.
Table 5. Activity of catalyst prepared by solution combustion.
Samples Weight /g
Activity of Catalyst for Ammonia Synthesis (15 MP, 30,000 h−1)
450 ◦C 425 ◦C 400 ◦C
vol.% mmol/g·h vol.% mmol/g·h vol.% mmol/g·h
SCS1.7 2.27 12.26 130.30 11.24 116.93 9.22 97.69SCS5 2.11 12.36 126.66 11.22 129.49 9.17 109.26
SCS8.3 1.94 12.36 138.52 11.48 138.95 9.44 119.21WBC 6.06 18.60 69.32 18.82 70.01 17.35 65.35
It can be seen from Table 5 that the ammonia concentration is 12.36 vol.% for SCS5 with glycine/Feof 5 and 18.60 vol.% for WBC at 450 ◦C, 15 MPa and 30,000 h−1, respectively. Correspondingly,the reaction rate is 138.52 mmol g−1 h−1 for SCS5 and 69.32 mmol g−1 h−1 for WBC, respectively.Of note, although the ammonia concentration of SCS5 is lower than that of WBC, but the reactionrate is higher than that of WBC. This is because the reaction rate is proportional to the ammoniaconcentration and inversely proportional to the bulk density, while the bulk density of WBC is abovethree times higher than that of the SCS5 catalyst. Therefore, the catalytic activity of Fe2O3-basedammonia synthesis catalysts prepared by SCS still remains subject to a further increase.
3. Materials and Methods
3.1. Catalysts Preparation
Fe2O3-based ammonia synthesis catalysts with different fuel/Fe molar ratios were prepared by SCS.Fe(NO3)3·9H2O (43.40 g, 99.0%, Aladdin, Shanghai, China), Al(NO3)3·9H2O (2.22 g, 99.0%, Aladdin),KNO3 (0.14 g, 99.0%, Aladdin, Shanghai, China), Ca(NO3)2·4H2O (0.64 g, 99.0%, Aladdin, Shanghai,China) and glycine (14.46 g, 21.70 g, 28.93 g, 43.40 g, 72.30 g, 101.22 g, 99.0%, Aladdin, Shanghai, China)were dissolved in 150 mL distilled water. The solution was condensed in the 500 mL beaker in a waterbath at 80 ◦C under mechanical stirring. Gelatinized samples were achieved and transferred into analumina crucible. SCS was carried out at 500 ◦C in a muffle furnace for 3 h to obtain red fluffy material.Finally, it was pressed into pellets under 20 MPa for 15 min and then crushed into 1.0–1.4 mm particles.
Catalysts 2020, 10, 1027 8 of 11
WBC catalyst is a wustite-based catalyst prepared by melting according to our previous study [34,35].In order to facilitate the explanation, the catalyst is named according to the glycine/Fe molar ratioslisted in Supplementary Table S1. A WBC conventional catalyst was also prepared with the samecontent of promoters according to a methodology previously optimized by the authors.
3.2. Catalysts Characterization
N2 physical adsorption (BET) experiment was measured by an ASAP2010 adsorption instrument(Micromeritics Company, Atlanta, GA, USA). The catalysts were degassed at 200 ◦C for 10 h beforethe analysis.
The phase and grain size of the catalysts were determined by X-ray diffraction (XRD) over aBruker D8 Advance diffractometer (λ = 0.154056 nm, Cu Kα radiation, 2θ = 10◦~140◦) (Bruker AXSCompany, Karlsruhe, Germany).
The morphology was investigated by SEM (scanning electron microscope, JSM-7800FPRIME)(Hitachi, Tokyo, Japan) with the accelerating voltage of 29 kV. The samples were crushed into a finepowder and sprayed with Pt to get clear images before the characterization of SEM. The surfaceelement analysis of samples uses QUANTAX X-ray energy spectrometer (Bruker AXS Company,Karlsruhe, Germany).
The morphology and crystal structure of the samples were determined by TEM (transmissionelectron microscopy) using JEM-ARM300F GRAND ARM (JEOL, Akishima, Japan). The samples werecrushed into a fine powder and dispersed in ethanol by ultrasonic treatment for 30 min before thecharacterization of TEM. Images were taken at an operating voltage of 160 kV.
For X-ray photoelectron spectroscopy (XPS) experiments, a spectrometer from Thermo ESCALAB250XI photoelectron spectroscopy (Thermo Fisher Scientific Company, Waltham, MA, USA) with amono-chromatized microfocused Al X-ray source was employed. Setting the binding energy of carbon(C1s) at 284.6 eV, the charging of samples was corrected. Before the measurements, the powder sample,pressed into self-supporting disks, was loaded into a sub-chamber and then evacuated at 25 ◦C for 4 h.
3.3. Catalytic Activity Test
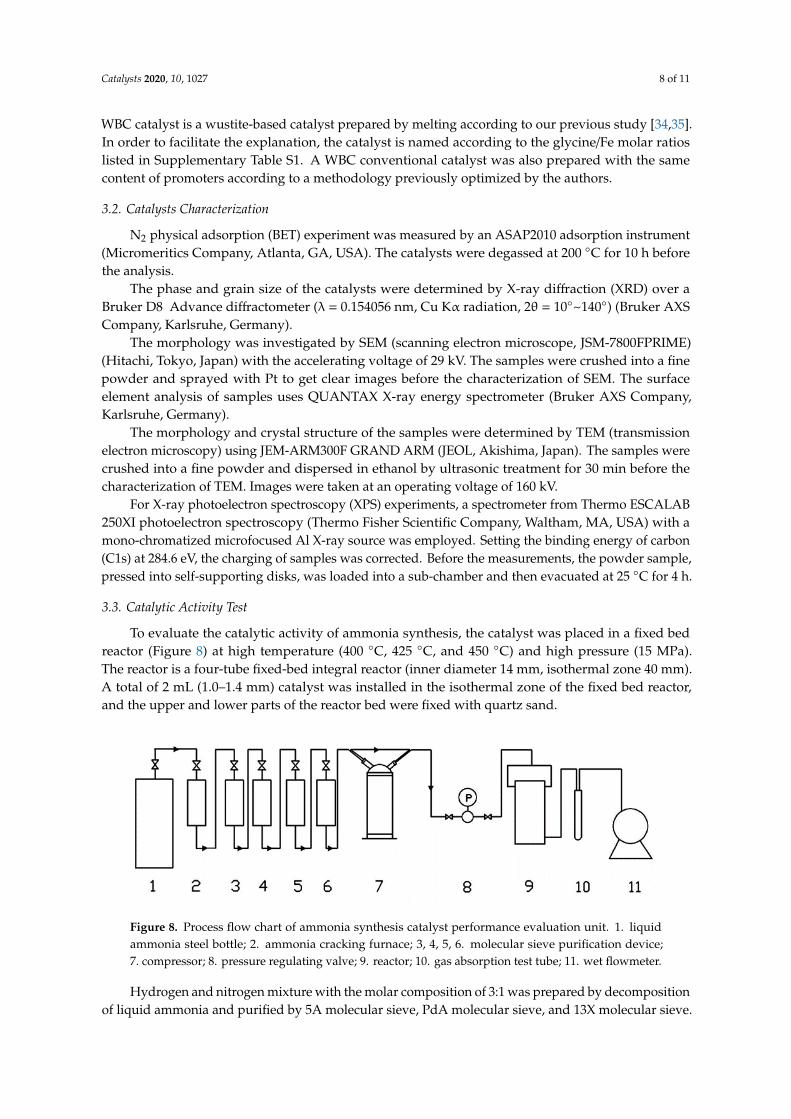
To evaluate the catalytic activity of ammonia synthesis, the catalyst was placed in a fixed bedreactor (Figure 8) at high temperature (400 ◦C, 425 ◦C, and 450 ◦C) and high pressure (15 MPa).The reactor is a four-tube fixed-bed integral reactor (inner diameter 14 mm, isothermal zone 40 mm).A total of 2 mL (1.0–1.4 mm) catalyst was installed in the isothermal zone of the fixed bed reactor,and the upper and lower parts of the reactor bed were fixed with quartz sand.
Catalysts 2020, 10, x FOR PEER REVIEW 9 of 12
Figure 8. Process flow chart of ammonia synthesis catalyst performance evaluation unit. 1. liquid
ammonia steel bottle; 2. ammonia cracking furnace; 3, 4, 5, 6. molecular sieve purification device; 7.
compressor; 8. pressure regulating valve; 9. reactor; 10. gas absorption test tube; 11. wet flowmeter.
Ammonia concentration (φ) at the reactor outlet was calculated by Equation (1).
2 4 2
2 4 2 4 2 4 2 4
1
1/ 2 1/ 2 4
1/ 2 1/ 2 1/ 2 1/ 2
22.081
22.08 22.08
H SO H SO
H SO H SO H SO H SO
N V K V
N V V K N V
2
2
(1)
where N1/2H2SO4 denotes the number of substance of 1/2 H2SO4, mol·ml−1, V1/2H2SO4 refers to the volume
of sulfuric acid solution, in mL, 22.08 is the standard volume of ammonia gas, in L·mol−1, V2 is the
residual gas volume measured by a wet-flow meter at the measurement conditions, in liters, and K is
the conversion coefficient of the gas volume under the measurement conditions converting to gas
volume at standard state.
20
760 1 / 273
H OP PK
t
(2)
where P0—atmospheric pressure, mmHg (1 mmHg = 133.322 Pa, the same below); PH2O—saturated
vapor partial pressure, mmHg; t—temperature of wet flow meter, °C. Reaction rate was determined
by Equation (3).
0
22.41 (1 ) 22.41 (1 )
V C Vm
C C
S V Sr
W
(3)
where rm—mass reaction rate, mmol·g−1·h−1; WC—mass of reduced catalyst, g; Vc—volume of
reduced catalyst, cm3; CC
C
W
V —packed density of reduced catalyst, g·cm−3; φ0, φ—ammonia
concentration of the inlet and outlet of reactor, % (mol); Δφ = φ − φ0—net value of ammonia, %.
4. Conclusions
In this work, Fe2O3-based ammonia synthesis catalysts were prepared by SCS with
Fe(NO3)3·9H2O, Al(NO3)3·9H2O, KNO3, and Ca(NO3)2·4H2O as the precursors and glycine as the fuel.
The effect of different glycine/Fe ratios on catalyst performance was studied. The irregular granular
catalysts were obtained in different theoretical fuel quantities. The α-Fe2O3 has a smaller particle size
than the WBC catalyst, was obtained when the fuel was sufficient, and the promoters formed a more
stable solid solution with Fe2O3.
The SCS5 catalysts prepared by SCS with high dispersion of promotions, shows higher ammonia
synthesis reaction rate than that of traditional fused iron catalysts. The high dispersion of promoters,
small iron particles in the catalyst, cause high activity and low energy consumption during the
preparation of the catalyst. This is a useful attempt at the preparation of ammonia synthesis catalyst
Figure 8. Process flow chart of ammonia synthesis catalyst performance evaluation unit. 1. liquidammonia steel bottle; 2. ammonia cracking furnace; 3, 4, 5, 6. molecular sieve purification device;7. compressor; 8. pressure regulating valve; 9. reactor; 10. gas absorption test tube; 11. wet flowmeter.
Hydrogen and nitrogen mixture with the molar composition of 3:1 was prepared by decompositionof liquid ammonia and purified by 5A molecular sieve, PdA molecular sieve, and 13X molecular sieve.

Catalysts 2020, 10, 1027 9 of 11
After purification, the hydrogen and nitrogen mixture was compressed by a diaphragm compressor topass through a pipeline valve, and finally entered the reactor through the pressure stabilizing valve,controlling the flow rate of the gas in the reactor through the needle valve.
The catalyst was reduced by temperature programmed reduction (400 ◦C: 2 h, 425 ◦C: 6 h, 450 ◦C:10 h, 475 ◦C: 4 h, 500 ◦C: 4 h) in mixed gas (75% H2 and 25% N2) according to the reduction procedure(5 MPa, 30,000 h−1), then the reaction conditions (15 MPa, 30,000 h−1) were controlled, and the formationrate of ammonia synthesis (Vol.%) was determined by sulfuric acid neutralization titration.
Ammonia concentration (ϕ) at the reactor outlet was calculated by Equation (1).
ϕ =N1/2H2SO4 ×V1/2H2SO4 × 22.08
N1/2H2SO4 ×V1/2H2SO4 × 22.08 + V2 ×K=
(1 +
K ×V2
22.08×N1/2H2SO4 ×V1/2H2SO4
)−1
(1)
where N1/2H2SO4 denotes the number of substance of 1/2 H2SO4, mol·ml−1, V1/2H2SO4 refers to thevolume of sulfuric acid solution, in mL, 22.08 is the standard volume of ammonia gas, in L·mol−1, V2 isthe residual gas volume measured by a wet-flow meter at the measurement conditions, in liters, and Kis the conversion coefficient of the gas volume under the measurement conditions converting to gasvolume at standard state.
K =P0 − PH2O
760(1 + t/273)(2)
where P0— atmospheric pressure, mmHg (1 mmHg = 133.322 Pa, the same below); PH2O—saturatedvapor partial pressure, mmHg; t—temperature of wet flow meter, ◦C. Reaction rate was determined byEquation (3).
rm =SVVC
22.41WC·ϕ−ϕ0
(1 + ϕ)=
SV
22.41ρC·
∆ϕ(1 + ϕ)
(3)
where rm—mass reaction rate, mmol·g−1·h−1; WC—mass of reduced catalyst, g; Vc—volume of reduced
catalyst, cm3; ρC =WCVC
—packed density of reduced catalyst, g·cm−3; ϕ0, ϕ—ammonia concentrationof the inlet and outlet of reactor, % (mol); ∆ϕ = ϕ − ϕ0—net value of ammonia, %.
4. Conclusions
In this work, Fe2O3-based ammonia synthesis catalysts were prepared by SCS with Fe(NO3)3·9H2O,Al(NO3)3·9H2O, KNO3, and Ca(NO3)2·4H2O as the precursors and glycine as the fuel. The effect ofdifferent glycine/Fe ratios on catalyst performance was studied. The irregular granular catalysts wereobtained in different theoretical fuel quantities. The α-Fe2O3 has a smaller particle size than the WBCcatalyst, was obtained when the fuel was sufficient, and the promoters formed a more stable solidsolution with Fe2O3.
The SCS5 catalysts prepared by SCS with high dispersion of promotions, shows higher ammoniasynthesis reaction rate than that of traditional fused iron catalysts. The high dispersion of promoters,small iron particles in the catalyst, cause high activity and low energy consumption during thepreparation of the catalyst. This is a useful attempt at the preparation of ammonia synthesis catalyst bythe solution combustion method. Compared with the melting method, which requires high operatingtemperatures (1600 ◦C), SCS provides a simple and fast route for the preparation of catalysts forammonia synthesis. Although the catalyst prepared by solution combustion synthesis presented ahigher reaction rate than that of the catalyst prepared by a conventional melting method, it is in theform of powder and it is therefore difficult to press into pellets. In future work, the shaping of catalystwith proper mechanical strength will be focused upon. This work not only provides a new possibilityfor the industrial preparation of Fe-based catalysts for ammonia synthesis, but also provides a newdirection for the development of Fe-based catalysts.
Catalysts 2020, 10, 1027 10 of 11
Supplementary Materials: The following are available online at http://www.mdpi.com/2073-4344/10/9/1027/s1,Table S1: Nomenclature of catalysts. Figure S1: Reaction rate of ammonia synthesis over citric acid/Fe compositecatalysts prepared by SCS at a reaction condition. All the catalysts were reduced by temperature programmedreduction. Figure S2: Reaction rate of ammonia synthesis over glycol/Fe composite catalysts prepared by SCS at areaction condition. All the catalysts were reduced by temperature programmed reduction. Figure S3: Reactionrate of ammonia synthesis over urea/Fe composite catalysts prepared by SCS at a reaction condition. All thecatalysts were reduced by temperature programmed reduction.
Author Contributions: B.C.: Drafting the work; methodology and experimental investigation, literature search;figures; data collection. H.L.: acquisition; project supervision; funding acquisition. W.H.: Conceptualization,writing; project supervision; funding acquisition. All authors have read and agreed to the published version ofthe manuscript.
Funding: This research was funded by Zhejiang Provincial Natural Science Foundation of China under grantNo. LY19B060009.
Conflicts of Interest: The authors declare no conflict of interest.
References
1. Liu, H.H. Recent advances in research of catalysts for ammonia synthesis. Chin. J. Catal. 2001, 22, 304–316.2. Pernicone, N.; Ferrero, E.; Rossetti, I.; Forni, L.; Canton, P.; Riello, P.; Fagherazzi, G.; Signoretto, M.; Pinna, F.
Wustite as a new precursor of industrial ammonia synthesis catalysts. Appl. Catal. A Gen. 2003, 251, 121–129.[CrossRef]
3. Liu, H.Z. Ammonia synthesis catalyst 100 years: Practice, enlightenment and challenge. Chin. J. Catal. 2014,35, 1619–1640. [CrossRef]
4. Liu, H.Z.; Li, X.N.; Hu, Z.N. Development of novel low temperature and low pressure ammonia synthesiscatalyst. Appl. Catal. A Gen. 1996, 142, 209–222. [CrossRef]
5. Han, W.F.; Huang, S.L.; Cheng, T.H.; Tang, H.D.; Li, Y.; Liu, H.Z. Promotion of Nb2O5 on the wustite-basediron catalyst for ammonia synthesis. Appl. Surf. Sci. 2015, 353, 17–23. [CrossRef]
6. Patil, K.C.; Aruna, S.T.; Mimani, T. Combustion synthesis: An update. Curr. Opin. Solid State Mater. Sci.2002, 6, 507–512. [CrossRef]
7. Dinesha, M.L.; Jayanna, H.S.; Mohanty, S.; Ravi, S. Structural, electrical and magnetic properties of Co and Feco-doped ZnO nanoparticles prepared by solution combustion method. J. Alloys Compd. 2010, 490, 618–623.[CrossRef]
8. Jin, Y.; Qin, W.P.; Zhang, J.S.; Zhang, M.M.; Wang, Y.; Cao, C.Y. Synthesis of Gd3PO7: Eu3+ nanospheres via afacile combustion method and optical properties. J. Solid State Chem. 2008, 181, 724–729. [CrossRef]
9. Lou, X.M.; Chen, D.H. Synthesis of CaWO4: Eu3+ phosphor powders via a combustion process and itsoptical properties. Mater. Lett. 2008, 62, 1681–1684. [CrossRef]
10. Qiu, Z.F.; Zhou, Y.Y.; Lu, M.K.; Zhang, A.Y.; Ma, Q. Combustion synthesis of three-dimensionalreticular-structured luminescence SrAl2O4: Eu, Dy nanocrystals. Solid State Sci. 2008, 10, 629–633. [CrossRef]
11. Wang, H.; Han, W.; Li, X.; Liu, B.; Tang, H.; Li, Y. Solution Combustion Synthesis of Cr2O3
Nanoparticles and the Catalytic Performance for Dehydrofluorination of 1,1,1,3,3-Pentafluoropropaneto 1,3,3,3-Tetrafluoropropene. Molecules 2019, 24, 361. [CrossRef] [PubMed]
12. Zheng, Y.F.; Liu, H.Z.; Li, X.N. In situ X-ray Diffraction Investigation on Reduction Process ofAmmonia-synthesis Fused-iron Catalysts and the Formation Mechanism of Its Active Phase. Chem. J.Chin. Univ. 2009, 30, 1177–1182.
13. Gu, B.; Ordomsky, V.V.; Bahri, M.; Ersen, O.; Chemayskii, P.A.; Filimonov, D.; Khodakov, A.Y. Effects of thepromotion with bismuth and lead on direct synthesis of light olefins from syngas over carbon nanotubesupported iron catalysts. Appl. Catal. B Environ. 2018, 234, 153–166. [CrossRef]
14. Li, J.B.; Ma, H.F.; Zhang, H.T.; Sun, Q.W.; Ying, W.Y.; Fang, D.Y. Direct production of light olefins from syngasover potassium modified Fe-Mn catalyst. React. Kinet. Mech. Catal. 2014, 112, 409–423. [CrossRef]
15. Ghosh, S.K.; Pal, S.; Roy, S.K.; Pal, S.K.; Basu, D. Modelling of flame temperature of solution combustionsynthesis of nanocrystalline calcium hydroxyapatite material and its parametric optimization. Bull. Mater.Sci. 2010, 33, 339–350. [CrossRef]
Catalysts 2020, 10, 1027 11 of 11
16. Han, W.F.; Wang, Z.K.; Li, X.J.; Tang, H.D.; Xi, M.; Li, Y.; Liu, H.Z. Solution combustion synthesis ofnano-chromia as catalyst for the dehydrofluorination of 1,1-difluoroethane. J. Mater. Sci. 2016, 51,11002–11013. [CrossRef]
17. Gonzalez-Cortes, S.L.; Imbert, F.E. Fundamentals, properties and applications of solid catalysts prepared bysolution combustion synthesis (SCS). Appl. Catal. A Gen. 2013, 452, 117–131. [CrossRef]
18. Han, W.F.; Liu, B.; Li, X.L.; Yang, L.T.; Wang, J.C.; Tang, H.D.; Liu, W.C. Combustion Synthesis of AmorphousAl and Cr Composite as the Catalyst for Dehydrofluorination of 1,1-Difluoroethane. Ind. Eng. Chem. Res.2018, 57, 12774–12783. [CrossRef]
19. Tsuji, Y.; Kitano, M.; Kishida, K.; Sasase, M.; Yokoyama, T.; Hara, M.; Hosono, H. Ammonia synthesis overCo-Mo alloy nanoparticle catalyst prepared via sodium naphthalenide-driven reduction. Chem. Commun.2016, 52, 14369–14372. [CrossRef]
20. Gupta, M.; Gupta, R.P. Anomalous surface segregation behaviour of some 3d elements in ferromagnetic iron.J. Phys. Condens. Matter 2013, 25, 8. [CrossRef]
21. Jafari, A.; Ebadi, A.; Sahebdelfar, S. Effect of iron oxide precursor on the properties and ammonia synthesisactivity of fused iron catalysts. React. Kinet. Mech. Catal. 2019, 126, 307–325. [CrossRef]
22. Lendzion-Bielun, Z.; Jedrzejewski, R. Determination of the content of promoters in magnetite and wustitephases in the fused iron catalyst. Pol. J. Chem. Technol. 2013, 15, 27–29. [CrossRef]
23. Jedrzejewski, R.; Lendzion-Bielun, Z. Reduction Process of Iron Catalyst Precursors for Ammonia SynthesisDoped with Lithium Oxide. Catalysts 2018, 8, 494. [CrossRef]
24. Pu, Z.Y.; Zheng, Y.F.; Liu, H.Z.; Li, X.N. Influence of promoter and Fe2+/Fe3+ ratio on microstructure of fusediron catalysts for ammonia synthesis. Indian J. Chem. Sect. A Inorg. Bio-Inorg. Phys. Theor. Anal. Chem. 2011,50, 156–162.
25. Powell, C.J. Recommended Auger parameters for 42 elemental solids. J. Electron. Spectrosc. Relat. Phenom.2012, 185, 1–3. [CrossRef]
26. Ouyang, M.; Hiraoka, H. Structure and magnetic properties of iron oxide films deposited by excimer laserablation of a metal-containing polymer. Mater. Res. Bull. 1997, 32, 1099–1107. [CrossRef]
27. Wu, H.B.; Desai, S.R.; Wang, L.S. Observation and photoelectron spectroscopic study of novel mono- anddiiron oxide molecules: FeOy− (y = 1–4) and Fe2Oy− (y = 1–5). J. Am. Chem. Soc. 1996, 118, 5296–5301.[CrossRef]
28. Hara, M.; Kitano, M.; Hosono, H. Ru-Loaded C12A7:e(-) Electride as a Catalyst for Ammonia Synthesis.ACS Catal. 2017, 7, 2313–2324. [CrossRef]
29. Kozuch, S.; Shaik, S. Kinetic-quantum chemical model for catalytic cycles: The Haber-Bosch process and theeffect of reagent concentration. J. Phys. Chem. A 2008, 112, 6032–6041. [CrossRef]
30. Spencer, M.S. On the rate-determining step and the role of potassium in the catalytic synthesis of ammonia.Catal. Lett. 1992, 13, 45–54. [CrossRef]
31. Inoue, Y.; Kitano, M.; Kishida, K.; Abe, H.; Niwa, Y.; Sasase, M.; Fujita, Y.; Ishikawa, H.; Yokoyama, T.;Hara, M.; et al. Efficient and Stable Ammonia Synthesis by Self-Organized Flat Ru Nanoparticles on CalciumAmide. ACS Catal. 2016, 6, 7577–7584. [CrossRef]
32. Kitano, M.; Inoue, Y.; Yamazaki, Y.; Hayashi, F.; Kanbara, S.; Matsuishi, S.; Yokoyama, T.; Kim, S.W.; Hara, M.;Hosono, H. Ammonia synthesis using a stable electride as an electron donor and reversible hydrogen store.Nat. Chem. 2012, 4, 934–940. [CrossRef] [PubMed]
33. Kitano, M.; Kanbara, S.; Inoue, Y.; Kuganathan, N.; Sushko, P.V.; Yokoyama, T.; Hara, M.; Hosono, H. Electridesupport boosts nitrogen dissociation over ruthenium catalyst and shifts the bottleneck in ammonia synthesis.Nat. Commun. 2015, 6, 9. [CrossRef] [PubMed]
34. Liu, H.Z.; Liu, C.B.; Li, X.N.; Cen, Y.Q. Effect of an iron oxide precursor on the H2 desorption performancefor an ammonia synthesis catalyst. Ind. Eng. Chem. Res. 2003, 42, 1347–1349. [CrossRef]
35. Zheng, Y.-F.; Liu, H.-Z.; Liu, Z.-J.; Li, X.-N. In situ X-ray diffraction study of reduction processes of Fe3O4−
and Fe1−xO-based ammonia-synthesis catalysts. J. Solid State Chem. 2009, 182, 2385–2391. [CrossRef]
© 2020 by the authors. Licensee MDPI, Basel, Switzerland. This article is an open accessarticle distributed under the terms and conditions of the Creative Commons Attribution(CC BY) license (http://creativecommons.org/licenses/by/4.0/).