Solid Waste Management in Nairobi: A Situation Analysis
59
Solid Waste Management in Nairobi: A Situation Analysis Technical Document accompanying the Integrated Solid Waste Management Plan Prepared by: Allison Kasozi and Harro von Blottnitz Environmental & Process Systems Engineering Group University of Cape Town For the City Council of Nairobi on contract for the United Nations Environment Programme Draft: 17 February 2010
Transcript of Solid Waste Management in Nairobi: A Situation Analysis

Solid Waste Management in
Nairobi: A Situation Analysis
Technical Document accompanying
the Integrated Solid Waste Management Plan
Prepared by: Allison Kasozi and Harro von Blottnitz
Environmental & Process Systems Engineering Group
University of Cape Town
For the City Council of Nairobi
on contract for the United Nations Environment Programme
Draft: 17 February 2010

Preface
The purpose of this accompanying technical document to the main Integrated Solid Waste
Management (ISWM) Draft Plan is to explain in more detail the thinking, rationale, calculations,
modelling and assumptions made in the development of the Specific ISWM Actions arrived at, and
summarised in the main Draft Plan document. The situational background to Solid Waste
Management in Nairobi City is drawn and analysed at from a basic systems perspective to allow for
the development of more holistic interventions to the problems and challenges highlighted in the
ISWM planning process to this point. The data utilised to this end is sourced from a diversity of
sources including; previous research work on solid waste management in Nairobi and other areas,
preliminary zone surveys and waste characterisation audits carried out in Nairobi in 2009, UNEP/CCN
ISWM Training and Stakeholder Workshops held in Nairobi through 2009, and public and private
reports. It is hoped that from this contextual lens, the specific ISWM actions proposed and
summarised in the main ISWM Draft Plan document can be better understood and seen to follow
from a natural sequence and thread of considerations.
Contents
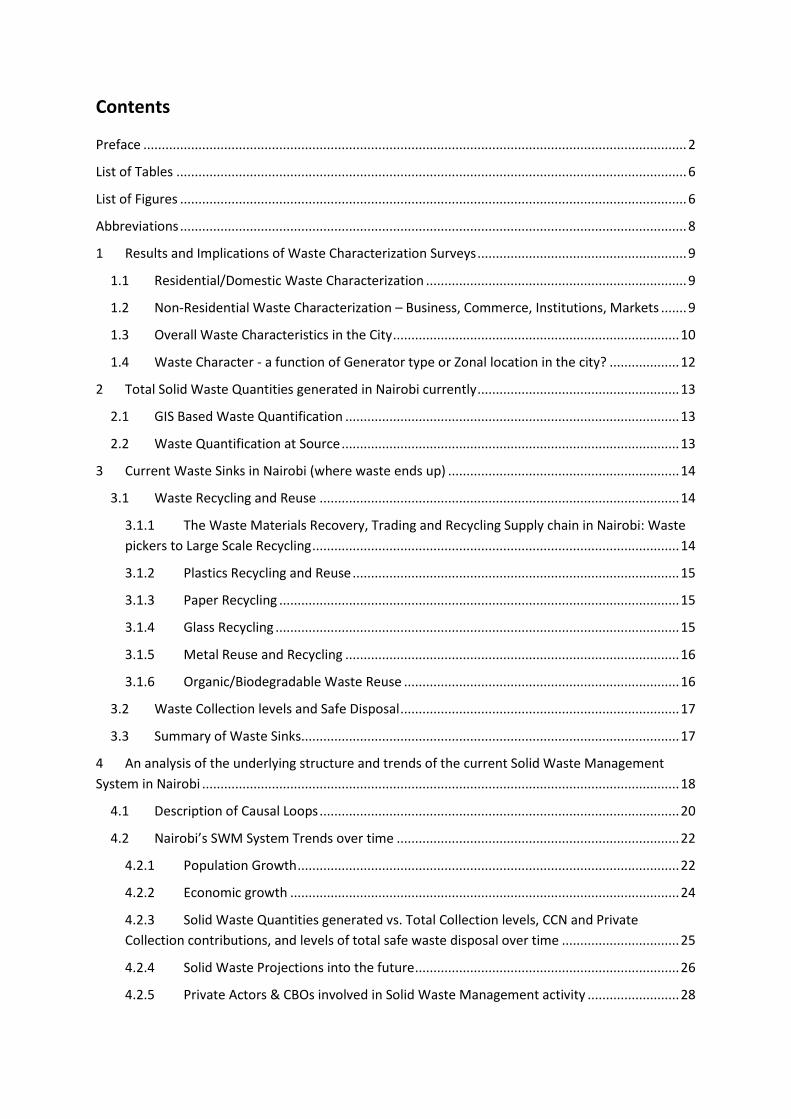
Preface .................................................................................................................................................... 2
List of Tables ........................................................................................................................................... 6
List of Figures .......................................................................................................................................... 6
Abbreviations .......................................................................................................................................... 8
1 Results and Implications of Waste Characterization Surveys ......................................................... 9
1.1 Residential/Domestic Waste Characterization ....................................................................... 9
1.2 Non-Residential Waste Characterization – Business, Commerce, Institutions, Markets ....... 9
1.3 Overall Waste Characteristics in the City .............................................................................. 10
1.4 Waste Character - a function of Generator type or Zonal location in the city? ................... 12
2 Total Solid Waste Quantities generated in Nairobi currently ....................................................... 13
2.1 GIS Based Waste Quantification ........................................................................................... 13
2.2 Waste Quantification at Source ............................................................................................ 13
3 Current Waste Sinks in Nairobi (where waste ends up) ............................................................... 14
3.1 Waste Recycling and Reuse .................................................................................................. 14
3.1.1 The Waste Materials Recovery, Trading and Recycling Supply chain in Nairobi: Waste
pickers to Large Scale Recycling .................................................................................................... 14
3.1.2 Plastics Recycling and Reuse ......................................................................................... 15
3.1.3 Paper Recycling ............................................................................................................. 15
3.1.4 Glass Recycling .............................................................................................................. 15
3.1.5 Metal Reuse and Recycling ........................................................................................... 16
3.1.6 Organic/Biodegradable Waste Reuse ........................................................................... 16
3.2 Waste Collection levels and Safe Disposal ............................................................................ 17
3.3 Summary of Waste Sinks....................................................................................................... 17
4 An analysis of the underlying structure and trends of the current Solid Waste Management
System in Nairobi .................................................................................................................................. 18
4.1 Description of Causal Loops .................................................................................................. 20
4.2 Nairobi’s SWM System Trends over time ............................................................................. 22
4.2.1 Population Growth ........................................................................................................ 22
4.2.2 Economic growth .......................................................................................................... 24
4.2.3 Solid Waste Quantities generated vs. Total Collection levels, CCN and Private
Collection contributions, and levels of total safe waste disposal over time ................................ 25
4.2.4 Solid Waste Projections into the future ........................................................................ 26
4.2.5 Private Actors & CBOs involved in Solid Waste Management activity ......................... 28
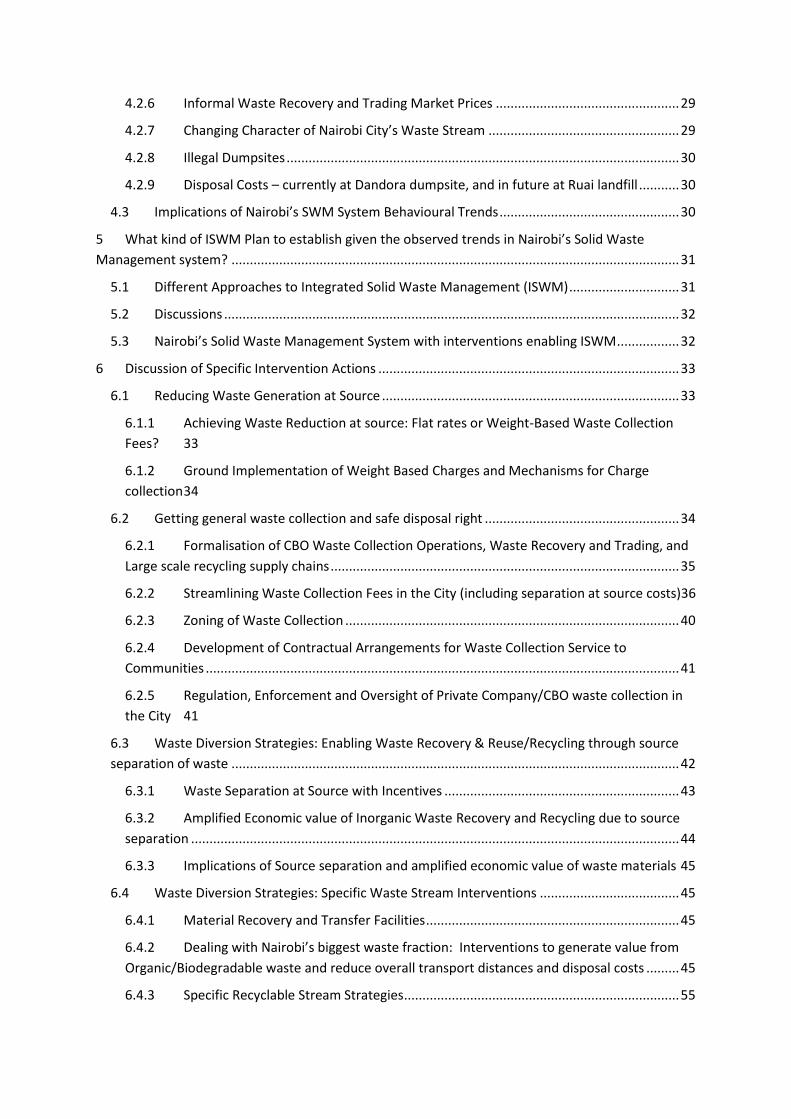
4.2.6 Informal Waste Recovery and Trading Market Prices .................................................. 29
4.2.7 Changing Character of Nairobi City’s Waste Stream .................................................... 29
4.2.8 Illegal Dumpsites ........................................................................................................... 30
4.2.9 Disposal Costs – currently at Dandora dumpsite, and in future at Ruai landfill ........... 30
4.3 Implications of Nairobi’s SWM System Behavioural Trends ................................................. 30
5 What kind of ISWM Plan to establish given the observed trends in Nairobi’s Solid Waste
Management system? .......................................................................................................................... 31
5.1 Different Approaches to Integrated Solid Waste Management (ISWM) .............................. 31
5.2 Discussions ............................................................................................................................ 32
5.3 Nairobi’s Solid Waste Management System with interventions enabling ISWM ................. 32
6 Discussion of Specific Intervention Actions .................................................................................. 33
6.1 Reducing Waste Generation at Source ................................................................................. 33
6.1.1 Achieving Waste Reduction at source: Flat rates or Weight-Based Waste Collection
Fees? 33
6.1.2 Ground Implementation of Weight Based Charges and Mechanisms for Charge
collection 34
6.2 Getting general waste collection and safe disposal right ..................................................... 34
6.2.1 Formalisation of CBO Waste Collection Operations, Waste Recovery and Trading, and
Large scale recycling supply chains ............................................................................................... 35
6.2.2 Streamlining Waste Collection Fees in the City (including separation at source costs)36
6.2.3 Zoning of Waste Collection ........................................................................................... 40
6.2.4 Development of Contractual Arrangements for Waste Collection Service to
Communities ................................................................................................................................. 41
6.2.5 Regulation, Enforcement and Oversight of Private Company/CBO waste collection in
the City 41
6.3 Waste Diversion Strategies: Enabling Waste Recovery & Reuse/Recycling through source
separation of waste .......................................................................................................................... 42
6.3.1 Waste Separation at Source with Incentives ................................................................ 43
6.3.2 Amplified Economic value of Inorganic Waste Recovery and Recycling due to source
separation ..................................................................................................................................... 44
6.3.3 Implications of Source separation and amplified economic value of waste materials 45
6.4 Waste Diversion Strategies: Specific Waste Stream Interventions ...................................... 45
6.4.1 Material Recovery and Transfer Facilities ..................................................................... 45
6.4.2 Dealing with Nairobi’s biggest waste fraction: Interventions to generate value from
Organic/Biodegradable waste and reduce overall transport distances and disposal costs ......... 45
6.4.3 Specific Recyclable Stream Strategies ........................................................................... 55

6.4.4 Landfill or End-of-Life Treatment Levies on Problematic Waste Materials .................. 55
6.5 End fate of residual or un-diverted solid waste in the City: Construction and Capitalisation
of Sanitary Landfill at Ruai ................................................................................................................ 56
6.6 Continual monitoring of Waste Character, Quantities and related solid waste information
to aid future planning ....................................................................................................................... 56
References ............................................................................................................................................ 57

List of Tables
Table 1: Waste characterization at immediate source and at communal collection points for
Residential generators ............................................................................................................................ 9
Table 3: Summary of City-wide waste characteristics at immediate source and at communal
collection points .................................................................................................................................... 10
Table 2: Waste characterisation at immediate source and at communal waste collection points for
Business, Commercial & Institutional generators ................................................................................. 10
Table 4: Anova analysis of residential waste compositions at immediate source and at communal
waste collection points ......................................................................................................................... 11
Table 5: Summary of Anova analysis to determine if waste characterisation at communal waste
collection points is statistically different across zones ......................................................................... 12
Table 6: Summary of Anova analysis to determine if waste characterisation at communal waste
collection points is statistically different across generator types ........................................................ 12
Table 7: Nairobi’s Population since 1906 .............................................................................................. 22
Table 8: Projected Municipal Solid Waste Generation in Nairobi ........................................................ 27
Table 9: Timeline of the increase of Private Actors in Nairobi's Solid Waste Management ................ 28
Table 10: Nairobi's evolving Waste Character ...................................................................................... 29
Table 11: Disposal Costs to Dandora designated and Ruai landfill ....................................................... 30
Table 12: Summary of CCN total disposal costs to Dandora dumpsite per ton waste collected (Source:
Njenga, 2009a) ...................................................................................................................................... 37
Table 13: Private Collector Charges in Nairobi, late 90's to early 2000's ............................................. 39
Table 14: Comparative Analysis of fertiliser value of compost and inorganic fertilisers based on
market prices and nutrient contents, July 2009 (Source: Onduru et al, 2009) .................................... 53
List of Figures
Figure 1: Summary of Nairobi's Waste Sources and Sinks 2009 ........................................................... 17
Figure 2: Nairobi City's Population growth ........................................................................................... 23
Figure 3: Typical logistic growth curve of biological organisms (Farabee, 2001) ................................. 23
Figure 4: Population growth curves of New York (Gibson& Jung, 2005) and London (Wendell Cox
Consultancy, 2001) respectively ........................................................................................................... 23
Figure 5: Projected Population Growth in Nairobi pre and post 2009 ................................................. 24
Figure 6: Kenya's GDP per capita growth since 1996 ........................................................................... 24
Figure 7: Solid waste generation vs. CCN, Private and Total Collection levels and disposal at
designated landfill ................................................................................................................................. 25
Figure 8: Nairobi MSW Generation and Projections ............................................................................. 28
Figure 9: Private Collector & CBO Collection Charges in Nairobi, 2009 (Source: Letema et al, 2009) . 39
Figure 10: Biogas Plant Pay Back Periods relative to electricity selling price and pure organic waste
buying incentives or tipping fees .......................................................................................................... 51
Figure 11: Approximate Biogas Plant Net Annual Incomes before tax relative to electricity selling
price and pure organic waste buying incentives or tipping fees .......................................................... 51

Figure 12: Annual Biogas Plant Returns on Investment (pre-tax) relative to electricity selling price and
pure organic waste buying incentives or tipping fees .......................................................................... 52
Abbreviations
CBO – Community Based Organisation
CBD – Central Business District
CCN – City Council of Nairobi
CLD – Causal Loop Diagram
ISWM – Integrated Solid Waste Management
ITDG – Intermediate Technology Development Group, now Practical Action
JICA – Japan International Cooperation Agency
KNCPC – Kenya National Cleaner Production Centre
LA – Local Authority
MENR – Ministry of Environment and Natural Resources
MoLG – Ministry of Local Government
MoNMD – Ministry of Nairobi Metropolitan Development
MSW – Municipal Solid Waste
NEMA – National Environmental Management Authority
NTT – National Task Team (Multi-Public/Private Stakeholder team appointed to oversee the progress
and implementation of the UNEP/CCN Nairobi ISWM Project)
SWM – Solid Waste Management
UNEP – United Nations Environmental Program
UN-HABITAT – United Nations Human Settlements Programme
UNDP – United Nations Development Programme
UN-OCHA – United Nations Office for the Coordination of Humanitarian Affairs

1 Results and Implications of Waste Characterization Surveys
In the course of the ISWM project, waste characterization surveys were carried out by the National
Task Team (NTT) in 2009 in July and September at designated CCN communal waste collection
points, and at immediate source (waste taken directly from households and various business,
commerce and institutional premises) respectively, to determine the current character of Nairobi’s
waste. The sample numbers taken and used for the characterisations achieved theoretical 99%
Confidence levels for residential/domestic and non-domestic waste characterisation at immediate
source, and 95% and 90% Confidence levels respectively for domestic and non-domestic waste
characterisation at communal waste collection points. The results of the characterisations are
summarised in the sections following.
1.1 Residential/Domestic Waste Characterization
A total of 568 samples spread over a week were taken directly from households in three zones
namely; Starehe, Makadara and Westlands for waste characterisation at immediate source, while a
total of 163 communal waste collection points located in residential areas spread across Nairobi City
were sampled for waste characterisation at collection points. The results of the residential /domestic
waste characterisations carried out at immediate source and at communal waste collection points
are summarised in Table 1 below.
Table 1: Waste characterization at immediate source and at communal collection points for Residential generators
Waste Type Composition (%)
At immediate Source At Communal Waste
Collection Points located
(directly from Households) in Residential areas
Organic/Biodegradable 58.6 46.1
Paper 11.9 8.9
Plastics 15.9 15.4
Glass 1.9 5.6
Metal 2.0 2.3
Other 9.7 21.7
1.2 Non-Residential Waste Characterization – Business, Commerce, Institutions,
Markets
A total of 84 samples spread over one week were taken directly from retail supermarkets and
various shops; offices and workplaces; institutions - including primary and secondary schools and
universities, religious venues and non-hazardous waste from health care units and hospitals; and at
catering venues in three zones namely; Starehe, Makadara and Westlands for Non-domestic waste
characterisations at immediate source. A total of 83 samples taken from communal waste collection
points located in general business and commercial areas spread across Nairobi City, and 14 from
collection points located adjacent to fruit and vegetable general markets, were used for the
characterisation of business, commercial and market waste at communal waste collection points.

A further 102 samples from communal waste collection points located in areas that had mixed
residential and business/commercial activity were taken but are excluded from this summary, they
however generally had waste compositions that fell between those observed at communal collection
points located in or adjacent to residential areas only as in Table 1 above, and business/commerce
only areas as shown below in Table 2.
The non-domestic waste characterisations determined at immediate source and at waste collection
points are summarised in Table 2 below;
1.3 Overall Waste Characteristics in the City
UNEP/NEMA (2003) (cited in Ngau & Kahiu, 2009 – ISWM Secondary Data Report) found that
domestic waste contributes 68% of the total waste generated in Nairobi; while non-domestic waste
from industrial, markets, roads & other activities contributed a combined total of about 32% of the
total waste generated, broken down as follows; Industrial: 14 %; roads: 8 %; hospitals: 2 %; markets:
1 %; and 7 % from other sources. Using this information and some of the characterisations in
Sections 1.1 and 1.2 as proxies for some of the categories classified in UNEP/NEMA (2003) above (i.e.
residential composition at source used as is, Office/workplace source composition used as a proxy
for industrial non-hazardous waste, Business/Commerce collection point based composition used as
a proxy for road waste, non hazardous/medical waste composition at source used as is, market
collection point based compositions used as a proxy for immediate source compositions in markets,
and retail/shops composition at source used as a proxy for the 'other' sources); the overall the city-
wide waste characterisation at immediate source and at communal collection points is estimated at:
Table 3: Summary of City-wide waste characteristics at immediate source and at communal collection points
City-wide waste Compositions (%)
Waste type At immediate
source At Communal Waste
Collection Pts
Organics 50.9 43.0
Paper 17.5 12.1
Plastic 16.1 15.1
Glass 2.0 5.6
Metals 2.0 2.7
Other 11.4 21.7
Table 2: Waste characterisation at immediate source and at communal waste collection points for Business, Commercial & Institutional generators

While it might be expected that there should be similarity in the waste characterisations at source
and at collection points as theoretically waste generated at source ends up at collection points, this
is not the case in reality. The difference between immediate source and collection points based
waste characteristics may be attributed to some of the waste at source not passing through CCN
communal waste collection points, but going straight to disposal dump as in the case of middle to
high income residential areas and larger businesses that use door to door private collection; and in
the instances where it does go through communal collection points first as in the lower income
areas, the difference is likely due to natural degradation of organic waste and paper, and is also
likely strong evidence of the active informal recovery and trading of recyclable material in the City as
observed in previous studies (Karanja, 2005; Baud et al, 2004) as well as in the course of the 2009
Waste Characterisation surveys and as voiced at UNEP/CCN ISWM Stakeholder workshops in Dec.
2009; resulting in an overall decrease in potentially recyclable material and an increase in residual
waste at collection points.
Due to the highly differentiated nature of non-domestic waste generators sampled at immediate
source (i.e. Business, Commerce, Institutions, Markets – it is not known currently what the individual
sub-generators’ contribution to non-domestic waste is) relative to communal waste collection points
(with mixed waste coming from general Business/Commercial areas with no sub-generator
specificity), a direct statistical comparison of non-domestic waste compositions at immediate source
and at communal collection points was not possible. An Analysis of Variance (Anova analysis)
however of Nairobi’s major residential waste stream (68% of total waste generated), providing a
direct comparison between characterisation at immediate source and communal waste collection
points was possible due to the homogeneity of generators sampled in the residential category at
immediate source and at collection points; and was done to determine if there are indeed any
differences in the waste character between source and collection points given the sample numbers
taken, and their respective standard deviations and averages. The results of this are summarised in
Table 4 below, and show that there are indeed differences in the waste composition of organics,
paper, glass and the ‘other’ or residual streams between immediate source and communal collection
points; generally supporting the conclusions drawn above. While the decline in the organics and
paper streams, and subsequent increase in residual waste may be attributed to natural degradation
and informal waste recovery activity, the general increase in glass composition between source and
collection points is curious and could be due to non desirability of the material for waste recovery
owing to a lack of broken glass recycling capacity in the City, a scenario that is also alluded to by
Karanja (2005) – See Section 3.1.4.
Table 4: Anova analysis of residential waste compositions at immediate source and at communal waste collection points
Overall the waste composition at immediate source shows three major categories that would aid in
the effective source separation of waste material to enhance downstream material recovery and
value generation in the development of the ISWM plan namely; Organic material – 50.9%,
Potentially recyclable materials - 37.7% and Other/Residual material – 11.4%.
Enough evidence of Statistical difference of waste component means between Source & Collection Pts?
Paper Glass Plastic Organics Metals Other
Yes Yes No Yes No Yes

The waste characterisation determined in 2009 above generally deviates slightly but not radically
from previous studies. JICA study (1998) determined the Nairobi Municipal Solid Waste stream to
comprise of: 51% food waste, 17% paper (15% recyclable), 12% plastics (5% containers), 7% grass
and wood, 3% metal, 3% textile, 2% glass, and others (5%) and ITDG (now called Practical Action) in
2004 gave a slightly different municipal solid waste composition with organics comprising 61%, 21%
plastics and 12% paper (Bahri, 2005). A waste characterisation history of solid waste in the city is
outlined in more detail in Section 4.2.7.
1.4 Waste Character - a function of Generator type or Zonal location in the city?
An Analysis of Variance (Anova) - essentially a statistical comparison of the waste compositions
collected from the collection points in the different zones, was done to determine if there are any
differences in the waste character between the different zones. Waste compositions at communal
waste collection points were compared for this purpose as collection points by their communal
nature are more representative of the generator mix and demographics across the city, and typically
allowed larger samples volume-wise; allowing for a quicker and broader comparison of waste
character city-wide than would be possible with individual samples taken at immediate source.
Table 5: Summary of Anova analysis to determine if waste characterisation at communal waste collection points is
statistically different across zones
Enough evidence of Statistical difference in waste compositions across zones?
Generator Paper only Glass only Plastic only Organics only Metals only Recyclables Combined
Residential No No Yes No* No No
Business/Commerce No No No No No No
Table 6: Summary of Anova analysis to determine if waste characterisation at communal waste collection points is
statistically different across generator types
Enough evidence of Statistical difference in waste compositions across generators?
Paper only Glass only Plastic only Organics only Metals only Recyclables Combined
Across generators Yes No No Yes No Yes
The results show a relative indifference in waste compositions between zones with the exception of
plastic, and therefore no strong evidence for the need for specific zone based waste intervention
activities. The analysis instead shows that waste character in Nairobi is different across generator
types, and is a stronger function of the responsible generators i.e. residences/households and
commerce/institutions, than of the geographical location of generators. Any detailed intervention
policies developed targeting specific waste types should therefore be directed at specific generator
groups exhibiting strong compositions of the particular material of interest as shown in Sections 1.1
and 1.2.

2 Total Solid Waste Quantities generated in Nairobi currently
Total waste quantities being generated in Nairobi were determined using GIS based scale up
techniques from communal waste collection point quantity estimates, and via quantifications done
at immediate source during the source characterisation survey.
2.1 GIS Based Waste Quantification
GIS figures yet to come..
2.2 Waste Quantification at Source
Quantification of waste generation at source was done in households in Makadara, Starehe, and
Westland zones and yielded the following results:
Makadara zone (low to middle income level households) residential per capita generation rates
vary from 0.21 – 0.65 kg/person/day, with a mean of 0.49 kg/person/day.
Starehe zone (low to middle income level households) residential per capita generation rates
vary from 0.24 – 0.82 kg/person/day, with a mean of 0.43 kg/person/day.
Westlands zone (mostly high income level households) generation rates vary from 0.41-0.79
kg/person/day with a mean of 0.65 kg/person/day.
JICA in 1998 estimated total City waste generation at 1530 tons/day, of which 82.8% was from
households; equivalent to 263 tons/day non-domestic waste, and 1267 tons/day domestic or
residential waste. This gave an average per capita residential waste generation of 0.59
kg/person/day given the population at the time (2,143,254 people in 1999 – See Section 4.2.1). ITDG
in 2004 estimated total solid waste generation at 2400 tons/day (Bahri, 2005). From UNEP/NEMA’s
(2003) (cited in Ngau & Kahiu, 2009) determination that domestic waste contributes 68% of the total
waste generated in Nairobi; the residential waste generation per capita of the city’s 2,656,997
residents in 2004 (See Section 4.2.1) had increased to about 0.61 kg/capita/day in that year.
Because JICA (1998) conducted the characterisation surveys twice over the course of the year six
months apart (May & November), their results would have better accounted for seasonal
fluctuations in waste generation in the City at the time. From the household source waste
characterisation surveys done in October 2009, an average of 0.53 kg/person/day was determined
from all the households sampled in all zones. However in cognisance of the planning nature of this
work, and because there are typically fluctuations in waste quantities generated over varying
seasons; the upper 0.65 kg/person/day observed from sampling in Westlands Zone is taken as the
city-wide estimate of waste generation per capita to cater for maximum volume waste generation.
This coupled with the city’s current population estimate at 3.265 million gives a maximum residential
waste generation estimate of 2122 tons/day. UNEP/NEMA (2003) (cited in Ngau & Kahiu, 2009)
found that domestic waste contributes 68% of the total waste generated in Nairobi; it can therefore
be estimated that current Non-domestic waste generation is about 999 tons/day, and Total waste
generation in the City in turn is currently at most about 3121 tons/day. This represents an increase
of 30% from the estimate waste generation figures of 2400 tons/day in 2004 by ITDG (Bahri, 2005),
and a full doubling of waste generation in ten years from 1530 tons/day in 1998 (JICA, 1998).
3 Current Waste Sinks in Nairobi (where waste ends up)
3.1 Waste Recycling and Reuse
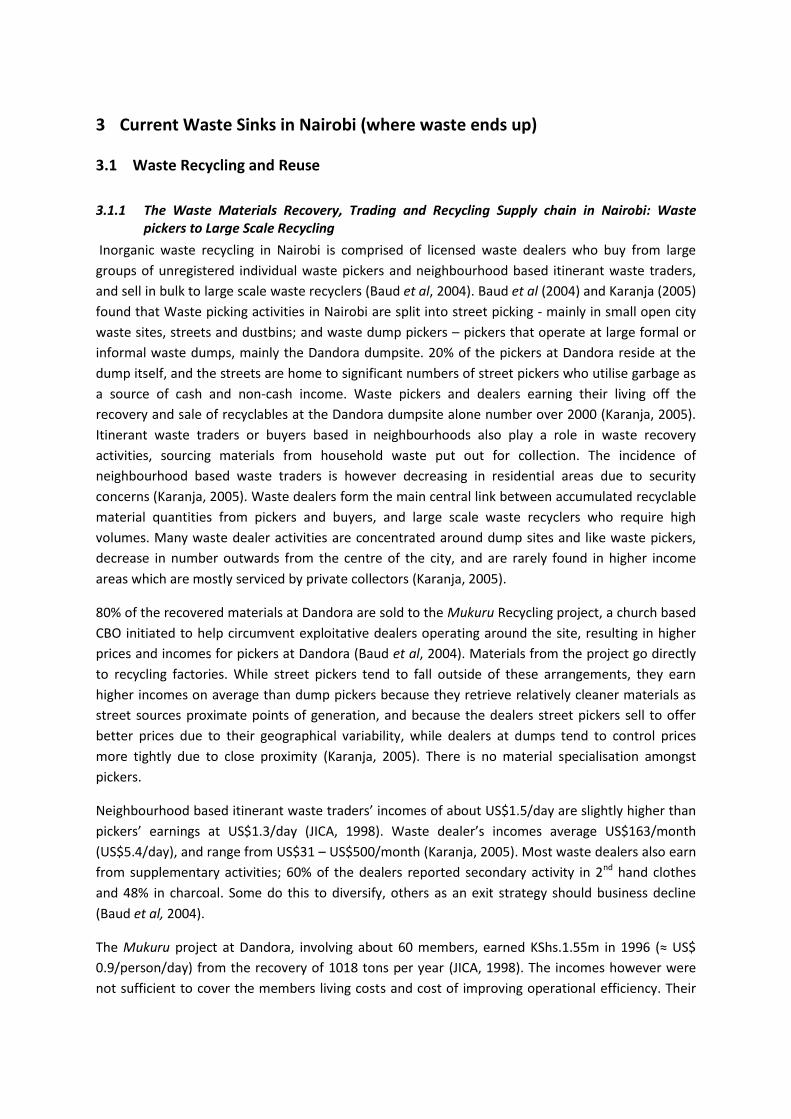
3.1.1 The Waste Materials Recovery, Trading and Recycling Supply chain in Nairobi: Waste pickers to Large Scale Recycling
Inorganic waste recycling in Nairobi is comprised of licensed waste dealers who buy from large
groups of unregistered individual waste pickers and neighbourhood based itinerant waste traders,
and sell in bulk to large scale waste recyclers (Baud et al, 2004). Baud et al (2004) and Karanja (2005)
found that Waste picking activities in Nairobi are split into street picking - mainly in small open city
waste sites, streets and dustbins; and waste dump pickers – pickers that operate at large formal or
informal waste dumps, mainly the Dandora dumpsite. 20% of the pickers at Dandora reside at the
dump itself, and the streets are home to significant numbers of street pickers who utilise garbage as
a source of cash and non-cash income. Waste pickers and dealers earning their living off the
recovery and sale of recyclables at the Dandora dumpsite alone number over 2000 (Karanja, 2005).
Itinerant waste traders or buyers based in neighbourhoods also play a role in waste recovery
activities, sourcing materials from household waste put out for collection. The incidence of
neighbourhood based waste traders is however decreasing in residential areas due to security
concerns (Karanja, 2005). Waste dealers form the main central link between accumulated recyclable
material quantities from pickers and buyers, and large scale waste recyclers who require high
volumes. Many waste dealer activities are concentrated around dump sites and like waste pickers,
decrease in number outwards from the centre of the city, and are rarely found in higher income
areas which are mostly serviced by private collectors (Karanja, 2005).
80% of the recovered materials at Dandora are sold to the Mukuru Recycling project, a church based
CBO initiated to help circumvent exploitative dealers operating around the site, resulting in higher
prices and incomes for pickers at Dandora (Baud et al, 2004). Materials from the project go directly
to recycling factories. While street pickers tend to fall outside of these arrangements, they earn
higher incomes on average than dump pickers because they retrieve relatively cleaner materials as
street sources proximate points of generation, and because the dealers street pickers sell to offer
better prices due to their geographical variability, while dealers at dumps tend to control prices
more tightly due to close proximity (Karanja, 2005). There is no material specialisation amongst
pickers.
Neighbourhood based itinerant waste traders’ incomes of about US$1.5/day are slightly higher than
pickers’ earnings at US$1.3/day (JICA, 1998). Waste dealer’s incomes average US$163/month
(US$5.4/day), and range from US$31 – US$500/month (Karanja, 2005). Most waste dealers also earn
from supplementary activities; 60% of the dealers reported secondary activity in 2nd hand clothes
and 48% in charcoal. Some do this to diversify, others as an exit strategy should business decline
(Baud et al, 2004).
The Mukuru project at Dandora, involving about 60 members, earned KShs.1.55m in 1996 (≈ US$
0.9/person/day) from the recovery of 1018 tons per year (JICA, 1998). The incomes however were
not sufficient to cover the members living costs and cost of improving operational efficiency. Their

major problem is securing a stable market for recovered materials, especially for waste paper and
compost.
Important waste materials on the waste recovery market include; paper, scrap iron - used by local
artisans and metal working companies, plastics and whole bottles. A record of waste material
preferences and selling prices by waste dealers is detailed in Section 4.2.6.
3.1.2 Plastics Recycling and Reuse
As of 2005 the level of re-use and recycling of post-consumer plastic in Nairobi was very low, with
approximately only 1% recycled (ITDG, 2005 cited in Ngau & Kahiu, 2009; Bahri, 2005). Using this
figure, and assuming a plastics composition of about 15% as a bridge between JICA(1998) and the
2009 Characterisation survey results, and using ITDG’s (2004) total waste generation estimation of
2400 tons/day in 2004; plastic reuse in 2005 was about 3.6 tons/day. The ISWM Secondary data and
Preliminary Survey Report (Ngau & Kahiu, 2009) reported the presence of some private companies
and groups actively involved in plastic waste recycling in Nairobi currently including; Devani, RH,
Green Loop International, Eurasia plastics and community based recyclers. One of these groups,
Green Loop International, has a total waste plastic recycling/re-manufacturing capacity of about 450
ton/month (15tons/day) of HDPE, LDPE and plastic lumber (Bahri, 2005). During Preliminary Zone
surveys prior to characterisation surveys in 2009 it was also noted that a number of community
based recyclers are currently being supported by Practical Action (formerly ITDG) which has
identified thirteen (13) functional plastic waste collection points, thirty seven (37) recycling groups
and one thousand six hundred and thirteen (1,613) individuals in the city’s Eastland’s area that can
spearhead the recycling program through a legally defined cooperative framework (Ngau & Kahiu,
2009). The registered cooperative is operating on a 5-year business plan.
In July 2006, the KNCPC, supported by UNDP and UNEP also finalized a Comprehensive Plastic Waste
Strategy for Nairobi City centred on the reduction, reuse and recycling of plastic wastes in the city.
Its progress to date however has not yet been documented (KNCPC, 2006).
Given the capacity of Green Loop International by itself, the ITDG estimates in 2005, and the
presence of other private and sub-national players in the plastics recycling industry; it is conceivable
that current plastics recycling and reuse capacity in the City could be in the region of 20-25 tons/day,
equivalent to approximately 5% of the available waste plastic in the city.
3.1.3 Paper Recycling
Chandaria and Madhupaper have previously been noted to be the most established and dominant
players in the trade and recycling of waste paper in Nairobi (Karanja, 2005), with remanufacturing
capacities about 24 tons/day and 20 tons/day respectively of waste paper summing up to about 8%
of total waste paper in the city. Another previously sizable entity involved in the waste paper
recovery and recycling, Webuye Paper Mills, has however closed (Kahiu, 2009).
3.1.4 Glass Recycling
Glass recycling in Nairobi is dominated by Central Glass Industries (CGI), a subsidiary of Kenya
Breweries Ltd (KBL). CGI uses about 720 tons of clear glass and 1260 tons of green/amber glass per
month (about 66 tonnes glass /day) of which (Karanja, 2005). Karanja (2005) however noted that
glass recycling of especially broken glass is on the decline as the reprocessing of broken glass was
found to be too costly and unprofitable due to high maintenance costs of the imported precision

equipment. Power constraints (shortages resulting in rationing), economic conditions and increasing
competition from lighter and more durable aluminum cans, plastics and Tetra-pack containers from
the early 2000’s were also attributed as likely contributing factors. Progress to date on this is not
clear, although the presence of elevated glass levels in the communal waste collection point
characterizations relative to at immediate source as discussed earlier could indicate the lack of
informal recovery activity interest in the predominantly broken glass at the collection point stage.
With an estimate 2% waste glass composition in Nairobi’s current waste stream, equal to about 62
tons/day of glass, it would seem that CGI’s capacity was once sufficient to reuse a substantial
amount of the waste glass available but has since declined due to high costs of broken glass
recycling. Current recycle levels are not known.
3.1.5 Metal Reuse and Recycling
Karanja (2005) notes the presence of up to 9 rolling mills in Nairobi, some of which were however
closed at the time of the researcher’s work. One of the largest and still in operation, Roll Mill Ltd,
however consumes about 30 tons of scrap/day equivalent to about half of the available 62 tons/day
of total metal in Nairobi’s waste. There is also a very vibrant Jua Kali small scale metal recycling and
reworking industry in the City. Given that not all the waste metal available is necessarily scrap metal
suitable for reuse or metal working, and also that the capacity mentioned is only consumed by one
entity, it seems reasonable to conclude that Nairobi is not in need of any further metal recycling
apparatus besides the efficient separation and movement of the available waste metal to the above
mentioned interested actors.
3.1.6 Organic/Biodegradable Waste Reuse
A number of Community Based Organizations and private holdings are involved in the composting of
organic waste for sale. A survey done on the biggest entities involved in the activity including
community/self help groups and private companies showed a combined compost production
capacity of about 1.2 tons/day in the City (Onduru et al, 2009), equivalent to about 2.4 tons/day of
raw organic waste feed assuming an average 50% mass reduction during the process. This in turn is
equivalent to less than 1% of available organic biodegradable material, the bulk of which is food
material.
There is also qualitative evidence of the active current use and sizable potential in the use of fresh
raw organic wastes especially from markets and restaurants by urban and peri-urban farmers as
animal and livestock feed (Karanja, 2005; Onduru et al, 2009; Ngau & Kahiu, 2009). Organic waste
material amounts reused in this way are however unquantified at the current time. Early work by
Mazingira Institute (Mazingira, 1987 cited by Karanja, 2005) indicated that 12-14% of animal
producers in Nairobi fed their animals on urban organic waste. Karanja (2005) also found that 42.9%
of markets and institutions interviewed in her work reported that organic waste from their premises
was used as animal feed, mostly pigs. With feeding alone accounting for between 60 to 80% of the
total livestock production costs in Kenya (Githinji et al, 2009 cited by Onduru et al, 2009) and from
the work cited above, it seems evident that there is an active interest in using fresh urban organic
waste in this way, and it looks likely that this will only gain in importance in future.
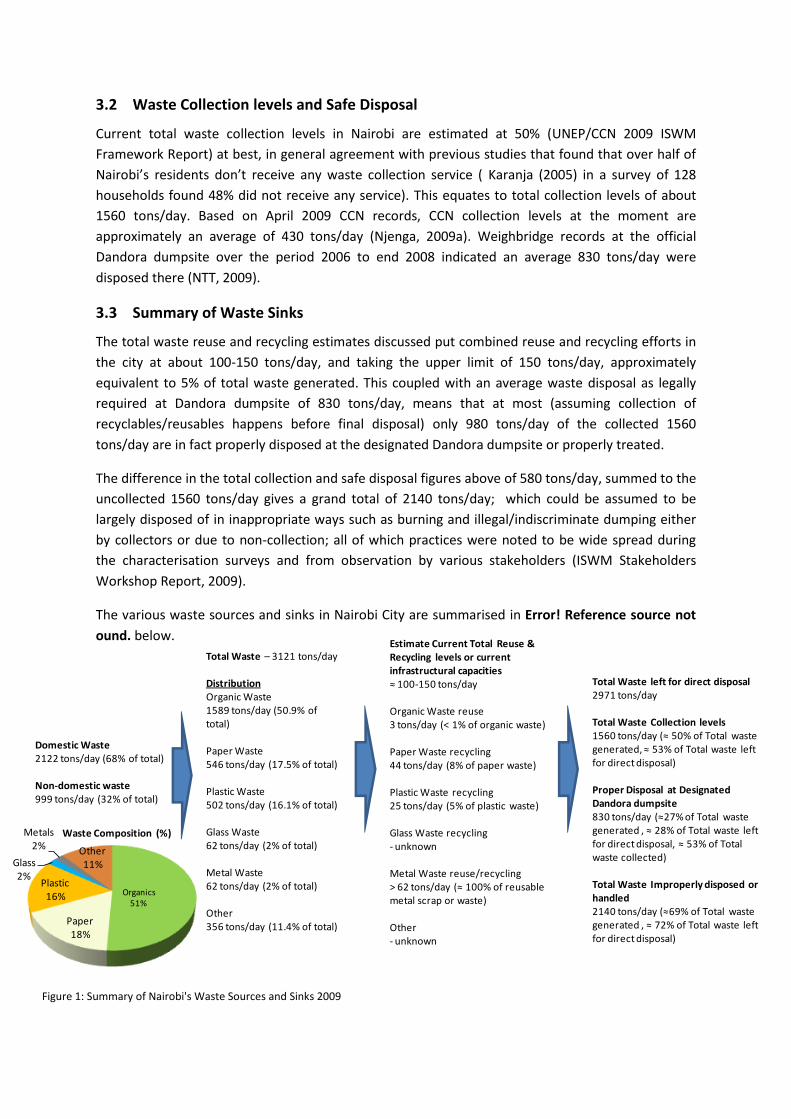
Domestic Waste 2122 tons/day (68% of total)
Non-domestic waste999 tons/day (32% of total)
Total Waste – 3121 tons/day
DistributionOrganic Waste1589 tons/day (50.9% of total)
Paper Waste546 tons/day (17.5% of total)
Plastic Waste502 tons/day (16.1% of total)
Glass Waste62 tons/day (2% of total)
Metal Waste62 tons/day (2% of total)
Other356 tons/day (11.4% of total)
Estimate Current Total Reuse & Recycling levels or current infrastructural capacities≈ 100-150 tons/day
Organic Waste reuse3 tons/day (< 1% of organic waste)
Paper Waste recycling44 tons/day (8% of paper waste)
Plastic Waste recycling25 tons/day (5% of plastic waste)
Glass Waste recycling- unknown
Metal Waste reuse/recycling> 62 tons/day (≈ 100% of reusable metal scrap or waste)
Other- unknown
Total Waste left for direct disposal2971 tons/day
Total Waste Collection levels1560 tons/day (≈ 50% of Total waste generated, ≈ 53% of Total waste left for direct disposal)
Proper Disposal at Designated Dandora dumpsite830 tons/day (≈27% of Total waste generated , ≈ 28% of Total waste left for direct disposal, ≈ 53% of Total waste collected)
Total Waste Improperly disposed or handled2140 tons/day (≈69% of Total waste generated , ≈ 72% of Total waste left for direct disposal)
Organics51%
Paper18%
Plastic16%
Glass2%
Metals2% Other
11%
Waste Composition (%)
3.2 Waste Collection levels and Safe Disposal
Current total waste collection levels in Nairobi are estimated at 50% (UNEP/CCN 2009 ISWM
Framework Report) at best, in general agreement with previous studies that found that over half of
Nairobi’s residents don’t receive any waste collection service ( Karanja (2005) in a survey of 128
households found 48% did not receive any service). This equates to total collection levels of about
1560 tons/day. Based on April 2009 CCN records, CCN collection levels at the moment are
approximately an average of 430 tons/day (Njenga, 2009a). Weighbridge records at the official
Dandora dumpsite over the period 2006 to end 2008 indicated an average 830 tons/day were
disposed there (NTT, 2009).
3.3 Summary of Waste Sinks
The total waste reuse and recycling estimates discussed put combined reuse and recycling efforts in
the city at about 100-150 tons/day, and taking the upper limit of 150 tons/day, approximately
equivalent to 5% of total waste generated. This coupled with an average waste disposal as legally
required at Dandora dumpsite of 830 tons/day, means that at most (assuming collection of
recyclables/reusables happens before final disposal) only 980 tons/day of the collected 1560
tons/day are in fact properly disposed at the designated Dandora dumpsite or properly treated.
The difference in the total collection and safe disposal figures above of 580 tons/day, summed to the
uncollected 1560 tons/day gives a grand total of 2140 tons/day; which could be assumed to be
largely disposed of in inappropriate ways such as burning and illegal/indiscriminate dumping either
by collectors or due to non-collection; all of which practices were noted to be wide spread during
the characterisation surveys and from observation by various stakeholders (ISWM Stakeholders
Workshop Report, 2009).
The various waste sources and sinks in Nairobi City are summarised in Error! Reference source not
ound. below.
Figure 1: Summary of Nairobi's Waste Sources and Sinks 2009
4 An analysis of the underlying structure and trends of the current Solid
Waste Management System in Nairobi
Based on information collected from previous waste management studies done in Nairobi, the ISWM
Secondary data report (Ngau & Kahiu, 2009), Preliminary zonal surveys within Nairobi’s
administrative zones prior to the Waste Characterisation surveys in 2009, as well as UNEP/CCN
ISWM Training and Stakeholder Workshops in 2009, a systems analysis has been attempted to
explain the underlying structure and behaviour of the Solid Waste Management (SWM) System in
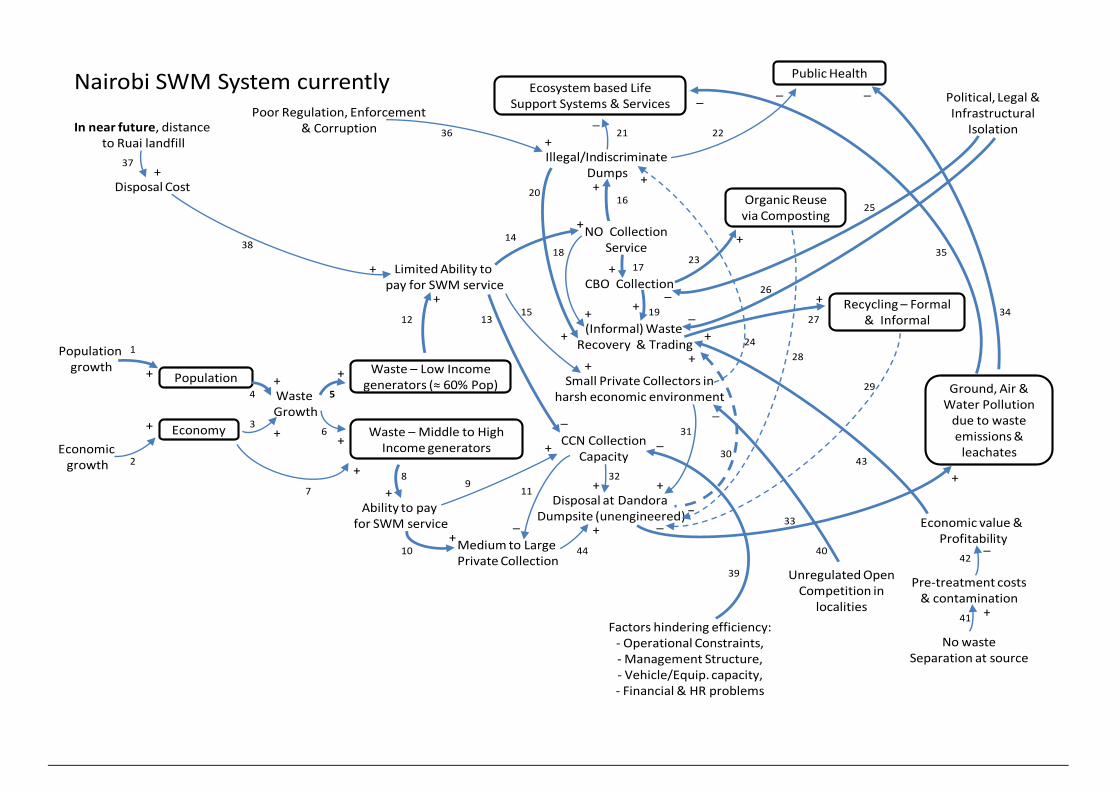
Nairobi. This makes use of the method of constructing a Causal Loop Diagram.
In a Causal Loop Diagram, a positive or plus sign (+) at the arrow head between two variables A & B
shows a positive relationship between the variables, i.e. an increase in A results in a an increase in B,
likewise a decrease in A results in a decrease in B. A negative or minus sign (-) at the arrow head
between two variables A & B shows a negative or counter relationship between the two, i.e. an
increase in A results in a decrease in B, likewise a decrease in A results in an increase in B.
A loop of three or more variables say A,B,C containing only positive signs at the arrow heads has a
net reinforcing effect, while the presence of a single negative sign in this chain creates a balancing
effect of the loop, e.g. if say A and B have a positive relationship, but B and C have a negative
relationship, the net result in the chain A, B, C is a counter effect because an increase or decrease in
B due to a similar change in A always produces the opposite change in C.
The causal loops currently perceived to be major drivers in Nairobi’s SWM system based on
qualitative/descriptive emphasis in the literature, previous studies, as well as concerns raised in the
ISWM Stakeholder’s Workshop – Dec. 2009 are indicated in bold. The trends highlighted in the
causal loop diagram, drawn strictly from qualitative/descriptive data, are then validated
quantitatively using empirical data from several sources; these supporting empirical trends are
presented afterwards in Section 4.2.
The Causal Loop Diagram is shown in the figure below, and explained in Section 4.1.
Waste – Low Income generators (≈ 60% Pop)
Recycling – Formal & Informal
Organic Reuse via Composting
Population
Economy Waste – Middle to High Income generators
Ecosystem based Life Support Systems & Services
Economicgrowth
Waste Growth
Limited Ability to pay for SWM service CBO Collection
Ability to pay for SWM service
Population growth
CCN CollectionCapacity
(Informal) Waste Recovery & Trading
Political, Legal & Infrastructural
Isolation
NO CollectionService
Illegal/Indiscriminate Dumps
Disposal at Dandora Dumpsite (unengineered) Economic value &
Profitability
Pre-treatment costs & contamination
No waste Separation at source
Medium to Large Private Collection
Small Private Collectors inharsh economic environment
+
++
++
+
+
+
+
+
+
+
_
+
+
_
+
+
+
+
+
+
++
_
+
__
+
_
+
+
+
+
_
_
Factors hindering efficiency:- Operational Constraints,- Management Structure,- Vehicle/Equip. capacity,- Financial & HR problems
_
_
Poor Regulation, Enforcement & Corruption
Nairobi SWM System currently
Disposal Cost
In near future, distance to Ruai landfill
+
+
Ground, Air & Water Pollution
due to waste emissions &
leachates
Public Health
Unregulated Open Competition in
localities
+
_
_
_
1
2
3
4 5
6
7
89
20
19
18
17
16
15
14
1312
11
10
21 22
23
28
29
30
24
25
26
27
32
33
34
31
35
36
37
38
39
40
41
42
43
44

4.1 Description of Causal Loops
The generation of waste is generally a product of the City residents’ day to day living activities and the City’s
economic activity expressed in business enterprise, commerce, industry and various public institutions (loops 3 & 4).
These in turn are fed by the respective population and economic/commercial growths prevalent in the city at the
time (loops 1 & 2). In Nairobi, the waste generated generally falls into two broad categories, that from low income
and informal settlement areas, whose residents comprise about 60% of the City’s population (loops 5) (Baud et al,
2004; Karanja, 2005; Ngau & Kahiu, 2009; UN-HABITAT & UN-OCHA, 2009) ; and that from middle to high income
areas and whose residents comprise the remainder (loops 6). A third general category of generators not explicitly
shown in the diagram but one that behaves similarly to the two already mentioned is Commerce/Business and
general non-domestic waste generators, with smaller enterprises, kiosks etc synonymous with lower income owners
and larger establishments associated with more affluent ownership.
Low income residents by nature only have a limited ability to pay for Solid Waste Management (SWM) Services,
while middle to higher income residents on the other hand are better able to pay for these services (loops 8 & 12).
In Nairobi, the general total waste collection service by the City Council of Nairobi (CCN) has been consistently
declining due to various factors including declining resourcing and facilitation from central government leading to
internal operational constraints; inefficiencies in management structure; under-billing for collection service;
inefficiencies in human resourcing as well as in revenue collection and other issues (loop 39) (JICA, 1998; Karanja,
2005). Of note, while the previous model of service charge collection coupled to water bills worked well in middle to
high income areas where each house usually has water service and an own meter connection (loop 9), it
inadvertently exempted many users of the CCN collection service - mainly high density low income area residents,
from paying the already under-billed fees such as when there was no water service at all (In 2002 only 24 per cent of
slum households in Nairobi had access to piped water, compared to 92 per cent of the rest of Nairobi - UN-HABITAT
& UN-OCHA, 2009); or when water meters are shared between several households as is largely the case in low
income and informal areas (Karanja, 2005); or when unmetered communal water outlets or taps are used, again
mainly in the lower income areas (loop 13) (Njenga, 2009b; pers. communication). General direct service charge
collections by CCN have since been scrapped completely due to poor performance and politicking, and this along
with the factors mentioned above has severely crippled the CCN’s ability to effectively meet the city’s collection and
disposal needs while meeting own operational costs over time. Loops 39 and 13 may be argued to be the most
dominant causes for the CCN’s declining performance. Several previous studies (JICA, 1998; Baud, 2004; Karanja,
2005) have comprehensively investigated and noted the various causes of CCNs declining capacity and these will not
be discussed at length here. The general resulting consensus however, reaching its culmination in the
recommendations of the JICA 1998 study commissioned by the CCN, is the privatisation of SWM services in the city.
This has led to the rapid emergence of various private waste collectors in the city (loop 10 and more recently loop
15). The limited ability of residents especially in the lower income areas to pay for SWM services however has to
date been largely unattractive to medium to large, more established private collectors, and over the years these
areas have remained under serviced due to low CCN collection ability/capacity and low medium-to-large private
collector interest (loop 14). JICA (1998) found that 26% of high income areas, 16% of middle income, 75% of low
income and 74% of surrounding areas did not receive any solid waste collection service. This lack of service delivery
in low income areas led to the emergence of Community Based Organisations (CBOs) in the form of Youth Groups
and general Self Help Organisations involving community members in the clean up of their communities (loop 17).
While many were initially formed for the major purpose of keeping neighbourhoods clean, income generation was
needed to sustain these activities. As a result a number of these are increasingly simultaneously involved in the
active collection, sorting, recovery, and sale of recyclables to waste dealers and to larger scale recyclers in what is
currently a largely informal industry (loop 19). Many CBOs are also involved in the making of compost from organic
biodegradable material for sale (loop 23) (JICA, 1998). On cleaning up of neighbourhoods, residual waste collected
by the groups is ideally taken to designated CCN communal waste collection points for further transport to disposal,
complaints abound however of irregular ongoing waste collection by CCN (Letema et al, 2009).
A separate and often closely linked network of waste collectors and dealers involved in Informal Waste recovery and
Trading also exists in the city (observed in Preliminary Zone Surveys prior to 2009 Waste characterisation exercises
and by Baud et al, 2004; Karanja, 2005), with large concentrations at Dandora and other dumpsites (loops 20 & 30) -
a situation that is un-ideal due to already observed significant pollution levels and health hazards at the official but
unengineered Dandora dumpsite (Kimani, 2007). Waste dealers’ locations tend to be dictated first by the availability
and then quality of materials and pickers in the surrounding areas – both common incidences in lower income areas
with their largely uncollected wastes. Much lesser incidence of waste dealers is noted in high income areas where
large private collectors have taken over collection of waste thereby reducing the quantity of materials traditionally
available to them for recovery and trade (Karanja, 2005).
The Community Based Organisations and associated waste recovery, trading and recycling activity going on
informally especially in the lower income areas, or in larger scale recycling industries have the potential for the
creation of new forms of sizable employment in the city, and feed into the City’s wider economic growth and longer
term material self sufficiency. Waste pickers and dealers earning their living off the recovery and sale of recyclables
at the Dandora dumpsite alone number over 2000 (Karanja, 2005). Community Based Organisations and Informal
waste recovery and trading activity however face hindrance to their effective and amplified participation in Nairobi’s
SWM due to their isolation legally, politically and infrastructure/support structure-wise (Karanja, 2005; ISWM
Stakeholder Workshop – Dec. 2009) (loops 25 & 26). From a techno-economic perspective likewise, the non-
separation of waste at source means waste is mixed and as a result contaminated by the time it is collected by the
various actors ,thereby increasing costs due to the pre-recycling cleaning requirements needed to get it recycle
ready (loop 41). This in turn reduces the recyclables’ potential economic value and profitability on the waste
recovery and trading market (loop 42), creating a harsh economic environment for the sustained involvement and
amplification of the activity (net negative effect of loop 41, followed by 42 and 43).
Small private collectors and entities are now starting to operate in low income areas (loop 15), with some however
charging very low fees in trying to capture this market and to outcompete rivals as private collection in the city is
currently under open unregulated competition; with no zoning of collection areas to keep distances and costs
reasonable, and no obligation of residents in same localities to use the same service provider (Karanja, 2005). ‘Brief
case’ and small companies charging very low fees are notorious for dumping waste illegally to cut costs (Karanja,
2005) (loop 24). Karanja (2005) notes that the open unregulated nature of private collection has implications on the
wider private waste collection sector, with several having scattered clientele and thereby charging greater fees to
overcome transport costs accruing from the non-optimal collection routes and increased distances incurred. This in
turn presents a potential barrier to the entry of new, initially small private collectors to the sector due to the high
charges already being charged and high operational costs resulting from scattered clientele.
An additional recent trend is the evolution of some CBOs to Community Based Enterprises (CBEs), which are
essentially CBOs providing a private collection service for a small fee (Karanja, 2005) (a variation of loop 15).
In spite of these efforts the lack of regular waste collection is still a problem in many low income areas (loop 14), as
evidenced in the preliminary zonal surveys and subsequent characterization exercises, a situation resulting in the
mushrooming of various illegal and indiscriminate dumping sites (- also noted in the above exercises) (loop 16), and
which pose health and environmental hazards (loops 21 & 22), and also result in longer term economic investment
dis-incentives for the areas in which they are located. Uncollected waste at indiscriminate and unengineered dumps
with its leachates and other emissions also has the effect longer term of the reducing the local, and possibly larger
scale, ecological biodiversity in the environment, resulting in a reduction in the environment’s carrying capacity and
thereby waste degradation and purifying capacities (Hjorth & Bagheri, 2006)(loops 21 & 35) – effects that serve the
Life Support Systems and Services on which the general City’s population depends for survival. Indiscriminate and
illegal dumping of waste, even due to reasons other than those discussed above such as a desire by some private
collectors to cut disposal costs is further aggravated by poor regulation, enforcement and corruption (Karanja, 2005)
(loop 36).

Middle to higher income areas receive greater waste collection coverage, largely by private collectors (loop 10), due
to their greater ability to pay for the service (loop 8). All waste collected by private collectors and the CCN is
designated for final disposal at Dandora (loops 44 & 32), although a number of illegal and indiscriminate dumps exist
as discussed earlier. Because Dandora is an open, unlined dump simultaneously ridden with open burning of waste,
significant levels of heavy metal pollution have been noted (Kimani, 2007) in the soil near the dump (loop 33) and in
the blood samples taken from surrounding communities (loop 34). Serious respiratory, skin and other health and
environmental effects, and wider potential have also been noted as a result (Kimani, 2007) (loops 34 & 35). These
environmental effects also likely permeate into the Nairobi River that flows near the dump, and so long as the dump
continues to be used as it is currently, this can be expected to continue to be the case. These ground, air and water
emissions, and environmental effects over the longer term have the potential to suppress the ability of Ecosystem
based Life Support Systems and Services to support a healthy City population (loop 34).
In the near future, following the decision to move the official disposal site from Dandora which is 7.5km east of the
CBD to a new engineered landfill at Ruai 30 km east of the CBD, there is going to be an inevitable increase in the
general cost of waste disposal (loops 37 & 38) (See Section 4.2.9). This, along with the typically heavy traffic
congestion on the City’s roads, has significant implications for the ability of Nairobi’s mostly low income waste
generators to actually pay for the SWM service in the future.
The section following records the observed empirical behaviour over time of the main actors in Nairobi’s SWM
system that supports the qualitative CLD structure described above.
4.2 Nairobi’s SWM System Trends over time
A summary is given below showing the trends pertaining to the behaviour of some of the main actors and variables
in Nairobi’s SWM system over time. This gives further insight as to what the inherent behaviour of the system has
been over time, and gives potential pointers as to what any proposed Integrated Solid Waste Management (ISWM)
Plan should seek to build on or modify in the system.
4.2.1 Population Growth
Table 7 below adapted from the City of Nairobi Environmental Outlook (UNEP & UN-Habitat, 2007) shows Nairobi’s
near exponential historical population growth.
Table 7: Nairobi’s Population since 1906
Year Nairobi Population
Population in millions
% Increase since last year record
Average annual increase based on increase since last
year record
1906 11,512 0.0115
1928 29,864 0.0299 159.4 7.2
1931 47,919 0.0479 60.5 20.2
1936 49,600 0.0496 3.5 0.7
1944 108,900 0.1089 119.6 14.9
1962 343,500 0.3435 215.4 12.0
1969 509,286 0.5093 48.3 6.9
1979 827,775 0.8278 62.5 6.3
1989 1,324,570 1.3246 60.0 6.0
1999 2,143,254 2.1433 61.8 6.2
2000 2,290,049 2.2900 6.8 6.8
2001 2,379,741 2.3797 3.9 3.9
2002 2,470,850 2.4709 3.8 3.8
2003 2,563,297 2.5633 3.7 3.7
2004 2,656,997 2.6570 3.7 3.7
2005 2,751,860 2.7519 3.6 3.6
2009* 3,265,000* 3.2650* 18.6* 4.7*
Note: 2009 Population figures are currently estimates

The near exponential growth in Nairobi’s population is also vividly depicted in Figure 2 below.
Figure 2: Nairobi City's Population growth
As observed in Table 7 recent population figures seem to suggest that growth is slowing down, with annual growth
rates for the period 2005 - 2015 projected at 2.8 %, dropping from 4.5% in the period 1995 – 2005 (UNEP & UN-
Habitat, 2007). This lends itself strongly to the possibility of population in the city levelling off at some point in the
future. Human populations are usually projected using population age structures (Gilbert& Wendell, 2008); however
assumptions of logistic growth – where population growth is limited by the amount of resources such as land or food
available in the surrounding environment (the ‘environmental carrying capacity’), are a fair approximation for human
population projection. Evidence for this is illustrated in the population growth of two of the world’s largest cities –
New York and London since 1800 as shown in Figure 3 and Figure 4.
Figure 3: Typical logistic growth curve of biological organisms (Farabee, 2001)
Figure 4: Population growth curves of New York (Gibson& Jung, 2005) and London (Wendell Cox Consultancy, 2001) respectively
From these observations, there is reasonable ground to believe that Nairobi City’s population shall start to level off
at some point and cannot continue its current exponential growth. For the purposes of projecting Nairobi’s waste
0
1
1
2
2
3
3
4
Pop
ula
tio
n in
mill
ion
s
Year
Nairobi Population Growth
0
1
2
3
4
5
6
7
8
9
Po
pu
lati
on
in m
illio
ns
Year
0123456789
10
Po
pu
lati
on
in m
illio
ns
Year

generation into the future therefore, logistic population growth is assumed. While the physical application of the
concept of an area’s population ‘carrying capacity’ is tricky as cities tend to expand geographically and to
increasingly import resources from further afield; a population carrying capacity of Nine million residents is assumed
for the logistic population projection model used for Nairobi, on the basis of trying to match the initial population
growth in the logistic model as closely as possible to the recorded growth of Nairobi’s population as above. The
results of the projected vs. recorded population in the past, and population projections from 2009 are shown in
Figure 5 below.
Figure 5: Projected Population Growth in Nairobi pre and post 2009
4.2.2 Economic growth
GDP per capita data from the Kenya National Bureau of Statistics (2009) is used a proxy to illustrate the growth of
the city’s economy and resulting per capita benefits over its recent history. This is shown in Figure 6 below.
Figure 6: Kenya's GDP per capita growth since 1996
The increasing trends in the City’s population and welfare are seen to be consistent with the rapid increase in waste
generation. From the data, it would seem that population growth (Section 4.2.1) is the main driver of the rapid
waste increase in Nairobi.
0
1
2
3
4
5
6
7
8
Po
pu
lati
on
in m
illio
ns
Year
Projected Population Growth
Recorded Population Growth (UNEP & UN-Habitat, 2007)
Modelled Logistic Population Growth & Projection beyond 2009
0200,000400,000600,000800,000
1,000,0001,200,0001,400,0001,600,000
GD
P p
er c
apit
a
Year
GDP per capita growth (constant 1982 prices)

4.2.3 Solid Waste Quantities generated vs. Total Collection levels, CCN and Private Collection contributions, and
levels of total safe waste disposal over time
Historical solid waste generation data for Nairobi City is shown below using annual records from the CCN for the
period 1973 to 1988 (Karanja, 2005), and results from more recent work by JICA (1998), ITDG (2004) (cited by Bahri,
2005), and waste characterisation and quantification surveys carried out in 2009. This is compared against average
CCN waste collection, total waste collection and private collection contributions over the same period, using
information adapted from the same sources as well as from the UNEP ISWM Training and Stakeholder Workshops
held in 2009. The entry of Private waste collectors into Solid Waste Management the city was in 1986 (Karanja,
2005), and no historical records exist as to their impact until the JICA study in 1998. To estimate their performance
pre-1998, a linear increase in their collection levels relative to the recorded 1998 level is assumed from 1986 when
they started operations. Current disposal amounts at the designated landfill at Dandora were estimated using
average weighbridge records from 2006-2008 (NTT, 2009).
Figure 7: Solid waste generation vs. CCN, Private and Total Collection levels and disposal at designated landfill
From the information available, it’s seen that while the absolute waste collection levels of the CCN (including
contracts awarded to private companies to execute some of the work) have increased from 1998 to 2009, their
overall contribution to waste collection in the city has dropped from 16% to 14%. Private Collector contributions - in
the form of private companies and CBOs, to the amounts of total waste collected seem to have increased from 8% to
36% over the same period.
Given that CCN no longer actively collects service charges from residents, this trend could be due to the emergence
of more efficient private waste collection (with its more efficient non-central charge collection mechanisms), whose
service the populace is better satisfied with and in turn finds more agreeable to pay for. Over time, this will have led
to an increase in the capacity, market power and political clout of private collector companies (through residents’
satisfaction - who can protest and influence public officials’ sentiment against extra CCN spending, through company
owners that could have political sympathisers, and through greater general public embrace and silent forcing of the
political hand) relative to the CCN DoE; thereby leading to reduced government willingness to spend on SWM budget
funds to CCN and in time constraining its performance. In this position, CCN is poorly placed to redeem the waste
collection ‘market’ it once held, and is better positioned to take on a regulatory role using the one position of
0
500
1,000
1,500
2,000
2,500
3,000
3,500
Tota
l MSW
(to
ns/
day
)
Year
Solid waste generation vs. CCN, Private and Total Collection levels and disposal at designated landfill
Total Solid Waste Generation Average CCN Collection Private Collection Total Waste CollectionDisposal at designated landfiill
_
+
+
+
+
+
+
+
+
+
+
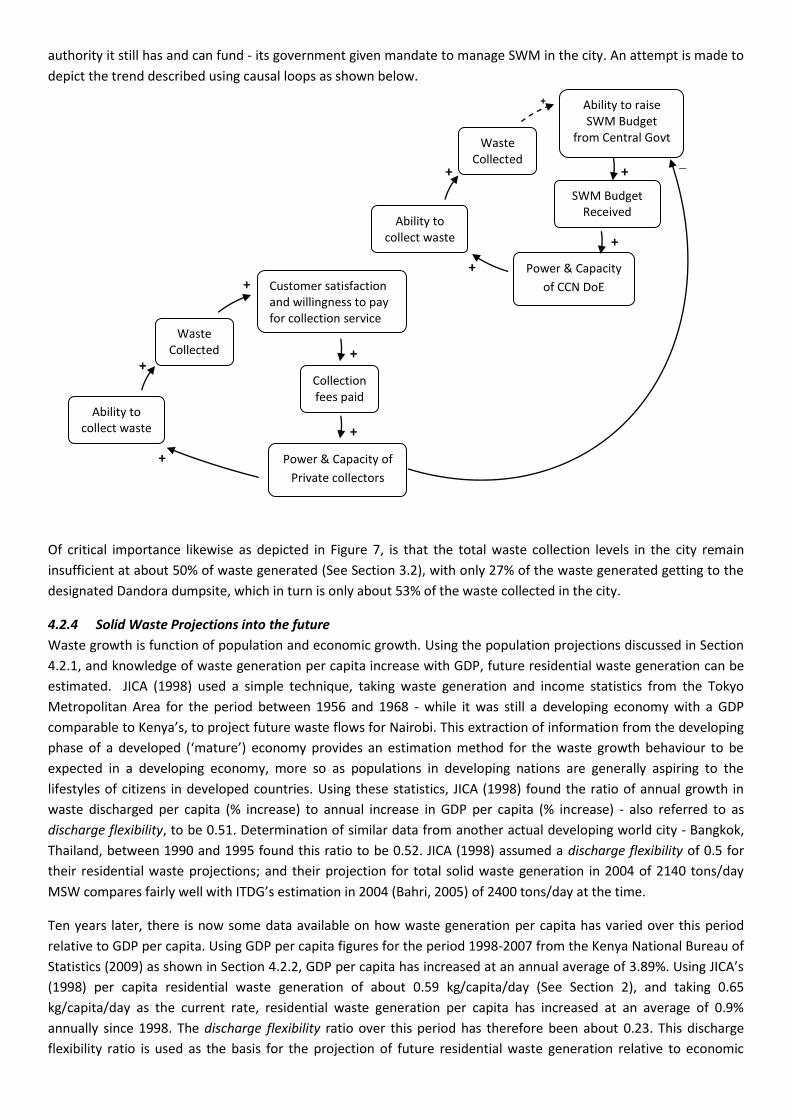
authority it still has and can fund - its government given mandate to manage SWM in the city. An attempt is made to
depict the trend described using causal loops as shown below.
Of critical importance likewise as depicted in Figure 7, is that the total waste collection levels in the city remain
insufficient at about 50% of waste generated (See Section 3.2), with only 27% of the waste generated getting to the
designated Dandora dumpsite, which in turn is only about 53% of the waste collected in the city.
4.2.4 Solid Waste Projections into the future
Waste growth is function of population and economic growth. Using the population projections discussed in Section
4.2.1, and knowledge of waste generation per capita increase with GDP, future residential waste generation can be
estimated. JICA (1998) used a simple technique, taking waste generation and income statistics from the Tokyo
Metropolitan Area for the period between 1956 and 1968 - while it was still a developing economy with a GDP
comparable to Kenya’s, to project future waste flows for Nairobi. This extraction of information from the developing
phase of a developed (‘mature’) economy provides an estimation method for the waste growth behaviour to be
expected in a developing economy, more so as populations in developing nations are generally aspiring to the
lifestyles of citizens in developed countries. Using these statistics, JICA (1998) found the ratio of annual growth in
waste discharged per capita (% increase) to annual increase in GDP per capita (% increase) - also referred to as
discharge flexibility, to be 0.51. Determination of similar data from another actual developing world city - Bangkok,
Thailand, between 1990 and 1995 found this ratio to be 0.52. JICA (1998) assumed a discharge flexibility of 0.5 for
their residential waste projections; and their projection for total solid waste generation in 2004 of 2140 tons/day
MSW compares fairly well with ITDG’s estimation in 2004 (Bahri, 2005) of 2400 tons/day at the time.
Ten years later, there is now some data available on how waste generation per capita has varied over this period
relative to GDP per capita. Using GDP per capita figures for the period 1998-2007 from the Kenya National Bureau of
Statistics (2009) as shown in Section 4.2.2, GDP per capita has increased at an annual average of 3.89%. Using JICA’s
(1998) per capita residential waste generation of about 0.59 kg/capita/day (See Section 2), and taking 0.65
kg/capita/day as the current rate, residential waste generation per capita has increased at an average of 0.9%
annually since 1998. The discharge flexibility ratio over this period has therefore been about 0.23. This discharge
flexibility ratio is used as the basis for the projection of future residential waste generation relative to economic
Power & Capacity of
Private collectors
Ability to collect waste
Waste Collected
Customer satisfaction and willingness to pay for collection service &
Collection fees paid
Power & Capacity
of CCN DoE
Ability to collect waste
Waste Collected
Ability to raise SWM Budget
from Central Govt
SWM Budget Received
growth, and in conjunction with the projected population (Section 4.2.1 ) gives future projection estimates for total
domestic waste generation in Nairobi. Non-domestic waste generation, being the product of much more complex
interplay between various factors including general economic growth, day time working population and day time
economic activity (not always necessarily based in the city permanently, e.g. open markets and market traders
whose participants might be peri-urban residents, city resource imports that fluctuate with need, and peri-urban
resident movement to institutions in the city such as education and healthcare etc), is modelled and projected
simplistically assuming linear growth based on recorded experience from 1998 to 2009. From 263 tons/day in 1998
to 999 tons/day of Non-domestic waste in 2009 (See details in Section 2), Non-domestic waste has grown at a simple
linear annual growth of 25% from 1998 levels.
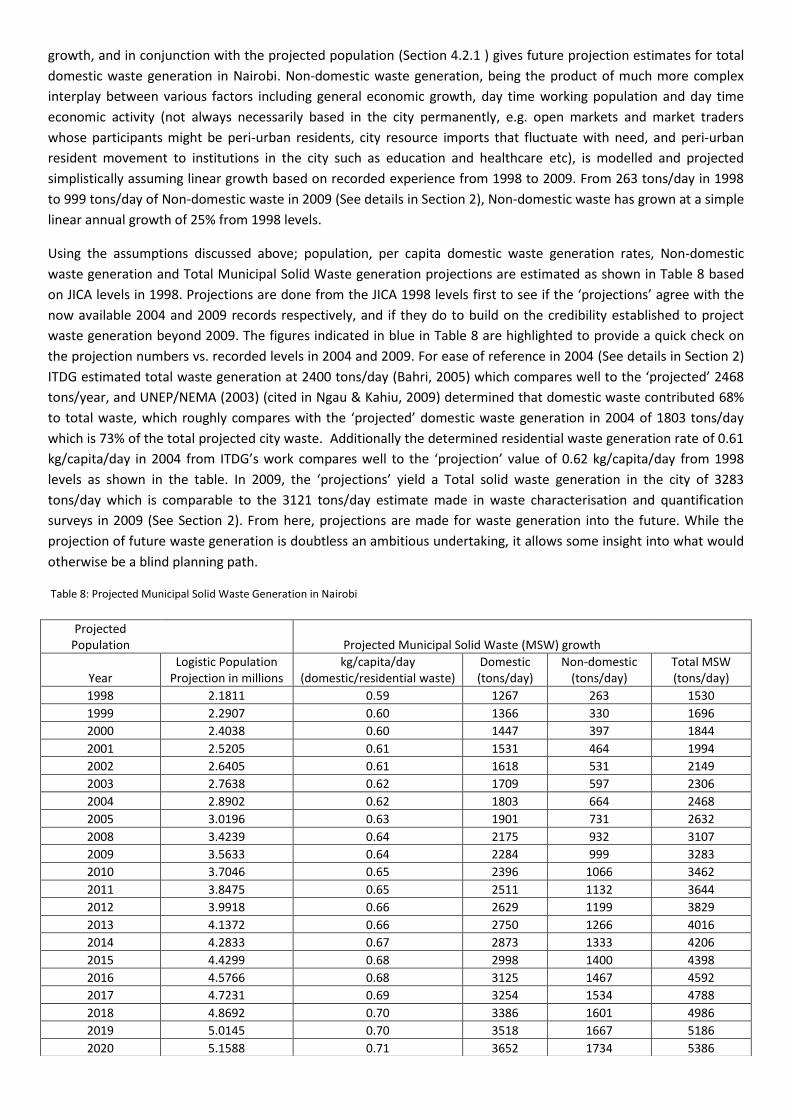
Using the assumptions discussed above; population, per capita domestic waste generation rates, Non-domestic
waste generation and Total Municipal Solid Waste generation projections are estimated as shown in Table 8 based
on JICA levels in 1998. Projections are done from the JICA 1998 levels first to see if the ‘projections’ agree with the
now available 2004 and 2009 records respectively, and if they do to build on the credibility established to project
waste generation beyond 2009. The figures indicated in blue in Table 8 are highlighted to provide a quick check on
the projection numbers vs. recorded levels in 2004 and 2009. For ease of reference in 2004 (See details in Section 2)
ITDG estimated total waste generation at 2400 tons/day (Bahri, 2005) which compares well to the ‘projected’ 2468
tons/year, and UNEP/NEMA (2003) (cited in Ngau & Kahiu, 2009) determined that domestic waste contributed 68%
to total waste, which roughly compares with the ‘projected’ domestic waste generation in 2004 of 1803 tons/day
which is 73% of the total projected city waste. Additionally the determined residential waste generation rate of 0.61
kg/capita/day in 2004 from ITDG’s work compares well to the ‘projection’ value of 0.62 kg/capita/day from 1998
levels as shown in the table. In 2009, the ‘projections’ yield a Total solid waste generation in the city of 3283
tons/day which is comparable to the 3121 tons/day estimate made in waste characterisation and quantification
surveys in 2009 (See Section 2). From here, projections are made for waste generation into the future. While the
projection of future waste generation is doubtless an ambitious undertaking, it allows some insight into what would
otherwise be a blind planning path.
Table 8: Projected Municipal Solid Waste Generation in Nairobi
Projected Population
Projected Municipal Solid Waste (MSW) growth
Year Logistic Population
Projection in millions kg/capita/day
(domestic/residential waste) Domestic (tons/day)
Non-domestic (tons/day)
Total MSW (tons/day)
1998 2.1811 0.59 1267 263 1530
1999 2.2907 0.60 1366 330 1696
2000 2.4038 0.60 1447 397 1844
2001 2.5205 0.61 1531 464 1994
2002 2.6405 0.61 1618 531 2149
2003 2.7638 0.62 1709 597 2306
2004 2.8902 0.62 1803 664 2468
2005 3.0196 0.63 1901 731 2632
2008 3.4239 0.64 2175 932 3107
2009 3.5633 0.64 2284 999 3283
2010 3.7046 0.65 2396 1066 3462
2011 3.8475 0.65 2511 1132 3644
2012 3.9918 0.66 2629 1199 3829
2013 4.1372 0.66 2750 1266 4016
2014 4.2833 0.67 2873 1333 4206
2015 4.4299 0.68 2998 1400 4398
2016 4.5766 0.68 3125 1467 4592
2017 4.7231 0.69 3254 1534 4788
2018 4.8692 0.70 3386 1601 4986
2019 5.0145 0.70 3518 1667 5186
2020 5.1588 0.71 3652 1734 5386
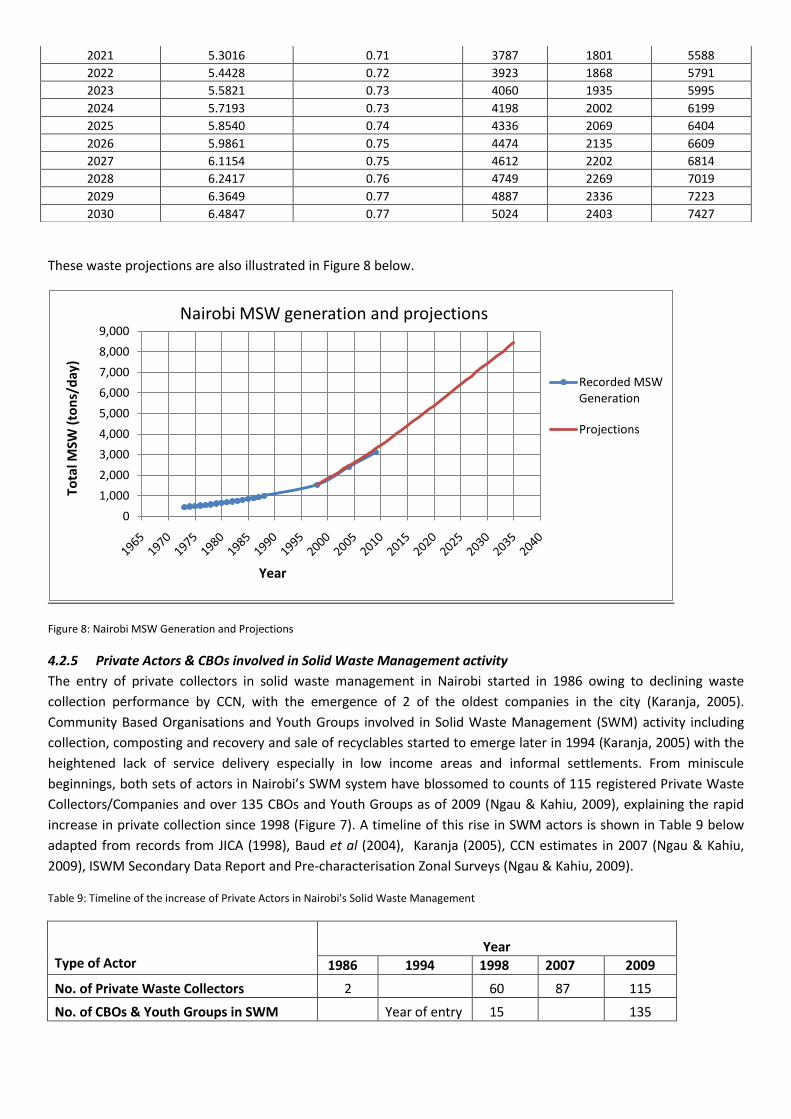
These waste projections are also illustrated in Figure 8 below.
Figure 8: Nairobi MSW Generation and Projections
4.2.5 Private Actors & CBOs involved in Solid Waste Management activity
The entry of private collectors in solid waste management in Nairobi started in 1986 owing to declining waste
collection performance by CCN, with the emergence of 2 of the oldest companies in the city (Karanja, 2005).
Community Based Organisations and Youth Groups involved in Solid Waste Management (SWM) activity including
collection, composting and recovery and sale of recyclables started to emerge later in 1994 (Karanja, 2005) with the
heightened lack of service delivery especially in low income areas and informal settlements. From miniscule
beginnings, both sets of actors in Nairobi’s SWM system have blossomed to counts of 115 registered Private Waste
Collectors/Companies and over 135 CBOs and Youth Groups as of 2009 (Ngau & Kahiu, 2009), explaining the rapid
increase in private collection since 1998 (Figure 7). A timeline of this rise in SWM actors is shown in Table 9 below
adapted from records from JICA (1998), Baud et al (2004), Karanja (2005), CCN estimates in 2007 (Ngau & Kahiu,
2009), ISWM Secondary Data Report and Pre-characterisation Zonal Surveys (Ngau & Kahiu, 2009).
Table 9: Timeline of the increase of Private Actors in Nairobi's Solid Waste Management
Type of Actor
Year
1986 1994 1998 2007 2009
No. of Private Waste Collectors 2 60 87 115
No. of CBOs & Youth Groups in SWM Year of entry 15 135
0
1,000
2,000
3,000
4,000
5,000
6,000
7,000
8,000
9,000
To
tal M
SW (
ton
s/d
ay)
Year
Nairobi MSW generation and projections
Recorded MSW Generation
Projections
2021 5.3016 0.71 3787 1801 5588
2022 5.4428 0.72 3923 1868 5791
2023 5.5821 0.73 4060 1935 5995
2024 5.7193 0.73 4198 2002 6199
2025 5.8540 0.74 4336 2069 6404
2026 5.9861 0.75 4474 2135 6609
2027 6.1154 0.75 4612 2202 6814
2028 6.2417 0.76 4749 2269 7019
2029 6.3649 0.77 4887 2336 7223
2030 6.4847 0.77 5024 2403 7427
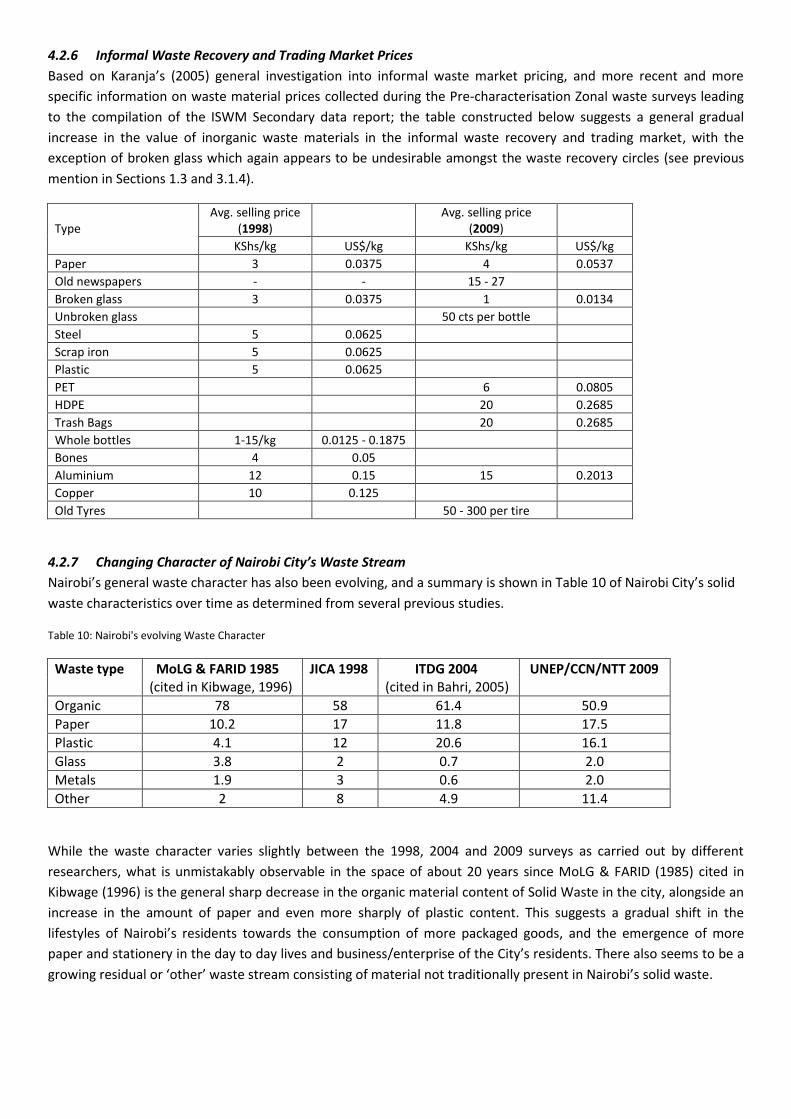
4.2.6 Informal Waste Recovery and Trading Market Prices
Based on Karanja’s (2005) general investigation into informal waste market pricing, and more recent and more
specific information on waste material prices collected during the Pre-characterisation Zonal waste surveys leading
to the compilation of the ISWM Secondary data report; the table constructed below suggests a general gradual
increase in the value of inorganic waste materials in the informal waste recovery and trading market, with the
exception of broken glass which again appears to be undesirable amongst the waste recovery circles (see previous
mention in Sections 1.3 and 3.1.4).
Type Avg. selling price
(1998) Avg. selling price
(2009)
KShs/kg US$/kg KShs/kg US$/kg
Paper 3 0.0375 4 0.0537
Old newspapers - - 15 - 27 Broken glass 3 0.0375 1 0.0134
Unbroken glass
50 cts per bottle Steel 5 0.0625
Scrap iron 5 0.0625 Plastic 5 0.0625 PET
6 0.0805
HDPE
20 0.2685
Trash Bags
20 0.2685
Whole bottles 1-15/kg 0.0125 - 0.1875 Bones 4 0.05 Aluminium 12 0.15 15 0.2013
Copper 10 0.125 Old Tyres
50 - 300 per tire
4.2.7 Changing Character of Nairobi City’s Waste Stream
Nairobi’s general waste character has also been evolving, and a summary is shown in Table 10 of Nairobi City’s solid
waste characteristics over time as determined from several previous studies.
Table 10: Nairobi's evolving Waste Character
Waste type MoLG & FARID 1985 JICA 1998 ITDG 2004 UNEP/CCN/NTT 2009 (cited in Kibwage, 1996) (cited in Bahri, 2005)
Organic 78 58 61.4 50.9
Paper 10.2 17 11.8 17.5
Plastic 4.1 12 20.6 16.1
Glass 3.8 2 0.7 2.0
Metals 1.9 3 0.6 2.0
Other 2 8 4.9 11.4
While the waste character varies slightly between the 1998, 2004 and 2009 surveys as carried out by different
researchers, what is unmistakably observable in the space of about 20 years since MoLG & FARID (1985) cited in
Kibwage (1996) is the general sharp decrease in the organic material content of Solid Waste in the city, alongside an
increase in the amount of paper and even more sharply of plastic content. This suggests a gradual shift in the
lifestyles of Nairobi’s residents towards the consumption of more packaged goods, and the emergence of more
paper and stationery in the day to day lives and business/enterprise of the City’s residents. There also seems to be a
growing residual or ‘other’ waste stream consisting of material not traditionally present in Nairobi’s solid waste.
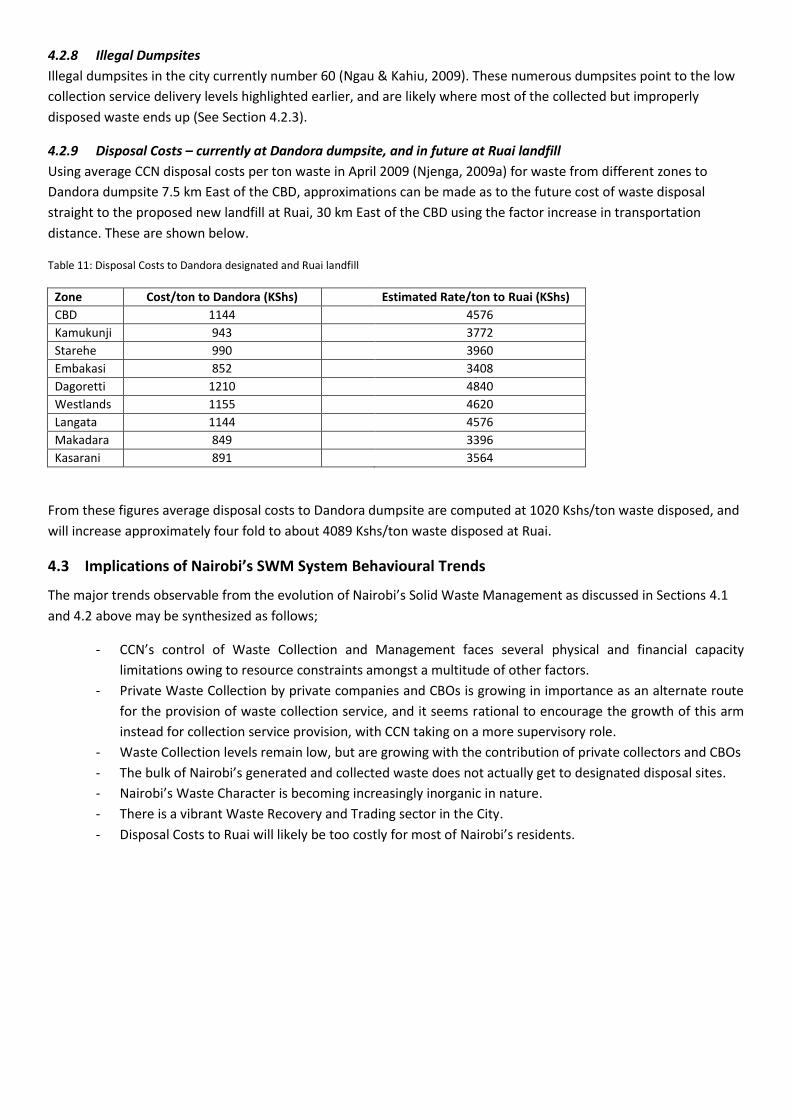
4.2.8 Illegal Dumpsites
Illegal dumpsites in the city currently number 60 (Ngau & Kahiu, 2009). These numerous dumpsites point to the low
collection service delivery levels highlighted earlier, and are likely where most of the collected but improperly
disposed waste ends up (See Section 4.2.3).
4.2.9 Disposal Costs – currently at Dandora dumpsite, and in future at Ruai landfill
Using average CCN disposal costs per ton waste in April 2009 (Njenga, 2009a) for waste from different zones to
Dandora dumpsite 7.5 km East of the CBD, approximations can be made as to the future cost of waste disposal
straight to the proposed new landfill at Ruai, 30 km East of the CBD using the factor increase in transportation
distance. These are shown below.
Table 11: Disposal Costs to Dandora designated and Ruai landfill
Zone Cost/ton to Dandora (KShs)
Estimated Rate/ton to Ruai (KShs)
CBD 1144
4576
Kamukunji 943
3772
Starehe 990
3960
Embakasi 852
3408
Dagoretti 1210
4840
Westlands 1155
4620
Langata 1144
4576
Makadara 849
3396
Kasarani 891
3564
From these figures average disposal costs to Dandora dumpsite are computed at 1020 Kshs/ton waste disposed, and
will increase approximately four fold to about 4089 Kshs/ton waste disposed at Ruai.
4.3 Implications of Nairobi’s SWM System Behavioural Trends
The major trends observable from the evolution of Nairobi’s Solid Waste Management as discussed in Sections 4.1
and 4.2 above may be synthesized as follows;
- CCN’s control of Waste Collection and Management faces several physical and financial capacity
limitations owing to resource constraints amongst a multitude of other factors.
- Private Waste Collection by private companies and CBOs is growing in importance as an alternate route
for the provision of waste collection service, and it seems rational to encourage the growth of this arm
instead for collection service provision, with CCN taking on a more supervisory role.
- Waste Collection levels remain low, but are growing with the contribution of private collectors and CBOs
- The bulk of Nairobi’s generated and collected waste does not actually get to designated disposal sites.
- Nairobi’s Waste Character is becoming increasingly inorganic in nature.
- There is a vibrant Waste Recovery and Trading sector in the City.
- Disposal Costs to Ruai will likely be too costly for most of Nairobi’s residents.
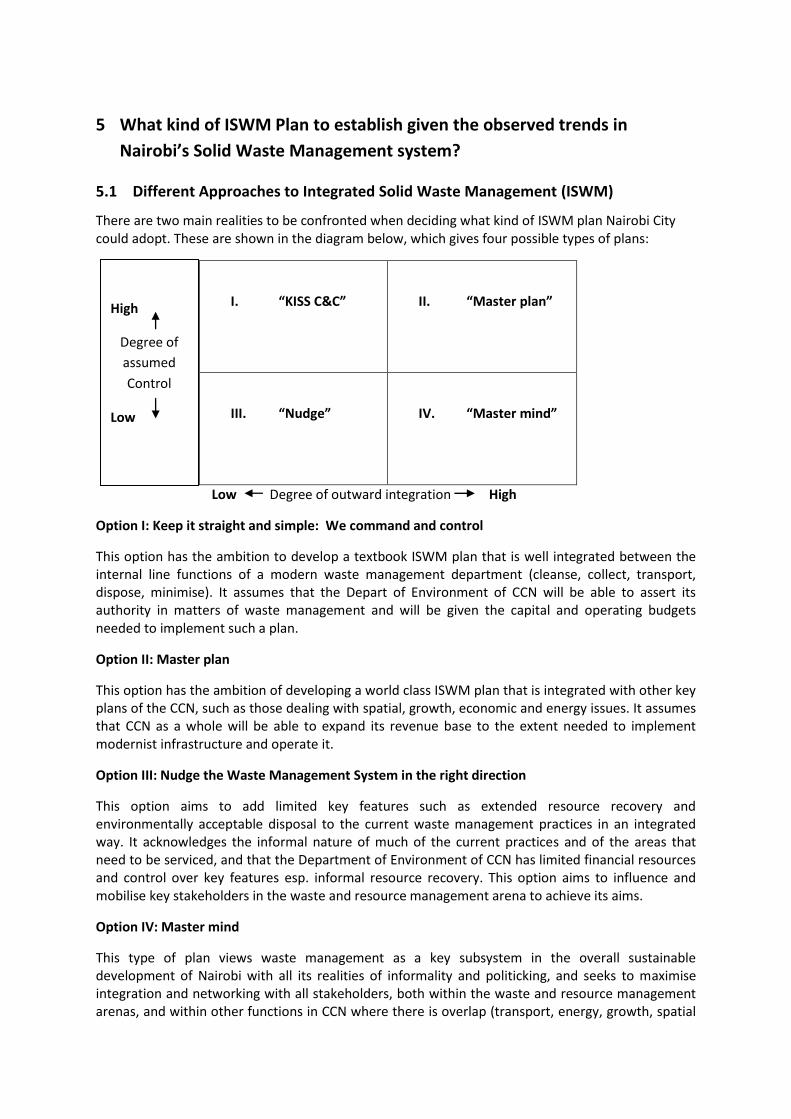
5 What kind of ISWM Plan to establish given the observed trends in
Nairobi’s Solid Waste Management system?
5.1 Different Approaches to Integrated Solid Waste Management (ISWM)
There are two main realities to be confronted when deciding what kind of ISWM plan Nairobi City could adopt. These are shown in the diagram below, which gives four possible types of plans:
I. “KISS C&C”
II. “Master plan”
III. “Nudge”
IV. “Master mind”
Low Degree of outward integration High
Option I: Keep it straight and simple: We command and control
This option has the ambition to develop a textbook ISWM plan that is well integrated between the internal line functions of a modern waste management department (cleanse, collect, transport, dispose, minimise). It assumes that the Depart of Environment of CCN will be able to assert its authority in matters of waste management and will be given the capital and operating budgets needed to implement such a plan.
Option II: Master plan
This option has the ambition of developing a world class ISWM plan that is integrated with other key plans of the CCN, such as those dealing with spatial, growth, economic and energy issues. It assumes that CCN as a whole will be able to expand its revenue base to the extent needed to implement modernist infrastructure and operate it.
Option III: Nudge the Waste Management System in the right direction
This option aims to add limited key features such as extended resource recovery and environmentally acceptable disposal to the current waste management practices in an integrated way. It acknowledges the informal nature of much of the current practices and of the areas that need to be serviced, and that the Department of Environment of CCN has limited financial resources and control over key features esp. informal resource recovery. This option aims to influence and mobilise key stakeholders in the waste and resource management arena to achieve its aims.
Option IV: Master mind
This type of plan views waste management as a key subsystem in the overall sustainable development of Nairobi with all its realities of informality and politicking, and seeks to maximise integration and networking with all stakeholders, both within the waste and resource management arenas, and within other functions in CCN where there is overlap (transport, energy, growth, spatial
High
Degree of
assumed
Control
Low
and economic planning). It is premised on systems thinking and views such as “capacity follows resources follows leadership”.
5.2 Discussions
Based on the observations made in Sections 4.1 and 4.2 of the realities and challenges of Solid
Waste Management in Nairobi along with CCN’s physical capacity and financial limitations and the
growth of several alternate actors, it seems reasonable to direct the ISWM Plan towards “Option III:
Nudge the SWM System in the right direction”, or at best towards “Option IV: Master Mind”.
5.3 Nairobi’s Solid Waste Management System with interventions enabling ISWM
Based on the picture drawn in the previous sections outlining the nature of Nairobi’s solid waste
management and evolution over time, several proposals are outlined to handle the waste generated
in the city holistically.
Following workshop consultations with various stakeholders in the city’s waste management and
with the City Council of Nairobi, the stated goals of the ISWM Plan and of the City Council in general
are:
1. To build source separation as a core component of waste management in Nairobi, so as to enable frequent collection of disease-causing fractions for resource recovery and/or treatment, whilst also providing more easily stored and handled recyclables and residuals.
2. To restructure and extend collection of source separated streams with a view of protecting public health
3. To build infrastructure and systems for safe disposal of residuals.
Within the above goals, several broad actions were proposed by Stakeholders:
To build awareness and capacity for waste reduction and source separation as a core component of waste management for resource recovery.
To restructure and extend efficient and equitable collection and transportation of solid waste streams with a view of protecting public health and the environment.
To build environmentally sound infrastructure, and systems for safe treatment and disposal of waste residuals.
To create an enabling environment for resource recovery and the development of markets for different recyclables.
With these in mind, Specific ISWM Intervention Actions are developed and proposed in Section 6
following.

6 Discussion of Specific Intervention Actions
6.1 Reducing Waste Generation at Source
Due to the highlighted rapid growth of municipal solid waste in Nairobi and the resulting
implications in terms of required landfill space and disposal costs, the reduction of waste generation
at source will be particularly important in the City’s waste management strategy here on.
6.1.1 Achieving Waste Reduction at source: Flat rates or Weight-Based Waste Collection Fees?
While there is a temptation to have waste collection paid for in Nairobi using flat or fixed rates,
perhaps via differentiated charges for different income level residents as in the past and as is the
case traditionally in many other areas globally; flat rate or fixed collection fees regardless of
differentiated charges for low, middle and high income residents or enterprises cannot lead to
behavioural change as regards the reduction of waste for disposal at source. This is because
residents or generators are buffered from the direct, actual cost of waste disposal relative to how
much they themselves are generating, and any marketing or other campaigns to induce behavioural
change towards less waste generation will have little effect without an economic penalty inherent in
higher charges for excessive waste generation – which acts as a behavioural feed back loop. An
inherent economic penalty or cost for excessive waste generation and disposal is especially easily
comprehensible by all generators as monetary cost for service is a virtually universal language. This
can be illustrated at its simplest using a causal loop diagram as follows;
_
+
This system of paying for waste collection service can also be argued to be fairer and more sensitive
to different generators whether residential, non-domestic, or of differing income levels, as the rich
typically generate more waste (as is evident in the different waste generation rates of the different
income level zones sampled at immediate source – See Section 2.2), and in turn pay should pay
more for its disposal. The accountability or responsibility for the charges ultimately collected from
the generator also becomes internal and blame is not placed on external parties or collectors who
might be accused of charging exorbitant per household or business/commercial rates determined
from averages. The use of Pay as you Throw schemes in other countries such as Sweden, Belgium,
Denmark has been observed to lead to decreased waste generation by residents through genuine
behavioural change, however in some instances also through evasion by illegal dumping; and to
increased separation of waste for recycling to decrease amounts set out for disposal (Dahlén &
Lagerkvist, 2010; UNEP/CCN 3rd ISWM Stakeholder’s Workshop, 2009). In the Nairobi context,
efficient supervisory and regulatory oversight by the CCN and by responsible community
associations will be crucial to overcome possible evasion and illegal dumping resulting from the use
Excessive Waste put out
for direct disposal
High weight-based
charges accruing
of the Polluter Pay principle in charging for waste collection service. Issues regarding supervision and
regulatory oversight of the waste management system in Nairobi are discussed in Section 6.2.5.
Other crucial elements in this system include the determination of appropriate streamlined
collection fees per kilogram of waste generated including source waste separation costs for all
residents to refer to (Section 6.2.2); determination of on ground implementation implications and
charge collection mechanisms in the Nairobi Context (Section 6.1.2) ; zoning and contracting
arrangements for service provision (Section 6.2.3 and 6.2.4); and importantly efficient regulation and
supervisory oversight to ensure residents and collectors are not discarding waste indiscriminately or
illegally to avoid charges (Section 6.2.5).
6.1.2 Ground Implementation of Weight Based Charges and Mechanisms for Charge collection
A weight based waste collection and fee system seems reasonably implementable in the Nairobi
context through the use of portable hanging scales, with waste weighed under the supervision of
collectors and house/business owners followed by the provision of a receipt as proof, prior to the
receipt of the waste by the collector. In the case of communes such as apartments or flats where
generator differentiation might be difficult, total wastes collected can be weighed, and the amount
due divided evenly and receipted amongst the known numbers of households or generators in the
commune. The generators would then pay according to the amounts generated, and fee collections
can be done directly by the collectors who would know the area and communities they are dealing
with well; bypassing the need for centralised charge collection with its associated high
administration costs and mismanagement as has been the case in the past (Karanja, 2005).
6.2 Getting general waste collection and safe disposal right
While the ultimate goals of Integrated Solid Waste Management are to reduce waste being
generated at source, derive value from as much of the waste as possible and safely dispose of
residual or left over waste, these goals require long term behavioural changes and policies whose
impact will not be felt from the get go. It is therefore logical to begin any planning towards this end
by getting the general waste collection and disposal system to work effectively, before emphasis can
be turned to waste diversion and value derivation.
While plans for the privatisation of Solid Waste Collection in Nairobi are rightly underway following
JICA’s (1998) recommendations, the organisation of private waste collection in the city needs to
resolve two major issues;
The scattered distribution of private collectors’ clients (Baud et al, 2004; Karanja, 2005;
UNEP/CCN 3rd ISWM Stakeholder Workshop – Dec. 2009). Because private waste collectors are
profit driven and no legal bounds exist as to their operational areas or to tie residents to service
providers in their locality, collection service costs will only increase, alienating pockets of
residents that cannot afford the desired rates and in the process running counter to the aims of
reasonable collection charges and equitable collection levels. This is due to the use of non-
optimal collection routes and accumulation of high transport distances on the part of collectors
in trying to get to scattered perceived higher income clients and will increasingly alienate
residents that cannot afford the service.
The non regulation or streamlining of collection fees under the current regime of open
unregulated competition (Baud et al, 2004; Karanja, 2005; UNEP/CCN 3rd ISWM Stakeholder
Workshop – Dec. 2009). The collection of arbitrary service charges directly from generators by
private collectors, especially from households, only promotes the provision of service to those
who can pay the desired arbitrary rates, leading to the alienation of lower income areas by the
majority of private companies. The official streamlining of charges, along with the formalisation
and encouragement of CBOs as private collection entities free to operate in the lower income
areas they have already become established in, can however help to increase service provision
at reasonable rates in especially lower income areas. Participation in waste collection generally
needs to appeal both to economic viability and the common good, and streamlined charges
should try to balance the two. Indeed there is evidence to suggest that the ‘poor’ are in fact
willing to pay for improved service levels. Esho (1997) (cited in Baud et al, 2004) found that 47%
of residents less than KShs 100/month were willing to pay more than KShs. 200, while 50% of
those paying KShs. 300 – 400/month were willing to pay as much as Kshs. 800/month. Further to
this, more recent evidence suggests the same willingness with 76%, 59%, 58% and 67% of
respondents in high, middle, low income and surrounding areas respectively willing to pay for
improved waste collection services (UNEP/CCN 3rd ISWM Stakeholder Workshop – Dec. 2009).
Several Strategies are proposed to improve the efficiency and levels of Waste Collection and Safe
disposal in the City. These are discussed in the sections following.
6.2.1 Formalisation of CBO Waste Collection Operations, Waste Recovery and Trading, and
Large scale recycling supply chains
In addition to the current registration and oversight of Private Waste Collection Companies in
Nairobi by the CCN, there is a need to similarly recognize, formalise and streamline the operation of
CBO’s in waste collection so they have the same legal and operational status as Private Collectors; to
formalise the operation and roles of actors involved in Waste Recovery and Trading activity as
described in Section 3.1.1 (i.e. waste pickers - operating at the neighbourhood, street and dump
levels, Waste dealers and suppliers to Large scale Recyclers); and to formalise the waste material
supply chains to the recycling industry itself to minimise exploitation of informal recyclers and
negotiate pricing.
There is evidence for success of this approach from the emergence of Participatory Solid Waste
Management defined as ‘‘Solid waste recovery, reuse and recycling practices with organized
and empowered recycling co-ops supported with public policies, embedded in solidarity economy
and targeting social equity and environmental sustainability” (Jutta, 2010). The concept combines
environmental and social issues such as employment generation, increased income generation,
improved occupational health and the promotion of human development opportunities and
environmental health in general (Jutta, 2010).
Jutta (2010) cites an example of the success of Inclusive or Participatory Waste Management in the
organized Recyclers’ Movement in Brazil, officially created in 2001 during the 1st National Recyclers’
Congress in Brasilia, with the participation of more than 1700 recyclers from all over Brazil. The
‘‘Brasilia document” expresses the needs of the people who make a living from recovering
recyclables. The first Latin American Congress of recyclers was held in Caxias do Sul where the
‘‘Caxias document” was produced; disseminating the conditions of recyclers in various countries in

Latin America. The movement has gone onto gain momentum through strengthening of regional
networks.
Jutta (2010) notes several pivotal lessons learned over the past years from research on Co-op
recycling and is cited directly below:
“Government support is crucial to the recyclers, since they have no capital to invest in
infrastructure and capacity building. Co-operative recycling should not be treated as a separate
program, but rather be integrated into the municipal solid waste program. Government
recognition and commitment are essential.
Co-ops need to work in autonomy, allowing them to adjust to prevailing local conditions and
specific municipal waste management frameworks.
Taking topography into consideration is decisive for pushcartdriven waste collection, therefore
dividing the area into water catchments works well.
Professional relations need to gear the relationship between recycling groups and the
municipality. Paternalistic approaches maintain or create dependency.
A social assistance approach needs to focus on empowerment of the recycling groups and on
strengthening their autonomy.
Recovering the dignity and citizenship of recyclers needs to become a public responsibility.
Overall, there are many social, environmental, and economic gains for the municipality from the
collection and separation of recyclables; these benefits need to be fully recognized and valued.
A network of recycling social enterprises needs to be in place, together with adequate policies,
protecting the sector against market and price fluctuations.”
6.2.2 Streamlining Waste Collection Fees in the City (including separation at source costs)
As the CCN withdraws from the collection and transport of solid waste generated in the city in the
near future leaving the space to private collection and CBOs in their respective various forms, it will
need to actively take on the role of regulator of the private waste collection enterprise in the City. As
discussed in Section 6.2.3 there is a strong case for this regulation to include the zoning of waste
collection areas for private collector and CBO operations so as to minimise transport and thereby
disposal costs to residents, and legally bind residents to use the same collector. This would in turn
lead to reduced incidence of non-collection of waste due to heightened transport costs passed on to
residents, and greater equity in service delivery across the city. In order for this to work however,
the economic viability of collection operations in any area of the city need to be guaranteed to the
collector and one way to achieve this is the development of streamlined collection charges
applicable to all generators regardless of location in the city.
Using average CCN disposal costs per ton waste in April 2009 for disposal at Dandora dumpsite 7.5
km East of the CBD (Njenga, 2009a), and elevated future disposal costs on account of the factor
increase in transportation distance to the proposed new landfill at Ruai 30 km East of the CBD; the
calculations below show the necessary approximate disposal charges due from households and
businesses, institutions and other non-domestic waste generators for waste disposal at Dandora,
and in the future at Ruai so as to support an economically viable and environmentally benign private
waste collection sector in the city. The CCN waste disposal costs used as a basis for computing the
streamlined charges include all waste transportation costs, associated labour costs, machinery
maintenance and depreciation for waste disposal at Dandora. These (CCN) disposal costs are shown
in Table 12 below, and calculations towards determining approximate streamlined collection charges

for residual waste due for disposal city wide are discussed in Section 6.2.2.1. All streamlined charges
calculated include source separation costs for the provision of 3 waste separation bags to small
generators. Larger generators will be legally required to buy their own separation containers (three
receptacles) and separate at source.
Table 12: Summary of CCN total disposal costs to Dandora dumpsite per ton waste collected (Source: Njenga, 2009a)
Zone Rate/ton
CBD 1144
Kamukunji 943
Starehe 990
Embakasi 852
Dagoretti 1210
Westlands 1155
Langata 1144
Makadara 849
Kasarani 891
Average: 1020
The streamlined collection charges determined below would apply in the scenario that all waste is
put out for disposal at landfill, as if it were residual waste. Incentives for the separation of waste at
source, and recovery of recyclable and pure organic waste are described in Section 6.3.1; - where
reduced collection fees would apply to encourage the active separation of waste at source at the
generator level, and as a result of which (reduced collection charges) waste collectors are
encouraged to interact with the Waste Recovery and Trading market to sell their collected quality
recyclables, and also potentially sell their quality organic waste to Anaerobic digestion facilities so as
to realise improved profit margins and reduce their disposal transportation costs.
6.2.2.1 Major assumptions and Proposed Weight-Based Streamlined Waste Collection Charges
The major assumptions made in calculating the proposed Streamlined Collection charges for Nairobi
City’s residents include;
Per capita residential waste generation of 0.65kg/person/day (See Section 2 for details)
A 50% cost increase factor from the average CCN disposal costs to account for increased
distance for collection of waste from individual households and businesses/institutions as
opposed to from communal waste collection points as the CCN largely does at the moment
Inclusion of costs for 3 way at-source waste separation bin bags. A total of 9 bags is allowed per
household per month, with 4 waste separation bags per month for organic waste (1 each week),
2 each for recyclables and residuals per month (1 for each every 2 weeks) and 1 extra per
household
30% profit margin over and above the bare disposal costs for the economic viability of private
collection operations. A reasonable margin is allowed here to ensure the sector is attractive, and
so that no excuse for poor performance can be cited for non-disposal at designated sites,
however this margin should not be too high as to make the mere disposal of waste at designated
sites lucrative in itself, instead it is limited so as to provide incentive to private collectors to
engage in waste trading of separated recyclables with the waste recovery market to improve
their profit margins.
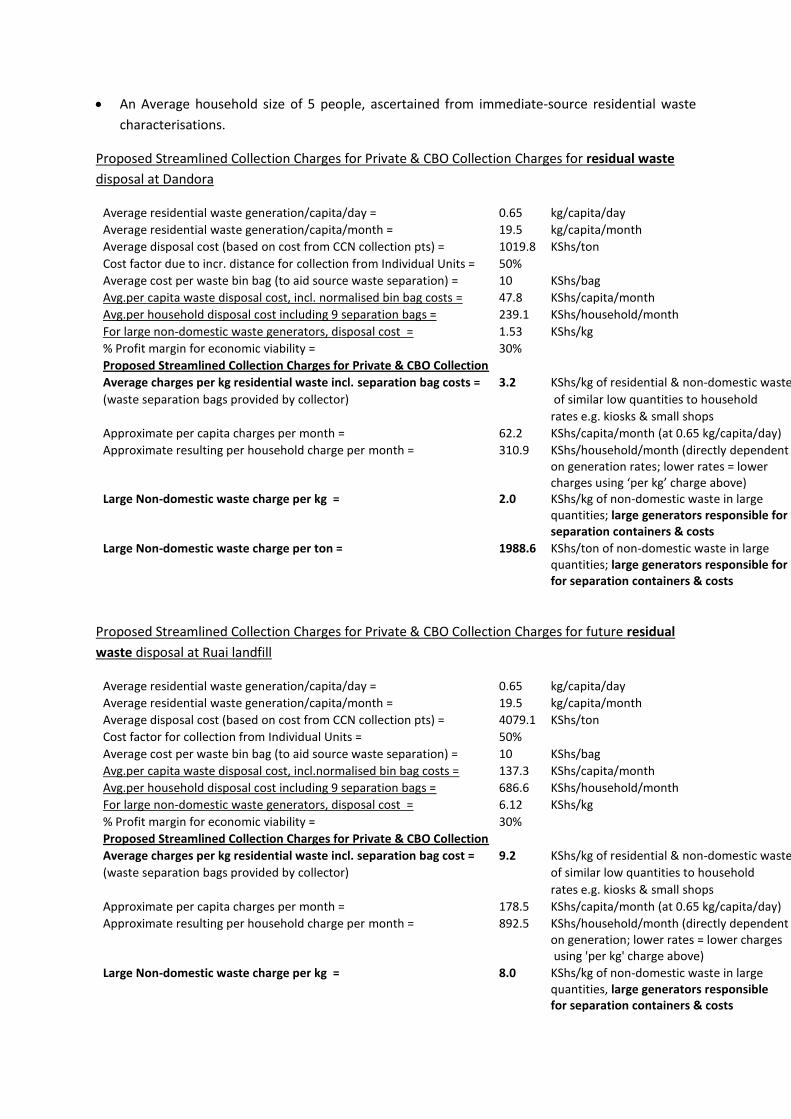
An Average household size of 5 people, ascertained from immediate-source residential waste
characterisations.
Proposed Streamlined Collection Charges for Private & CBO Collection Charges for residual waste
disposal at Dandora
Average residential waste generation/capita/day = 0.65 kg/capita/day Average residential waste generation/capita/month = 19.5 kg/capita/month Average disposal cost (based on cost from CCN collection pts) = 1019.8 KShs/ton Cost factor due to incr. distance for collection from Individual Units = 50%
Average cost per waste bin bag (to aid source waste separation) = 10 KShs/bag Avg.per capita waste disposal cost, incl. normalised bin bag costs = 47.8 KShs/capita/month Avg.per household disposal cost including 9 separation bags = 239.1 KShs/household/month For large non-domestic waste generators, disposal cost = 1.53 KShs/kg % Profit margin for economic viability = 30%
Proposed Streamlined Collection Charges for Private & CBO Collection Average charges per kg residential waste incl. separation bag costs = 3.2 KShs/kg of residential & non-domestic waste
(waste separation bags provided by collector)
of similar low quantities to household
rates e.g. kiosks & small shops
Approximate per capita charges per month = 62.2 KShs/capita/month (at 0.65 kg/capita/day) Approximate resulting per household charge per month = 310.9 KShs/household/month (directly dependent
Large Non-domestic waste charge per kg = 2.0
on generation rates; lower rates = lower charges using ‘per kg’ charge above) KShs/kg of non-domestic waste in large
quantities; large generators responsible for separation containers & costs
Large Non-domestic waste charge per ton = 1988.6 KShs/ton of non-domestic waste in large
quantities; large generators responsible for for separation containers & costs
Proposed Streamlined Collection Charges for Private & CBO Collection Charges for future residual
waste disposal at Ruai landfill
Average residential waste generation/capita/day = 0.65 kg/capita/day Average residential waste generation/capita/month = 19.5 kg/capita/month Average disposal cost (based on cost from CCN collection pts) = 4079.1 KShs/ton Cost factor for collection from Individual Units = 50%
Average cost per waste bin bag (to aid source waste separation) = 10 KShs/bag Avg.per capita waste disposal cost, incl.normalised bin bag costs = 137.3 KShs/capita/month Avg.per household disposal cost including 9 separation bags = 686.6 KShs/household/month
For large non-domestic waste generators, disposal cost = 6.12 KShs/kg % Profit margin for economic viability = 30%
Proposed Streamlined Collection Charges for Private & CBO Collection Average charges per kg residential waste incl. separation bag cost = 9.2 KShs/kg of residential & non-domestic waste
(waste separation bags provided by collector)
of similar low quantities to household
rates e.g. kiosks & small shops
Approximate per capita charges per month = 178.5 KShs/capita/month (at 0.65 kg/capita/day) Approximate resulting per household charge per month = 892.5 KShs/household/month (directly dependent
on generation; lower rates = lower charges using 'per kg' charge above)
Large Non-domestic waste charge per kg = 8.0 KShs/kg of non-domestic waste in large
quantities, large generators responsible for separation containers & costs
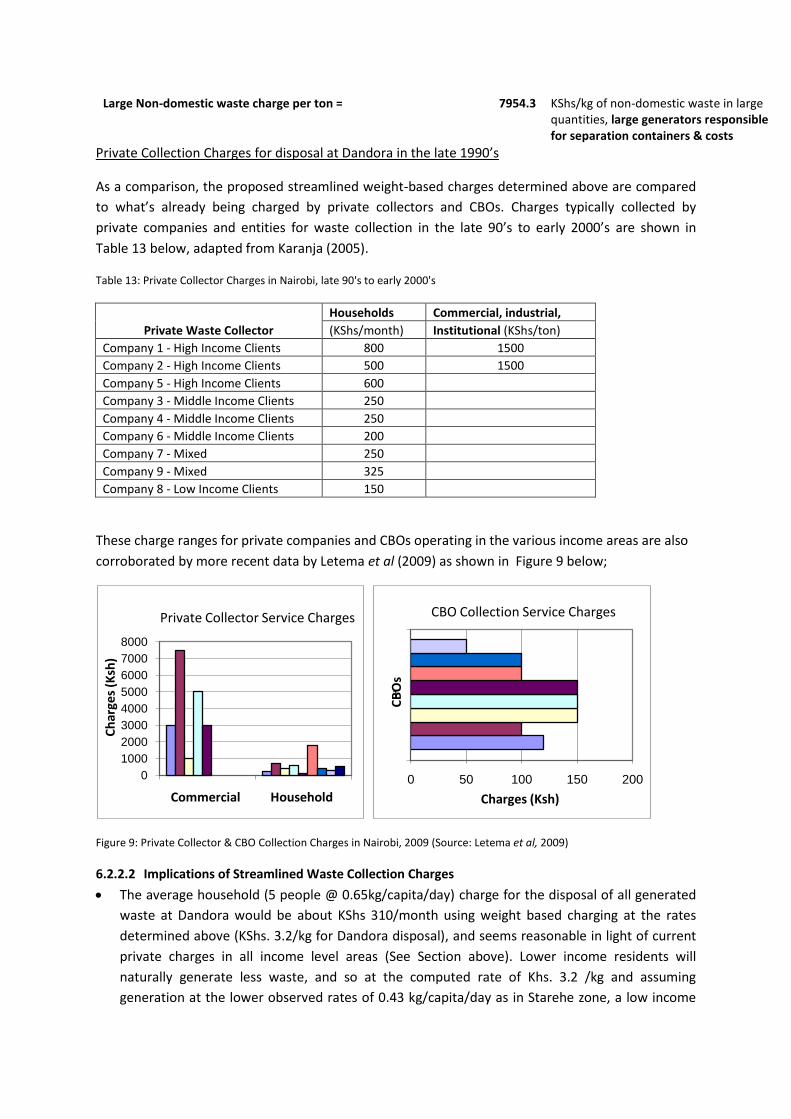
Large Non-domestic waste charge per ton = 7954.3 KShs/kg of non-domestic waste in large
quantities, large generators responsible for separation containers & costs
Private Collection Charges for disposal at Dandora in the late 1990’s
As a comparison, the proposed streamlined weight-based charges determined above are compared
to what’s already being charged by private collectors and CBOs. Charges typically collected by
private companies and entities for waste collection in the late 90’s to early 2000’s are shown in
Table 13 below, adapted from Karanja (2005).
Table 13: Private Collector Charges in Nairobi, late 90's to early 2000's
Households Commercial, industrial,
Private Waste Collector (KShs/month) Institutional (KShs/ton)
Company 1 - High Income Clients 800 1500
Company 2 - High Income Clients 500 1500
Company 5 - High Income Clients 600
Company 3 - Middle Income Clients 250
Company 4 - Middle Income Clients 250
Company 6 - Middle Income Clients 200
Company 7 - Mixed 250
Company 9 - Mixed 325
Company 8 - Low Income Clients 150
These charge ranges for private companies and CBOs operating in the various income areas are also
corroborated by more recent data by Letema et al (2009) as shown in Figure 9 below;
Figure 9: Private Collector & CBO Collection Charges in Nairobi, 2009 (Source: Letema et al, 2009)
6.2.2.2 Implications of Streamlined Waste Collection Charges
The average household (5 people @ 0.65kg/capita/day) charge for the disposal of all generated
waste at Dandora would be about KShs 310/month using weight based charging at the rates
determined above (KShs. 3.2/kg for Dandora disposal), and seems reasonable in light of current
private charges in all income level areas (See Section above). Lower income residents will
naturally generate less waste, and so at the computed rate of Khs. 3.2 /kg and assuming
generation at the lower observed rates of 0.43 kg/capita/day as in Starehe zone, a low income
0
1000
2000
3000
4000
5000
6000
7000
8000
Commercial Household
Ch
arge
s (K
sh)
Private Collector Service Charges
0 50 100 150 200
1
Charges (Ksh)
CB
Os
CBO Collection Service Charges

household of 5 would pay on average about KShs. 205 /month - only slightly higher than current
private charges, and importantly within the range previously found agreeable by low income
residents by previous researchers (Esho (1997) cited in Baud et al, 2004). These charges also
appear reasonable in light of current willingness to pay for improved service levels of 76%, 59%,
58% and 67% respectively by respondents in high, middle, low income and surrounding areas
respectively (UNEP/CCN 3rd ISWM Stakeholder Workshop - Dec. 2009), with the added
advantage of accounting for costs of waste separation at source, and hopefully reducing
generation rates on account of the pay as you throw principle utilised in the billing.
The direct disposal of waste at Ruai will generally be too costly for most of Nairobi’s residents.
Urgent interventions will therefore be necessary before then to reduce waste volumes,
transport distances and costs accruing from the direct movement of the bulk of waste generated
straight to disposal. These are discussed in Sections 6.3 and 6.4.
6.2.3 Zoning of Waste Collection
Pioneered by The KARENGATA and the Nairobi Central Business District Association, Nairobi City
now has an estimated two hundred (200) registered Resident Associations (RA) in the city which
have formed two umbrella associations ‘We Can Do It’ and Kenya Alliance of Residential Associations
(KARA), to lobby for improved service provision and delivery in areas such as solid waste
management, water, street lighting, housing and roads; to facilitate formation of new RAs and
provide technical assistance to potential new RAs ( Karanja, 2005; Ngau & Kahiu, 2009).
Additionally, Nairobi City is administratively broken down into several units with the Ward level
comprising the smallest administrative unit. The zoning of waste collection areas for Private
Collector and CBO operations has several distinct advantages over the current ad hoc state of private
and CBO waste collection;
It would result in minimised transport distances by Collectors/CBOs and thereby disposal costs
to both collectors and residents, resulting in reduced waste non-collection on account of
elevated costs or use of different unscrupulous companies
It would legally bind residents to use the same collector in a locality and lead to the geographical
organisation of waste collection across the city, improving accountability for performance
The legally required spatial distribution of private waste collectors would result in greater equity
in service provision through out the city as collectors are forced to spread out. This would
reduce the concentration and competition of private collectors/CBOs in similar localities – a
scenario that’s been previously noted as a potential barrier of entry into the private waste
collection sector, as new entrants find already exorbitant fees being charged to scattered clients
and cannot compete viably at these same high rates and with the same level of client scatter
(Karanja, 2005). Zoning waste collection would allow new, initially small but growing, private
collectors and CBOs to more productively participate in Nairobi’s waste collection sector and
greater waste management.

6.2.4 Development of Contractual Arrangements for Waste Collection Service to Communities
With the zoning of waste collection, contracts for collection service provision would then be
tendered for by private entities and CBOs based on their capacities relative to the size of the service
area (typically determined by the area’s population density which can be used to determine
household density assuming 5 people per household), agreed to by the relevant Resident
Association for the area in question, and renewed annually by the serviced community residents
based on performance. Areas currently without such associations would be encouraged to form
some for this purpose, with the possible involvement of local leaders in this regard. A pre-emptive
breakdown of zonal or ward level population densities and household numbers through out Nairobi
(based on 2009 Census data) at the Regulator level (CCN), to help determine and monitor waste
collector allocations city wide based on capacity, would aid this action.
Contracts entered into between Private waste collectors/CBOs and Resident Associations will
provide legal protection to both parties regarding fee collections and service provision as per set
standards. These contracts will need minimum stipulations for the efficient provision of the
collection service.
Minimum stipulations envisaged in Zoned waste collection Contracts include:
Explicit mention of service charges in line with streamlined collection fees
Legal requirement for all generators to adequately separate waste at source into recyclables,
pure organic/biodegradables and residual waste; or else risk non-service provision
Provision of 9 separation-at-source waste/bin bags per month by collectors to small generators.
Legal requirement for large generators to buy and use their own waste separation containers.
Stipulation of minimum area or neighbourhood cleanliness standards, collection frequency ,and
penalties accrued on failure to achieve agreed terms
Penalties on generators if found to be engaged in illegal dumping
Explicit mention of entity that will transport collected waste to designated landfill if different
from contracted waste collector/CBO, and attachment of associated sub-contract for this
purpose.
It is hoped that the combined streamlining of collection fees, zoning of waste collection, and
development of contractual arrangements between collectors and resident associations will weed
out shoddy pricing with undercharging companies attempting to minimise/avoid disposal costs
through illegal dumping, enable the economic viability and attractiveness of the collection sector to
especially new small private collectors and CBOs - more so in low income areas, and result in greater
equity in collection services over time.
6.2.5 Regulation, Enforcement and Oversight of Private Company/CBO waste collection in the
City
The success of the discussed action steps will be dependent on the efficient regulation and
enforcement of passed plans, policies and bylaws resulting from the agreed ISWM plan.
Private waste collection (private companies and CBOs) in Nairobi City can be regulated first at the
community/neighbourhood or Residential Association level, and additionally at the CCN or Overall
Supervisory level.
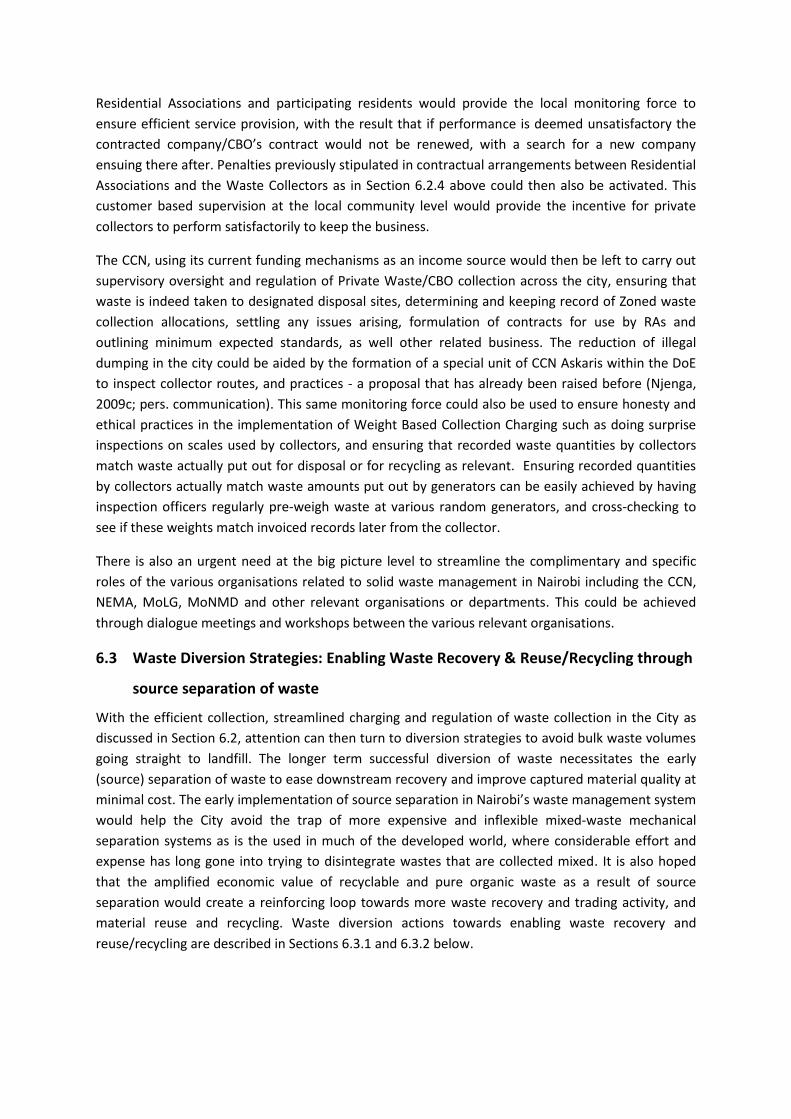
Residential Associations and participating residents would provide the local monitoring force to
ensure efficient service provision, with the result that if performance is deemed unsatisfactory the
contracted company/CBO’s contract would not be renewed, with a search for a new company
ensuing there after. Penalties previously stipulated in contractual arrangements between Residential
Associations and the Waste Collectors as in Section 6.2.4 above could then also be activated. This
customer based supervision at the local community level would provide the incentive for private
collectors to perform satisfactorily to keep the business.
The CCN, using its current funding mechanisms as an income source would then be left to carry out
supervisory oversight and regulation of Private Waste/CBO collection across the city, ensuring that
waste is indeed taken to designated disposal sites, determining and keeping record of Zoned waste
collection allocations, settling any issues arising, formulation of contracts for use by RAs and
outlining minimum expected standards, as well other related business. The reduction of illegal
dumping in the city could be aided by the formation of a special unit of CCN Askaris within the DoE
to inspect collector routes, and practices - a proposal that has already been raised before (Njenga,
2009c; pers. communication). This same monitoring force could also be used to ensure honesty and
ethical practices in the implementation of Weight Based Collection Charging such as doing surprise
inspections on scales used by collectors, and ensuring that recorded waste quantities by collectors
match waste actually put out for disposal or for recycling as relevant. Ensuring recorded quantities
by collectors actually match waste amounts put out by generators can be easily achieved by having
inspection officers regularly pre-weigh waste at various random generators, and cross-checking to
see if these weights match invoiced records later from the collector.
There is also an urgent need at the big picture level to streamline the complimentary and specific
roles of the various organisations related to solid waste management in Nairobi including the CCN,
NEMA, MoLG, MoNMD and other relevant organisations or departments. This could be achieved
through dialogue meetings and workshops between the various relevant organisations.
6.3 Waste Diversion Strategies: Enabling Waste Recovery & Reuse/Recycling through
source separation of waste
With the efficient collection, streamlined charging and regulation of waste collection in the City as
discussed in Section 6.2, attention can then turn to diversion strategies to avoid bulk waste volumes
going straight to landfill. The longer term successful diversion of waste necessitates the early
(source) separation of waste to ease downstream recovery and improve captured material quality at
minimal cost. The early implementation of source separation in Nairobi’s waste management system
would help the City avoid the trap of more expensive and inflexible mixed-waste mechanical
separation systems as is the used in much of the developed world, where considerable effort and
expense has long gone into trying to disintegrate wastes that are collected mixed. It is also hoped
that the amplified economic value of recyclable and pure organic waste as a result of source
separation would create a reinforcing loop towards more waste recovery and trading activity, and
material reuse and recycling. Waste diversion actions towards enabling waste recovery and
reuse/recycling are described in Sections 6.3.1 and 6.3.2 below.

6.3.1 Waste Separation at Source with Incentives
Source separation is seen as a key component to realising any significant reduction in waste
transported and disposed of at landfill, through its diversion via recovery, trading, inorganic material
recycling and organic waste reuse activity. Several Incentives are proposed to encourage the
separation of waste at source at both the generator and collector level.
6.3.1.1 Generator Incentive: Reduced Streamlined Collection fees for separated high purity recyclable
and organic waste
The collection charges described in Section 6.2.2 above are what would be due if residents chose to
simply put all their waste out for disposal with no regard for separation, or in instances where
‘separated’ waste is of low purity. To encourage the active separation of waste for the down stream
recovery of recyclable material, 3 bags would be provided under this scheme at any one time in the
month for the separation of waste into organic/biodegradable, recyclable and residual fractions.
Source separation is also proposed to be incentivised through a reduced collection fee equal to three
quarters of the residual disposal rates determined above in Section 6.2.2 for high purity separated
recyclables and organic waste.
In line with this, the collection fee applicable for high purity separated recyclables and quality
separated organic waste would be KShs. 2.4/kg separated recyclable or separated organic
residential waste and KShs. 1.5/kg separated recyclable or separated organic Non-Domestic waste,
whereas any residual waste set out for disposal to Dandora would be charged the previously
determined KShs. 3.2/kg residential waste and KShs. 2/kg non-domestic waste. When Ruai
becomes the official designated landfill site, these charges would increase to KShs. 6.9/kg of
separated recyclable or separated organic residential waste, and KShs. 6/kg separated recyclable
or separated organic Non-Domestic waste.
The onus for claiming this reduced charge would be placed on the generators (mass media campaign
to make this known to all) to entice them to separate effectively so as to be in a position to claim the
reduction. In the same spirit, private collectors and CBOs/CBEs would also seek to encourage source
separation amongst their clientele in order for them to collect high purity recyclables and organic
waste which can then be traded at higher values on the waste recovery market and at organic waste
anaerobic digester facilities (discussed in detail in Section 6.4.2). The reduced collection service fee
for recyclable waste provides an incentive for the collectors to ‘recover’ and possibly exceed the
resulting reduced profit margin through their active downstream participation in the waste recovery
and trading market where recyclables are traded at an average of about KShs. 2/kg (See Section
4.2.6), in effect potentially doubling the amount they would earn from simply taking the bare
disposal cost; - this before taking into account that waste dealers and traders would likely be located
locally meaning reduced transport distances and costs for collectors for recyclable wastes. Under the
reduced fees for separated recyclables, households and generators actively separating at source
would in turn also pay less for the collection service.
6.3.1.2 Waste Collector Incentive: Minimising waste disposal transportation costs, and maximising
waste value on the Waste Recovery & Trading Market to improve profit margins
The inclusion of source separation costs in the streamlined waste collection charges proposed
means the activity can be facilitated infrastructually, with the remainder of the effort towards
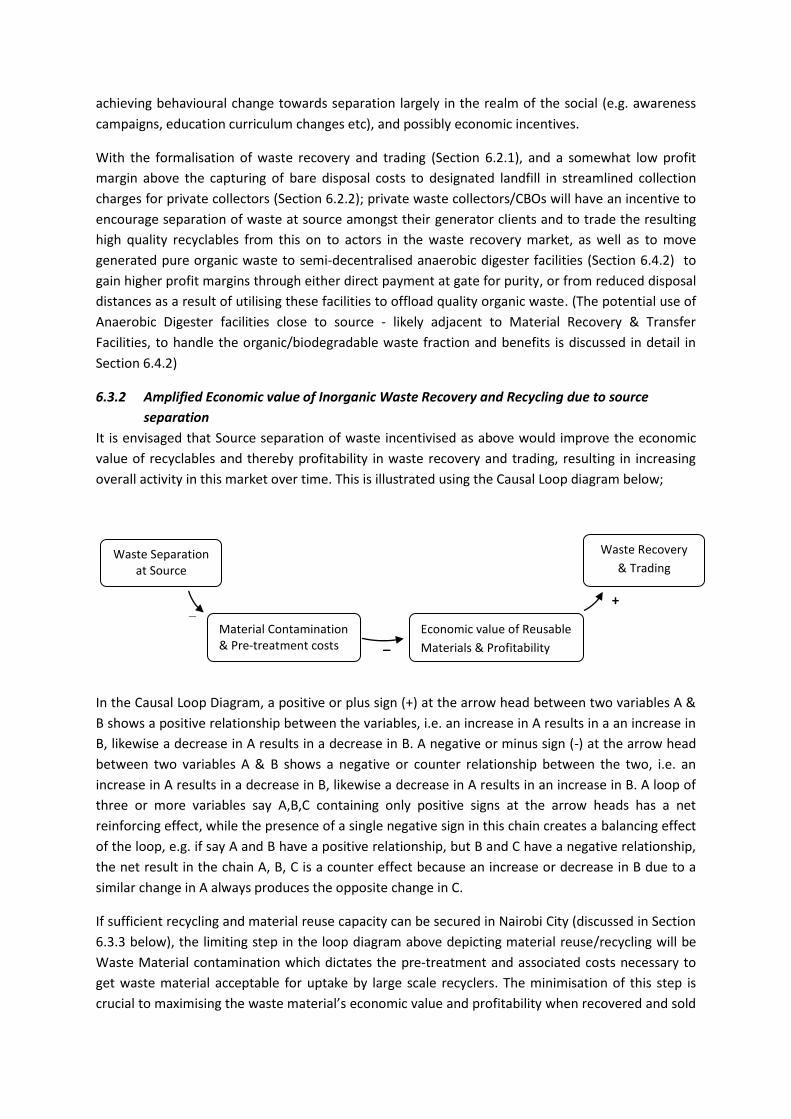
_
_
+
achieving behavioural change towards separation largely in the realm of the social (e.g. awareness
campaigns, education curriculum changes etc), and possibly economic incentives.
With the formalisation of waste recovery and trading (Section 6.2.1), and a somewhat low profit
margin above the capturing of bare disposal costs to designated landfill in streamlined collection
charges for private collectors (Section 6.2.2); private waste collectors/CBOs will have an incentive to
encourage separation of waste at source amongst their generator clients and to trade the resulting
high quality recyclables from this on to actors in the waste recovery market, as well as to move
generated pure organic waste to semi-decentralised anaerobic digester facilities (Section 6.4.2) to
gain higher profit margins through either direct payment at gate for purity, or from reduced disposal
distances as a result of utilising these facilities to offload quality organic waste. (The potential use of
Anaerobic Digester facilities close to source - likely adjacent to Material Recovery & Transfer
Facilities, to handle the organic/biodegradable waste fraction and benefits is discussed in detail in
Section 6.4.2)
6.3.2 Amplified Economic value of Inorganic Waste Recovery and Recycling due to source
separation
It is envisaged that Source separation of waste incentivised as above would improve the economic
value of recyclables and thereby profitability in waste recovery and trading, resulting in increasing
overall activity in this market over time. This is illustrated using the Causal Loop diagram below;
In the Causal Loop Diagram, a positive or plus sign (+) at the arrow head between two variables A &
B shows a positive relationship between the variables, i.e. an increase in A results in a an increase in
B, likewise a decrease in A results in a decrease in B. A negative or minus sign (-) at the arrow head
between two variables A & B shows a negative or counter relationship between the two, i.e. an
increase in A results in a decrease in B, likewise a decrease in A results in an increase in B. A loop of
three or more variables say A,B,C containing only positive signs at the arrow heads has a net
reinforcing effect, while the presence of a single negative sign in this chain creates a balancing effect
of the loop, e.g. if say A and B have a positive relationship, but B and C have a negative relationship,
the net result in the chain A, B, C is a counter effect because an increase or decrease in B due to a
similar change in A always produces the opposite change in C.
If sufficient recycling and material reuse capacity can be secured in Nairobi City (discussed in Section
6.3.3 below), the limiting step in the loop diagram above depicting material reuse/recycling will be
Waste Material contamination which dictates the pre-treatment and associated costs necessary to
get waste material acceptable for uptake by large scale recyclers. The minimisation of this step is
crucial to maximising the waste material’s economic value and profitability when recovered and sold
Material Contamination & Pre-treatment costs &
Waste Recovery
& Trading
Economic value of Reusable
Materials & Profitability
Waste Separation at Source

on to recyclers, and in essence dictates the overall interest in Waste Recovery and Trading Activity as
the actors in this sector are profit/income driven. Waste separation at source can be used to
maximise material quality from source, and to minimise recovered material contamination and pre-
treatment costs incurred, thereby allowing maximum possible material economic value and returns
on the recovery market for those involved in the sector be they waste dealers, CBOs or Private
companies.
6.3.3 Implications of Source separation and amplified economic value of waste materials
As a result of the actions proposed above, it is hoped that there will be an up turn in the quality and
amount of available recyclable materials and organic waste. The challenge from here is to ensure
that the City’s recycling capacity as expressed in Private enterprise, NGO projects, or other small
scale and informal activity, can cope with the increased availability recyclable material now and in
the future. At the moment, reuse and recycling capacity remains very low in the City (See Section
3.1). Strategies towards developing and increasing recycling capacity and infrastructure in the city
are discussed in Sections 6.4.3 and 6.4.4.
6.4 Waste Diversion Strategies: Specific Waste Stream Interventions
6.4.1 Material Recovery and Transfer Facilities
Plans are underway for the establishment of 3-4 Material Recovery and Transfer Facilities in Nairobi
City (2nd ISWM Stakeholders Workshop – Nov. 2009) which aim to reduce waste volumes for disposal
through the extended recovery of recyclables and quality organic waste not already captured
through mechanisms discussed above. These facilities would also help to reduce transportation costs
to landfill through the compression of residual waste and use of bulk transportation as opposed to
smaller trucking. Working with formalised waste collection, waste recovery and trading, and
recycling supply structures as discussed in Sections 6.2 and 6.3 above these facilities have the
potential to go a long way towards the reduction of waste volumes to landfill and overall disposal
costs.
6.4.2 Dealing with Nairobi’s biggest waste fraction: Interventions to generate value from
Organic/Biodegradable waste and reduce overall transport distances and disposal costs
Organic/Biodegradable which is at least 51% of total waste generated in Nairobi (See Section 1.3)
represents the single biggest waste fraction in Nairobi City. Specific Intervention measures to
intercept this fraction, and generate as much value from it as possible - in effect treating it as a
resource and not waste, would therefore go a long way not only towards the reduction of its
disposal at landfill and associated costs, but also towards the reduction of the potential generation
of disease causing pathogens, vectors and rodents; and help spur a behavioural culture of unlocking
the hidden value in what is only too easily called ‘waste’.
6.4.2.1 Opportunity for CBOs (or other entities) in the quick movement of fresh organic waste from
restaurants and markets to livestock farmers
As highlighted in Section 3.1.6, there is an interest in the use of organic waste as animal feed in
Nairobi City (Karanja, 2005; Onduru et al, 2009; Ngau & Kahiu, 2009), with evidence of such activity
already prevalent in Nairobi. An opportunity therefore exists for the formation of CBOs and other
groups/actors specifically targeting high purity fresh local restaurant and market waste for rapid
transfer and movement to farmers, livestock keepers and feed millers in the city and its surrounds as

livestock feed, as an income generating activity. Options also exist in such a chain for private entity
involvement in the pre-treatment of the fresh organic wastes for animal feed purposes.
The benefits of such activities have been highlighted in developing cities such as Manila in the
Phillipines – where CBOs collect and sell market/restaurant waste to pig farmers at about half the
price of commercial feeds, saving on commercial feed costs and resulting in a doubling of profits
after accounting for all rearing costs (Rees, 2005). This action would likely be best taken further by
NGOs involved in waste-to-resource and income generation activity, and entrepreneurs.
6.4.2.2 Anaerobic digestion of Organic/Biodegradable Residential and Institutional, Commerce,
Market Solid waste
The direct composting of organic waste in Nairobi City as a value generation activity is economically
unattractive at the moment due to its pricing vs. its nutrient value relative to synthetic fertiliser (See
Section 6.4.2.3). Owing to this, the anaerobic digestion of biodegradable organic waste in Nairobi
City for energy would seem to lend itself to the greater generation of value and benefits from
organic waste than straight composting in the Nairobi context; while also allowing for the radical
reduction of total waste amounts due for disposal. The minimal digestate volumes left after
anaerobic digestion are also more stable in nature and can be made available for further up take by
smaller scale composting, application on agricultural lands if appropriate mechanisms are put in
place, or for significantly reduced disposal.
Nairobi‘s urban context also lends itself to the use of biogas to generate electricity, and not directly
for cooking. While the utilisation of biogas generated from the anaerobic digestion of biodegradable
waste directly for cooking indeed has greater benefits owing to minimal energy conversion losses
incurred in the process, such a scenario is likely to be difficult to implement in Nairobi’s urban
setting. In order to be utilised directly for cooking, biogas cannot be piped over excessive distances
and a maximum piping distance in the region of 300m radius from the source of the biogas is often
cited. Given that any zonal or semi-decentralised digester facilities closer to generation sources are
likely to be adjacent to material recovery facilities, it is unlikely that residential areas or potential
direct biogas-to-cook clients would easily be within such close proximity to these areas. Other issues
that would need to be tackled in such a direct use scenario include the metering and billing of biogas
supplied to clients; the critical need for the minimisation of potential leaks along supply lines
thereby extending risk sand potential costs of leaks beyond the digester facility; the need for
extended behavioural change on the part of residents in that they would need to culturally accept
the use of the biogas for cooking, as well as need to buy appropriate stoves to utilise it. In light of
the above challenges, it seems to make better sense to utilise any generated biogas from organic
waste at the zonal or semi-decentralised scale for the generation of electricity instead, possibly via
biogas driven Generator-Engine sets (Genset); - electricity being a good/service that the city’s
populace is already familiar with and is willing to pay for (minimal behavioural changes required),
and for which distribution infrastructure is already largely available. The electricity can then be
supplied either locally at agreed rates with the approval of the national electricity regulator KenGen,
or fed into the national grid at negotiated rates with KenGen. This approach also makes economic
sense in light of Kenya’s stretched electricity generating capacity.
Direct Biogas use for cooking can however still be encouraged at source or generator level, say for
large institutions, or at markets which naturally tend to have the presence of small –medium scale
caterers on-site cooking meals for traders and neighbouring workers.
Two approaches for the Anaerobic Digestion of Biodegradable waste for energy and/or its
encouragement in Nairobi are envisaged;
Through the encouragement of bio-digestion of organic wastes for biogas for cooking or
compost at large institutions and commercial premises, especially those with organic content
rich wastes. This could be achieved through the development of sub-national policy
encouraging onsite digestion or composting through various instruments such as tax breaks,
property tax or rent reductions at Local Authority level, preferential government business
contracting to Private actors actively improving their ‘green’ credentials through activities like
organic reuse via biogas or composting etc.
Through the development of close to source anaerobic digestion facilities for residential and
small business organic waste in Nairobi’s zones, preferably adjacent to the 3-4 planned
Material Recovery and Transfer station areas. The Sewage and Waste Water Treatment works
at Ruai also provide a good opportunity in future for the co-digestion of municipal solid waste
with treated sewage for the generation of methane for energy generation. Biogas will be used
directly for electricity generation for sale locally or to the national grid, with selling prices to be
negotiated with clients or with KenGen as circumstances dictate so as to try and achieve
maximum all round benefits for all actors involved.
Kenya has already seen some adaptation and application of organic waste digestion for biogas to
energy at the small to medium scale. The biggest examples of this cited directly from work by
Onduru et al (2009) include the following:
“ Individual entrepreneur in Kilifi, coastal Kenya: A sisal estate in Kilifi has made an attempt to
produce biogas at industrial scale from 700 m3 digester. The biogas produced is used to run two
Genset generators (imported from Germany) to produce electricity with a potential to supply to the
national grid. However, the entrepreneur does not supply the grid power due to perceived low
payments from KENGEN (≈ 7 US cents per unit supplied), which does not cover the cost of
production (running costs and cost of personnel). The generated biogas is used to run machinery in
the sisal estate.
Individual farmer in Kiambu Municipality (Mr. Harrison Gicheru Nganga): Harrison constructed
a fixed dome reactor at cost of KES 500,000 in the year 2008. The reactor was constructed by a GTZ-
PSDA trained technician. The reactor is fed with cattle manure-water mixture from 7 cows, 4 heifers
and 9 calves (under zero-grazing unit). The biogas is piped within a radius of about 300 meters to five
other households (five sons) in addition to Mr. Gicheru’s own house. Although the biogas is not
metered and beneficiary households are not currently paying, Harrison estimates that he would be
earning KES3000 per month suppose the beneficiary households were to pay on agreed upon terms.
The sludge (digestate) that comes from the biogas plant is also used for growing vegetables, maize,
and Napier grass.
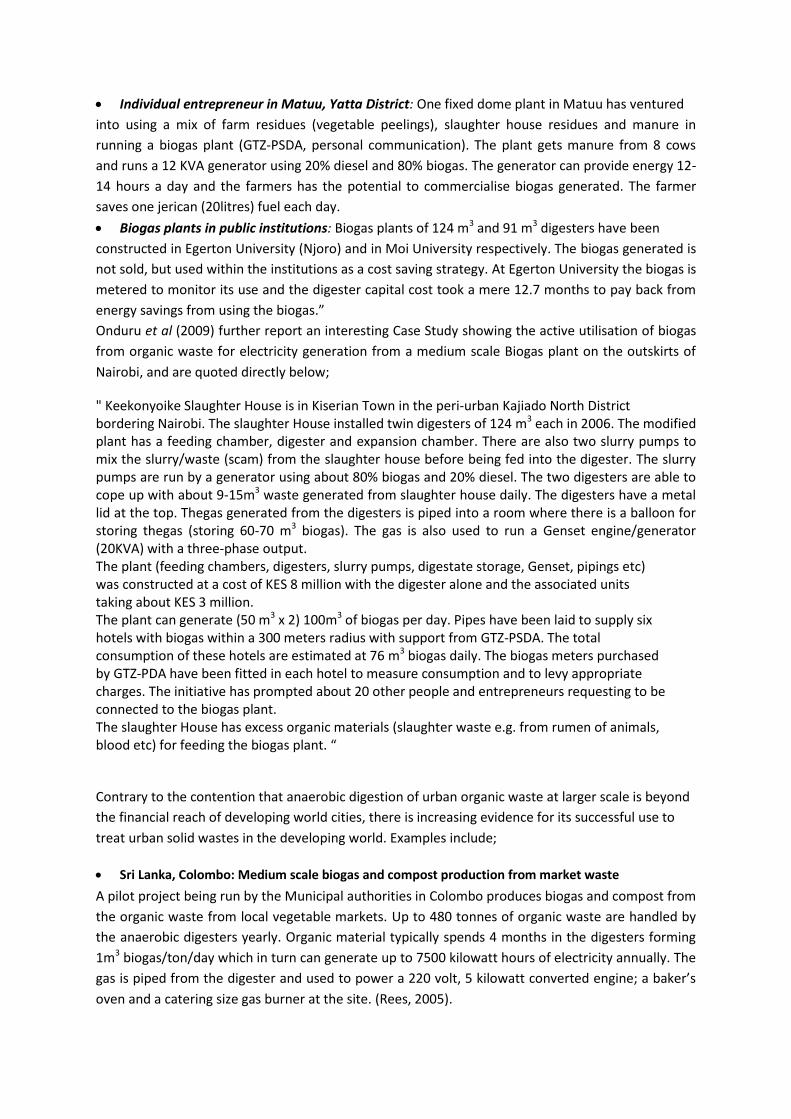
Individual entrepreneur in Matuu, Yatta District: One fixed dome plant in Matuu has ventured
into using a mix of farm residues (vegetable peelings), slaughter house residues and manure in
running a biogas plant (GTZ-PSDA, personal communication). The plant gets manure from 8 cows
and runs a 12 KVA generator using 20% diesel and 80% biogas. The generator can provide energy 12-
14 hours a day and the farmers has the potential to commercialise biogas generated. The farmer
saves one jerican (20litres) fuel each day.
Biogas plants in public institutions: Biogas plants of 124 m3 and 91 m3 digesters have been
constructed in Egerton University (Njoro) and in Moi University respectively. The biogas generated is
not sold, but used within the institutions as a cost saving strategy. At Egerton University the biogas is
metered to monitor its use and the digester capital cost took a mere 12.7 months to pay back from
energy savings from using the biogas.”
Onduru et al (2009) further report an interesting Case Study showing the active utilisation of biogas
from organic waste for electricity generation from a medium scale Biogas plant on the outskirts of
Nairobi, and are quoted directly below;
" Keekonyoike Slaughter House is in Kiserian Town in the peri-urban Kajiado North District bordering Nairobi. The slaughter House installed twin digesters of 124 m3 each in 2006. The modified plant has a feeding chamber, digester and expansion chamber. There are also two slurry pumps to mix the slurry/waste (scam) from the slaughter house before being fed into the digester. The slurry pumps are run by a generator using about 80% biogas and 20% diesel. The two digesters are able to cope up with about 9-15m3 waste generated from slaughter house daily. The digesters have a metal lid at the top. Thegas generated from the digesters is piped into a room where there is a balloon for storing thegas (storing 60-70 m3 biogas). The gas is also used to run a Genset engine/generator (20KVA) with a three-phase output. The plant (feeding chambers, digesters, slurry pumps, digestate storage, Genset, pipings etc) was constructed at a cost of KES 8 million with the digester alone and the associated units taking about KES 3 million. The plant can generate (50 m3 x 2) 100m3 of biogas per day. Pipes have been laid to supply six hotels with biogas within a 300 meters radius with support from GTZ-PSDA. The total consumption of these hotels are estimated at 76 m3 biogas daily. The biogas meters purchased by GTZ-PDA have been fitted in each hotel to measure consumption and to levy appropriate charges. The initiative has prompted about 20 other people and entrepreneurs requesting to be connected to the biogas plant. The slaughter House has excess organic materials (slaughter waste e.g. from rumen of animals, blood etc) for feeding the biogas plant. “
Contrary to the contention that anaerobic digestion of urban organic waste at larger scale is beyond
the financial reach of developing world cities, there is increasing evidence for its successful use to
treat urban solid wastes in the developing world. Examples include;
Sri Lanka, Colombo: Medium scale biogas and compost production from market waste
A pilot project being run by the Municipal authorities in Colombo produces biogas and compost from
the organic waste from local vegetable markets. Up to 480 tonnes of organic waste are handled by
the anaerobic digesters yearly. Organic material typically spends 4 months in the digesters forming
1m3 biogas/ton/day which in turn can generate up to 7500 kilowatt hours of electricity annually. The
gas is piped from the digester and used to power a 220 volt, 5 kilowatt converted engine; a baker’s
oven and a catering size gas burner at the site. (Rees, 2005).
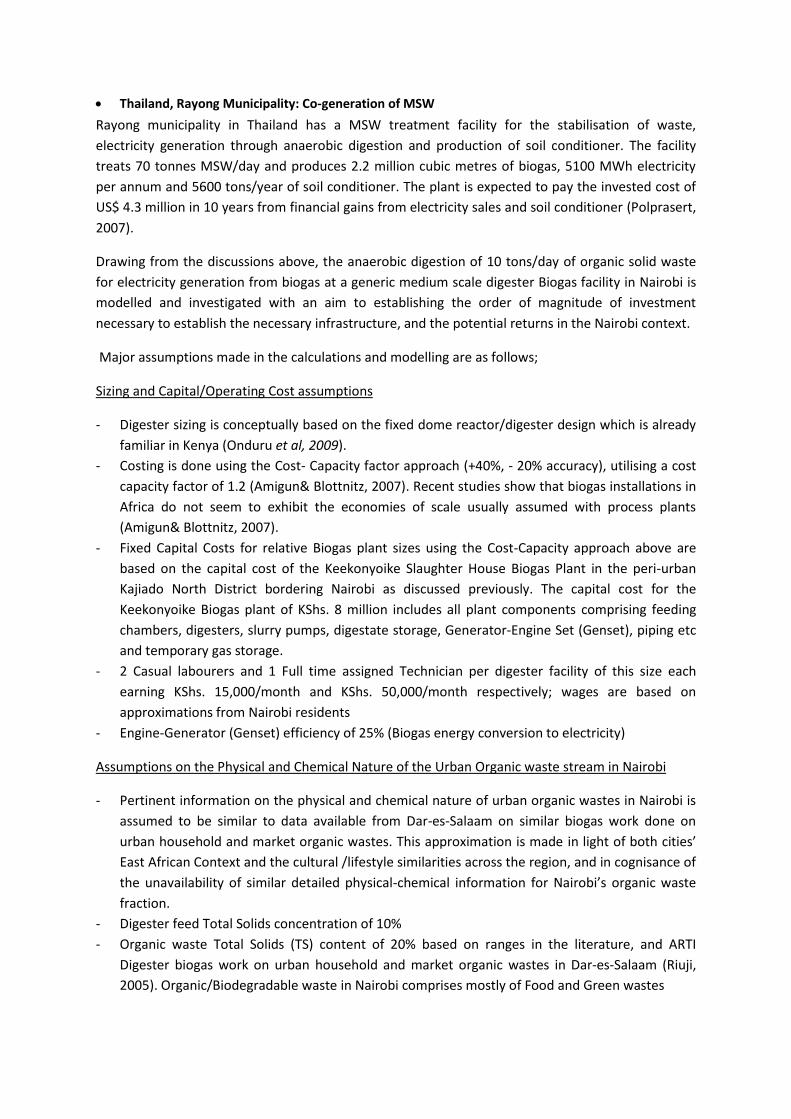
Thailand, Rayong Municipality: Co-generation of MSW
Rayong municipality in Thailand has a MSW treatment facility for the stabilisation of waste,
electricity generation through anaerobic digestion and production of soil conditioner. The facility
treats 70 tonnes MSW/day and produces 2.2 million cubic metres of biogas, 5100 MWh electricity
per annum and 5600 tons/year of soil conditioner. The plant is expected to pay the invested cost of
US$ 4.3 million in 10 years from financial gains from electricity sales and soil conditioner (Polprasert,
2007).
Drawing from the discussions above, the anaerobic digestion of 10 tons/day of organic solid waste
for electricity generation from biogas at a generic medium scale digester Biogas facility in Nairobi is
modelled and investigated with an aim to establishing the order of magnitude of investment
necessary to establish the necessary infrastructure, and the potential returns in the Nairobi context.
Major assumptions made in the calculations and modelling are as follows;
Sizing and Capital/Operating Cost assumptions
- Digester sizing is conceptually based on the fixed dome reactor/digester design which is already
familiar in Kenya (Onduru et al, 2009).
- Costing is done using the Cost- Capacity factor approach (+40%, - 20% accuracy), utilising a cost
capacity factor of 1.2 (Amigun& Blottnitz, 2007). Recent studies show that biogas installations in
Africa do not seem to exhibit the economies of scale usually assumed with process plants
(Amigun& Blottnitz, 2007).
- Fixed Capital Costs for relative Biogas plant sizes using the Cost-Capacity approach above are
based on the capital cost of the Keekonyoike Slaughter House Biogas Plant in the peri-urban
Kajiado North District bordering Nairobi as discussed previously. The capital cost for the
Keekonyoike Biogas plant of KShs. 8 million includes all plant components comprising feeding
chambers, digesters, slurry pumps, digestate storage, Generator-Engine Set (Genset), piping etc
and temporary gas storage.
- 2 Casual labourers and 1 Full time assigned Technician per digester facility of this size each
earning KShs. 15,000/month and KShs. 50,000/month respectively; wages are based on
approximations from Nairobi residents
- Engine-Generator (Genset) efficiency of 25% (Biogas energy conversion to electricity)
Assumptions on the Physical and Chemical Nature of the Urban Organic waste stream in Nairobi
- Pertinent information on the physical and chemical nature of urban organic wastes in Nairobi is
assumed to be similar to data available from Dar-es-Salaam on similar biogas work done on
urban household and market organic wastes. This approximation is made in light of both cities’
East African Context and the cultural /lifestyle similarities across the region, and in cognisance of
the unavailability of similar detailed physical-chemical information for Nairobi’s organic waste
fraction.
- Digester feed Total Solids concentration of 10%
- Organic waste Total Solids (TS) content of 20% based on ranges in the literature, and ARTI
Digester biogas work on urban household and market organic wastes in Dar-es-Salaam (Riuji,
2005). Organic/Biodegradable waste in Nairobi comprises mostly of Food and Green wastes

- 90% Volatile Solids (VS) in the solid fraction of urban organic waste, based on ARTI Digester
biogas work on urban household and market organic wastes in Dar-es-Salaam (Riuji, 2005)
- 75% Average Volatile Solids (VS) Reduction during Anaerobic Digestion based on labwork
literature, and ARTI Digester work in Dar-es-Salaam (Riuji, 2005)
- Average Biogas Yield of urban household and market organic wastes of 0.5m3/kg VS
- Average Methane concentration of 55% in Biogas based on ranges in the literature, and ARTI
Digester work in Dar-es-Salaam on urban household and market organic wastes (Riuji, 2005)
- Conservative Estimate Retention time of substrate in digester of 40 days, based on literature and
ARTI Digester work in Dar-es-Salaam (Riuji, 2005)
Based on these assumptions, a generic medium scale digester Biogas facility in Nairobi treating 10
ton/day of organic urban solid waste would need digester sizes totalling to about 800 m3; this figure
is however likely an overestimate given advances in bioreactor/digester technology and approaches.
The full fixed capital cost of the organic Waste-to-Biogas -to-electricity plant would be of the order
of KShs. 33 million.
The subsequent sale of the generated electricity privately or to the national grid at various selling
prices, and the use of potential buying incentives or tipping fees for pure separated organic waste
from waste collectors, yields several scenarios. These are shown graphically below in terms of;
- Approximate Fixed Capital Investment Pay Back Periods for the plant based on electricity selling
prices and pure organic waste buying incentives indicated with a + sign, or tipping fees indicated
with a - sign (Figure 10);
- Estimate Net Annual Incomes before tax relative to electricity selling prices and pure organic
waste buying incentives indicated with a + sign, or tipping fees indicated with a - sign (Figure 11);
- Estimate Returns on Investment (using net annual incomes before tax) relative to electricity
selling prices and pure organic waste buying incentives indicated with a + sign, or tipping fees
indicated with a – sign (Figure 12).
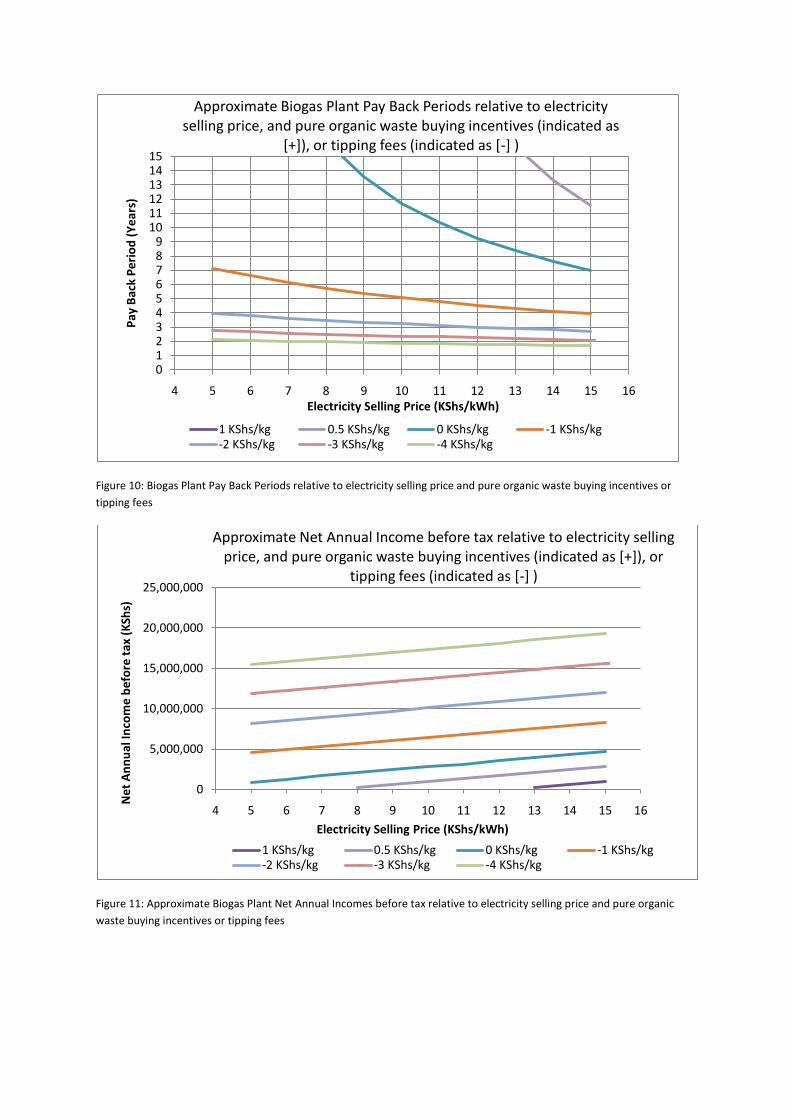
Figure 10: Biogas Plant Pay Back Periods relative to electricity selling price and pure organic waste buying incentives or
tipping fees
Figure 11: Approximate Biogas Plant Net Annual Incomes before tax relative to electricity selling price and pure organic
waste buying incentives or tipping fees
0123456789
101112131415
4 5 6 7 8 9 10 11 12 13 14 15 16
Pay
Bac
k P
eri
od
(Y
ear
s)
Electricity Selling Price (KShs/kWh)
Approximate Biogas Plant Pay Back Periods relative to electricity selling price, and pure organic waste buying incentives (indicated as
[+]), or tipping fees (indicated as [-] )
1 KShs/kg 0.5 KShs/kg 0 KShs/kg -1 KShs/kg-2 KShs/kg -3 KShs/kg -4 KShs/kg
0
5,000,000
10,000,000
15,000,000
20,000,000
25,000,000
4 5 6 7 8 9 10 11 12 13 14 15 16
Ne
t A
nn
ual
Inco
me
be
fore
tax
(K
Shs)
Electricity Selling Price (KShs/kWh)
Approximate Net Annual Income before tax relative to electricity selling price, and pure organic waste buying incentives (indicated as [+]), or
tipping fees (indicated as [-] )
1 KShs/kg 0.5 KShs/kg 0 KShs/kg -1 KShs/kg-2 KShs/kg -3 KShs/kg -4 KShs/kg
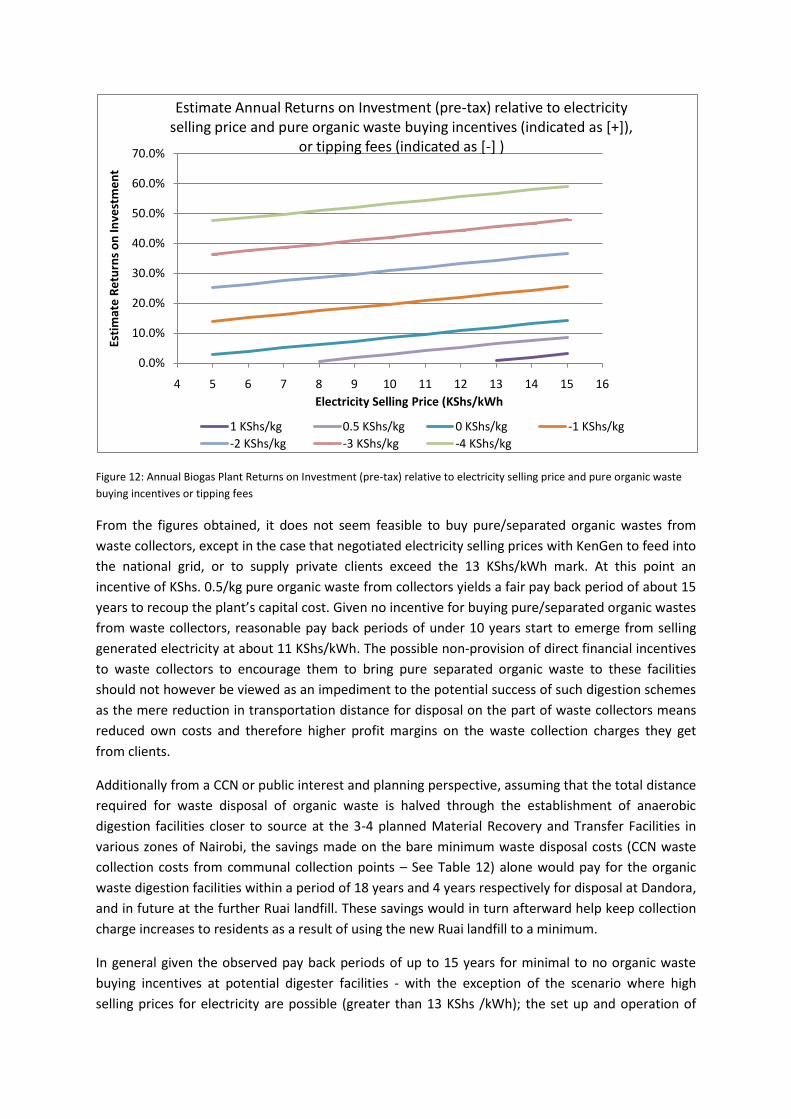
Figure 12: Annual Biogas Plant Returns on Investment (pre-tax) relative to electricity selling price and pure organic waste
buying incentives or tipping fees
From the figures obtained, it does not seem feasible to buy pure/separated organic wastes from
waste collectors, except in the case that negotiated electricity selling prices with KenGen to feed into
the national grid, or to supply private clients exceed the 13 KShs/kWh mark. At this point an
incentive of KShs. 0.5/kg pure organic waste from collectors yields a fair pay back period of about 15
years to recoup the plant’s capital cost. Given no incentive for buying pure/separated organic wastes
from waste collectors, reasonable pay back periods of under 10 years start to emerge from selling
generated electricity at about 11 KShs/kWh. The possible non-provision of direct financial incentives
to waste collectors to encourage them to bring pure separated organic waste to these facilities
should not however be viewed as an impediment to the potential success of such digestion schemes
as the mere reduction in transportation distance for disposal on the part of waste collectors means
reduced own costs and therefore higher profit margins on the waste collection charges they get
from clients.
Additionally from a CCN or public interest and planning perspective, assuming that the total distance
required for waste disposal of organic waste is halved through the establishment of anaerobic
digestion facilities closer to source at the 3-4 planned Material Recovery and Transfer Facilities in
various zones of Nairobi, the savings made on the bare minimum waste disposal costs (CCN waste
collection costs from communal collection points – See Table 12) alone would pay for the organic
waste digestion facilities within a period of 18 years and 4 years respectively for disposal at Dandora,
and in future at the further Ruai landfill. These savings would in turn afterward help keep collection
charge increases to residents as a result of using the new Ruai landfill to a minimum.
In general given the observed pay back periods of up to 15 years for minimal to no organic waste
buying incentives at potential digester facilities - with the exception of the scenario where high
selling prices for electricity are possible (greater than 13 KShs /kWh); the set up and operation of
0.0%
10.0%
20.0%
30.0%
40.0%
50.0%
60.0%
70.0%
4 5 6 7 8 9 10 11 12 13 14 15 16
Esti
mat
e R
etu
rns
on
Inve
stm
en
t
Electricity Selling Price (KShs/kWh
Estimate Annual Returns on Investment (pre-tax) relative to electricity selling price and pure organic waste buying incentives (indicated as [+]),
or tipping fees (indicated as [-] )
1 KShs/kg 0.5 KShs/kg 0 KShs/kg -1 KShs/kg
-2 KShs/kg -3 KShs/kg -4 KShs/kg
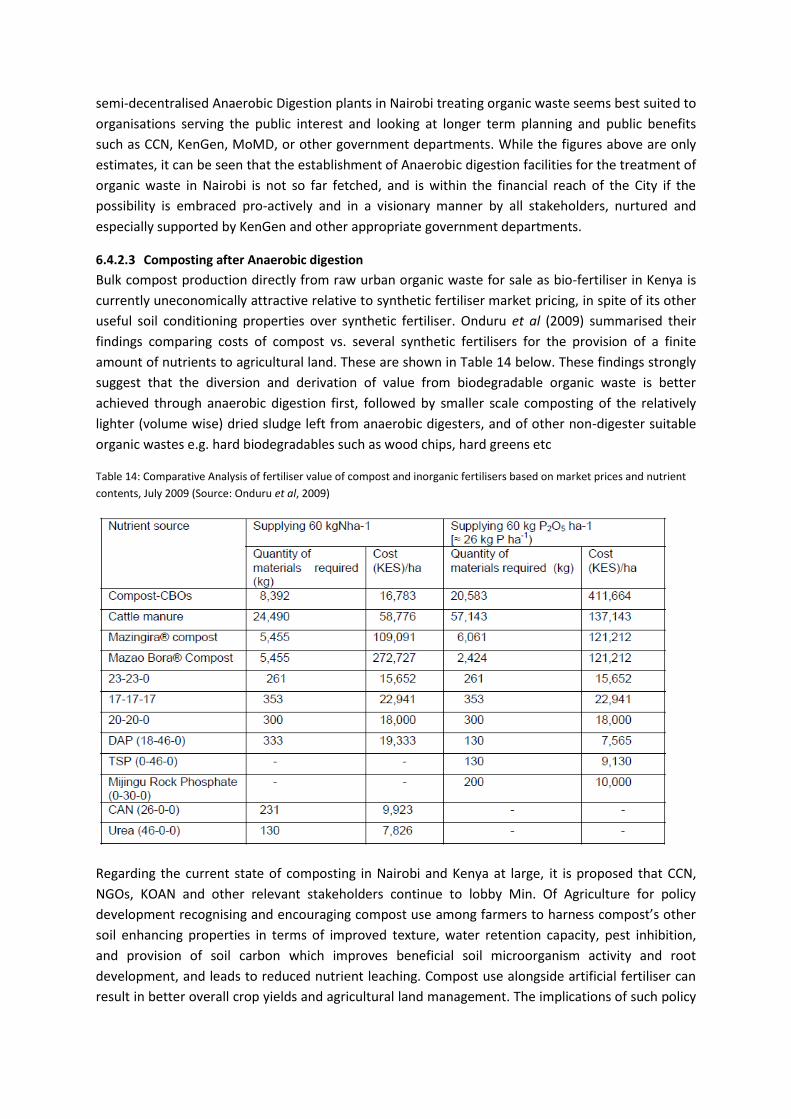
semi-decentralised Anaerobic Digestion plants in Nairobi treating organic waste seems best suited to
organisations serving the public interest and looking at longer term planning and public benefits
such as CCN, KenGen, MoMD, or other government departments. While the figures above are only
estimates, it can be seen that the establishment of Anaerobic digestion facilities for the treatment of
organic waste in Nairobi is not so far fetched, and is within the financial reach of the City if the
possibility is embraced pro-actively and in a visionary manner by all stakeholders, nurtured and
especially supported by KenGen and other appropriate government departments.
6.4.2.3 Composting after Anaerobic digestion
Bulk compost production directly from raw urban organic waste for sale as bio-fertiliser in Kenya is
currently uneconomically attractive relative to synthetic fertiliser market pricing, in spite of its other
useful soil conditioning properties over synthetic fertiliser. Onduru et al (2009) summarised their
findings comparing costs of compost vs. several synthetic fertilisers for the provision of a finite
amount of nutrients to agricultural land. These are shown in Table 14 below. These findings strongly
suggest that the diversion and derivation of value from biodegradable organic waste is better
achieved through anaerobic digestion first, followed by smaller scale composting of the relatively
lighter (volume wise) dried sludge left from anaerobic digesters, and of other non-digester suitable
organic wastes e.g. hard biodegradables such as wood chips, hard greens etc
Table 14: Comparative Analysis of fertiliser value of compost and inorganic fertilisers based on market prices and nutrient
contents, July 2009 (Source: Onduru et al, 2009)
Regarding the current state of composting in Nairobi and Kenya at large, it is proposed that CCN,
NGOs, KOAN and other relevant stakeholders continue to lobby Min. Of Agriculture for policy
development recognising and encouraging compost use among farmers to harness compost’s other
soil enhancing properties in terms of improved texture, water retention capacity, pest inhibition,
and provision of soil carbon which improves beneficial soil microorganism activity and root
development, and leads to reduced nutrient leaching. Compost use alongside artificial fertiliser can
result in better overall crop yields and agricultural land management. The implications of such policy

development in an already water stressed country like Kenya would include reduced potential for
the eutrophication of current water bodies, and reduced compromise of ground water quality due to
excessive nutrient leaching resulting from artificial fertiliser use alone. Other results that could be
expected from such policy development would include better pest management, reducing pesticide
expenses incurred by farmers in the long run. There is also the possibility for such a policy to
encourage alternative organic farming to tap into higher EU and global market prices for organic
agricultural produce.
Another potentially attractive avenue for the production and utilisation of compost could be
collaborative mixed fertiliser production with current Kenyan fertiliser manufacturers and sellers,
resulting in the development of optimal organo-synthetic fertiliser products that would tap into the
strengths of each component, and which would be superior in performance to either component
applied alone. In this way composting groups, CBOs etc, can gain fair pricing for compost product
and tap into the already established distribution and marketing chain of synthetic fertiliser
manufacturers and sellers in the country, leaving them to concentrate on compost production and
quality assurance. Such an arrangement with fertiliser manufacturers and sellers not only means
reduced distribution/marketing expense but also helps build the credibility of compost as an
agricultural product, as it positions it among ‘modern’ chemical fertilisers which are already bought
and positively perceived by many farmers, and also as a result of the already existing business
relationships fertiliser manufacturers and sellers have built with farmers (Rouse et al, 2008). A
successful example of this business model is in operation in Dhaka, Bangladesh where the Agro-
fertiliser company involved in this business model is confident it can sell up to 10 times the present
volume purchased from the composters (Rouse et al, 2008).
Finally the use of vermi-compost production methods is also a possibility for compost production as
they give greater nutrient value than aerobic composting (Baud et al, 2004) and would return better
nutrient value for the established selling prices in Table 14 above. The composting worms used in
the process can also be sold as poultry feed or fish bait after use. Pilot projects currently exist in
Bangalore, Hyderabad (Baud et al, 2004).
6.4.2.4 The Potential Domino effects of deriving value from Biodegradable waste through mainly
anaerobic digestion for energy
The following potential chain effects are envisaged from the active treatment of, and derivation of
value from organic waste through biogas plants generating electricity as a waste diversion activity;
Behavioural change by residents viewing waste as a resource and not simply a nuisance
The attachment of value to Organic waste will have reinforcing domino effects on inorganic
waste recycling with increased incentive for the encouragement of source separation by
collectors to clients, and in the process help to maximise value from both the organic and
inorganic streams in Nairobi leading to greater waste diversion
The anaerobic Digestion of organic waste for energy close to source at the Municipal Level,
alongside the current Lake Turkana Wind Energy farm project can serve as a trigger and driver
for the nationwide uptake and growth of the Renewable Energy Industry – an area that Kenya
and indeed many other developing countries should increasingly seek to develop alongside their
other existing concerns, so as to secure their energy and economical futures in an increasingly
volatile oil price and climate change global environment.

6.4.3 Specific Recyclable Stream Strategies
The current total recycling capacity in Nairobi is very low relative to total waste amounts being
generated (See Section 3). With the implementation of waste separation at source as proposed,
there will be an even more urgent need to increase total recycling capacity to take up the increased
volumes of separated quality recyclable material so as to realise significant waste diversion from
landfill.
In July 2006, the KNCPC, supported by UNDP and UNEP, finalized a Comprehensive Plastic Waste
Strategy for Nairobi City centred on the reduction, reuse and recycling of plastic wastes in the city;
with the CCN and the active participation of neighbourhood associations and CBOs helping to drive
this strategy (KNCPC, 2006). While its progress to date is not yet officially documented, there is a
need to develop similar strategies for other recyclable waste streams chiefly paper. The active
involvement here of organisations such as NEMA, various NGOs involved in the waste-to-resource
activity, and Academic and Research Institutions would help aid this. Paper is not a problematic
material besides its capture with minimal contamination, and options exist for its profitable use in
direct recycling in Nairobi for good quality papers (see Section 3.1.3), and for its anaerobic digestion
for energy and/or thermal energy recovery in the form of briquetting technologies when
unrecyclable. Strategy efforts similar to the KNCPC Plastics Strategy should therefore be steered
towards the encouragement of private enterprise in paper recycling, organisation and securing of
dependable supply chains for quality material, into research and development of various
technologies to tap into its value, and provision of seed funding for intending entrepreneurs.
Problematic waste materials that are difficult to recycle or for which recycling capacity is currently
non-existent or overly expensive are proposed to be dealt with via Extended Producer Responsibility
as discussed in Section 6.4.4.
6.4.4 Landfill or End-of-Life Treatment Levies on Problematic Waste Materials
Some waste materials generated do not currently have recycling infrastructure in the City or are
altogether not readily recyclable and therefore pose end-of-life problems. Some of these include
broken glass (discussed further in Sections 1.3, 3.1.4 and 4.2.6) which has limited appropriate
recycling infrastructure; and plastic bags especially less than 30 microns, polystyrene food packaging,
waxed paper, tetrapak containers, Construction & Demolition waste etc which are generally more
difficult materials to recycle. Other candidates to this list would include e-waste, for which no
recycling capacity and legislature currently exists. A proposal here is made to institute National level
landfill taxes on problematic materials, which may also be interpreted as end-of-life treatment or
disposal planning taxes. These taxes or levies would be payable at the gate of manufacturers,
importers or relevant sellers whichever is appropriate, in line with the ethos of Extended Producer
Responsibility, and would flow into a central pool fund to enable the purchase and/or development
of appropriate recycling capacity or end of life treatment infrastructure. An example of the
application of Extended Producer Responsibility is the 2008 Government exercise duty of 120% on
carrier bags, and ban on production of plastic bags of less than 30 micron thickness. In instances
where national tax disincentives for such materials already exist such as in the case of plastic bags,
recommendation would be towards the rigorous implementation of the same.
A successful example of this model of planning for the end-of-life treatment of problematic wastes is
Municipal Council of Nakuru which stipulates under Section 197(i) of their environmental

management by-laws for instance “Any person who uses polythene bags for whatever purpose in his
business or elseswhere shall bear the cost of treating or disposing of that polythene. (ii) The cost
shall not exceed 20% of the Business Permit fee unless the Council otherwise decides“ (Muraya,
2010; pers. communication).
A similar approach could be taken in Nairobi where manufacturers, businesses, commerce or other
activity as appropriate from which these materials initially originate before entering the public space
would help pay for the infrastructure necessary to recycle or safely dispose of these materials,
through their annual renewal fees for business permits or licenses. The funds from this would then
go into a central pool for this purpose as described above.
6.5 End fate of residual or un-diverted solid waste in the City: Construction and
Capitalisation of Sanitary Landfill at Ruai
Given that the official designated dumpsite at Dandora has reached full capacity and has been noted
to be responsible for gross environmental and public health hazards (Kimani, 2007), there is an
urgent need to accelerate the movement of residual waste disposal to the proposed new engineered
landfill at Ruai as per JICA’s (1998) recommendations. This would result in minimised environmental
pollutions from the waste, and have long term implications towards the future ecological and
general health of the city. It is envisaged that such an engineered landfill facility would be primarily
for the end disposal of residual waste with greater emphasis placed on waste diversion for
recyclable and organic/biodegradable materials via value derivation as discussed in Section 6.4; in
order reduce overall disposal distances and costs, and extend landfill life expectancy.
6.6 Continual monitoring of Waste Character, Quantities and related solid waste
information to aid future planning
The future planning of solid waste management in Nairobi, measurement of policy performance and
the future execution of decisions by relevant decision makers will rely on the provision of accurate
and timely information. It is therefore necessary to make provision for the regular update of waste
and its related information in Nairobi such as waste character across generators, waste quantities
and contributions to this from different generators, population and macro/micro economic growth
data, waste amounts collected and reaching designated disposal sites, illegal dumping, recycling
levels etc. Activities proposed to keep tabs on this information include:
- Week long waste characterizations, quantifications and related waste research twice a year
every five years by CCN/NEMA Officers, or organised into regular research projects conducted in
collaboration with local academic institutions. These would inform on character, generated
quantities, contributions from different generators, recycling levels, collection levels, amounts
reaching designated disposal sites and other information of interest. Research would also go into
the development of local solid waste management and reuse/recycling technologies.
- Establishment and regular maintenance of Weighbridge at designated disposal sites
- Regular update of population and macro/micro economic data through liaising with Kenya
National Bureau of Statistics
- Accurate register and record keeping on the numbers and nature of the various actors involved
in Nairobi’s waste collection and management by CCN
References
Bahri, G. 2005. Sustainable Management of Plastic Bag Waste: The Case of Nairobi, Kenya. MSc. in
Environmental Management and Policy IIIEE, Lund University. Available from: ]http://www.svep-
projekt.se/undergrad/search.tkl?field_query1=pubid&query1=1148993488-1734-
689&recordformat=display [accessed 5 March 2009].
Baud, I.S.A., Post, J. & Furedy, C. 2004. Solid waste management and recycling actors, partnerships
and policies in Hyderabad, India and Nairobi, Kenya. Illustrated ed.Springer.
Dahlén, L. & Lagerkvist, A. 2010. Pay as you throw: Strengths and weaknesses of weight-based billing in household waste collection systems in Sweden. Waste Management. 30(1):23-31.
Farabee, M.J. 2001. Factors influencing population growth. [Online]. Available from:
http://www.emc.maricopa.edu/faculty/farabee/BIOBK/BioBookpopecol.html [accessed 15 March
2009].
Gibson, C. & Jung, K. 2005. Historical Census Statistics On Population Totals By Race, 1790 to 1990,
and By Hispanic Origin, 1970 to 1990, For Large Cities And Other Urban Places In The United States .
US Census Bureau. [Online]. Available from:
http://www.census.gov/population/www/documentation/twps0076/twps0076.html. [accessed 5
May 2009].
Gilbert, M.M. & Wendell, E.P. 2008. Introduction to Environmental Engineering & Science. 3rd ed.
Pearson Education International. 107, 606-609.
Githinji, V., Olala, M., and Maritim, W., 2009. Report: Feed Milling Industry Survey. Ministry of Livestock Development and Association of Kenya Feed Manufacturers. Gutberlet, J. 2010. Waste, poverty and recycling. Waste Management. 30(2):171-173.
ISWM Stakeholders Workshop Report, 2009. Report on UNEP/CCN 3rd ISWM Stakeholder Workshop
to Identify Issues of Concern for the ISWM Plan - December 2009. Pan Afric Hotel, Nairobi.
JICA 1998. The study on solid waste management in Nairobi City in the Republic of Kenya : final
report. Japan International Cooperation Agency (JICA); in collaboration with CTI Engineering &
Environmental Technology Consultants. [Online]. Available from:
http://lvzopac.jica.go.jp/external/library. [accessed 10 April 2009].
Kahiu, 2009. Presentation: Assessment of Current Waste Management Systems: Technology &
Infrastructure. 2nd UNEP/CCN ISWM Training Workshop II – June 2009. Pan Afric Hotel, Nairobi.
Karanja, A. 2005. Solid Waste Management in Nairobi: Actors, Institutional Arrangements and
Contributions to Sustainable Development. PhD in Development Studies, Institute of Social Studies,
The Hague, Netherlands. Available: http://www.shaker.nl.
Kenya National Bureau of Statistics. 2009. GDP Per Capita (constant 1982 prices)1996 - 2008.
[Online]. Available from: http://www.knbs.or.ke/. [accessed 10 January 2010]
Kibwage, J. 1996. Towards the Privatisation of Household Solid Waste Management Services in the
City of Nairobi. Masters Thesis. [Online]. Available from:
www.tobaccotobamboo.com/masters_thesis/coverpage.pdf. [accessed 10 December 2009].
Kimani, N.G. 2007. Environmental Pollution and Impacts on Public Health: Implications of the
Dandora Municipal Dumping site in Nairobi, Kenya. United Nations Environment Programme (UNEP)
- Urban Environment Unit. Available from:
http://www.unep.org/urban_environment/PDFs/DandoraWasteDump-ReportSummary.pdf
[accessed 3 May 2009].
KNCPC. 2006. A Comprehensive Plastic Waste Management Strategy for the City of Nairobi. Nairobi:
Kenya National Cleaner Production Centre.
Letema, S., Murray, I., and Kigo, D. 2009. Presentation: Institutional Analysis. 3rd UNEP/CCN ISWM
Stakeholder Workshop - December 2009. Nairobi, Kenya.
Muraya, I. 2010. Plastic Bag Disincentives in Nakuru Municipality. Personal Communication via Miss.
Annemarie Kinyanjui, UNEP Nairobi Office.
Ngau & Kahiu, 2009. ISWM Secondary Data Report on Solid Waste Inventory in Nairobi: Report of the National Technical Taskforce (NTT) on Preparation of An Integrated Solid Waste management Plan for Nairobi. Nairobi. Njenga, 2009a. Presentation: Financing Mechanism - Current Earnings & Expenditures - City Council of Nairobi. 2nd UNEP/CCN ISWM Workshop - July 2009. Pan Afric Hotel, Nairobi, Kenya. Njenga, 2009b. Personal communication on why waste billing coupled to water bills failed in low income areas. City Council of Nairobi, Department of Environment. Njenga, 2009c. Personal communication on how illegal dumping and environmental crimes related to solid waste management in Nairobi can be curbed. City Council of Nairobi, Department of Environment. NTT. 2009. Private communication on currently registered private waste collectors and Dandora Weighbridge records. National Task Team, UNEP Integrated Solid Waste Management Project 2009 - Nairobi. Onduru, D.D., Waarts, Y., Jager, A., Zwart, K. 2009. Converting City Waste into Compost Pilot Nairobi: Inventory and Analysis of Users, Producers and Markets for Compost, Biogas and Livestock Feeds in Urban and Peri-urban Areas of Nairobi. ETC East Africa; LEI Wageningen; Alterra Wageningen Polprasert, C. 2007. Organic Waste Recycling: Technology and Management. 3rd ed. London: IWA
Publishing. 9-16.
Rees, D. 2005. Recycling Organic Waste. Practical Action. [Online] Available from:
http://practicalaction.org/docs/technical_information_service/recycling_organic_waste.pdf
[accessed 23 May 2009].
Riuji, L.C. 2005. Research on Anaerobic Digestion of Organic Solid Waste at Household Level in Dar es
Salaam, Tanzania. Bachelor of Science. Institute of Natural Resource Sciences, Zurich University of
Applied Sciences. [Online]. Available from:
http://www.eawag.ch/organisation/abteilungen/sandec/publikationen/publications_swm/downloa
ds_swm/anaerobic_digestion.pdf. [accessed 10 April 2009]
Rouse, J., Rothenberger, S., Zurbrügg, C. 2008. Marketing Compost: A guide for Compost Producers
in Low and Middle Income Countries. Sandec: Department of Water and Sanitation in Developing
Countries. Eawag Aquatic Research.
UNEP & UN-HABITAT - Kenya 2007. City of Nairobi Environment Outlook. Nairobi, Kenya.: United
Nations Environment Programme (UNEP) & United Nations Human Settlements Programme (UN
Habitat), Kenya. [Online]. Available from:
http://www.unep.org/DEWA/Africa/docs/en/NCEO_Report_FF_New_Text.pdf. [accessed 10 May
2009].
UN-HABITAT & UN-OCHA, 2009. Report on Planning Meeting convened jointly by UN-HABITAT & UN-OCHA: Strengthening Co-ordination Response on Urban Vulnerability in Kenya. Nairobi, Kenya. Wendell Cox Consultancy, 2001. Greater London, Inner London & Outer London Population & Density
History. [Online]. Available from:.http://www.demographia.com/dm-lon31.htm. [accessed 18 May
2009].