Solid phase extraction of organochlorine pesticides with ... · Solid phase extraction of...
14
Solid phase extraction of organochlorine pesticides with modified poly (styrene-divinylbenzene) microbeads using home-made solid phase extraction syringes Basri Gu ¨ lbakan, Cengiz Uzun, O ¨ mu ¨r C ¸ elikbıc ßak, Olgun Gu ¨ ven, Bekir Salih * Hacettepe University, Faculty of Science, Department of Chemistry, Beytepe Campus, 06532 Ankara, Turkey Received 29 April 2006; received in revised form 8 August 2007; accepted 22 October 2007 Abstract Poly (styrene-divinylbenzene) (PS-DVB) microbeads, having 8 lm diameters were modified with –NH 2 , –CN and –COOH functional groups. These modified microbeads were used in home-made solid phase extraction cartridge for the recovery and the pre-concentration of chlorinated pesticides from aqueous media. Characterization of pristine and –NH 2 , –CN and –COOH functional groups modified microbeads were examined by Fourier transform-infrared spectrom- eter (FT-IR), porosimeter, scanning electron microscope (SEM) and thermogravimetric analyzer (TGA). It was found from gravimetric analyses that high amount of functional groups were modified onto the polymeric microbeads. For the recovery and pre-concentration of chlorinated pesticides, a standard mixture containing 17 different chlorinated pes- ticides in acetone were used and diluted in water to prepare dilute working solution of the pesticides. Flow rate of 0.3 mL/ min was found to be optimum flow rate for the high recovery and high pre-concentration factor for the studied pesticides. The highest recovery value of all studied pesticides were obtained when –CN modified microbeads were used. Recovery and the pre-concentration factors for the other microbeads modified with –NH 2 and –COOH was found to be lower than –CN modified microbeads. However, these two different type microbeads could also be used for the recovery and pre-con- centration of chlorinated pesticides. For the desorption of the chlorinated pesticides from the modified microbeads, ethyl acetate was found to be the best desorbing agent instead of hexane, dichloromethane and the other desorbing agents. Recovery of the chlorinated pesticides was higher than 85% and pre-concentration factor was found to be at least 200-fold. Ó 2007 Elsevier Ltd. All rights reserved. Keywords: Modified PS-DVB; Recovery; Chlorinated pesticides; Solid phase extraction; Pre-concentration; Modification 1. Introduction Organochlorine pesticides (OCPs) are organic micro pollutants of great environmental concern due to their toxicity, persistent nature and highly adverse effects on animals and human beings [1–3]. Although usage of OCPs has been banned and restricted in developed countries, they still found extensive use in many developing countries for agri- cultural and public purposes, owing to their low cost and effective control on harmful insects [4]. OCPs are generally found in complex matrices at 1381-5148/$ - see front matter Ó 2007 Elsevier Ltd. All rights reserved. doi:10.1016/j.reactfunctpolym.2007.10.014 * Corresponding author. Tel.: +90 3122977975; fax: +90 3122992163. E-mail address: [email protected] (B. Salih). Available online at www.sciencedirect.com Reactive & Functional Polymers 68 (2008) 580–593 www.elsevier.com/locate/react REACTIVE & FUNCTIONAL POLYMERS
-
Upload
duongtuyen -
Category
Documents
-
view
232 -
download
0
Transcript of Solid phase extraction of organochlorine pesticides with ... · Solid phase extraction of...
Available online at www.sciencedirect.com REACTIVE
Reactive & Functional Polymers 68 (2008) 580–593
www.elsevier.com/locate/react
&FUNCTIONALPOLYMERS
Solid phase extraction of organochlorine pesticideswith modified poly (styrene-divinylbenzene) microbeads
using home-made solid phase extraction syringes
Basri Gulbakan, Cengiz Uzun, Omur Celikbıc�ak, Olgun Guven, Bekir Salih *
Hacettepe University, Faculty of Science, Department of Chemistry, Beytepe Campus, 06532 Ankara, Turkey
Received 29 April 2006; received in revised form 8 August 2007; accepted 22 October 2007
Abstract
Poly (styrene-divinylbenzene) (PS-DVB) microbeads, having 8 lm diameters were modified with –NH2, –CN and–COOH functional groups. These modified microbeads were used in home-made solid phase extraction cartridge forthe recovery and the pre-concentration of chlorinated pesticides from aqueous media. Characterization of pristine and–NH2, –CN and –COOH functional groups modified microbeads were examined by Fourier transform-infrared spectrom-eter (FT-IR), porosimeter, scanning electron microscope (SEM) and thermogravimetric analyzer (TGA). It was foundfrom gravimetric analyses that high amount of functional groups were modified onto the polymeric microbeads. Forthe recovery and pre-concentration of chlorinated pesticides, a standard mixture containing 17 different chlorinated pes-ticides in acetone were used and diluted in water to prepare dilute working solution of the pesticides. Flow rate of 0.3 mL/min was found to be optimum flow rate for the high recovery and high pre-concentration factor for the studied pesticides.The highest recovery value of all studied pesticides were obtained when –CN modified microbeads were used. Recoveryand the pre-concentration factors for the other microbeads modified with –NH2 and –COOH was found to be lower than–CN modified microbeads. However, these two different type microbeads could also be used for the recovery and pre-con-centration of chlorinated pesticides. For the desorption of the chlorinated pesticides from the modified microbeads, ethylacetate was found to be the best desorbing agent instead of hexane, dichloromethane and the other desorbing agents.Recovery of the chlorinated pesticides was higher than 85% and pre-concentration factor was found to be at least 200-fold.� 2007 Elsevier Ltd. All rights reserved.
Keywords: Modified PS-DVB; Recovery; Chlorinated pesticides; Solid phase extraction; Pre-concentration; Modification
1. Introduction
Organochlorine pesticides (OCPs) are organicmicro pollutants of great environmental concern
1381-5148/$ - see front matter � 2007 Elsevier Ltd. All rights reserved
doi:10.1016/j.reactfunctpolym.2007.10.014
* Corresponding author. Tel.: +90 3122977975; fax: +903122992163.
E-mail address: [email protected] (B. Salih).
due to their toxicity, persistent nature and highlyadverse effects on animals and human beings [1–3].Although usage of OCPs has been banned andrestricted in developed countries, they still foundextensive use in many developing countries for agri-cultural and public purposes, owing to their lowcost and effective control on harmful insects [4].OCPs are generally found in complex matrices at
.
B. Gulbakan et al. / Reactive & Functional Polymers 68 (2008) 580–593 581
trace levels. Their exact determination has been achallenging task for many years [5,6]. These low lev-els usually necessitate an extraction and pre-concen-tration step. Several extraction methods have beendescribed to determine OCPs in different media withdifferent instrumental techniques [7–10]. Liquid–liquid extraction (LLE) was the first and the mostcommon used method for extraction [11,12]. Solidphase extraction (SPE) became the most powerfultrace enrichment method recently since it offersmany advantages over LLE and overcomes mostof the drawbacks of traditional LLE [13–15].Graphitized carbon black [16–19], chemicallybonded silica with C8 and C18 groups [20,21] andpolymeric resins such as XAD2, XAD4 [22,23],PRP-1 and PLRP-S [24–27] have been used for solidphase extraction of pesticides. Despite the commonuse of bonded silica and polystyrene resins for var-ious analytes, they possess several shortcomings fortheir use in SPE. While silica itself hydrophilic andinstable in alkaline solutions, the hydrocarbonchains make the surface hydrophobic. Because ofthe surface hydrophobicity of alkylated silica, thecontact of the surface of alkylated silica with pre-dominantly aqueous samples is poor. However,the other resins-porous polystyrene resins have alsoa hydrophobic character and surface contact ofthese resins is really poor like alkylated silica resins.The surface hydrophobicity of these sorbents usu-ally necessitates a pretreatment step with a polaractivating solvent such as methanol or acetonitrileto obtain better surface contact with aqueous sam-ples [28]. However, the activating solvent can be lea-ched out of the resin, which causes ineffectiveextraction. In order to overcome all these draw-backs, chemically modified resins have been startedto use widely. For the new chemical modified resins,various functional groups have been chemicallyattached to the polymeric resins [29–33]. Chemicalintroduction of polar groups increases the surfacehydrophilicity and improves the surface contactbetween the resin and the analyte and recoveriesof polar compounds considerably increase whencompared to their unmodified counterparts[29,31,34,35]. In previous studies, PS-DVB micro-beads were chemically modified with hydroxy-methyl, benzoyl, acetyl, o-carboxy benzoyl andtrimethyl ammonium groups [28,29,32,33]. In thisstudy, different chemical modifications were usedto increase the surface polarity of PS-DVB micro-beads having 8 lm sizes and to obtain better recov-eries than their unmodified analogues and
previously modified functional groups. PS-DVBmicrobeads have been modified with amine, carbox-ylic acid and cyano groups and performance ofthese modified resins were tested over commercialsolid phase extraction resins packed with C18bonded silica. Chlorinated pesticide mixture stan-dard containing 17 different pesticides were usedand the recoveries and pre-concentration factor ofpesticides were calculated by using the resultsobtained by a gas chromatograph (GC) equippedwith electron capture detector (ECD) and massdetector (MS).
2. Experimental
2.1. Materials and methods
PS-DVB (12% w/w DVB) microbeads havingaverage 8 lm diameter were purchased fromAldrich (Milwaukee, USA). Nitric acid (HNO3,65%, v/v) and sulfuric acid (H2SO4, 98%, v/v) werepurchased from Merck and were of spectroscopicgrade. To obtain 95% HNO3 by weight, the mixtureHNO3/H2SO4 in 50% v/v was distilled and dilutedto 90%. Hexane, acetone and ethyl acetate were pur-chased from Merck (Darmstadt, GERMANY) andwere of pesticide quality. Copper (I) cyanide(CuCN) and sodium nitrite (NaNO2) were pur-chased from Aldrich (Buchs, SWITZERLAND)and used without further purification. Potassiumbromide was obtained from Merck (Darmstadt,GERMANY) as spectroscopic grade for FT-IR.All other chemicals were of reagent grade and usedwithout further purification. Organochlorine pesti-cide standard containing 17 different pesticides inacetone at 1000 ppm for each-was of analyticalgrade and obtained from (Accustandard, NewHaven, CT, USA). A mixture of all the compoundswas prepared by using deionized water of18.2 MX cm resistivity obtained from a MilliQ-water purification system (Millipore, Bedford,MA, USA.) All solutions were prepared freshlybefore solid phase extraction procedure wasapplied. The stock and standard solutions werestored in a refrigerator at +4 �C until use.
2.2. Modification of the PS-DVB microbeads with
–NH2 group
PS-DVB microbeads were first nitrated throughnitration reaction, in order to modify the polymericmicrobeads further with –NH2 group. A typical
582 B. Gulbakan et al. / Reactive & Functional Polymers 68 (2008) 580–593
preparation procedure was exemplified below. PS-DVB beads (1 g) were added into 4 mL of 90%HNO3 in small portions. Since the nitration reac-tion is extremely exothermic, reaction mixture waskept at 0 �C with an ice bath during the reaction.After finishing the addition of the microbeads, reac-tion mixture was kept at 25 �C for 1 h. Then micro-beads were filtered and washed with cold waterseveral times to remove the any unreacted HNO3.Finally microbeads were washed with acetone anddried in a vacuum oven at 60 �C. Nitration yieldwas determined gravimetrically and 42% weightincrement was found when compared to initialweight of the beads. The weight increment corre-sponds to theoretical calculation for almost allaromatic rings nitrated case. For the conversionof –NO2 groups to –NH2 groups, a reduction reac-tion is carried out. For this purpose, 1 g of nitratedmicrobeads was refluxed in the presence of HCl byadding tin filings in small portions at 80 �C. Inorder to check full conversion of –NO2 groups to–NH2 groups, FT-IR spectra of the samples wererecorded at each addition of tin filings. It was foundthat 2.8 g tin fillings and 5 mL concentrated HClwere required for the complete reduction. Aftercompletion of the reduction reaction, an additional5 mL HCl was added for the oxidation of remainingtin filings, and then the reaction mixture was cooledto room temperature. Microbeads were filtered andthen washed with 1 M HCl, 1 M NaOH and water,respectively. Finally, modified microbeads with–NH2 functional groups were dried in vacuum ovenat 60 �C.
2.3. Modification of the PS-DVB microbeads with
–CN functional groups
For the modification of PS-DVB microbeadswith –CN groups, Sand Meyer reaction [36] wasapplied. Diazonium chloride salt of the –NH2 mod-ified microbeads was prepared as the first step. NH2
modified microbeads (1 g) were added to the solu-tion containing 3 mL concentrated HCl and 6 mLwater in a flask. Cooled NaNO2 solution (0.63 gNaNO2 and 2 mL water) was added to the poly-meric suspended mixture drop by drop at 0 �C.The reaction temperature was kept at 0 �C usingan ice bath during all reaction period. After comple-tion of NaNO2 addition, reaction mixture was keptat 0 �C for another 1 h. Then microbeads were fil-tered off and washed with cold water. Since the dia-zonium chloride salts were not so stable, these
microbeads were subjected directly to Sand–Mayerreaction right after the synthesis. Diazonium saltsof microbeads (1 g) were reacted with 0.54 g ofCuCN and 0.62 g of KCN in 13 mL water. The pro-gress of the reaction was followed through the evo-lution of nitrogen gas. Reaction mixture was keptovernight at 25 �C to reach complete conversion.Microbeads were then washed with water and 1 Mof HNO3 to remove any unreacted CuCN. Finallymicrobeads were washed with water and acetoneand then dried in vacuum oven.
2.4. Modification of the PS-DVB microbeads with
–COOH groups
Microbeads modified with –CN were hydrolyzedunder acidic conditions with H2SO4, in order toobtain –COOH modified microbeads. CN modifiedmicrobeads (1 g) were refluxed with 50 mL 75%H2SO4 at 140–150 �C for 8 h. After complete hydro-lysis, microbeads were washed with water to removeexcess H2SO4 several times and dried in a vacuumoven at 60 �C.
2.5. Characterization of modified microbeads
FT-IR spectra of pristine and modified PS-DVBmicrobeads were recorded by using FT-IR spec-trometer (Nicolet, 520 Model FT-IR spectrometer,SA). A few mg of sample was thoroughly mixedwith 0.1 g of KBr and pressed into pellet form andthen the spectrum was recorded. TGA thermogramsof PS-DVB and modified PS-DVB microbeads wereobtained by using Thermal Analyzer (Dupont 951Model, USA). The mass of the samples was gener-ally in the range of 5–8 mg. The heating runs wereperformed from 30 �C to 800 �C at a heating rateof 10 �C/min under nitrogen atmosphere with20 mL/min nitrogen gas flux. The mass of the sam-ple was continuously recorded as a function of tem-perature. For the measurements of BET surfacearea, pore size and pore volume of the plain andmodified microbeads were done by Quantachrome,NOVA 2000 series volumetric gas adsorptioninstrument and for the scanning electron micro-scope images, Jeol Scanning Electron Microscope(SEMASID-10, JAPAN) were used at an accelerat-ing voltage of 80 kV. For the images of SEM, spec-imens were mounted on metal slubs and thensplattered with a 100 A-thick layer of gold in a sput-ter apparatus (Bio-Rad,England) and then imageswere obtained. Elemental compositions of the plain
B. Gulbakan et al. / Reactive & Functional Polymers 68 (2008) 580–593 583
and modified polymers were also measured usingelement composition mode of SEM.
2.6. Solid phase extraction apparatus
For the construction of home-made solid phaseextraction syringe barrels, polypropylene syringesof 2 mL and polyethylene frits having 0.2 lm poresize were purchased from ChromTech (USA) andused as received. Commercial SPE syringes in the10 � 12 mm dimensions (having an internal volumeof 6 mL) containing 100 mg C18 bonded silica werepurchased from AllTech (USA).
2.7. Construction of home-made SPE syringes
For the construction of home-made solid phaseextraction syringes, one filter was placed at the bot-tom of the syringe and, 100 mg of –CN, –NH2 and–COOH modified polymeric microbeads wereweighed and placed into the syringe and then finallyanother filter was placed at the top of the syringe.
2.8. Extraction procedure
The syringes were conditioned with 2 mL ofmethanol and 2 mL of water, respectively, beforeintroducing the sample through the syringes. An ali-quot of 20 mL of pesticide solution containing dif-ferent amount of pesticides (i.e., from 0.5 to100 ppb) was applied through the syringe at0.3 mL/min flow rate. Before elution, the columnwas dried by passing through nitrogen gas for10 min. Pesticides were eluted with ethyl acetate intoa calibrated tube until the final volume of 1 mL wasreached.
2.9. Chromatographic conditions
A gas chromatograph (GC 6890, Hewlett-Pack-ard, Palo Alto, CA, USA), coupled with a massdetector (MS5973N, Hewlett-Packard, Palo Alto,CA, USA) and electron capture detector (ECD,Hewlett-Packard, Palo Alto, CA, USA) was usedfor the analysis of pesticides. Flow rate of heliummobile phase was set at 1.0 mL/min. The tempera-ture programming was set as follows: Temperaturewas held for 1 min at 50 �C, then increased to200 �C with a 15 �C/min heating ramp and thenkept at 200 �C for 5 min. Finally, temperature wasincreased to 280 �C with a 25 �C/min heating rampand kept at 280 �C for 10 min. GC–MS system was
used only to optimize the order of the pesticidespassing through the capillary GC column and definethe retention time of each pesticide.
3. Results and discussion
3.1. Characteristics of pristine and modified PS-DVB
microbeads
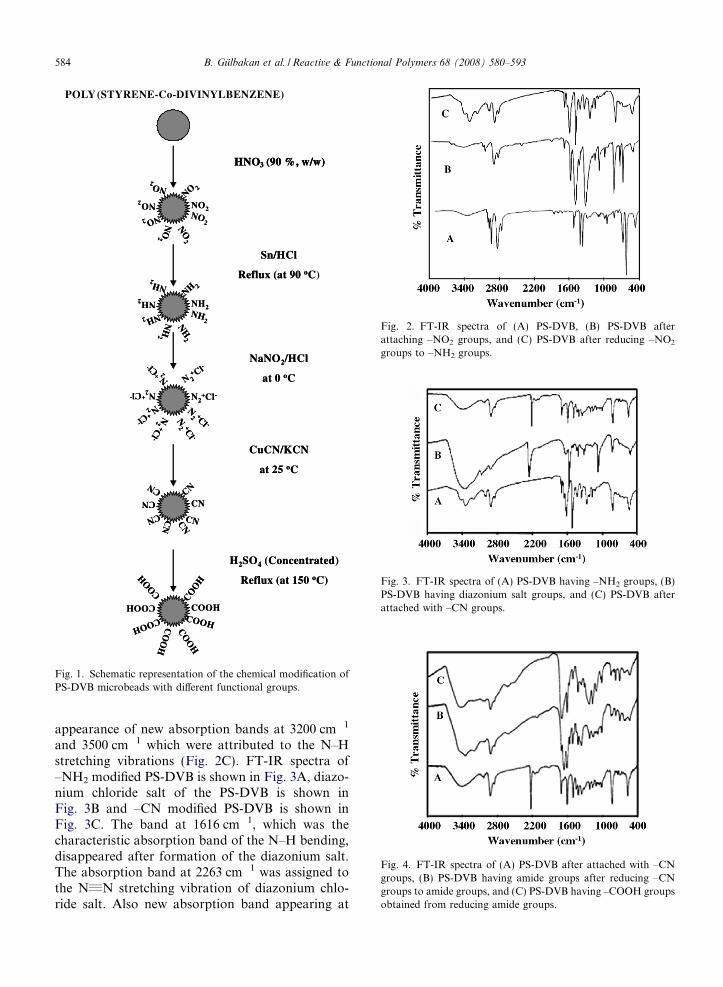
In order to synthesize –NH2, –COOH and –CNmodified PS-DVB microbeads, first –NO2 func-tional groups were attached onto the pristine PS-DVB microbeads and –NO2 groups were reducedto –NH2 groups. In the second step, –NH2 func-tional groups were converted to diazonium chloridesalts and reacted with CuCN to obtain –CN mod-ified microbeads. In the final step, a part of –CNmodified microbeads were hydrolyzed in the acidicmedium and all –CN groups were converted to–COOH functional groups via amide groups. Thissystematic study scheme is shown in Fig. 1 indetail.
3.2. Characterization by FT-IR
For the characterization of the pristine and mod-ified PS-DVB microbeads, FT-IR spectra wererecorded and given in Figs. 2–4. In Fig. 2, the FT-IR spectra of pristine PS-DVB, nitrated PS-DVBand –NH2 modified PS-DVB microbeads weregiven. The absorption bands at 1520 cm�1 and1342 cm�1 in Fig. 2B were assigned to the asymmet-ric and symmetric –N. . .O stretching vibrations,respectively. The absorption band observed at856 cm�1 was assigned to the –C–N stretchingvibration that characterizes the attachment of–NO2 groups to the pristine polymeric microbeads.These results indicated that the successful attach-ment of –NO2 groups to the PS-DVB microbeadswas obtained. After the nitration of the PS-DVBmicrobeads, weight of pristine polymer wasincreased and this increment value was found tobe 42%. This result showed that high amount of–NO2 groups was loaded onto the polymeric micro-beads. The main spectral changes on the FT-IRspectrum of nitrated PS-DVB, when the reductionreaction was carried out, were the disappearanceof –N. . .O stretching vibration bands at 1520 and1342 cm�1. The new absorption band at1616 cm�1 assigned to the –N–H bending vibration.The most striking indication of the reduction of–NO2 groups to the –NH2 groups was the
NaNO2/HCl
at 0 oC
CuCN/KCN
at 25 oC
HNO (90 %, w/w)3
Sn/HCl
Reflux (at 90 oC
POLY(STYRENE-Co-DIVINYLBENZENE)
NO2
NO 2
NO2N
O2
NO2
NO2
NO2
NO
2
NH2
NH 2
NH2N
H2
NH2
NH2
NH2
NH
2
N 2+ Cl-
N2+Cl-
N2+Cl-
N2+Cl-
N2 +Cl -
N2 +C
l -
N2
+Cl-
N2+Cl
-
CNCN
CNCN
CN
CNCN C
NH2SO4 (Concentrated)
Reflux (at 150 oC)
COOH
CO
OH
COOHCO
OH
COO
H
COOH
COOH CO
OH
NaNO2/HCl
at 0 oC
CuCN/KCN
at 25 oC
HNO (90 %, w/w)3HNO (90 %, w/w)3
Sn/HCl
Reflux (at 90 oC)
NO2
NO 2
NO2N
O2
NO2
NO2
NO2
NO
2
NH2
NH 2
NH2N
H2
NH2
NH2
NH2
NH
2
N 2+ Cl-
N2+Cl-
N2+Cl-
N2+Cl-
N2 +Cl -
N2 +C
l -
N2
+Cl-
N2+Cl
-
CNCN
CNCN
CN
CNCN C
NH2SO4 (Concentrated)
Reflux (at 150 oC)
COOH
CO
OH
COOHCO
OH
COO
H
COOH
COOH CO
OH
Fig. 1. Schematic representation of the chemical modification ofPS-DVB microbeads with different functional groups.
Fig. 2. FT-IR spectra of (A) PS-DVB, (B) PS-DVB afterattaching –NO2 groups, and (C) PS-DVB after reducing –NO2
groups to –NH2 groups.
Fig. 3. FT-IR spectra of (A) PS-DVB having –NH2 groups, (B)PS-DVB having diazonium salt groups, and (C) PS-DVB afterattached with –CN groups.
Fig. 4. FT-IR spectra of (A) PS-DVB after attached with –CNgroups, (B) PS-DVB having amide groups after reducing –CNgroups to amide groups, and (C) PS-DVB having –COOH groupsobtained from reducing amide groups.
584 B. Gulbakan et al. / Reactive & Functional Polymers 68 (2008) 580–593
appearance of new absorption bands at 3200 cm�1
and 3500 cm�1 which were attributed to the N–Hstretching vibrations (Fig. 2C). FT-IR spectra of–NH2 modified PS-DVB is shown in Fig. 3A, diazo-nium chloride salt of the PS-DVB is shown inFig. 3B and –CN modified PS-DVB is shown inFig. 3C. The band at 1616 cm�1, which was thecharacteristic absorption band of the N–H bending,disappeared after formation of the diazonium salt.The absorption band at 2263 cm�1 was assigned tothe N„N stretching vibration of diazonium chlo-ride salt. Also new absorption band appearing at

B. Gulbakan et al. / Reactive & Functional Polymers 68 (2008) 580–593 585
1082 cm�1 confirms the formation of the diazoniumsalt.
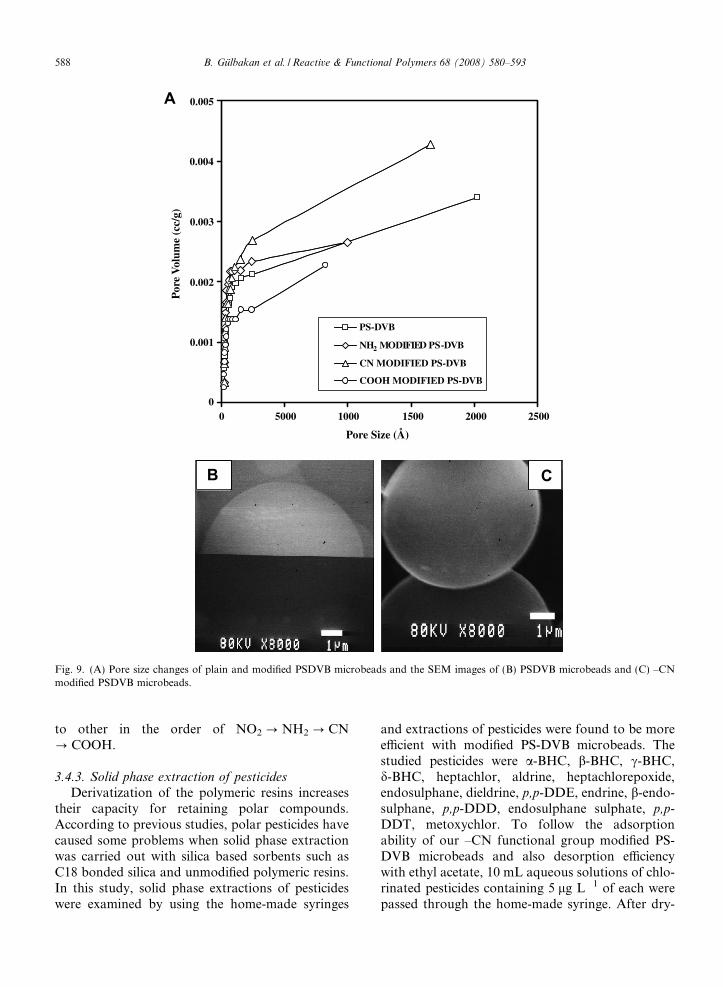
The absorption band at 2263 cm�1 attributed tothe N„N stretching vibration was converted to anew and sharp absorption band at 2226 cm�1. Theintense absorption band at 1082 cm�1 also disap-peared. These two spectral changes pointed out thatthe chemical attachments of –CN groups were suc-cessfully made onto PS-DVB microbeads. FT-IRspectra of the –CN modified microbeads are givenin Fig. 4A to compare the FT-IR spectra of–CONH2 (Fig. 4B) and –COOH (Fig. 4C) modifiedPS-DVB microbeads. The sharp absorption band at2226 cm�1 disappeared completely when the–CN modified microbeads were converted first toamide and then to carboxylic acid groups. Thenew absorption band appearing at 1700 cm�1 wasassigned to the C@O stretching vibration via–COOH groups. The broad absorption band at3500 cm�1 was assigned to the O–H stretching inthe –COOH groups.
Fig. 5. TGA curves of (A) PS-DVB, (B) PS-DVB after attaching –NO2 gand (D) PS-DVB having diazonium salt groups.
3.3. Characterization by TGA
For the thermogravimetric analysis, pristine PS-DVB and modified PS-DVB microbeads with differ-ent functional groups were used and TGA and DTAcurves are given in Figs. 5 and 6. The evaluation ofTGA curves of all species showed that thermaldecomposition of –NO2, –N2Cl and –COOH modi-fied microbeads showed two steps, while the othersnamely unmodified, –NH2 and –CN modifiedmicrobeads showed single step thermal degradation.For the –NO2 modified microbeads, first thermaldegradation step temperature started at 318 �Cand completed at 387 �C with about 40% mass lossand second step degradation took place between 380and 650 �C with 20% mass loss (Fig. 5B). The initialdegradation temperature of –NO2 modified PS-DVB microbeads shifted to lower values by about64 �C. However, unmodified microbeads completelydecomposed at 800 �C (1% residue was left), butwhen –NO2 modified microbeads were heated up
roups, (C) PS-DVB after reducing –NO2 groups to –NH2 groups,
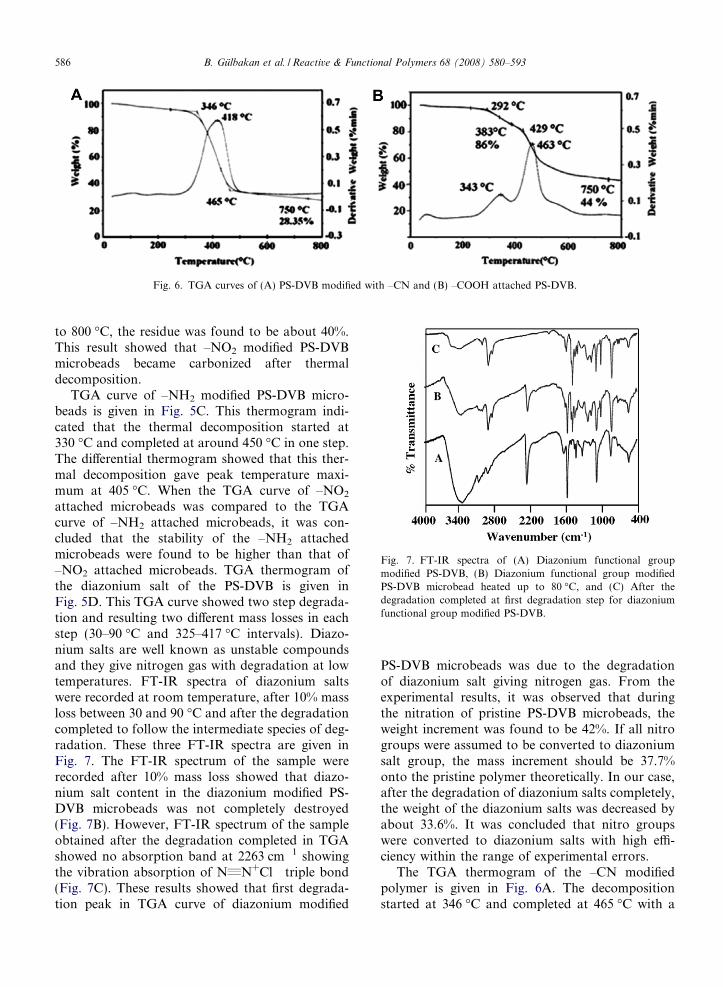
Fig. 6. TGA curves of (A) PS-DVB modified with –CN and (B) –COOH attached PS-DVB.
Fig. 7. FT-IR spectra of (A) Diazonium functional groupmodified PS-DVB, (B) Diazonium functional group modifiedPS-DVB microbead heated up to 80 �C, and (C) After thedegradation completed at first degradation step for diazoniumfunctional group modified PS-DVB.
586 B. Gulbakan et al. / Reactive & Functional Polymers 68 (2008) 580–593
to 800 �C, the residue was found to be about 40%.This result showed that –NO2 modified PS-DVBmicrobeads became carbonized after thermaldecomposition.
TGA curve of –NH2 modified PS-DVB micro-beads is given in Fig. 5C. This thermogram indi-cated that the thermal decomposition started at330 �C and completed at around 450 �C in one step.The differential thermogram showed that this ther-mal decomposition gave peak temperature maxi-mum at 405 �C. When the TGA curve of –NO2
attached microbeads was compared to the TGAcurve of –NH2 attached microbeads, it was con-cluded that the stability of the –NH2 attachedmicrobeads were found to be higher than that of–NO2 attached microbeads. TGA thermogram ofthe diazonium salt of the PS-DVB is given inFig. 5D. This TGA curve showed two step degrada-tion and resulting two different mass losses in eachstep (30–90 �C and 325–417 �C intervals). Diazo-nium salts are well known as unstable compoundsand they give nitrogen gas with degradation at lowtemperatures. FT-IR spectra of diazonium saltswere recorded at room temperature, after 10% massloss between 30 and 90 �C and after the degradationcompleted to follow the intermediate species of deg-radation. These three FT-IR spectra are given inFig. 7. The FT-IR spectrum of the sample wererecorded after 10% mass loss showed that diazo-nium salt content in the diazonium modified PS-DVB microbeads was not completely destroyed(Fig. 7B). However, FT-IR spectrum of the sampleobtained after the degradation completed in TGAshowed no absorption band at 2263 cm�1 showingthe vibration absorption of N„N+Cl� triple bond(Fig. 7C). These results showed that first degrada-tion peak in TGA curve of diazonium modified
PS-DVB microbeads was due to the degradationof diazonium salt giving nitrogen gas. From theexperimental results, it was observed that duringthe nitration of pristine PS-DVB microbeads, theweight increment was found to be 42%. If all nitrogroups were assumed to be converted to diazoniumsalt group, the mass increment should be 37.7%onto the pristine polymer theoretically. In our case,after the degradation of diazonium salts completely,the weight of the diazonium salts was decreased byabout 33.6%. It was concluded that nitro groupswere converted to diazonium salts with high effi-ciency within the range of experimental errors.
The TGA thermogram of the –CN modifiedpolymer is given in Fig. 6A. The decompositionstarted at 346 �C and completed at 465 �C with a
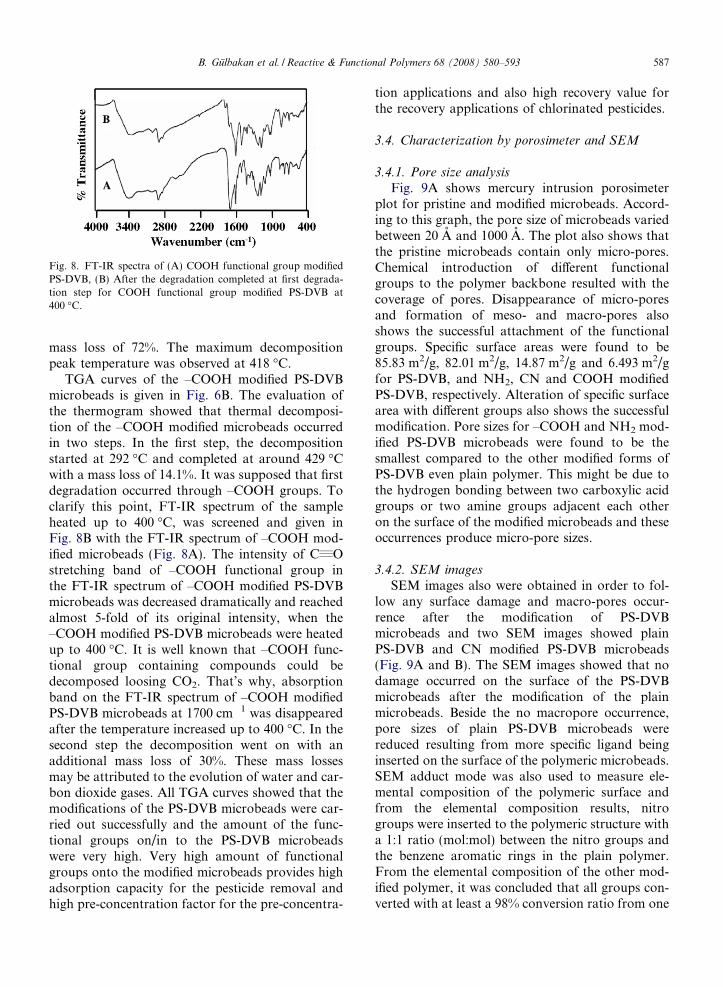
Fig. 8. FT-IR spectra of (A) COOH functional group modifiedPS-DVB, (B) After the degradation completed at first degrada-tion step for COOH functional group modified PS-DVB at400 �C.
B. Gulbakan et al. / Reactive & Functional Polymers 68 (2008) 580–593 587
mass loss of 72%. The maximum decompositionpeak temperature was observed at 418 �C.
TGA curves of the –COOH modified PS-DVBmicrobeads is given in Fig. 6B. The evaluation ofthe thermogram showed that thermal decomposi-tion of the –COOH modified microbeads occurredin two steps. In the first step, the decompositionstarted at 292 �C and completed at around 429 �Cwith a mass loss of 14.1%. It was supposed that firstdegradation occurred through –COOH groups. Toclarify this point, FT-IR spectrum of the sampleheated up to 400 �C, was screened and given inFig. 8B with the FT-IR spectrum of –COOH mod-ified microbeads (Fig. 8A). The intensity of C„Ostretching band of –COOH functional group inthe FT-IR spectrum of –COOH modified PS-DVBmicrobeads was decreased dramatically and reachedalmost 5-fold of its original intensity, when the–COOH modified PS-DVB microbeads were heatedup to 400 �C. It is well known that –COOH func-tional group containing compounds could bedecomposed loosing CO2. That’s why, absorptionband on the FT-IR spectrum of –COOH modifiedPS-DVB microbeads at 1700 cm�1 was disappearedafter the temperature increased up to 400 �C. In thesecond step the decomposition went on with anadditional mass loss of 30%. These mass lossesmay be attributed to the evolution of water and car-bon dioxide gases. All TGA curves showed that themodifications of the PS-DVB microbeads were car-ried out successfully and the amount of the func-tional groups on/in to the PS-DVB microbeadswere very high. Very high amount of functionalgroups onto the modified microbeads provides highadsorption capacity for the pesticide removal andhigh pre-concentration factor for the pre-concentra-
tion applications and also high recovery value forthe recovery applications of chlorinated pesticides.
3.4. Characterization by porosimeter and SEM
3.4.1. Pore size analysis
Fig. 9A shows mercury intrusion porosimeterplot for pristine and modified microbeads. Accord-ing to this graph, the pore size of microbeads variedbetween 20 A and 1000 A. The plot also shows thatthe pristine microbeads contain only micro-pores.Chemical introduction of different functionalgroups to the polymer backbone resulted with thecoverage of pores. Disappearance of micro-poresand formation of meso- and macro-pores alsoshows the successful attachment of the functionalgroups. Specific surface areas were found to be85.83 m2/g, 82.01 m2/g, 14.87 m2/g and 6.493 m2/gfor PS-DVB, and NH2, CN and COOH modifiedPS-DVB, respectively. Alteration of specific surfacearea with different groups also shows the successfulmodification. Pore sizes for –COOH and NH2 mod-ified PS-DVB microbeads were found to be thesmallest compared to the other modified forms ofPS-DVB even plain polymer. This might be due tothe hydrogen bonding between two carboxylic acidgroups or two amine groups adjacent each otheron the surface of the modified microbeads and theseoccurrences produce micro-pore sizes.
3.4.2. SEM images
SEM images also were obtained in order to fol-low any surface damage and macro-pores occur-rence after the modification of PS-DVBmicrobeads and two SEM images showed plainPS-DVB and CN modified PS-DVB microbeads(Fig. 9A and B). The SEM images showed that nodamage occurred on the surface of the PS-DVBmicrobeads after the modification of the plainmicrobeads. Beside the no macropore occurrence,pore sizes of plain PS-DVB microbeads werereduced resulting from more specific ligand beinginserted on the surface of the polymeric microbeads.SEM adduct mode was also used to measure ele-mental composition of the polymeric surface andfrom the elemental composition results, nitrogroups were inserted to the polymeric structure witha 1:1 ratio (mol:mol) between the nitro groups andthe benzene aromatic rings in the plain polymer.From the elemental composition of the other mod-ified polymer, it was concluded that all groups con-verted with at least a 98% conversion ratio from one
PS-DVB
NH2 MODIFIED PS-DVB
CN MODIFIED PS-DVB
COOH MODIFIED PS-DVB
0.005
0.004
0.003
0.002
0.001
Por
e V
olum
e (c
c/g)
A
00 5000 1000 1500 2000 2500
Pore Size (Å)
B CB C
Fig. 9. (A) Pore size changes of plain and modified PSDVB microbeads and the SEM images of (B) PSDVB microbeads and (C) –CNmodified PSDVB microbeads.
588 B. Gulbakan et al. / Reactive & Functional Polymers 68 (2008) 580–593
to other in the order of NO2 ? NH2 ? CN? COOH.
3.4.3. Solid phase extraction of pesticidesDerivatization of the polymeric resins increases
their capacity for retaining polar compounds.According to previous studies, polar pesticides havecaused some problems when solid phase extractionwas carried out with silica based sorbents such asC18 bonded silica and unmodified polymeric resins.In this study, solid phase extractions of pesticideswere examined by using the home-made syringes
and extractions of pesticides were found to be moreefficient with modified PS-DVB microbeads. Thestudied pesticides were a-BHC, b-BHC, c-BHC,d-BHC, heptachlor, aldrine, heptachlorepoxide,endosulphane, dieldrine, p,p-DDE, endrine, b-endo-sulphane, p,p-DDD, endosulphane sulphate, p,p-DDT, metoxychlor. To follow the adsorptionability of our –CN functional group modified PS-DVB microbeads and also desorption efficiencywith ethyl acetate, 10 mL aqueous solutions of chlo-rinated pesticides containing 5 lg L�1 of each werepassed through the home-made syringe. After dry-
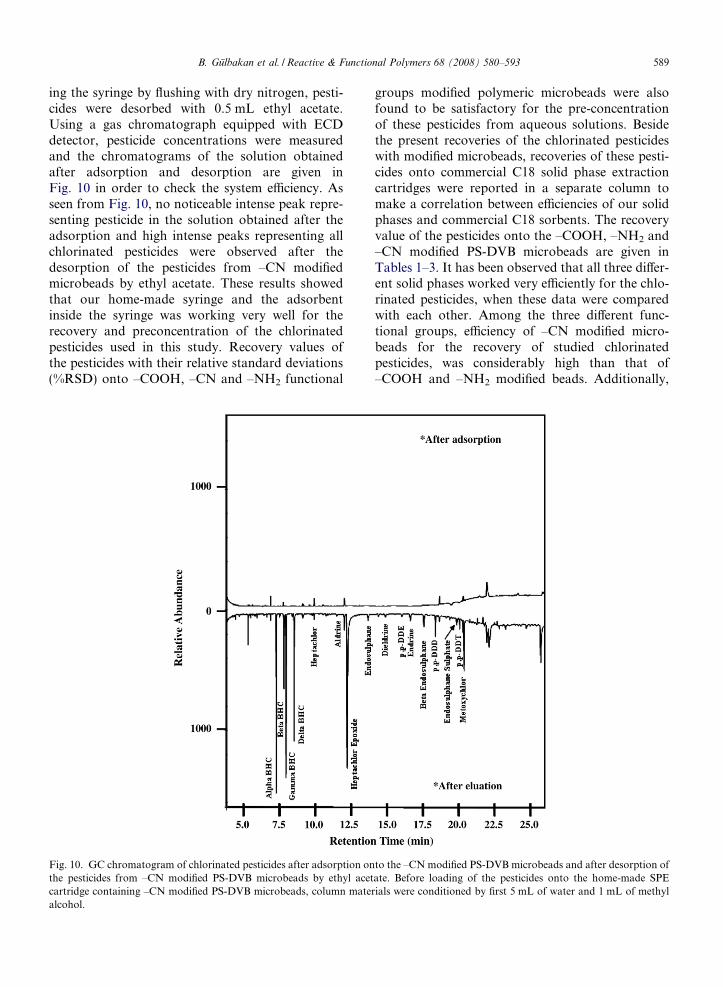
B. Gulbakan et al. / Reactive & Functional Polymers 68 (2008) 580–593 589
ing the syringe by flushing with dry nitrogen, pesti-cides were desorbed with 0.5 mL ethyl acetate.Using a gas chromatograph equipped with ECDdetector, pesticide concentrations were measuredand the chromatograms of the solution obtainedafter adsorption and desorption are given inFig. 10 in order to check the system efficiency. Asseen from Fig. 10, no noticeable intense peak repre-senting pesticide in the solution obtained after theadsorption and high intense peaks representing allchlorinated pesticides were observed after thedesorption of the pesticides from –CN modifiedmicrobeads by ethyl acetate. These results showedthat our home-made syringe and the adsorbentinside the syringe was working very well for therecovery and preconcentration of the chlorinatedpesticides used in this study. Recovery values ofthe pesticides with their relative standard deviations(%RSD) onto –COOH, –CN and –NH2 functional
Fig. 10. GC chromatogram of chlorinated pesticides after adsorption onthe pesticides from –CN modified PS-DVB microbeads by ethyl acetcartridge containing –CN modified PS-DVB microbeads, column matealcohol.
groups modified polymeric microbeads were alsofound to be satisfactory for the pre-concentrationof these pesticides from aqueous solutions. Besidethe present recoveries of the chlorinated pesticideswith modified microbeads, recoveries of these pesti-cides onto commercial C18 solid phase extractioncartridges were reported in a separate column tomake a correlation between efficiencies of our solidphases and commercial C18 sorbents. The recoveryvalue of the pesticides onto the –COOH, –NH2 and–CN modified PS-DVB microbeads are given inTables 1–3. It has been observed that all three differ-ent solid phases worked very efficiently for the chlo-rinated pesticides, when these data were comparedwith each other. Among the three different func-tional groups, efficiency of –CN modified micro-beads for the recovery of studied chlorinatedpesticides, was considerably high than that of–COOH and –NH2 modified beads. Additionally,
to the –CN modified PS-DVB microbeads and after desorption ofate. Before loading of the pesticides onto the home-made SPErials were conditioned by first 5 mL of water and 1 mL of methyl
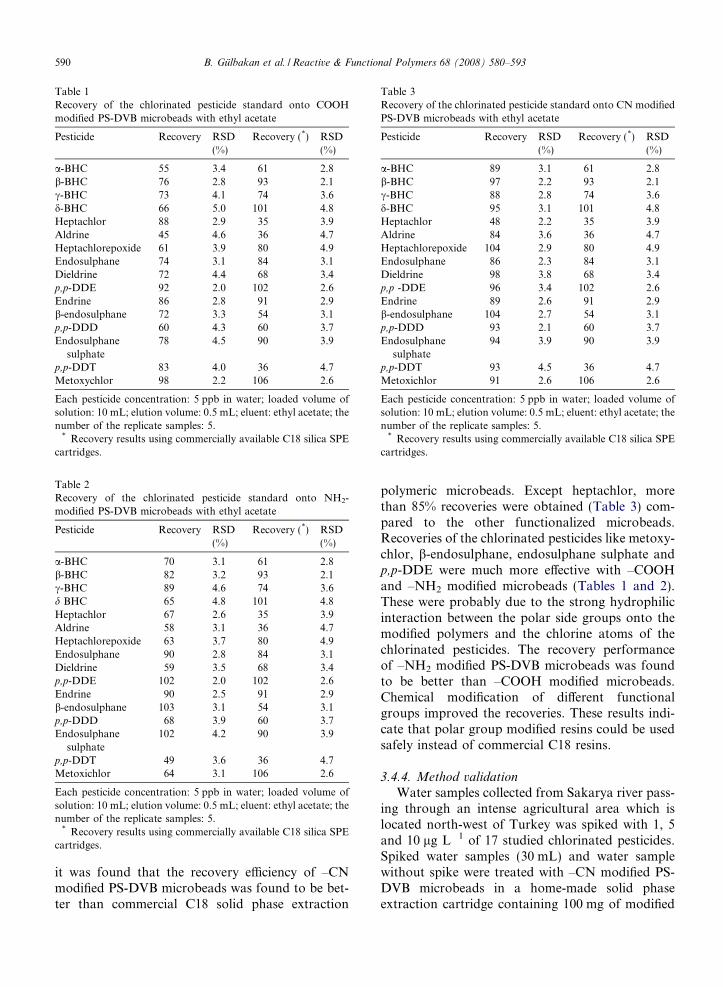
Table 1Recovery of the chlorinated pesticide standard onto COOHmodified PS-DVB microbeads with ethyl acetate
Pesticide Recovery RSD(%)
Recovery (*) RSD(%)
a-BHC 55 3.4 61 2.8b-BHC 76 2.8 93 2.1c-BHC 73 4.1 74 3.6d-BHC 66 5.0 101 4.8Heptachlor 88 2.9 35 3.9Aldrine 45 4.6 36 4.7Heptachlorepoxide 61 3.9 80 4.9Endosulphane 74 3.1 84 3.1Dieldrine 72 4.4 68 3.4p,p-DDE 92 2.0 102 2.6Endrine 86 2.8 91 2.9b-endosulphane 72 3.3 54 3.1p,p-DDD 60 4.3 60 3.7Endosulphane
sulphate78 4.5 90 3.9
p,p-DDT 83 4.0 36 4.7Metoxychlor 98 2.2 106 2.6
Each pesticide concentration: 5 ppb in water; loaded volume ofsolution: 10 mL; elution volume: 0.5 mL; eluent: ethyl acetate; thenumber of the replicate samples: 5.
* Recovery results using commercially available C18 silica SPEcartridges.
Table 2Recovery of the chlorinated pesticide standard onto NH2-modified PS-DVB microbeads with ethyl acetate
Pesticide Recovery RSD(%)
Recovery (*) RSD(%)
a-BHC 70 3.1 61 2.8b-BHC 82 3.2 93 2.1c-BHC 89 4.6 74 3.6d BHC 65 4.8 101 4.8Heptachlor 67 2.6 35 3.9Aldrine 58 3.1 36 4.7Heptachlorepoxide 63 3.7 80 4.9Endosulphane 90 2.8 84 3.1Dieldrine 59 3.5 68 3.4p,p-DDE 102 2.0 102 2.6Endrine 90 2.5 91 2.9b-endosulphane 103 3.1 54 3.1p,p-DDD 68 3.9 60 3.7Endosulphane
sulphate102 4.2 90 3.9
p,p-DDT 49 3.6 36 4.7Metoxichlor 64 3.1 106 2.6
Each pesticide concentration: 5 ppb in water; loaded volume ofsolution: 10 mL; elution volume: 0.5 mL; eluent: ethyl acetate; thenumber of the replicate samples: 5.
* Recovery results using commercially available C18 silica SPEcartridges.
Table 3Recovery of the chlorinated pesticide standard onto CN modifiedPS-DVB microbeads with ethyl acetate
Pesticide Recovery RSD(%)
Recovery (*) RSD(%)
a-BHC 89 3.1 61 2.8b-BHC 97 2.2 93 2.1c-BHC 88 2.8 74 3.6d-BHC 95 3.1 101 4.8Heptachlor 48 2.2 35 3.9Aldrine 84 3.6 36 4.7Heptachlorepoxide 104 2.9 80 4.9Endosulphane 86 2.3 84 3.1Dieldrine 98 3.8 68 3.4p,p -DDE 96 3.4 102 2.6Endrine 89 2.6 91 2.9b-endosulphane 104 2.7 54 3.1p,p-DDD 93 2.1 60 3.7Endosulphane
sulphate94 3.9 90 3.9
p,p-DDT 93 4.5 36 4.7Metoxichlor 91 2.6 106 2.6
Each pesticide concentration: 5 ppb in water; loaded volume ofsolution: 10 mL; elution volume: 0.5 mL; eluent: ethyl acetate; thenumber of the replicate samples: 5.
* Recovery results using commercially available C18 silica SPEcartridges.
590 B. Gulbakan et al. / Reactive & Functional Polymers 68 (2008) 580–593
it was found that the recovery efficiency of –CNmodified PS-DVB microbeads was found to be bet-ter than commercial C18 solid phase extraction
polymeric microbeads. Except heptachlor, morethan 85% recoveries were obtained (Table 3) com-pared to the other functionalized microbeads.Recoveries of the chlorinated pesticides like metoxy-chlor, b-endosulphane, endosulphane sulphate andp,p-DDE were much more effective with –COOHand –NH2 modified microbeads (Tables 1 and 2).These were probably due to the strong hydrophilicinteraction between the polar side groups onto themodified polymers and the chlorine atoms of thechlorinated pesticides. The recovery performanceof –NH2 modified PS-DVB microbeads was foundto be better than –COOH modified microbeads.Chemical modification of different functionalgroups improved the recoveries. These results indi-cate that polar group modified resins could be usedsafely instead of commercial C18 resins.
3.4.4. Method validationWater samples collected from Sakarya river pass-
ing through an intense agricultural area which islocated north-west of Turkey was spiked with 1, 5and 10 lg L�1 of 17 studied chlorinated pesticides.Spiked water samples (30 mL) and water samplewithout spike were treated with –CN modified PS-DVB microbeads in a home-made solid phaseextraction cartridge containing 100 mg of modified

Table 4Recovery of the chlorinated pesticide from Sakarya river water with 1, 5, 10 ppb spiked and without spike onto CN modified PS-DVBmicrobeads and C18 SPE cartridge
Compound Added(lg L�1)
Found using CNmodified beads (lg L�1)
Recovery(%)
RSD(%)
Found using C18 SPEcartridge (lg L�1)
LOD(lg L�1)
LOQ(lg L�1)
a-BHC 0 0.27 – 0.23 0.03 0.051 1.18 92.9 3.6 –5 5.14 97.5 –
10 10.28 100.1 –b-BHC 0 0.23 – 2.4 0.18 0.05 0.08
1 1.26 102.4 –5 5.17 98.9 –
10 10.15 99.2 –c-BHC 0 0.28 – 3.2 0.22 0.02 0.03
1 1.23 96.1 –5 5.29 100.2 –
10 10.27 99.9 –d-BHC 0 0.16 – 0.13 0.03 0.05
1 1.12 96.6 2.9 –5 5.18 100.4 –
10 10.15 99.9 –Heptachlor 0 0.37 – 3.7 0.35 0.01 0.02
1 1.36 93.5 –5 5.28 98.3 –
10 10.32 99.5 –Aldrine 0 0.28 – 4.2 0.23 0.03 0.06
1 1.37 107.0 –5 5.34 101.2 –
10 10.36 100.8 –Heptachlor epoxide 0 2.48 – 1.73 0.03 0.07
1 3.52 101.2 4.1 –5 7.19 96.1 –
10 12.32 98.8 –Endosulphane 0 0.34 – 0.17 0.02 0.04
1 1.28 95.5 2.9 –5 5.29 99.1 –
10 10.32 99.8 –Dieldrine 0 5.37 – 2.7 4.25 0.01 0.03
1 6.08 95.5 –5 10.08 97.2 –
10 15.01 97.7 –Endrine 0 0.28 – 3.5 0.17 0.05 0.08
1 1.19 93.0 –5 5.19 98.3 –
10 10.25 99.7 –b-Endosulphane 0 0.42 – 3.1 0.35 0.04 0.07
1 1.36 95.8 –5 5.35 98.9 –
10 10.38 99.6 –p,p-DDD 0 0.07 – 0.08 0.03 0.05
1 1.05 98.1 2.0 –5 5.04 99.4 –
10 10.05 99.8 –Endosulfan sulphate 0 0.34 – 3.6 0.30 0.01 0.03
1 1.38 103.0 –5 5.35 100.2 –
10 10.36 100.2 –p,p-DDT 0 0.53 – 0.43 0.05 0.07
1 1.57 102.6 4.7 –(continued on next page)
B. Gulbakan et al. / Reactive & Functional Polymers 68 (2008) 580–593 591
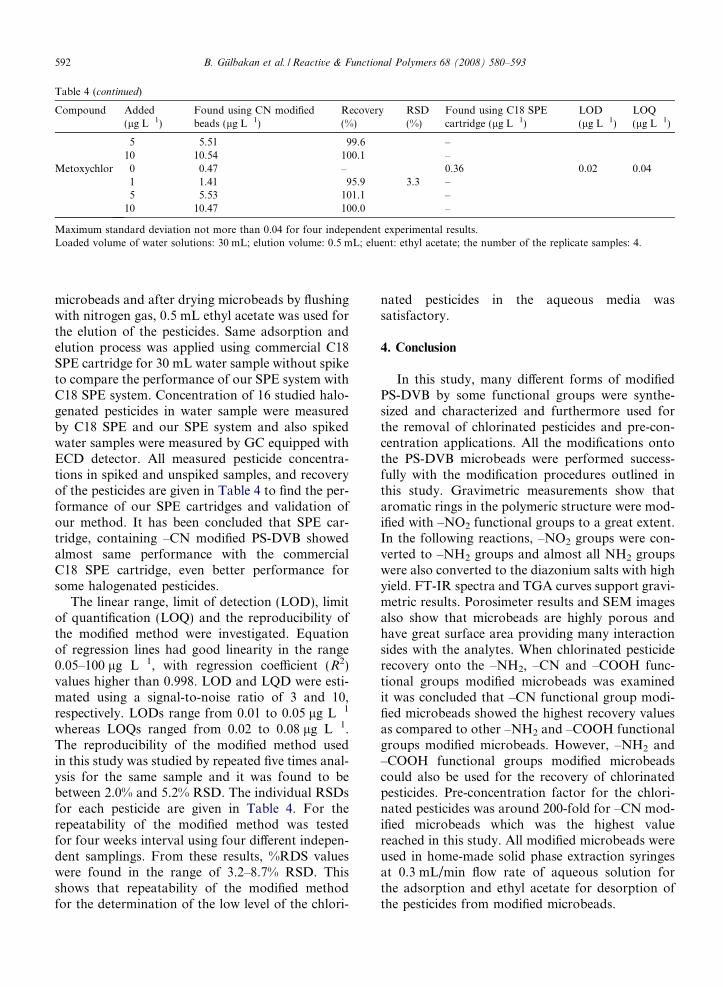
Table 4 (continued)
Compound Added(lg L�1)
Found using CN modifiedbeads (lg L�1)
Recovery(%)
RSD(%)
Found using C18 SPEcartridge (lg L�1)
LOD(lg L�1)
LOQ(lg L�1)
5 5.51 99.6 –10 10.54 100.1 –
Metoxychlor 0 0.47 – 0.36 0.02 0.041 1.41 95.9 3.3 –5 5.53 101.1 –
10 10.47 100.0 –
Maximum standard deviation not more than 0.04 for four independent experimental results.Loaded volume of water solutions: 30 mL; elution volume: 0.5 mL; eluent: ethyl acetate; the number of the replicate samples: 4.
592 B. Gulbakan et al. / Reactive & Functional Polymers 68 (2008) 580–593
microbeads and after drying microbeads by flushingwith nitrogen gas, 0.5 mL ethyl acetate was used forthe elution of the pesticides. Same adsorption andelution process was applied using commercial C18SPE cartridge for 30 mL water sample without spiketo compare the performance of our SPE system withC18 SPE system. Concentration of 16 studied halo-genated pesticides in water sample were measuredby C18 SPE and our SPE system and also spikedwater samples were measured by GC equipped withECD detector. All measured pesticide concentra-tions in spiked and unspiked samples, and recoveryof the pesticides are given in Table 4 to find the per-formance of our SPE cartridges and validation ofour method. It has been concluded that SPE car-tridge, containing –CN modified PS-DVB showedalmost same performance with the commercialC18 SPE cartridge, even better performance forsome halogenated pesticides.
The linear range, limit of detection (LOD), limitof quantification (LOQ) and the reproducibility ofthe modified method were investigated. Equationof regression lines had good linearity in the range0.05–100 lg L�1, with regression coefficient (R2)values higher than 0.998. LOD and LQD were esti-mated using a signal-to-noise ratio of 3 and 10,respectively. LODs range from 0.01 to 0.05 lg L�1
whereas LOQs ranged from 0.02 to 0.08 lg L�1.The reproducibility of the modified method usedin this study was studied by repeated five times anal-ysis for the same sample and it was found to bebetween 2.0% and 5.2% RSD. The individual RSDsfor each pesticide are given in Table 4. For therepeatability of the modified method was testedfor four weeks interval using four different indepen-dent samplings. From these results, %RDS valueswere found in the range of 3.2–8.7% RSD. Thisshows that repeatability of the modified methodfor the determination of the low level of the chlori-
nated pesticides in the aqueous media wassatisfactory.
4. Conclusion
In this study, many different forms of modifiedPS-DVB by some functional groups were synthe-sized and characterized and furthermore used forthe removal of chlorinated pesticides and pre-con-centration applications. All the modifications ontothe PS-DVB microbeads were performed success-fully with the modification procedures outlined inthis study. Gravimetric measurements show thataromatic rings in the polymeric structure were mod-ified with –NO2 functional groups to a great extent.In the following reactions, –NO2 groups were con-verted to –NH2 groups and almost all NH2 groupswere also converted to the diazonium salts with highyield. FT-IR spectra and TGA curves support gravi-metric results. Porosimeter results and SEM imagesalso show that microbeads are highly porous andhave great surface area providing many interactionsides with the analytes. When chlorinated pesticiderecovery onto the –NH2, –CN and –COOH func-tional groups modified microbeads was examinedit was concluded that –CN functional group modi-fied microbeads showed the highest recovery valuesas compared to other –NH2 and –COOH functionalgroups modified microbeads. However, –NH2 and–COOH functional groups modified microbeadscould also be used for the recovery of chlorinatedpesticides. Pre-concentration factor for the chlori-nated pesticides was around 200-fold for –CN mod-ified microbeads which was the highest valuereached in this study. All modified microbeads wereused in home-made solid phase extraction syringesat 0.3 mL/min flow rate of aqueous solution forthe adsorption and ethyl acetate for desorption ofthe pesticides from modified microbeads.
B. Gulbakan et al. / Reactive & Functional Polymers 68 (2008) 580–593 593
References
[1] B.D. Rodan, D.W. Pennington, N. Eckley, A. Boethling,Environ. Sci. Technol. 33 (1999) 3482.
[2] H.W. Vallack, D.J. Bakker, I. Brandt, E. Brostrom-Lunden,A. Brouwer, K.R. Bull, Environ. Toxicol. Pharmacol. 6(1998) 143.
[3] R.R. Rao, Ind. J. Pharmac. 6 (1974) 165.[4] S. Tanabe, H. Iwata, R. Tasukawa, Sci. Total Environ. 154
(1994) 163.[5] R. Boussahel, S. Bouland, K.M. Moussaoui, M. Baudu, A.
Montiel, Water Res. 36 (2002) 1909.[6] R.B. Geerdink, W.M.A. Niessen, U.A.Th. Brinkman, J.
Chromatogr. A 970 (2002) 66.[7] J.L. Luque-Garcia, M.D. Luque de Castro, Trends Anal.
Chem. 22 (2003) 41.[8] S. Babic, M. Petrivic, M. Kastelan-Macan, J. Chromatogr.
A 823 (1998) 3.[9] X.R. Zhu, H.K. Lee, J Chromatogr. A 976 (2002) 393.
[10] R. Kreuzig, A. Koinecke, M. Bahadir, J. Biochem. Biophys.Methods 43 (2000) 403.
[11] USEPA, Test Method 608, US Environ. Protect. Agen.,Cincinnati, OH, 1984.
[12] G.H. Tan, Analyst 117 (1992) 1129.[13] E.M. Thurman, M.S. Mills, J.D Winefordner (Eds.), Wiley,
New York, 1998, pp. 1–22.[14] I. Liska, J. Krupcik, P.A. Leclerq, J. High Resolut. Chro-
matogr. 12 (1989) 577.[15] L.A. Berrueta, B. Gallo, F. Vicente, Chromatographia 40
(1995) 474.[16] A. Di Corcia, S. Marchese, R. Samperi, J. Chromatogr. 642
(1993) 163.[17] A. Di Corcia, M. Marchetti, Anal. Chem. 63 (1991) 580.
[18] C. Crescenzi, A. Di Corcia, E. Guerriero, R. Samperi,Environ. Sci. Technol. 31 (1997) 479.
[19] D. Bacaloni, G. Goretti, A. Lagana, B.M. Petronio, M.Rotatori, Anal. Chem. 52 (1980) 2033.
[20] G. Achilli, G.P. Cellerino, G. Melzi d’Eril, S. Bird, J.Chromatogr. A 697 (1995) 357.
[21] P. Parrilla, J.L. Martinez Vidal, M. Martinez Galera, A.G.Frenich, Fresenius, J. Anal. Chem. 350 (1994) 633.
[22] F. Ballesteros, M. Gallego, M. Valcarcel, Environ. Sci.Technol. 30 (1997) 2071.
[23] B. Gawdzik, J. Gawdzik, U. Czerwinska-Bil, J. Chromatogr.509 (1990) 135.
[24] V. Pichon, M.C. Hennion, J. Chromatogr. A 665 (1994)269.
[25] S. Guenu, M.C. Hennion, J. Chromatogr. A 737 (1996) 15.[26] D. Puig, D. Barcelo, J. Chromatogr. A 733 (1996) 371.[27] E. Pocurrull, M. Calull, R.M. Marce, F. Borrull, Chroma-
tographia 38 (1994) 579.[28] M.E. Leon-Gonzalez, L.V. Perez-Arribas, J. Chrom. A 902
(2000) 4.[29] J.J. Sun, J.S. Fritz, J. Chromatogr. A 590 (1992) 197.[30] J.J. Sun, J.S. Fritz, J. Chromatogr. 522 (1990) 95.[31] J.S. Fritz, P.J. Dumont, L.W. Schmidt, J. Chromatogr. A
691 (1995) 133.[32] N. Masque, M. Galia, R.M. Marce, F. Borrull, J. Chroma-
togr. A 771 (1997) 55.[33] N. Masque, M. Galia, R.M. Marce, F. Borrull, Analyst 122
(1997) 425.[34] D.L. Ambrose, J.S. Fritz, M.R. Buchmeiser, N. Atzl, G.K.
Bonn, J. Am. Chem. Soc. 119 (1997) 9166.[35] L. Schmidt, J.J. Sun, J.S. Fritz, J. Chromatogr. 641 (1993)
57.[36] T. Sandmeyer, Chem. Ber. 17 (1884) 1633.