Solid forms of pharmaceuticals: Polymorphs, salts and cocrystals
9
7/21/2019 Solid forms of pharmaceuticals: Polymorphs, salts and cocrystals http://slidepdf.com/reader/full/solid-forms-of-pharmaceuticals-polymorphs-salts-and-cocrystals 1/9 'r~] 3, 4 : : ' ' g ELSEVIER Journal of Pharmaceutical and Biomedical Analysis 13 (1995) 1321 1329 JOURNAL OF PHARMACEUTICAL AND BIOMEDICAL ANALYSIS Analysis of pharmaceutical creams: a useful approach based on solid-phase extraction (SPE) and UV spectrophotometry D. Bonazzi, V. Andrisano, R, Gatti, V. Cavrini * Dipartimento di Scienze Farmaceutiche. Unicersitgl di Bologna, via Belme/oro 6, 40126 Bologna, ltulv Received for review 11 November 1994: revised manuscript receixed 20 February 1905 Abstract Solid-phase extraction (SPE) using C-18, diol and ion-exchange sorbents followed by UV spectrophoto- metric (conventional and derivative mode) assay was applied to the analysis of basic, acidic and neutral drugs commercially available in creams. A representative set of drugs (promethazine, chlorhexidine, benzydamine, ketoprofen, ibuprofen, fenti- azac, piroxicam, fluorouracil, crotamiton and hydrocortisone acetate) was selected, and for each drug the appropriate SPE conditions (adsorption, washing and elution) were investigated to obtain a practical and reliable sample clean-up. It was shown that the developed SPE procedures were capable of removing interfering cream components (excipients including preservatives) allowing accurate spectrophotometric analyses to be performed. In some applications, derivative spectrophotometry was advantageous over the conventional absorption mode with respect to higher selectivity and versatility. Keywor~b: Pharmaceutical creams; Sample clean-up; Solid-phase extraction: Drug analysis: Derivative spectrophotometry 1. Introduction A number of drugs that possess a variety of pharmacological activities (e.g. anti-inflamma- tory, antimycotic) are currently used as creams for topical treatment [1,2]. The analysis of these complex formulations can sometimes be performed by simple, non-specific titrimetric methods in non-aqueous solvents [1-3] or in heterogeneous systems [2,4,5], but specific de- terminations (spectrophotometric and chro- matographic methods) are usually required. Spectrophotometric analyses are generally based on chromogenic reactions in order to perform absorbance measurements in the visi- ble region, so avoiding interference from the excipients. Direct UV assays are not always * Corresponding author. 0731-7085/95/$09.50 © 1995 Elsevier Science B.V. All rights SSDI I)731-7085(95)01536-1 suitable without prior sample clean-up [1,2,5]. Gas chromatography [1,2,5,6], high-perfor- mance liquid chromatography (HPLC) [1,2,4,5,7] and thin-layer chromatography (HPTLC) [8-10] are widely applied to the analysis of pharmaceutical creams; the meth- ods usually involve time-consuming and labori- ous sample clean-up steps, such as liquid liquid extraction and excipient precipi- tation by cooling of an appropriate sample solution. When this preliminary clean-up is omitted and the sample solutions are directly subjected to HPLC analysis, intermediate ana- lytical column washings with an organic sol- vent are recommended [7,11] to remove the liphophilic components of the cream base. Recently, it has been observed that solid- phase extraction (SPE) can offer the opportu- nity of simple and practical procedures for reserved
-
Upload
sameh-ibrahim-qanadilo -
Category
Documents
-
view
227 -
download
0
description
Control and selection of the properties of active pharmaceutical ingredients is a crucial part of the drugdevelopment process. One major part of this process is the selection of an appropriate solid form. This review will discussthree major types of crystalline solids, polymorphs, salts and cocrystals and processes used to develop and find theseforms.
Transcript of Solid forms of pharmaceuticals: Polymorphs, salts and cocrystals

7/21/2019 Solid forms of pharmaceuticals: Polymorphs, salts and cocrystals
http://slidepdf.com/reader/full/solid-forms-of-pharmaceuticals-polymorphs-salts-and-cocrystals 1/9
' r~] 3, 4 : : ' '
g
E L S E V I E R
Journal of Pharm aceutical and Biomedical Analysis
13 (1995) 1321 1329
J O U R N A L O F
PHARMACEUTICAL
AN D BIOMEDICAL
A N A LY S I S
A n a l y s i s o f p h a r m a c e u t i c a l c r e a m s : a u s e f u l a p p r o a c h
b a s e d o n s o l i d - p h a s e e x t r a c t i o n ( S P E ) a n d U V
s p e c t r o p h o t o m e t r y
D . B o n a z z i , V . A n d r i s a n o , R , G a t t i , V . C a v r i n i *
Dip art im ento di Scie nze Farmaceut iche. Unicers itgl di Bologna, via Belm e/oro 6, 401 26 Bologna, l tu lv
Received for review 11 Nove mb er 1994: revised man uscript receixed 20 Februa ry 1905
Abstract
Solid-phase extract ion (SPE) using C-18, diol and ion-exchange sorbents fol lowed by UV spectrophoto-
metric (conv ent ional and de rivat ive mo de) assay was appl ied to the analysis of basic, acidic and neutral
drugs c omm ercial ly avai lable in creams.
A rep resentat ive set of drugs (p rom ethazine, chlorhexidine, benzyd amine , ketop rofen, ibuprofe n, fenti -
azac, pi roxicam, f luorouraci l , crotamiton and hydrocort isone acetate) was selected, and for each drug the
appropriate SPE condi t ions (adsorpt ion, washing and elut ion) were invest igated to obtain a pract ical and
reliable sample clean-up. I t was shown that the deve loped SPE proc edures were capab le of removing
interfering cream c om pon ents (excipients including preservatives) al lowing accu rate spectro photo me tric
analyses to be perform ed. In some appl icat ions, derivat ive spec troph otom etry was advantag eous ove r the
convent ional absorpt ion mode with respect to higher select ivi ty and versat i l i ty .
K e y w o r ~ b : Pharmaceut ical creams; Sample clean-up; Sol id-phase extract ion: Drug analysis : Derivat ive
s p ec t ro p h o t o me t ry
1 . I n t r o d u c t i o n
A n u m b e r o f d r u g s t h a t p o s se s s a v a r ie t y o f
p h a r m a c o l o g i c a l a c t i v i t i e s ( e . g . a n t i - i n f l a m m a -
t o r y , a n t i m y c o t i c ) a r e c u r r e n t l y u s e d a s c r e a m s
f o r t o p i c a l t r e a t m e n t [ 1 , 2 ] . T h e a n a l y s i s o f
t h e s e c o m p l e x f o r m u l a t i o n s c a n s o m e t i m e s b e
p e r f o r m e d b y s i m p l e , n o n - s p e c if i c t i t r im e t r i c
m e t h o d s i n n o n - a q u e o u s s o l v e n t s [ 1 - 3 ] o r i n
h e t e ro g en eo u s s y s t ems [2 ,4 ,5 ], b u t s p ec i f i c d e -
t e r m i n a t i o n s ( s p e c t r o p h o t o m e t r i c a n d c h r o -
m a t o g r a p h i c m e t h o d s ) a r e u s u a l l y r e q u i r e d .
S p e c t r o p h o t o m e t r i c a n a l y s e s a r e g e n e r a l l y
b a s e d o n c h r o m o g e n i c r e a c t i o n s i n o r d e r t o
p e r f o r m a b s o r b a n c e m e a s u r e m e n t s i n t h e v i s i -
b l e r e g i o n , s o a v o i d i n g i n t e r f e r e n c e f r o m t h e
e x c i p i e n t s . D i r e c t U V a s s a y s a r e n o t a l w a y s
* Corresponding author.
0731-7085/95/$09.50 © 1995 Elsevier Scie nce B.V. All rights
S S D I I)731-7085(95)01536-1
s u i t ab l e w i t h o u t p r i o r s amp l e c l ean -u p [1 , 2 , 5 ] .
G a s c h r o m a t o g r a p h y [ 1 , 2 , 5 , 6 ] , h i g h - p e r f o r -
m a n c e l i q u i d c h r o m a t o g r a p h y ( H P L C )
[ 1 , 2 , 4 , 5 , 7 ] a n d t h i n - l a y e r c h r o m a t o g r a p h y
( H P T L C ) [ 8 - 1 0 ] a r e w i d e l y a p p l i e d t o t h e
a n a l y s i s o f p h a r m a c e u t i c a l c r e a m s ; t h e m e t h -
o d s u s u a l l y i n v o l v e t i m e - c o n s u m i n g a n d l a b o r i -
o u s s a m p l e c l e a n - u p s t e p s , s u c h a s
l i q u id l i q u id e x t r a c t i o n a n d e x c i p i e n t p r e c i p i -
t a t io n b y c o o l in g o f a n a p p r o p r i a t e s a m p l e
s o l u t i o n . W h e n t h i s p r e l i m i n a r y c l e a n - u p i s
o m i t t e d a n d t h e s a m p l e s o l u t i o n s a r e d i r e c t l y
s u b j e c t e d t o H P L C a n a l y s i s , i n t e r m e d i a t e a n a -
l y t i c a l c o l u m n w a s h i n g s w i t h a n o r g a n i c s o l -
v e n t a r e r e c o m m e n d e d [ 7 , 1 1 ] t o r e m o v e t h e
l ip h o p h i li c c o m p o n e n t s o f t h e c r e a m b a se .
R e c e n t l y , i t h a s b e e n o b s e r v e d t h a t s o l i d -
p h a s e e x t r a c t i o n ( S P E ) c a n o f f e r t h e o p p o r t u -
n i t y o f s im p l e a n d p r a c t i c a l p r o c e d u r e s f o r
reserved
7/21/2019 Solid forms of pharmaceuticals: Polymorphs, salts and cocrystals
http://slidepdf.com/reader/full/solid-forms-of-pharmaceuticals-polymorphs-salts-and-cocrystals 2/9
1322
D . B o n a z z i e t a l . / J . P h a r m . B i o m e d . A n a l . 1 3 1 9 9 5 ) 1 3 2 1 - 1 3 2 9
sample clean-up in the analysis of imidazole
antimycotic drugs in creams [12,13]. The role
of SPE technique in drug analysis is well
known [14-18], but systematic investigations
on its application to the analysis of creams
have not been reported; some specific applica-
tions have been developed only in the HPLC
analysis of steroid topical dosage forms using
conventional SPE [19-21] and on-line column
switching procedures [22-24].
Thus, the aim of this study was to provide
convenient and reliable SPE procedures as
useful guidelines for sample clean-up in the
analysis of pharmaceutical creams. A repre-
sentative set of basic, acidic, and neutral
drugs, belonging to different structural groups
(promethazine, chlorhexidine, benzydamine,
ketoprofen, ibuprofen, fentiazac, piroxicam,
fluorouracil, crotamiton and hydrocortisone
acetate) and commercially available as creams
were selected. For each drug, the appropriate
SPE conditions (sorbent, adsorption, washing,
elution) were investigated using UV spec-
troscopy (conventional and derivative mode) to
monitor the development of the SPE method.
In this application, UV spectroscopy proved to
be a suitable technique to evaluate the perfor-
mance of the different SPE steps; moreover,
with the derivative mode, the residual non-spe-
cific matrix absorption was suppressed to allow
accurate analyses of commercial creams to be
performed.
2. Experimental
2. I. Materials
Promethazine hydrochloride, ketoprofen,
piroxicam, chlorhexidine, ibuprofen were ob-
tained from Sigma Chimica (Italy), fluorouracil
and hydrocortisone acetate were from Fluka
(Switzerland) and benzydamine hydrochloride
was from Aldrich (Italy). Crotamiton was
kindly supplied by Ciba-Geigy (Italy) and fen-
tiazac was from LPB Istituto Farmaceutico
(Italy).
All other chemicals were obtained from Far-
mitalia C. Erba (Italy). Phosphate buffer solu-
tions (pH 4.5; 7 .4; and 8.0) were prepared
according to s tandard methods. Solid-phase ex-
tractions were performed on Bond Elut car-
tridges (500mg; 2.8ml) from Analytichem
(Varian, USA), using a Baker-10 SPE vacuum
manifold connected to a water aspirator.
2.2. Apparatus
All the spectrophotometric analyses were
performed on a Jasco Uvidec-610 double-beam
spectrophotometer using 1-cm quartz cells with
a slit width of 2 nm. Suitable settings were:
scan speed 100 nmmi n-~, chart speed
20 nm cm -1, absorbance scale 0-2.0. For the
derivative mode, the A2 value and the ab-
sorbance scale were selected in accordance with
the nature and concentration of the analyte.
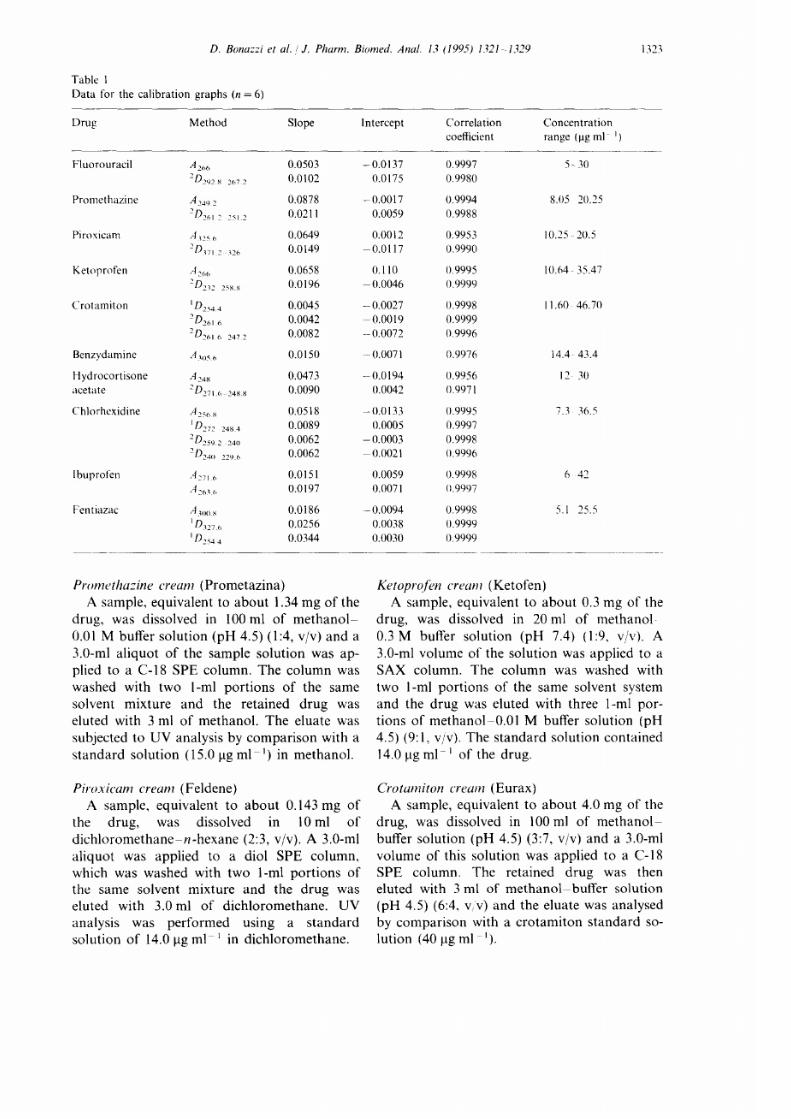
2.3. Calibration graphs
Standard solutions of appropriate concentra-
tions in suitable solvents (Table 1) were pre-
pared for each drug. The absorbance at 2max
(zero-order spectrum) as well as the selected
amplitudes ~D and 2D (first- and second-order
derivative spectrum, respectively) were plotted
against the corresponding concentration to ob-
tain the calibration graphs.
2.4. Solid phase extraction SPE)
Before use, the SPE columns were properly
conditioned as follows: C-18 sorbent by rinsing
with 6 ml of methanol; strong anion exchange
(SAX) sorbent by rinsing with 6ml of
methanol and then with 3 ml o f methanol
buffer solution (pH 8) (1:1, v/v); strong cation
exchange (SCX) propylsulphonate (PRS)
(propylsulphonic acid) and SCX (benzenesul-
phonic acid) sorbents by rinsing with 6 ml of
methanol and then with 3 ml o f buffer solution
(pH 4.5); diol sorbent by rinsing with 6ml
of dichloromethane and then with l ml of n-
hexane.
A 3.0-ml aliquot of the sample solution was
applied to the appropriate SPE column as de-
scribed below for each drug.
2.5. Sample preparation
Fluorouracil cream (Efudix)
A sample was dissolved in water-methanol
(80:20, v/v) to give a final concentration of
about 20 ~tg ml 1 of the drug. A 3.0-ml aliquot
was applied to a conditioned C-18 SPE column
and the column was then washed with 3.0 ml of
water. The filtrate and the washings were com-
bined and subjected to UV analysis by com-
parison with a s tandard solution (20 ~tg ml -l ).
7/21/2019 Solid forms of pharmaceuticals: Polymorphs, salts and cocrystals
http://slidepdf.com/reader/full/solid-forms-of-pharmaceuticals-polymorphs-salts-and-cocrystals 3/9
D. B ona zz i e t a l . / J . Phar m. B iom ed . Ana l . 13 19 9 5 ) 13 21 13 29
Table 1
Data for the calibration graphs (n = 6)
1323
Drug Method Slope Intercept Correlation Concentration
coefficient range (lag ml ~)
F l u o r o u r a c i l A 2 6 6
0.0503 -0.0137 0.9997 5- 30
2D292~ 26v 2 0.0102 0.0175 0.9980
Promethazine A2492 0.0878 - 0.0017 0.9994 8.05 20.25
2D~,~ - 2st.2 0.0211 0.0059 0.9988
Piroxicam A ~2~ 6 0.0649 0.0012 0.9953 10.25 20.5
2Dw~ 2 ~26 0.0149 0.0117 0.9990
Ketoprofen A26~, 0.0658 0.110 0.9995 10.64- 35.47
2D2~2 2ssg 0.0196 0.0046 (I.9999
Crotamiton i D2~4 4 0.0045 - (I.0027 0.9998 I 1.60 46.70
20261 6 0.0042 (I.0019 0.9999
2D261 6 2472 0.0082 -- (I.0072 0.9996
Benzydamine A~o56 0.0150 - (I.0071 0.9976 14.4 43.4
Hydrocortisone A248 0.0473 --0.0194 0.9956 12 30
a c e t a t e 2D271 6 248.8 0.0090 0.0042 0.9971
Chlorhexidine A256 s 0.0518 -0.0133 0.9995 7.3 36.5
I D272
2484 0.0089 0.0005 0.9997
2D2592
24(} 0.0062 -0.0003 (I.9998
2D240 229.6 0.0062 0.0021 (}.9996
Ibuprofen A2716 0.0151 I).0059 0.9998 6 42
A26~ ~, 0.0197 I).0071 (I.9997
Fentiazac A3oos 0.0186 -0.0094 0.9998 5.1 25.5
I D~27 6 0.0256 0.0038 {).9999
i D2544 0.0344 0.0030 0.9999
P r o m e t h a z i n e c r e a n l (Prometazina)
A sample, equiva lent to about 1.34 mg of the
drug, was dissolved in 100ml of methanol-
0.01 M buffer solution (pH 4.5) (1:4, v/v) and a
3.0-ml aliquot of the sample solution was ap-
plied to a C-18 SPE column. The column was
washed with two l-ml portions of the same
solvent mixture and the retained drug was
eluted with 3 ml of met hanol. The eluate was
subjected to UV analysis by comparison with a
sta nda rd solu tion (15.0 lag ml ~) in metha nol .
P i r o x i c a m c r e a m (Feldene)
A sample, equivalent to a bout 0.143 mg of
the drug, was dissolved in 10ml of
dic hlor ome tha ne-n -hex ane (2:3 , v/v). A 3.0-ml
aliquot was applied to a diol SPE column,
which was washed with two 1-ml porti ons of
the same solvent mixture and the drug was
eluted with 3 .0ml of d ichloromethane. UV
analysis was performed using a stan dard
solu tion of 14.0 lag ml ~ in dich lor ome than e.
K e t o p r o J e n c r e a n l (Ketofen)
A sample, equivalent to about 0.3 mg of the
drug, was dissolved in 20 ml of me than ol
0.3 M buffer s olu tio n (pH 7.4) (1:9, v/v). A
3.0-ml volume of the solution was applied to a
SAX column. The column was washed with
two 1-ml portions of the same solvent system
and the drug was eluted with three 1-ml por-
tions of methanol-0.01 M buffer solution (pH
4.5) (9:1, v/v). The standard solution contained
14,0 lag ml ~ of t he dru g.
C r o t a m i t o n c r e a m (Eurax)
A sample, equ ivalent to abo ut 4.0 mg of the
drug, was dissolved in 100ml of methanol
buffer solution (pH 4.5) (3:7, v/v) and a 3.0-ml
volume of this solution was applied to a C-18
SPE column. The retained drug was then
eluted with 3 ml of meth anol -bu ffe r solut ion
(pH 4.5) (6:4, v/v) and the eluate was analysed
by comparison with a crotamiton s tandard so-
lu ti on (40 lag ml ~).
7/21/2019 Solid forms of pharmaceuticals: Polymorphs, salts and cocrystals
http://slidepdf.com/reader/full/solid-forms-of-pharmaceuticals-polymorphs-salts-and-cocrystals 4/9
1324
D. Bonazzi et al./ J. Pharm . Biomed. Anal. 13 1995) 1321-1329
I b u p r o f e n c r e a m
(Brufen)
A sample, equivalent to about 3.0 mg of the
drug, was dissolved in 100ml of methanol-
phosphate buffer solution (pH 8.0 ) (1:1, v/v)
and a 3.0-ml aliquot was applied to a SAX
SPE column. The column was washed with
2 ml o f methanol -buffe r solution (pH 8.0) (1:1,
v/v) and then the drug was eluted with 3 ml of
methanol-phosphate buffer solution (pH 4.5)
(9:1, v/v). The eluate was analysed by compari-
son with a standard solution of ibuprofen in
the same solvent system (27 tag ml 1).
tional and derivative mode) before and after
the SPE step. The absorbances (zero-order
spectrum) and the amplitudes ~D and
2 D
(first-
and second-order derivative) at the selected
wavelengths were compared with the corre-
sponding values obtained from an appropriate
standard solution of the drug to calculate the
drug content in each sample.
3 . R e s u l t s a n d d i s c u s s i o n
C h l o r h e x i d i n e c r e a m
(Trust)
A sample equivalent to about 3.0 mg of the
drug was dissolved in 100ml of methanol-
phosphate buffer solution (pH 4.5) (1:9, v/v)
and a 3.0-ml aliquot was applied to a PRS SPE
column. The column was washed with 2 ml of
the buffer solution (pH 4.5) and then the drug
was eluted with two 1.5-ml portions of buffer
solution (pH 7.4). The combined eluates were
subjected to spectrophotometric analysis using
a standard solution (26 lag ml ~) in the same
solvent.
B e n z y d a m i n e h y d r o c h l o r i d e c r e a m
(Tantum)
The sample solution was prepared as de-
scribed for chlorhexidine but a SCX cartridge
was used for the SPE.
In creams, the active components (basic,
acidic and neutral drugs of different polarity)
are dispersed in complex emulsions containing
hydrophobic and hydrophilic compounds,
emulsifying agents and preservatives. Depend-
ing on the drug and formulation nature, differ-
ent SPE processes have been developed in this
study. The performance of the SPE methods
was first evaluated on standard solutions of
each drug and then the suitability of the
methods was verified on solutions of commer-
cial samples. To this end, UV spectra (conven-
tional and derivative mode) obtained from the
sample solution before and after the SPE step
were compared with the spectrum of a stan-
dard solution of the drug in the same solvent
system.
H y d r o c o r t i s o n e a c e t a t e c r e a m
(Lenirit)
A sample equivalent to 0.5 mg of steroid was
dissolved in 20ml of n-hexane-dichlorome-
thane (7:3, v/v) and 3.0ml of the resulting
solution was applied to a diol SPE column.
The column was washed with 2ml of di-
chloromethane and the drug was eluted with
two 1.5-ml portions of methanol. UV analyses
were performed by comparison with a drug
standard solution (25 lag m1-1) in methanol .
F e n t i a z a c c r e a m
(Norvedan)
A sample equivalent to about 5.0 mg of the
drug was dissolved in 100 ml o f n-h exane-
dichloromethane (7:3, v/v) and a 3.0-ml aliquot
was applied to a diol SPE column. The column
was washed with two 1-ml portions o f n-hex-
ane-dichlorometh ane (7:3, v/v) and the re-
tained drug was eluted with two 1.5-ml
portions of methanol.
2 . 6 . A s s a y p r o c e d u r e
The sample solution of each drug was sub-
jected to spectrophotometric analysis (conven-
3 .1 . S o l i d - p h a s e e x t r a c t i o n S P E )
The SPE strategy generally comprises the
isolation (and concentration) of the analytes
from a complex matrix by adsorption onto an
appropriate sorbent, the removal of interfering
impurities by washing with a suitable solvent
system and then the selective recovery of the
retained analytes with a modifed solvent sys-
tem of suitable elution strength. If necessary,
this process can be modified by selection of
sorbent and solvent systems, so that the inter-
fering components are retained by a sorbent
and the an~dytes are then recovered in the
filtrate-eluate.
The last approach was found to be effective
for the sample clean-up of commercial fluorou-
racil creams which also contained methyl- and
propyl-p-hydroxybenzoate. These preservatives
exhibit UV spectral properties which can inter-
fere with the spectrophotometric assay of the
drug. Thus, using a C-18 sorbent and dissolv-
ing the cream sample in aqueous medium (20%
v/v methanol), the hydrophobic parabens were

7/21/2019 Solid forms of pharmaceuticals: Polymorphs, salts and cocrystals
http://slidepdf.com/reader/full/solid-forms-of-pharmaceuticals-polymorphs-salts-and-cocrystals 5/9
D . B o n a z z i e t a l . / J . P h a r m . B i o m e d . A n a l . 1 3 1 9 9 5 ) 1 3 2 1 - 1 3 2 9 1325
completely retained by the C-18 sorbent while
fluorouracil passed through.
When the usual, general SPE process was
adopted, the conditions were adjusted to in-
duce the interactions matrix -analyt e, analyte
sorbent and analyte-eluent, increasing in that
order. Thus, for the analysis of the basic, hy-
drophobic drug promethazine a C-18 sorbent
was used to isolate the analyte from a 20%
v/v methanol sample solution; after washing
with the same solvent system to remove the
excipients, the drug was recovered with
methanol. A similar procedure was applied to
the clean-up of crotamiton creams. When ba-
sic, comparatively hydrophilic drugs such as
chlorhexidine and benzydamine were analysed,
a SCX packing material was preferred. At
pH 4.5 (aqueous medium), the protonated
chlorhexidine was retained by a PRS sorbent,
while the uncharged excipients passed through
the column; subsequent elution with a solvent
(pH 7.4) provided quantitative drug recovery.
The same procedure was applied to the analy-
sis of benzydamine hydrochloride cream, but
an arylsulphonic sorbent (SCX) was used. The
last cation exchange material was found to be
unsuitable for the extraction of chlorhexidine;
the different size and nature of the drugs are
probably responsible for different secondary
interactions with the aliphatic-aromatic moiety
of the SPE sorbent.
Ion-exchange methodology also proved to
be suitable for the clean-up of cream samples
containing hydrophobic, acidic drugs such
as Ketoprofen (pK~=5.9) and Ibuprofen
(pK~,= 5.2). The drugs, in the carboxylate
form in a basic solvent system, were retained
by a SAX sorbent; after appropriate washing
to remove the excipients, the drugs were re-
covered by eluting with an acidic solvent sys-
tem. This procedure allows elimination of
neutral components such as methyl- and
propyl-parabens which could interfere with the
spectrophotometric determination.
A diol sorbent, previously applied to the
sample clean-up of imidazole antimycotic
creams [12,13], was found to be suitable for
the analysis of formulations containing neu-
tral or acidic drugs of different polarity, such
as hydrocortisone acetate, fentiazac and
piroxicam. In these applications, the cream
sample was dissolved in an appropriate di-
chloromethane-n-hexane mixture, where the
dichloromethane n-hexane ratio was suitably
adjusted to give weak matrix-analyte interac-
tions and to favour the sorbent analyte inter-
actions. Under these conditions, the drug was
adsorbed onto the diol sorbent while most of
the excipients were eliminated; the drug was
then recovered by eluting with methanol or
dichloromethane.
On the basis of this and previous experience
[12,13], the use of a diol sorbent as the first
approach for the clean-up of a formulated
cream can be suggested. The hydrophobic and
acidic-basic properties of the drug as well as
the nature of the excipients constitute critical
elements for determining the choice of a re-
versed-phase or ion-exchange methodology for
optimisation of the SPE.
3 .2 . U V s p e c t r o s c o p y
Conventional (zero-order) and derivative
(first- and second-order) UV spectroscopy was
applied to the analysis of the representative,
selected drugs and to monitor the develop-
ment of the appropriate SPE method. For
each drug, linear relationships between the ab-
sorption maximum absorbance (zero-order) or
the selected amplitudes ~D and 2D (first- and
second-derivative), and the corresponding
drug concentration were found (Table 1).
When commercial creams were analysed, the
applicability of the different UV methods un-
der different conditions (with and without
SPE step) were evaluated. The results are
given in Table 2.
Direct conventional spectrophotometric
analysis of the sample solutions was not found
to be applicable: in each case, inflated assay
results were obtained, the extent depending on
the excipient structure and the measurement
wavelength. This effect was marked for formu-
lations containing parabens (fluorouracil, ke-
toprofen, ibuprofen, benzydamine) or
butylhydroxyanisole (chlorhexidine). Minor
effects were observed when the cream base
components were of an aliphatic nature; inter-
ference with the assay of piroxicam from an
aromatic compound (phenylethyl alcohol) was
prevented by using high wavelengths for mea-
surements.
Derivative UV spectrophotometric analysis
of the sample solution, without a preliminary
SPE clean-up did not offer significant im-
provements in accuracy.
When the commercial cream samples were
subjected to the SPE procedures prior to the

7/21/2019 Solid forms of pharmaceuticals: Polymorphs, salts and cocrystals
http://slidepdf.com/reader/full/solid-forms-of-pharmaceuticals-polymorphs-salts-and-cocrystals 6/9
1326 D . B o n a z z i e t a l . / J . P h a r m . B i o m e d . A n a l . 1 3 1 9 9 5 ) 1 3 2 1 - 1 3 2 9
T a b l e 2
A s s a y r e s u l t s ~ f o r t h e s p e c t r o p h o t o m e t r i c ( c o n v e n t i o n a l a n d d e r i v a t iv e m o d e ) a n a l y s i s o f p h a r m a c e u t i c a l c r e a m s b e f o r e
a n d a f t e r S P E c l e a n - u p s t e p
D r u g M e t h o d B e f or e S P E A f t e r S P E
( S P E )
% f o u n d R S D % % f o u n d R S D %
C r o t a m i t o n ~D 106.22 2.5 99.41 1.24
254.4
(C - 18) 2D26t 6 104.13 2.7 98. I 1 0.73
2D261.6 247.2
107.86 2.3 98.9 0 1.71
I bu pr o f en A 27~ .6 > 150 . 20 b 98 . 21 0 . 93
( SA X ) A2636 > 150 . 15 b 98 . 29 1 .01
B e n z y d a m i n e ( S C X ) A 3 o5 6 1 3 5 . 70 2 . 9 9 8 . 6 6 1 . 20
C h l o r h e x i d i n e A 2 5 6 . 8 146 . 46 2 . 2 102 . 95 0 . 38
(PR S) ID272 248.4 140.93 3.0 98.32 0.16
2D259.2 240 142.31 2.9 98. 30 0.2 9
2D24o 229.9 145.25 2.1 97.83 0.25
H y d r o c o r t i s o n e A 24 8 1 1 0 .0 7 2 . 3 9 9 . 7 3 0 . 6 5
ace t a t e ( 2 - O H) 2D271 6 2488 90 . 82 2 . 6 99 . 71 0 . 65
F l u o r o u r a c i l A266 125 . 35 3 . 2 102 . 62 0 . 27
( C- I 8 )
2D292.8 267.2 89.1 0 3.1 99 .80 1.19
P r o m e t h a z i n e A 2 4 9 .2 140.74 2.3 100.52 1.58
(C-18 ) 20261.2 251.2 107.04 2.8 99.7 0 2.66
P i r o x ic am A 325 .6 103 . 89 2 . 5 98 . 09 0 . 79
( 2 - OH) 20371 . 2 326 102 . 96 3 . 0 98 . 80 0 . 70
K e t o p r o f e n A 2 6o 127.63 2.4 97.71 0.35
(SA X ) 2D232_258.8 113 . 76 3 .1 98 . 58 0 . 88
Fe n t i a zac A3oo4 112. 81 2 . 6 98 . 05 0 . 89
( 2 - O H) 10327 . 6 86 . 20 2 . 9 98 . 35 0 . 75
1D 88.41 2.8 97.50 0.90
254.4
T h e r e s u lt s , e x p r e s s e d a s a p e r c e n t a g e o f t h e c l a i m e d c o n t e n t , a r e
d e t e r m i n a t i o n s .
b ( _ ) : n o t d o n e .
t h e m e a n s o f fi v e ( a f te r S P E ) a n d t h r e e ( b e f o re S P E )
spectrophotometric assay, interference was
eliminated and accurate analyses were per-
formed. In general, no significant differences
were observed between the conventional and
the derivative mode of analysis; slight inter-
ference observed in the conventional determi-
nation of fluorouracil and chlorhexidine was
completely suppressed using the derivative
mode. It should be emphasized that crotami-
ton was analysed only by derivative spec-
trophotometry. Crotamiton is a typical
compound with a UV spectrum characterized
by slight shoulders in the usual analytical re-
gion 220-300 nm (Fig. 1); using the derivative
mode, the shoulders are converted to intense,
sharp peaks whose amplitudes can be used for
quantitative applications. Moreover it was
shown that the SPE method could provide an
effective clean-up of the crotamiton sample so-
lution; the derivative spectrum after SPE over
the 250-350 nm region was essentially identi-
cal to that of an equimolar standard solution.
The performance of the adopted SPE proce-
dures can be further illustrated by the exam-
ples reported in Fig. 2 (benzydamine
hydrochloride), Fig. 3 (hydrocortisone ac-
etate), Fig. 4 (ketoprofen) and Fig. 5 (ibupro-
fen). Generally, after the SPE step, the UV
spectra appear to recover their correct profiles
allowing accurate analysis to be.performed. It
should be pointed out that the method of
sample dissolution was chosen to be suitable
for the subsequent SPE step; a different
method of sample preparation could probably
be devised to provide more accurate direct
spectrophotometric analyses. The accuracy of
the proposed methods was determined by
analysing commercial samples spiked with a
known quantity of drug; the recoveries were
98.00-100.64%. The precision of the method
(SPE and UV assay) was good, as indicated
by the RSD (Table 2).

7/21/2019 Solid forms of pharmaceuticals: Polymorphs, salts and cocrystals
http://slidepdf.com/reader/full/solid-forms-of-pharmaceuticals-polymorphs-salts-and-cocrystals 7/9
D. B ona zz i e t a l . / J . Phar m. B iom ed . Ana l . 13 19 9 5 ) 13 21 13 29
1327
3 0 ~ 7 - ~ - ~
1 5
0
i
' , .
\
\
'\
\
\ ,
/ \
2s,l.~
. ~..
26•.6
B D C 2 D
~ . . . . . . . o
I I
i
200 300 200 300 200 300
n m
Fig . I . Ze ro -order (A) , f i r s t -o rder (B) and se cond-order (C) de r iva t ive UV spec t ra o f c ro tami ton sample so lu t ion
(45.6 pg ml ~), before (- . -) and after ( ) the SPE (C-18 sorbent) clean-up step.
B ecause of t he gene ra l l y h i gh recove r i e s and
t he go od prec i s ion ( R S D < 1 .5% , wi t h t he ex-
cep t i on of p rome t haz i ne ) whi ch can be a tt a i ned
f r o m e x p e r i e n c e w i t h t h e m e t h o d , S P E - U V
s p e c t r o p h o t o m e t r y c a n b e c o n s i d e r e d t o b e a
use fu l combi na t i on for t he rou t i ne qua l i t y con-
t ro l o f pha rm aceut i ca l c reams .
4 . C o n c l u s i o n s
Sol i d-phase ex t rac t i on (SPE) proved t o be an
e f fec t ive t oo l fo r pe r form i ng adequ a t e sam pl e
c l ean-up for t he spec t rophot ome t r i c ana l ys i s o f
drugs i n c reams . The SPE condi t i ons can be
opt i mi zed by se l ec t i ng t he appropr i a t e sorben t
and e l uen t sys t ems accord i ng t o t he prope r t i e s
of t he drug and exc i p ien t s ( a c i d ba se ,
l ipophi l ic i ty) . Afte r the SPE s teps , both con-
vent i ona l ( z e ro-orde r ) and de r i va t i ve spec -
t roscopy can be gene ra l l y app l i ed . The
de r i va t i ve mode , howeve r , o f fe r s a more cha r -
ac ter i s t i c spec t ra l prof i le tha t i s useful for drug
i den t i f i c a t i on and for i mprovi ng t he accuracy
of t he me t hod , by us i ng sa t e ll it e peaks a t
higher wavelengths and suppress ing the res id-
ua l non-spec i f i c ma t r i x absorp t i on . The pro-
l
A
200 300 n
Fig . 2 . Zer o-order UV spec t ra o f benzydamine sample
so lu t ion (30 pg ml ~), be fore ( ) and a f te r ( - . . ) the
SPE (SCX sorben t ) c lean-up s tep .
0.75
~ . ~
o , ~ . . . _
200 300
r im
I I I
200 300
2 D
B
Fig . 3 . Zero-order (A) and second-order (B) de r iva t ive UV
spec t ra o f hydrocor t i sone ace ta te sample so lu t ion
(25 pg ml- ~) , be fore ~ ) and a f te r ( . . . ) the SPE (d io l
sorbent) clean-up step.

7/21/2019 Solid forms of pharmaceuticals: Polymorphs, salts and cocrystals
http://slidepdf.com/reader/full/solid-forms-of-pharmaceuticals-polymorphs-salts-and-cocrystals 8/9
1328 D . B o n a z z i e t a l . / J . P h a r m . B i o m e d . A n a l . 1 3 1 9 9 5 ) 1 3 2 1 - 1 3 2 9
2.0
1 0
/ \
:
°
220 260
L_
i ° • I
300 340
r i m
2D
Fig . 4 . Ze ro-order UV spec trum of ke toprofen sample
solutio n (14.2 pg m l 1; pH 7.4) before ( ) the SPE
(SAX sorben t) c lean-up s tep . Zero-order ( . . . ) and second-
order ( - - - ) UV spec tra o f the so lu tion (pH 4 .5) a f te r the
SPE step.
1.0
0 S
A
l i
I i \
250 3S0
N m
2 D
0
Fig . 5 . Ze ro-order UV spec trum of ibuprofen sample so lu-
t ion (27 lag m l- t ; pH 8 .0) be fore ( ) the SPE (SAX
sorbent) c lean-up s tep . Zero-order ( . . . ) and second-order
( . • ) UV spec tra o f the so lu t ion (pH 4 .5) a f te r the SPE
step.
p o s e d S P E p r o c e d u r e s m a y a l s o be a d o p t e d i n
c h r o m a t o g r a p h i c ( H P L C ) a n a l y s e s t o a v o i d
o v e r l o a d i n g a n d d e l e t e r io u s e f f ec t s u p o n t h e
a n a l y t i c a l c o l u m n p e r f o r m a n c e a n d l i fe t im e .
Acknowledgements
T h a n k s a r e d u e t o M i s s C e c i l ia L i m i n a a n d
M i s s M a u r a B o t t u r a f o r th e i r v a l u a b l e t e c hn i -
c a l a s s i s ta n c e . T h i s w o r k w a s s u p p o r t e d b y t h e
M U R S T ( R o m e , I t al y ).
References
[1 ] T h e U n i t e d S ta t e s P h a rma c o p e ia XXI I a n d T h e N a -
t io n a l F o rmu la ry XV II - - U n i t e d S ta t e s P h a rma -
cope ia l Convent ion , Rockvi l le , MD, 1990 .
[2] The Bri t ish Pharmacopoe ia , Vol . I I , HMSO, London ,
1993.
[3] F . J . Van der Vaart , A. H ulshoff and A .W.M . Inde-
mans, Pharm. Weekbl. Sci. Ed. , 4 (1982) 16-20.
[4] V. Cavrin i , A.M. Di P ie t ra and M.A. Raggi , In t , J .
Pharm ., 10 (1982) 119-124.
[5] F . J. Van der V aart , A. Hulshoff and A.W .M. lnde-
man s, J . Pharm . B iomed. Anal. , 1 (1983) 507-5 15.
[6] O.A. Lake , A. Hulshoff and A .W.M . Indem ans ,
Pharm. Weekbl. Sci. Ed. , 4 (1982) 43-48.
[7] O.A. Lake , A. Hulshoff , F . J . Van der V aart and
A.W.M. Indemans , Pharm. Weekbl . Sc i . Ed . , 5 (1983)
15-21 .
[8] M. O kam oto and M. Ohta , J . Chrom atogr . , 369
(1986) 403-407.
[9] L . Z ivanovic , D. Z ivanov-Stak ic and D. Radulov ic ,
Arch. Pharm., 320 (1987) 1183 1185.
[10] J . Sherma , B.P . Whitcom b and K . Brubaker , J . P lanar
Chromatogr . Mod. TLC, 3 (1990) 189-190 .
[11] F.M . R abel, J . Assoc. Off. Anal. C hem ., 64 (1981)
1258.
[12] V. Cavrin i , A.M. Di P ie t ra and R. Ga t t i , J . Pharm.
Biomed. Anal. , 7 (1989) 1535 1543.
[13] A.M . D i P ie t ra , V. Cavrin i , V. Andrisan o and R.
Gat t i , J . Pharm . Biomed. Ana l . , 10 (1992) 873-879 .
[14] R.O. M cDow all , E . Doyle , G.S . Murk i t t and V .S.
Picat, J . Pharm . Bio med. Anal. , 7 (1989) 1087 1096.
[15] K.B. F urton and J . R e in , Ana l . Chim. Ac ta , 236
(1990) 99-114.
[16] T .R. Krishnan and I . Ib ranam, J . Pharm. Biomed.
Anal. , 12 (1994) 287-297.
[17] M. M oors and D .L. Massa r t , Trends Ana l . Chem. ,
9(5) (1990) 164-169.
[18] M . M oors, B. Steenssens, F. Tielem ans and D .L.
Massart, J . Pharm. Biomed. Anal. , 12 (1994) 463-481.
[19] M. Z ief, L.J . Crane and J . Ho rwa th, Int. L ab. , 12
(1982) 102, 104-109.
[20] G. Cortani, Lab. 2000, 2 (1988) 8-9; Chem. Abstr. ,
113, 120887t.
7/21/2019 Solid forms of pharmaceuticals: Polymorphs, salts and cocrystals
http://slidepdf.com/reader/full/solid-forms-of-pharmaceuticals-polymorphs-salts-and-cocrystals 9/9
D. Bonazzi et al ./ J. Pharm. Biomed. Anal. 13 1995) 1321 1329 1329
[ 21 ] H . T o k u n a g a , T . K i m u r a a n d J. K a w a m u r a , l y a k u h i n
Ke nkyn , 15 (1984) 87 92 ; Chem. A bs t r . , 100 ,
161853d.
[22] E .J. Ben jam in and D.L . Co nley , In t . J . Pharm . , 13
(1983) 205-217 .
[23] D.L . Conley and E .J. B en jamin , J . Chrom atogr . , 257
(1983) 337 344.
[24] E .W. S mi th , J .M. H a igh and I . Kaufe r , In t . J . Pharm. ,
27 (198 5) 185 192