
Solar Water Heater Research Project - CCBC Faculty...
28
Solar Water Heater Research Project: Collector Facing Horizontal Angle Orientation May 01, 2008 ENVS 102- Environmental Science Lab Spring 2008 Created by: Dara Benton Zack Mohler Charles Ward Joy William
Transcript of Solar Water Heater Research Project - CCBC Faculty...

Solar Water Heater Research Project:
Collector Facing Horizontal Angle Orientation
May 01, 2008
ENVS 102- Environmental Science Lab
Spring 2008
Created by:
Dara Benton
Zack Mohler
Charles Ward
Joy William

2
Introduction
Objective
Our initial goal for this research project was to do design and build a passive
thermosyphon solar water heating system capable of reaching an optimal temperature of
100 F (38 C) – 110 F (43 C). Additional, the system was designed to support a semester
long study on the optimal position of the collector relative to the sun, along a horizontal
angle (or azimuth), capable of producing the above stated temperatures.
Background Research
The overall process of this research project required a fairly extensive amount of
background research, mainly to uncover and utilize the past findings of others. The
background research revealed articles discussing the step-by-step process of how to
construct several types of passive solar water heaters and a thorough review of relevant
terminology. This served as a great starting point for understanding some of the
components of designing any type of passive system. There were discussions of the
methods of insulating systems, orientation of the systems relative to the sun, as well as
the important design elements needed for an efficient collector and storage tank to
achieve optimal insolation. The background research revealed in-depth discussions on
several variations of solar heating systems and clear explanations on some underlying
principles of how these systems work including the associated properties of water and
thermodynamics. Basically, this was a review of the physics at work in a thermosyphon
system. There were also specific reviews of flat-plate collector designs (the type used
here) including the dimensions of the many parts included in such a system. There were
also discussions of both open and closed loop systems practical for installation in a home.

3
Perhaps most helpful though, were the excellent diagrams presented throughout much of
the research. Among the individual sources that proved most useful were the websites for
the U.S. Department of Energy, Energy Efficiency and Renewable Energy and the past
student reports (available on Dr. Floyd’s webpage) on similar research. A bibliography of
the research team’s resources used for this project is located at the end of this report.
Hypothesis
While the research team understands that past research clearly supports a
generalized south-facing collector orientation, our hopes were to reveal a more specific
optimal range of horizontal angles from which a flat-plate collector is most effective in
capturing solar energy. While a true south-facing (0 ) collector may yield the highest
levels of insolation, the research team believed there to be an optimal range of south-
facing angles (-15 to +15 ) that would allow the collector to capture the same amount of
radiation from the sun as if it were oriented in a true south-facing (0 ) direction. For the
purposes of this experiment, true south will be given the value 0 (where east would be
-90 and west +90 ).
Results
Research Design Process
As is reflected in the weekly data graphs (see pages 9-13 and the Appendix), the
dependent variable is the temperature of the water in both the storage tank and the
collector output pipe. The independent variable is the orientation of the collector
(expressed in horizontal angle measurement relative to the sun). In order to establish our
point of reference from which to measure the angle along the horizon, the team used a
magnetic compass to determine the direction of magnetic south. However, because we

4
used true south as our point of reference and because the magnetic North Pole and the
geographic North Pole do not coincide, we also utilized a declination calculation1 and a
sun path chart (see Fig. 1)2 to accurately orient our collector. After determining the
latitude (39.27825 N) and the longitude (76.740124 W) for the 21228 zip code
(Catonsville, MD), it was determined that the declination (the angle between magnetic
north and true north) was 11º 0’ W. 3 After determining true south, using a protractor we
marked-off lines of reference on the workbench to denote horizontal angles every 15º
from -60º to +60º. These lines served as the basis for our weekly horizontal angle
changes.
QuickTime™ and aTIFF (Uncompressed) decompressor
are needed to see this picture.
Fig. 1
The research data collection took place over a period of 7 weeks, from Tuesday
March 11, 2008 through Tuesday, April 29, 2008. However, the data results reflected in
our final graphs and calculations are based only upon the data collected only from week 2
through week 7 (where weeks 2 & 3 are combined as they reflect measurements from the
same horizontal angle and week 1 is counted only as preliminary data from no specific
horizontal angle).

5
In order to accurately test our hypothesis, we took measures to try and produce
reliable and valid results. In part, this required controlling for as many variables as
possible. Our experimentation took place within the setting of a climate-controlled
greenhouse. From this setting, there was no need to control for factors regarding the
weather immediately surrounding our solar heating system. However, the weather outside
of the greenhouse is a variable that we attempted to control for in our final results. We
were able to control for varying degrees of sun exposure (i.e. limited amount of exposure
on overcast days versus full exposure on sunny days) by taking averages from our weekly
data. For example, the data from the two sunniest days (presumably the two highest
temperatures) of a given week were averaged and this average was used to represent the
week’s average maximum storage tank water temperature.
Additionally, during the course of the project the sun’s path continually increased
in altitude, appearing to rise higher in the sky as the summer solstice was approaching
(see Fig. 1). While we did not physically attempt to control for this factor by making
adjustments to the vertical angle orientation of the collector to offset the sun’s change in
position, we took this into consideration when evaluating our data. It should be noted that
the vertical position (or latitude) of the collector remained at one constant angle
throughout the duration of the experiment, at about a 50 angle from the workbench.
System Design and Construction
The materials used in the construction of our passive solar water heater, their
costs, and each item’s specific qualities and dimensions are listed in Fig. 2. Our system
design was based upon the following factors: the team’s individual research on the web

6
and scientific databases, past student reports on similar projects, class discussions, and
the availability and cost of materials.
(1) 18” X 24” X .093” Plexiglas $ 7.18
(1) 24” X 6” X ½” piece lumber $ 2.95
(2) 24” X 4” X ½” piece lumber $ 5.62
(1) 10’ X ½” M-grade copper tubing $10.59
(3) ½” copper tee fitting $ 2.32
(4) ½” copper elbow fitting $ 1.91
(2) ½” X 3/8” copper female adapter $ 6.78
(2) 3/8” X 3/8” brass hose barb adapter $ 5.26
(1) duct tape $ 4.53
(1) plumbing tape $ 1.05
(1) 1.3 gallon (4.9 liter) plastic container w/lid $ 5.82
(1) can matte finish black spray paint $ 5.00
(1) box 1 ¼” finishing nails $ 2.65
(2) 3/8” plastic hose barb nipple w/gasket N.A.
(2) 3/8” inside diameter vinyl plastic tubing piece N.A.
Total Cost $61.66
Fig. 2 Building Materials
The flat-plate collector dimensions were designed relative to the size of the water
storage tank by using a 1 sq. foot collector facing per 1-gallon tank ratio, as this was
revealed as optimal in our research.4 The storage tank capacity was approximately 1.3
gallons (or 3.75 liters) of water, but we kept it filled with approximately 3.5 liters (or 0.35
cc) of water. It was important to use a square-sided storage tank so that the fittings
installed on its side would fit flush without any leaks. Also, a tight fitting lid for the
storage tank was necessary, not only to prevent loss of water through evaporation, but
also to prevent unwanted heat loss through the top of an open container. The final
dimensions of the collector measured L24” X W7” X D4”. However, it is important to
note the Plexiglas facing measured at L24” X W6” or 1 square foot. This was an
unconventional part of our design, while still in keeping with the desired 1 square foot

7
measurement. Our original intention for elongating the collector was to maximize the
horizontal space within our limited workbench area, as we would be rotating the collector
each week. We chose to utilize copper tubing to construct the collector manifold (see Fig.
3) because of its superior heat transfer abilities when compared with vinyl tubing, as was
also revealed in our research.5 However, vinyl tubing was used to connect the storage
tank to the collector to and from both the intake and outtake.
Fig. 3 Collector manifold prior to assembly. Shown with straight pipe, tees & elbows.
After its assembly, the collector manifold was painted black in an effort to collect
the most amount of the sun’s energy. We found it sufficient to attach the Plexiglas facing
with duct tape instead of risking breakage by attaching it with nails or screws. Finally, it
is important to note that there was no insulation used on this solar water heater. This
decision was based upon the objective of reaching a maximum temperature, without
concern for actually sustaining a maximum temperature. Figures 4 & 5 show the
completed system at work in the greenhouse, facing a +60º angle along the horizon.

8
Fig. 4 Solar water heater collector, Fig. 5 System from opposite
probe, and vinyl tubing to storage tank side, showing tank & probe and
tubing from intake & outtake.
Weekly Data Graphs and Lab Notes
Week 1 Tuesday, March 11-Tuesday, March 18:
After the construction and assembly of our solar water heating system was
complete, we decided to set it up within the greenhouse and begin collecting data with
LoggerPro. The purpose of this preliminary data collection was to be sure the system was
working without leaks or any other unforeseen problems with design, construction,
assembly and/or initial placement. The system was oriented without regard to specific
horizontal or vertical angle. LoggerPro was set to collect temperature data continuously

9
for 168 hours at a rate of 4 samples per hour. The data software monitored two distinct
area’s temperatures with probes located in: 1) the water in the storage tank and 2) the
water in the collector output pipe.
After the first week of continuous data collection we noticed no leakage of water.
The storage tank reached a maximum temperature (on Monday, March 17, 2008) of
31.01º C (87.82º F) and the collector output pipe reached a maximum (same day) of
27.12º C (80.82º F). A graph of week 1 data can be found in the Appendix.
Weeks 2 & 3 Tuesday, March 18-Tuesday, April 01:
2008 Mar 19 to Apr 01: 0 Degrees
0
5
10
15
20
25
30
0 8
16
24
32
40
48
56
64
72
80
88
96
104
112
120
128
136
144
152
160
168
176
184
192
200
208
216
224
232
240
248
256
264
272
280
288
296
304
312
320
328
Time (hours)
Tem
pera
ture (
deg
rees C
)
Storage Tank Collector Output Pipe
Beginning at week 2, we set up a system from which we could make weekly
adjustments to the horizontal angle placement of the collector. The collector was
positioned at a horizontal angle of 0º (true south) and a vertical angle of approximately
50º from upright. The LoggerPro was set to collect for 350 hours at 4 samples per hour.
During these two weeks of testing, the storage tank reached a maximum temperature (on
Wednesday, March 26, 2008) of 26.91º C (80.44º F). Since our hypothesis predicted that,

10
at this angle (0º or true south), our tank would reach its highest temperature, the group
was surprised to have not reached a higher maximum temperature.
Week 4 Tuesday, April 01-Tuesday April 08:
2008 Apr 01 to Apr 08: +15 degrees
0
5
10
15
20
25
30
35
0
5.2
5
10.5
15.8 21
26.3
31.5
36.8 42
47.3
52.5
57.8 63
68.3
73.5
78.8 84
89.3
94.5
99.8
105
110
116
121
126
131
137
142
147
152
158
163
Time (hours)
Tem
peratu
re (
deg
rees C
)
Storage Tank Collector Output Pipe
This week, the horizontal angle of the collector was adjusted to +15º. The group
determined that we would be more likely to find a position of optimal sunlight collection
if we continued movement westward along the horizon. The vertical angle was kept
constant, at approximately 50º. LoggerPro was set to collect continuously for 168 hours
at a rate of 4 samples per hour. The storage tank reached a maximum temperature (on
Saturday, April 05, 2008) of 30.61º C (87.10º F). With this new information, the group
decided to continue collector movement for next week westward along the horizon.

11
Week 5 Tuesday, April 08-Tuesday, April 15:
2008 Apr 08 to Apr 15: +30 degrees
0
5
10
15
20
25
30
35
40
0 7
14
21
28
35
42
49
56
63
70
77
84
91
98
105
112
119
126
133
140
147
154
161
Time (hours)
Tem
pera
ture (
deg
rees C
)
Storage Tank Collector Output Pipe
This week, the horizontal angle of the collector was adjusted to +30º. The vertical
angle was kept constant at 50º. The LoggerPro was set to collect continuously for 168
hours at a rate of 4 samples per hour. The storage tank reached a maximum temperature
(on Thursday, April 10, 2008) of 34.71º C (94.48º F). Again, in order to locate an optimal
angle for maximum insolation, the group decided to continue movement of the collector
toward a more westward-facing orientation for next week.
Additionally, it was noticed that while constructing the collector we failed to
remove the thin plastic protective covering from the Plexiglas collector facing. Although
Dr. Floyd did not foresee this as a problem for solar collection, the group disassembled
the collector and removed the protective covering anyway. Also, it should be mentioned
that from the first week of data collection, the water in the covered storage tank remained
at a constant level, with no need for refilling. However, the group has needed to monitor
weekly, the position of the temperature probe in this tank because the connecting cord

12
(from probe to computer) was stretched to its maximum length and had a tendency to
almost lift the probe tip out of the water surface. Luckily, the probe has remained in the
tank water at all times, but its placement has varied from the tip being ½ inch submerged
to about 2 inches submerged.
Week 6 Tuesday, April 15-Tuesday, April 22:
2008 Apr 15 to Apr 22: +45 Degrees
0
5
10
15
20
25
30
35
40
0
6.2
5
12.5
18.8 25
31.3
37.5
43.8 50
56.3
62.5
68.8 75
81.3
87.5
93.8
100
106
113
119
125
131
138
144
150
156
163
Time (hours)
Tem
pera
ture (
deg
rees C
)
Storage Tank Collector Output Tube
This week, the horizontal angle of the collector was adjusted to +45º as we have
yet to ascertain any optimal range. The vertical angle was kept constant at 50º. The
LoggerPro was set to collect continuously for 168 hours at a rate of 4 samples per hour.
The storage tank reached a maximum temperature (on Friday, April 18, 2008) of 35.39º C
(95.70º F). In keeping with the trend of the past several weeks of data, this week’s
maximum storage tank water temperature is the highest recorded thus far. The group will

13
make calculations in order to account for the ever increasing outside air temperature and
determine if the water’s temperature is a function of the outside air temperature.
Week 7 Tuesday, April 22-Tuesday, April 29:
2008 Apr 22 to Apr 29: +60 degrees
0
5
10
15
20
25
30
35
40
0
6.2
5
12.5
18.8 25
31.3
37.5
43.8 50
56.3
62.5
68.8 75
81.3
87.5
93.8
100
106
113
119
125
131
138
144
150
156
163
Time (hours)
Tem
pera
ture (
deg
rees C
)
Storage Tank Collector Output Pipe
This week, the horizontal angle of the collector was adjusted to +60º as we have
yet to ascertain any optimal range. The vertical angle was kept constant at 50º. The
LoggerPro was set to collect continuously for 168 hours at a rate of 4 samples per hour.
The storage tank reached a maximum temperature (on Saturday, April 26, 2008) of
35.56º C (96.01º F). This week’s maximum water temperature is the highest overall
temperature that the water in the storage tank had reached for the duration of the
experiment. Based solely upon maximum storage tank water temperature, this may mean
we will not locate any optimal range of horizontal angle orientation.

14
Discussion
In order to more clearly and comprehensively evaluate the week-to-week data,
several data tables and graphs of the combined weekly data have been constructed. Such
graphs allowed the research team to draw conclusions about the data and notice any
trends that may have occurred. In addition, these graphs helped us to evaluate whether or
not our research hypothesis is, in fact, supported. Interestingly, some final graphs seem to
support our hypothesis while others can be seen as refuting the hypothesis.
Final Graphs
As the research progressed, it appeared that a clear trend was developing while
evaluating the maximum temperatures achieved from week to week, as seen in the
following chart entitled Maximum Temperature. Contrary to our hypothesis, with the
Maximum Temperature
26.91084
30.61493
34.71464 35.38907 35.55831
0
5
10
15
20
25
30
35
40
0 10 20 30 40 50 60 70
Horizontal Angle (0 to +60 degrees)
Tem
pera
ture (
deg
rees C
)
Max Temp

15
collector facing 0º (or true south), the graph reveals that the water in the storage tank
reached a high temperature of approximately 26.91º C, compared with a high temperature
of approximately 35.55º C with the collector facing +60º horizontal angle. This evidence
alone does not support our hypothesis that an optimal range of collector insolation should
exist at south-facing horizontal angles and these angles would be within the range of -15
to +15 . According to the graph directly above, no optimal was yet discovered and
furthermore, a southwest-facing collector had provided the highest temperatures, thus, the
most insolation, or exposure to the sun’s rays.
However, several factors may have played a role in receiving this data. This may
have been a result of the protruding southeast wall of the greenhouse blocking some of
the early afternoon sun and preventing an accurate reading of the highest possible level of
sun exposure available to the collector at a true south-facing angle (or 0 ). At the same
time, the vertical angle at which the collector was held constant (approx. 50 ) may have
played a prominent role. It is possible that when the collector was oriented in a more
southwest-facing horizontal angle, the collector was at an optimal vertical angle for the
maximum collection of solar energy and perhaps the opposite was true when the collector
was more south-facing.
Also of interest, and perhaps most closely in support of our hypothesis, is the final
graph illustrating the relationship between outside air temperature and storage tank water
temperature entitled Outside Tmax per Storage Tank Tmax (seen on page 16). In this
graph, the relationship was meant to show if the temperature of the water within the
storage tank was a function of the temperature of the outside air. The maximum water
temperature at a specified horizontal angle was compared with the maximum outside air

16
temperature occurring on that same day (for further data, see Appendix for the graph
illustrating Outside Tmax and Storage Tank Tmax).
Outside Tmax per Storage Tank Tmax
(reflects data from corresponding
days)
1.274
1.837
1.524
1.2021.333
0
0.2
0.4
0.6
0.8
1
1.2
1.4
1.6
1.8
2
0 20 40 60 80
Horizontal Angle (0 to +60 degrees)
Tem
pera
ture (
deg
rees C
)
S.T.Tempmax per O.Tempmax
By the significant variances in ratio, it can be said that the temperature of the
water within the storage tank is not a function of the temperature of the outside air, which
also supports the fact that the water temperature increases are a result of a properly
functioning thermosyphoning solar water heater. Perhaps of equal importance, this graph
seems to support our hypothesis that an optimal range of collector insolation should exist
at south-facing horizontal angles within the range of -15 to +15 . Note the highest data
point (1.837 C) exists at a horizontal angle of +15 .
The data tables for the graphs discussed above, as well as further research with
additional graphs and tables, can be found in the Appendix.

17
Mechanisms and Design
There are other factors regarding the mechanisms of operation and system design
that are important to discuss. First, the collector design held some interesting and
unintended consequential effects. As was discussed in the above section entitled System
Design and Construction and as seen in Fig. 4 above, the collector was an elongated
version of the more conventional square-shaped collectors others chose to build. Our
original intentions for this component of the design are explained above. However, what
is important to consider is the possibility that this elongated collector may have allowed
us to more accurately test the levels of insolation at varying angles along the horizon.
That is, although the total surface area measured 1 square foot, only 6 inches (the width
of the collector) of collector facing was available to capture solar energy.
In addition, the depth of our collector may have also inhibited less direct sunrays
to enter the collector by effectively blocking them out. Although this was an unintended
consequence of our design, and may have been a factor in the water temperature never
reaching our desired goal, this may be an important element for future researchers to
consider.
Although our system, thus far, was unable to reach the desired water temperature
range of 38º C to 43º C, it suffered no leaks at anytime and was built quite solidly. It is
possible that the number of manifold piping or its volume capacity played a role in its
ability to achieve higher temperatures. Further research on these variables was conducted
this semester and should be considered by others in their design as an important factor.
Again, the depth of our collector may have played a role in lower than expected water
temperatures as well. The four inch deep walls created a larger than necessary volume of

18
air within the collector that may have had an effect on its ability to produce higher
temperatures.
Lastly, although we had weekly data on the temperature of the water as it first
exited the collector from the collector output pipe, we spent little time evaluating these
numbers. We used this data only as a means to evaluate if our system was working
properly, but other data seemed to conclusively show that it was working properly.
However, it should be mentioned that the expected result was that the water in the
collector output pipe would consistently be at a higher temperature than the water in the
storage tank. In fact, the opposite was true. This may point to some design flaw, but it
would require further investigation.
Conclusion and Recommendations
Conclusion
Overall, the most important aspect of this research project involved rethinking the
relationship between humans and energy consumption. Our attempt to optimize a
component of capturing solar energy for the purpose of heating water mostly illuminated
one simple fact: the Sun’s energy, unless stored, is not consistently available 24 hours a
day, year-long at any one place on Earth. However, the “needs” of humans living within
industrialized societies currently dictates an ever-ready supply of energy with many of
these sources quickly being depleted. Thus, it is important for the scientific community to
optimize solar energy. However, perhaps it is most important for humans to rethink our
energy consumption and relative “needs” in light of what sources are truly available long-
term. At this point, conservation of energy is the most immediately effective way of
heading-off any foreseen or unforeseen problems associated with our current worldwide

19
energy consumption. The Appendix includes data graphs and tables measuring the
amount of Btu’s and Calories our specific solar heater was able to produce. Also related,
are the graphs in the Appendix illustrating the maximum change in temperature entitled
Delta Tmax and Delta Tmax Avg. While evaluating these, the bench-scale size of our
system must be considered, as the numbers may appear unimpressive, but can be applied
to a larger system’s water volume capacity.
Recommendations
In terms of technical recommendations here are a few. Get your system up and
running as quickly as possible, without compromising quality. Our group was up and
running first and still able to collect useable data for only 7 weeks. Seven weeks may
seem like enough, but in fact it was not. If we were to redo this experiment several things
would change. However, without the fortune of having current access to the other
research groups’ most recent data and conclusions this will be a more generalized
suggestion. It is probably much more important than we had anticipated to
simultaneously measure and compare both the horizontal and the vertical orientation of
the collector in relation to the sun. Although we attempted to keep the vertical constant
and thought it possible to later account for the changing altitude of the sun’s path, we
have no definitive evaluation of the effects of this variable. However, future researchers
may be able to simply use data from this semester’s groups and evaluate the relationship
based upon past research.
A crucial component to this project rests in the group’s ability to keep continuous,
detailed and accurate lab notes. Summarizing any information at the close of the research
would prove very difficult without these. Do not rely on memory alone as you will

20
probably only remember what you think is important at the time and dismiss some critical
observation that could easily have been noted and revisited later.
Additionally, this project requires a fair amount of critical evaluation and it is
much easier to do so as a group. What one researcher overlooks as valuable information,
another is sure to pick up on. With that said, do not hesitate to become engaged in the
thinking process of the research, as every member has much to contribute, despite their
level or area of understanding.
Do yourself, and your group, a favor and research as much as possible during the
first few weeks of lab. This is critical and will determine your success for the duration of
the project. Also, keep in mind the immense amount of information that exists, not only
on the web or in books, but also the knowledge within yourself, other group members and
the instructor. The chances are, if you start asking the questions, someone will help you
find the answer. However, initiative is paramount in a lab setting.

21
Notes
1. NOAA Satellite and Information Service, National Geophysical Data Center,
Geomagnetism, http://www.ngdc.noaa.gov/geomagmodels/Declination.jsp.
2. Okay Solar, Sun Path Chart for 40 degrees Latitude, http://www.oksolar.com/
images/solar_path_large.jpg.
3. NOAA, Geomagnetism.
4. U.S. Department of Energy, Energy Efficiency and Renewable Energy, A
Consumer’s Guide to Energy Efficiency and Renewable Energy, http://www.eere.energy.
gov/consumer/your_home/water_heating/index.cfm?mytopic=12850.
5. Maria K. Chaconas and Dan Jacobs, “Creating a Passive Solar Water Heating
System,” Community College of Baltimore County, http://student.ccbcmd.edu/envproj/
jfloyd/index.htm.

22
Bibliography
Bainbridge, David A. “Build Your Own Passive Solar Water Heater.” Mother Earth
News, no. 224 (Oct/Nov 2007): 78-86, http://search.ebscohost.com/login.aspx?
direct=true&db=eih&AN=26615615&site=ehost-live. (accessed February 5,
2008).
Build It Solar, The Renewable Energy Site for Do-It-Yourselfers. “Doug's Simple
Thermosyphon Solar Water Heater.” http://www.builditsolar.com/Projects/
WaterHeating/DougThermosyphon.htm. (accessed February 11, 2008).
Chaconas, Maria K. & Jacobs, Dan. “Creating a Passive Solar Water Heating System.”
Community College of Baltimore County. http://student.ccbcmd.edu/envproj/
jfloyd/index.htm.
Hackleman, Michael. “7 Solar Water Heating System Designs.” Backwoods Home
Magazine, 1998. http://www.backwoodshome.com/articles/hackleman65.html.
(accessed February 5, 2008)
NOAA Satellite and Information Service.National Geophysical Data Center.
Geomagnetism. http://www.ngdc.noaa.gov/geomagmodels/Declination.
jsp.(accessed March 11, 2008).
Okay Solar. Sun Path Chart for 40 degrees Latitude. http://www.oksolar.com/ images/
solar_path_large.jpg. (accessed Feb 24, 2008).
Sun Earth Inc. Quality Solar Energy Products. http://www.sunearthinc.com/empire_
series_flat_plate.htm. (accessed February 11, 2008).

23
Bibliography (cont’d)
U.S. Department of Energy, Energy Efficiency and Renewable Energy. A Consumer’s
Guide to Energy Efficiency and Renewable Energy. http://www.eere.energy.
gov/consumer/your_home/water_heating/index.cfm?mytopic=12850. (accessed
Feb 11, 2008).
WBALTV. Baltimore Weather Almanac. http://www.wbaltv.com/almanac/index.html.
(accessed Apr 29, 2008).

24
Appendix- A1
Week 1 Data Graph
2008 Mar11 to Mar18: no specified angle
0
5
10
15
20
25
30
35
0
5.5 11
16.5 22
27.5 33
38.5 44
49.5 55
60.5 66
71.5 77
82.5 88
93.5 99
105
110
116
121
127
132
138
143
149
154
160
165
Time (hours)
Tem
pera
ture (
deg
rees C
)
Storage Tank Collector Output Pipe
Final Data Tables
Horizontal
Angle (x-
axis)
Max Temp
C
Avg.
Temp2max DeltaT Max
DeltaT
Avg2max
OutsideT
max
0 26.91084 26.88765 12.17925 11.95299 20.556
15 30.61493 30.18211 14.73219 13.29703 16.667
30 34.71464 32.79374 18.49237 16.2371 22.778
45 35.38907 35.2564 19.53291 18.6038 29.444
60 35.55831 33.98093 16.51113 15.73192 26.667
Horizontal
Angle (x-
axis)
Outside T
per
Storage
Tank T
Calorie-
Delta Tmax
x 3500 cc
of water
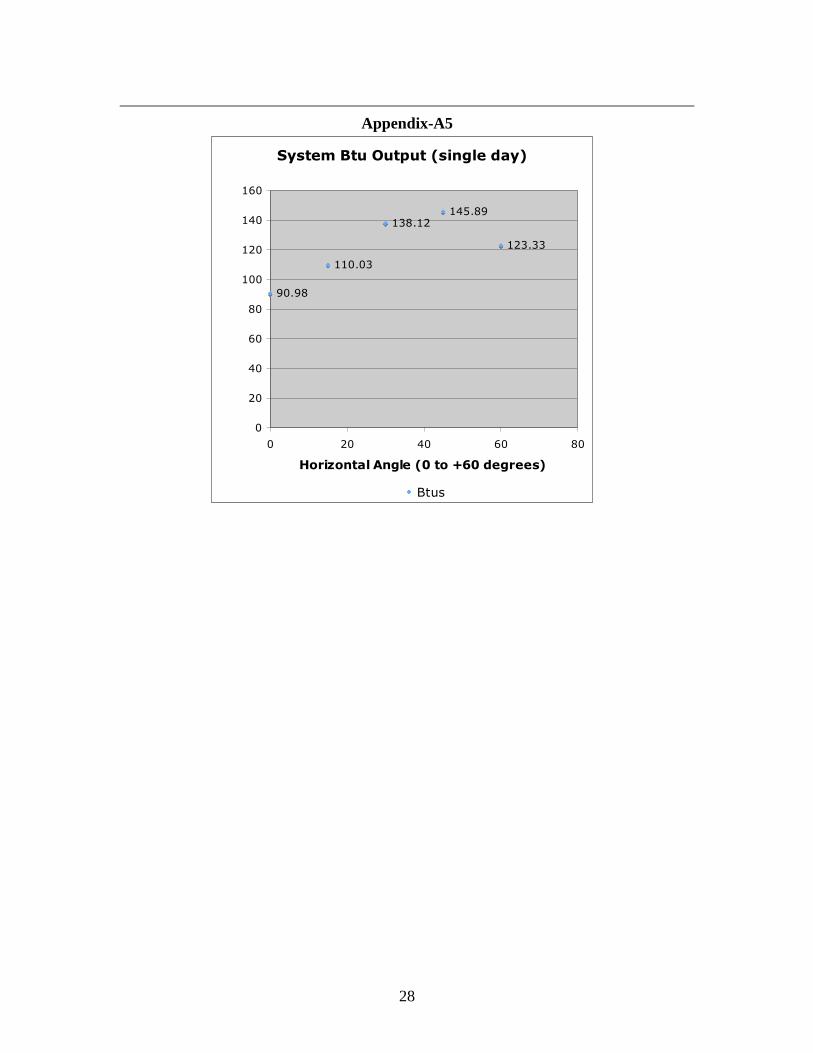
Btu (Delta
Tmax x lbs
of water)
0 1.274 42630 90.98
15 1.837 51555 110.03
30 1.524 64715 138.12
45 1.202 68355 145.89
60 1.333 57785 123.33

25
Appendix-A2
Final Graphs
Avg Max Temp (Top 2)
26.88765
30.18211
32.79374
35.256433.98093
0
5
10
15
20
25
30
35
40
0 20 40 60 80
Horizontal Angle (0 to +60 degrees)
Tem
pera
ture (
deg
rees C
)
Avg Max Temp (Top 2)
Delta T Max
12.17925
14.73219
18.4923719.53291
16.51113
0
5
10
15
20
25
0 20 40 60 80
Horizontal Angle (0 to +60 degrees)
Tem
pera
ture (
deg
rees C
)
Delta T Max

26
Appendix-A3
Delta T Max Avg (top 2)
11.95299
13.29703
16.2371
18.6038
15.73192
0
2
4
6
8
10
12
14
16
18
20
0 20 40 60 80
Horizontal Angle (0 to +60 degrees)
Tem
pera
ture (
deg
rees C
)
Delta T Max Avg (top 2)
Storage Tank Tmax and Outside
Tmax (reflects data from
corresponding days)
26.91084
30.61493
34.71464 35.38907 35.55831
20.556
16.667
22.778
29.44426.667
0
5
10
15
20
25
30
35
40
0 10 20 30 40 50 60 70
Horizontal Angle (0 to +60 degrees)
Tem
peratu
re (
deg
rees C
)
Max Temp Outside Temp max

27
Appendix-A4
Outside Tmax per Storage Tank Tmax
(reflects data from corresponding
days)
1.274
1.837
1.524
1.2021.333
0
0.2
0.4
0.6
0.8
1
1.2
1.4
1.6
1.8
2
0 20 40 60 80
Horizontal Angle (0 to +60 degrees)
Tem
pera
ture (
deg
rees C
)
S.T.Tempmax per O.Tempmax
System Caloric Output (single day)-
Delta Tmax x .35cc
42630
51555
6471568355
57785
0
10000
20000
30000
40000
50000
60000
70000
80000
0 1 2 3 4 5 6
Horizontal angle (0 to +60 degrees)
Ca
lorie
s
Calories
28
Appendix-A5
System Btu Output (single day)
90.98
110.03
138.12145.89
123.33
0
20
40
60
80
100
120
140
160
0 20 40 60 80
Horizontal Angle (0 to +60 degrees)
Btu
s
Btus