
SOLAR PV INDUSTRY JOBS REPORT - SAPVIA
27
APRIL 2021 SOLAR PV INDUSTRY JOBS REPORT PREPARED FOR South African PV Industry Association Eastgate Office Park, Block A South Boulevard Road | Bruma Johannesburg | 2198 | South Africa Office: +27(0)11 553 7264 SUBMITTED BY Ruan Fourie Energy Economist | Energy Industry Energy Centre | Smart Places | CSIR PO Box 395, Pretoria | 0001
Transcript of SOLAR PV INDUSTRY JOBS REPORT - SAPVIA

APRIL 2021
SOLAR PV INDUSTRY JOBS REPORT
PREPARED FOR South African PV Industry Association
Eastgate Office Park, Block ASouth Boulevard Road | Bruma
Johannesburg | 2198 | South AfricaOffice: +27(0)11 553 7264
SUBMITTED BY Ruan Fourie
Energy Economist | Energy IndustryEnergy Centre | Smart Places | CSIR
PO Box 395, Pretoria | 0001

PROUDLY SPONSORED BY:
LITERATURE REVIEW
ISSUING ORGANISATION: .........................................................................Council for Scientific and Industrial Research (CSIR)
Energy Centre
Smart Places
PO Box 395
Pretoria 0001
CONTRACT NAME: .........................................................................................CONSULTING AGREEMENT
SAPVIA SOLAR PV INDUSTRY JOBS REPORT
CONTACT DETAILS:........................................................................................ SAPVIA
Eastgate Office Park, Block A
South Boulevard Road, Bruma
Johannesburg
2198
South Africa
Office: +27(0)11 553 7264
APPROVED BY:
Responsibility Name Signature
Project Leader Ruan Fourie
Research Group leaders (Energy Systems)
Crescent Mushwana
Dr Brian North
Centre Manager Dr. Clinton Carter-Brown
Client representative Frank Spencer
DOCUMENT CONTROL
ISSUING ORGANISATION: .........................................................................Council for Scientific and Industrial Research (CSIR)
Energy Centre
Smart Places
PO Box 395
Pretoria 0001
Contract Name: ................................................................................................CONSULTING AGREEMENT
SAPVIA SOLAR PV INDUSTRY JOBS REPORT
Contact Details: SAPVIA
Eastgate Office Park, Block A
South Boulevard Road, Bruma
Johannesburg
2198
South Africa
Office: +27(0)11 553 7264
APPROVED BY:
Responsibility Name Signature
Project Leader Ruan Fourie
Research Group leader (Energy Systems) Crescent Mushwana
Centre Manager Dr. Clinton Carter-Brown
Client representative Frank Spencer
PROUDLY SPONSORED BY:
3
DOCUMENT CONTROL
ISSUING ORGANISATION: .........................................................................Council for Scientific and Industrial Research (CSIR)
Energy Centre
Smart Places
PO Box 395
Pretoria 0001
Contract Name: ................................................................................................CONSULTING AGREEMENT
SAPVIA SOLAR PV INDUSTRY JOBS REPORT
Contact Details: SAPVIA
Eastgate Office Park, Block A
South Boulevard Road, Bruma
Johannesburg
2198
South Africa
Office: +27(0)11 553 7264
APPROVED BY:
Responsibility Name Signature
Project Leader Ruan Fourie
Research Group leader (Energy Systems) Dr Brian North
Centre Manager Dr. Clinton Carter-Brown
Client representative Frank Spencer
PROUDLY SPONSORED BY:
5
TABLE OF CONTENTS1. Introduction ........................................................................................................................................................................................................................8
2. The Jobs Definition Conundrum................................................................................................................................................................................82.1. Background .................................................................................................................................................................................................................8
2.1.1. Green jobs as defined by the International Labour Organisation (ILO) ..................................................................................82.2. Job-years/full time equivalent (FTE) jobs ................................................................................................................................................... 92.3. Direct, indirect and induced jobs ...................................................................................................................................................................102.4. Jobs per standardised unit output .................................................................................................................................................................11
3. Global Solar PV Jobs Overview ................................................................................................................................................................................113.1. Renewable Energy and Jobs – Annual Review 2018/2019 (IRENA) ..................................................................................................113.2. Forecasting job creation from renewable energy deployment through a value-chain approach
(University of Zaragoza) ............................................................................................................................................................................................ 123.3. Job creation potential and skill requirements (Masdar Institute of Science and Technology) ........................................... 12
4. Solar PV Jobs Global Leading Markets (Case Studies) ................................................................................................................................ 134.1. Background .............................................................................................................................................................................................................. 134.2. Regional off grid solar prospects .................................................................................................................................................................. 134.3. China .......................................................................................................................................................................................................................... 134.4. Brazil ..........................................................................................................................................................................................................................144.5. United States ..........................................................................................................................................................................................................144.6. India ...........................................................................................................................................................................................................................144.7. Japan ..........................................................................................................................................................................................................................14
5. South African Solar PV Jobs Overview ...............................................................................................................................................................145.1. Photovoltaic Electricity: Localisation study ............................................................................................................................................... 155.2. Co-benefits job creation through renewable
energy in South Africa ................................................................................................................................................................................................165.3. South African employment potential estimation....................................................................................................................................16
6. Conclusions ...................................................................................................................................................................................................................... 17
Figures and Tables ...............................................................................................................................................................................................................18
References ..............................................................................................................................................................................................................................25
LIST OF TABLESTable 1: Stages that influence solar PV employment [12] .........................................................................................................................................20Table 2: Involved FTE jobs for the commissioning of a 1MWp PV facility in 2010 [9] .................................................................................20Table 3: Total full time direct jobs as per model results [9] .......................................................................................................................................21Table 4: Solar PV value chain employment factor summary from survey responses [13] ..........................................................................21Table 5: Job creation from several renewable energy technologies ....................................................................................................................22
LIST OF FIGURESFigure 1: Global Solar PV Installed Capacity [1] ...............................................................................................................................................................18Figure 2: South African Solar PV Installed Capacity (GW) [1] ..................................................................................................................................18Figure 3: Direct, Indirect and Induced Jobs[9] ................................................................................................................................................................19Figure 4: Global Employment by renewable energy technologies (IRENA, 2018; IRENA, 2019). ...........................................................19Figure 5: 2019 Chinese solar PV Jobs .................................................................................................................................................................................22Figure 6: Estimates of total and average number of FTE jobs created along the South African PV
industry value chain (2007, 2010, and 2020) ...............................................................................................................................................................23Figure 7: Forecasted Cumulative job years created during the construction phase in wind and solar PV
between the year 2018 and 2030 ..........................................................................................................................................................................................23Figure 8: Forecasted evolution of net employment in the power sector by the different technologies
(direct jobs) ..................................................................................................................................................................................................................................24
LIST OF ABBREVIATIONSCIM Construction, Installation and Manufacturing
CSIR Council for Scientific and Industrial Research
DBSA Development Bank of Southern Africa
DEFF Department of Environmental Affairs,
Fisheries and Forestry
DMRE Department of Mineral Resources
and Energy
DRE Decentralised Renewable Energy
EPC Engineering, Procurement and Construction
GW Gigawatt
GWh Gigawatt hour
IO Input-Output
IPPO Independent Power Producers Office
ILO International Labour Organisation
IRENA International Renewable Energy Agency
MW Megawatt
NREL National Renewable Energy Laboratory
O&M Operations and Maintenance
PAYG Pay-as-you-go
PV Photovoltaic
RE Renewable Energy
REI4P Renewable Energy Independent Power
Producers Procurement Program
SAPVIA South African Photovoltaic Industry
Association
SHS Solar Home System
SSEG Small-Scale Embedded GenerationUCT University of Cape Town

1 INTRODUCTION
Global installed renewable energy (RE) power generation capacity grew more than 170 GW in 2019 (mostly solar PV) to 2 532 GW [1]. For the fifth year in a row, net additions of RE power generation capacity clearly outpaced net installations of fossil fuel and nuclear power generation capacity combined. Global solar PV installations grew from 481 GW in 2018 to 579 GW in 2019, an increase of 98 GW [1], see Figure 1.
China was the global leader in new solar PV technology installations followed by the United States, India and Japan. Solar PV is clearly the global leader in new RE power sector generation development contributing 57,5% of total new RE generation capacity additions.
In contrast, South Africa has seen inconsistent growth over the last decade due to policy uncertainty, see Figure 2 for South African solar PV installed capacity evolution.
The inconsistent procurement of solar PV has seen variability in employment creation in the sector as local companies struggle to invest in a market with inconsistent demand for solar PV. Understanding the reason and implications of this variability in the market requires a brief overview of the market itself.
The solar PV market is divided in two market segments: utility and embedded generation. The latter spans residential, commercial and industrial applications and is often referred to as small scale embedded generation (SSEG), while the former mostly covers large utility scale ground mounted installations feeding power directly into the grid. Recent times have seen the introduction of ground mounted installations in the commercial and industrial space.
Job creation is a significant component of the socio-economic effects related to RE development in South Africa. The deployment of solar PV, in the utility and SSEG markets has created jobs for the South African economy as a whole.
The likely continued contribution of the solar PV industry in creating new jobs supports public policy and the allocation towards solar PV generation in the country’s Integrated Resource Plan (IRP). This literature review will cover the following aspects of jobs emanating from the solar PV sector:
n Analyzing the jobs definition conundrumn Global solar PV jobs research overview n Case Studies – solar PV jobs research overview in
various countriesn South African solar PV jobs research overview
The literature reviewed in the report identifies the number of jobs created as well as the chosen metric used to report said job numbers.
The literature review concludes with recommendations on what the best metrics are to report real job numbers as well as highlighting the results of the countries that report annual job numbers in the solar PV domain.
2 THE JOBS DEFINITION CONUNDRUM
2.1 BACKGROUND
The impact of RE jobs in South Africa is a complex issue that is highly contested by various groups in the country. It is essential to reach a common understanding of how jobs numbers are reported, although there are several studies conducted on this topic. These studies are investigated in this report and analyses work completed by the International Renewable Energy Agency (IRENA), International Labour Organisation (ILO), University of Zaragoza, CSIR and the University of Cape Town (UCT).
The uncertainty associated with selecting a consistent jobs metric to use creates confusion when reporting and engaging stakeholders on the number of jobs created by a technology in the South African power sector. A wide range of definitions of employment generated by energy sector activities have been proposed and a variety of methods have been used to construct such estimates. This study provides a comparison of how different countries or studies are using employment figures or how they arrive at certain estimates of jobs created by a specific technology deployment such as solar PV.
This section focuses on describing various approaches used in estimating employment created in the RE sector. The section will outline the following concepts:
n Job-years/full time equivalent (FTE) jobsn Direct, indirect and induced jobsn Jobs per standardised unit output
2.1.1 GREEN JOBS AS DEFINED BY THE INTERNATIONAL LABOUR ORGANISATION (ILO)
Green jobs are defined as jobs that help reduce the overall negative environmental impact, in the long run leading to environmentally, economically and socially sustainable enterprises and economies. Green jobs are decent jobs, which protect and restore ecosystems through reducing energy consumption and resources utilised, thus limiting the production carbon footprint and waste [2]. The Skills for Green Jobs: South Africa study by ILO [2] shows that the private sector stakeholder
plays a critical role in greening the economy, especially in terms of innovation and job creation opportunities. Moreover, job creation opportunities are central in the South African low carbon and climate-resilient growth path. The creation of green jobs is an important part of adopting solar PV and other RE technologies, it is also a key component of the Just Energy Transition. The South African Department of Environment, Forestry and Fisheries (DEFF) identified four areas that can create and promote green jobs [2]:[2]
n Development and growth of new green sectors and industries;
n Retrofitting industrial efficiency processes and clean production technologies in existing sectors and industries;
n Growing existing GE sectors such as renewable energy, waste recycling and biodiversity;
n Incentivising and accelerating private and public-sector investment in restoring critical ecosystem services and land productivity, water conservation, wetland rehabilitation and fire management.
These are some of the areas that can contribute to creating green jobs as identified by DEFF. Small and Medium Enterprises (SMEs) have a significant role to play in the country’s development objectives due to the economic impact they have in the South African Gross Domestic Product (GDP). SMEs created about 14% of employment opportunities which translates to approximately 42% economic contribution towards the GDP[2]. The prospects of SMEs in creating jobs in the energy value chain is minimal since most of them do not have the technical capacity in technologies like solar and wind [2]. Efforts to increase the labour absorption in various economic sectors (with the green economy receiving particular attention) have been undertaken since 2011.
The green economy is complex, extremely diverse and rapidly growing in many of its segments, particularly in an economy such as South Africa’s. The country will essentially be dealing with the progressive and simultaneous introduction of technologies that are either being improved, developed or commercialised. The economic merit of many of these technologies may only be fully established in years to come, opening up opportunities for the establishment of infant industries over time [3]. According to [3], the green economy sector has the potential to create approximately 98 000 new direct jobs on average in the short term, almost 255 000 in the medium term and around 462 000 employment opportunities in the formal economy in the long term.
2.2. JOB-YEARS/FULL TIME EQUIVALENT (FTE) JOBS
The reporting of job numbers in a standardised format is required due to the variable duration of different job opportunities created in the solar PV value chain. Construction, installation and manufacturing (CIM) jobs generally fall within one year while operation and maintenance (O&M) jobs span the lifetime of the plant and O&M jobs are generally lower than CIM jobs in the RE sector. Furthermore, some O&M jobs tend to periodically employ individuals which leads to underreporting of job numbers. Defining the different metrics currently used when reporting job numbers is critically important when undertaking a study that aims to collect and forecast job numbers for a specific technology.
The terms job-years or full-time equivalent (FTE) are often used loosely and are often misinterpreted as meaning the number of persons employed. The section that follows provides an elaboration into job-years and FTE metrics and how they are derived.
FULL TIME EQUIVALENT (FTE)
According to the ILO definition [4], an FTE job, “is a unit to measure employed persons in a way that makes them comparable although they may work a different number of hours per week”.
The FTE unit is obtained by comparing an employee's average number of hours worked to the average number of hours of a full-time worker. A full-time worker is therefore counted as one FTE, while a part-time worker gets a score in proportion to the hours he or she works.
This is a good way of measuring employment and is used to express the size of the workforce of an enterprise, activity or country. This metrics proves useful in cross value chain jobs assessments as part time employees can be standardised to annual FTE job numbers.
JOB-YEAR
The CSIR was unable to source a document from a reputable organisation that defines job-year apart from a document released by the United States Executive Office of the President Council of Economic Advisers. This document defines a job-year as one job for one year [5].
The lack of a reputable referenced document that clearly defines what a job year is, creates uncertainty around the metric itself and whether it would be prudent to use this metric in an analysis undertaken in the rest of this study.
98

The CSIR outlined its understanding on what a job-year is based on how this metric has been used in reporting jobs numbers in other reports. A job-year refers to a job that exists for a consecutive 40 hour per week for an undisturbed period of 12 months.
The concept of job-years becomes important when accounting for jobs created during the construction phase (18 to 24-month period) and O&M (20 years) phases of a typical lifetime of a solar PV (or other power generation) project. This enables comparison of jobs on a like for like basis. This metric format allows the user to specify how many people are employed in a specific year, which requires appropriate treatment of full-time and part-time jobs and the duration of activities that are time-bounded.
While others may argue that this is the best way to account for jobs created and supported by the industry others lean more towards accounting for jobs per energy concept without splitting the construction and O&M jobs.
EXAMPLES OF JOB-YEAR CALCULATIONS
If a job exists for 3 months employing one person, it is a quarter of a job-year, and therefore it would take four 3-month-long jobs to make one job-year or FTE. If a job exists for two years, it counts as two job-years.
So, in a 3-month example, if a road maintenance contract (for example) employs 100 people on a 3-month contract, that contract is actually creating 25 job-years, whereas a two-year project employing 100 people for a full period of 2 years is actually creating 200 job-years. So even though both projects were employing 100 people each, the actual number of job-years created is 225.
DIFFERENT APPROACHES TO BUILDING UP JOBS METRICS
According to World Bank (2011) [6] the time dimension of a job has to be fully articulated before aggregating employment created from different parts of a project or policy. A job is usually defined in terms of the number of job-years attached to the employment. This depends on how much time in each year a job is paid for (how long in a year does the person get paid for), and for how many years the job exists. Part-time jobs are converted to FTEs and then scaled by the number of years for which that particular job is required (e.g. construction for a few years, maintenance for several years).
Some studies have calculated the total number of job-years created over the lifetime of the project, which was the method initially used by the Independent Power Producers Office (IPPO) report [7] when reporting on
jobs, especially O&M jobs, which makes the number appear inflated if the basis for the definitions and calculations are not understood.
The World Bank references another report [8] published in Energy Policy journal which suggests that in order to compare different projects with different lifetimes, it is best to divide the total number of job-years created by the lifetime of the project to arrive at an annual equivalent. This means that the sector would then report on jobs per annum, rather than total job-years over the lifetime of the project, which can be misinterpreted. It should be noted that no single metric is likely to capture all the nuance of the job volumes and timing created over a project lifetime. Furthermore, the comparison metric numbers observed from different sources can only be meaningful to the extent that the same definitions and philosophies have been applied in calculating the numbers.
2.3. DIRECT, INDIRECT AND INDUCED JOBS
In addition to job-years and FTEs, there is the concept of direct, indirect and induced jobs [6]. This is explained further in the context of solar PV projects.
n Direct jobs are jobs created by the direct suppliers of solar PV projects (e.g. design, development, management, construction/installation, and maintenance phase of the project).
n Indirect jobs are jobs within the value chain of the direct suppliers to the project (e.g. the construction equipment manufacturers). The total employment created as the solar PV sector expands its outputs in order to supply the inputs required for the output of the solar PV sector. For example, the manufacture of glass or aluminium frames to supply solar PV manufacturer creates indirect employment.
n Induced jobs are created as a result of workers (directly and indirectly employed by the project value chains) spending earnings within the economy. These may include the jobs created or sustained in the hospitality sector in the Northern Cape as workers require accommodation, food and transport for the duration of the construction of solar plants.
The industry reports job numbers based on the industry codes specified by StatsSA for specific projects at a site. However, the job numbers collected in this way do not account for the indirect and induced jobs. Therefore, in order to account for indirect and induced jobs, additional information has to be collected from the industries impacted the new power generation project/facility. The job numbers reported by industry are assumed to be only representing new jobs created
by a project, and they do not account for the ripple effect that a project development like solar PV has on the rest of the economy. Within the solar PV market, direct jobs are those created by firms that are directly focused on solar PV project execution: solar developers, engineering, procurement and construction (EPC) firms, and solar PV component manufacturers.
In contrast, indirect jobs are created by businesses that are in the second tier of the solar PV industry value chain, such as suppliers of materials for manufacturing (such as glass), electricity suppliers, and public officers who deal with administration and finance. Figure 3 illustrates the examples of direct, indirect and induced effects of the solar PV industry.
Furthermore, it should be noted that indirect and induced jobs are normally sustained or supported jobs. This means that, for instance, for a logistics company to secure business in the solar PV sector for transportation of equipment and materials to site, they sustain their business and they manage to keep the people employed. These may not be new jobs created specifically for the solar PV industry but rather sustained jobs which enables the economy to maintain jobs that would have otherwise been lost if the logistics company did not have a pipeline of business to keep people employed.
While the method for defining different forms of jobs creation are mostly aligned across the globe to direct, indirect and induced effects, reporting is dependent on the ability of the industry to track and report on their numbers in such a manner. Further limitations include the fact that it is difficult to track indirect and especially induced job impacts as many of these business do not relate their activity to a specific technology.
2.4. JOBS PER STANDARDISED UNIT OUTPUT
When reporting and comparing jobs numbers in the energy value chain, it is important to make sure that job numbers across technologies/value chains use the same output metric. The previous 2 sections summarised metric options that provide a starting point on reporting job numbers. The issue with these metrics are that they do not allow for easy comparisons to be drawn across technology options with varying outputs and installed capacities.
In order to compare different technologies, or even value chain segments of technologies, one requires a unit output measurement. One potential approach is that the technologies are compared on employment (average job-years/FTE) per unit of energy output which would be defined as gigawatt-hours (GWh) of electricity generated per year.
Another approach is to assess employment per unit of capacity such as megawatt (MW), but a distinction must be made between the nameplate capacity of the plant (peak MW) and the expected capacity utilization of the plant (average MW). Because of the large variation in capacity factors between alternative technologies, the number of jobs created to produce a given number of GWh per year may vary substantially between technologies, while the cost for the same annual GWh will increase with reducing capacity factor of a plant. Employment would not decrease as the capacity factor of a specific plant reduces over time and as such the jobs/installed capacity would be a method for compensating for this inaccuracy. Therefore, for the purposes of this analysis, the metric that is most suitable is FTE jobs/MW/annum.
The South African RE market has not tracked real job creation in a standardised method that is publicly available apart from the IPPO process. This information is unfortunately not broken down to each value chain segment and the methodology by which this data is collected has also not been shared.
3. GLOBAL SOLAR PV JOBS OVERVIEW
3.1. RENEWABLE ENERGY AND JOBS – ANNUAL REVIEW 2018/2019 (IRENA)
The IRENA annual review does not quote the metric used to report job number nor the employment ratios1 used in calculating final figures. Technologies such as solar PV have a direct impact on jobs created through the production and installation of the solar cells and panels. The falling costs of RE technologies continue to drive the deployment of solar PV. According to the IRENA Annual Review, international RE employment reached 10.9 million jobs in 2017, a 5.3% increase compared with the previous year [10]. The jobs created in 2018 increased by 7% on 2016 levels, reaching a record high of 11 million jobs.
The international solar PV sector had 3.4 million jobs in 2017, representing a total installation of 94 GW, which is a 23% increase from the previous year. Figure 4 shows that in 2018 the jobs created in the solar PV sector grew to 3.6 million. The IRENA reports do not provide a metric used in reporting this information, which could be attributed to the misaligned approaches of large amounts of data that they are collecting across the globe.
1110
1 Employment ratio refers to the proportion of jobs created per unit of installed power throughout the solar PV value chain
Many countries derive socio-economic benefits from RE, but most of the employment benefits remain highly concentrated in countries such as China, Brazil, the United States, India, Germany and Japan with these countries having significant proportions of the manufacturing of solar energy components.
These benefits are created across the solar PV value chain. The overall employment numbers in 2018 increased in China and India, while South Africa, the United States, Japan and the European Union lost jobs in the RE sector. The main causes for these decreases can be attributed to political and policy changes within these nations. The employment outlook is shaped by a wide range of technical, economic and policy-driven factors.
Furthermore, the analysis takes an overall technology view in reporting the number of jobs created and does not delineate between different parts of the technology value chains. This extends from component design and manufacturing by O&M through to assembling, installation and commissioning/monitoring. As such the CSIR continued its literature review with the aim of identifying methods used internationally to capture and report on real job numbers collected across the value chain of solar PV.
3.2. FORECASTING JOB CREATION FROM RENEWABLE ENERGY DEPLOYMENT THROUGH A VALUE-CHAIN APPROACH
In 2013, the team at the University of Zaragoza in Spain identified the same issue outlined in the previous section and set out to develop a methodology to capture real data across the RE technologies value chains. The method proposed is based on the collection, critical analysis and presentation of the results obtained using primary information sources. The main focus for reviewing this literature is to draw insights from the methodology rather than the results as the data is dated.
The study states that quantifying total jobs involved in the deployment of solar PV and other RE technologies can give varying results as technology deployment differs across off-grid, grid-connected, ground or rooftop-mounted PV [12].
These differences are caused by varying labour intensity of each stage in the solar PV value chain for different applications and scale. Jobs and employment characteristics are different depending on the nature of the projects.
Table 1 shows the various categories of jobs created across the solar PV value chain and provides details regarding their stability, level of specialisation and volumes.
For example, construction and installation, and dismantling, creates more jobs, but for a shorter period of time. Most stable jobs are generated in categories 1, 2 and 4, however, they are mainly located where the actual manufacturing takes place. However, construction and O&M employment opportunities are not dependent on the component manufacturing location.
The Zaragoza study continues by developing specific metrics for a 1MWp facility across the PV value chain. The metrics used in their assessment is Jobs/MW as seen in Table 2. The study added another layer of complexity by including the professional level2 of the type of job.
The study concludes by using these metrics to calculate the number of jobs created by the Spanish PV industry between 2001 and 2010 based on the MW installed. Results can be seen in Table 3 above. Results were aggregated to differentiate between manufacturing, installation and O&M jobs and provides a breakdown of jobs created across the PV value chain that cannot be viewed in the IRENA reports.
3.3. JOB CREATION POTENTIAL & SKILLS REQUIREMENTS
The Masdar Institute of Science and Technology in the United Arab Emirates conducted a similar study [13] to that of the University of Zaragoza with the aim of quantifying job creation potential of RE across their respective value chains. This study builds on the “jobs per unit measure of energy” principle by conducting interviews and surveys with key industry stakeholders to obtain the required metrics across different technology value chains.
This study, at the start, applied a high-level approach which provides simplicity that is not provided by classic input-output (IO) models when estimating job impacts, since analytical models generally ignore jobs that are less indirectly associated with an industry.
As such the results are likely to under-report overall employment impacts [14]. Such more concise models often use employment factors illustrated in Table 4 from interviews or questionnaires from industry partners to link RE technology diffusion employment estimations. Interview specifics are used to develop job intensities or employment factors, defined as the number of jobs derived from a certain RE technology investment or capacity. The metrics listed in the table below differ in their energy units and employment type grouping as the survey allowed respondents to reply on their own chosen energy unit.
Lastly, the study shows that a variable that needs to be considered is the degree of development in the solar PV sector and above all the maturity of the technology considered from the industrial development prospects. The study used a learning rate to artificially increase the number of real jobs created over time.
4. SOLAR PV JOBS3 GLOBAL LEADING MARKETS (CASE STUDIES)
4.1. BACKGROUND
The case studies in this section have been primarily adopted from the IRENA Renewable Energy and Jobs Annual Review [10] with supplementary sources from other reports . The case studies below will provide insights into the number of jobs created as well as recent trends in various nations, however, it will not speak to the metrics used as IRENA does not define the metric they employ nor the methodology in gathering said information in their studies. This is indicative of a global challenge in quantifying job numbers in the RE sector.
4.2. REGIONAL OFF GRID SOLAR PROSPECTS
Solar PV will continue to play an important role in improving energy access. The global renewable off- grid capacity more than doubled in the past decade to 8.8 GW in 2018; off-grid solar PV expanded 10-fold to 2.9 GW [10]. In South Asia, public sector programmes have had a strong role in improving energy access. On the contrary, private sector “Pay-as-you-go” (PAYG) business models are common in Sub-Saharan Africa. Investment in private off-grid projects grew from $10 million in 2010 to $511.5 million in 2018, accounting for a cumulative investment of $ 1.7 billion over that period.
Businesses operating under the PAYG model played a significant role in growing jobs created in developing countries. A recent case study known as “BBOXX’s” in the Democratic Republic of Congo’s “Energie pour Tous” rural electrification initiative intended to provide energy access through solar home systems (SHS) and mini-grids to 2.5 million people by 2020 projected nearly 10 000 jobs that could be created through solar PV deployment.
According to [15], approximately 80% of global investments in off-grid solar PV projects were in Sub-Saharan Africa, while 15% in South Asia and 5% in Latin America. A group of key participating firms, including Zola, M-KOPA, d.light, Mobisol, BBOXX, and others, secured two-thirds of the total investment. The solar PV
sector created jobs in distributed off-grid installations. Information remains relatively scarce on the full employment impacts of off-grid renewable projects.
However, a total of 130 million off-grid solar lanterns, SHS, and other products had been sold worldwide by 2017. Over 40 companies that participated in the survey conducted by [16] projected off-grid solar employment in parts of Sub-Saharan Africa and South Asia at 372 000 FTE jobs. Almost 56% of these jobs are in rural areas and 27% are occupied by women. This estimate is comprised of sales and distribution, installation and maintenance, and customer support. According to IRENA (2019), “Power for All” launched an annual jobs census on the decentralised renewable energy (DRE) sector in low-energy access countries.
This census involves a wide range of solar technologies. Originally the project focused on Kenya, India and Nigeria, however, the geographic scope will broaden to 10 countries in 2019 and 25 in 2020. The study examines approximately 150 DRE businesses and conducts focus group discussions with stakeholders from government, skills development and training sector, civil society, finance, and industry.
The research analysis, which is still pending, is set to yield valuable insights on total DRE employment permanency of jobs, levels of compensation, current skills demand, recruitment challenges, and gender and youth representation.
The study maps areas of indirect employment impacts in upstream activities such as equipment suppliers, or service providers such as training and education [10].
4.3. CHINA
China remains the clear leader in renewable energy employment worldwide, accounting for 39% of the world’s total RE jobs. Overall, a drop in solar PV from 2.216 million jobs to 2.194 million has been recorded in 2019. This is due to a notice by the government of China that it was suspending advantageous arrangements for utility-scale solar, imposing a cap on subsidised distributed solar, and reducing feed-in-tariffs in response to continuous growth in solar subsidies. Subsidies had grown largely because the authority that approves solar farms was delegated to the local level in 2013, making policy coordination difficult. China installed 43 GW of solar PV in 2018, which is an 18% decline as compared to 2017. Rooftop solar PV saw gains, although utility-scale deployment dropped significantly.
Largely, the production of solar PV modules grew by 21% in 2018 to 87 GW, however, significant overcapacities in the supply chain led to some factory
1312
2 The authors do not provide a detailed description of what professional level jobs entail
3 The solar PV jobs consulted in this literature include utility-scale as well as distributed solar system
closures and layoffs. Offsetting lower domestic sales to a large extent, exports rose by 30%, to 41 GW, during 2018. PV exports to emerging markets are being promoted through China’s newly unveiled International Investment Alliance for Renewable Energy. Chinese PV manufacturers are also increasing their global footprint, with production facilities in close to 20 countries [10]. The solar PV employment numbers created in China are shown in Figure 5.
4.4. BRAZIL
IRENA Renewable Energy and Jobs Annual Review of 2019 reported that Brazil is increasing activities in solar PV, installing 828 MW of large-scale capacity and 318 MW of distributed capacity during 2018. In operation since mid-2018, the country’s 399 MW Pirapora solar complex in Minas Gerais is one of Latin America’s larger domestic modules users (Power Technology, 2018). IRENA’s employment factor calculations suggest that Brazil presently has close to 15 600 jobs in solar PV, mostly in construction and installation. According to [10], the industry group Associação Brasileira de Energia Solar Fotovoltaica, will likely install about 1 GW of capacity during 2019, and 15 000 new jobs could be created from this initiative.
4.5. UNITED STATES
According to the IRENA Renewable Energy and Jobs Annual Review of 2019, in the US solar PV experienced a second successive year of job losses, down to 242 300 [10]. This was due to the uncertainty surrounding US import tariff policy that resulted in several utility-scale projects being delayed. The policy amendments in California and Massachusetts also reduced solar PV activities. Once the uncertainty over tariffs was lifted, new projects started construction and project announcements surged.
Also, the Chinese government’s decision in May 2018 to cut domestic solar incentives which support the domestic Chinese solar PV industry had the effect of reducing global demand for modules as Chinese solar prices decreased; the resulting over-supply lowered prices worldwide and counteracted the impact of the tariffs [17]. Two-thirds of these jobs are in installations and project development, mainly in the residential areas. Manufacturing accounts for 14% of solar PV jobs created in the solar PV sector [10]. Domestic US module production has been volatile over the years, and most of the solar PV technology is imported. Uncertainty about the US tariff policy hindered investments in the utility-scale solar PV projects. The US example illustrates the negative effect that policy uncertainty and rapid changes can have on solar PV job creation potential.
4.6. INDIA
India’s employment in grid-connected solar PV, as estimated by IRENA using employment factors, increased to 115 000 jobs in 2018, a gain of more than 20 000 additional jobs over 2017. Jobs in off-grid solar applications cannot be calculated with precision since jobs are quantified by employment factors and some off-grid systems are small in size therefore it is not always feasible to use employment factors. Moreover, the indirect jobs for off-grid solar systems are diverse throughout the world.
However, the jobs creation may well double total solar PV employment. Seven of India’s top 10 module suppliers are Chinese firms. Indian manufacturers cannot compete on cost due to a number of factors such as incentives that the Chinese companies receive for manufacturing, cheap labour costs, technology development knowhow and automated production. Imports, principally from China and Malaysia, but increasingly also from Thailand, Vietnam, and Singapore, dominate the Indian market. In the fiscal year 2018, domestic manufacturers had a market share of just 7% [18].
4.7. JAPAN
Japan’s solar PV installations reached a cumulative 55.5 GW in 2018, the second-largest installations after China. The pace of new installations declined for the third year in a row. The reasons for slowdown in solar PV installations were lower feed-in-tariffs, land shortages and grid constraints. Close to 300 solar firms have declared bankruptcy since 2015, with the number rising year on year.
According to [11] in Japan employment is estimated to be approximately 250 000 jobs, a reduction of 22 000 from 2017. A new driver is expected to be activated by the larger installations and more jobs may come from the government’s “Zero Energy Homes” policy, which requires all new buildings to integrate solar PV and energy efficiency technologies by 2030. This initiative is specific to Japan.
5. SOUTH AFRICAN SOLAR PV JOBS OVERVIEW
The Department of Minerals Resources and Energy (DMRE) Renewable Energy Independent Power Producers Procurement Programme (REI4P) was established at the end of 2010 as one of the South African government’s urgent interventions to enhance South Africa’s power generation capacity. The South African government adopted a framework consisting
of 18 Strategic Infrastructure Projects that is intended to transform the economic landscape of South Africa, create a significant number of new jobs, strengthen the delivery of basic services to the people of South Africa and support the integration of African economies.
The section below will provide a high level assessment of the amount of jobs that solar PV created in SA according to a different research reports.
5.1. SOLAR PV ELECTRICITY: LOCALISATION STUDY
The South African Photovoltaic Industry Association (SAPVIA) in collaboration with South Africa’s Trade, Industry and Competition (the DITC) and the World Wildlife Fund for Nature commissioned a research study into the localisation potential of solar PV and the strategy needed to support a large scale roll-out in South Africa in 2012/2013. The reports content is based on a much earlier report completed in 2006 using 2001 data.
A detailed breakdown of the methodology employed during the study is not represented in the report which makes it difficult to compare the results of the study to other research pieces.
5.1.1 UTILITY MARKET
According to this 2017 study completed on the Solar PV market in South Africa [19], the utility market is projected to lead in terms of installed capacities in the near to medium-term and is anticipated to procure 1.1 GW between 2017-2020. Construction of utility-scale projects are expected to create 5.83 FTE jobs per MW per annum, and this can be strengthened through improved local content policy. Additionally, O&M are expected to create 0.35 FTE jobs per MW over the lifetime of the facility. PV components like inverters, mounting hardware and modules account for the biggest expenditure of the total project cost.
Continuous job creation opportunities are dependent on market certainty and government commitments to continue procuring solar PV. The FTE/MW figures mentioned in this study is based on theoretical modelling framework which provides context of metrics that can be expected but does not provide a methodology for collecting and reporting on real jobs data.
5.1.2 COMMERCIAL AND INDUSTRIAL MARKET AND SMALL RESIDENTIAL MARKETS
The commercial and industrial market share increased rapidly in the past few years in South Africa, with rooftop applications accounting for the largest number of installations, although ground-mounted plants
have a higher installed capacity. The payback period of rooftop systems is between 5 and 7 years. The construction and installation of solar PV systems for commercial and industrial applications is estimated to create between 5.3 and 8.0 FTE jobs per MW.
Comparing these metrics to those on a utility scale it can be seen that the number of jobs per MW increase as time progresses. Grid-tied and autonomous off-grid PV systems that deploy batteries through hybrid systems are used for household PV systems.
Most of these applications are found in rural areas. The adoption of PV systems in South Africa has been dominated by applications in rural households, however, in the past few years the recent amendments of the Electricity Act of 2006 has increased residential and commercial solar PV systems adoption[19]. Moreover, the application of solar PV systems in industrial sector and mining areas has increased significantly.
The jobs created during the installation of residential solar PV systems differ depending on whether it is a rooftop or a mono pole grounded solar PV system. Rooftop systems have been adopted predominantly, and they are projected to create between 6.1 and 9.2 FTE jobs per MW (i.e. 7.7 FTE jobs per MW on average) during construction and installation [19]. Most solar PV systems for households are being installed on rooftops; however, ground mounting or mono pole systems can also be installed, nevertheless, their cost is approximately 5-10% more expensive.
Solar PV modules and inverters are among the top three biggest cost items for household solar PV systems. Table 5 shows that solar PV technology can create up to 17 times more FTE jobs per average MW over the life of the facility during the establishment phase [19] than wind power or solar thermal technologies. At the operational phase, solar PV impact on employment is smaller since it requires minimal operation supervision and maintenance. Furthermore, employment created during production and installation of solar PV technology has the potential to create employment in other sectors that are not in the value chain. These may include the financial services sector and security services, among others.
Figure 6 shows that 3.5 FTE jobs/MW and 1.2 FTE jobs/MW can be created by the supply and services value chain segments respectively. Solar PV panels suppliers that provide the link between producers and installers benefit from solar PV projects by achieving approximately 2.9 FTE jobs/MW [19]. The ability of South Africa to realise employment opportunities created through the development of the local solar PV energy capacity is dependent on the country’s industry
1514
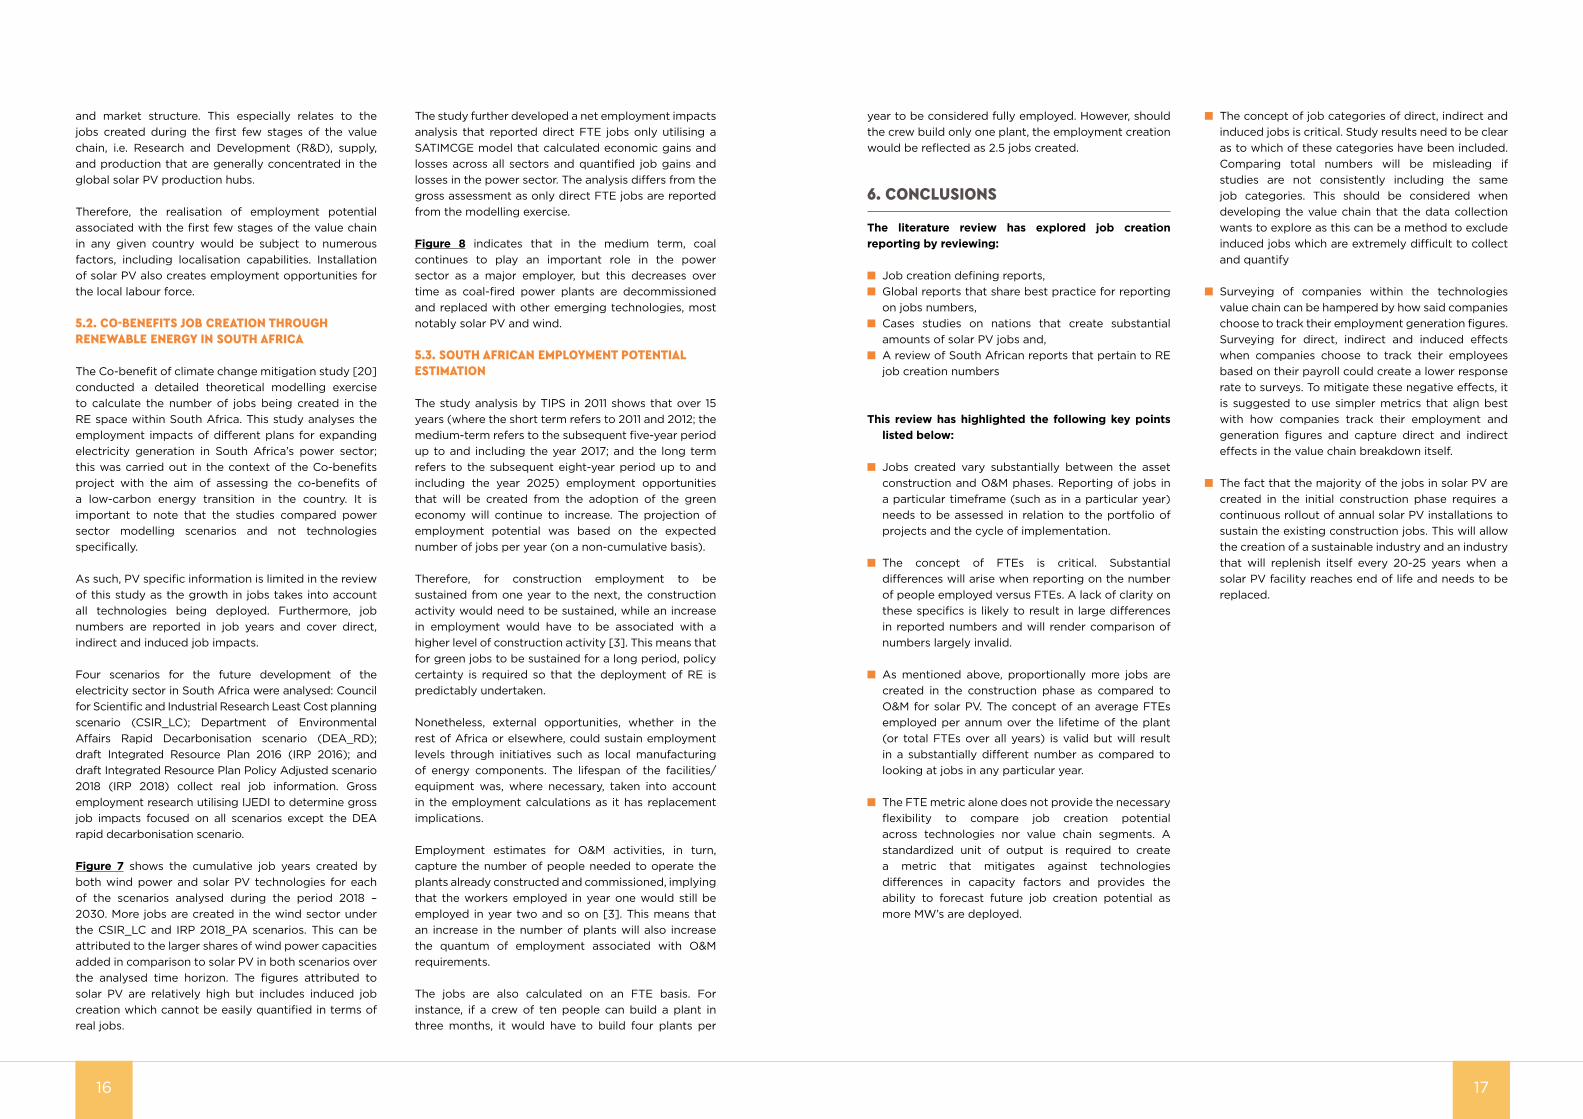
and market structure. This especially relates to the jobs created during the first few stages of the value chain, i.e. Research and Development (R&D), supply, and production that are generally concentrated in the global solar PV production hubs.
Therefore, the realisation of employment potential associated with the first few stages of the value chain in any given country would be subject to numerous factors, including localisation capabilities. Installation of solar PV also creates employment opportunities for the local labour force.
5.2. CO-BENEFITS JOB CREATION THROUGH RENEWABLE ENERGY IN SOUTH AFRICA
The Co-benefit of climate change mitigation study [20] conducted a detailed theoretical modelling exercise to calculate the number of jobs being created in the RE space within South Africa. This study analyses the employment impacts of different plans for expanding electricity generation in South Africa’s power sector; this was carried out in the context of the Co-benefits project with the aim of assessing the co-benefits of a low-carbon energy transition in the country. It is important to note that the studies compared power sector modelling scenarios and not technologies specifically.
As such, PV specific information is limited in the review of this study as the growth in jobs takes into account all technologies being deployed. Furthermore, job numbers are reported in job years and cover direct, indirect and induced job impacts.
Four scenarios for the future development of the electricity sector in South Africa were analysed: Council for Scientific and Industrial Research Least Cost planning scenario (CSIR_LC); Department of Environmental Affairs Rapid Decarbonisation scenario (DEA_RD); draft Integrated Resource Plan 2016 (IRP 2016); and draft Integrated Resource Plan Policy Adjusted scenario 2018 (IRP 2018) collect real job information. Gross employment research utilising IJEDI to determine gross job impacts focused on all scenarios except the DEA rapid decarbonisation scenario.
Figure 7 shows the cumulative job years created by both wind power and solar PV technologies for each of the scenarios analysed during the period 2018 – 2030. More jobs are created in the wind sector under the CSIR_LC and IRP 2018_PA scenarios. This can be attributed to the larger shares of wind power capacities added in comparison to solar PV in both scenarios over the analysed time horizon. The figures attributed to solar PV are relatively high but includes induced job creation which cannot be easily quantified in terms of real jobs.
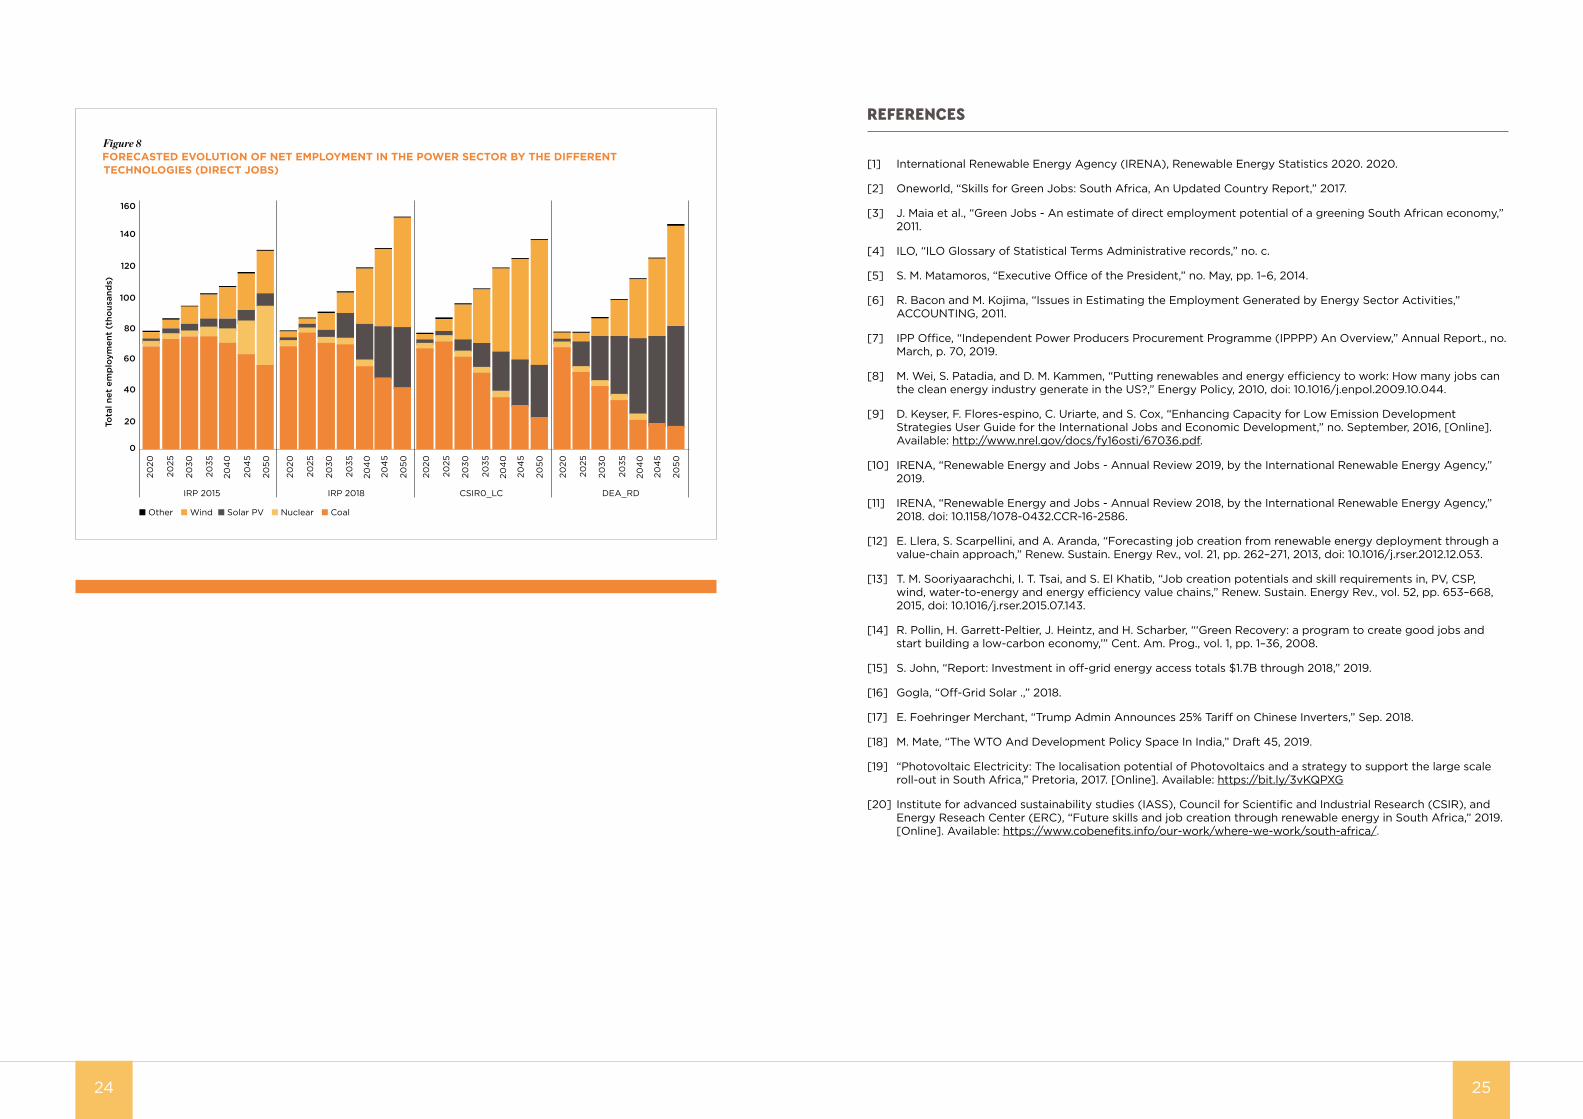
The study further developed a net employment impacts analysis that reported direct FTE jobs only utilising a SATIMCGE model that calculated economic gains and losses across all sectors and quantified job gains and losses in the power sector. The analysis differs from the gross assessment as only direct FTE jobs are reported from the modelling exercise.
Figure 8 indicates that in the medium term, coal continues to play an important role in the power sector as a major employer, but this decreases over time as coal-fired power plants are decommissioned and replaced with other emerging technologies, most notably solar PV and wind.
5.3. SOUTH AFRICAN EMPLOYMENT POTENTIAL ESTIMATION
The study analysis by TIPS in 2011 shows that over 15 years (where the short term refers to 2011 and 2012; the medium-term refers to the subsequent five-year period up to and including the year 2017; and the long term refers to the subsequent eight-year period up to and including the year 2025) employment opportunities that will be created from the adoption of the green economy will continue to increase. The projection of employment potential was based on the expected number of jobs per year (on a non-cumulative basis).
Therefore, for construction employment to be sustained from one year to the next, the construction activity would need to be sustained, while an increase in employment would have to be associated with a higher level of construction activity [3]. This means that for green jobs to be sustained for a long period, policy certainty is required so that the deployment of RE is predictably undertaken.
Nonetheless, external opportunities, whether in the rest of Africa or elsewhere, could sustain employment levels through initiatives such as local manufacturing of energy components. The lifespan of the facilities/equipment was, where necessary, taken into account in the employment calculations as it has replacement implications.
Employment estimates for O&M activities, in turn, capture the number of people needed to operate the plants already constructed and commissioned, implying that the workers employed in year one would still be employed in year two and so on [3]. This means that an increase in the number of plants will also increase the quantum of employment associated with O&M requirements.
The jobs are also calculated on an FTE basis. For instance, if a crew of ten people can build a plant in three months, it would have to build four plants per
year to be considered fully employed. However, should the crew build only one plant, the employment creation would be reflected as 2.5 jobs created.
6. CONCLUSIONS
The literature review has explored job creation reporting by reviewing:
n Job creation defining reports, n Global reports that share best practice for reporting
on jobs numbers, n Cases studies on nations that create substantial
amounts of solar PV jobs and, n A review of South African reports that pertain to RE
job creation numbers
This review has highlighted the following key points listed below:
n Jobs created vary substantially between the asset construction and O&M phases. Reporting of jobs in a particular timeframe (such as in a particular year) needs to be assessed in relation to the portfolio of projects and the cycle of implementation.
n The concept of FTEs is critical. Substantial differences will arise when reporting on the number of people employed versus FTEs. A lack of clarity on these specifics is likely to result in large differences in reported numbers and will render comparison of numbers largely invalid.
n As mentioned above, proportionally more jobs are created in the construction phase as compared to O&M for solar PV. The concept of an average FTEs employed per annum over the lifetime of the plant (or total FTEs over all years) is valid but will result in a substantially different number as compared to looking at jobs in any particular year.
n The FTE metric alone does not provide the necessary flexibility to compare job creation potential across technologies nor value chain segments. A standardized unit of output is required to create a metric that mitigates against technologies differences in capacity factors and provides the ability to forecast future job creation potential as more MW’s are deployed.
n The concept of job categories of direct, indirect and induced jobs is critical. Study results need to be clear as to which of these categories have been included. Comparing total numbers will be misleading if studies are not consistently including the same job categories. This should be considered when developing the value chain that the data collection wants to explore as this can be a method to exclude induced jobs which are extremely difficult to collect and quantify
n Surveying of companies within the technologies value chain can be hampered by how said companies choose to track their employment generation figures. Surveying for direct, indirect and induced effects when companies choose to track their employees based on their payroll could create a lower response rate to surveys. To mitigate these negative effects, it is suggested to use simpler metrics that align best with how companies track their employment and generation figures and capture direct and indirect effects in the value chain breakdown itself.
n The fact that the majority of the jobs in solar PV are created in the initial construction phase requires a continuous rollout of annual solar PV installations to sustain the existing construction jobs. This will allow the creation of a sustainable industry and an industry that will replenish itself every 20-25 years when a solar PV facility reaches end of life and needs to be replaced.
1716

FIGURES AND TABLES
Figure 4GLOBAL EMPLOYMENT BY RENEWABLE ENERGY TECHNOLOGIES (IRENA, 2018; IRENA, 2019)
0 500 1000 1500 2000 2500 3000 3500 4000
Tide, Waveand Ocean Energy
CSP
Municipal andindustrial waste
SolarPhotovoltaic
Liquid Biofuels
Hydropower
Wind Energy
Solar Heating/Cooling
Solid Biomass
Biogas
GeothermalEnergy
Jobs (thousands)
3605O�-grid solar for
energy access
1160
801
787
334
94
41
34
1
2054
2063
Figure 2SOUTH AFRICAN SOLAR PV INSTALLED CAPACITY (GW)
2010
0
2011
0.01
2012
0.01
2013
0.26
2014
1.06
2015
1.25
2016
1.97
2017
2.19
2018
2.56
2019
2.56
+3 GW
0GW
Figure 1GLOBAL SOLAR PV INSTALLED CAPACITY
2010
40
2011
72
2012
102
2013
136
2014
172
2015
217
2016
291
2017
384
2018
481
2019
579
+98 GW
+538 GW
XX XX
XX XX
1918
DIRECT INDIRECT INDUCEDn On-site construction workersn Equipment manufacturersn Design servicesn Maintenance workersn Security personneln Replacement part
manufactureres
n Legal servicesn Natural resource suppliersn Construction equipment
suppliersn Whole businesses that sell
replacement partsn Accounting services
n Housingn Retailersn Restaurantsn Health care providersn Agriculture, food
providers
Figure 3DIRECT, INDIRECT AND INDUCED JOBS

Table 3TOTAL FULL TIME DIRECT JOBS AS PER MODEL RESULTS
2001 2002 2003 2004 2005 2006 2007 2008 2009 2010
Manufacturing 963 1224 1447 2417 1713 1633 2145 9714 3598 11,075
Installation 372 594 581 1033 1539 3935 9149 18,040 475 2494
O&M 242 287 332 419 561 1020 2423 5863 5933 6296
Total jobs 1577 2105 2360 3869 3813 6588 13,717 33,617 10,006 19,865
Table 4 TOTAL FULL TIME DIRECT JOBS AS PER MODEL RESULTSTechnology type Employment opportunity Employment Factor Direct/ Indirect/Induced
Solar PV
Manufacturing, construction, Installation 5.76–6.21 jobs/MWp Direct
O&M 1.2–4.8 jobs/MWp Direct
PV module manufacturing
3–7 jobs/MWp
12–20 jobs/MWp Indirect
PV panel production 10 jobs/MWp Direct
Wholesale, retail, installation & maintenance 36 jobs/MWp Direct
Installation 346 jobs/MWp Direct
O&M 2.7 jobs/MWp Direct
Construction
17.2 man-years/MW Direct
9.4 man-years/MW Indirect
7.2 man-years/MW Induced
Operations
4.1 man-years/MW Direct
1.6 man-years/MW Indirect
2.7 man-years/MW Induced
Project construction 33–39 job-years/MWp Direct and Indirect
Table 1STAGES THAT INFLUENCE SOLAR PV EMPLOYMENT
Category number Category description
Volume of job creation generation
Location (from higher to lower numbers of jobs)
Sustainability of job
Level of specialisation
1 Research, design and development Medium From foreign to local Stable Very high
2 Manufacturing Medium From foreign to local Stable Very high
3 Transport, installation and commissioning High From local to foreign Temporary High
4 Operation and maintenance Low Local Stable Medium
5 Renovation, modernization, uprating or de-commissioning High From local to foreign Temporary High
Table 2INVOLVED FTE JOBS FOR THE COMMISSIONING OF A 1MWP PV FACILITY IN 2010
Jobs/MW Managers Technical consulters Salesmen Installers Operators Maintenance
staffAdministrative
staff Total jobs
Projects/studies 0.08 0.17 0.03 0.05 0.33
Silicon 0.05 0.80 0.13 0.98
Cells 1.01 0.50 0.70 0.20 2.41
Module assembly 2.01 1.01 4.02 2.01 9.05
Solar tracker 0.97 1.04 0.84 2.55 0.97 6.37
Elect. components & inverters 0.68 0.45 0.82 0.65 2.60
Installation 1.06 1.35 0.67 2.31 0.67 6.06
Operation 0.30 0.35 0.21 0.47 0.32 1.65
Total 6.16 4.41 2.20 2.31 8.90 0.47 5.00 29.46
XX XX
XX XX
2120

Figure 52019 CHINESE SOLAR PV JOBS
39% of global
renewable
energy jobs
Solar PV2.2 million jobs
Solar Water Heating670 000 jobs
Figure 6ESTIMATES OF TOTAL AND AVERAGE NUMBER OF FTE JOBS CREATED ALONG THE SOUTH AFRICAN SOLAR PV INDUSTRY VALUE CHAIN (2007, 2010, AND 2020)
0 5 10 15 20 25 30 35 40 45 50
2007
2010
2020
Average number of jobs created per MW of installed PV systems at di�erent stages of the value chain
0.9 2.6
3.4
3.4
7.0
9.0
9.6
2.1
2.7
2.9
29.1
31.7
32.4
0.9
1.2
0 50
2007
2010
2020
■ Research ■ Supply ■ Production ■ Wholesaler ■ Installation
Total jobs/MW
■ Entire Value Chain
47.9
49.6
41.8
Figure 7FORECASTED CUMULATIVE JOB YEARS CREATED DURING THE CONSTRUCTION PHASE IN WIND AND SOLAR PV BETWEEN THE YEAR 2018 AND 2030
Cum
ulat
ive
job
yea
rs, 2
018
-20
30(t
hous
and
s)
800
700
600
500
400
300
200
100
0
IRP 2016 IRP 2018 CSIR_LC
■ PV ■ Wind
Table 5JOB CREATION FROM SEVERAL RENEWABLE ENERGY TECHNOLOGIES
TechnologyEmployment per MW Average employment over life of the
facility
CIM (FTE jobs/MW)
O&M (FTE jobs/MW)
CIM (FTE jobs/MWa)
O&M (FTE jobs/MWa)
2001
Solar PV 30.0-32.3 0.25-1.0 5.76-6.21 1.2-4.8
Wind power 2.57-3.8 0.1-0.29 0.29-0.43 0.27-0.83
Biomass 4.29-8.5 0.04-1.53 0.13-0.4 0.38-1.8
Coal 8.5 0.18 0.27 0.74
2006
Solar PV 32.34-37.0 0.37-1.0 6.47-7.40 1.85-5.0
Wind Power 3.80-10.96 0.14-0.18 0.43-1.25 0.41-0.50
Solar Thermal 4.55 0.38 0.45 0.95
XX
XX
XX
2322
REFERENCES
[1] International Renewable Energy Agency (IRENA), Renewable Energy Statistics 2020. 2020.
[2] Oneworld, “Skills for Green Jobs: South Africa, An Updated Country Report,” 2017.
[3] J. Maia et al., “Green Jobs - An estimate of direct employment potential of a greening South African economy,” 2011.
[4] ILO, “ILO Glossary of Statistical Terms Administrative records,” no. c.
[5] S. M. Matamoros, “Executive Office of the President,” no. May, pp. 1–6, 2014.
[6] R. Bacon and M. Kojima, “Issues in Estimating the Employment Generated by Energy Sector Activities,” ACCOUNTING, 2011.
[7] IPP Office, “Independent Power Producers Procurement Programme (IPPPP) An Overview,” Annual Report., no. March, p. 70, 2019.
[8] M. Wei, S. Patadia, and D. M. Kammen, “Putting renewables and energy efficiency to work: How many jobs can the clean energy industry generate in the US?,” Energy Policy, 2010, doi: 10.1016/j.enpol.2009.10.044.
[9] D. Keyser, F. Flores-espino, C. Uriarte, and S. Cox, “Enhancing Capacity for Low Emission Development Strategies User Guide for the International Jobs and Economic Development,” no. September, 2016, [Online]. Available: http://www.nrel.gov/docs/fy16osti/67036.pdf.
[10] IRENA, “Renewable Energy and Jobs - Annual Review 2019, by the International Renewable Energy Agency,” 2019.
[11] IRENA, “Renewable Energy and Jobs - Annual Review 2018, by the International Renewable Energy Agency,” 2018. doi: 10.1158/1078-0432.CCR-16-2586.
[12] E. Llera, S. Scarpellini, and A. Aranda, “Forecasting job creation from renewable energy deployment through a value-chain approach,” Renew. Sustain. Energy Rev., vol. 21, pp. 262–271, 2013, doi: 10.1016/j.rser.2012.12.053.
[13] T. M. Sooriyaarachchi, I. T. Tsai, and S. El Khatib, “Job creation potentials and skill requirements in, PV, CSP, wind, water-to-energy and energy efficiency value chains,” Renew. Sustain. Energy Rev., vol. 52, pp. 653–668, 2015, doi: 10.1016/j.rser.2015.07.143.
[14] R. Pollin, H. Garrett-Peltier, J. Heintz, and H. Scharber, “‘Green Recovery: a program to create good jobs and start building a low-carbon economy,’” Cent. Am. Prog., vol. 1, pp. 1–36, 2008.
[15] S. John, “Report: Investment in off-grid energy access totals $1.7B through 2018,” 2019.
[16] Gogla, “Off-Grid Solar .,” 2018.
[17] E. Foehringer Merchant, “Trump Admin Announces 25% Tariff on Chinese Inverters,” Sep. 2018.
[18] M. Mate, “The WTO And Development Policy Space In India,” Draft 45, 2019.
[19] “Photovoltaic Electricity: The localisation potential of Photovoltaics and a strategy to support the large scale roll-out in South Africa,” Pretoria, 2017. [Online]. Available: https://bit.ly/3vKQPXG
[20] Institute for advanced sustainability studies (IASS), Council for Scientific and Industrial Research (CSIR), and Energy Reseach Center (ERC), “Future skills and job creation through renewable energy in South Africa,” 2019. [Online]. Available: https://www.cobenefits.info/our-work/where-we-work/south-africa/.
Figure 8FORECASTED EVOLUTION OF NET EMPLOYMENT IN THE POWER SECTOR BY THE DIFFERENT TECHNOLOGIES (DIRECT JOBS)
2020
2025
2030
2035
204
0
204
5
2050
Tota
l net
em
plo
ymen
t (t
hous
and
s)
160
140
120
100
80
40
20
0
■ Other ■ Wind ■ Solar PV ■ Nuclear ■ Coal
IRP 2015 IRP 2018 CSIR0_LC DEA_RD
60
2020
2025
2030
2035
204
0
204
5
2050
2020
2025
2030
2035
204
0
204
5
2050
2020
2025
2030
2035
204
0
204
5
2050
XX
2524

FORENSICS SCENARIO ANALYSIS

TABLE OF CONTENTS1. Introduction ..................................................................................................................................................................................................................31
2. Methodology ................................................................................................................................................................................................................312.1. Overview.................................................................................................................................................................................................................312.2. Identification Of Preferred Metric .............................................................................................................................................................312.3. Contact List Construction And Sorting ..................................................................................................................................................312.4. Data Collection And Calculation Of Metrics .......................................................................................................................................322.5. Scenario Forecasting Utilising Real Job Number Calculated Metrics .....................................................................................32
3. Local Solar PV Jobs Survey ................................................................................................................................................................................343.1. Survey Stratification ........................................................................................................................................................................................343.2. Survey Responses ...........................................................................................................................................................................................343.3. Survey Results ..................................................................................................................................................................................................34
4. Scenario Configuration and Assumed Solar PV Capacities .................................................................................................................35
5. Scenario Job Analysis Results ............................................................................................................................................................................355.1. General ...................................................................................................................................................................................................................355.2. Base Case Scenario .........................................................................................................................................................................................355.3. IRP 2019 Scenario ............................................................................................................................................................................................355.4. Accelerated Scenario .....................................................................................................................................................................................365.5. High Road Scenario ........................................................................................................................................................................................365.6. O&M And Construction Jobs......................................................................................................................................................................36
6. Validation of Study Results ..................................................................................................................................................................................376.1. General ...................................................................................................................................................................................................................376.2. REI4P Job Statistics ........................................................................................................................................................................................376.3. I-Jedi Model Projections ...............................................................................................................................................................................376.4. International Benchmarks ............................................................................................................................................................................37
7. Summary and Conclusion .....................................................................................................................................................................................38
Figures and Tables ..........................................................................................................................................................................................................40
8. References ....................................................................................................................................................................................................................47
Annexure A1 .......................................................................................................................................................................................................................48A1.1: Questionnaires ................................................................................................................................................................................................48A1.2: Job Number Tables ......................................................................................................................................................................................50
LIST OF TABLESTable 1: Survey company categories ........................................................................................................................................................................41Table 2: Survey sample size and response rate ..................................................................................................................................................41Table 3: Survey results per value chain category ...............................................................................................................................................41Table 4: Value chain category job intensity in FTE jobs/MW (2 years average for 2018 and 2019) ....................................... 42Table 5: Installed Capacities (Utility scale) in MW by scenario ................................................................................................................. 42Table 6: Installed Capacities (Embedded scale) by scenario .....................................................................................................................43Table 7: IPP value chain segment questionnaire ..............................................................................................................................................48Table 8: Services value chain segment questionnaire ...................................................................................................................................48Table 9: Manufacturers and equipment providers value chain segment questionnaire ................................................................48Table 10: EPC value chain segment questionnaire ..........................................................................................................................................48Table 11: IPP value chain segment questionnaire .............................................................................................................................................48Table 12: Total annual FTE jobs (Base Case) ......................................................................................................................................................49Table 13: Total annual FTE jobs (IRP 2019) .........................................................................................................................................................49Table 14: Total annual FTE jobs (Accelerated Case) .......................................................................................................................................49Table 15: Total annual FTE jobs (High Road) .....................................................................................................................................................49Table 16: O&M annual FTE jobs (Base Case) ......................................................................................................................................................50Table 17: O&M annual FTE jobs (IRP 2019) .........................................................................................................................................................50Table 18: O&M annual FTE jobs (Accelerated Case) .......................................................................................................................................50Table 19: O&M annual FTE jobs (High Road) .....................................................................................................................................................50Table 20: Construction annual FTE jobs (Base Case)......................................................................................................................................51Table 21: Construction annual FTE jobs (IRP 2019) ..........................................................................................................................................51Table 22: Construction annual FTE jobs (Accelerated Case) .......................................................................................................................51Table 23: Construction annual FTE jobs (High road) .......................................................................................................................................51
LIST OF FIGURESFigure 1: Methodology employed to calculate future PV job creation potential using surveyed jobs data ........................40Figure 2: Solar PV value chain utilized to categorise surveyed jobs data ...........................................................................................40Figure 3: Comparison of the jobs per MW in the utility and embedded markets ........................................................................... 42Figure 4: Annual job creation for solar PV between 2011 and 2018 (Base case) ..............................................................................43Figure 5: Annual job creation forecast for solar PV between 2019 and 2030 (IRP 2019) ............................................................44Figure 6: Annual job creation forecast for solar PV between 2019 and 2030 (Accelerated scenario) ..................................44Figure 7: Annual job creation forecast for solar PV between 2011 and 2030 (High road scenario) ........................................45Figure 8: Total FTE jobs created across all scenarios between 2011 and 2030 .................................................................................45Figure 9: Annual construction FTE jobs created across all scenarios between 2011 and 2030 ................................................46Figure 10: Annual O&M FTE jobs created across all scenarios between 2011 and 2030 ..............................................................46Figure 11: Solar PV direct and indirect job creation potential between 2019 and 2030 based
on I-JEDI modelling (CSIR Analysis) ...................................................................................................................................................................47

LIST OF ABBREVIATIONSCSIR Council for Scientific and Industrial Research
DEFF Department of Environmental Affairs,
Fisheries and Forestry
DMRE Department of Minerals, Resources and Energy
EPC Engineering Procurement and Construction
FTE Full Time Equivalent
GW Gigawatt
I-JEDI International Jobs and Economic
Development Impacts
ILO International Labour Organisation
IPPO Independent Power Producers Office
IPPs Independent Power Producers
IRENA International Renewable Energy Agency
MW Megawatt
MWp Megawatt Peak
NREL National Renewable Energy Laboratory
PPA Power Purchase Agreement
PV Photovoltaic
QC Quality Control
REI4P Renewable Energy Independent Power
Producers Procurement Program
RFQ Request for Quotation
SAPVIA South African Photovoltaics Industry Association
SSEG Small-Scale Embedded Generation
1. INTRODUCTION
The Solar PV market is broadly divided in two market segments; utility and embedded markets. The latter spans residential, commercial and industrial applications and is often referred to as small scale embedded generation (SSEG) or embedded captive projects, while the former mostly covers large utility scale ground mounted installations.
An important consideration in the planning and implementation of Solar PV is an understanding of the economic and job creation impact.
The objective of the study is to provide a quantified analysis of the existing and future job creation impacts of Solar PV in South Africa. This includes a comprehensive audit of jobs in the South African PV sector, including both the utility and the embedded markets.
The surveyed data has been analysed and converted to metrics as have been used to forecast the past and future job creation in the Solar PV value chain.
This report includes:
n Overview of the methodology employed in collecting, aggregating, and forecasting the jobs in the South African Solar PV sector.
n Overview and analysis of the jobs data collected during the survey of local companies working in the Solar PV value chain.
n Overview of the modelling inputs used in the forecasting of future jobs in the Solar PV sector as informed by four scenarios for the deployment of Solar PV in South Africa.
n The results of the forecasting of future job creation potential as informed by the job intensity results from the market survey and future deployment scenarios.
n Sense checking of the forecasted results as per comparison of the results with jobs numbers previously reported by the Independent Power Producer Office (IPPO) and results obtained from an input-output economic modeling tool.
n Conclusions on the results and key observations
2. METHODOLOGY
2.1. OVERVIEW
The methodology applied to calculate the existing and future jobs across the Solar PV sector in South Africa is summarised in Figure 1.
2.2. IDENTIFICATION OF PREFERRED METRIC
The literature review completed as part of the overarching study investigated international approaches for collecting and reporting PV sector jobs data[1]. Gaps identified in these approaches include a lack of standardised metrics, difficulties in comparing job numbers across technologies, and difficulties in distinguishing between construction and O&M jobs. Furthermore, it was identified that Full-Time Equivalent (FTE)1 is the metric most commonly used internationally when reporting job numbers. Considering the abovementioned aspects identified in the literature review, and after review of options and alternatives, for the purposes of this study the chosen metric was determined as FTE jobs/MW/annum as a basis for estimating historical and future job creation in the deployment of Solar PV in South Africa. This approach is aligned with international best practice and provides a basis for the calculation and comparison on jobs in a quantifiable manner.
2.3. CONTACT LIST CONSTRUCTION AND SORTING
The application of the methodology requires the calculation of the job intensity (jobs per MW of Solar PV installed) of the local Solar PV sector in South Africa. That requires a suitably detailed understanding of the local Solar PV value chain and the local jobs that have been created in constructing and maintaining the presently installed Solar PV capacity in the country. Given the relative infancy of the Solar PV sector in South Africa, detailed reporting and breakdown of the job creation and economic impacts of the sector are not yet uniformly available. To determine the present job intensity of the Solar PV sector, a detailed survey of local companies was required. This necessitated the creation of a contact list database containing the details of the local companies working in portions of the Solar PV value chain.
Close to 1 000 company contact details (linked to the PV value chain) were collected to develop the contact database which enabled the collecting of historical
1 According to the International Labour Organisation’s (ILO) definition [1], a full-time equivalent (FTE) job, “is a unit to measure employed persons in a way that makes them comparable although they may work a different number of hours per week”. The FTE unit is obtained by comparing an employee's average number of hours worked to the average number of hours of a full-time worker.
31

jobs data numbers in the Solar PV sector. These companies were searched and sorted across a defined Solar PV value chain as summarised in Figure 2. The data collected across this value chain was aggregated to calculate the jobs per MW metrics for the defined elements of the Solar PV value chain that would then enable the calculation of the South African Solar PV sector job intensity values for both the utility and embedded markets.
Further details on the value chain categories applied in the decomposition of the contact database is provided in Section 3.1.
2.4. DATA COLLECTION AND CALCULATION OF METRICS
All the companies in the contact database were then surveyed to collect jobs utilising a standardised questionnaire that collected key information pertaining to:
n Number of permanent employeesn Number of contract employeesn Installed capacity in MW per annumn Number of projects in specified yearn Type of service or manufacturing provided
Annexure A contains the questionnaire applied in collecting the jobs data across the Solar PV value chain in South Africa. Data was collected for 2018 and 2019. The collection of jobs data prior to 2018 was not possible for the purposes of this study as initial application of the survey confirmed that many companies could not readily supply job numbers for earlier years.
The surveyed job numbers were collated and applied to calculate job/MW metrics for each category of the local Solar PV value chain for the years 2018 and 2019. A consolidated FTE jobs/MW metric was then calculated for application in the forecasting analysis to estimate the predicted job creation as dependent on the installed capacities to date and scenarios for the future further addition of Solar PV in the South African power system.
The metrics themselves are a combination of permanent and contract workers employed for a full year in 2018 and 2019. Where employees had been employed for a shorter period than 1 year, the metric was converted to a FTE based on the duration of temporary employment. It is important to note that very few respondents indicated contract workers employed for less than a full year between 2018 and 2019.
2.5. SCENARIO FORECASTING UTILISING REAL JOB NUMBER CALCULATED METRICS
The outcome of the Solar PV market survey provides an understanding of the local job intensity in the construction, installation, manufacturing, and operation of Solar PV facilities. To then calculate the total number of jobs that have historically been created in South Africa and estimate the future job creation potential, it is necessary to understand the historical and future installed capacities of the technology. This requires an understanding of the existing Solar PV installation base and a prediction of the possible or likely levels of future deployment. Given the uncertainties in the installed base (both present and future) a scenario-based approach was followed. Four key scenarios have been developed.
Annual job numbers are calculated by multiplying the annual installed capacities with the job intensity metrics developed via the survey. The calculated job numbers are split between the construction and O&M phases by applying the split outcomes obtained from I-JEDI modelling tool of 97% to 3% respectively, as is aligned with international metrics and experience. This was applied as follows:
n Annual O&M jobs additions (due to new installations) were cumulatively added to calculate the number of O&M jobs in each year. This illustrates how O&M jobs are sustained and grown through the cumulative growth in the total installed base. O&M jobs are there for sustained over the lifetime of the plant while construction jobs are assumed to exists only in the year in which the construction takes place.
n Annual construction jobs were calculated in each year based on the new capacity installed in each year. This illustrates how construction jobs change as linked to the specific capacities installed in particular years.
n The total jobs in each year is the sum of the annual O&M jobs and annual construction jobs.
Note: All jobs in these calculations are FTEs representing the estimated annual employment opportunities created and sustained across the Solar PV value chain in South Africa.
Forecasting of job creation potential was completed across 4 different scenarios. The base case scenario takes a historical view of the number of jobs created based on verifiable installed capacities. The IRP 2019 and accelerated scenarios take a future view only without considering historical installation to unpack the next 10 years of Solar PV development’s job creation potential.
The high road scenario provides the best possible development of Solar PV considering historical figures based on import data as well as the elements of the accelerated scenario. Further details on the assumptions informing the installed capacities applied in each of the forecasted scenarios is provided below.
BASE CASE SCENARIO (HISTORICAL VIEW BASED ON CSIR ANALYSIS)
This scenario is a representation of the historical number of MWs of Solar PV installed to date for both utility and embedded generation until 2018. These figures are the existing installed capacity assumptions broadly applied in CSIR energy modelling studies and has no relation to the published IRP document in any way. Source documents utilized to obtain the installed capacity figures include:
n CSIR Analysis of IPP procurement announcements[2]
n CSIR analysis of the Eskom medium term adequacy outlook 2019[3]
IRP SCENARIO (FORECASTED SCENARIO ONLY)
This scenario is based on the Integrated Resource Plan’s Policy Adjusted scenario as gazetted by the Department of Mineral Resources and Energy (DMRE) in 2019[4].
This scenario was used to estimate the future job creation potential up to 2030 for both utility and embedded generation scales based on installed Solar PV capacities included in that plan. The current generation gap of 2 500 MW is assumed to be developed by the embedded scale between 2019 to 2022 with 625 MW of embedded Solar capacity added in each year over this time period.
ACCELERATED SCENARIO (FORECASTED SCENARIO ONLY)
The Solar PV deployment in the IRP2019 may underestimate the possible Solar PV deployment in South Africa as may require accelerated deployment to support increased decarbonisation of the power system and the accelerated retiring of aging and poor performing coal-fired power stations. This scenario is informed by the “modest renewable energy industrialisation” [5] scenario developed by the CSIR using the same modelling methodology, assumptions and tools as the DMRE IRP2019 but with the removal of specific constraints and the application of further boundary conditions as reflects an accelerated decarbonisation of the power system as compared to the IRP2019.
The scenario developed by the CSIR results in increased installation levels of renewable energy (including Solar PV) as associated with more progressive decarbonisation and cost reduction objectives.
HIGH ROAD SCENARIO (HISTORICAL AND FORECASTED SCENARIO)
The SSEG data applied in the “Base case” scenario is likely to underestimate the actual presently installed embedded Solar PV capacity given the uncertainty in actual installation levels due to the lack of registration of these facilities and an associated consolidated national view.
This scenario applies Solar PV import data obtained from Quantec [6] and adjusts the estimated installed capacity of existing Solar PV installations. Quantec is a paid for data platform that consolidates South African economic and socio-economic data from different government entities such as StatSA, and the South African Revenue Service (SARS).
The import data for PV modules into South Africa (as obtained from SARS source documents captured in Quantec) was applied to calculate the estimated total Solar PV capacity that could have been installed in South Africa assuming that all panels have been installed locally. Import data obtained from Quantec was quoted in annual rand value which were then converted to MW by utilising specific Rand/Watt figures provided by industry experts at SAPVIA.
Utility scale projects completed are then subtracted from the overarching figure leaving an assumed figure of embedded generation.
The utility scale projects are assumed to increase slightly as per the Renewable Energy Independent Power Producer Procurement Programme (REI4P) bid windows constructed in 2018/2019.
The difference between the estimated total Solar PV capacity (based on total panel imports) and REI4P utility scale capacities is then the assumed embedded market capacities in South Africa.
The adjusted as-is installation base assumptions are combined with the same forward looking “modest renewable energy industrialisation” [5] scenario applied in the “accelerated scenario” to provide this “high road scenario” that may be more reflective of the present and future Solar PV capacities in South Africa.
3332

3. LOCAL SOLAR PV JOBS SURVEY
3.1. SURVEY STRATIFICATION
Close to 1 000 company contact details (linked to the PV value chain) were collected to develop the contact database. The data collected through the creation of the contact database indicates that active participation in this sector commenced from the year 2010.
Delays in conclusion of the IPPs power purchase agreements (PPA) beyond bid window 3 have had a clear impact on the number of jobs created by the Solar PV industry. The phasing of bid window contracts awarded is as follows:
n 2012 bid window 1n 2013 (bid window 2 and 3) n 2018 (bid window 3.5 and 4)
It is assumed that there would be a delay from the date of bid window awarding to construction starting. The substantial delay in procurement between 2013 and 2018 resulted in uncertainty in the Solar PV sector. Several companies did not remain in business in the period between 2013 and 2018. Therefore, the survey of jobs in the sector was focused on the years 2018 and 2019, whereby active companies could supply jobs data as can be used to estimate job intensity (jobs per MW) and thereby calculate total jobs.
The survey responses were classified into categories according to the different roles the companies perform in the value chain, as include: IPPs, Services, Manufacturers and Equipment Providers, EPC Utility, EPC Commercial and Industry (C&I) and SSEGs as summarised in Table 1. The categorisation was applied in a manner whereby the contribution to each of the embedded and utility market segments can be assessed which in turn supported the calculation of a jobs intensity metric for each of these market segments.
3.2. SURVEY RESPONSES
Table 2 summarises the survey sample and response rate across the different categories. The overall survey response rate was 11,4%, whereby, of the 936 companies contacted, 107 companies completed the survey. This response rate aligns with industry norms for such surveys and is considered adequate for the purposes of this analysis.
The EPC C&I category has the highest response rate of 23%, followed by IPP at 13%. The EPC Utility has the lowest response rate at 1% (with only one company out of 101, responding) as reflects a lack of willingness to share information that may be perceived to be of a commercially sensitive and competitive nature.
3.3. SURVEY RESULTS
The survey results across the value chain categories (for the years 2018 and 2019) are summarised in Table 3. Each sub-category adds to the overall value chain with additional jobs and performing unique services to build and operate the same installed capacity.
The following key observations can be noted in the changes in the surveyed data between 2018 and 2019:
n IPP project companies contributed the largest proportion to the overall Solar PV employment and employment levels did not significantly change between 2018 and 2019. Most of the jobs in this category are permanent.
n Miscellaneous services such as training recruitment and facility management contributed the largest proportion to the overall services employment and did not significantly change between 2018 and 2019. Most of the jobs in this category are permanent jobs, with an increase in the proportion of permanent vs contract jobs between 2018 and 2019.
n Panel assembly and manufacture contributed the largest proportion to overall manufacturing job creation and increased between 2018 and 2019. Most of the jobs in this category are permanent jobs.
n EPC Utility contract job creation substantially increased in 2019 with a large increase in contract jobs as would logically be linked to utility scale project construction activities.
n EPC C&I job creation substantially increased in 2019 with increases in both the permanent and contract jobs. Most of the jobs in this category are contract jobs.
n The number of jobs created in the SSEG value chain segment appears low when compared to other value chain segments but relates to only 6 and 16 MWs of installed capacity. There has been a substantial increase in both permanent and contract jobs.
Given the survey response rate, the absolute numbers collected only reflect the jobs in a sub-set of companies working in the Solar PV sector. To apply these survey results to a South African level calculation of total jobs, the survey results were translated into the job intensity values for both permanent and contract jobs for each of the categories as summarised in Table 4.
Figure 3 summarises the number of FTE jobs per MW for the different value chain categories as split between the utility and embedded scale installations. The category that has the highest jobs per MW is SSEG,
contributing 18 FTE jobs/MW. This is followed by EPC C&I with 11 FTE jobs/MW. The IPP category had the lowest jobs per MW. Figure 3 further illustrates that the embedded market creates more than twice the number of FTE jobs per MW installed as compared to the utility scale market. This confirms the opportunity for job creation in the SSEG market.
4. SCENARIO CONFIGURATION AND ASSUMED SOLAR PV CAPACITIES
As described in section 2, the quantification of historical and future jobs creation potential in the South African Solar PV industry requires input assumptions for the amount of Solar PV capacity installed and to which South Africa job intensity metrics can be applied. The specific assumptions applied in determining the installation capacities are described in section 2.5.
Table 5 indicates the annual Solar PV installed capacity added to the grid historically and capacity that will be added over the next 10 years on a utility scale. Furthermore, a substantial drop in installed capacity can be observed in 2015 due to a gap in procurement and a lack of signed PPAs in both the base case and high road scenarios.
Table 6 summarises the annual installed capacity added to the grid historically and capacity that will be added over the next 10 years on an embedded scale. Please note that for the base case scenario that no installed capacities are listed in 2019 as there was no reliable information that could reference the correct amount of MWs installed in this year. It is assumed that all embedded generation stipulated in the IRP relates to Solar PV. Embedded generation installation figures were split between C&I and Residential market segments based on a 82%/18% assumption which was based on verifiable data in the base case scenario.
5. SCENARIO JOB ANALYSIS RESULTS
5.1. GENERAL
Multiplying the installed annual capacities (section 4) with the job intensity metrics calculated from the survey data (section 3.3) provides an estimate of the number of construction and O&M jobs created across the Solar PV value chain in the evaluation period. It is important to note that O&M jobs make up roughly 3% of new employment opportunities (based on an I-JEDI modelling assumptions) but has a cumulative effect as those jobs are sustained across the entire modelling time frame and increase with every new annual installation. Results are presented for each of the scenarios evaluated.
5.2. BASE CASE SCENARIO
The number of construction and O&M jobs created across the Solar PV value chain between 2011 and 2018 for the base case scenario are as summarised in Figure 4.
Job creation in the PV sector was in its infancy during 2011 and 2012 with rapid acceleration in the number of jobs created in 2013 and 2014 due to the construction of PV plants as part of the REI4P. The delays in signing further IPPs in 2015 resulted in a decrease of more than 9 000 jobs in the PV sector (a decrease of 70.75% year on year). The job losses were primarily incurred in the IPP, EPC Utility and manufacturing value chain segments with SSEG increasing in the same year as many companies explored options in the embedded market.
Job creation increased again in 2016 as further utility scale projects were constructed. This shows the resilience of the PV sector and its ability to scale up job creation quickly when demand for PV is stimulated. The base case scenario is limited in 2017 and 2018 as no sourced reference could be found for utility scale generation addition.
The figures for these years represent an extremely conservative estimate of utility scale new generation addition and the embedded market but further assumptions are made in the high road scenario to test the implications of increased utility and embedded market installation in this period.
5.3. IRP 2019 SCENARIO
The number of construction and O&M jobs forecasted to be created across the Solar PV value chain between 2019 and 2030 for the IRP 2019 scenario are as summarised in Figure 5.
The Solar PV sector’s contribution to power sector employment is expected to grow steadily until a peak of 38 758 FTE jobs is reached in 2022. This peak in job creation potential relates to 2 025 MW of new installed PV capacity. Significant job losses are expected in 2024, 2026 and 2027 due to no planed procurement of utility scale projects in these years (as per the IRP 2019).
These jobs losses are expected to exceed 15 000 FTE jobs when compared to 2025, a decrease of 50.6%. The bulk of these job losses are incurred in the EPC utility value chain segment. The forecast quantifies the importance of a consistent build out plan for new Solar PV generation capacity for sustained job creation as large reductions in new build capacity build in future years will result in job losses. The results furthermore raise the qualitative risk that such changes are likely to
3534
lead to instability in the sector and inhibit the ability of the sector to ramp up when new installation capacity increases in future years. Construction jobs are the backbone of job creation potential for the Solar PV industry in the short to medium term, with O&M jobs growing in the longer term as cumulative installed capacities grow.
The impact of the SSEG market and increased O&M jobs effects can be seen in 2026 and 2027 as no new utility scale capacity is planned for these years.
5.4. ACCELERATED SCENARIO
The number of construction and O&M jobs forecasted to be created across the Solar PV value chain between 2019 and 2030 for the accelerated scenario are as summarised in Figure 6.
In this scenario there is a constant build of new utility scale Solar PV with no years of zero capacity addition as compared with the IRP 2019 scenario. As such a consistent increase to power sector employment can be observed by the Solar PV sector beyond 2023. There is a substantial loss in the number of jobs (38%) from 2022 to 2023 which is due to the deployment of 1 450 MW of embedded capacity in 2022, dropping to 500 MW in 2023.
The large embedded generation capacity addition in 2022 is due to the assumption applied in this scenario that the current gap in capacity of the South African power system will be partly offset via the embedded market for Solar PV given the fast deployment timelines of this technology.
A cumulative addition of O&M jobs can be observed between 2023-2030 as there is a consistent procurement of 1500 MWs each year, and the O&M jobs cumulatively increase with total installed capacity. This is seen by a linear increase in total jobs between 2023 and 2030 while the same annual amounts of new capacity are installed each year. See section 5.6 for further analysis of the O&M jobs.
5.5. HIGH ROAD SCENARIO
The number of construction and O&M jobs forecasted to be created across the Solar PV value chain between 2011 and 2030 for the high road scenario are as summarised in Figure 7.
In this high road scenario, the application of the solar panel import data obtained from Quantec slightly increases the installed capacity of the embedded Solar PV market as compared to the base case scenario. This in turn slightly increases the overall number of annual jobs created between 2011 and 2018 as compared to
the results of the base case scenario. The import data further adds to the embedded generation capacity in 2019 which is then supplemented with the accelerated scenario case for utility scale capacity addition. These modified assumptions result in the creation of 48 756 FTE jobs in 2019.
Furthermore, by 2022 the total jobs are forecasted to increase to 53422 as the embedded market for Solar PV deploys to fill the capacity gap in the South African power sector and further utility scale Solar PV is constructed. The cumulative addition of O&M jobs can again be observed between 2023-2030 as there is a consistent procurement of 1500 MWs each year and the O&M jobs grow with the cumulative increase in Solar PV capacity.
5.6. O&M AND CONSTRUCTION JOBS
The creation of O&M jobs over time is critically important to the long-term sustainability of the solar PV sector. O&M jobs make up roughly 3% of new employment opportunities (based on an I-JEDI modelling assumption) but has a cumulative effect as those jobs are sustained across the entire modelling time frame and increase with every new annual installation. This section unpacks the annual job creation potential across construction and O&M project phases.
Figure 8 illustrates the total job creation for all scenarios analysed. These figures include construction and O&M jobs created in each modelling time frame. It is evident that the high road scenario creates the most FTE jobs when compared to the IRP 2019 and accelerated scenarios. The high road scenario has also created more jobs opportunities in the past due to higher levels if installed capacity assumed.
Figure 9 illustrates the annual constructing jobs created year on year between 2011 and 2030. When comparing Figure 8 and Figure 9 it can be seen that the Solar PV industry is heavily dependent on construction jobs between 2011 and 2022 after which O&M jobs start to play a larger role in total job creation due to the cumulative summation of these jobs over time. Gaps in procurement and their associated effect on annual job creation can be observed for the IRP 2019 scenario in the years 2024,2026 and 2027.
The cumulative addition of O&M jobs over time can be observed in Figure 10 across all scenarios. The creation of new O&M jobs every year adds to existing O&M jobs created in previous years which contributes to the long-term stability of the industry. Gaps in procurement of new installed capacity of Solar PV will not hinder O&M jobs in the same manner as construction jobs as they are sustaining existing capacity procured in previous years.
6. VALIDATION OF STUDY RESULTS
6.1. GENERAL
The comparison of the study results with other data sources, studies and models is an important check to validate the results and increase the credibility thereof.
6.2. REI4P JOB STATISTICS
The South African IPP Office provides a reliable source of the number of jobs created by the REI4P. Unfortunately, the IPP office does not aggregate results down to a job per technology level but rather only provides the number of jobs created by the entire programme. Nevertheless, this will still provide a comparison of the extent to which the job creation estimated in this study relates to the job numbers reported by the IPP office for the utility scale market.
According to the IPP Office Q4 Report (2016/2017) the REI4P programme had created 31 207 total job years for South African citizens during construction and operations [7]. Note that this total jobs figure includes the jobs created for the entire REI4P programme (onshore wind, concentrated solar thermal, solar PV, biomass solid, biogas, landfill gas and small hydro) and not only the Solar PV value chain.
The reported figures for the REI4P programme has no obvious disconnect with the calculated job numbers obtained from the audit conducted. The results of this study estimates that as of 2017 a total of 8 636 FTE jobs were created by the Solar PV value chain (base case scenario). It is expected that the jobs audit number will be lower than the IPP office number as the latter relates to all renewable technologies on a utility scale while the jobs audit conducted only relates to the solar PV value chain. A more detailed comparison of numbers is not possible given the lack of stratification of the published IPP Office numbers.
6.3. I-JEDI MODEL PROJECTIONS
The CSIR completed a comprehensive modelling exercise of the IRP 2019 with the aim to quantify the number of jobs that will be created by the entire power sector through the implementation of the IRP 2019 as using the I-JEDI model. I-JEDI has the capability of quantifying positive and negative impacts associated with the deployment and decommissioning of different power generation technologies. The model is customised using country specific data on regional installation costs, regional average annual salaries per industry and regional social accounting matrix. The model requires input data on the project size in megawatts (MW) and the percentage of labour and materials sourced locally. The model outputs include
the number of jobs, the earnings, the economic output as well as GDP contribution.
Figure 11 shows general alignment with the jobs data forecasting results shown in Figure 5. The figures between 2022 and 2027 are within 2% - 15% of one another across overlapping years which is a positive sign of the methodology used on the surveyed data forecasting. Differences are higher for years 2019-2021 and 2028-2030 due to minor differences in installations capacity assumption and modelling methodologies. The CSIR phased back constructing jobs of Solar PV in future years (2031-2033) which affected annual job creation between 2028 and 2030 in their I-JEDI methodology.
The scale of procurement to fil the generation gap identified in the IRP 2019 document was filled in different ways through the 2 modelling methodologies. The scenario forecasting of the IRP 2019 using the data collected provided a job number of 38 758 in 2022 compared to 34 776 in the I-JEDI modelling exercise. The gap in procurement of Solar PV (2024,2026 and 2027) and the associated loss of jobs created aligns well with the results of the forecasting analysis completed in section 5.3.
The validation completed in the section above indicates that the methodology employed in this study aligns well with other sources that speak to Solar PV job creation in South Africa.
6.4. INTERNATIONAL BENCHMARKS
The literature review completed as part of this overarching study reference various international reports that outline forecasting methodologies and reporting metrics when considering Solar PV job creation potential. While these methodologies do not align completely with the methodology employed in this study, some general alignments can be observed.
These alignments include:
THE UNIVERSITY OF ZARAGOZA (FORECASTING JOB CREATION OF A 1MWP FACILITY)
A similar methodology was developed by the University of Zaragoza to determine future job creation using job intensity metrics but limited the value chain to only the technology components and directly associated services[8]. In essence the bulk services sector will be excluded from their study as compared to this study.
The methodology further differs by not distinguishing between utility and embedded scale and focuses on the job creation potential for a typical 1MWp facility.
3736
This study found that an average of 29.46 jobs were created for the construction and operation of this 1 MWp facility. This relates well to SSSEG value chain segment supported by the necessary manufacturing and service segments creating an average of 28 FTE jobs/MW (See Figure 3).
MASDAR INSTITUTE OF SCIENCE AND TECHNOLOGY (JOB CREATION POTENTIALS AND SKILL REQUIREMENTS)
The Masdar Institute of Science and Technology in the United Arab Emirates conducted a similar study to that of the university of Zaragoza with the aim of quantifying job creation potential of RE across their respective value chains[9]. This study builds on the jobs per unit measure of energy principle by conducting interviews and surveys with key industry stakeholders to obtain the required metrics across different technology value chains.
The value chain developed in this study differs from both the University of Zaragoza and CSIR methodologies and again does not split between utility and embedded markets.
As such direct value chain segment cannot be compared as the specific description of each value chain assumed in this study was not defined.
The study found that an average of between 33-39 job years were created for every MWp developed, constructed, and maintained. This again relates well to the 28 FTE jobs/MW (See Figure 3) related to the SSEG value chain segment supported by the necessary manufacturing and services segments.
Considering the above international benchmarks, the results obtained from the study completed by the CSIR relates well to international findings and provides international verification of the methodology used in this study.
7. SUMMARY AND CONCLUSION
The study has estimated the number of jobs that have been created and are forecasted to be created in the South African Solar PV sector for a range of scenarios. The following is summarised as regards to the methodology applied in this study:
n A review of international practices has confirmed that a suitable methodology for the estimation of jobs in the Solar PV sector is via the calculation of FTE jobs as based on job intensity linked to the amount of capacity installed i.e., FTE jobs per MW installed.
n The South African Solar PV value chain was decomposed into categories. A contact database was established of almost 1 000 companies working in the local Solar PV sector. Companies were categorised according to the sector within which they work.
n The companies in the contact database were surveyed to obtain information on both permanent and contract employees. The survey collected data for the 2018 and 2019 years.
n The survey methodology and response rate are acceptable for the purposes of the calculation of job intensity numbers.
n The calculated job intensity numbers resulting from the survey are aligned with international norms.
n The results of the I-JEDI modelling were used as the basis for the ratio between construction and O&M jobs. The methodology applied then calculates construction jobs based on the installed capacities added in each year. The O&M jobs are calculated based on the cumulative total installed capacity in each year.
n Four scenarios of existing and future Solar PV capacity were applied to calculate the estimated jobs in each year using the job intensity values obtained from the survey.
n The results were benchmarked against other data sources and models, verifying that the outcomes are reasonable and credible.
The Solar PV market has played a critical role in power sector employment over the last 9 years and is expected to grow substantially over the next decade across all of the scenario’s analysed in this study. The analysis completed has highlighted several key observations and outcomes:
n The Solar PV industry stakeholders were well captured by constructing a contact database of nearly 1 000 companies and sorting them across a specified value chain.
n The data collected can be viewed as reliable due to an intensive data collection process via email, phone calls and direct interviews. Further validation of the data collected through follow up calls adds to the data’s validity.
n Data gaps in the EPC Utility value chain segment should be filled in future studies by providing companies with a method to provide data to an independent third party that has agreed not to share their information with any stakeholder within the Solar PV value chain
n The job intensity of the SSEG market (39 FTE jobs per MW) is substantially higher than the utility market (17 FTE jobs per MW) as confirms the increased job creation potential of the SSEG market.
n The calculated job intensities reflect the historical market structure and levels of local content. The validation of the study results with the I-JEDI model indicate that increased local content and increasing job intensity have the potential to add substantial further new jobs in the Solar PV sector. Localisation of the manufacturing value chain is hence critical to additional job creation.
n The substantial delay in procurement between 2013 and 2018 resulted in uncertainty in the Solar PV sector. This impacted on both permanent and contract workers, whereby the industry reduced permanent workers and shifted to increased application of contract workers.
n The bulk of jobs created by the Solar PV industry are in project construction, while O&M jobs are created at a much lower rate but grow cumulatively year on year as the total Solar PV installed base increases.
n As based on the results of the IRP 2019 scenario, the Solar PV industry is expected to create between 33 000 and 35 000 FTE jobs between 2028 and 2030, but with considerable variation between years. In years of zero utility scale installation the job numbers are substantively impacted. The forecasted minimum jobs of
14 407 occur in 2024, with no utility scale Solar PV capacity planned in the IRP 2019 in that year. O&M jobs are forecasted to grow to between 6 000 and 8000 by 2030.
n In the accelerated scenario the Solar PV industry is expected to consistently create between 36 000 and 38 000 FTE jobs per year between 2028 and 2030, supporting between 9 000 and 11 000 O&M jobs per year by 2030. The higher annual job figures are attributed to the increased installed capacity of Solar PV, as results in increased construction jobs and increased O&M jobs as compounded by annual cumulative growth in the total installed capacity. The sustained build out of new Solar PV capacity results in sustained and predictable job growth.
n In the high road scenario, the Solar PV industry is expected to consistently create between 38 000 and 40 000 FTE jobs per year between 2028 and 2030, supporting between 11 000 and 13 000 O&M jobs per year by 2030.
The analysis conducted identified key risks and opportunities for the Solar PV market. These include:
n In the long term the Solar PV industry has the potential to create substantial sustained O&M jobs. Job creation in the scaling up of Solar PV until 2030 will continue to be dominated by jobs in the construction of new capacity. Periods of no or low new utility scale Solar PV capacity addition will negatively impact on the sustainability of jobs in the sector.
n The rate of growth of jobs in the Solar PV sector is linked to the localisation of manufacturing and the opportunity to increase the job intensity. Increasing local content (as will increase job intensity) requires a consistent year on year new build of capacity, as is evident from the modelling results. A lack of certainty on new capacity additions in each year is expected to negatively impact on job intensity and total jobs.
n The SSEG market present considerable opportunity for increased job creation, but the ability to achieve such will be dependent on related policy certainty and enabling frameworks. The stimulation of this market presents considerable opportunities for sustained job creation.
n The ability of local Solar PV developers and supply chains to support both the utility scale and embedded SSEG markets will provide agility to move between these markets and sustain jobs in periods where new build capacity in one market may be lower in any particular period of time.
3938

n Literature review learnings
n Available information on how stakeholders collect information
n Adopted metric based on internatiional best practice: FTE jobs/MW/annum
n Create a contact list of close to 1000 companies
n Sort all companies across a specified PV value chain that splits jobs across IPPs, EPC, Services, etc.
n Contact all companies in the database via email, telephone, and interviews to complete jobs data collection surveys
n Capture all data in sheet and calcualte job/MW figure for 2018 and 2019 across entire specified PV value chain
n Create 4 scenarios for the power sector that outlines PV growth based on differing assumptions
n Utilise calculated metrics to forecast future job creation potential based on created scenarios
n Utilise I-JEDI split between construction and O&M jobs to split calculated jobs across project phases
Figure 1METHODOLOGY EMPLOYED TO CALCULATE FUTURE PV JOB CREATION POTENTIAL USING SURVEYED JOBS DATA
Identification of preferred
metric
Contact list construction and sorting
Data collection and calculation of
metrics
Scenario Forecasting utilising real job
number calculated metrics
Figure 2SOLAR PV VALUE CHAIN UTILIZED TO CATEGORISE SURVEYED JOBS DATA
Project companies
IPP companies
Developers
IPPs
Legal
Funding
Logistics
Consultancies
Services
Inverter
Panel
Tracker
Balance of system
Manufacturing/ Equipment Providers
Utility scale
Commercial and Industrial scale
EPC
Residential scale
SSEG
FIGURES AND TABLES Table 1SURVEY COMPANY CATEGORIES
Category Embedded Utility Description
IPP x IPP companies, IPP project companies and developers that all play a role in the development, funding, management, and construction of a solar PV facility
Services x x Funders, legal institutions, logistics companies, consultants, and recruitment and training companies providing essential services to the solar PV industry
Manufacturers x x Manufacturers or assemblers of inverters, PV panels, tracker systems, and other products required in the balance of the PV system
EPC Utility x Engineering, procurement, and construction companies servicing utility scale solar PV projects
EPC C&I x Engineering, procurement, and construction companies servicing commercial and industrial scale solar PV projects
SSEG x Smaller companies developing installing and servicing residential solar PV projects
Table 2SURVEY SAMPLE SIZE AND RESPONSE RATE
Category Number surveyed Number of responses Percentage responses
IPP 116 15 13%
Services 243 29 12%
Manufacturers 91 16 6%
EPC Utility 101 1 1%
EPC C&I 66 15 23%
SSEG 319 31 10%
Table 3SURVEY RESULTS PER VALUE CHAIN CATEGORY
Value chain segments
2018 2019
Installed capacity
Permanent Jobs
Contract Jobs
Installed capacity
Permanent Jobs
Contract Jobs
IPP
IPP project companies 546 341 33 546 373 31
IPP companies 365 96 70 365 108 37
Developers 419 39 40 313 38 37
Services
Legal 52 10 10 52 10 10
Funders 52 23 50 52 46 9
Logistics 52 6 - 52 8 -
Consultants 52 23 50 52 46 9
Miscellaneous 52 61 21 52 64 24
Manufacturers and equipment providers
Inverter - - - 160 14 4
Panel 284 225 162 359 239 147
Tracker 70 53 - 70 53 -
Balance of system 395 203 58 1029 271 160
EPC Utility
EPC Company 75 64 53 75 43 695
EPC C&I
EPC Company 49 190 391 93 268 664
SSEG Residential
SSEG Company 6 69 71 16 107 114
4140

Table 4VALUE CHAIN CATEGORY JOB INTENSITY IN FTE JOBS/MW (2 YEARS AVERAGE FOR 2018 AND 2019)
Category Permanent FTE jobs/MW Contract FTE jobs/MW
IPP 1.0 0.3
Services 4.2 2.5
Manufacturers 2.2 0.8
EPC Utility 0.7 5.0
EPC C&I 3.4 7.6
SSEG 9.0 9.4
Table 5INSTALLED CAPACITIES (UTILITY SCALE) IN MW BY SCENARIO
Scen
ario
Utility scale installed MW2019
2011
2012
2013
2014
2015
2016
2017
2018
2019
2020
2021
2022
2023
2024
2025
2026
2027
2028
2029
2030
Tota
l
Bas
e ca
se
210
750
5 509
- - - 1474
IRP
20
19
114
300
140
0
100
0
100
0
100
0
100
0
100
0
68
14
Acc
eler
ated
159
4
325
423
100
0
100
0
100
0
100
0
100
0
100
0
100
0
100
0
100
0
1134
2
Bes
t ca
se
210
750
5 509
275
275
186
9
325
423
100
0
100
0
100
0
100
0
100
0
100
0
100
0
100
0
100
0
136
41
Figure 3COMPARISON OF THE JOBS PER MW IN THE UTILITY AND EMBEDDED MARKETS
Utility Embedded
FT
E jo
bs
for
MW
40
35
30
25
20
15
10
5
0
1
17
7
3
6
3
7
39
11
18
■ IPP ■ Services ■ Manufacturers ■ EPC Utility ■ EPC C&I ■ SSEG
Solar PV FTE jobs per MW for utilityand embedded scales
Figure 3
Table 6INSTALLED CAPACITIES (EMBEDDED SCALE) BY SCENARIO
Scen
ario
Embedded scale installed MW
2011
2012
2013
2014
2015
2016
2017
2018
2019
2020
2021
2022
2023
2024
2025
2026
2027
2028
2029
2030
Tota
l
Bas
e ca
se
2 2 12 25 132 135 135 140 593
C&
I
2 2 19 19 57 115 115 117 446
Res - - 3 6 75 20 20 23 147
IRP
2019
625 625 625 625 500 500 500 500 500 500 500 500 6500
C&
I
514 514 514 514 411 411 411 411 411 411 411 411 5348
Res 91 91 91 91 73 73 73 73 73 73 73 73 948
Acc
eler
ated
584 775 1150 1450 500 500 500 500 500 500 500 500 7959
C&
I
480 638 946 1193 411 411 411 411 411 411 411 411 6548
Res 104 137 204 257 89 89 89 89 89 89 89 89 1411
Bes
t cas
e
129 129 129 129 129 129 129 713 775 1150 1450 500 500 500 500 500 500 500 500 8991
C&
I
106 106 106 106 106 106 106 587 638 946 1193 411 411 411 411 411 411 411 411 7397
Res 23 23 23 23 23 23 23 126 137 204 257 89 89 89 89 89 89 89 89 1594
Figure 4ANNUAL JOB CREATION FOR SOLAR PV BETWEEN 2011 AND 2018 (BASE CASE)
2011 2012
FT
E jo
bs
14000
12000
10000
8000
6000
4000
2000
041 43
Annual employment opportunities (base scenario)
2013 2014 2015 2016 2017 2018
4013
13302
3891
12125
3907 4121
-70.75%
■ IPP ■ Services ■ Manufacturers ■ EPC Utility ■ EPC C&I ■ SSEG
Figure 4
4342
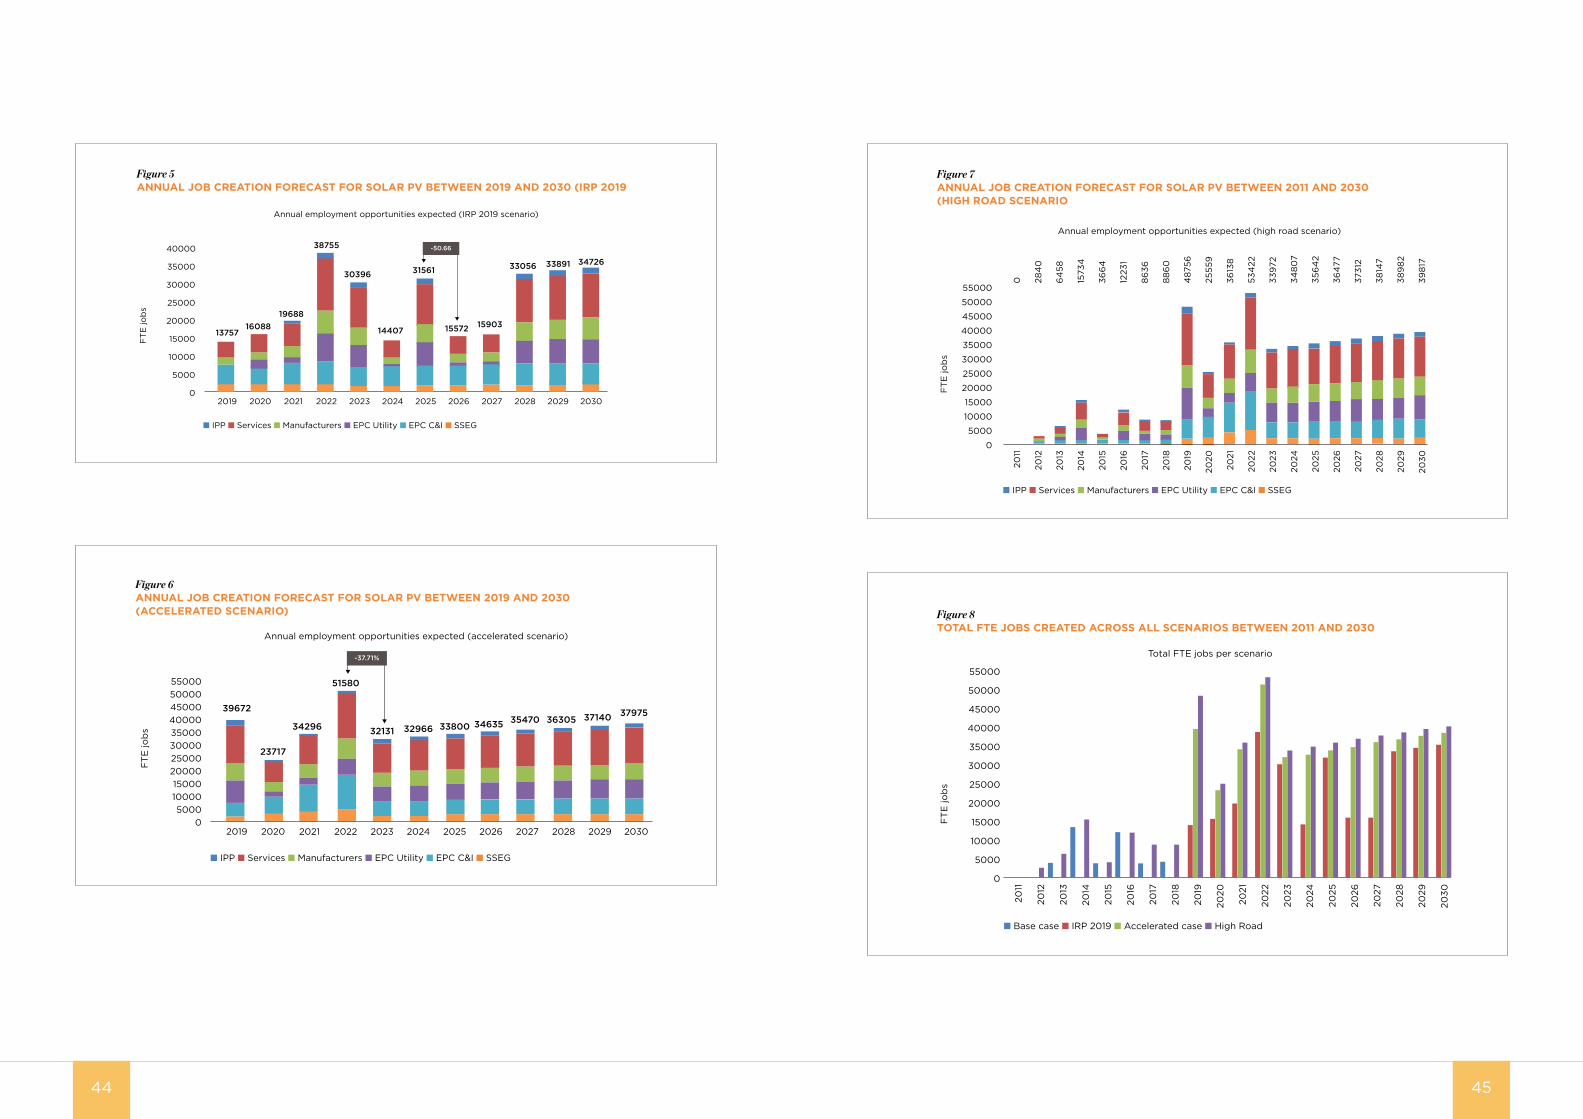
Figure 6ANNUAL JOB CREATION FORECAST FOR SOLAR PV BETWEEN 2019 AND 2030 (ACCELERATED SCENARIO)
2019 2020
FT
E jo
bs 35000
40000450005000055000
30000250002000015000100005000
0
39672
23717
■ IPP ■ Services ■ Manufacturers ■ EPC Utility ■ EPC C&I ■ SSEG
Annual employment opportunities expected (accelerated scenario)
2021 2022 2023 2024 2025 2026 2027 2028 2029 2030
34296
51580
32131 32966 33800 34635
-37.71%
35470 36305 37140 37975
Figure 5ANNUAL JOB CREATION FORECAST FOR SOLAR PV BETWEEN 2019 AND 2030 (IRP 2019
2019 2020
FT
E jo
bs
35000
40000
30000
25000
20000
15000
10000
5000
0
1375716088
■ IPP ■ Services ■ Manufacturers ■ EPC Utility ■ EPC C&I ■ SSEG
Annual employment opportunities expected (IRP 2019 scenario)
2021 2022 2023 2024 2025 2026 2027 2028 2029 2030
19688
38755
30396
14407
31561
15572
-50.66
15903
33056 33891 34726
Figure 5
Figure 6
Figure 8TOTAL FTE JOBS CREATED ACROSS ALL SCENARIOS BETWEEN 2011 AND 2030
2011
FT
E jo
bs
35000
40000
45000
50000
55000
30000
25000
20000
15000
10000
5000
0
■ Base case ■ IRP 2019 ■ Accelerated case ■ High Road
Total FTE jobs per scenario
2016
2015
2014
2013
2012
2029
2028
2027
2026
2025
2030
2024
2023
2022
2021
2020
2019
2018
2017
Figure 7ANNUAL JOB CREATION FORECAST FOR SOLAR PV BETWEEN 2011 AND 2030 (HIGH ROAD SCENARIO
2011
FT
E jo
bs
35000
40000
45000
50000
55000
30000
25000
20000
15000
10000
5000
0
■ IPP ■ Services ■ Manufacturers ■ EPC Utility ■ EPC C&I ■ SSEG
Annual employment opportunities expected (high road scenario)
2016
2015
2014
2013
2012
2029
2028
2027
2026
2025
2030
2024
2023
2022
2021
2020
2019
2018
2017
0 1223
1
366
4
1573
4
64
58
284
0
389
82
3814
7
3731
2
364
77
356
42
398
17
348
07
339
72
534
22
3613
8
2555
9
48
756
88
60
86
36
Figure 7
Figure 8
4544
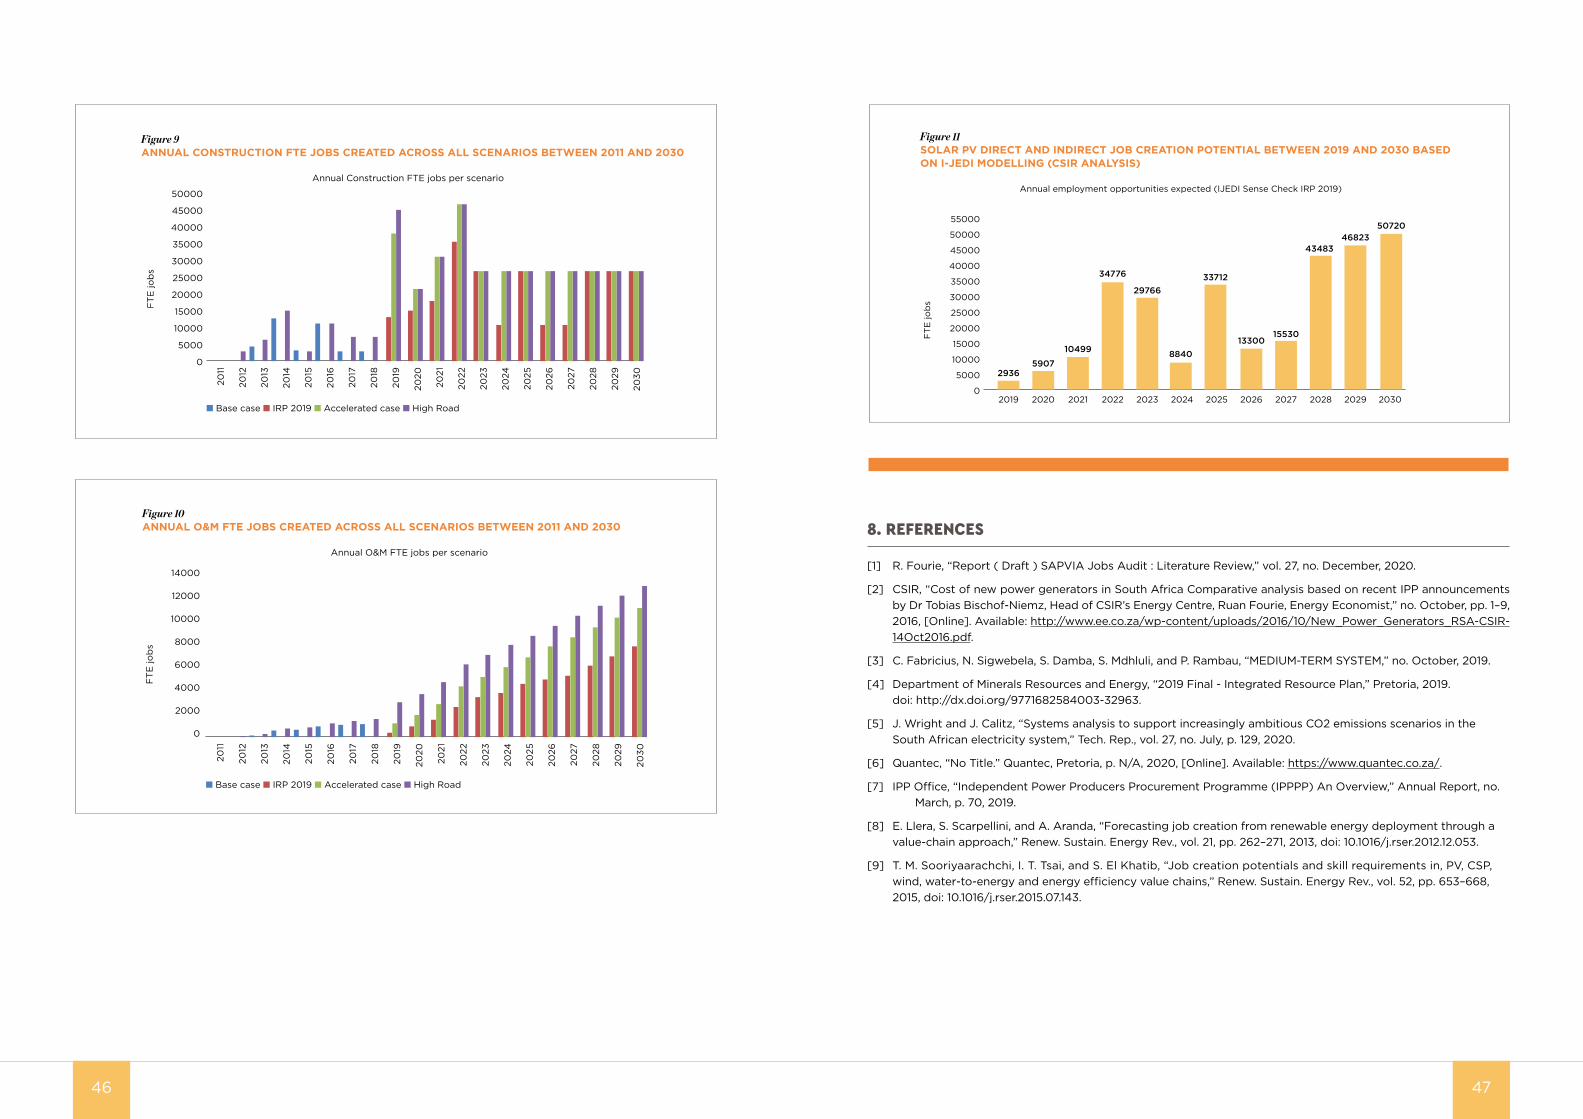
Figure 9
Figure 10
Figure 9ANNUAL CONSTRUCTION FTE JOBS CREATED ACROSS ALL SCENARIOS BETWEEN 2011 AND 2030
2011
FT
E jo
bs
35000
40000
45000
50000
30000
25000
20000
15000
10000
5000
0
■ Base case ■ IRP 2019 ■ Accelerated case ■ High Road
Annual Construction FTE jobs per scenario
2016
2015
2014
2013
2012
2029
2028
2027
2026
2025
2030
2024
2023
2022
2021
2020
2019
2018
2017
Figure 10ANNUAL O&M FTE JOBS CREATED ACROSS ALL SCENARIOS BETWEEN 2011 AND 2030
2011
FT
E jo
bs
■ Base case ■ IRP 2019 ■ Accelerated case ■ High Road
Annual O&M FTE jobs per scenario
2016
2015
2014
2013
2012
2029
2028
2027
2026
2025
2030
2024
2023
2022
2021
2020
2019
2018
2017
14000
12000
10000
8000
6000
4000
2000
0
8. REFERENCES
[1] R. Fourie, “Report ( Draft ) SAPVIA Jobs Audit : Literature Review,” vol. 27, no. December, 2020.
[2] CSIR, “Cost of new power generators in South Africa Comparative analysis based on recent IPP announcements by Dr Tobias Bischof-Niemz, Head of CSIR’s Energy Centre, Ruan Fourie, Energy Economist,” no. October, pp. 1–9, 2016, [Online]. Available: http://www.ee.co.za/wp-content/uploads/2016/10/New_Power_Generators_RSA-CSIR-14Oct2016.pdf.
[3] C. Fabricius, N. Sigwebela, S. Damba, S. Mdhluli, and P. Rambau, “MEDIUM-TERM SYSTEM,” no. October, 2019.
[4] Department of Minerals Resources and Energy, “2019 Final - Integrated Resource Plan,” Pretoria, 2019. doi: http://dx.doi.org/9771682584003-32963.
[5] J. Wright and J. Calitz, “Systems analysis to support increasingly ambitious CO2 emissions scenarios in the South African electricity system,” Tech. Rep., vol. 27, no. July, p. 129, 2020.
[6] Quantec, “No Title.” Quantec, Pretoria, p. N/A, 2020, [Online]. Available: https://www.quantec.co.za/.
[7] IPP Office, “Independent Power Producers Procurement Programme (IPPPP) An Overview,” Annual Report, no. March, p. 70, 2019.
[8] E. Llera, S. Scarpellini, and A. Aranda, “Forecasting job creation from renewable energy deployment through a value-chain approach,” Renew. Sustain. Energy Rev., vol. 21, pp. 262–271, 2013, doi: 10.1016/j.rser.2012.12.053.
[9] T. M. Sooriyaarachchi, I. T. Tsai, and S. El Khatib, “Job creation potentials and skill requirements in, PV, CSP, wind, water-to-energy and energy efficiency value chains,” Renew. Sustain. Energy Rev., vol. 52, pp. 653–668, 2015, doi: 10.1016/j.rser.2015.07.143.
Figure 11SOLAR PV DIRECT AND INDIRECT JOB CREATION POTENTIAL BETWEEN 2019 AND 2030 BASED ON I-JEDI MODELLING (CSIR ANALYSIS)
2019 2020
FT
E jo
bs
35000
40000
45000
50000
55000
30000
25000
20000
15000
10000
5000
0
Annual employment opportunities expected (IJEDI Sense Check IRP 2019)
2021 2022 2023 2024 2025 2026 2027 2028 2029 2030
29365907
10499
34776
29766
8840
33712
1330015530
4348346823
50720
Figure 11
4746
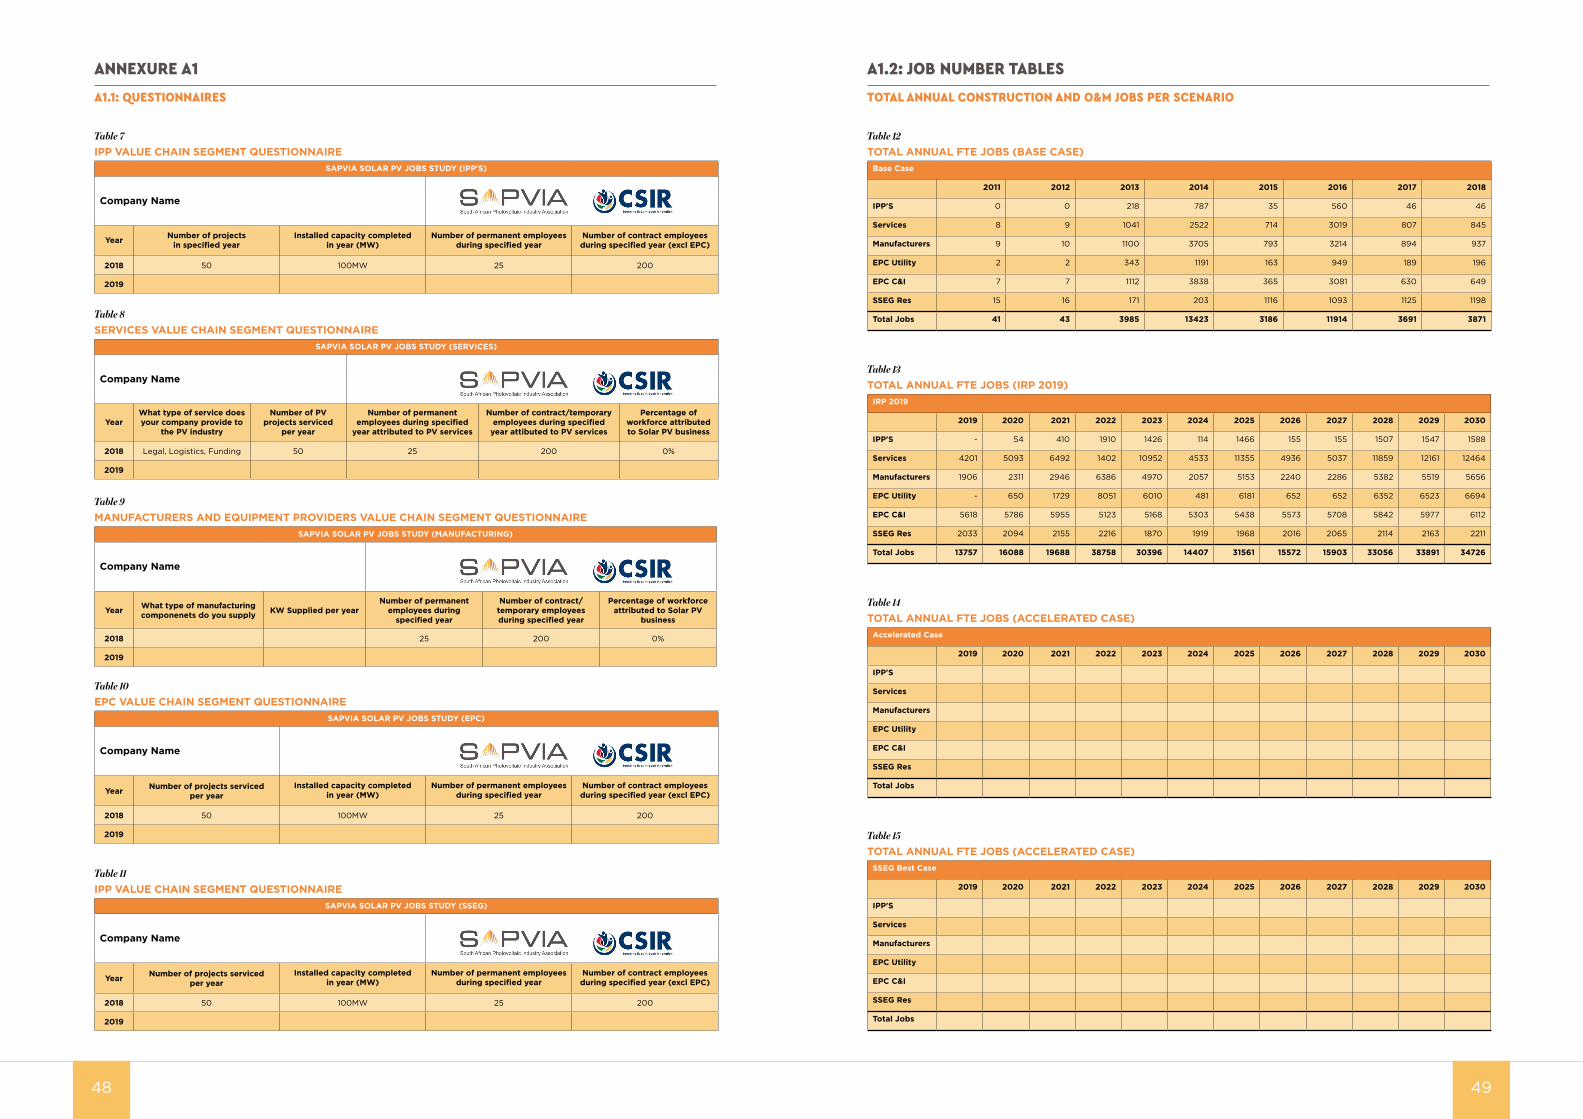
ANNEXURE A1
A1.1: QUESTIONNAIRES
A1.2: JOB NUMBER TABLES
TOTAL ANNUAL CONSTRUCTION AND O&M JOBS PER SCENARIO
4948
Table 7
IPP VALUE CHAIN SEGMENT QUESTIONNAIRESAPVIA SOLAR PV JOBS STUDY (IPP'S)
Company Name
Year Number of projects in specified year
Installed capacity completed in year (MW)
Number of permanent employees during specified year
Number of contract employees during specified year (excl EPC)
2018 50 100MW 25 200
2019
Table 8
SERVICES VALUE CHAIN SEGMENT QUESTIONNAIRESAPVIA SOLAR PV JOBS STUDY (SERVICES)
Company Name
YearWhat type of service does your company provide to
the PV industry
Number of PV projects serviced
per year
Number of permanent employees during specified
year attributed to PV services
Number of contract/temporary employees during specified
year attibuted to PV services
Percentage of workforce attributed to Solar PV business
2018 Legal, Logistics, Funding 50 25 200 0%
2019
Table 10
EPC VALUE CHAIN SEGMENT QUESTIONNAIRESAPVIA SOLAR PV JOBS STUDY (EPC)
Company Name
Year Number of projects serviced per year
Installed capacity completed in year (MW)
Number of permanent employees during specified year
Number of contract employees during specified year (excl EPC)
2018 50 100MW 25 200
2019
Table 9
MANUFACTURERS AND EQUIPMENT PROVIDERS VALUE CHAIN SEGMENT QUESTIONNAIRESAPVIA SOLAR PV JOBS STUDY (MANUFACTURING)
Company Name
Year What type of manufacturing componenets do you supply KW Supplied per year
Number of permanent employees during
specified year
Number of contract/temporary employees during specified year
Percentage of workforce attributed to Solar PV
business
2018 25 200 0%
2019
Table 11
IPP VALUE CHAIN SEGMENT QUESTIONNAIRESAPVIA SOLAR PV JOBS STUDY (SSEG)
Company Name
Year Number of projects serviced per year
Installed capacity completed in year (MW)
Number of permanent employees during specified year
Number of contract employees during specified year (excl EPC)
2018 50 100MW 25 200
2019
Table 12
TOTAL ANNUAL FTE JOBS (BASE CASE)Base Case
2011 2012 2013 2014 2015 2016 2017 2018
IPP'S 0 0 218 787 35 560 46 46
Services 8 9 1041 2522 714 3019 807 845
Manufacturers 9 10 1100 3705 793 3214 894 937
EPC Utility 2 2 343 1191 163 949 189 196
EPC C&I 7 7 1112 3838 365 3081 630 649
SSEG Res 15 16 171 203 1116 1093 1125 1198
Total Jobs 41 43 3985 13423 3186 11914 3691 3871
Table 13
TOTAL ANNUAL FTE JOBS (IRP 2019)IRP 2019
2019 2020 2021 2022 2023 2024 2025 2026 2027 2028 2029 2030
IPP'S - 54 410 1910 1426 114 1466 155 155 1507 1547 1588
Services 4201 5093 6492 1402 10952 4533 11355 4936 5037 11859 12161 12464
Manufacturers 1906 2311 2946 6386 4970 2057 5153 2240 2286 5382 5519 5656
EPC Utility - 650 1729 8051 6010 481 6181 652 652 6352 6523 6694
EPC C&I 5618 5786 5955 5123 5168 5303 5438 5573 5708 5842 5977 6112
SSEG Res 2033 2094 2155 2216 1870 1919 1968 2016 2065 2114 2163 2211
Total Jobs 13757 16088 19688 38758 30396 14407 31561 15572 15903 33056 33891 34726
Table 14
TOTAL ANNUAL FTE JOBS (ACCELERATED CASE)Accelerated Case
2019 2020 2021 2022 2023 2024 2025 2026 2027 2028 2029 2030
IPP'S
Services
Manufacturers
EPC Utility
EPC C&I
SSEG Res
Total Jobs
Table 15
TOTAL ANNUAL FTE JOBS (ACCELERATED CASE)SSEG Best Case
2019 2020 2021 2022 2023 2024 2025 2026 2027 2028 2029 2030
IPP'S
Services
Manufacturers
EPC Utility
EPC C&I
SSEG Res
Total Jobs
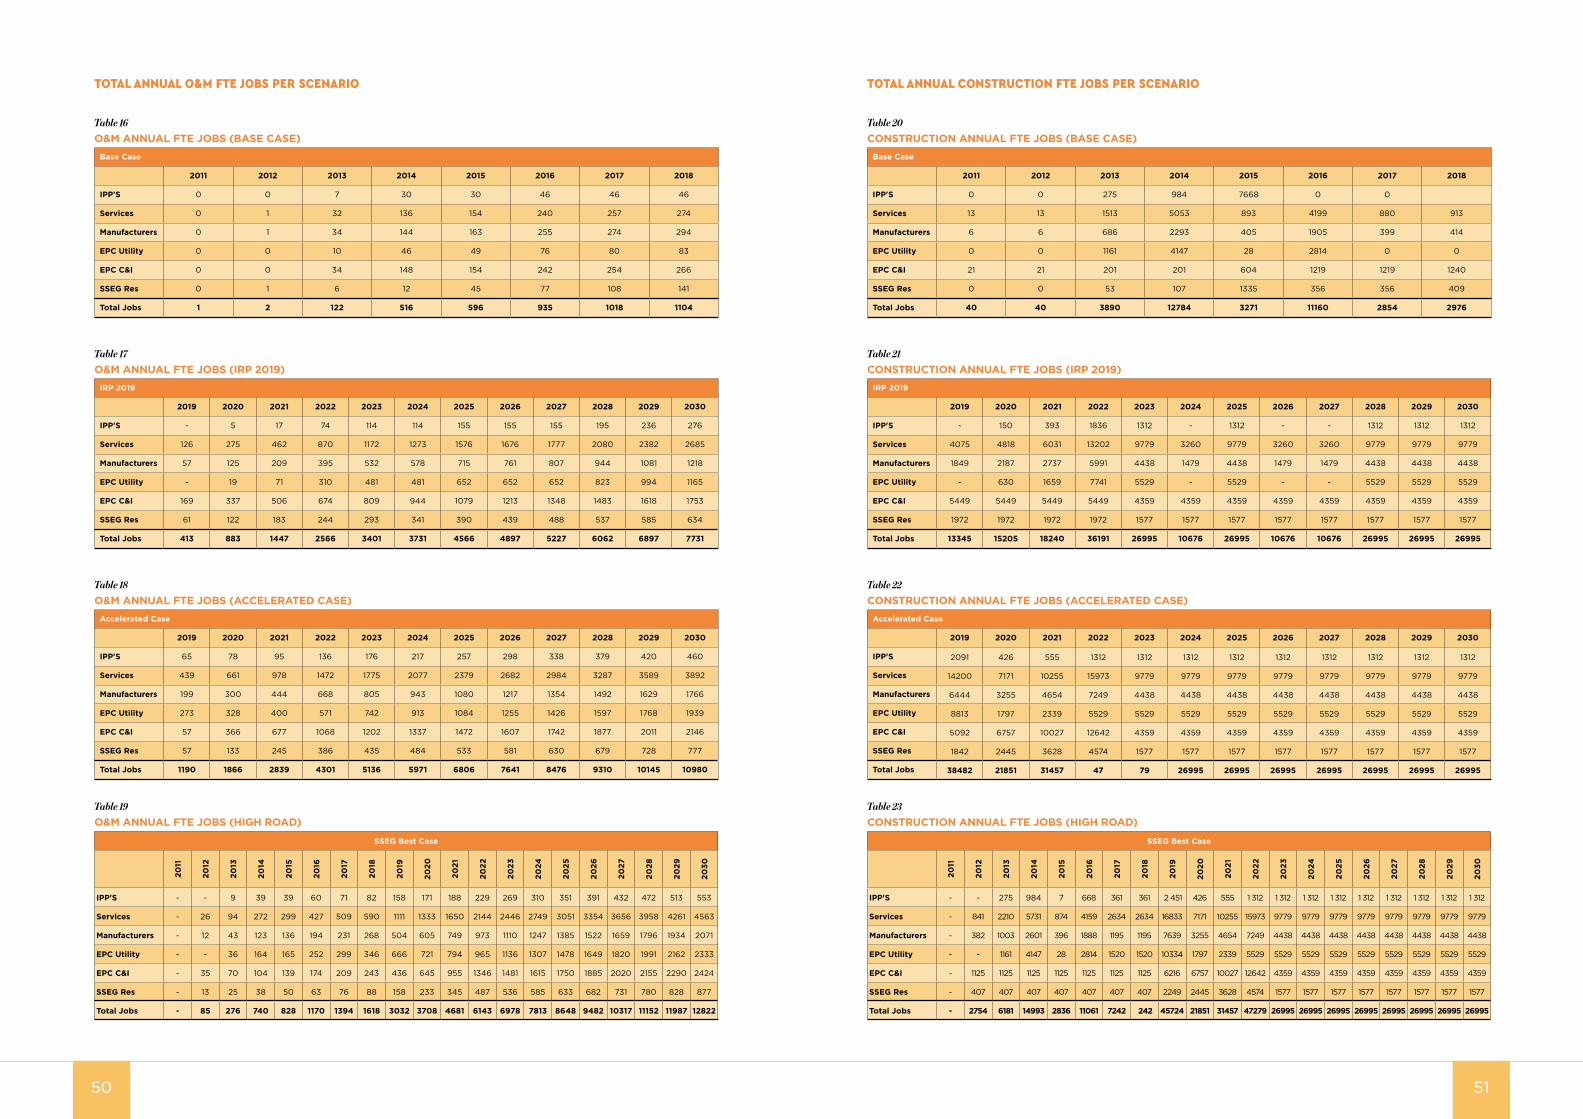
5150
Table 16
O&M ANNUAL FTE JOBS (BASE CASE)Base Case
2011 2012 2013 2014 2015 2016 2017 2018
IPP'S 0 0 7 30 30 46 46 46
Services 0 1 32 136 154 240 257 274
Manufacturers 0 1 34 144 163 255 274 294
EPC Utility 0 0 10 46 49 76 80 83
EPC C&I 0 0 34 148 154 242 254 266
SSEG Res 0 1 6 12 45 77 108 141
Total Jobs 1 2 122 516 596 935 1018 1104
Table 17
O&M ANNUAL FTE JOBS (IRP 2019)IRP 2019
2019 2020 2021 2022 2023 2024 2025 2026 2027 2028 2029 2030
IPP'S - 5 17 74 114 114 155 155 155 195 236 276
Services 126 275 462 870 1172 1273 1576 1676 1777 2080 2382 2685
Manufacturers 57 125 209 395 532 578 715 761 807 944 1081 1218
EPC Utility - 19 71 310 481 481 652 652 652 823 994 1165
EPC C&I 169 337 506 674 809 944 1079 1213 1348 1483 1618 1753
SSEG Res 61 122 183 244 293 341 390 439 488 537 585 634
Total Jobs 413 883 1447 2566 3401 3731 4566 4897 5227 6062 6897 7731
Table 18
O&M ANNUAL FTE JOBS (ACCELERATED CASE)Accelerated Case
2019 2020 2021 2022 2023 2024 2025 2026 2027 2028 2029 2030
IPP'S 65 78 95 136 176 217 257 298 338 379 420 460
Services 439 661 978 1472 1775 2077 2379 2682 2984 3287 3589 3892
Manufacturers 199 300 444 668 805 943 1080 1217 1354 1492 1629 1766
EPC Utility 273 328 400 571 742 913 1084 1255 1426 1597 1768 1939
EPC C&I 57 366 677 1068 1202 1337 1472 1607 1742 1877 2011 2146
SSEG Res 57 133 245 386 435 484 533 581 630 679 728 777
Total Jobs 1190 1866 2839 4301 5136 5971 6806 7641 8476 9310 10145 10980
Table 19
O&M ANNUAL FTE JOBS (HIGH ROAD)
SSEG Best Case
2011
2012
2013
2014
2015
2016
2017
2018
2019
2020
2021
2022
2023
2024
2025
2026
2027
2028
2029
2030
IPP'S - - 9 39 39 60 71 82 158 171 188 229 269 310 351 391 432 472 513 553
Services - 26 94 272 299 427 509 590 1111 1333 1650 2144 2446 2749 3051 3354 3656 3958 4261 4563
Manufacturers - 12 43 123 136 194 231 268 504 605 749 973 1110 1247 1385 1522 1659 1796 1934 2071
EPC Utility - - 36 164 165 252 299 346 666 721 794 965 1136 1307 1478 1649 1820 1991 2162 2333
EPC C&I - 35 70 104 139 174 209 243 436 645 955 1346 1481 1615 1750 1885 2020 2155 2290 2424
SSEG Res - 13 25 38 50 63 76 88 158 233 345 487 536 585 633 682 731 780 828 877
Total Jobs - 85 276 740 828 1170 1394 1618 3032 3708 4681 6143 6978 7813 8648 9482 10317 11152 11987 12822
TOTAL ANNUAL O&M FTE JOBS PER SCENARIO
Table 20
CONSTRUCTION ANNUAL FTE JOBS (BASE CASE)Base Case
2011 2012 2013 2014 2015 2016 2017 2018
IPP'S 0 0 275 984 7668 0 0
Services 13 13 1513 5053 893 4199 880 913
Manufacturers 6 6 686 2293 405 1905 399 414
EPC Utility 0 0 1161 4147 28 2814 0 0
EPC C&I 21 21 201 201 604 1219 1219 1240
SSEG Res 0 0 53 107 1335 356 356 409
Total Jobs 40 40 3890 12784 3271 11160 2854 2976
Table 21
CONSTRUCTION ANNUAL FTE JOBS (IRP 2019)IRP 2019
2019 2020 2021 2022 2023 2024 2025 2026 2027 2028 2029 2030
IPP'S - 150 393 1836 1312 - 1312 - - 1312 1312 1312
Services 4075 4818 6031 13202 9779 3260 9779 3260 3260 9779 9779 9779
Manufacturers 1849 2187 2737 5991 4438 1479 4438 1479 1479 4438 4438 4438
EPC Utility - 630 1659 7741 5529 - 5529 - - 5529 5529 5529
EPC C&I 5449 5449 5449 5449 4359 4359 4359 4359 4359 4359 4359 4359
SSEG Res 1972 1972 1972 1972 1577 1577 1577 1577 1577 1577 1577 1577
Total Jobs 13345 15205 18240 36191 26995 10676 26995 10676 10676 26995 26995 26995
Table 22
CONSTRUCTION ANNUAL FTE JOBS (ACCELERATED CASE)Accelerated Case
2019 2020 2021 2022 2023 2024 2025 2026 2027 2028 2029 2030
IPP'S 2091 426 555 1312 1312 1312 1312 1312 1312 1312 1312 1312
Services 14200 7171 10255 15973 9779 9779 9779 9779 9779 9779 9779 9779
Manufacturers 6444 3255 4654 7249 4438 4438 4438 4438 4438 4438 4438 4438
EPC Utility 8813 1797 2339 5529 5529 5529 5529 5529 5529 5529 5529 5529
EPC C&I 5092 6757 10027 12642 4359 4359 4359 4359 4359 4359 4359 4359
SSEG Res 1842 2445 3628 4574 1577 1577 1577 1577 1577 1577 1577 1577
Total Jobs 38482 21851 31457 47 79 26995 26995 26995 26995 26995 26995 26995
Table 23
CONSTRUCTION ANNUAL FTE JOBS (HIGH ROAD)
SSEG Best Case
2011
2012
2013
2014
2015
2016
2017
2018
2019
2020
2021
2022
2023
2024
2025
2026
2027
2028
2029
2030
IPP'S - - 275 984 7 668 361 361 2 451 426 555 1 312 1 312 1 312 1 312 1 312 1 312 1 312 1 312 1 312
Services - 841 2210 5731 874 4159 2634 2634 16833 7171 10255 15973 9779 9779 9779 9779 9779 9779 9779 9779
Manufacturers - 382 1003 2601 396 1888 1195 1195 7639 3255 4654 7249 4438 4438 4438 4438 4438 4438 4438 4438
EPC Utility - - 1161 4147 28 2814 1520 1520 10334 1797 2339 5529 5529 5529 5529 5529 5529 5529 5529 5529
EPC C&I - 1125 1125 1125 1125 1125 1125 1125 6216 6757 10027 12642 4359 4359 4359 4359 4359 4359 4359 4359
SSEG Res - 407 407 407 407 407 407 407 2249 2445 3628 4574 1577 1577 1577 1577 1577 1577 1577 1577
Total Jobs - 2754 6181 14993 2836 11061 7242 242 45724 21851 31457 47279 26995 26995 26995 26995 26995 26995 26995 26995
TOTAL ANNUAL CONSTRUCTION FTE JOBS PER SCENARIO

South African PV Industry Association Eastgate Office Park, Block A
South Boulevard Road | Bruma | Johannesburg | 2198 Office: +27(0)11 553 7264