Solar Energy: Frequently Asked Questions
26
Solar Energy: Frequently Asked Questions January 27, 2020 Congressional Research Service https://crsreports.congress.gov R46196
Transcript of Solar Energy: Frequently Asked Questions

Solar Energy: Frequently Asked Questions
January 27, 2020
Congressional Research Service
https://crsreports.congress.gov
R46196

Congressional Research Service
SUMMARY
Solar Energy: Frequently Asked Questions Use of solar energy for electricity generation is growing in the United States and globally. In the
United States, solar energy overall accounted for 2.2% of total electricity generation in 2018, up
from 0.7% in 2014.
This report addresses a dozen frequently asked questions that may be of interest to lawmakers as
the growing use of solar energy potentially affects a variety of areas of congressional interest.
The first set of questions looks at different technologies that use solar energy to generate
electricity and their costs and prevalence over time. Costs for all components of solar
photovoltaic (PV) systems, including cells, modules, inverters, and other related equipment, have
generally declined in recent years. Assessing solar energy costs for consumers is challenging
because there are many local factors to consider. Another question considers whether using solar
energy is a reliable form of electricity generation given its variable nature.
The second set of questions discusses federal and state policies aimed at promoting deployment
of solar energy in the United States. At the federal level, tax incentives reduce the after-tax cost
of investing in solar property, thereby encouraging taxpayers to invest in more solar property
than they would have absent tax incentives. Federal tax incentives include an investment tax
credit for businesses, eligibility for accelerated depreciation for businesses, and a residential
energy efficient property tax credit for individuals. At the state level, renewable portfolio
standards (or, more broadly, electricity portfolio standards) require electric utilities to procure a
specified amount of electricity from designated, eligible sources. Twenty-nine states, three U.S.
territories, and the District of Columbia are implementing electricity portfolio standards. All of
these policies include solar energy as an eligible source. Utility-scale solar systems typically
benefit from electricity portfolio standards, while commercial- and residential-scale systems
typically benefit from a different state policy called net metering. Net metering allows individual electricity consumers to
receive payment for the electricity produced by systems installed on their property (or, in some cases, systems not installed
on their property but with which consumers have a contractual arrangement).
Another set of questions considers the U.S. manufacturing base for solar products and U.S. tariffs, which have been applied
over the years on imports of solar equipment. The results on the nation’s solar manufacturing industry have been mixed.
Different parts of the solar PV supply chain have responded differently to the tariffs. For some components, such as the
assembly of solar modules, domestic production has increased since the imposition of tariffs. By one count, about 20
factories assembled PV modules in the United States in 2018. For other components, such as solar cell production, tariffs
have not had this effect. At present, there is one major domestic producer of crystalline-silicon solar cells; several producers
of solar cells have closed U.S. plants since 2012. A related question discusses the number of U.S. jobs supported by the
domestic solar industry, which employed more than 240,000 full-time equivalent workers in 2018. Of these positions, 64%
involved two solar sectors, the installation of solar systems and project development.
The final questions address some potential environmental considerations associated with the use of solar energy, such as land
use. Standard metrics for measuring land use impacts for different energy technologies do not exist. When considering total
land area occupied, solar typically requires more land to produce the same amount of electricity than many other sources.
Other aspects of land requirements affect comparisons among energy sources, including technology developments over time,
land cover change, and time-to-recovery. Possible effects on agricultural production are also discussed. Some farmers view
solar energy favorably as an income supplement, but others raise concerns about long-term damage to soil health and
agricultural productivity. Some researchers are investigating options for dual-use solar PV systems known as agrivoltaics, in
which the same land could be used for simultaneous crop production and electricity generation.
R46196
January 27, 2020
Ashley J. Lawson, Coordinator Analyst in Energy Policy
Molly F. Sherlock Specialist in Public Finance
Michaela D. Platzer Specialist in Industrial Organization and Business
Corrie E. Clark Analyst in Energy Policy
Tadlock Cowan Analyst in Natural Resources and Rural Development
Solar Energy: Frequently Asked Questions
Congressional Research Service
Contents
How Does Solar Energy Work? ....................................................................................................... 1
Solar Photovoltaic (PV) ............................................................................................................ 1 Concentrating Solar Power ....................................................................................................... 3
How Much Electricity Comes From Solar Energy? ........................................................................ 3
How Much Does a Solar PV System Cost? ..................................................................................... 4
How Does Solar Energy Impact Electricity Costs for Consumers? ................................................ 7
Comparing Electricity Costs ..................................................................................................... 7
Is Solar Energy Reliable? ................................................................................................................ 9
What Federal Tax Incentives Support Solar Energy Development? ............................................. 10
Tax Incentives for Businesses ................................................................................................. 10 Tax Incentives for Individuals .................................................................................................. 11
How Much Do Solar Tax Incentives Cost? .................................................................................... 11
What State Policies Support Solar Energy Development? ............................................................ 12
How Are U.S. Tariffs Affecting Domestic Solar Manufacturing? ................................................. 13
What U.S. Jobs Are Supported by the Solar Industry? .................................................................. 18
What Land Requirements Does Solar Energy Have? .................................................................... 19
What Are Potential Impacts of Solar Energy Development on Agriculture? ................................ 21
Figures
Figure 1. Crystalline-Silicon Photovoltaic (PV) Manufacturing Process ........................................ 1
Figure 2. U.S. Electricity Generation from Solar Energy, 2014-2018............................................. 4
Figure 3. Q1 2018 Average U.S. Solar PV System Costs ................................................................ 5
Figure 4. Solar PV Total System Costs, 2010-Q1 2018 .................................................................. 6
Figure 5. U.S. Cell and Module Production .................................................................................. 15
Figure 6. Domestic Solar Industry Employment ........................................................................... 18
Contacts
Author Information ........................................................................................................................ 23
Solar Energy: Frequently Asked Questions
Congressional Research Service 1
How Does Solar Energy Work?1 The energy in sunlight can be converted into electricity in either of two ways: by using solar
photovoltaic cells or by concentrating solar energy to produce heat for electricity generation.
Solar energy can also be used to heat water for direct use, but this report focuses only on
electricity generation applications.
Solar Photovoltaic (PV)
Sunlight can interact with certain materials to directly produce electricity in a process known as
the photovoltaic (PV) effect. Silicon (more specifically, crystalline-silicon, or c-Si) is the most
commonly used material today, but other materials (e.g., cadmium telluride) also can be used.
Research is ongoing into alternative materials and designs that might be more efficient or less
expensive than c-Si.2
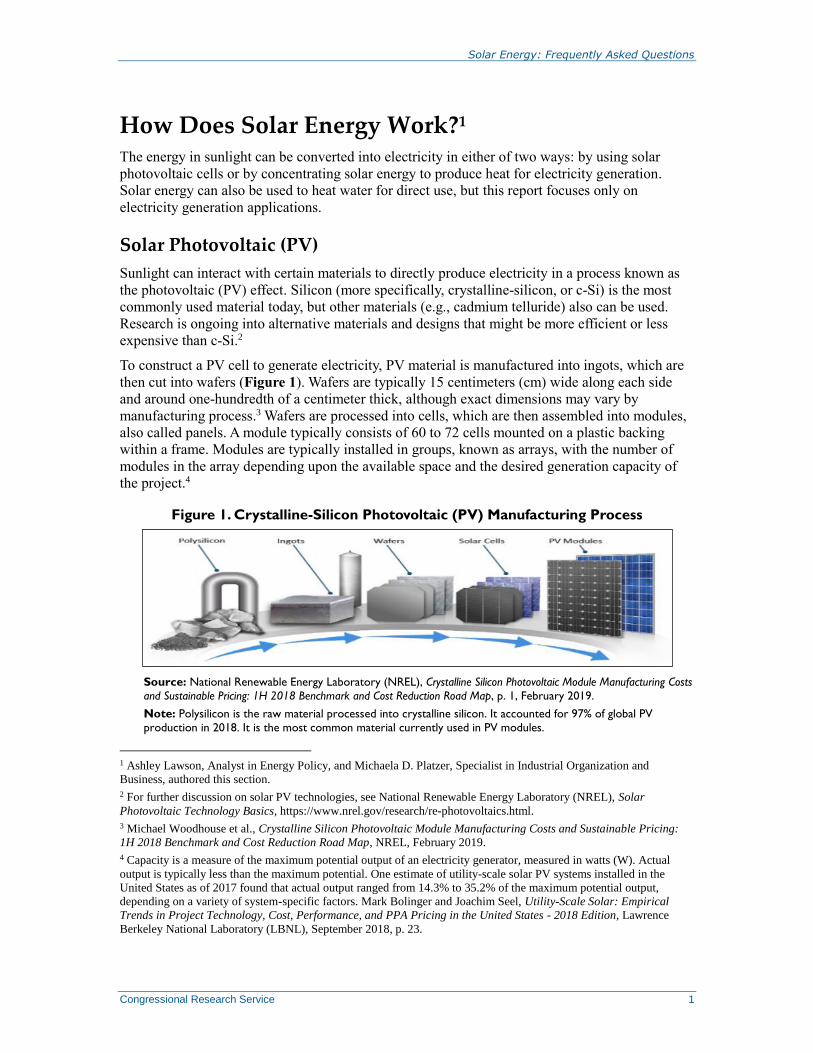
To construct a PV cell to generate electricity, PV material is manufactured into ingots, which are
then cut into wafers (Figure 1). Wafers are typically 15 centimeters (cm) wide along each side
and around one-hundredth of a centimeter thick, although exact dimensions may vary by
manufacturing process.3 Wafers are processed into cells, which are then assembled into modules,
also called panels. A module typically consists of 60 to 72 cells mounted on a plastic backing
within a frame. Modules are typically installed in groups, known as arrays, with the number of
modules in the array depending upon the available space and the desired generation capacity of
the project.4
Figure 1. Crystalline-Silicon Photovoltaic (PV) Manufacturing Process
Source: National Renewable Energy Laboratory (NREL), Crystalline Silicon Photovoltaic Module Manufacturing Costs
and Sustainable Pricing: 1H 2018 Benchmark and Cost Reduction Road Map, p. 1, February 2019.
Note: Polysilicon is the raw material processed into crystalline silicon. It accounted for 97% of global PV
production in 2018. It is the most common material currently used in PV modules.
1 Ashley Lawson, Analyst in Energy Policy, and Michaela D. Platzer, Specialist in Industrial Organization and
Business, authored this section.
2 For further discussion on solar PV technologies, see National Renewable Energy Laboratory (NREL), Solar
Photovoltaic Technology Basics, https://www.nrel.gov/research/re-photovoltaics.html.
3 Michael Woodhouse et al., Crystalline Silicon Photovoltaic Module Manufacturing Costs and Sustainable Pricing:
1H 2018 Benchmark and Cost Reduction Road Map, NREL, February 2019.
4 Capacity is a measure of the maximum potential output of an electricity generator, measured in watts (W). Actual
output is typically less than the maximum potential. One estimate of utility-scale solar PV systems installed in the
United States as of 2017 found that actual output ranged from 14.3% to 35.2% of the maximum potential output,
depending on a variety of system-specific factors. Mark Bolinger and Joachim Seel, Utility-Scale Solar: Empirical
Trends in Project Technology, Cost, Performance, and PPA Pricing in the United States - 2018 Edition, Lawrence
Berkeley National Laboratory (LBNL), September 2018, p. 23.
Solar Energy: Frequently Asked Questions
Congressional Research Service 2
A PV system includes modules and a variety of structural and electronic components, known as
balance of system (BOS) equipment, to tie the system together.5 Structural BOS equipment
includes brackets, on which the modules are mounted. For ground-mounted systems, these
brackets can be either fixed or able to rotate during the day to face the sun. Mounting systems that
can rotate are known as tracking systems. Modules mounted on tracking systems tend to generate
more electricity than modules on fixed-mount systems, all else being equal, because the tracking
systems can optimize the amount of sunlight hitting the module over the course of a day.6 One
key piece of BOS equipment is an inverter, an electronic device that converts the electricity
generated by PV modules into a form that is usable in the U.S. electric system. Other electronic
BOS equipment includes charge controllers, circuit breakers, meters, and switch gear. Some PV
systems also include integrated energy storage systems such as batteries.7
PV systems can be divided into three categories, based primarily on capacity.8
Utility-scale systems (i.e., solar farms) may range in capacity from a few
megawatts (MW) to a few hundred MW. They are typically owned and operated
like other central power plants. Utility-scale projects are typically connected to
the electricity transmission system, the network of high-voltage lines that move
electricity over long distances.
Commercial-scale systems typically range in capacity from a few kilowatts (kW;
1,000 kW = 1 MW) to a few hundred kW. They may be installed on the ground
or on rooftops, and are typically owned or hosted by commercial, industrial, or
institutional entities. Some may be connected to the transmission system, and
some may be connected to the electricity distribution system, the network of low-
voltage lines that deliver electricity directly to most consumers.
Residential-scale systems typically have generation capacity of a few kW. Most
residential-scale projects are installed on rooftops and connected to the
distribution system.
Another way to categorize PV systems is by ownership model. Systems connected to the
transmission system (typically utility-scale) are generally owned by utilities or independent
power producers, as is the case for other central power plants. Smaller systems may use other
ownership models, depending on what applicable state laws allow.
Customer-owned systems are owned directly by the electricity consumer
benefiting from the system. The consumer might buy the system outright or
finance it in the same way as for other property improvements (e.g., loan).
Third-party ownership (i.e., solar leasing) is an ownership model in which an
electric consumer, such as a homeowner, allows a company to build a solar
5 Balance of system (BOS) equipment is sometimes called balance of plant (BOP) equipment.
6 Generally, tracking systems can be installed only on ground-mounted systems. In other words, rooftop systems do not
typically include tracking systems.
7 For a discussion of energy storage systems, see CRS Report R45980, Electricity Storage: Applications, Issues, and
Technologies, by Richard J. Campbell.
8 This report provides illustrative capacity thresholds because the industry does not have established capacity
thresholds. For example, some analysis defines 1 MW as the minimum size for utility-scale projects, while other
analysis uses 5 MW. Also, the industry has not reached consensus on whether capacity is the best metric for
categorizing projects. This report uses capacity for consistency with the data shown throughout. Other analyses may
define utility-scale projects based on agreements for how the electricity will be purchased (e.g., power purchase
agreement versus net metering). Another option is to use total project cost as the defining characteristic. See Mark
Bolinger and Joachim Seel, September 2018.
Solar Energy: Frequently Asked Questions
Congressional Research Service 3
system on the consumer’s property. The company owns and maintains the solar
system while the consumer uses the electricity produced by the system. The
consumer pays back the cost of the system to the company through either lease
payments or a power purchase agreement.
Community solar (i.e., solar gardens) is an ownership model in which multiple
electricity consumers may purchase or lease shares of a solar system through a
subscription. Subscribers can benefit from the project by receiving electricity,
financial payments, or both. Community solar systems are usually not installed
on a subscriber’s property, and the systems may be owned by a utility or another
type of entity.
Concentrating Solar Power
Concentrating solar power (CSP) technologies collect and concentrate energy from sunlight to
heat certain fluids (liquids or gases). CSP plants use these heated fluids to produce electricity,
either by creating steam to drive a steam turbine or by directly running a generator. CSP plants
can be designed with thermal energy storage systems.9 At least one CSP plant with storage
operating in the United States is capable of generating electricity 24 hours a day.10
How Much Electricity Comes From Solar Energy?11 Electricity generation from solar energy has grown in recent years, as shown in Figure 2. Solar
energy overall (PV and CSP combined) accounted for 0.7% of total U.S. electricity generation in
2014 and 2.2% of the total in 2018, according to data from the U.S. Energy Information
Administration (EIA).12 Most generation (96% in 2018) from solar energy comes from PV
systems. Large-scale systems, defined by EIA as those greater than 1 MW, accounted for 61% of
overall generation from solar energy in 2014, the first year for which EIA reported generation
data for different size categories. By 2018, the share from large-scale systems had increased to
68%.
9 For an overview, see DOE, Concentrating Solar Power Thermal Storage System Basics, August 21, 2013.
10 One example is reported in Thomas W. Overton, “Top Plant: Crescent Dunes Solar Energy Project, Tonopah,
Nevada,” Power Magazine, December 1, 2016, https://www.powermag.com/crescent-dunes-solar-energy-project-
tonopah-nevada-2/.
11 Ashley Lawson, Analyst in Energy Policy, was the author of this section.
12 CRS analysis of data from U.S. Energy Information Administration (EIA), Electric Power Annual 2018, 2019,
https://www.eia.gov/electricity/annual/.

Solar Energy: Frequently Asked Questions
Congressional Research Service 4
Figure 2. U.S. Electricity Generation from Solar Energy, 2014-2018
Generation in GWh and as Percent of Total U.S. Electricity Generation
Source: U.S. Energy Information Administration (EIA), Electric Power Annual 2018, 2019.
Notes: GWh = gigawatt-hours. Bars are labeled with the percent of total U.S. generation from solar energy
overall (large-scale and small-scale combined) in that year. EIA defines large-scale generation as generators with
capacity > 1 MW, and small-scale generation as generators with capacity < 1 MW. EIA began reporting
generation data for small-scale solar generators in 2014.
How Much Does a Solar PV System Cost?13 Costs for solar PV systems vary by size, as shown in Figure 3. The figure shows an estimate of
average U.S. solar PV system costs per unit of capacity, as of the first quarter of 2018 (Q1 2018),
based on an analysis by the Department of Energy’s National Renewable Energy Laboratory
(NREL). Costs for any individual project could differ based on project-specific circumstances.
Two general findings from NREL’s analysis are supported by numerous other studies, namely
that larger projects tend to be cheaper on a per-unit basis, and that costs for projects of all sizes
have declined in recent years.
Utility-scale systems have the lowest unit costs, ranging from an average of $1.06 per watt of
direct current (hereinafter, W) to $1.13/W in 2018, depending on whether projects were mounted
13 Ashley Lawson, Analyst in Energy Policy, was the author of this section.

Solar Energy: Frequently Asked Questions
Congressional Research Service 5
on fixed brackets or tracking systems, respectively.14 Commercial-scale systems cost $1.83/W on
average in Q1 2018, and residential-scale systems cost $2.70/W on average. The total system cost
differences shown in Figure 3 are driven primarily by higher “soft costs.” These costs include,
for example, costs associated with permitting, interconnecting with the grid, and installer
overhead costs. The soft costs are much higher for smaller-scale systems, per watt, than for
utility-scale systems.
Figure 3. Q1 2018 Average U.S. Solar PV System Costs
Source: Ran Fu, David Feldman, and Robert Margolis, U.S. Solar Photovoltaic System Cost Benchmark: Q1 2018,
NREL, November 2018.
Notes: DC = direct current; BOS = balance of system. Separate costs are shown for utility-scale solar PV
systems depending on whether they are mounted on fixed brackets (fixed) or a tracking system (tracking). Labels
show total system costs.
14 Solar PV systems produce direct current (DC) electricity, which must be converted to alternating current (AC)
electricity for use. Some power is lost during this conversion process, so the same system will have a different capacity
rating (i.e., size) depending on whether it is reported as DC or AC.

Solar Energy: Frequently Asked Questions
Congressional Research Service 6
PV system costs have declined, as shown by data from the NREL analysis shown in Figure 4.
NREL reported costs from 2010 to Q1 2018. NREL credits cost declines over this time period to
cost declines in all system components (i.e., modules, inverters, BOS equipment, labor, and other
soft costs).15
PV module costs increased between 2017 and 2018 as a result of tariffs discussed in the section
“How Are U.S. Tariffs Affecting Domestic Solar Manufacturing?,” offsetting cost declines in
other system components, according to the NREL report.
Figure 4. Solar PV Total System Costs, 2010-Q1 2018
Source: Ran Fu, David Feldman, and Robert Margolis, U.S. Solar Photovoltaic System Cost Benchmark: Q1 2018,
NREL, November 2018.
Notes: DC = direct current. Q1 2018 value reflects first-quarter data only. Separate cost curves are shown for
utility-scale solar PV projects depending on whether they are mounted on fixed brackets (fixed) or a tracking
system (tracking). Values are inflation-adjusted by NREL using the consumer price index.
15 Labor costs for a project are different from total wages received by a worker. NREL identifies one factor for
declining labor costs over this time period as more efficient PV modules. Increased efficiency means that fewer panels
must be installed to generate the same amount of electricity. This lowers labor costs, on a per-watt installed basis,
because fewer hours of labor are required.
Solar Energy: Frequently Asked Questions
Congressional Research Service 7
How Does Solar Energy Impact Electricity Costs for
Consumers?16 Generalizing the cost impacts to consumers for solar systems is challenging because costs for
these systems vary across the United States. Additionally, solar system costs are declining in both
absolute terms (as discussed in the previous section) and relative to other sources of electric
power. In parts of the country, new solar systems are sometimes among the least cost-options for
generating electricity. This was not generally the case a few years ago.
Policies aimed at promoting solar energy make an assessment of costs more complex. For
example, tax incentives, as discussed in the section “What Federal Tax Incentives Support Solar
Energy Development?,” can reduce the ownership costs for businesses or individuals that
purchase solar energy systems. Some of those costs are then transferred to taxpayers. The
following discussion focuses on electricity costs only from a consumer’s point of view.
Consumers’ electricity costs can be measured in two ways. The first way is the electricity rate,
typically expressed in cents per kilowatt-hour (cents/kWh). The second way is the electricity bill,
typically the total costs for electricity that consumers pay each month expressed in dollars. In
most cases, an electricity bill reflects the costs to produce electricity (typically, the applicable
electricity rate times the amount of electricity consumed), the costs to deliver electricity to the
consumer, and any other fees as determined by state or local regulators (e.g., contributions to
funds that provide bill relief to low-income households). Electricity rates can go down while bills
go up, and vice versa.
Multiple factors can determine how solar energy might affect what consumers pay for electricity.
Many of these factors vary based on local circumstances. They can also change over time as the
profile of electricity sources changes.
Comparing Electricity Costs
One way to compare electricity costs is by estimating the lifetime costs of energy systems.
Lifetime costs include the initial construction and installation cost plus operation and
maintenance (O&M) costs, fuel costs, and other costs. Electricity rates are strongly influenced by
total lifetime costs for all the electricity generators serving a given area. Lifetime costs for solar
energy have historically been higher than for many other sources, but that is changing in many
parts of the United States.17 For example, one commonly used measure of lifetime costs is the
levelized cost of electricity (LCOE), usually expressed in dollars per megawatt-hour of
generation ($/MWh) and averaged over the lifetime of a project. LCOE estimates attempt
“apples-to-apples” comparisons among technologies because the estimates account for how much
electricity a given power plant is expected to produce over its lifetime.18 According to widely
cited estimates from one consulting firm, 2019 LCOE for new utility-scale solar systems ranged
16 Ashley Lawson, Analyst in Energy Policy, was the author of this section.
17 For example, see Mark Bolinger and Joachim Seel, September 2018, p. 41.
18 The different organizations that produce LCOE estimates use different assumptions about future fuel costs, power
plant production levels, maintenance costs and other factors, which can result in different LCOE estimates. LCOE has
limitations in its applicability. For example, LCOE estimates typically do not account for transmission systems or other
infrastructure that may be required to produce and deliver electricity. Consumer-facing prices, which can be very
different from LCOE estimates, may be more relevant for some policy debates.
Solar Energy: Frequently Asked Questions
Congressional Research Service 8
from $32/MWh to $42/MWh. By comparison, LCOE for new wind generation was $28/MWh-
$54/MWh and for natural gas combined cycle generation was $44/MWh-$68/MWh.19
Another factor in consumers’ bills is the extent to which electricity from solar energy displaces
electricity generation from existing sources. If existing power plants are called upon to produce
less electricity than planned when they were first built due to the availability of power from less
expensive sources, the owners still need to pay the construction cost of their unneeded capacity.
Such costs are known as stranded costs. Depending on each state’s regulatory framework,
stranded costs might be borne by power plant owners or be passed through to consumers in
electric bills.
To the extent that solar systems require new transmission lines to deliver electricity to consumers,
the cost of building those lines may result in higher electricity bills. Utility-scale solar, which is
frequently located in rural areas distant from consumers, may have higher associated cost impacts
on bills than, for example, residential-scale solar, depending upon project details. On the other
hand, installation of solar systems can sometimes avoid upgrades to transmission systems,
resulting in potentially lower costs for consumers. In other cases, though, solar systems
necessitate upgrades to local distribution systems, which might increase costs for customers. In
states with carbon pricing policies in place, increased solar energy deployment could reduce the
bill impacts associated with the carbon price.
Generating solar energy has approximately zero marginal cost. Marginal costs reflect the variable
costs of producing incremental amounts of electricity from an existing source. Marginal costs are
typically dominated by fuel costs, which are not relevant for solar energy. When solar energy is
present in an area, fewer fuel-consuming electricity sources are required, which tends to drive
down marginal costs for the regional electricity system overall. This effect may diminish as the
number of solar electricity generators increases in an area, because nearby solar PV systems tend
to maximize their electricity production at the same time (usually midday). If all of the midday
electricity demand were to be met by solar PV, there would no incremental cost benefit to adding
more solar PV systems to the region.20
The rate and bill impacts discussed above would apply to all electricity consumers within a region
in which solar energy development is taking place. Consumers that install rooftop solar systems
or participate in community solar projects (“solar customers”) could have different bill impacts.
Most states allow solar customers to be financially compensated for the electricity generated by
the projects they host. The most common type of policy for this compensation is net metering,
though some states have established net metering alternatives. Depending on a consumer’s
electricity demand and the size of the solar energy project, solar consumers participating in net
metering or related policies could reduce their electricity bills to zero.21
19 Lazard, Lazard’s Levelized Cost of Energy Analysis—Version 13.0, November 2019, https://www.lazard.com/media/
451086/lazards-levelized-cost-of-energy-version-130-vf.pdf. While LCOE can be indicative of the relative cost
competitiveness of technology types, every power plant’s actual costs will depend upon local circumstances (e.g.,
regional differences in fuel costs, solar resource quality).
20 See Joachim Seel, Andrew Mills, and Ryan Wiser, Impacts of High Variable Renewable Energy Futures on
Wholesale Electricity Prices, and on Electric-Sector Decision Making, Lawrence Berkeley National Laboratory, May
2018. A few regions of the country are beginning to experience this reduction in the effect of solar on the region’s
marginal electricity costs, especially during midday periods. It is distinct from the “duck curve” situation described in
the section “Is Solar Energy Reliable?,” although many proposed options for addressing one would likely also address
the other.
21 Non-solar customers might experience bill impacts too, such as higher electricity rates resulting from lost utility
revenue from solar customers. This cost shift and other issues are discussed in CRS Report R46010, Net Metering: In
Solar Energy: Frequently Asked Questions
Congressional Research Service 9
Is Solar Energy Reliable?22 One potential reliability concern for solar energy is due to its variable nature, dependent on the
availability of sunlight.23 For example, solar PV systems cannot produce electricity at night, and
their output can vary during the day depending on local weather conditions (e.g., cloudiness). The
physical requirements of the electricity system are such that the supply and demand of electricity
must equal each other at all times. Currently, to ensure reliability, other sources of electricity
generation are used when solar energy is not available. Expanding other types of electricity
system infrastructure, such as transmission lines or energy storage assets, could also address this
limitation. Alternatively, policies and regulatory frameworks that incent greater electricity
consumption during daytime hours and less at night (i.e., load shifting) could reduce the
reliability impact of solar energy’s variability.
Another potential reliability concern for solar energy arises from the mismatch between the hours
of the day when generation from solar energy peaks (typically midday) and when electricity
demand peaks (typically several hours later). To maintain reliability, some sources of electricity
have to quickly increase their output to account for the simultaneous drop-off in output from solar
generators and increase in demand. As more solar systems are installed, the need for other sources
that can quickly change output levels typically increases. This situation is often referred to as the
“duck curve” because the shape of the plot showing the difference between demand and output
from solar generators resembles a duck.24 Not all electricity generators are capable of quickly
changing their output, and their deployment may not match the levels of deployment of solar
generators. Load shifting, operational changes to non-solar sources, and deployment of more
flexible resources (e.g., energy storage) are all possible ways to address the duck curve. Some
analysis suggests that electric vehicle deployment might also act as a form of load shifting and
address the duck curve, at least if vehicle charging occurs when output from solar sources is
high.25
A third potential reliability concern comes from the fact that solar PV produces direct current
(DC) electricity. Conventional generators produce alternating current (AC) electricity, and the
grid is optimized for AC. An inverter is an electrical device that converts DC to AC; grid-
connected solar PV systems require an inverter. For this reason, solar is sometimes referred to as
an “inverter-based resource.”26 Generators that produce AC also inherently contribute to grid
reliability by providing what are known as “essential reliability services” or “ancillary services.”27
Most of these services arise from the way generators physically respond to changes in the balance
Brief, by Ashley J. Lawson.
22 Ashley Lawson, Analyst in Energy Policy, was the author of this section.
23 For further discussion see CRS In Focus IF11257, Variable Renewable Energy: An Introduction, by Ashley J.
Lawson.
24 This mismatch and potential reliability concern have been recognized since at least 2008, but the term “duck curve”
was popularized by a 2013 analysis by the California Independent System Operator (CAISO). NREL, Ten Years of
Analyzing the Duck Chart, February 26, 2018.
25 Julia Pyper, “Electric Ridesharing Benefits the Grid, and EVgo Has the Data to Prove It,” Greentech Media, May 9,
2019, https://www.greentechmedia.com/articles/read/electric-ridesharing-benefit-the-grid-evgo.
26 Batteries and wind turbines are also inverter-based resources. Wind turbines do produce AC, but the quality is
insufficient for the grid, so electricity from wind turbines is typically first converted to DC, then converted back to AC
and delivered to the grid.
27 Essential reliability services include inertia, frequency response, and voltage control. For more information about
these services, and the physical factors underlying them, see Federal Energy Regulatory Commission, Reliability
Primer, 2016.
Solar Energy: Frequently Asked Questions
Congressional Research Service 10
of electricity supply and demand over fractions of seconds. Inverter-based resources do not
inherently provide these services, although inverters can be designed (and are being deployed) to
provide some of these services.
The electric power industry and its federal and state regulators have been studying ways to
protect system reliability from the unique nature of inverter-based resources since at least 2008.
Additionally, Congress has funded a variety of research programs related to electric reliability.28
No widespread reliability issues due to solar appear to have occurred to date, though some local
reliability issues have been reported.29
What Federal Tax Incentives Support Solar Energy
Development?30 Various provisions in the Internal Revenue Code (IRC) support investment in solar energy
equipment. These provisions reduce the after-tax cost of investing in solar property, thereby
encouraging taxpayers to invest in more solar property than they would have absent tax
incentives. Tax incentives for solar energy property were first enacted in 1978. Several incentives
for solar are currently part of the tax code.31 Historically, the value of tax incentives for solar has
fluctuated, although the current tax credit rates were established in 2005.32 Under current law,
solar tax incentives are scheduled to phase down in the coming years from their 2019 rates.
Tax Incentives for Businesses
Investments in certain renewable energy property, including solar, qualify for an investment tax
credit (ITC).33 The amount of the credit is determined as a percentage of the taxpayer’s basis in
eligible property (generally, the basis is the cost of acquiring or constructing eligible property).
The credit rate for solar was 30% through 2019, 26% in 2020 and 22% in 2021. Solar energy has
a permanent 10% ITC that is to go into effect in 2022. The expiration dates for the ITC are
commence construction deadlines.34 For example, solar property that was under construction by
28 Some examples are provided in CRS Report R45764, Maintaining Electric Reliability with Wind and Solar Sources:
Background and Issues for Congress, by Ashley J. Lawson.
29 For example, in 2016, a solar farm in Southern California stopped production after a wildfire caused a disturbance at
another part of the electricity transmission system. Analysis of the event showed that the inverter’s design was
responsible for the loss of power. Changes made since the event are meant to prevent similar occurrences in the future,
but the event highlights how system operators are still evolving in their approach to maintaining reliability as solar
energy is deployed to a larger extent. See North American Electric Reliability Corporation, 1,200 MW Fault Induced
Solar Photovoltaic Resource Interruption Disturbance Report, June 2017.
30 Molly F. Sherlock, Specialist in Public Finance, was the author of this section.
31 The Energy Tax Act of 1978 (P.L. 95-618) included a temporary, refundable, 10% tax credit for solar energy
property. As a refundable tax credit, the value of the tax credit could exceed a taxpayer’s tax liability. To the extent that
the tax credit exceeded tax liability, it would have been received as a refund (payment) from the Treasury.
32 For a legislative history of the solar investment tax credit (ITC), see CRS In Focus IF10479, The Energy Credit: An
Investment Tax Credit for Renewable Energy, by Molly F. Sherlock. For a legislative history of the tax credit for
individuals, see Appendix B in CRS Report R42089, Residential Energy Tax Credits: Overview and Analysis, by
Margot L. Crandall-Hollick and Molly F. Sherlock.
33 Internal Revenue Code (IRC) §48.
34 Taxpayers can establish start of construction by beginning physical work of a significant nature or by having incurred
at least 5% of the property’s total cost. Once construction begins, eligibility for tax credits requires that a taxpayer
make continuous progress toward completion. For detailed information, see IRS Notice 2018-59, “Beginning of
Construction for the Investment Tax Credit Under Section 48,” available at https://www.irs.gov/pub/irs-drop/n-18-
Solar Energy: Frequently Asked Questions
Congressional Research Service 11
the end of 2019 may qualify for the 30% tax credit, even if the property is not placed in service
(or ready for use) until a later date.
Special provisions in the tax code allow solar energy property to be depreciated over a shorter
period of time than would normally be the case.35 Specifically, solar energy property is classified
as five-year property in the Modified Accelerated Cost Recovery System (MACRS).36 The
depreciable basis (the amount that is recovered through depreciation deductions over time) of
solar energy property is reduced by 50% of any ITC claimed. Thus, if a 30% ITC was claimed on
a $1 million investment in solar energy property, $850,000 would be depreciated under the
schedule for five-year MACRS property. Accelerating depreciation reduces the after-tax cost of
investing in solar energy property.
Temporarily, through 2022, certain investments in solar energy property are eligible for 100%
bonus depreciation.37 This eligibility means that for these investments, the expense can be
deducted immediately (i.e., expensed). Bonus depreciation is scheduled to phase down after 2022.
It is scheduled to decrease to 80% in 2023, 60% in 2024, 40% in 2025, and 20% in 2026, before
being 0% in 2027. Bonus depreciation may be claimed for new as well as used property.
Regulated public utilities cannot claim bonus depreciation. Tax-exempt organizations, such as
electric cooperatives, also cannot claim bonus depreciation, and typically are limited in their
ability to benefit from tax incentives more broadly.
Tax Incentives for Individuals
Individuals purchasing solar energy property may qualify for the residential energy-efficient
property credit.38 Through 2019, the tax credit for individuals is 30% of the cost of solar electric
property installed on the taxpayer’s residence.39 The tax credit rate is scheduled to be 26% in
2020 and 22% in 2021, with the credit expiring after 2021.40 The tax credit is nonrefundable,
meaning that the amount of the credit a taxpayer can claim in the tax year is limited to the
taxpayer’s income tax liability. However, unused tax credits can be carried forward to the
following tax year.
How Much Do Solar Tax Incentives Cost? Tax expenditure estimates are one source of information on the “cost” of solar tax incentives. Tax
expenditures are, by definition, the amount of forgone revenue associated with special provisions
59.pdf.
35 Generally, assets used in the production of electricity are recovered over a 20-year period. See IRS Publication 946
(2018), “How to Depreciate Property,” available at https://www.irs.gov/publications/p946.
36 IRC §168(e)(3)(B).
37 The 2017 tax revision (P.L. 115-97, commonly referred to as the Tax Cuts and Jobs Act) included a temporary 100%
bonus depreciation for qualified assets bought and placed in service between September 28, 2017, and December 31,
2022. This provision is not unique to solar, but it nonetheless reduces the after-tax cost of making investments in solar
energy property. For more information on bonus depreciation generally, see CRS Report RL31852, The Section 179
and Section 168(k) Expensing Allowances: Current Law and Economic Effects, by Gary Guenther.
38 IRC §25D.
39 A taxpayer’s residence includes any dwelling unit used as a residence by the taxpayer. It is not limited to property
installed on the taxpayer’s primary residence, so tax credits can be claimed for solar energy property installed on
second or vacation homes.
40 For more information, see CRS Report R42089, Residential Energy Tax Credits: Overview and Analysis, by Margot
L. Crandall-Hollick and Molly F. Sherlock.

Solar Energy: Frequently Asked Questions
Congressional Research Service 12
in the tax code, such as tax credits and accelerated cost recovery. For FY2019, the Joint
Committee on Taxation (JCT) estimates that the amount of forgone revenue associated with the
business ITC for solar was $3.4 billion.41 The amount of forgone revenue associated with the
residential energy-efficient property credit for FY2019 was an estimated $2.0 billion. This figure,
however, includes all eligible technologies.42 While most of this was due to solar energy property,
JCT does not estimate the forgone revenue associated with solar separate from other eligible
technologies. The revenue loss for five-year MACRS for all eligible energy property (primarily
wind and solar, but other technologies are eligible) is estimated at less than $50 million in
FY2018. Because bonus depreciation is not a solar- or even energy-specific provision, a tax
expenditure estimate for bonus depreciation for solar is not available.
Internal Revenue Service (IRS) data also provide information on individual claims of tax credits
for solar electric property.43 In 2017, individuals filed 381,242 tax returns that claimed the
residential energy-efficient property credit for solar electric property.44 The total cost of solar
electric property for which tax credits were claimed was $5.5 billion, generating approximately
$1.6 billion in individual income tax credits.45
What State Policies Support Solar Energy
Development?46 Per the Federal Power Act, states have jurisdiction over most aspects of electricity generation and
distribution.47 Consequently, many policies that affect the development solar energy are
implemented by states. This section discusses one common state policy, a renewable portfolio
standard. Other state policies designed to accelerate the deployment of solar energy include net
metering (mentioned in the section “How Does Solar Energy Impact Electricity Costs for
Consumers?”), state tax credits, and allowing third-party ownership (i.e., solar leasing).48
Renewable portfolio standards (or, more broadly, electricity portfolio standards), as typically
implemented, set requirements on utilities to procure a minimum share of their electricity sales
from specified renewable sources such as solar.49 Many factors influence solar energy
development, but renewable portfolio standards are widely credited as being a key factor
41 Joint Committee on Taxation, Estimates of Federal Tax Expenditures for Fiscal Years 2019–2023, JCX-55-19,
December 18, 2019, p. 21. Over the five-year period FY2019 to FY2023, JCT estimates that forgone revenue
associated with the ITC for solar will be $20.8 billion.
42 Taxpayers can also claim the residential energy-efficient property credit for solar water heating, small wind energy,
geothermal heat pump, and fuel cell property.
43 Data from the IRS Statistics of Income files are not directly comparable to JCT’s tax expenditure estimates. Tax
expenditures are estimates of the forgone revenue associated with a tax provision in a given fiscal year. The IRS
Statistics of Income data are estimates based on tax returns filed for a given calendar year.
44 Internal Revenue Service, Individual Income Tax Returns Line Item Estimates, 2017, Publication 4801 (Rev. 9-
2019), 2018, pp. 132-133, https://www.irs.gov/statistics/soi-tax-stats-individual-income-tax-returns-line-item-
estimates.
45 Ibid.
46 Ashley Lawson, Analyst in Energy Policy, was the author of this section.
47 16 U.S.C. §824.
48 For more information of state solar energy policies, including details by state, see North Carolina Clean Energy
Technology Center, Database of State Incentives for Renewables & Efficiency (DSIRE), https://www.dsireusa.org/.
49 Renewable portfolio standard policy design is discussed further in CRS Report R45913, Electricity Portfolio
Standards: Background, Design Elements, and Policy Considerations, by Ashley J. Lawson.
Solar Energy: Frequently Asked Questions
Congressional Research Service 13
historically, as they have provided a policy-driven source of demand for renewable electricity
generation. Twenty-nine states, three U.S. territories, and the District of Columbia are
implementing mandatory electricity portfolio standards, and an additional eight states and one
territory have voluntary standards. Of these, nine jurisdictions have targets of 100% clean energy.
Jurisdictions differ in their definitions of eligible clean energy sources, but solar is eligible in all
cases.50 Nineteen of these policies include specific requirements or extra incentives for solar.51
How Are U.S. Tariffs Affecting Domestic Solar
Manufacturing?52 The United States has applied tariffs on imports of solar energy equipment since 2012. The
different types of equipment comprising a solar PV system are discussed in the section “How
Does Solar Energy Work?”
The Obama Administration imposed double- and triple-digit antidumping and
countervailing duty tariffs on U.S. imports of solar cells and modules from China
in 2012 and 2015 and on imports from Taiwan in 2015.53
The Trump Administration imposed a tariff, which started at 30% in 2018 and
declines by 5% yearly until reaching 15% in 2021, on photovoltaic solar cells and
modules from most countries. The tariff includes some exemptions, such as an
annual 2.5 gigawatt (GW) tariff-free quota for solar cells as long as the final
module assembly takes place in the United States. Several dozen developing
countries are excluded from the tariff as long as their import levels stay small,54
and certain technologies, such as thin-film solar PV products or smaller
crystalline silicon PV cells, are not subject to the tariff.55 This tariff is scheduled
to expire in February 2022, but it may be extended, at the President’s discretion,
for up to four additional years. It is assessed on top of the previously existing
tariffs on Chinese and Taiwanese producers, leading to tariff rates as high as
239% on some PV products made in China.56
In 2018, the Trump Administration placed a 25% duty on steel and a 10% duty on
aluminum imported from most countries. These duties affect BOS equipment,
50 DSIRE, Renewable Portfolio Standard Policies, June 2019, http://ncsolarcen-prod.s3.amazonaws.com/wp-content/
uploads/2019/07/RPS-CES-June2019.pdf.
51 Galen Barbose, U.S. Renewable Portfolio Standards: 2019 Annual Status Report, Lawrence Berkeley National
Laboratory, July 2019.
52 Michaela D. Platzer, Specialist in Industrial Organization and Business, was the author of this section.
53 See CRS Report R42509, U.S. Solar Photovoltaic Manufacturing: Industry Trends, Global Competition, Federal
Support, by Michaela D. Platzer.
54 The solar tariff excludes countries that are part of the Generalized System of Preferences (GSP) list as long as these
individual countries account for less than 3%, or 9% collectively, of U.S. imports of solar cells in any given year. A
few countries have been removed from the list; for example, Turkey and India were taken off in spring 2019.
55 The U.S. Trade Representative recently announced that bifacial solar modules, which generate electricity on both
sides, lost their exemption at the end of October 2019, a change that could benefit U.S.-based manufacturers such as
First Solar and SunPower.
56 Section 201 of the Trade Act of 1974 (19 U.S.C. §2251) provides temporary relief for a U.S. industry from import
competition. See CRS In Focus IF10786, Safeguards: Section 201 of the Trade Act of 1974, by Vivian C. Jones.

Solar Energy: Frequently Asked Questions
Congressional Research Service 14
such as PV brackets, module frames, cabling, power electronics housing,
batteries, and wiring,57 and are projected to add 2% - 5% to PV system costs.58
Additional tariffs on a long list of Chinese products, including inverters and other
solar equipment, were imposed at a 10% rate in September 2018. The rate was
raised to 25% in May 2019.59
The tariff effects have not been felt evenly across the solar industry’s manufacturing segments
(i.e., polysilicon production, ingot and wafer production, solar cell production, and module
assembly). To date the tariffs have not encouraged expansion of U.S. manufacturing in the more
technologically advanced segment of the PV manufacturing supply chain, namely the production
of crystalline-silicon solar cells. However, U.S. production of solar modules, into which cells are
assembled, rose in 2018, and a few companies, including one Chinese manufacturer, have opened
solar module assembly plants in the United States. The increased domestic production of modules
draws on imported parts and components, reflecting the industry’s global supply chain.
U.S. solar tariffs have negatively affected the one segment of the PV supply chain in which the
United States traditionally has been the most competitive, the production of polysilicon, the key
raw material used in the manufacture of the vast majority of solar cells. China retaliated against
the Obama Administration tariffs by imposing double-digit tariffs on polysilicon shipped from the
United States to China, which had been a significant export market for U.S. producers. These
tariffs have had an adverse effect on U.S. production of polysilicon, which shrank 40% between
2015 and 2018.60 The U.S. share of global polysilicon production is also down, falling to 11% of
the global total in 2017 from 29% in 2010.61 The production of wafers made from polysilicon,
which in turn are cut to make individual cells, has largely been discontinued in the United
States,62 with China accounting for more than 80% of global wafer production in 2017.63
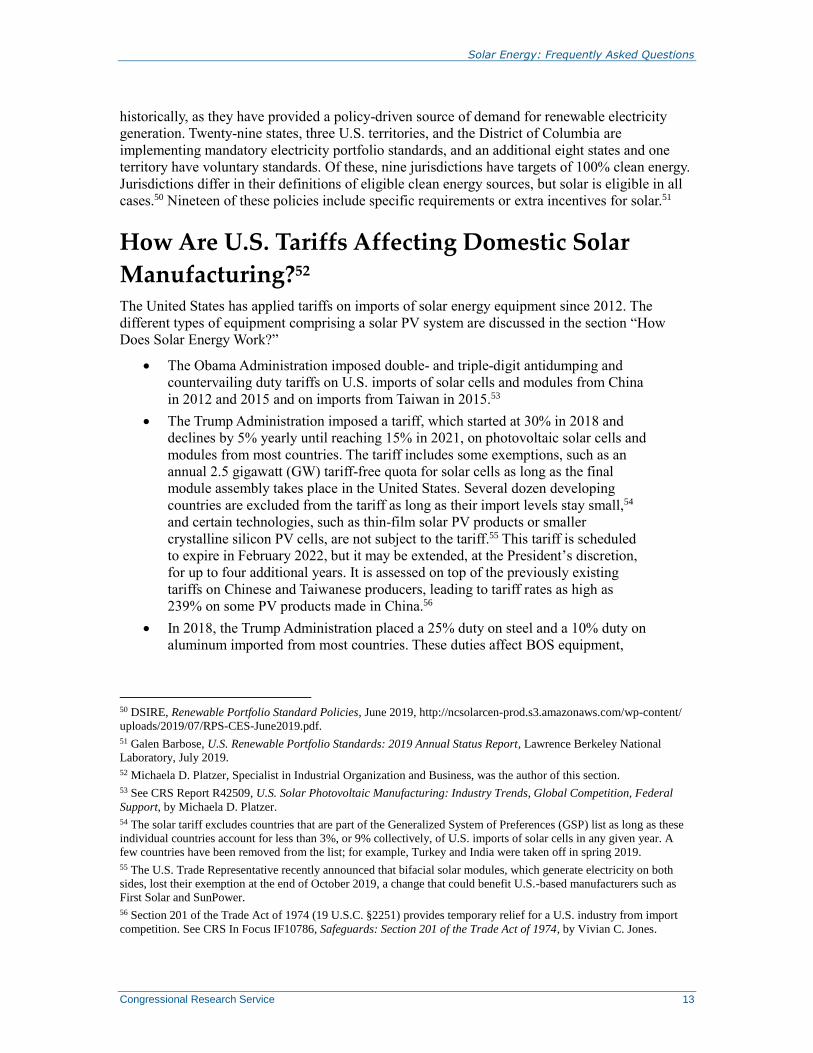
Solar cell production has significant economies of scale, so manufacturers generally centralize
production in large plants. As shown in Figure 5, annual domestic U.S. PV cell production shrank
to 124 megawatts (MW) in 2018, the lowest level since 2010.64 Domestic manufacturers of PV
modules import nearly all of their solar cells, which represent a substantial portion of the cost and
value of a finished module (27% in Q4 2018, according to Wood Mackenzie, an energy
57 Section 232 of the Trade Expansion Act of 1962 (19 U.S.C. §1862, as amended) permits the President to levy tariffs
and quotas on imports found to threaten or impair U.S. national security. Excluded from the Section 232 tariffs are
several countries, including Canada, Mexico, and the European Union.
58 David Feldman, Jack Hoskins, and Robert Margolis, Q4 2017/Q1 2018 Solar Industry Update, NREL, May 2018, p.
5.
59 Section 301 of the Trade Act of 1974 (19 U.S.C. §2411-2420) allows the Office of the United States Trade
Representative (USTR), at the direction of the President, to impose import restrictions if USTR determines that a
foreign country’s acts, policies, or practices are unreasonable and discriminatory. See CRS Report R45529, Trump
Administration Tariff Actions (Sections 201, 232, and 301): Frequently Asked Questions, coordinated by Brock R.
Williams.
60 Solar Energy Industries Association (SEIA)/Wood Mackenzie Power & Renewables, U.S. Solar Market Insight,
2018 Year in Review, Full Report, March 2019, pp. 58-59.
61 International Energy Agency Photovoltaic Power Systems Program (IEA-PVPS), Trends 2018 in Photovoltaic
Applications, December 3, 2018, p. 55.
62 According to NREL analysis, Panasonic, SolarWorld, and SunEdison had produced polysilicon ingots and wafers for
the solar industry in the United States, but by 2017 each had halted all U.S. production of ingots and wafers. Robert
Margolis, Daniel Feldman, and Daniel Boff, Q4 2016/Q1 2017 Solar Industry Update, NREL, April 25, 2017, p. 61.
63 IEA-PVPS, Trends 2018 in Photovoltaic Applications, December 3, 2018, p. 56.
64 Robert Margolis, David Feldman, and Daniel Boff, Q4 2016/Q1 2017 Solar Industry Update, NREL, April 25, 2017,
p. 61, and SEIA/Wood Mackenzie, U.S. Solar Market Insight, 2018 Year in Review, March 2019, pp. 58-59.
Solar Energy: Frequently Asked Questions
Congressional Research Service 15
consultancy).65 China accounted for more than two-thirds of the world’s solar cell production in
2017.66
Figure 5. U.S. Cell and Module Production
Annual U.S. Production in Megawatts (MW)
Source: Solar Energy Industries Association (SEIA)/Wood Mackenzie, Annual U.S. Solar Market Insight Reports
and National Renewable Energy Laboratory (NREL), Quarterly Solar Industry Update, https://www.energy.gov/eere/
solar/quarterly-solar-industry-update.
Despite the various trade actions in 2018, solar cell prices in the United States declined from 20
cents per watt at the beginning of that year to 10 cents per watt at year-end 2018, which
represented a 50% decrease in cost.67 Meanwhile, figures from the United States International
Trade Commission (ITC) show U.S. imports of solar cells more than doubled by value from 2016
to 2018. This trend continued despite the additional tariffs on solar cells and modules that took
effect in 2018, with U.S. imports of solar cells rising 32% during the first seven months of 2019
compared to the same period in 2018.68
One possible reason for the rise in cell imports is that the Trump Administration’s solar tariff
allows up to 2.5 GW of unassembled solar cells to be imported into the United States duty-free
65 SEIA/Wood Mackenzie, March 2019, p. 60.
66 IEA-PVPS, Trends 2018 in Photovoltaic Applications, December 3, 2018, p. 56.
67 SEIA/Wood Mackenzie, U.S. Solar Market Insight, 2018 Year in Review, Full Report, March 2019, p. 60.
68 CRS analysis of trade data by 10-digit Harmonized Tariff Schedule (HTS) uses codes 8541.40.6025 and
8541.40.6030 to compile solar cell data from the U.S. International Trade Commission’s (ITC) dataweb.

Solar Energy: Frequently Asked Questions
Congressional Research Service 16
each year the tariff is in effect. These can then be assembled into solar modules in the United
States.69 From February 2018 to the end of 2018, about a quarter, or 650 MW, of the duty-free
tariff rate quota was filled. The low fill rate during the first year may be because there was not
enough module assembly capacity in the United States to use those cells, and because some PV
cells were stockpiled prior to the imposition of the tariff. If the 2.5 GW quota is reached in any
year, foreign-made cells will be subject to U.S. tariffs for the balance of that year.
The uncertainty surrounding the tariffs limits the incentive to expand solar cell production in the
United States. For example, the Trump Administration’s solar tariff is initially set to last four
years, with the tariff rate declining by five percentage points in each year the tariff is in effect.70
The other tariffs may be discontinued at the President’s discretion. A new cell factory would need
a large capital investment and about two years to construct. The possibility that some or all of the
tariffs will be eliminated in the near future may discourage creation of new manufacturing
capacity.71 At present, Panasonic is the only major domestic producer of crystalline-silicon solar
cells, and several producers of solar cells have closed U.S. plants since 2012.72
Unlike cell production, domestic module assembly is growing. A count by the Solar Foundation, a
trade group, indicates that approximately 20 factories assembled PV modules in the United States
in 2018.73 Annual U.S. PV module production increased to 1.4 GW in 2018, up from 970 MW in
2017, but down from a record high of 1.7 GW in 2016, the year the federal investment tax credit
had been set to expire (see Figure 5).74 It typically takes about six months to construct a new
solar-module assembly facility and begin operation at scale. PV Magazine, an industry
publication, reported that 3.9 GW of new module manufacturing capacity was under construction
or had recently come online as of late 2018.75 Hanwha Q Cells, a South Korean company, and
Jinko Solar, a Chinese company (the largest module producer in the world), have opened new
module-assembly facilities in the United States.76 A Canadian company, Heliene, reopened a
shuttered solar module facility in Minnesota.77 NREL reports that several additional solar
companies expect to add another 4 GW of U.S. module assembly capacity.78
69 The quota does not have a country-by-country allocation; it is applied on a first-come, first-served basis. As of
November 4, 2019, 63% of the quota was filled, according to U.S. Customs and Border Protection. The quota year is
from February to February, not calendar or fiscal years.
70 The solar tariff fell from 30% to 25% on February 7, 2019, declining 5% annually to 15% during the period from
February 7, 2021 to February 6, 2022.
71 Sunpreme announced plans to open a factory to produce bifacial cells and modules in Texas in 2019, but no other
details about construction of the facility or when it will become operational are currently available. Also see, Julia
Pyper, “Did Trump’s Solar Tariffs Just Launch a US Manufacturing Renaissance?,” GTM, January 24, 2018.
72 United States International Trade Commission (USITC), Crystalline Silicon Photovoltaic Cells and Modules from
China, Publication 4874, March 2019, p. III-2.
73 The Solar Foundation, National Solar Jobs Census 2018, February 12, 2019, p. 39.
74 Robert Margolis, David Feldman, and Daniel Boff, Q4 2016/Q1 2017 Solar Industry Update, NREL, April 25, 2017,
p. 61; and SEIA/Wood Mackenzie, U.S. Solar Market Insight, 2018 Year in Review, March 2019, pp. 58-59.
75 Christian Roselund and John Weaver, “2018 Solar Power Year in Review (Part 1),” PV Magazine, December 20,
2018.
76 Besides Hanwha Q Cells’ new manufacturing plant in Georgia, the company assembles modules in South Korea,
Malaysia, and China. Jinko Solar, the first China-based solar manufacturer to locate a module assembly factory in the
United States, also assembles solar modules in China and Malaysia. According to press reports, Jinko Solar has said
that it will import cells from Malaysia, not China, for its factory in Florida.
77 See Emma Foehringer Merchant, “The Status of US Solar Manufacturing, One Year After Tariffs,” Green Tech
Media, February 25, 2019.
78 David Feldman and Robert Margolis, Solar Industry Update, Q4 2018/Q1 2019, NREL, May 2019, p. 56.

Solar Energy: Frequently Asked Questions
Congressional Research Service 17
In 2017, China accounted for more than 70% of total global module production.79 One challenge
for domestic producers is that U.S. module facilities are smaller than the most efficient plants in
Asia, meaning they generally lack the economies of scale that are central in driving down unit
costs. The two companies—SolarWorld and Suniva—that petitioned the Trump Administration to
put tariffs on imported cells and modules have both ceased production.
Because U.S. tariffs are much higher on imports from China and Taiwan than on products of other
countries, the tariffs have encouraged manufacturers of cells and modules to serve the U.S.
market from other Asian countries. PV module shipments into the United States from Malaysia,
South Korea, Vietnam, Mexico, and Thailand have largely replaced module imports from China,
which shrank to less than 1% of total U.S. imports by 2018. These five countries accounted for
nearly 85% of $2.8 billion in PV modules imported into the United States in 2018.80
Inverters made in China now face a 25% U.S. tariff. To avoid the U.S. tariff, two large suppliers
of inverters to the U.S. market are reportedly planning to shift production from China to other
locations.81 According to the Solar Energy Industries Association (SEIA), U.S. inverter
production is declining, primarily due to the closure of two major U.S. facilities at the end of
2016.82 Backsheets and junction boxes are other examples of solar energy components needed for
solar panel assembly, and they are also among the products that face a 25% tariff if they are
imported from China.83
Module prices globally have declined steeply over the past decade. While prices in the U.S.
market have fallen as well, despite the tariffs on imported cells and modules, they remained 61%
higher, on average, than the global average selling price in 2018, according to NREL.84 One
factor contributing to this price differential is the preference of U.S. purchasers for Tier 1 solar
modules, which may be 10% to 30% more expensive and may be more reliable than Tier 2 and
Tier 3 solar modules, although they may not necessarily be the best-performing modules on the
market.85 Projects using Tier 1 modules may be easier to finance than those using modules not
classified as Tier 1.
79 IEA-PVPS, Trends 2018 in Photovoltaic Applications, December 3, 2018, p. 56.
80 CRS analysis of trade data by 10-digit Harmonized Tariff Schedule (HTS) uses codes 8541.40.6015, 8541.40.6020,
and 8541.40.6035, to compile module data from the ITC’s dataweb.
81 Every major inverter manufacturer makes its solar inverters outside the United States, primarily in China. According
to Wood Mackenzie, California-based Enphase and Israeli-based SolarEdge supplied 89% of the U.S. market for
inverters last year. SolarEdge makes its products in China and operates an inverter factory in Hungary. It also has plans
for a new manufacturing site in Vietnam. Enphase expects to move some inverter manufacturing from China to
Mexico. Separately, China’s Huawei, which makes solar inverters and accounted for more than one-fifth of the global
market in 2018, has ceased U.S. sales, according to press reports, after about a dozen Members of Congress called for
its inverters to be banned from the U.S. electricity network. Wood Mackenzie says Huawei represented around 4% of
the U.S. market.
82 SEIA/Wood Mackenzie, U.S. Solar Market Insight, 2017 Year in Review, March 2018, pp. 57-58.
83 Backsheets are intended to electrically insulate the module and protect it from moisture, wind, and ultraviolet light
damage, and a PV junction box housing electrical connections is an enclosure usually installed on the backside of a
solar module. The majority of junction boxes are made in China.
84 David Feldman and Robert Margolis, Q4/Q1 2019 Solar Industry Update, NREL, May 2019, p. 60.
85 Tier 1 solar module manufacturers include Sunpower, LG, and Jinko. The Tier 1 designation was developed by
Bloomberg New Energy Finance as a guide to banks in lending for solar products. In general, Tier 1 modules are those
produced by vertically integrated companies that have been in business for at least five years, have highly automated
production facilities, and have received financing from multiple banks. See Bloomberg New Energy Finance,
“BloombergNEF PV Module Tier 1 List Methodology,” March 3, 2019.
Solar Energy: Frequently Asked Questions
Congressional Research Service 18
What U.S. Jobs Are Supported by the Solar
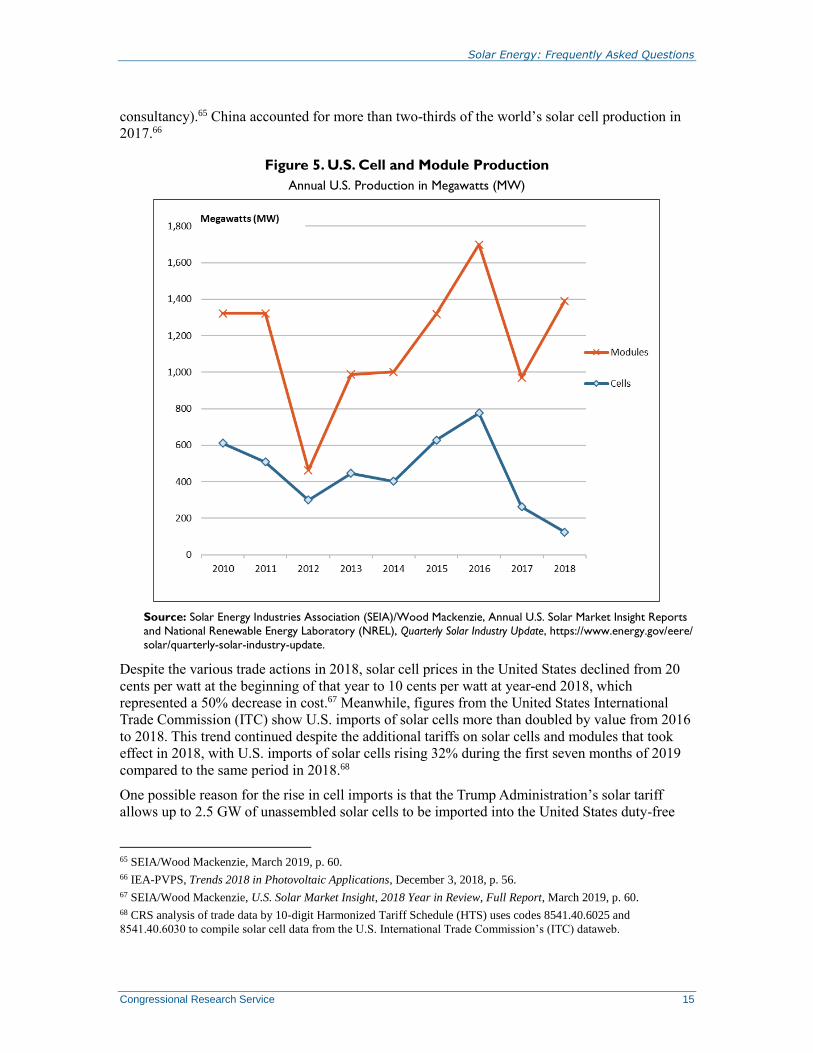
Industry?86 The federal government does not collect data on employment in the solar energy industry.
According to a report by the Solar Foundation, the industry provided 242,300 full-time equivalent
jobs in 2018 (Figure 6).87 Of these positions, 85% involved work other than manufacturing, such
as installation of solar systems and project management, wholesale trade and distribution, and
operations and maintenance.
Figure 6. Domestic Solar Industry Employment
2010-2018
Source: Solar Foundation, National Solar Jobs Census, 2018. 2019 data are projected.
Notes: “All Others” refers to activities not classified elsewhere, such as research and development and finance.
In 2018, the Solar Jobs Census added a new sector for operations and maintenance, with jobs in this segment
totaling 11,164. The census does not give a count for employment related to polysilicon production in the
United States.
Most employment in the solar energy industry—64% in 2018—involves two solar sectors, the
installation of solar systems and project development, whether on rooftops of individual homes or
larger projects. Although the federal government does not track employment specific to the solar
energy industry, the Bureau of Labor Statistics (BLS) publishes occupational data for solar PV
installers. These data indicate that employment in PV installation may be significantly lower than
the figures reported by SEIA for the combined solar installation and project development segment
of the industry. BLS predicts the overall employee occupational count for solar PV installers of
9,700 workers in 2018 will rise by 63% to 15,800 jobs in 2028.88 BLS predicts that solar
86 Michaela D. Platzer, Specialist in Industrial Organization and Business, was the author of this section.
87 The Solar Foundation, National Solar Jobs Census 2018, February 12, 2019, p. 15.
88 The Solar Foundation claims that BLS’s Standard Occupational Classification (SOC) category for solar installers is
incomplete because it defines solar PV installers too narrowly by omitting various workers from its figures, including
installation company support staff, project development staff, or workers completing solar site prep work. The
employment projection is from BLS’s Employment Projections Program (EPP), “Fastest Growing Occupations, 2018
and Projected 2028,” Table 1.3, September 4, 2019.

Solar Energy: Frequently Asked Questions
Congressional Research Service 19
installation will be the fastest-growing occupation in the nation over the next decade. BLS reports
the median pay for a PV installer in 2018 was $42,680 per year, or $20.52 per hour, about 13%
above the national median for all workers.89
At the end of 2018, the number of solar jobs as reported by the Solar Foundation was
approximately 7% lower than in 2016, with installation jobs accounting for most of the decline.
The annual number of PV systems installed in the United States shrank 14% to about 327,000 in
2018 from approximately 380,000 in 2016.90
Direct employment in U.S. solar manufacturing was about 34,000 workers in November 2018,
according to the Solar Foundation, accounting for about 14% of total employment related to the
solar energy sector. The number of reported jobs dropped by 4,400 from November 2016. One
reason for the decline may be that the tariffs raised the cost of foreign inputs that are assembled
into solar systems in U.S. factories, making those factories’ products more expensive.
Due to automation, a significant increase in employment in U.S. solar manufacturing is
considered to be unlikely. One market research firm says module manufacturing accounted for
about 1,200 U.S. jobs in 2018, but is projected to fall to just over a 1,000 workers by 2024.91 A
review of publicly available information by CRS suggests that there are fewer than 2,000 workers
involved in domestic polysilicon production. There is also limited employment related to the
assembly of solar factory production equipment for wafers, cells, and modules in the United
States because this equipment is made mainly in Europe and China.
What Land Requirements Does Solar Energy
Have?92 Land is required for the extraction, production, and consumption of energy and for the generation,
transmission, and distribution of electricity. There is not a generally accepted standard metric or
methodology for a comparison of land use impacts across energy technologies.93 Different studies
evaluate land use in different ways and may or may not account for upstream and downstream
process steps associated with electricity generation (e.g., extraction of fuels or resources used for
electricity generation), for the intensity of the impact of the activity on the occupied land, or for
the time-to-recovery.94 Other factors that may not be incorporated into comparisons include
location-dependent factors, such as solar incidence, or co-location of different activities with the
energy generation, such as solar panels on rooftops.
89 Solar PV installer became a federal occupational category in 2010. BLS, Occupational Outlook Handbook, Solar
Photovoltaic Installers (OES 47-2231), May 2018, https://www.bls.gov/ooh/construction-and-extraction/solar-
photovoltaic-installers.htm.
90 The Solar Energy Industry Association provided CRS with figures on the annual number of PV installations and
cumulative PV installations in the United States by email on August 19, 2019.
91 Victor Adeleke, Solar Panel Manufacturing in the United States, IBISWorld, March 2019, p. 36.
92 Corrie Clark, Analyst in Energy Policy, was the author of this section.
93 Llorenç Milà i Canals, Christian Bauer, and Jochen Depestele, et al., “Key Elements in a Framework for Land Use
Impact Assessment Within LCA,” The International Journal of Life Cycle Assessment, vol. 12, no. 1 (2007), pp. 5-15.
94 “Time-to-recovery” refers to the concept that some uses of land require more time for the land to return to its
previous state than other uses. Some argue that uses where the land can recover quickly should not be counted the same
as use that delays full recovery for decades or centuries. Department of Energy, “Chapter 10: Concepts in Integrated
Analysis,” Quadrennial Technology Review, (2015), https://www.energy.gov/quadrennial-technology-review-2015, p.
388.

Solar Energy: Frequently Asked Questions
Congressional Research Service 20
Estimates of power density for different energy sources vary by methodology and technology
type studied. Some estimates consider the area of the power plant only, while others include land
areas used for fuel production, electricity transmission, waste disposal, or other factors. Estimates
can change with time as technology innovation leads to increased energy efficiency; such is the
case for solar energy, with newer and more efficient technologies leading to increased power
density.
When considering total land area occupied, renewable energy sources generally require more land
to produce the same amount of electricity than nonrenewable sources.95 One metric used in the
energy sector that accounts for land use is power density, which can be expressed as a unit of
power per unit of area (e.g., watts per square meter). A review of 54 studies which examined the
power density of electric power production in the United States found that solar energy has a
lower power density than natural gas, nuclear, oil, and coal, but solar energy has a higher power
density than wind, hydro, biomass, and most geothermal.96 The review accounted for energy
conversion efficiencies, capacity factors, and infrastructure area, including infrastructure
associated with energy production (e.g., mines). The review did not control for time, reporting
that the earliest study included in the analysis was from 1974; however, the review concluded
that, of the nine energy types evaluated, only solar had a statistically significant relationship
between power density and time.97 Published values for power density for solar systems range
from 1.5 to 19.6 We/m2.98 Generally, solar thermal and utility-scale photovoltaic (PV) were found
to require more land area to produce the same amount of electricity than residential PV and
concentrated solar. While the technology for residential PV and utility-scale PV is similar, sloped
rooftops may allow more sunlight to reach otherwise flat panels for residential systems, and the
spacing of panels at utility-scale facilities (regardless of tilt) to provide for maintenance and to
avoid shading may lead to lower power densities.99 Another review found that both location-
dependent parameters and technology-dependent parameters affect the variability of land use
energy intensity of solar electricity generation.100
In addition to power density, other factors may be relevant when evaluating energy sources and
land use. Two examples are land use and land cover change, which account for the previous state
95 John van Zalk and Paul Behrens, “The Spatial Extent of Renewable and Non-renewable Power Generation: A
Review and Meta-analysis of Power Densities and Their Application in the U.S.,” Energy Policy, vol. 123 (2018), pp.
83-91; hereinafter van Zalk and Behrens 2018.
96 Van Zalk and Behrens 2018. The review considered nine energy sources: biomass, coal, geothermal, hydro, natural
gas, nuclear, oil, solar, and wind. The review also accounted for energy conversion efficiencies, capacity factors, and
infrastructure area, including infrastructure associated with energy production (e.g., mines).
97 Van Zalk and Behrens 2008 reported p-values and considered a p-value less than 0.05 to be significant. For solar
energy, the p-value was found to be 0.001. According to the review, solar energy power density increased by an
average of 0.42 We/m2 per year.
98 Van Zalk and Behrens 2008. We refers to the electrical power, in watts, produced by a generator. It is distinct from
Wth which refers to the thermal power produced by a generator.
99 P. Denholm and R. Margolis, The Regional Per-Capita Solar Electric Footprint for the United States, National
Renewable Energy Laboratory, Technical Report, NREL/TP-670-42463, December 2007, pp. 5-6,
https://www.nrel.gov/docs/fy08osti/42463.pdf.
100 Land use energy intensity can be considered as the amount of land used for a defined amount of electricity
generation. Such parameters include solar insolation (the amount of sunlight shining on any location), packing factor
(the ratio of a solar array area to the actual land area), system efficiency, and capacity factor (the ratio of total energy
generated during a period of time to the maximum possible electrical energy that could be generated during the same
period of time). Robert M. Horner and Corrie E. Clark, “Characterizing variability and reducing uncertainty in
estimates of solar land use energy intensity,” Renewable and Sustainable Energy Reviews, vol. 23 (July 2013), pp. 129-
137.

Solar Energy: Frequently Asked Questions
Congressional Research Service 21
of the land before an energy project was developed.101 In the case of solar, some solar energy
systems may change land use and land cover to a smaller degree than others. For example,
rooftop solar PV systems do not change how the underlying land is used or covered. Another
factor is co-location of activities where land can be occupied but not used exclusively by its
occupier. For example, farming and grazing can occur on land around wind turbines and
underneath solar panels (this dual-use solar is referred to as “agrivoltaics”). Time-to-recovery is
another factor to consider. Some technologies may impact land such that the land can recover to
its previous state after use in a matter of months or a few years; other technologies may impact
the land in such a way that it may take decades or centuries for the land to recover to its previous
state. According to the Department of Energy, “further work is critically needed to determine
appropriate land-use metrics for meaningful cross-comparisons.”102
What Are Potential Impacts of Solar Energy
Development on Agriculture?103 Agricultural land has become increasingly desirable for siting utility-scale solar PV systems (i.e.,
solar farms) for electrical generation. One concern that some raise about solar farm development
is that siting solar arrays on agricultural lands can also displace agricultural production.104 With
solar generation capacity in the United States increasing from less than 1 GW in 2010 to 50 GW
in 2018, demand for large tracts of reliably sunlit, cleared, unobstructed acreage is also
growing.105 California, North Carolina, Texas, and Florida had the largest U.S. cumulative solar
capacity in the third quarter of 2019, with California the largest.106
While some individual farm operations develop PV arrays through their own investments in solar
technologies as an income supplement or as an on-site energy source for their farming operations,
private solar development companies have increasingly turned to long-term leasing arrangements
with farmers to site PV arrays. Farmers benefit from the lease and solar developers get access to
the scarce commodity of land. Prime agricultural lands often represent very large tracts of land in
potentially suitable locations. As important as large tracts of acreage may be, other variables
determine whether a satisfactory lease is negotiated. The quality of the terrain, local weather
factors, proximity to grid connections, local transmission capacity, proximity to main roads,
conservation and environmental impact issues, local/regional land use regulations, and flood risks
all contribute to the suitability of particular agricultural acreage for a solar development company.
101 “Land use” refers to activities that take place on the land such as growing food. “Land cover” refers to the physical
characteristics of the land surface such as grassland or concrete. D.G. Brown, C. Polsky, and P. Bolstad, et al., “Ch. 13:
Land Use and Land Cover Change,” Climate Change Impacts in the United States: The Third National Climate
Assessment, J. M. Melillo, Terese (T.C.) Richmond, and G. W. Yohe, Eds., U.S. Global Change Research Program,
2014, pp. 318-332, https://nca2014.globalchange.gov/report/sectors/land-use-and-land-cover-change.
102 Department of Energy, Quadrennial Technology Review: An Assessment of Energy Technologies and Research
Opportunities, September 2015, p. 407.
103 Tadlock Cowan, Analyst in Natural Resources and Rural Development, was the author of this section.
104 It takes about 32 acres of solar power panels to meet the demands of 1,000 homes. See Land-Use Requirements for
Solar Power Plants in the U.S., NREL/TP-6A20-56290, June, 2013. Under a U.S. Department of Energy scenario, U.S.
solar PV deployment is predicted to grow to an estimated 1,618 gigawatts by 2050, requiring an estimated 6.6 million
acres of land, approximately equivalent to the size of Massachusetts. See Megan Day, Land Use Planning for Large-
Scale Solar, NREL/PR-7A40-72470. September 27, 2018.
105 U.S. Department of Energy, Electric Power Annual 2018, 2019.
106 SEIA/Wood Mackenzie, Solar Market Insight 2019 Q4 Report, 2019.
Solar Energy: Frequently Asked Questions
Congressional Research Service 22
In potential lease arrangements, farmers are often interested in whether or not the PV array will
curtail, if not completely end, their ability to continue farming. Typically, contractors constructing
solar farms will strip the topsoil and then mount the PV modules on concrete footings. Not only
does this remove the land from agricultural production during the period of the lease, it can
become prohibitively expensive to restore the land to production after a lease terminates.107 The
concern that the agricultural land can be permanently lost to production even after a lease ends is
a factor when considering whether to maximize energy capacity on land at the expense of
agricultural production. Suitable land where solar generation can be maximized will tend to be
highly compensated relative to the potential of the agricultural operation. For example, while
marginally productive acreage may be tilled, its yield potential is often quite low, and the
environmental costs can be high (e.g., erodible soils). This type of acreage may be suitable for
maximization of solar generation without significant threat to overall agricultural production.
Under other lease arrangements, solar energy development might occur without detriment to
farming. While the land is attractive for siting solar PV arrays, it is also valuable as productive
farmland. In these arrangements, vegetation growth may be possible under and around the solar
system. The University of Massachusetts Crop Research and Education Center is exploring
agrivoltaics, where modules are raised high enough off the ground and spaced in a way that crops
can still grow around and beneath them, but also permit an economically viable solar
development.108 Fear of a decline in agricultural production may be an important factor in some
opposition to solar development, particularly where the value of the land for solar exceeds the
current value for agriculture. Research examining the impact on agricultural yields of solar
development could prove important to informing future investment in solar generation.109 State
and federal grants to support development of dual-use agrivoltaic systems, such as the Solar
Massachusetts Renewable Target (SMART), could help offset these systems’ additional costs.110
Because U.S. agricultural land often enjoys favorable property tax treatment, different
states/regions may establish regulations governing the use of agricultural lands for
nonagricultural purposes. Local and regional planning commissions can constrain solar
development, and may require various permits and clearances that could challenge the longer-
term economic feasibility of the solar development, regardless of the suitability of the land for
solar deployment. Successfully co-locating agricultural production with solar development could
reduce some of the land use planning constraints—or outright prohibitions—that may come with
productive agricultural lands proposed for solar development.
107 A typical lease from a solar development company may have a life of 30-35 years.
108 Shemkus, Sarah, “Agrivoltaics: Solar panels on farms could be a win-win,” Civil Eats, January 2019.
109 Some research has shown that varieties of lettuce, tomatoes, pasture grass, and biogas maize produce greater yields
in the shade than under full sunlight. See Adeh, Elanz H., Good, Stephen P, Calaf, M, Higgins, Chad W. “Solar PV
power potential is greatest over cropland.” Scientific Reports 9, August 7, 2019.
110 The SMART program aims to create a long-term solar incentive program in the Commonwealth.
https://www.mass.gov/solar-massachusetts-renewable-target-smart.

Solar Energy: Frequently Asked Questions
Congressional Research Service R46196 · VERSION 2 · NEW 23
Author Information
Ashley J. Lawson, Coordinator
Analyst in Energy Policy
Corrie E. Clark
Analyst in Energy Policy
Molly F. Sherlock
Specialist in Public Finance
Tadlock Cowan
Analyst in Natural Resources and Rural
Development
Michaela D. Platzer
Specialist in Industrial Organization and Business
Disclaimer
This document was prepared by the Congressional Research Service (CRS). CRS serves as nonpartisan
shared staff to congressional committees and Members of Congress. It operates solely at the behest of and
under the direction of Congress. Information in a CRS Report should not be relied upon for purposes other
than public understanding of information that has been provided by CRS to Members of Congress in
connection with CRS’s institutional role. CRS Reports, as a work of the United States Government, are not
subject to copyright protection in the United States. Any CRS Report may be reproduced and distributed in
its entirety without permission from CRS. However, as a CRS Report may include copyrighted images or
material from a third party, you may need to obtain the permission of the copyright holder if you wish to
copy or otherwise use copyrighted material.


![Solar Power Frequently Asked Questions[1]](https://static.fdocuments.us/doc/165x107/577d33c21a28ab3a6b8ba800/solar-power-frequently-asked-questions1.jpg)