SOL PLAATJE MUNICIPALITY
118
1 SOL PLAATJE MUNICIPALITY THE ANNUAL REPORT 2010/11 Version 1.7 17 January 12
Transcript of SOL PLAATJE MUNICIPALITY
1
SOL PLAATJE MUNICIPALITY
THE ANNUAL REPORT 2010/11
Version 1.7 17 January 12
2
TABLE OF CONTENT
1. INTRODUCTION AND OVERVIEW 3
1.1. Mayor’s Foreword 4 1.2. Overview of the Municipality 5 1.3. Executive Summary 11
2. PERFORMANCE HIGHLIGHTS 17
2.1 IDP Strategic Development Objectives 17 2.2 Performance on Consolidated Service Delivery Targets 2010/11 20 2.3 Backlogs in Service Delivery as at 30 June 2011 54 2.4 Level and Standard of Service 56 2.5 Relating Backlogs to Municipal Spending on Service Delivery
Infrastructure 59 2.6 Relevance to the Municipal IDP 62 2.7 Approval of Land Use Change and Building Plans 2010/11 63
3. HUMAN RESOURCE AND OTHER ORGANISATIONAL
MANAGEMENT 67
3.1 General Information 67 3.2 Organisational Structure 68 3.2. Detailed Information 69
4. AUDITED STATEMENTS AND RELATED FINANCIAL INFORMATION 78
4.1 General Overview 78 4.2. Financial Performance 79 4.4 High Level Summary of Performance per sector 79 4.3 Budget to Actual Comparisons 80 4.5 The Audit Report 94 4.6 Audited Financial Statements 99 4.7 Report of the Audit Committee 4.8 Municipal Public Accounts Committee 4.9 Oversight Report
5. FUNCTIONAL AREA SERVICE DELIVERY REPORT

3
LIST OF TABLES
Table 1: The summary of financial performance is indicated in the table below; Table 2: Performance against Consolidated Service Delivery Targets 2011/12
SDBIP
4
CHAPTER 1: INTRODUCTION AND OVERVIEW 1.1 Mayor’s Foreword
The mandate of the governing party from the electorate was to improve the quality of their lives. This mandate finds expression in the 5-year strategic development agenda as captured in the IDP of the municipality. As we reflect on the events leading up to the tabling of this annual report we can with confidence state that our objective to stabilize the overall functionality of the municipality has yielded positive results. We have greatly enhanced service delivery capabilities in the municipal area. The completion of the first phase of refurbishment of the Homevale Waste Water Treatment Plant will provide more capacity and improve the quality of the effluent water. This is in addition to other bulk infrastructure initiatives i.e. additional electricity capacity that has been sourced from Eskom, and the refurbishment of the old water purification plant at Riverton. Several multi million rand projects have also been tabled for development after the upliftment of the moratorium on land and development. All our portfolio committees are functioning properly, decisions are properly and and procedurally taken, and reports timeously and correctly tabled. The required overall financial position of Sol Plaatje Municipality has improved and capital spending being within a required norm. In terms of improved audit outcomes we are on track to achieve a clean audit earlier than the projected date of 2014. Investment Plans were approved by council which will see a huge capital injection in infrastructure over the next 24 months. This lays the basis to unlock development in Sol Plaatje Municipality well into the next 10 years. Positive feedback has also been received from external bodies such as National Treasury and Development Bank of South Africa with Moody’s reflecting a “positive” outlook for the Sol Plaatje Municipality. Admittedly, much work lies ahead, but we can with confidence state that the Sol Plaatje Municipality functions at a higher level and meets its service delivery plans with few exceptions
5
1.2 Overview of the Municipality
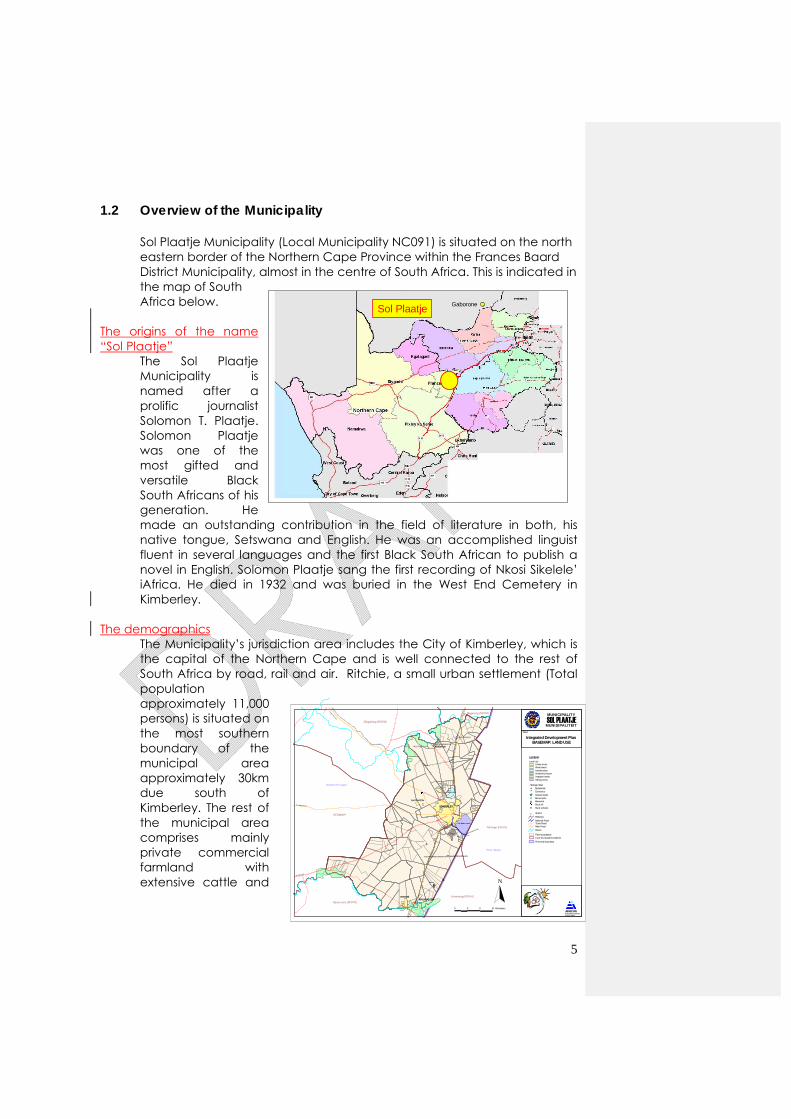
Sol Plaatje Municipality (Local Municipality NC091) is situated on the north eastern border of the Northern Cape Province within the Frances Baard District Municipality, almost in the centre of South Africa. This is indicated in the map of South Africa below.
The origins of the name “Sol Plaatje”
The Sol Plaatje Municipality is named after a prolific journalist Solomon T. Plaatje. Solomon Plaatje was one of the most gifted and versatile Black South Africans of his generation. He made an outstanding contribution in the field of literature in both, his native tongue, Setswana and English. He was an accomplished linguist fluent in several languages and the first Black South African to publish a novel in English. Solomon Plaatje sang the first recording of Nkosi Sikelele’ iAfrica. He died in 1932 and was buried in the West End Cemetery in Kimberley.
The demographics The Municipality’s jurisdiction area includes the City of Kimberley, which is the capital of the Northern Cape and is well connected to the rest of South Africa by road, rail and air. Ritchie, a small urban settlement (Total population approximately 11,000 persons) is situated on the most southern boundary of the municipal area approximately 30km due south of Kimberley. The rest of the municipal area comprises mainly private commercial farmland with extensive cattle and
ÊÚ
ß
ñ
ïß$T
ß
ï
Æb
Æb
Æb
Æb
Æb
Æb
ïñ
#S#S
#S
#S#S
PLATFONTEIN
KIMBERLEY
RIVERTON
RITCHIEMODDERRIVIER
Vaal River
Va
al R
iver
Riet R
iver
Riet Ri
Modder River
Kamfersdam
De Beers mines
Airport
Free State
Dikgatlong [NC092]
NCDMA09
Siyancuma [NC078]
Magareng [NC093]
Tokologo [FS182]
Letsemeng [FS161]
Northern Cape
HILL P/S
RIVERTON P/S
WATERWORKS P/S
ALEXANDERSFONTEIN P/S MAURITZFONTEIN P/S
N
AFRICON5 0 5 10 Kilometers
TITLE
Integrated Development Plan BASEMAP: LAND USE
SOL PLAATJEMUNICIPALITY
MUNISIPALITEIT
Provincial boundary
Farm boundariesLocal municipal boundaries
National RoadTrunk RoadMain Road
RailwaysÆb Station
Rivers
Mining areasIrrigation areas
Rural areasKamfersdamKimberley Airport
Urban areasLand Use
Heritage Sitesß Battlefieldsï Cemetries
ÊÚ Glacial marks
ñ Monuments
$T MemorialRock Art
LEGEND
T O JO
HANN
E SBU
RG
(N
12)
TO BARKLY WEST (R31)
TO SCHMIDSDRIFT (R64)
TO DOUGLAS (357)
T O C
APE
T OW
N
(N 1
2)
TO BLOEMFONTEIN (N8)
PROFESSIONAL SERVICES IN DEVELOPMENT
Rural schools#S
Sol PlaatjeGaborone
6
game farming and small pockets of crop Change map above (both) cultivation along the banks of the Vaal -, Modder - and Riet Rivers. The total population of the rural area is approximately 8,000 persons.
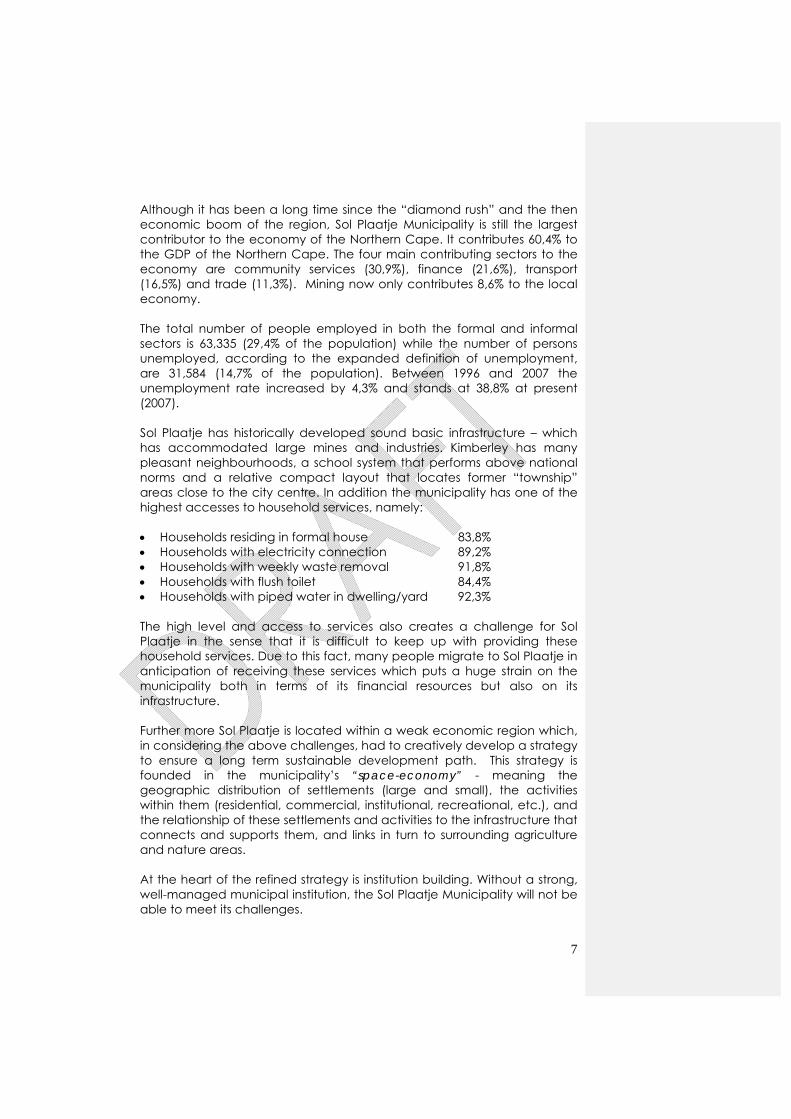
Sol Plaatje is therefore in essence an urban municipality as 99,2% of the population of 245,606 persons, made up of 52,120 households, resides in the City of Kimberley. Sol Plaatje Municipality covers an area of 187,300 ha with a population density of 1,3 persons per km. In the ten year period 1996 to 2006 the population growth was only 0.87%. Table below indicates the population of Sol Plaatje in relation to the other three local municipalities in the Frances Baard District.
The population residing in the municipal area is relatively young with 28% of the population below the age of 15 years and 6 % above the age 65 years. Only 8,1% of the persons above the age of 20 have a higher education while 9,1% has no schooling at all. It is also estimated that 32,4% of the residents of SPM are living in poverty. The History Kimberley still holds the title ‘Diamond Capital of the world’. In 1871 an 83.5 carat diamond was found on a farm close to the present location of Kimberley, which led to one of the biggest diamond rushes in the world. After the diamond rush, Kimberley became the world’s largest producer of diamonds. Kimberley contributed greatly toward South Africa’s economic development due to this diamond rush. The origins of this diamond rush, the Big Hole, became a world famous tourist attraction which is now a world class open-air museum. The city holds an old-world charm with it being famous for its high quality diamonds and for the rich history and culture that it possesses. Although lacking the furious pace of South Africa’s larger urban areas today, the Victorian grandeur of stately buildings still complements the urban setup. The economy
Population by local municipality - Frances Baard
0
50,000
100,000
150,000
200,000
250,000
300,000
Census 2001 205,983 35,765 21,735 61,320
CS 2007 245,606 40,752 20,433 46,409
NC091: Sol Plaatjie NC092: Dikgatlong NC093: Magareng NC094: Phokwane
7
Although it has been a long time since the “diamond rush” and the then economic boom of the region, Sol Plaatje Municipality is still the largest contributor to the economy of the Northern Cape. It contributes 60,4% to the GDP of the Northern Cape. The four main contributing sectors to the economy are community services (30,9%), finance (21,6%), transport (16,5%) and trade (11,3%). Mining now only contributes 8,6% to the local economy.
The total number of people employed in both the formal and informal sectors is 63,335 (29,4% of the population) while the number of persons unemployed, according to the expanded definition of unemployment, are 31,584 (14,7% of the population). Between 1996 and 2007 the unemployment rate increased by 4,3% and stands at 38,8% at present (2007). Sol Plaatje has historically developed sound basic infrastructure – which has accommodated large mines and industries. Kimberley has many pleasant neighbourhoods, a school system that performs above national norms and a relative compact layout that locates former “township” areas close to the city centre. In addition the municipality has one of the highest accesses to household services, namely: Households residing in formal house 83,8% Households with electricity connection 89,2% Households with weekly waste removal 91,8% Households with flush toilet 84,4% Households with piped water in dwelling/yard 92,3% The high level and access to services also creates a challenge for Sol Plaatje in the sense that it is difficult to keep up with providing these household services. Due to this fact, many people migrate to Sol Plaatje in anticipation of receiving these services which puts a huge strain on the municipality both in terms of its financial resources but also on its infrastructure. Further more Sol Plaatje is located within a weak economic region which, in considering the above challenges, had to creatively develop a strategy to ensure a long term sustainable development path. This strategy is founded in the municipality’s “space-economy” - meaning the geographic distribution of settlements (large and small), the activities within them (residential, commercial, institutional, recreational, etc.), and the relationship of these settlements and activities to the infrastructure that connects and supports them, and links in turn to surrounding agriculture and nature areas. At the heart of the refined strategy is institution building. Without a strong, well-managed municipal institution, the Sol Plaatje Municipality will not be able to meet its challenges.
8
The refined strategy further comprises seven key points: 1. Strengthen critical connections The first key point for the municipality is to strengthen critical connections between its broader jurisdictional area and Kimberley specifically. The municipality is part of a broader settlement system, and will not sustain itself without strong connections to other settlements, their needs, or activities within them.
2. Maintain and enhance Kimberley and existing outlying settlements as sustainable, attractive centres of living, services and work within their existing footprints Related to maintaining and strengthening critical connections to the municipality is managing Kimberley and outlying settlements as sustainable, attractive centres of living, services and work – with specific reference to ensure the upgrading and maintenance of existing infrastructure and the creation of new infrastructure for growth. 3. Strengthen the Kimberley CBD as the heart of the city and municipality The Kimberley CBD remains the economic and institutional heart of the Sol Plaatje Municipality. The viability of the CBD is critical in maintaining the role of Kimberley as a service centre to surrounding settlements, a place worthy of connecting to. The viability of the CBD is also critical to the city’s ability to provide opportunities for new enterprises to emerge. 4. Ensure good access to the CBD and between neighbourhoods Critical to maintaining the CBD is ensuring convenient access to, it from and between surrounding neighbourhoods. 5. Strengthen neighbourhood centres for convenience Neighbourhood centres are needed to provide in the daily needs of residents in defined areas for commercial and social services. However, these centres should not individually or collectively compete with the CBD, in that way harming Sol Plaatje Local Municipality’s overall position as a service centre or the municipality’s ability to facilitate job creation. 6. Prioritise improvements to disadvantaged areas while making the benefits of Kimberley more broadly available The municipality has made significant progress in improving living conditions in disadvantaged areas, ranging from the provision of housing to eradicating service backlogs and improving the quality of public space. Nevertheless, it is important to also make Kimberley’s offerings more broadly available to all residents, specifically through the provision of housing in areas well-located in relation to the CBD.
9
7. Maximise the capacity and economic potential of the river valleys The municipality should, through incentives and other measures, stimulate appropriate development in the river valleys and surrounding agricultural areas. The “7-point strategy” is utilized as a framework or a backdrop against which development programmes are assessed. Governance Model During the reporting period The Sol Plaatje Local Municipality wasis governed by an executive mayoral system – with the following standing committees of council. Finance Aesthetic and Development, Planning and Infrastructure Housing Local Economic Development MIG and IGR Organisational Development Security and Protection Services Social Development and Health Sport, Arts and Culture Council consisted ofs of 6455 members, 26 female and 29 male. The municipal council wasis further represented by the following political parties, 28 elected as ward councillors (23 ANC, 4 DA and 1 Independent) and 27 proportional representative councillors (17 ANC, 7 DA, 1 ACDP, 1 AZAPO, 1 ID). The Municipality has 28 wards with elected ward committees. (consult with Corrie to verify numbers, and change tense to past tense) The council and standing committees meet on a monthly basis. Twenty three (23) council Meetings were held during the reporting year which consisted of ordinary, special and informal council meetings.
10
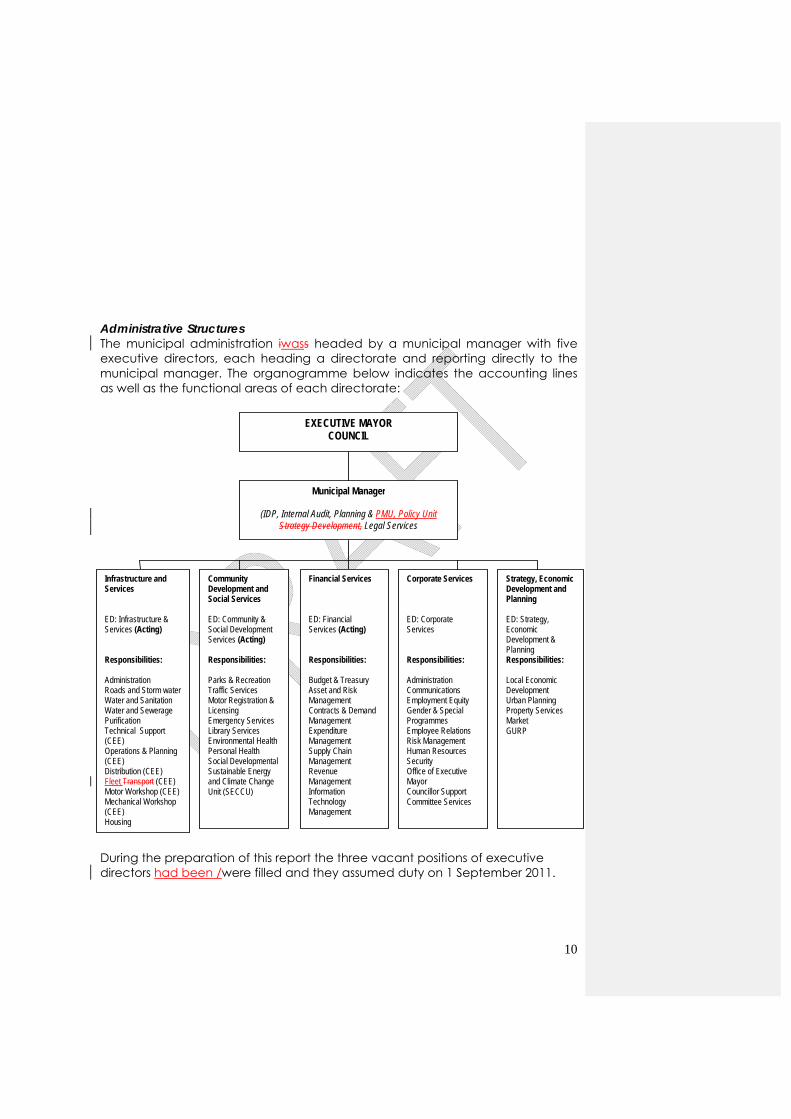
Administrative Structures The municipal administration iwass headed by a municipal manager with five executive directors, each heading a directorate and reporting directly to the municipal manager. The organogramme below indicates the accounting lines as well as the functional areas of each directorate: During the preparation of this report the three vacant positions of executive directors had been /were filled and they assumed duty on 1 September 2011.
Community Development and Social Services ED: Community & Social Development Services (Acting) Responsibilities: Parks & Recreation Traffic Services Motor Registration & Licensing Emergency Services Library Services Environmental Health Personal Health Social Developmental Sustainable Energy and Climate Change Unit (SECCU)
Corporate Services ED: Corporate Services Responsibilities: Administration Communications Employment Equity Gender & Special Programmes Employee Relations Risk Management Human Resources Security Office of Executive Mayor Councillor Support Committee Services
Financial Services ED: Financial Services (Acting) Responsibilities: Budget & Treasury Asset and Risk Management Contracts & Demand Management Expenditure Management Supply Chain Management Revenue Management Information Technology Management
Strategy, Economic Development and Planning ED: Strategy, Economic Development & Planning Responsibilities: Local Economic Development Urban Planning Property Services Market GURP
Infrastructure and Services ED: Infrastructure & Services (Acting) Responsibilities: Administration Roads and Storm water Water and Sanitation Water and Sewerage Purification Technical Support (CEE) Operations & Planning (CEE) Distribution (CEE) Fleet Transport (CEE) Motor Workshop (CEE) Mechanical Workshop (CEE) Housing
Municipal Manager
(IDP, Internal Audit, Planning & PMU, Policy Unit Strategy Development, Legal Services
EXECUTIVE MAYOR COUNCIL
11
1.3 Executive Summary
MUNICIPAL VISION
SOL PLAATJE, A DYNAMIC MUNICIPALITY THAT PROVIDES A COMPREHENSIVE RANGE OF AFFORDABLE SERVICES TO ALL ITS RESIDENTS
MISSION OF THE SOL PLAATJE MUNICIPALITY To be a dynamic, sustainable and efficient municipality by:-
Focusing on institutional transformation and management systems Ensuring access to quality, reliable and affordable services Strengthening relations with all stakeholders Maximizing income through responsible financial discipline Providing a challenging and rewarding working environment for all
its employees. This mission provides the foundation for the achievement of the municipality’s priorities. SOL PLAATJE MUNICIPALITY’S CORE VALUES The municipality has developed a set of value statements which are intended to govern and modify behavior across the organization. These values will be “lived” from the top of the organization. o Customer Focus “In everything that we do on a daily basis customer satisfaction will be our priority and in this regard the needs of the customer will be paramount.” o Integrity “At every level of interface with our customers, partners, peers and subordinates our conduct will be exemplary and constructive at all times.” o Honesty
12
“Regardless of the potential consequences, honesty will always be the best policy.” o Openness and Transparency “Information and knowledge will be shared willingly in an open manner. There will be no hidden agendas.” o Development Orientation “We recognize that the success of the municipality does not depend on our own success alone and we will actively seek participation of the public, other spheres of government and municipalities in our region and to link with other municipalities nationally and internationally.” LINKAGE WITH NATIONAL KEY PERFORMANCE AREAS FOR LOCAL GOVERNMENT Sol Plaatje Municipality, through its IDP, endorsed the five national key performance areas, namely:
1. Local Economic Development 2. Basic and Sustainable Service Delivery and Infrastructure
Development 3. Municipal Financial Viability and Management 4. Municipal Institutional Development and Transformation 5. Good Governance and Public Participation
Within each of the KPA’s the Municipality developed its own strategic objectives to address its own unique key priority issues. During subsequent reviews of the IDP since 2007/08 emphasis shifts were needed within these objectives, on the one hand to make the objectives attainable in the specific context of the Sol Plaatje Municipality circumstances and on the other to emphasize the overarching objectives related to the space-economy and long term growth. The Sol Plaatje Municipality has therefore focused on the following overarching strategic objectives, informed by municipality’s “space-economic development strategy”, within each of the national KPA’s to ensure a sustainable growth path for the City of Kimberley and the Municipality as a whole:
13
In terms of Local Economic Development Sol Plaatje municipality ensured that growth is infrastructure led and driven to date. Growth was constrained due to the global economic downturn but also limitation of its our infrastructure capacity.
The key focus on economic growth was to remove the
obstacles to growth and create an enabling environment. To that end a bulk infrastructure Intervention Plan was approved by council that seeks to enhance sewerage, water and electrical capacity. These projects are targeted for completion by end of 2012 and aim to achieve as its stated objectives enabling new development projects. Furthermore Council lifted the moratoria on the sale of land as well as that on development.
In addition other projects such as the Galeshewe SMME Village
and the Informal Trade Facilities at Ritchie commenced and are progressing well.
All of these interventions, as a collective, seek to stimulate the
revival of the economy.
Sol Plaatje Municipality will provide sustainable services to all its residents but will prioritise those areas in greatest need. The provision of basic services is an on-going daily obligation performed by the municipality with the aim of ensuring “certainty”, “regularity” and “quality” of such services. Various interventions were embarked upon in this regard.
Water A dedicated focus has been embarked upon to upgrade the
bulk water infrastructure. The various elements of this programme focuses on upgrading and/or replacing pumps, cleaning reservoirs and clarifiers and re-commissioning the old plant as a backup supply.
These actions are focused at all facilities i.e. Riverton, Newton
Reservoir and Ritchie Water Works. The projects commenced in the year at hand and will continue into the next. The municipalityWe also aim to achieve a blue drop status in water management by 2013. A focused intervention in the sector resulted in a blue drop score of 84% (improving from 640%).
A non revenue water loss minimization project was undertaken
with the aim of detecting causes of losses (eg. leaks, bypassing
14
of meters, etc) and to take corrective actions. This project is likely to yield results only in the 2012/13 financial year.
Electricity Council resolved to increase the electricity capacity by 80MvA
(to bring the total to 200MvA) and to upgrade the network and various sub stations. Eskom has been commissioned in this regard with the project scheduled for completion in 2012. The Southridge substation upgrade was already completed in this financial year. Electrification projects in areas such as Soul City, Greenpoint and Madalane were also completed at a cost of R3 461,247.16.
Sewerage The emergency project to improve the functioning of Homevale
Waste Water Treatment Works will be completed by February 2012. Subsequent thereto projects to further upgrade the Ritchie and Beaconsfield Waste Water Treatment Works was undertaken and should be completed in the 2011/12 financial year.
De Beers contributed R1.4 million towards the first phase of the
refurbishment project at the Beaconsfield Waste Water Treatment Works which was completed in June 2011. Phase 2 of the project will cost R12 133 625 and will be completed in April 2012.
The Homevale Waste Water Treatment Works will be upgraded
by a further 15 ml. this project is scheduled to be completed by October 2012. The Homevale upgrading project will cost an approximate amount of R140 000 000.00.
The collective impact of the above interventions will result in an
increasing capacity at Ritchie to 2 ml, Homevale 48ml and Beaconsfield to 9ml. The upgrading of Ritchie Waste Water Treatment Works cost R15.2 million. These interventions should allow for increased densification and development projects for between 10-15 years.
Roads
15
The road repair programme focused mainly on “pothole” repairs resulting in about 30 000 m² of road being repaired. The project started in the previous financial year when about 20 000 m² was done. However, the higher rainfalls and flood conditions caused considerable damage resulting in the increase of road deterioration.
Cleaning, Waste Removal Cleaning projects were reactivated and 15 persons per ward
were hired as part of the EPWP II Programme to focus on cleaning in the city. This is to supplement the normal cleaning actions. The recent heavy rains made this a cumbersome task/complicated the task. A dedicated focus was placed on waste removal services with the acquisition of two new compactors. In pursuance of a renewed focus on the environmenenvironment, thet and integrated waste management plan was finalized. It seeks to provide a basis for the future handling of waste in terms of collections, treatment and disposal, monitoring and compliance.
Other Matters Considerable investment has gone into the upgrading of social
amenities such as the various swimming pools in the city (with assistance from external bodies) and improvements in parks under the GURP project.
Due to the unusually higher rainfall during January-June 2011,
resulting in flood conditions and damage to property, the municipality was obliged to render emergency support to affected households by firstly relocating them to safety and thereafter to assist with mitigating the impact of the damage.
Financial Viability and Management The intervention focused on eradicating financial risks, a
dedicated focus on revenue collection, reviewing budget achievability on an on-going basis and generally improving financial management in the municipality. To achieve these aims various projects were embarked upon such as the replacement of prepaid electricity meters. By end of the financial year 2911 (of the 3 000) were replaced. The fact that income and expenses are now generally balanced has contributed to improve cash flow management and to the rebuilding of reserves (approximately R100 m). This has improved the liquidity ratio to 1.91 by end June 2011.
Institutional Development and Transformation
16
At the heart of the development strategy of the Sol Plaatje Municipality is institution building. Needless to say, without a strong, well-managed municipal institution, the Sol Plaatje Municipality will not be able to meet its challenges. An institution building process was started in 2009 to ensure a more effective and performance orientated organization which included issues such as:
A review of the macro – and micro organizational
structure to align it with the objects of local government and the IDP. The issue is also being looked at from an appropriate point of view.
A review of the HR Policies to address human resource attraction and retention as well as human resource management, development and administration. A revised HR Procedures Handbook was also produced.
A reconciliation of the payroll with the organizational establishment
A review of the effectiveness of the Local Labour Forum (LLF).
The recommendations and proposals of the above reviews are being implemented on a continuous basis. Good Governance and Public Participation Noting the historical administrative inefficiencies, poor audit
outcomes and procedural violations various interventions focused on addressing these matters. The governance model was reviewed, a revised and version approved. As a result of the revision, and implemented and ththe mayoral committee was appointed on a full time basis from November 2010.
Some 24 policies were approved to streamline and facilitate
decision-making. Although not legally required performance contracts were mooted for middle managers as a good governance measure so as to enhance performance in the institution. The process will unfold in future where each manager will be expected to have a signed one to be used as a basis for measuring performance.
The top 30 risks were also identified and a Risk Management Plan put in place to mitigate these risks.
Various interventions were continued as part of operation clean
audit aiming to ensure that improved audits are achieved by 2013/14 or earlier - hopefully earlier!
17
CONCLUSION In a general sense the overall functionality and governance of the municipality has improved considerably and the financial viability of the municipality is being strengthened and improved. Although much work still lies ahead, the conditions are conducive for continued growth and service provision.
CHAPTER 2 - MUNICIPAL PERFORMANCE HIGHLIGHTS 2.1 IDP Strategic Development Objectives
The Sol Plaatje 5-year Integrated Development Plan (IDP) is the blueprint that sets out its strategic development objectives it aims to achieve. Successes that have been achieved during the 2010/11 financial year – and will continue to be achieved – include the following: Local Economic Development - Infrastructure led and driven As an enabler of local economic development Sol Plaatje Municipality needs to stimulate economic growth and job creation from that whichwhat it controls. In this sense infrastructure is especially important as economic growth need to be leveraged off infrastructure development. As a means to unlock growth in the economy the factors that inhibit growth were reviewed, and strategies embarked upon to stimulate growth. This resulted in bulk infrastructure upgrade plans being approved to increase electricity capacity and network capability, upgrading the sewerage works at Homevale, Ritchie and Beaconsfield as well as specific water infrastructure supply systems. Tenders were awarded and implementation is underway. It is projected that these projects should come to fruition in the 2012/13 financial year. These interventions opened the way to lift the moratorium on development as well as the moratorium on the sale of land. An allied project to resolve the problem at Kamfersdam by installing a pipeline to divert water away and thereby mitigate the risk to the “trademark” flamingo’s as well as the two rail lines (linking Sol Plaatje with the rest of South Africa and Africa via Namibia) was commenced as a joint venture with Transnet. Partnering with DBSA and MIG as the financing partner R61,7m was invested in these projects during the 2010/11 reporting period.
18
The SPM also successfully accessed and implemented the EPWP incentive grant and through this programme created jobs totalling approximately 110 880 workdays. This resulted in the municipality receiving the national KAMOSO award for the best performing municipality in this regard. Sustainable and affordable service delivery according to areas of greatest need Apart from addressing the pressing need for municipal services, in especially disadvantaged areas, Sol Plaatje Municipality also focused on improving the water quality and certainty of supply. The infrastructure upgrades mentioned earlier seek to achieve part of this endeavour. However various actions to improve the quality yielded considerable improvements with the blue-drop score improving from 640% to 84% in the year. The municipality also achieved a 71% in the green-drop assessment being the best in the province. This reflects improvement in water and sanitation management. The report also details several service delivery improvements focused upon, such as the acquisition of two new refuse compactors for waste removal services, improved indigent verification processes, and closing of approximately 20,000 potholes. Municipal Governance and Financial Stability, Viability and Sustainability The focussed interventions to improve overall governance and financial management saw improvements in the overall functioning of council committees and management structures including middle managers required to sign performance agreements. This report is also evidenced by improved revenue collection, better control of expenditure and payment of creditors within the stipulated time frames. Capital spending has improved as evidenced by MIG achieving a 100% of spending by the end of the year. A further indicator is the improved cash position of the municipality and the fact that DBSA viewed the municipalities risk profile as having improved considerably resulting in sufficient confidence to grant a capital loan of R262m. Linked to the above is a dedicated focus to turn around a decade of poor audit outcomes and achieve a clean audit by 2014. The success of the Operation Clean Audit Report (OPCAR), is evidenced by the improved AGSA report from a decade of ‘disclaimers’ to a ‘qualified’ report. The IDP and the budget, which indicate the financial resources to achieve these objectives, are strategic plans and must be “operationalised” to be
19
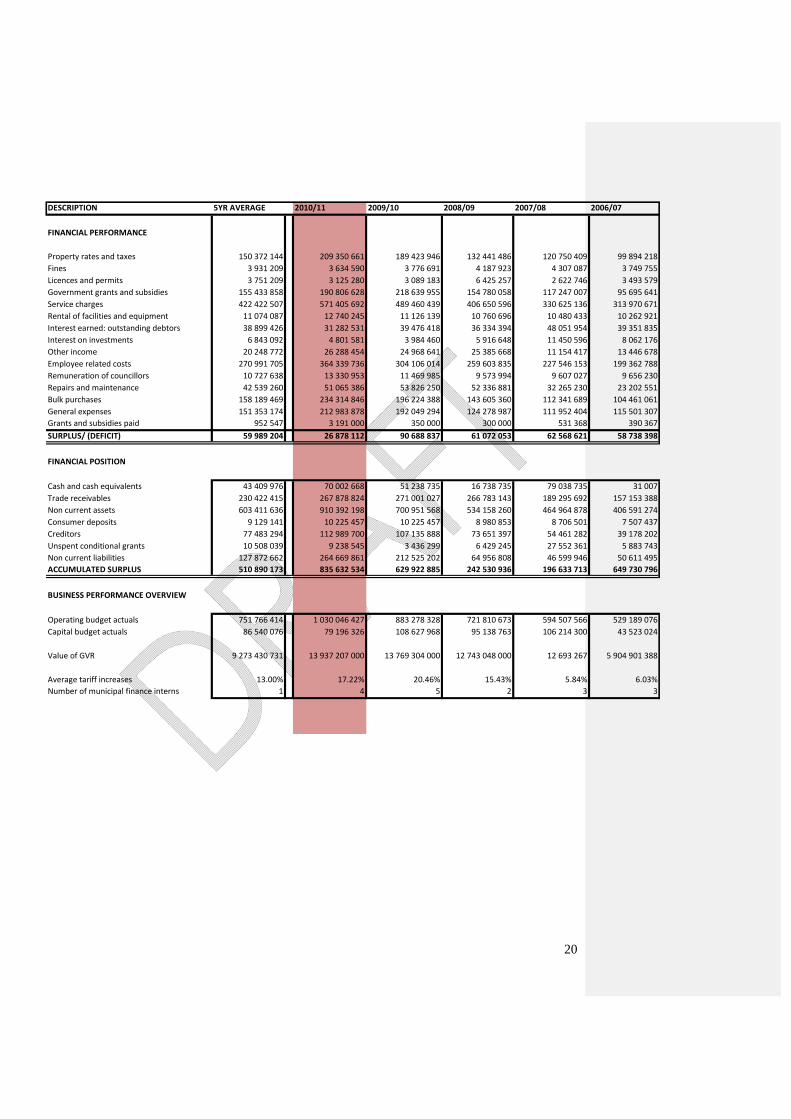
implemented. This is done through an annual Service Delivery and Budget Implementation Plan (SDBIP). The SDBIP is firstly, the implementation and management tool to ensure that budgetary decisions that were adopted by the council for the 2010/11 financial year are aligned with the IDP and secondly, it serves as the detailed plan, approved by the executive mayor, for implementing Sol Plaatje Municipality’s annual budget and delivering municipal services. Section 2.2 below indicates performance of this plan. Table 1: The summary of financial performance is indicated in the table below;
20
DESCRIPTION 5YR AVERAGE 2010/11 2009/10 2008/09 2007/08 2006/07
FINANCIAL PERFORMANCE
Property rates and taxes 150 372 144 209 350 661 189 423 946 132 441 486 120 750 409 99 894 218
Fines 3 931 209 3 634 590 3 776 691 4 187 923 4 307 087 3 749 755
Licences and permits 3 751 209 3 125 280 3 089 183 6 425 257 2 622 746 3 493 579
Government grants and subsidies 155 433 858 190 806 628 218 639 955 154 780 058 117 247 007 95 695 641
Service charges 422 422 507 571 405 692 489 460 439 406 650 596 330 625 136 313 970 671
Rental of facilities and equipment 11 074 087 12 740 245 11 126 139 10 760 696 10 480 433 10 262 921
Interest earned: outstanding debtors 38 899 426 31 282 531 39 476 418 36 334 394 48 051 954 39 351 835
Interest on investments 6 843 092 4 801 581 3 984 460 5 916 648 11 450 596 8 062 176
Other income 20 248 772 26 288 454 24 968 641 25 385 668 11 154 417 13 446 678
Employee related costs 270 991 705 364 339 736 304 106 014 259 603 835 227 546 153 199 362 788
Remuneration of councillors 10 727 638 13 330 953 11 469 985 9 573 994 9 607 027 9 656 230
Repairs and maintenance 42 539 260 51 065 386 53 826 250 52 336 881 32 265 230 23 202 551
Bulk purchases 158 189 469 234 314 846 196 224 388 143 605 360 112 341 689 104 461 061
General expenses 151 353 174 212 983 878 192 049 294 124 278 987 111 952 404 115 501 307
Grants and subsidies paid 952 547 3 191 000 350 000 300 000 531 368 390 367
SURPLUS/ (DEFICIT) 59 989 204 26 878 112 90 688 837 61 072 053 62 568 621 58 738 398
FINANCIAL POSITION
Cash and cash equivalents 43 409 976 70 002 668 51 238 735 16 738 735 79 038 735 31 007
Trade receivables 230 422 415 267 878 824 271 001 027 266 783 143 189 295 692 157 153 388
Non current assets 603 411 636 910 392 198 700 951 568 534 158 260 464 964 878 406 591 274
Consumer deposits 9 129 141 10 225 457 10 225 457 8 980 853 8 706 501 7 507 437
Creditors 77 483 294 112 989 700 107 135 888 73 651 397 54 461 282 39 178 202
Unspent conditional grants 10 508 039 9 238 545 3 436 299 6 429 245 27 552 361 5 883 743
Non current liabilities 127 872 662 264 669 861 212 525 202 64 956 808 46 599 946 50 611 495
ACCUMULATED SURPLUS 510 890 173 835 632 534 629 922 885 242 530 936 196 633 713 649 730 796
BUSINESS PERFORMANCE OVERVIEW
Operating budget actuals 751 766 414 1 030 046 427 883 278 328 721 810 673 594 507 566 529 189 076
Capital budget actuals 86 540 076 79 196 326 108 627 968 95 138 763 106 214 300 43 523 024
Value of GVR 9 273 430 731 13 937 207 000 13 769 304 000 12 743 048 000 12 693 267 5 904 901 388
Average tariff increases 13.00% 17.22% 20.46% 15.43% 5.84% 6.03%
Number of municipal finance interns 1 4 5 2 3 3
21
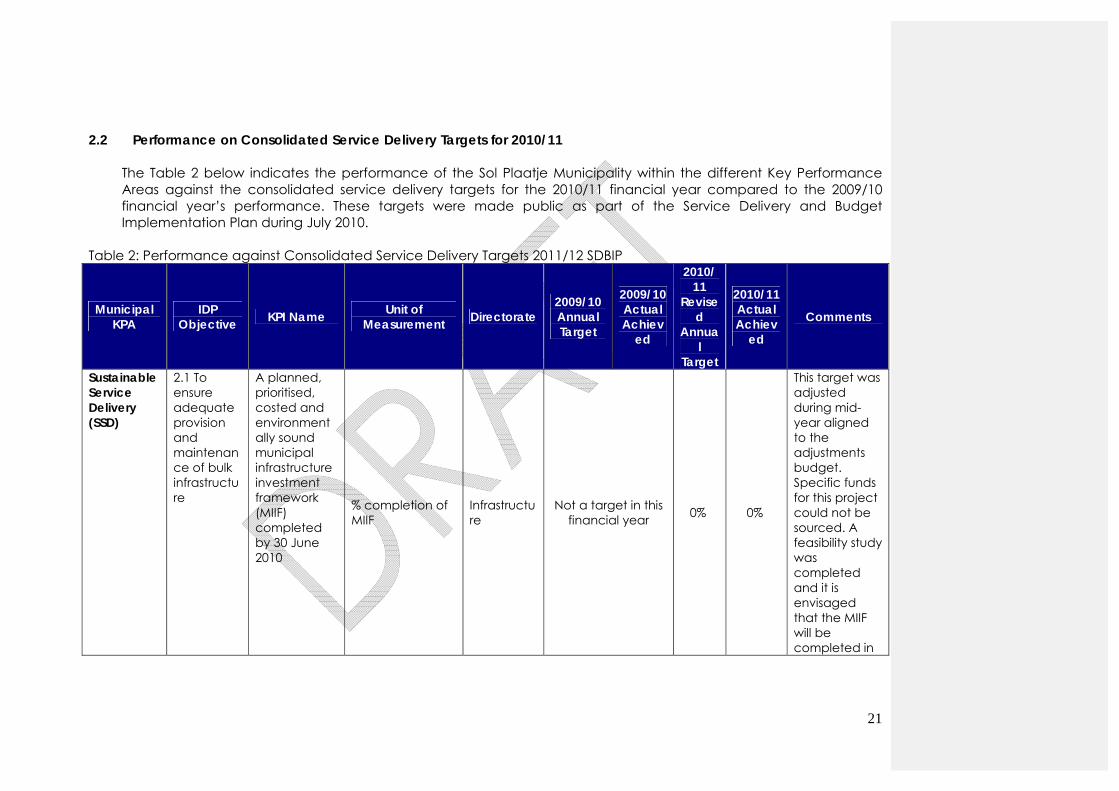
2.2 Performance on Consolidated Service Delivery Targets for 2010/11
The Table 2 below indicates the performance of the Sol Plaatje Municipality within the different Key Performance Areas against the consolidated service delivery targets for the 2010/11 financial year compared to the 2009/10 financial year’s performance. These targets were made public as part of the Service Delivery and Budget Implementation Plan during July 2010.
Table 2: Performance against Consolidated Service Delivery Targets 2011/12 SDBIP
Municipal KPA
IDP Objective KPI Name Unit of
Measurement Directorate 2009/10 Annual Target
2009/10 Actual Achiev
ed
2010/11
Revised
Annual
Target
2010/11 Actual Achiev
ed
Comments
Sustainable Service Delivery (SSD)
2.1 To ensure adequate provision and maintenance of bulk infrastructure
A planned, prioritised, costed and environmentally sound municipal infrastructure investment framework (MIIF) completed by 30 June 2010
% completion of MIIF
Infrastructure
Not a target in this financial year 0% 0%
This target was adjusted during mid-year aligned to the adjustments budget. Specific funds for this project could not be sourced. A feasibility study was completed and it is envisaged that the MIIF will be completed in

22
Municipal KPA
IDP Objective KPI Name Unit of
Measurement Directorate 2009/10 Annual Target
2009/10 Actual Achiev
ed
2010/11
Revised
Annual
Target
2010/11 Actual Achiev
ed
Comments
the next financial year
2.2 To ensure sustainable delivery in respect of water and sanitation, electricity, solid waste management and roads and storm water services to all residents of SPM
2,028 additional subsidised houses provided by SPM Housing Department in accordance with IHSP by 30 June 2013
No. of households
Infrastructure 3,358 1,277 546 584
Additional funding was allocated by COGHSTA to complete blocked projects – which resulted in the over achievement of the target.

23
Municipal KPA
IDP Objective KPI Name Unit of
Measurement Directorate 2009/10 Annual Target
2009/10 Actual Achiev
ed
2010/11
Revised
Annual
Target
2010/11 Actual Achiev
ed
Comments
2.2 To ensure sustainable delivery in respect of water and sanitation, electricity, solid waste management and roads and storm water services to all residents of SPM
3,050 additional households in formal settlements with sanitation by 30 June 2013 (Total Backlog 8,290 includes informal settlements)
No. of households
Infrastructure 1250 560 0 0
Water and sanitation: This target was adjusted during mid-year aligned to the adjustment budget. Specific funds for this project could not be sourced. A feasibility study was completed and it is envisaged that the MIIF will be completed in the next financial year
24
Municipal KPA
IDP Objective KPI Name Unit of
Measurement Directorate 2009/10 Annual Target
2009/10 Actual Achiev
ed
2010/11
Revised
Annual
Target
2010/11 Actual Achiev
ed
Comments
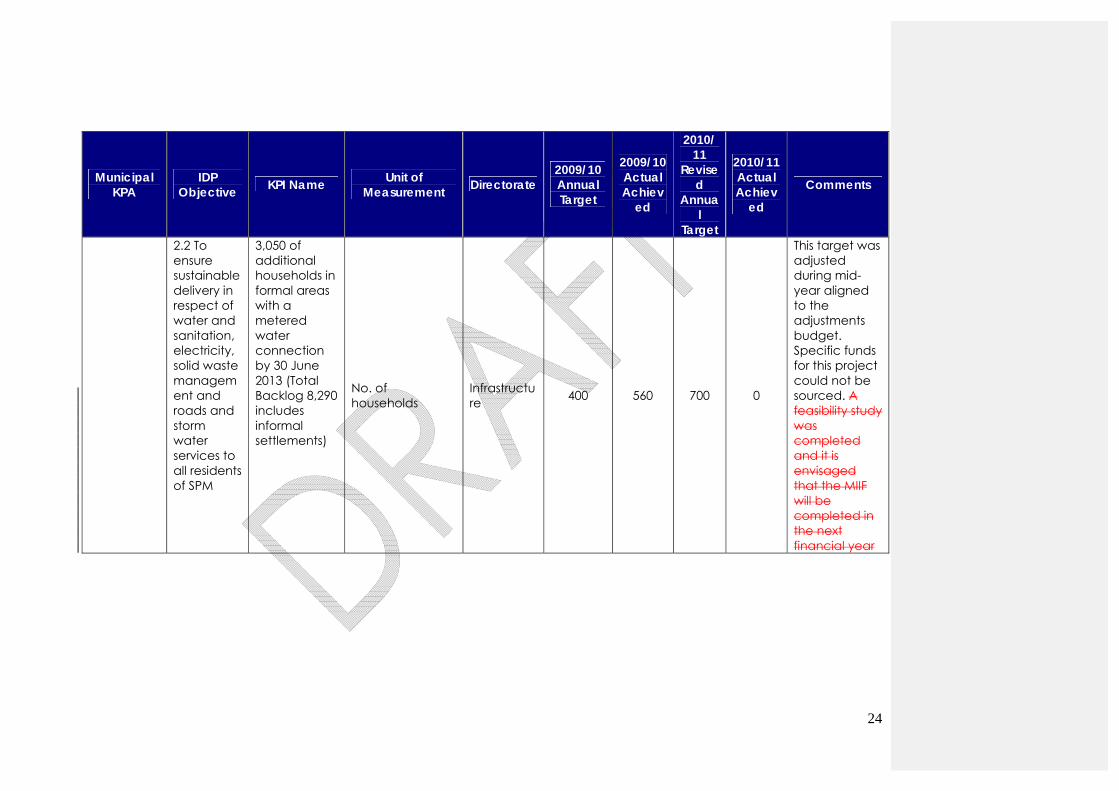
2.2 To ensure sustainable delivery in respect of water and sanitation, electricity, solid waste management and roads and storm water services to all residents of SPM
3,050 of additional households in formal areas with a metered water connection by 30 June 2013 (Total Backlog 8,290 includes informal settlements)
No. of households
Infrastructure 400 560 700 0
This target was adjusted during mid-year aligned to the adjustments budget. Specific funds for this project could not be sourced. A feasibility study was completed and it is envisaged that the MIIF will be completed in the next financial year
25
Municipal KPA
IDP Objective KPI Name Unit of
Measurement Directorate 2009/10 Annual Target
2009/10 Actual Achiev
ed
2010/11
Revised
Annual
Target
2010/11 Actual Achiev
ed
Comments
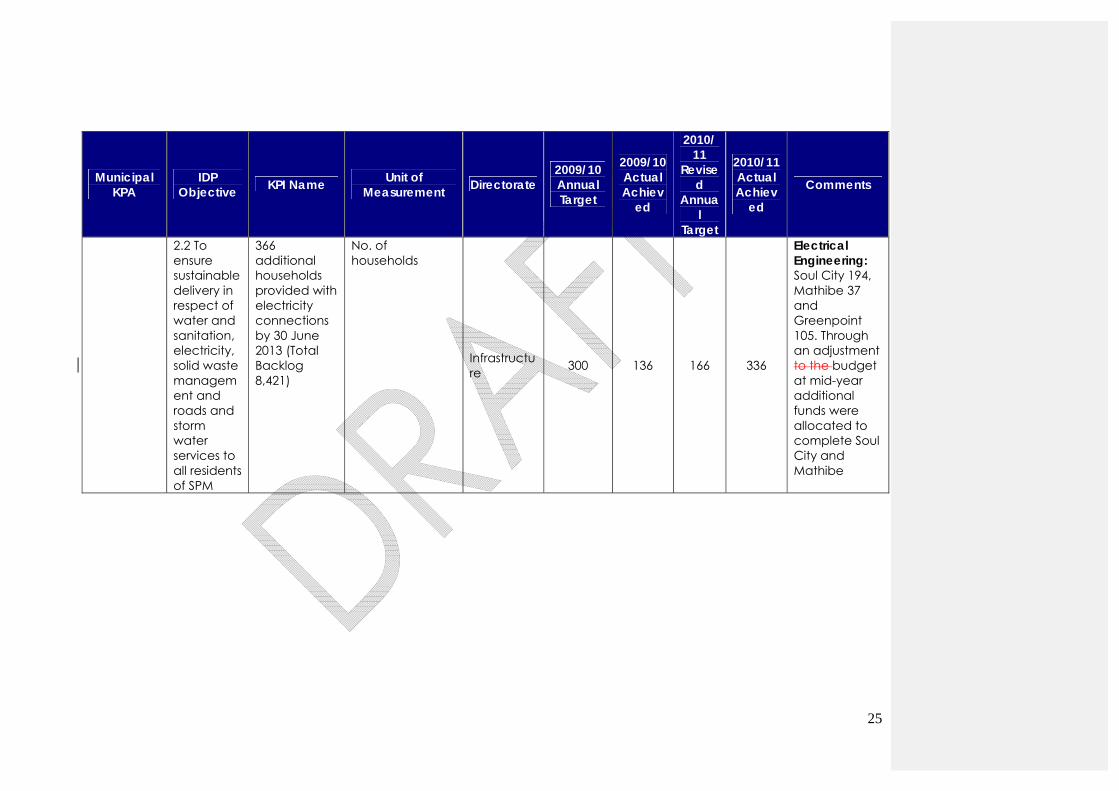
2.2 To ensure sustainable delivery in respect of water and sanitation, electricity, solid waste management and roads and storm water services to all residents of SPM
366 additional households provided with electricity connections by 30 June 2013 (Total Backlog 8,421)
No. of households
Infrastructure 300 136 166 336
Electrical Engineering: Soul City 194, Mathibe 37 and Greenpoint 105. Through an adjustment to the budget at mid-year additional funds were allocated to complete Soul City and Mathibe
26
Municipal KPA
IDP Objective KPI Name Unit of
Measurement Directorate 2009/10 Annual Target
2009/10 Actual Achiev
ed
2010/11
Revised
Annual
Target
2010/11 Actual Achiev
ed
Comments
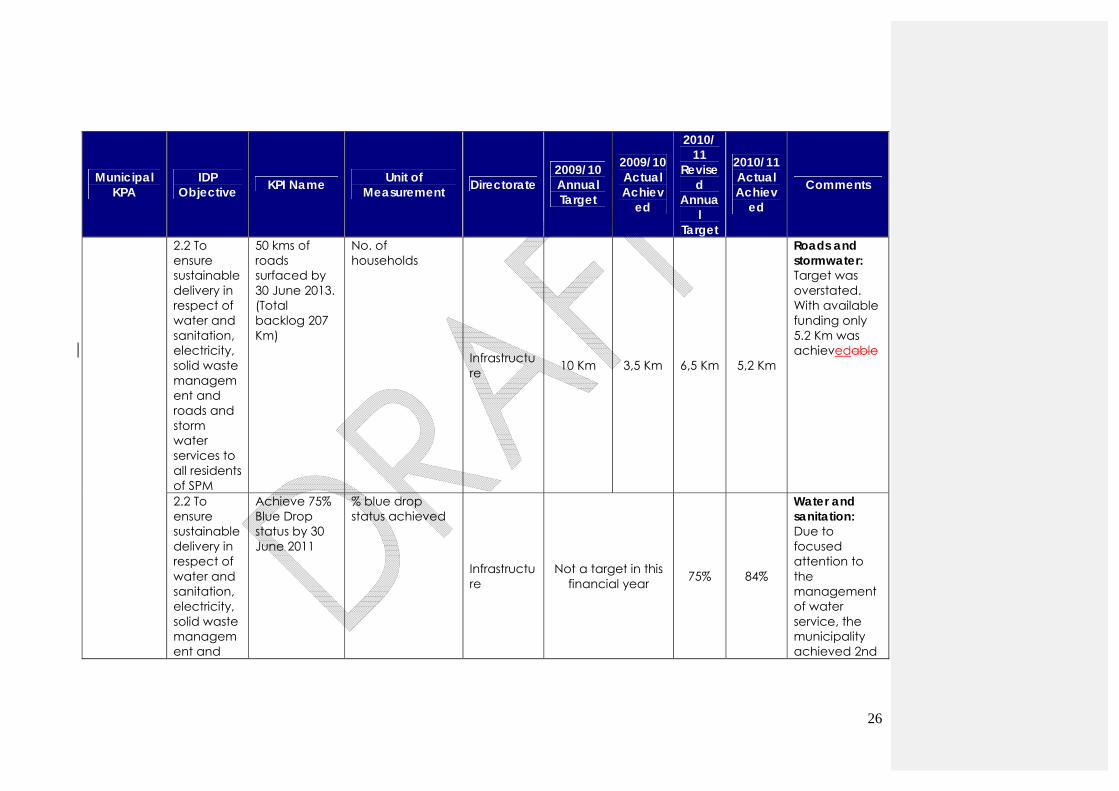
2.2 To ensure sustainable delivery in respect of water and sanitation, electricity, solid waste management and roads and storm water services to all residents of SPM
50 kms of roads surfaced by 30 June 2013. (Total backlog 207 Km)
No. of households
Infrastructure 10 Km 3,5 Km 6,5 Km 5,2 Km
Roads and stormwater: Target was overstated. With available funding only 5.2 Km was achievedable
2.2 To ensure sustainable delivery in respect of water and sanitation, electricity, solid waste management and
Achieve 75% Blue Drop status by 30 June 2011
% blue drop status achieved
Infrastructure
Not a target in this financial year 75% 84%
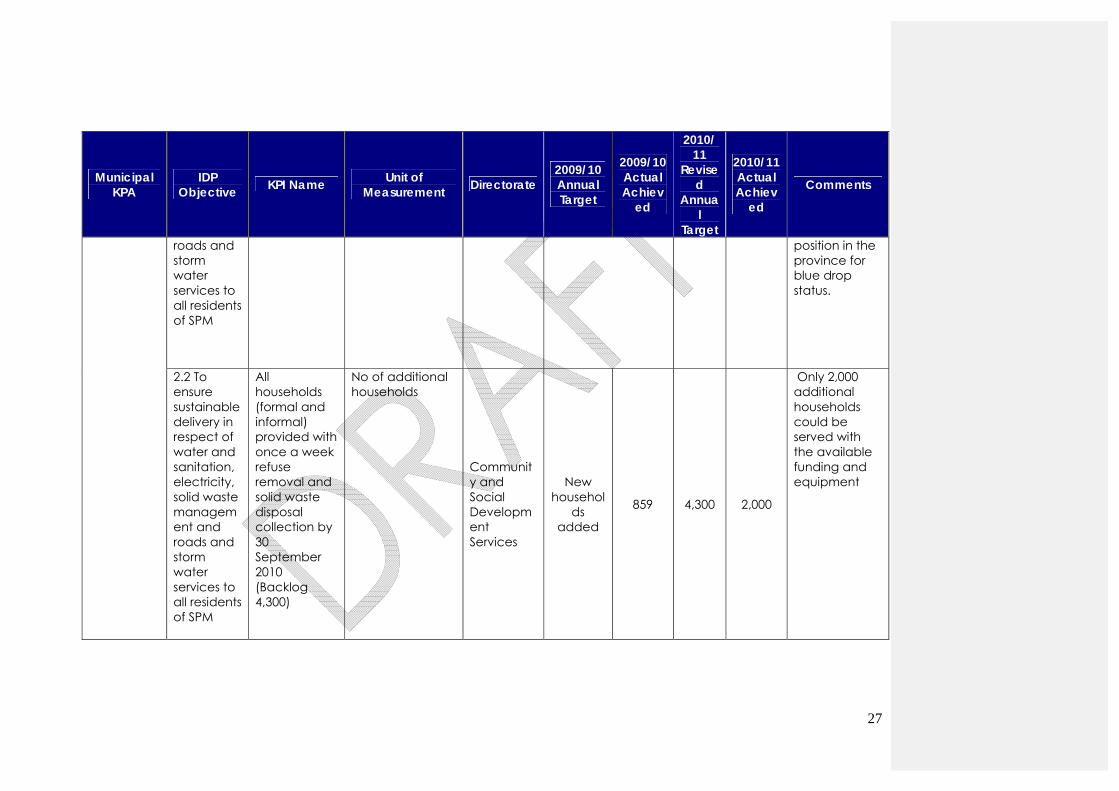
Water and sanitation: Due to focused attention to the management of water service, the municipality achieved 2nd
27
Municipal KPA
IDP Objective KPI Name Unit of
Measurement Directorate 2009/10 Annual Target
2009/10 Actual Achiev
ed
2010/11
Revised
Annual
Target
2010/11 Actual Achiev
ed
Comments
roads and storm water services to all residents of SPM
position in the province for blue drop status.
2.2 To ensure sustainable delivery in respect of water and sanitation, electricity, solid waste management and roads and storm water services to all residents of SPM
All households (formal and informal) provided with once a week refuse removal and solid waste disposal collection by 30 September 2010 (Backlog 4,300)
No of additional households
Community and Social Development Services
New househol
ds added
859 4,300 2,000
Only 2,000 additional households could be served with the available funding and equipment
28
Municipal KPA
IDP Objective KPI Name Unit of
Measurement Directorate 2009/10 Annual Target
2009/10 Actual Achiev
ed
2010/11
Revised
Annual
Target
2010/11 Actual Achiev
ed
Comments
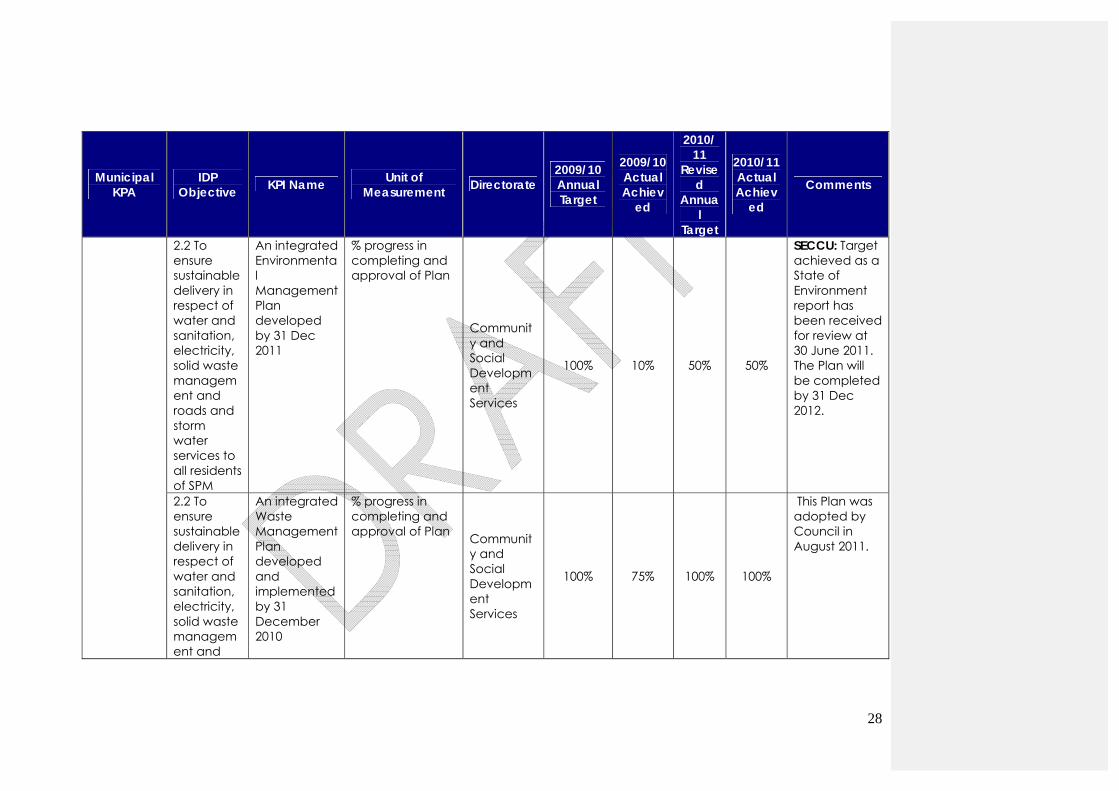
2.2 To ensure sustainable delivery in respect of water and sanitation, electricity, solid waste management and roads and storm water services to all residents of SPM
An integrated Environmental Management Plan developed by 31 Dec 2011
% progress in completing and approval of Plan
Community and Social Development Services
100% 10% 50% 50%
SECCU: Target achieved as a State of Environment report has been received for review at 30 June 2011. The Plan will be completed by 31 Dec 2012.
2.2 To ensure sustainable delivery in respect of water and sanitation, electricity, solid waste management and
An integrated Waste Management Plan developed and implemented by 31 December 2010
% progress in completing and approval of Plan Communit
y and Social Development Services
100% 75% 100% 100%
This Plan was adopted by Council in August 2011.
29
Municipal KPA
IDP Objective KPI Name Unit of
Measurement Directorate 2009/10 Annual Target
2009/10 Actual Achiev
ed
2010/11
Revised
Annual
Target
2010/11 Actual Achiev
ed
Comments
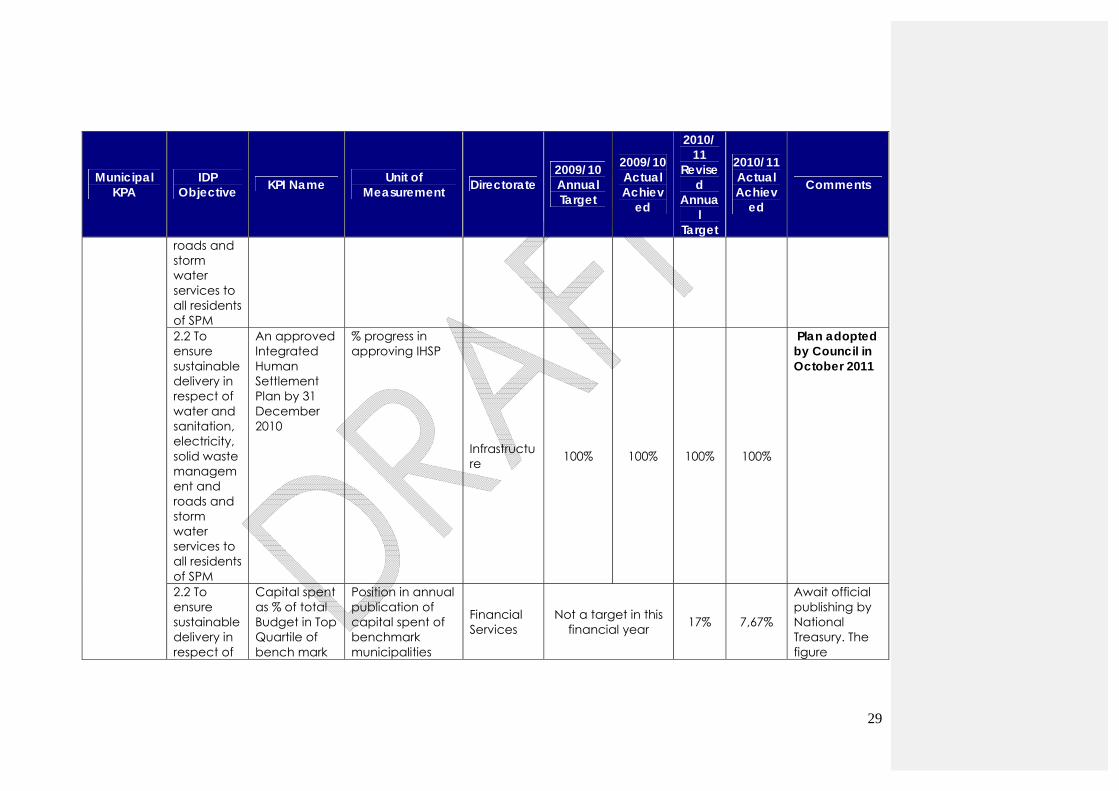
roads and storm water services to all residents of SPM 2.2 To ensure sustainable delivery in respect of water and sanitation, electricity, solid waste management and roads and storm water services to all residents of SPM
An approved Integrated Human Settlement Plan by 31 December 2010
% progress in approving IHSP
Infrastructure 100% 100% 100% 100%
Plan adopted by Council in October 2011
2.2 To ensure sustainable delivery in respect of
Capital spent as % of total Budget in Top Quartile of bench mark
Position in annual publication of capital spent of benchmark municipalities
Financial Services
Not a target in this financial year 17% 7,67%
Await official publishing by National Treasury. The figure
30
Municipal KPA
IDP Objective KPI Name Unit of
Measurement Directorate 2009/10 Annual Target
2009/10 Actual Achiev
ed
2010/11
Revised
Annual
Target
2010/11 Actual Achiev
ed
Comments
water and sanitation, electricity, solid waste management and roads and storm water services to all residents of SPM
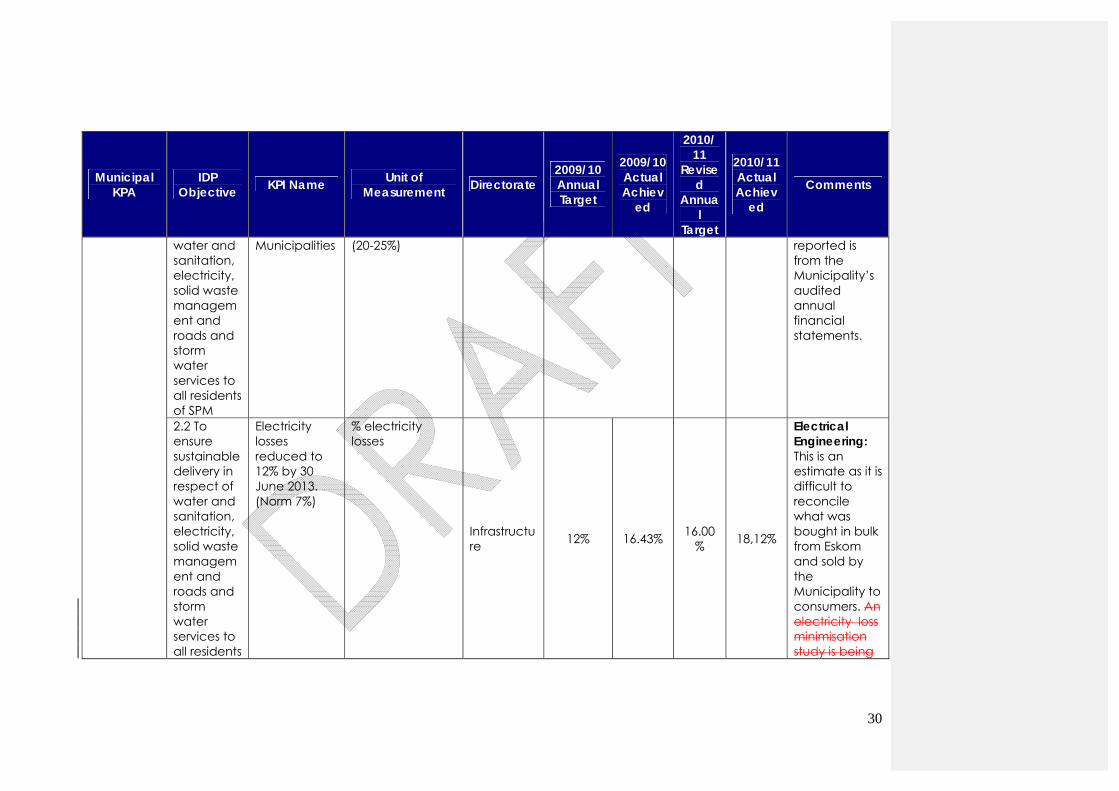
Municipalities (20-25%) reported is from the Municipality’s audited annual financial statements.
2.2 To ensure sustainable delivery in respect of water and sanitation, electricity, solid waste management and roads and storm water services to all residents
Electricity losses reduced to 12% by 30 June 2013. (Norm 7%)
% electricity losses
Infrastructure 12% 16.43% 16.00
% 18,12%
Electrical Engineering: This is an estimate as it is difficult to reconcile what was bought in bulk from Eskom and sold by the Municipality to consumers. An electricity loss minimisation study is being
31
Municipal KPA
IDP Objective KPI Name Unit of
Measurement Directorate 2009/10 Annual Target
2009/10 Actual Achiev
ed
2010/11
Revised
Annual
Target
2010/11 Actual Achiev
ed
Comments
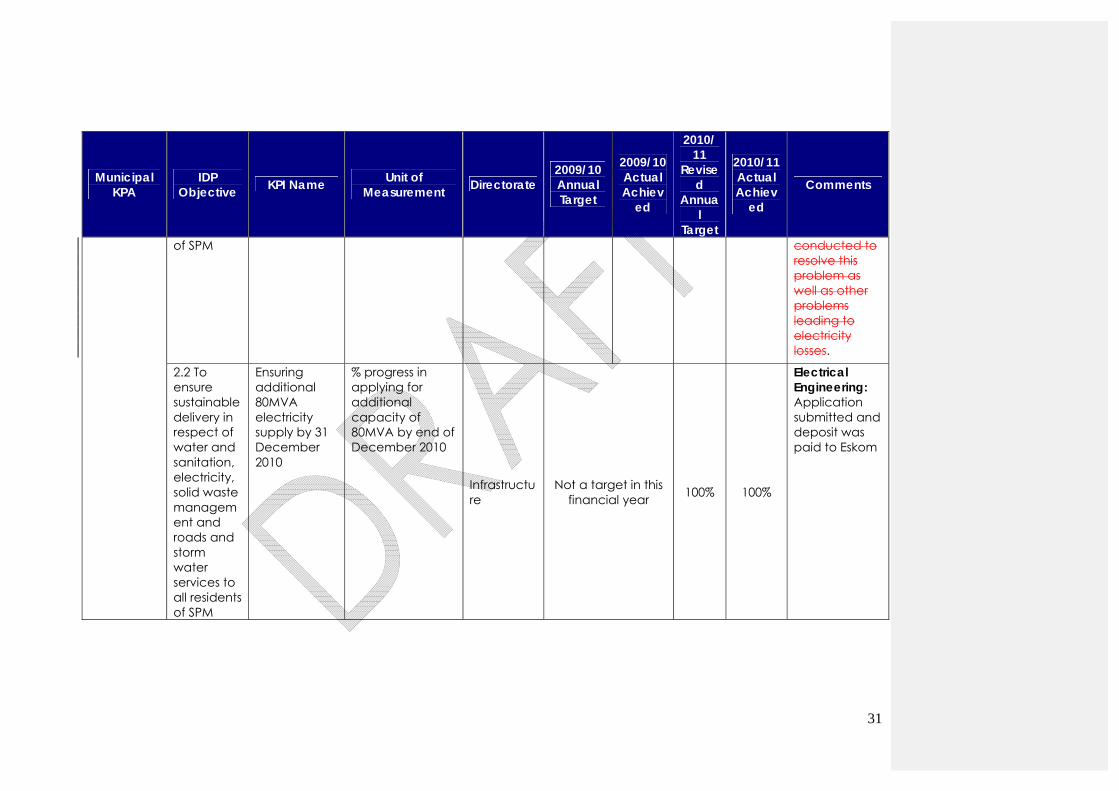
of SPM conducted to resolve this problem as well as other problems leading to electricity losses.
2.2 To ensure sustainable delivery in respect of water and sanitation, electricity, solid waste management and roads and storm water services to all residents of SPM
Ensuring additional 80MVA electricity supply by 31 December 2010
% progress in applying for additional capacity of 80MVA by end of December 2010
Infrastructure
Not a target in this financial year 100% 100%
Electrical Engineering: Application submitted and deposit was paid to Eskom
32
Municipal KPA
IDP Objective KPI Name Unit of
Measurement Directorate 2009/10 Annual Target
2009/10 Actual Achiev
ed
2010/11
Revised
Annual
Target
2010/11 Actual Achiev
ed
Comments
2.2 To ensure sustainable delivery in respect of water and sanitation, electricity, solid waste management and roads and storm water services to all residents of SPM
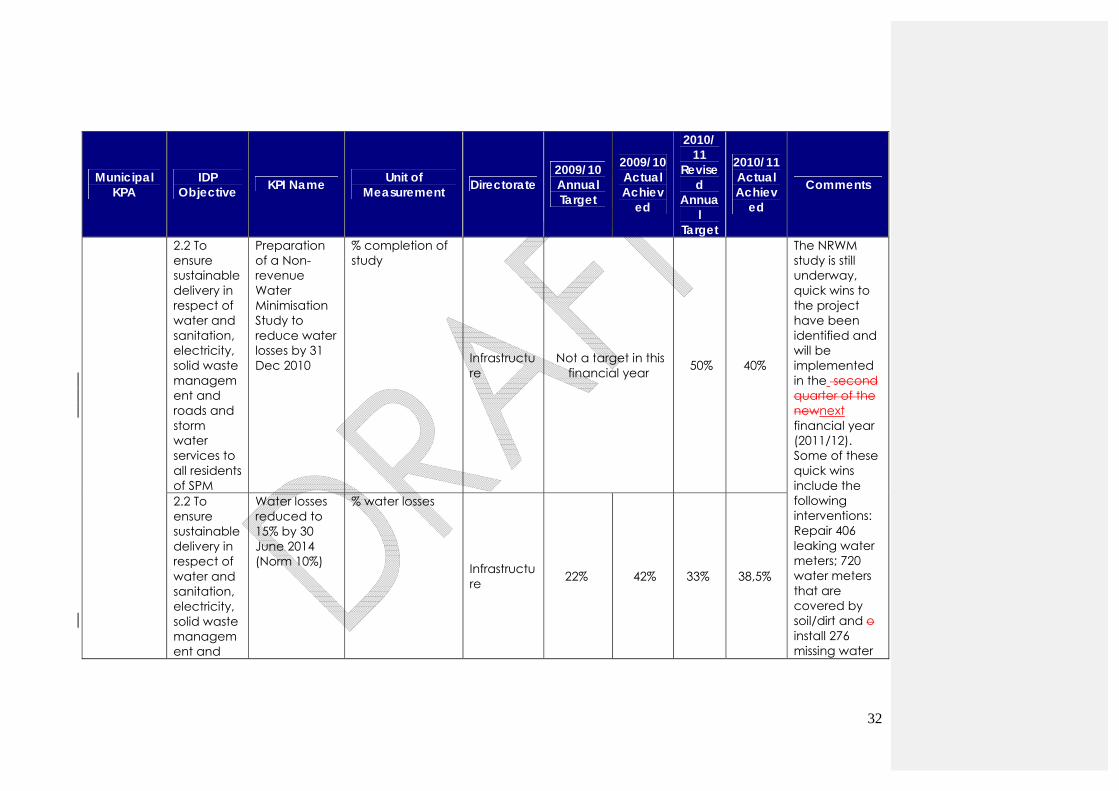
Preparation of a Non-revenue Water Minimisation Study to reduce water losses by 31 Dec 2010
% completion of study
Infrastructure
Not a target in this financial year 50% 40%
The NRWM study is still underway, quick wins to the project have been identified and will be implemented in the second quarter of the newnext financial year (2011/12). Some of these quick wins include the following interventions: Repair 406 leaking water meters; 720 water meters that are covered by soil/dirt and o install 276 missing water
2.2 To ensure sustainable delivery in respect of water and sanitation, electricity, solid waste management and
Water losses reduced to 15% by 30 June 2014 (Norm 10%)
% water losses
Infrastructure 22% 42% 33% 38,5%
33
Municipal KPA
IDP Objective KPI Name Unit of
Measurement Directorate 2009/10 Annual Target
2009/10 Actual Achiev
ed
2010/11
Revised
Annual
Target
2010/11 Actual Achiev
ed
Comments
roads and storm water services to all residents of SPM
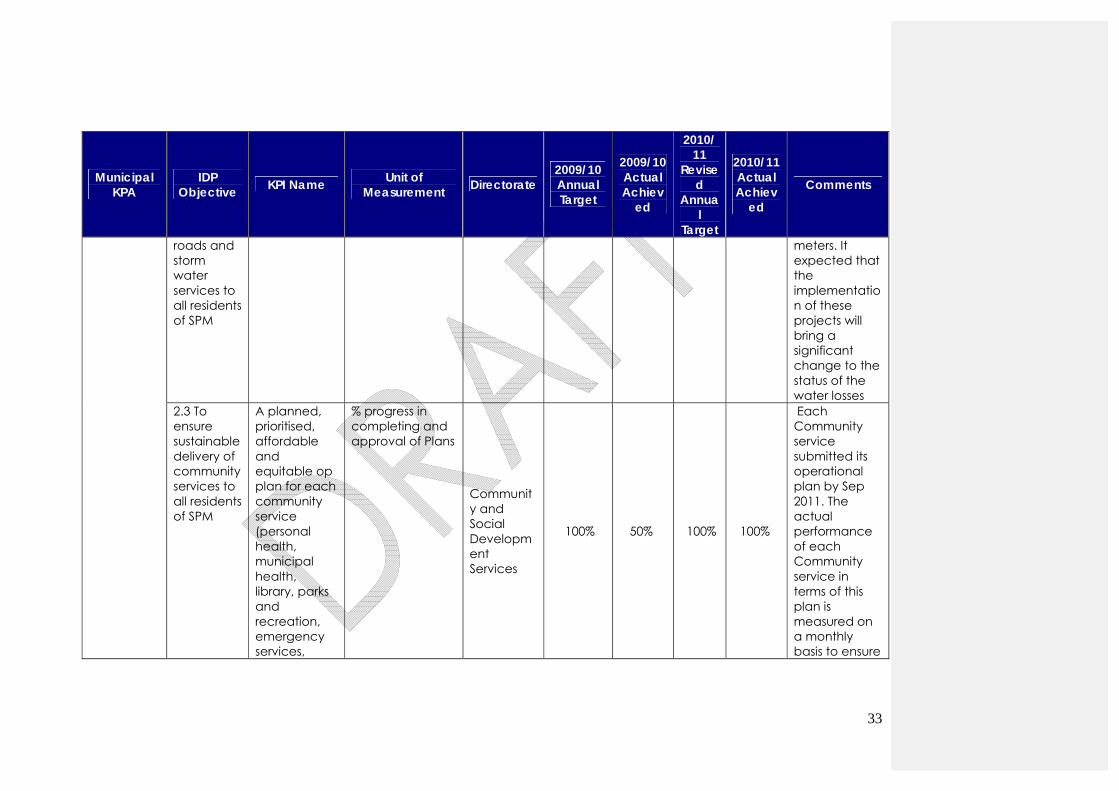
meters. It expected that the implementation of these projects will bring a significant change to the status of the water losses
2.3 To ensure sustainable delivery of community services to all residents of SPM
A planned, prioritised, affordable and equitable op plan for each community service (personal health, municipal health, library, parks and recreation, emergency services,
% progress in completing and approval of Plans
Community and Social Development Services
100% 50% 100% 100%
Each Community service submitted its operational plan by Sep 2011. The actual performance of each Community service in terms of this plan is measured on a monthly basis to ensure
34
Municipal KPA
IDP Objective KPI Name Unit of
Measurement Directorate 2009/10 Annual Target
2009/10 Actual Achiev
ed
2010/11
Revised
Annual
Target
2010/11 Actual Achiev
ed
Comments
traffic services and social development services) by 30 Sept 2010
performance is happening.
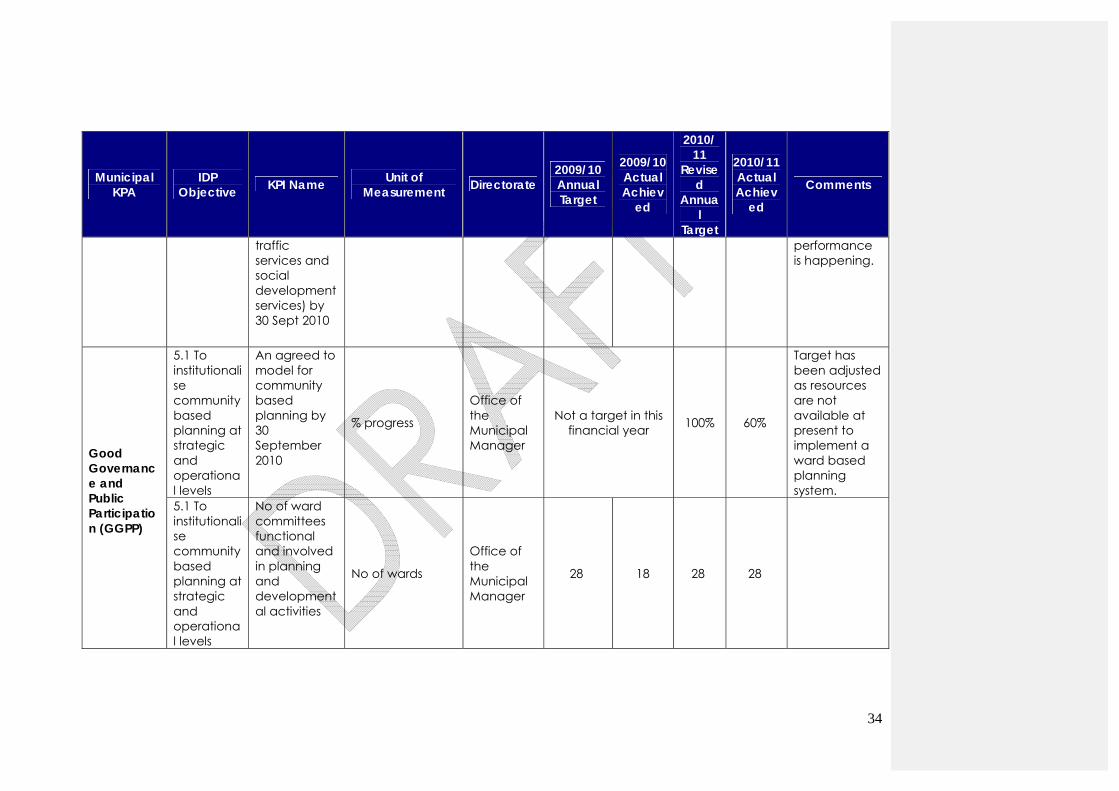
Good Governance and Public Participation (GGPP)
5.1 To institutionalise community based planning at strategic and operational levels
An agreed to model for community based planning by 30 September 2010
% progress
Office of the Municipal Manager
Not a target in this financial year 100% 60%
Target has been adjusted as resources are not available at present to implement a ward based planning system.
5.1 To institutionalise community based planning at strategic and operational levels
No of ward committees functional and involved in planning and developmental activities
No of wards
Office of the Municipal Manager
28 18 28 28

35
Municipal KPA
IDP Objective KPI Name Unit of
Measurement Directorate 2009/10 Annual Target
2009/10 Actual Achiev
ed
2010/11
Revised
Annual
Target
2010/11 Actual Achiev
ed
Comments
5.2 To enhance the public profile, reputation and positioning of the SPM
75% of Council Resolutions implemented on a quarterly basis
% of Council resolutions implemented (total no resolutions taken/no of resolutions implemented and signed off) on a quarterly basis
Office of the Municipal Manager
Not a target in this financial year 75% 74%
This achievement is according to the Council Resolutions Register
5.2 To enhance the public profile, reputation and positioning of the SPM
Council adopted Communication, Marketing and Positioning Strategy (including corporate image) implemented 30 September 2010
% completion of Strategy
Corporate Services 100% 50% 100% 90%
Communication and PR: Document adopted by EMT. To be tabled to Council for approval
36
Municipal KPA
IDP Objective KPI Name Unit of
Measurement Directorate 2009/10 Annual Target
2009/10 Actual Achiev
ed
2010/11
Revised
Annual
Target
2010/11 Actual Achiev
ed
Comments
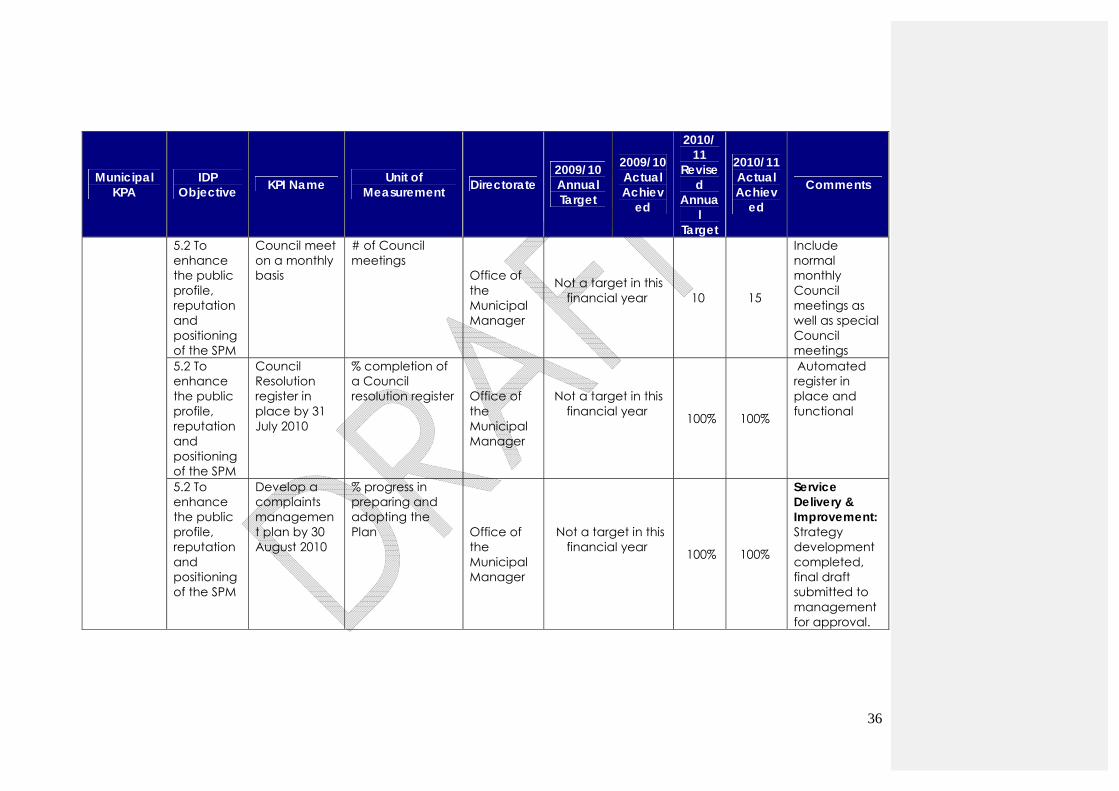
5.2 To enhance the public profile, reputation and positioning of the SPM
Council meet on a monthly basis
# of Council meetings
Office of the Municipal Manager
Not a target in this financial year
10 15
Include normal monthly Council meetings as well as special Council meetings
5.2 To enhance the public profile, reputation and positioning of the SPM
Council Resolution register in place by 31 July 2010
% completion of a Council resolution register Office of
the Municipal Manager
Not a target in this financial year
100% 100%
Automated register in place and functional
5.2 To enhance the public profile, reputation and positioning of the SPM
Develop a complaints management plan by 30 August 2010
% progress in preparing and adopting the Plan Office of
the Municipal Manager
Not a target in this financial year
100% 100%
Service Delivery & Improvement: Strategy development completed, final draft submitted to management for approval.
37
Municipal KPA
IDP Objective KPI Name Unit of
Measurement Directorate 2009/10 Annual Target
2009/10 Actual Achiev
ed
2010/11
Revised
Annual
Target
2010/11 Actual Achiev
ed
Comments
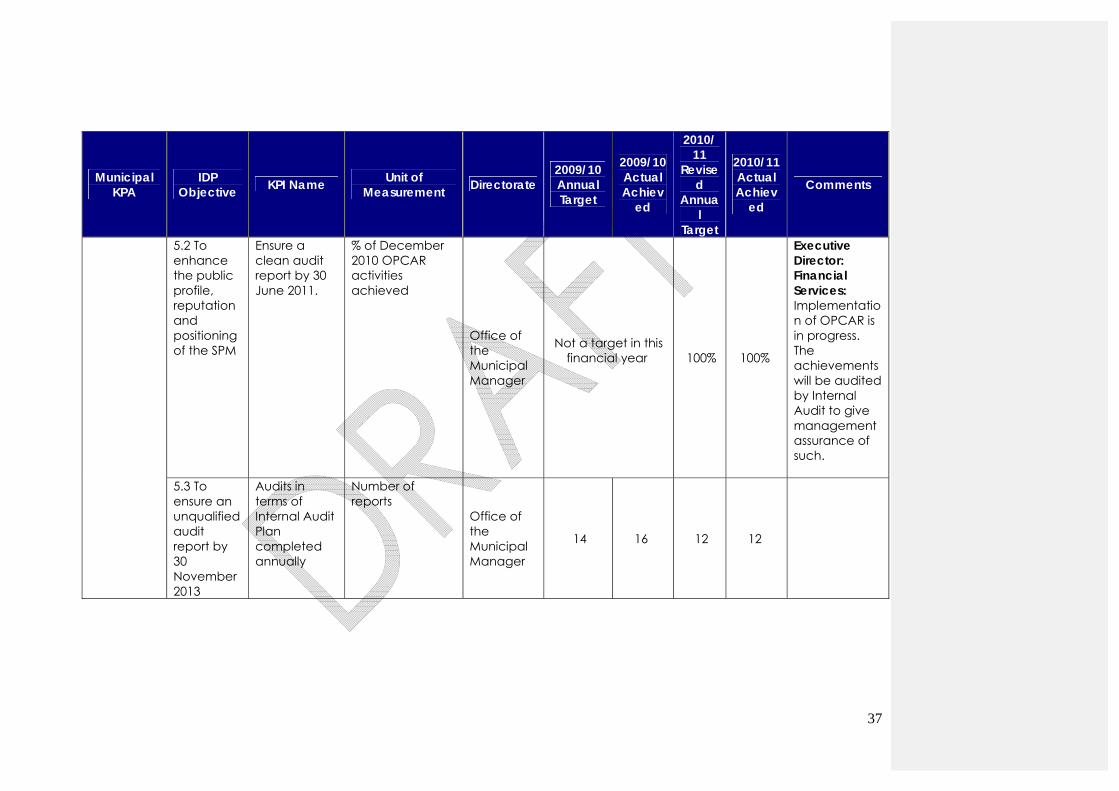
5.2 To enhance the public profile, reputation and positioning of the SPM
Ensure a clean audit report by 30 June 2011.
% of December 2010 OPCAR activities achieved
Office of the Municipal Manager
Not a target in this financial year
100% 100%
Executive Director: Financial Services: Implementation of OPCAR is in progress. The achievements will be audited by Internal Audit to give management assurance of such.
5.3 To ensure an unqualified audit report by 30 November 2013
Audits in terms of Internal Audit Plan completed annually
Number of reports
Office of the Municipal Manager
14 16 12 12
38
Municipal KPA
IDP Objective KPI Name Unit of
Measurement Directorate 2009/10 Annual Target
2009/10 Actual Achiev
ed
2010/11
Revised
Annual
Target
2010/11 Actual Achiev
ed
Comments
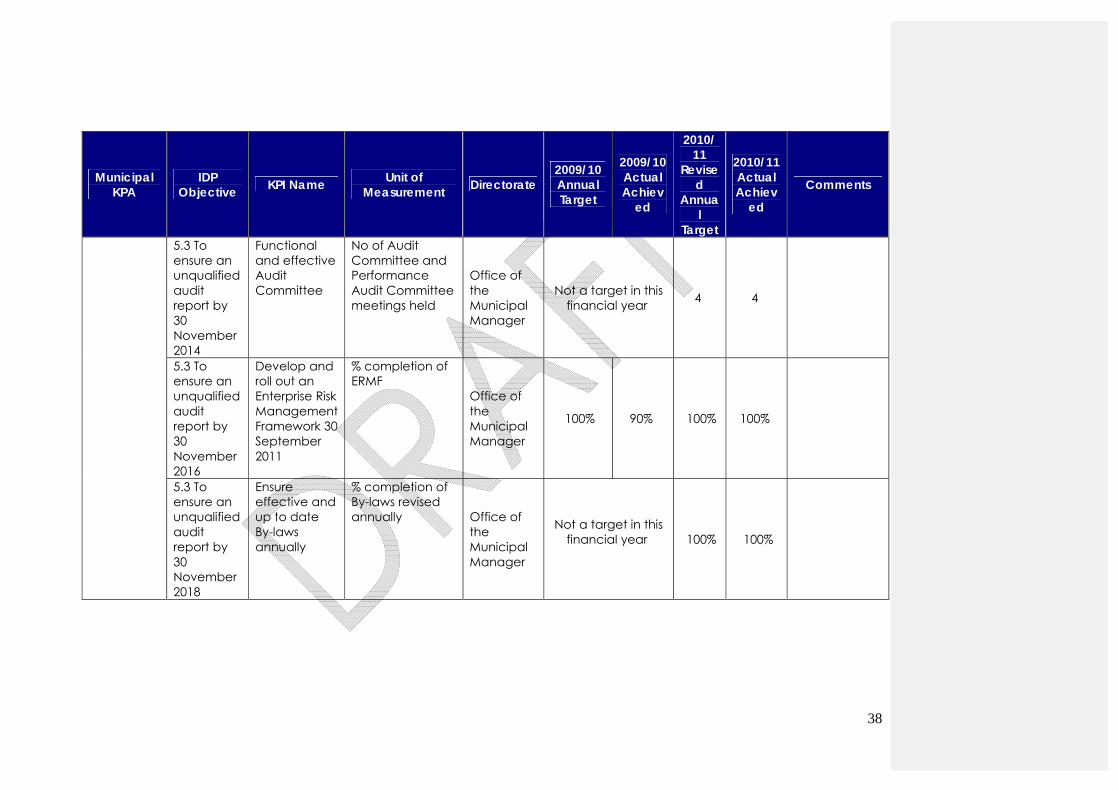
5.3 To ensure an unqualified audit report by 30 November 2014
Functional and effective Audit Committee
No of Audit Committee and Performance Audit Committee meetings held
Office of the Municipal Manager
Not a target in this
financial year
4 4
5.3 To ensure an unqualified audit report by 30 November 2016
Develop and roll out an Enterprise Risk Management Framework 30 September 2011
% completion of ERMF
Office of the Municipal Manager
100% 90% 100% 100%
5.3 To ensure an unqualified audit report by 30 November 2018
Ensure effective and up to date By-laws annually
% completion of By-laws revised annually Office of
the Municipal Manager
Not a target in this financial year
100% 100%
39
Municipal KPA
IDP Objective KPI Name Unit of
Measurement Directorate 2009/10 Annual Target
2009/10 Actual Achiev
ed
2010/11
Revised
Annual
Target
2010/11 Actual Achiev
ed
Comments
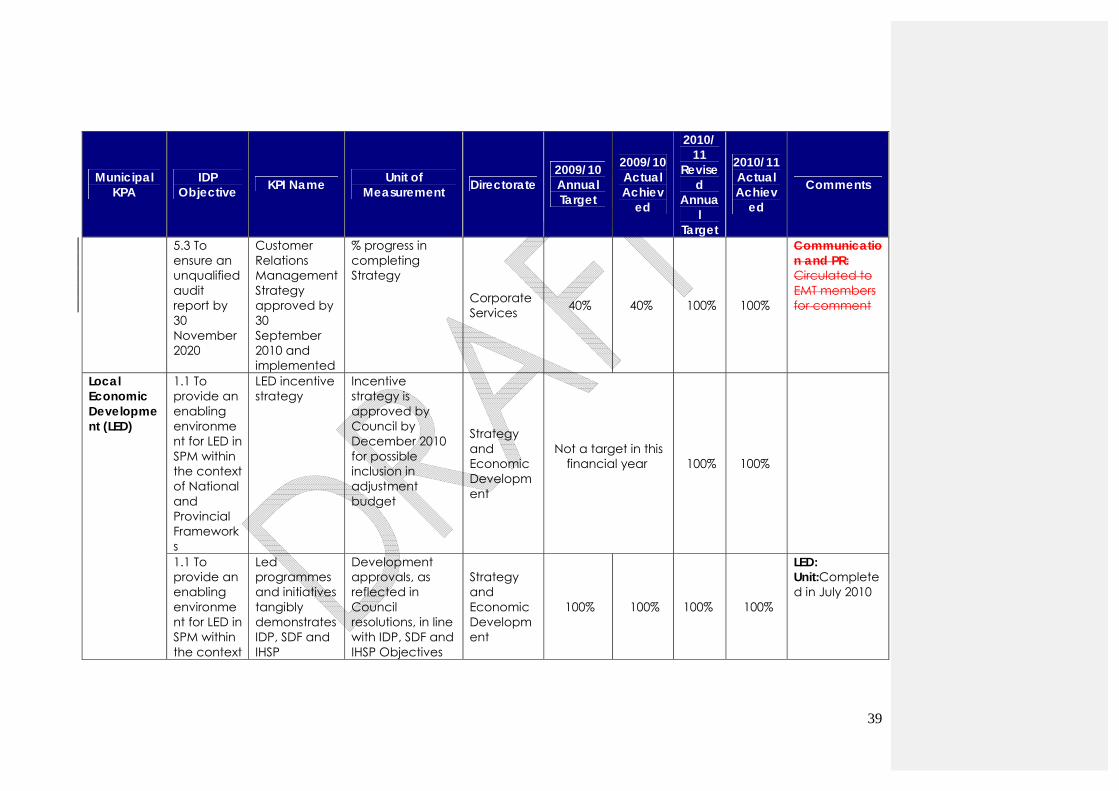
5.3 To ensure an unqualified audit report by 30 November 2020
Customer Relations Management Strategy approved by 30 September 2010 and implemented
% progress in completing Strategy
Corporate Services 40% 40% 100% 100%
Communication and PR: Circulated to EMT members for comment
Local Economic Development (LED)
1.1 To provide an enabling environment for LED in SPM within the context of National and Provincial Frameworks
LED incentive strategy
Incentive strategy is approved by Council by December 2010 for possible inclusion in adjustment budget
Strategy and Economic Development
Not a target in this financial year
100% 100%
1.1 To provide an enabling environment for LED in SPM within the context
Led programmes and initiatives tangibly demonstrates IDP, SDF and IHSP
Development approvals, as reflected in Council resolutions, in line with IDP, SDF and IHSP Objectives
Strategy and Economic Development
100% 100% 100% 100%
LED: Unit:Completed in July 2010
40
Municipal KPA
IDP Objective KPI Name Unit of
Measurement Directorate 2009/10 Annual Target
2009/10 Actual Achiev
ed
2010/11
Revised
Annual
Target
2010/11 Actual Achiev
ed
Comments
of National and Provincial Frameworks
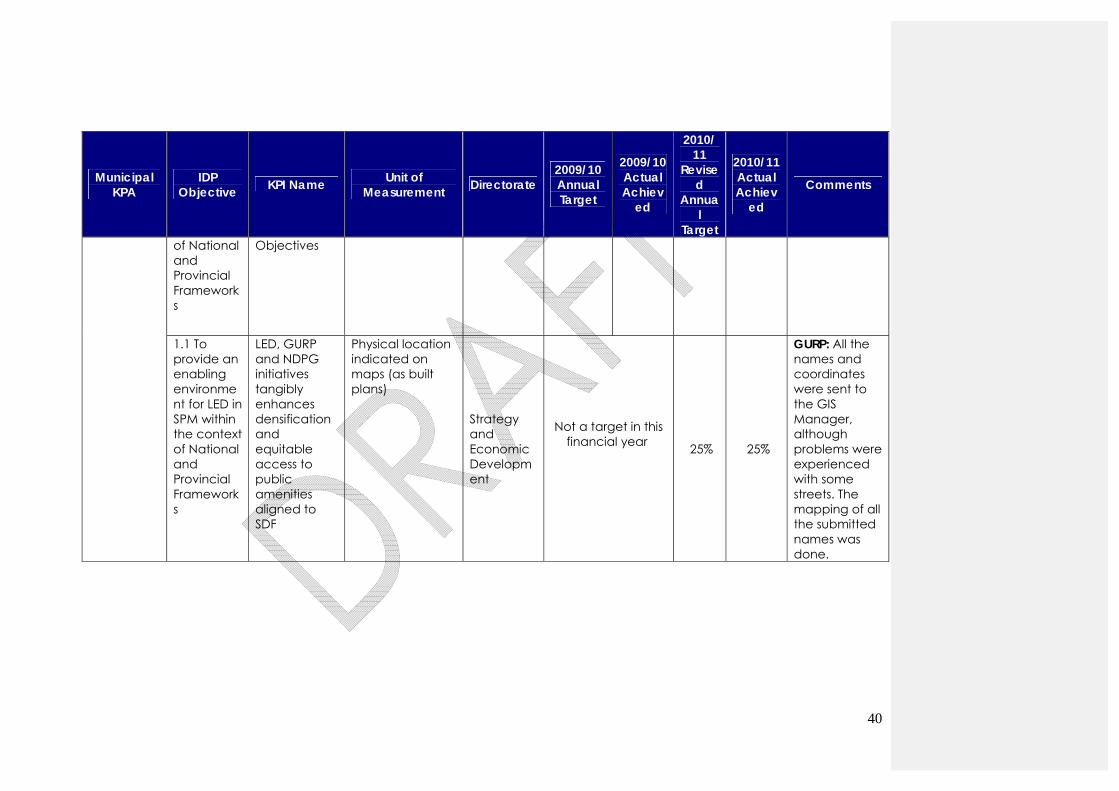
Objectives
1.1 To provide an enabling environment for LED in SPM within the context of National and Provincial Frameworks
LED, GURP and NDPG initiatives tangibly enhances densification and equitable access to public amenities aligned to SDF
Physical location indicated on maps (as built plans)
Strategy and Economic Development
Not a target in this financial year
25% 25%
GURP: All the names and coordinates were sent to the GIS Manager, although problems were experienced with some streets. The mapping of all the submitted names was done.

41
Municipal KPA
IDP Objective KPI Name Unit of
Measurement Directorate 2009/10 Annual Target
2009/10 Actual Achiev
ed
2010/11
Revised
Annual
Target
2010/11 Actual Achiev
ed
Comments
1.1 To provide an enabling environment for LED in SPM within the context of National and Provincial Frameworks
Review of Land Policy
% progress in Land Policy adopted by council by August 2010
Strategy and Economic Development
Not a target in this financial year
100% 100%
Urban Planning: The LUMS has not been promulgated; technical issues realised in the content. Town Planning Unit exploring different avenues in attempt to proclaim the document. Interpretation Act, 1957 (Act 33 of 1957), with specific reference to Section 12(2)(c) may assist with further progressing with the promulgation process.
42
Municipal KPA
IDP Objective KPI Name Unit of
Measurement Directorate 2009/10 Annual Target
2009/10 Actual Achiev
ed
2010/11
Revised
Annual
Target
2010/11 Actual Achiev
ed
Comments
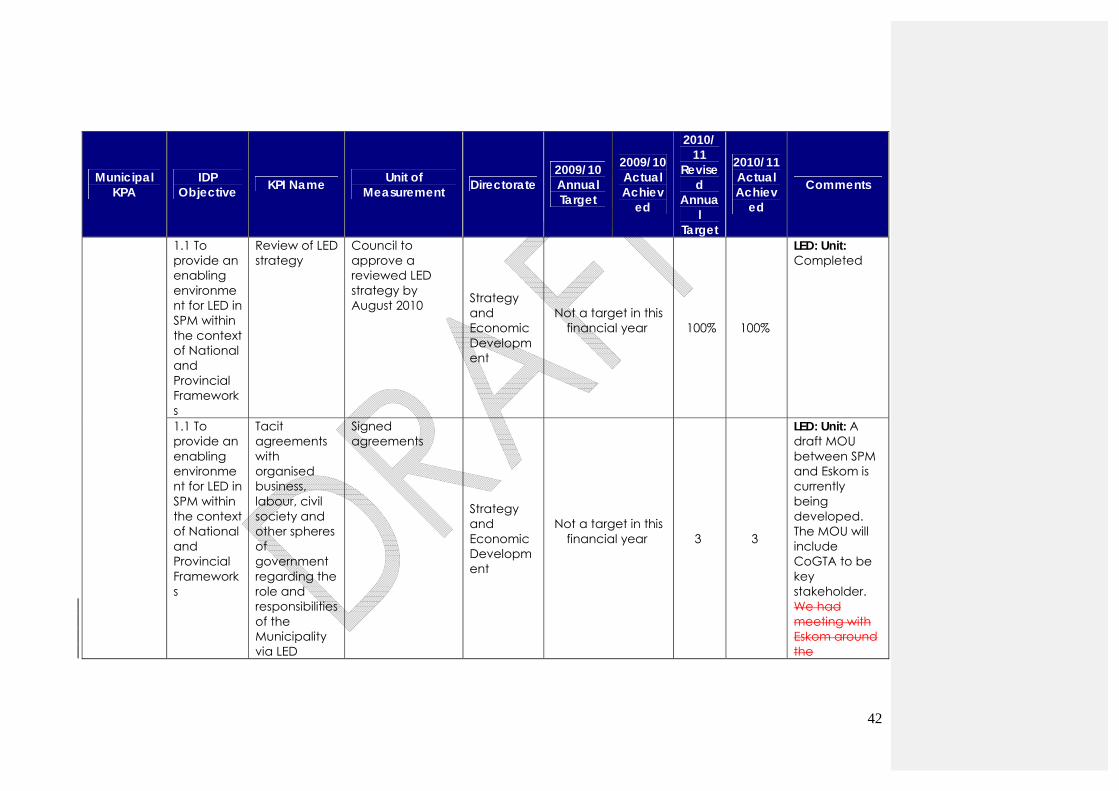
1.1 To provide an enabling environment for LED in SPM within the context of National and Provincial Frameworks
Review of LED strategy
Council to approve a reviewed LED strategy by August 2010 Strategy
and Economic Development
Not a target in this financial year
100% 100%
LED: Unit: Completed
1.1 To provide an enabling environment for LED in SPM within the context of National and Provincial Frameworks
Tacit agreements with organised business, labour, civil society and other spheres of government regarding the role and responsibilities of the Municipality via LED
Signed agreements
Strategy and Economic Development
Not a target in this financial year
3 3
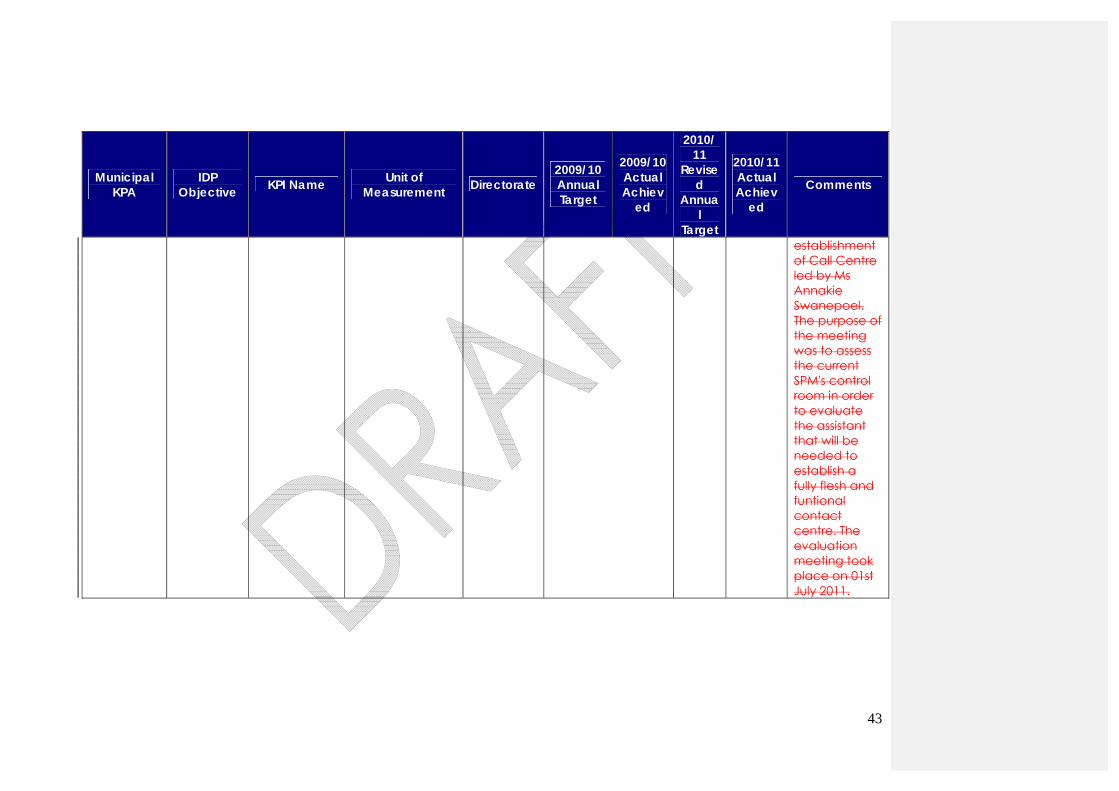
LED: Unit: A draft MOU between SPM and Eskom is currently being developed. The MOU will include CoGTA to be key stakeholder. We had meeting with Eskom around the
43
Municipal KPA
IDP Objective KPI Name Unit of
Measurement Directorate 2009/10 Annual Target
2009/10 Actual Achiev
ed
2010/11
Revised
Annual
Target
2010/11 Actual Achiev
ed
Comments
establishment of Call Centre led by Ms Annakie Swanepoel. The purpose of the meeting was to assess the current SPM's control room in order to evaluate the assistant that will be needed to establish a fully flesh and funtional contact centre. The evaluation meeting took place on 01st July 2011.
44
Municipal KPA
IDP Objective KPI Name Unit of
Measurement Directorate 2009/10 Annual Target
2009/10 Actual Achiev
ed
2010/11
Revised
Annual
Target
2010/11 Actual Achiev
ed
Comments
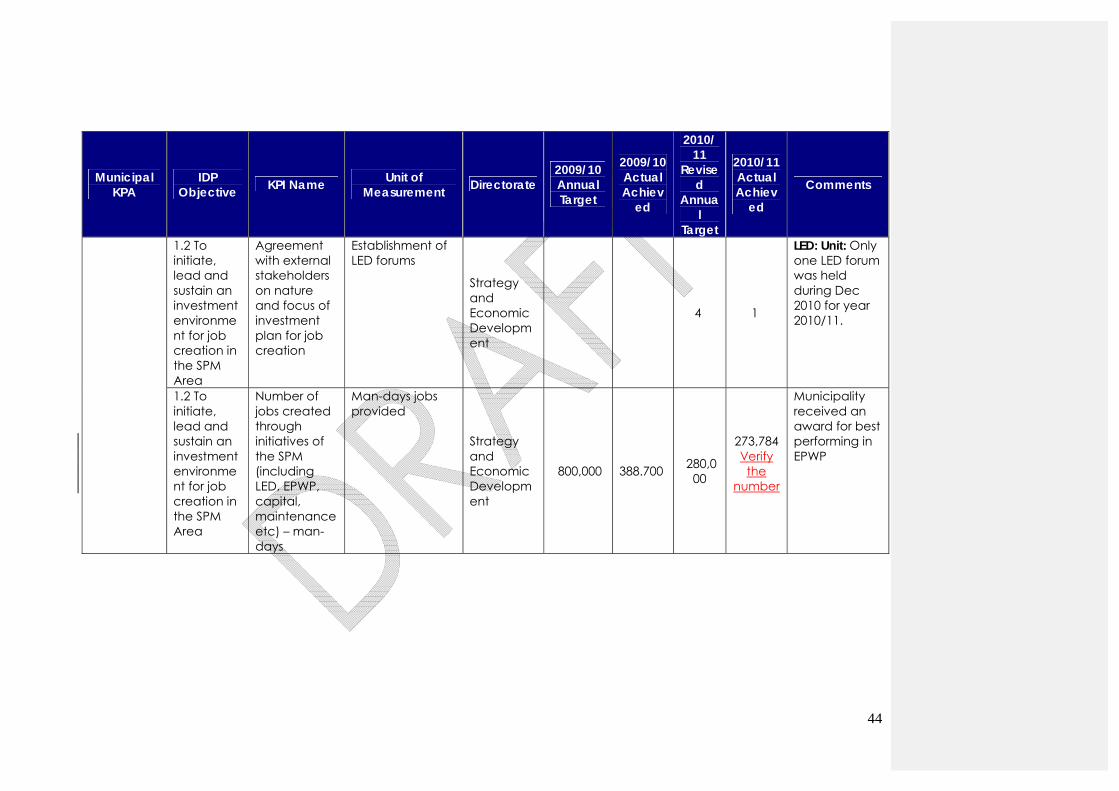
1.2 To initiate, lead and sustain an investment environment for job creation in the SPM Area
Agreement with external stakeholders on nature and focus of investment plan for job creation
Establishment of LED forums
Strategy and Economic Development
4 1
LED: Unit: Only one LED forum was held during Dec 2010 for year 2010/11.
1.2 To initiate, lead and sustain an investment environment for job creation in the SPM Area
Number of jobs created through initiatives of the SPM (including LED, EPWP, capital, maintenance etc) – man-days
Man-days jobs provided
Strategy and Economic Development
800,000 388.700 280,000
273,784 Verify the
number
Municipality received an award for best performing in EPWP
45
Municipal KPA
IDP Objective KPI Name Unit of
Measurement Directorate 2009/10 Annual Target
2009/10 Actual Achiev
ed
2010/11
Revised
Annual
Target
2010/11 Actual Achiev
ed
Comments
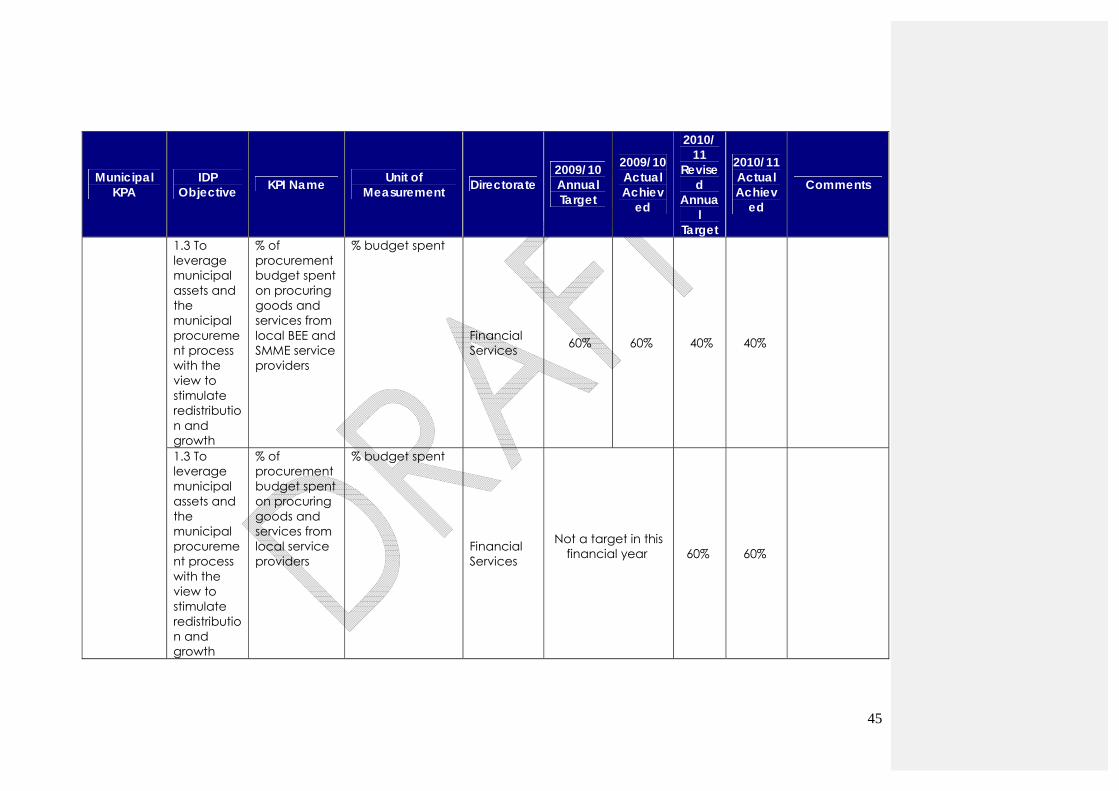
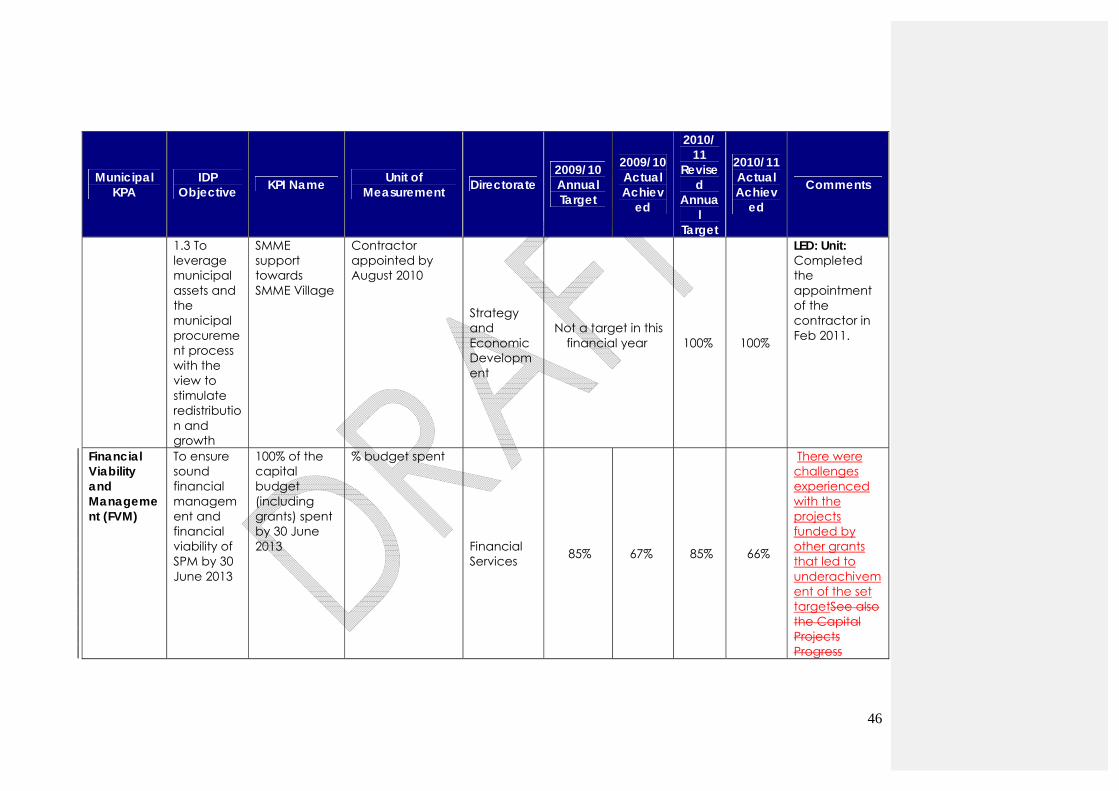
1.3 To leverage municipal assets and the municipal procurement process with the view to stimulate redistribution and growth
% of procurement budget spent on procuring goods and services from local BEE and SMME service providers
% budget spent
Financial Services 60% 60% 40% 40%
1.3 To leverage municipal assets and the municipal procurement process with the view to stimulate redistribution and growth
% of procurement budget spent on procuring goods and services from local service providers
% budget spent
Financial Services
Not a target in this financial year
60% 60%
46
Municipal KPA
IDP Objective KPI Name Unit of
Measurement Directorate 2009/10 Annual Target
2009/10 Actual Achiev
ed
2010/11
Revised
Annual
Target
2010/11 Actual Achiev
ed
Comments
1.3 To leverage municipal assets and the municipal procurement process with the view to stimulate redistribution and growth
SMME support towards SMME Village
Contractor appointed by August 2010
Strategy and Economic Development
Not a target in this financial year
100% 100%
LED: Unit: Completed the appointment of the contractor in Feb 2011.
Financial Viability and Management (FVM)
To ensure sound financial management and financial viability of SPM by 30 June 2013
100% of the capital budget (including grants) spent by 30 June 2013
% budget spent
Financial Services 85% 67% 85% 66%
There were challenges experienced with the projects funded by other grants that led to underachivement of the set targetSee also the Capital Projects Progress
47
Municipal KPA
IDP Objective KPI Name Unit of
Measurement Directorate 2009/10 Annual Target
2009/10 Actual Achiev
ed
2010/11
Revised
Annual
Target
2010/11 Actual Achiev
ed
Comments
Report
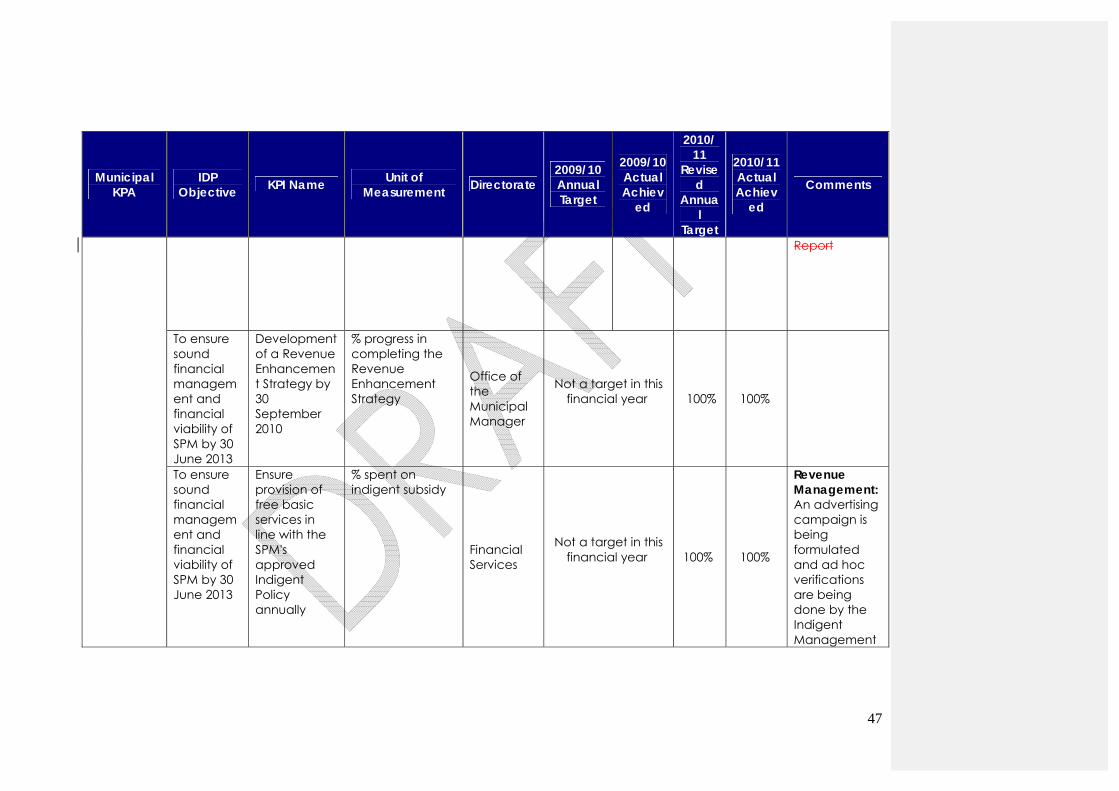
To ensure sound financial management and financial viability of SPM by 30 June 2013
Development of a Revenue Enhancement Strategy by 30 September 2010
% progress in completing the Revenue Enhancement Strategy
Office of the Municipal Manager
Not a target in this financial year
100% 100%
To ensure sound financial management and financial viability of SPM by 30 June 2013
Ensure provision of free basic services in line with the SPM's approved Indigent Policy annually
% spent on indigent subsidy
Financial Services
Not a target in this financial year
100% 100%
Revenue Management: An advertising campaign is being formulated and ad hoc verifications are being done by the Indigent Management
48
Municipal KPA
IDP Objective KPI Name Unit of
Measurement Directorate 2009/10 Annual Target
2009/10 Actual Achiev
ed
2010/11
Revised
Annual
Target
2010/11 Actual Achiev
ed
Comments
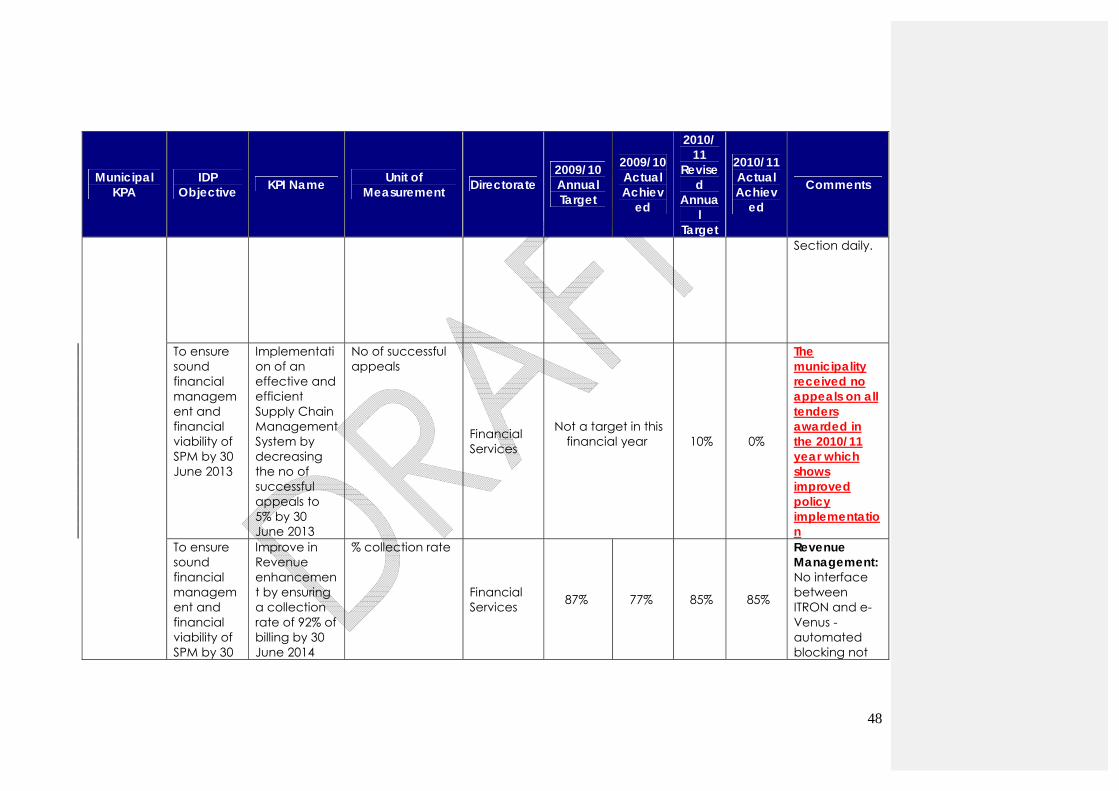
Section daily.
To ensure sound financial management and financial viability of SPM by 30 June 2013
Implementation of an effective and efficient Supply Chain Management System by decreasing the no of successful appeals to 5% by 30 June 2013
No of successful appeals
Financial Services
Not a target in this financial year
10% 0%
The municipality received no appeals on all tenders awarded in the 2010/11 year which shows improved policy implementation
To ensure sound financial management and financial viability of SPM by 30
Improve in Revenue enhancement by ensuring a collection rate of 92% of billing by 30 June 2014
% collection rate
Financial Services 87% 77% 85% 85%
Revenue Management: No interface between ITRON and e-Venus - automated blocking not
49
Municipal KPA
IDP Objective KPI Name Unit of
Measurement Directorate 2009/10 Annual Target
2009/10 Actual Achiev
ed
2010/11
Revised
Annual
Target
2010/11 Actual Achiev
ed
Comments
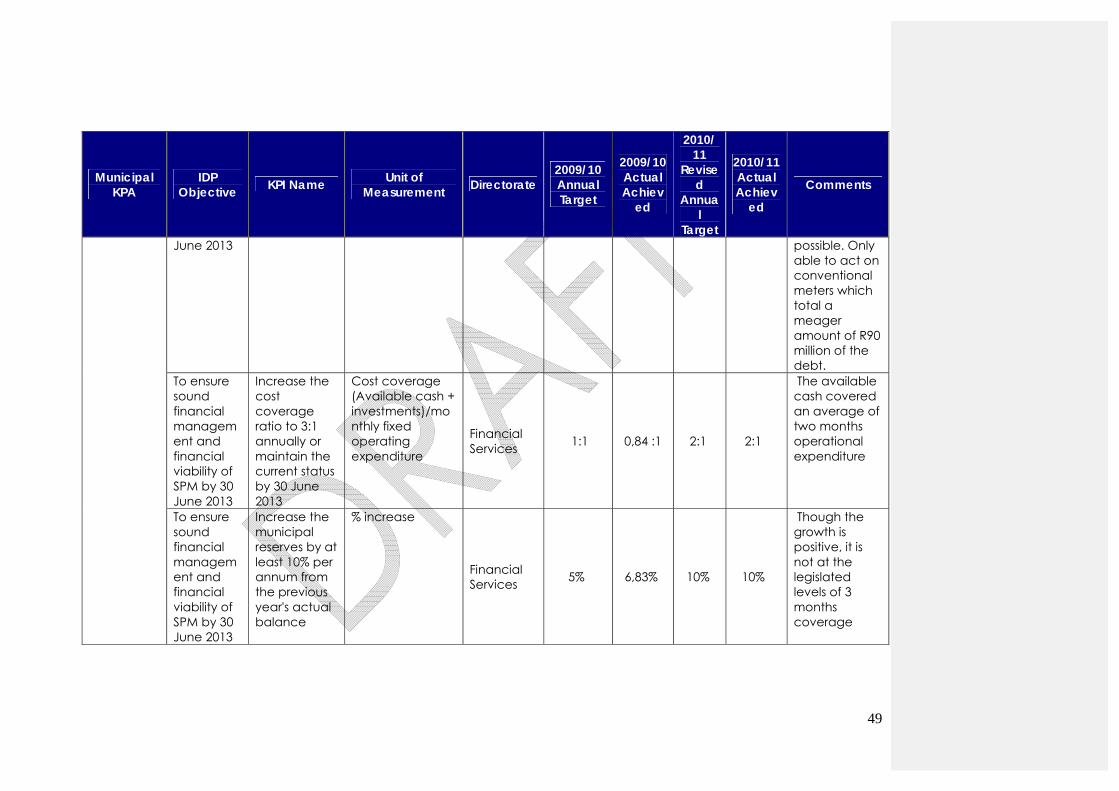
June 2013 possible. Only able to act on conventional meters which total a meager amount of R90 million of the debt.
To ensure sound financial management and financial viability of SPM by 30 June 2013
Increase the cost coverage ratio to 3:1 annually or maintain the current status by 30 June 2013
Cost coverage (Available cash + investments)/monthly fixed operating expenditure
Financial Services 1:1 0,84 :1 2:1 2:1
The available cash covered an average of two months operational expenditure
To ensure sound financial management and financial viability of SPM by 30 June 2013
Increase the municipal reserves by at least 10% per annum from the previous year's actual balance
% increase
Financial Services 5% 6,83% 10% 10%
Though the growth is positive, it is not at the legislated levels of 3 months coverage
50
Municipal KPA
IDP Objective KPI Name Unit of
Measurement Directorate 2009/10 Annual Target
2009/10 Actual Achiev
ed
2010/11
Revised
Annual
Target
2010/11 Actual Achiev
ed
Comments
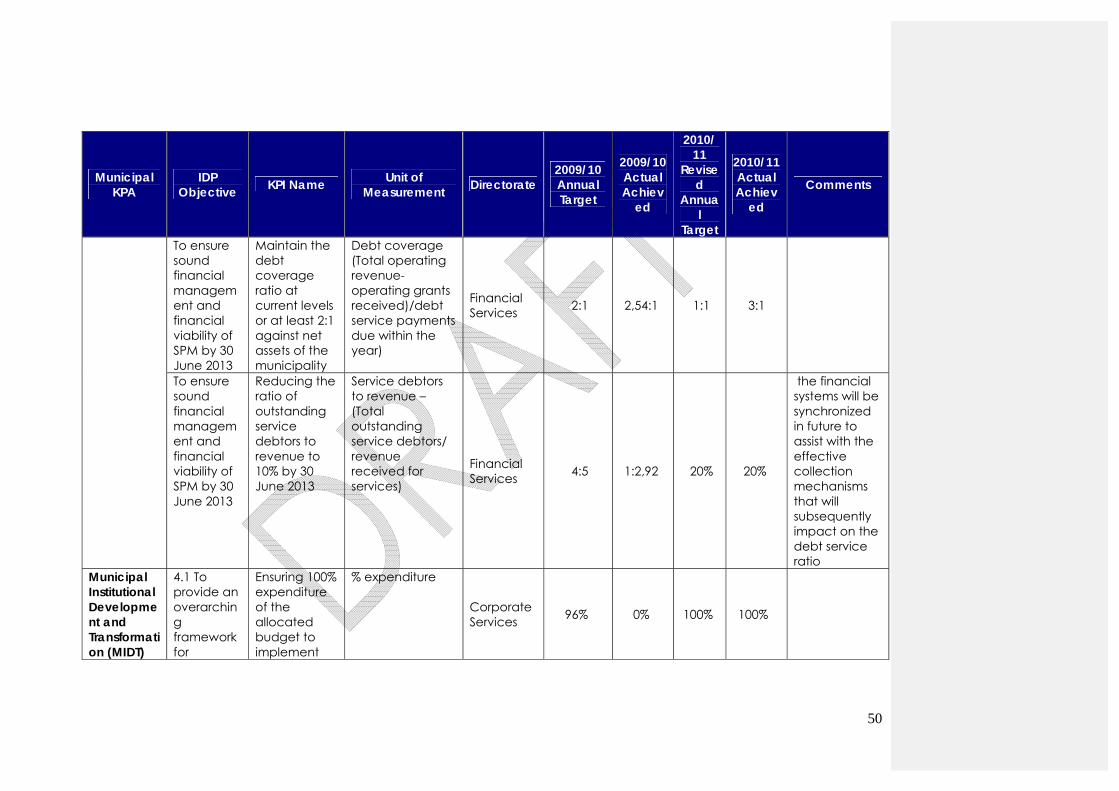
To ensure sound financial management and financial viability of SPM by 30 June 2013
Maintain the debt coverage ratio at current levels or at least 2:1 against net assets of the municipality
Debt coverage (Total operating revenue-operating grants received)/debt service payments due within the year)
Financial Services 2:1 2,54:1 1:1 3:1
To ensure sound financial management and financial viability of SPM by 30 June 2013
Reducing the ratio of outstanding service debtors to revenue to 10% by 30 June 2013
Service debtors to revenue – (Total outstanding service debtors/ revenue received for services)
Financial Services 4:5 1:2,92 20% 20%
the financial systems will be synchronized in future to assist with the effective collection mechanisms that will subsequently impact on the debt service ratio
Municipal Institutional Development and Transformation (MIDT)
4.1 To provide an overarching framework for
Ensuring 100% expenditure of the allocated budget to implement
% expenditure
Corporate Services 96% 0% 100% 100%
51
Municipal KPA
IDP Objective KPI Name Unit of
Measurement Directorate 2009/10 Annual Target
2009/10 Actual Achiev
ed
2010/11
Revised
Annual
Target
2010/11 Actual Achiev
ed
Comments
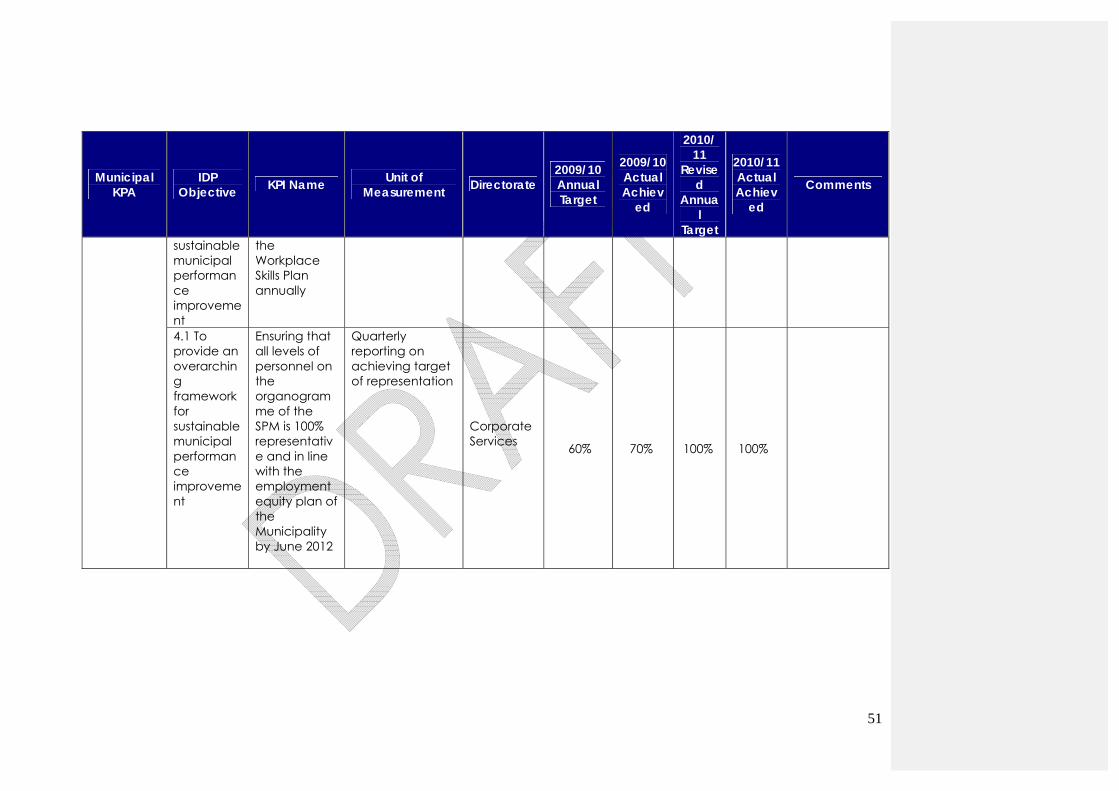
sustainable municipal performance improvement
the Workplace Skills Plan annually
4.1 To provide an overarching framework for sustainable municipal performance improvement
Ensuring that all levels of personnel on the organogramme of the SPM is 100% representative and in line with the employment equity plan of the Municipality by June 2012
Quarterly reporting on achieving target of representation
Corporate Services
60% 70% 100% 100%
52
Municipal KPA
IDP Objective KPI Name Unit of
Measurement Directorate 2009/10 Annual Target
2009/10 Actual Achiev
ed
2010/11
Revised
Annual
Target
2010/11 Actual Achiev
ed
Comments
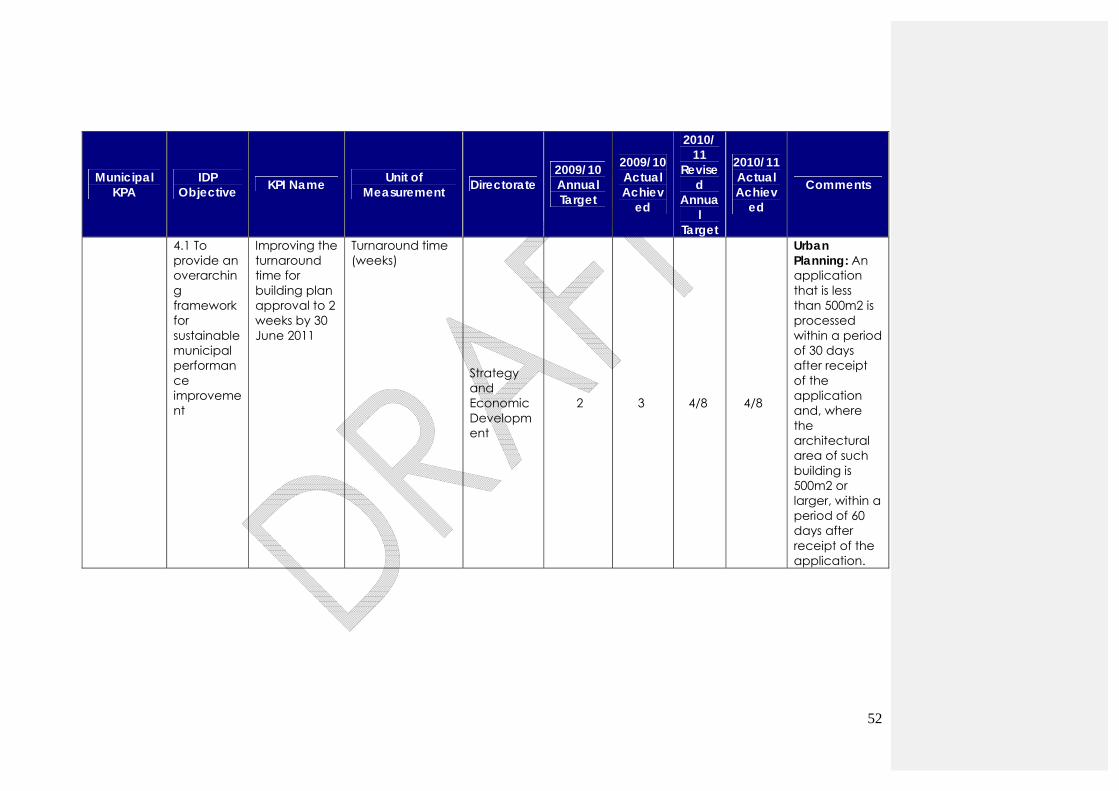
4.1 To provide an overarching framework for sustainable municipal performance improvement
Improving the turnaround time for building plan approval to 2 weeks by 30 June 2011
Turnaround time (weeks)
Strategy and Economic Development
2 3 4/8 4/8
Urban Planning: An application that is less than 500m2 is processed within a period of 30 days after receipt of the application and, where the architectural area of such building is 500m2 or larger, within a period of 60 days after receipt of the application.
53
Municipal KPA
IDP Objective KPI Name Unit of
Measurement Directorate 2009/10 Annual Target
2009/10 Actual Achiev
ed
2010/11
Revised
Annual
Target
2010/11 Actual Achiev
ed
Comments
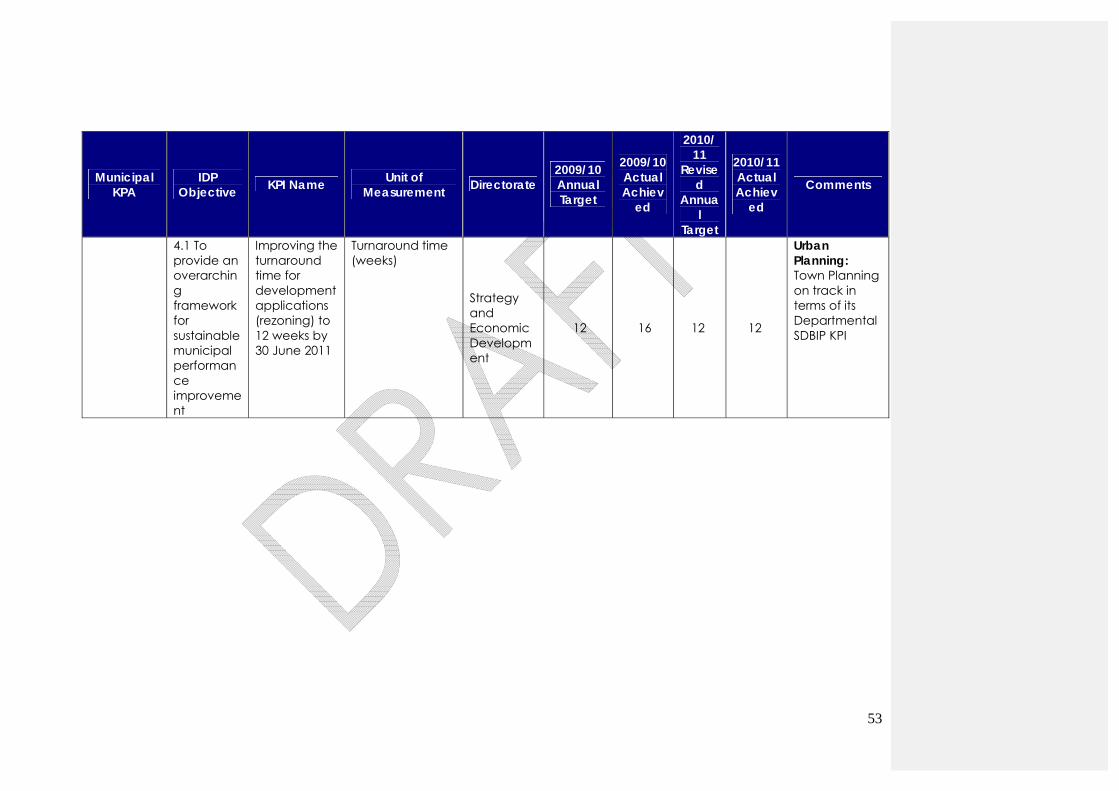
4.1 To provide an overarching framework for sustainable municipal performance improvement
Improving the turnaround time for development applications (rezoning) to 12 weeks by 30 June 2011
Turnaround time (weeks)
Strategy and Economic Development
12 16 12 12
Urban Planning: Town Planning on track in terms of its Departmental SDBIP KPI
54
2.3 2.3 Backlogs in Service Delivery 2.2 Backlogs in Service Delivery Backlogs in regard to housing related services are still a huge concern for the municipality. During the financial year under review not much of these backlogs could be eradicated as priority was given to the bulk infrastructure challenges that exist. The municipality does not necessarily budget for these type of services but rather rely on housing development grants from COGHSTA, electrification subsidies from the DoE and a small portion of MIG funding. Water Backlogs Backlogs for the water service are based on the number of households without access to the service. These backlogs include both formal and informal areas within the municipality. At the beginning of the financial year backlogs for the water service were standing at an estimate of 7,730 households. During the financial year, one project was focused in this area which was the Water Reticulation Promise Land (700 households), due to the delays in implementation the project was not completed and therefore the water backlogs remained the same. Sanitation Backlogs Backlogs for the sanitation service are based on the number of households without access to the service. These backlogs include both formal and informal areas within the municipality. At the beginning of the financial year backlogs in terms of the sanitation service were standing at an estimate of 7,730 households. During the financial year 2010/11 no reticulation projects were planned due to focus being given to bulk sanitation projects which means the sanitation backlogs remained the same. Electricity Backlogs Backlogs for the electricity service are linked to the number of households without access to this service. These backlogs include both formal and informal areas within the municipality. At the beginning of the financial year backlogs in terms of the electrical service stood at an estimate of 8,154 households. During the financial year 2010/11 336 households were electrified; these households are located in Soul City (194); Greenpoint (105) and Mathibe Grounds (37) areas within the municipality. With 336 backlogs being eradicated the estimated backlog will reduce to 7,818 for the electricity service. Road Backlogs Backlogs on municipal roads are estimated based on the number of kilometers of roads not surfaced in the municipal jurisdiction. These backlogs include all dirt/earth and gravel roads within the residential areas but exclude backlogs relating to surfaced roads which are maintenance related. At the beginning of the financial year the roads backlogs were standing at an estimate of 205.5 kilometers. During the financial year 2010/11 at least 5.2 km of streets were constructed in various wards from different funding sources. With 5.2 km of
Formatted: Outline numbered +Level: 2 + Numbering Style: 1, 2, 3, …+ Start at: 2 + Alignment: Left +Aligned at: 0 cm + Tab after: 1.27cm + Indent at: 1.27 cm
55
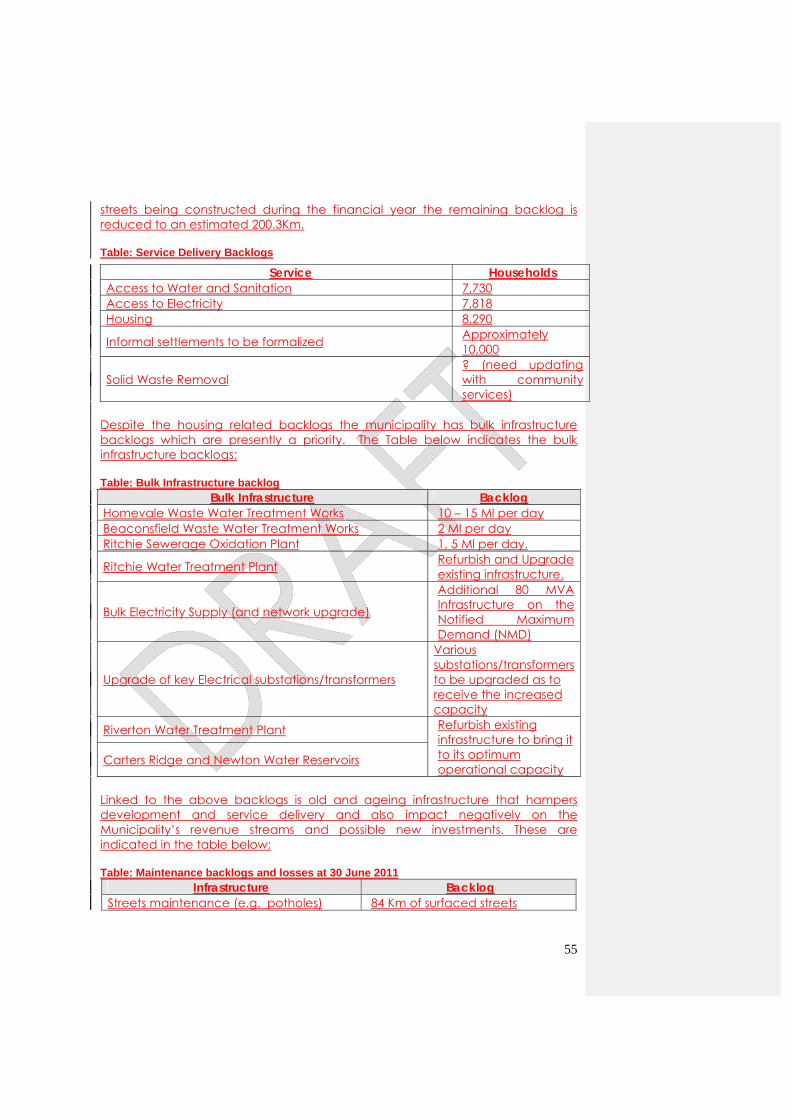
streets being constructed during the financial year the remaining backlog is reduced to an estimated 200.3Km. Table: Service Delivery Backlogs
Despite the housing related backlogs the municipality has bulk infrastructure backlogs which are presently a priority. The Table below indicates the bulk infrastructure backlogs: Table: Bulk Infrastructure backlog
Bulk Infrastructure Backlog Homevale Waste Water Treatment Works 10 – 15 Ml per day Beaconsfield Waste Water Treatment Works 2 Ml per day Ritchie Sewerage Oxidation Plant 1, 5 Ml per day.
Ritchie Water Treatment Plant Refurbish and Upgrade existing infrastructure.
Bulk Electricity Supply (and network upgrade)
Additional 80 MVA Infrastructure on the Notified Maximum Demand (NMD)
Upgrade of key Electrical substations/transformers
Various substations/transformers to be upgraded as to receive the increased capacity
Riverton Water Treatment Plant Refurbish existing infrastructure to bring it to its optimum operational capacity
Carters Ridge and Newton Water Reservoirs
Linked to the above backlogs is old and ageing infrastructure that hampers development and service delivery and also impact negatively on the Municipality’s revenue streams and possible new investments. These are indicated in the table below; Table: Maintenance backlogs and losses at 30 June 2011
Infrastructure Backlog Streets maintenance (e.g. potholes) 84 Km of surfaced streets
Service Households Access to Water and Sanitation 7,730 Access to Electricity 7,818 Housing 8,290
Informal settlements to be formalized Approximately 10,000
Solid Waste Removal ? (need updating with community services)
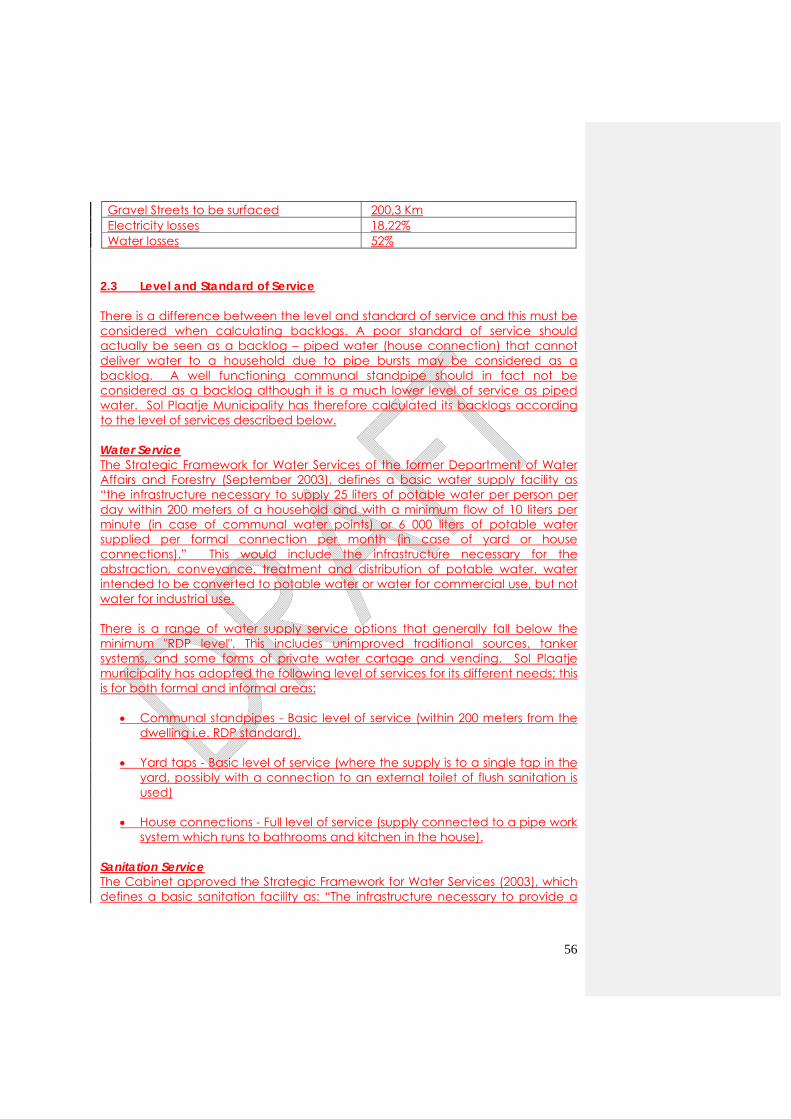
56
Gravel Streets to be surfaced 200,3 Km Electricity losses 18,22% Water losses 52%
2.3 Level and Standard of Service There is a difference between the level and standard of service and this must be considered when calculating backlogs. A poor standard of service should actually be seen as a backlog – piped water (house connection) that cannot deliver water to a household due to pipe bursts may be considered as a backlog. A well functioning communal standpipe should in fact not be considered as a backlog although it is a much lower level of service as piped water. Sol Plaatje Municipality has therefore calculated its backlogs according to the level of services described below. Water Service The Strategic Framework for Water Services of the former Department of Water Affairs and Forestry (September 2003), defines a basic water supply facility as “the infrastructure necessary to supply 25 liters of potable water per person per day within 200 meters of a household and with a minimum flow of 10 liters per minute (in case of communal water points) or 6 000 liters of potable water supplied per formal connection per month (in case of yard or house connections).” This would include the infrastructure necessary for the abstraction, conveyance, treatment and distribution of potable water, water intended to be converted to potable water or water for commercial use, but not water for industrial use. There is a range of water supply service options that generally fall below the minimum "RDP level". This includes unimproved traditional sources, tanker systems, and some forms of private water cartage and vending. Sol Plaatje municipality has adopted the following level of services for its different needs; this is for both formal and informal areas:
Communal standpipes - Basic level of service (within 200 meters from the dwelling i.e. RDP standard).
Yard taps - Basic level of service (where the supply is to a single tap in the
yard, possibly with a connection to an external toilet of flush sanitation is used)
House connections - Full level of service (supply connected to a pipe work
system which runs to bathrooms and kitchen in the house). Sanitation Service The Cabinet approved the Strategic Framework for Water Services (2003), which defines a basic sanitation facility as: “The infrastructure necessary to provide a
57
sanitation service which is safe, reliable, private, protected from the weather, ventilated, keeps smells to the minimum, is easy to keep clean, minimizes the risk of the spread of sanitation- related diseases by facilitating the appropriate control of disease carrying flies and pests, and enables safe and appropriate treatment and/or removal of human waste and wastewater in an environmentally sound manner.” A basic sanitation service is defined in the Strategic Framework for Water Services as: “The provision of a basic sanitation facility which is easily accessible to a household, the sustainable operation of the facility, including the safe removal of human waste and wastewater from the premises where this is appropriate and necessary, and the communication of good sanitation, hygiene and related practices.” The final choice of the type of service rests with the Water Services Authority (WSA). In order for the WSA to take such a decision they must ensure that it is practical as well as financially viable and sustainable. Several sanitation systems are widely applied in South Africa, but do not meet the basic level of service requirements. Bucket toilets and unimproved pit toilets are the most obvious, but problems have also been experienced with the operation and maintenance of other systems. Chemical toilets are prohibitively expensive for continuous use and should only be considered as a short-term and temporary measure (i.e. 3-5 months). Sol Plaatje municipality has adopted the following level of services for its different needs; this is for both formal and informal areas:
VIP toilets and other approved dry, on-site sanitation systems.
Septic tanks (usually used in areas not serviced with sewers but where full flush systems are installed, may also be an upgradeable option or as an option where the household takes some of the treatment responsibility from the municipal authority). Suitable for less densely populated areas with soil conditions that have good drainage properties.
Full water-borne sanitation (the household takes minimal responsibility for
treatment and disposal). Sanitation service levels need to be planned in conjunction with the availability of water resources and supply. Where flush systems are required, there must be sufficient water available and the viability of the system must take the cost of supplying water into account. Electricity Service Electricity distribution (defined as electricity reticulation in the constitution) is a municipal function and supplied by the municipality, with Eskom’s distribution arm being a large scale service provider serving a large proportion of South Africa’s municipalities. The bulk supply up to the municipal boundary is not a municipal function but virtually the exclusive domain of Eskom. Costs for the total
58
reticulation have been aggregated by service level and divided by the users served by a particular system hence the difference in cost of service. The level of service referred to here concerns the residential category that the municipality supplies. In terms of the Department of Energy (DoE) a basic provision of electricity that is subsidized is 20 AMP per household and in relation to Free Basic Electricity the proposed levels of service are 50kWh per household per month for a grid-based system for qualifying domestic consumers. Sol Plaatje municipality took a resolution to provide each new household with a 60 AMP grid connection. This decision was prompted by the fact that after developing low income areas households tent to upgrade their standard of living and therefore require a higher level of service which the municipality may not be ready to provide at the time, therefore to curb this the municipality provides a higher level of service to accommodate future upgrades. This approach may seem to be an expensive option but may also be cost effective in the long run. Roads Service Currently, there is not a national policy that defines a basic level of service for roads serving households in residential areas. However, the Municipal Infrastructure Investment Framework refers to "all-weather access to within 500 m of the dwelling". This could be interpreted as a „basic level of service‟. In urban areas, it is generally possible to improve upon this specification and to provide for access by a vehicle to each erf. In some rural areas, where there are very small, scattered settlements, it may not be feasible to provide all-weather access to within 500 m of every dwelling. Sol Plaatje municipality has adopted the following level of service options for its residential roads:
All-weather access to within 500 m of the dwelling Paved width (intermediate or full level of service) Hot premix or other black top surfaces Access to each erf with graded or gravel-paved road (basic) Access to each erf with a narrow paved road or a wider road with a
narrow paved width (intermediate or full level of service); and Due to high rainfall leading to surface run-off; high traffic volumes, gravel roads are not preferred and instead paved roads are a preferable options when considering the mentioned issues. The adaptability and suitability of the proposed road surface to the stormwater drainage to be used is considered as it is a strong linkage that exists between roads and stormwater service options (in a similar manner that water and sanitation services are linked). i.e. some of these roads are constructed in such a way that they carry stormwater (serve a dual purpose).
59
2. 4. Relating Backlogs to Municipal Spending on Service Delivery Infrastructure The Sol Plaatje Municipal Council faces a unique challenge of capacity as well as ageing bulk infrastructure which is unable to provide to the needs of a growing city. The demand for growth in housing, commercial developments and other social and economic infrastructure has resulted in the city’s infrastructural capacity being overstretched. From the bulk infrastructure backlogs it is clear that current capacity is below the desired need. In addition due to age and lack of renewal (and inadequate maintenance) some of the reticulation infrastructure result in considerable losses e.g. 52% losses in water. The municipality undertook the identification of the most urgent infrastructure needs to unlock development and deal with maintenance issues. In support of this an infrastructure upgrade initiative was prioritized and the process of acquiring a DBSA loan commenced. This process is now at implementation stage whereby various infrastructure projects have been indentified and are underway. Amongst these projects the Non-Revenue Water Minimization (NRWM) study was initiated by both the Municipality and DBSA in an attempt to minimize the current water losses experienced. This project involves the analyzing of the water infrastructure to determine the extent of the losses in the network. The result of this study will yield recommended solutions towards minimizing water losses. Another highlight in the current initiatives is the successful completion of Homevale Wastewater Treatment Works (WWTW) Refurbishment project which was recently completed at a cost of over R70 million. The objective of this project was to restore the capacity of the plant which had dilapidated due to maintenance needs. The outcome of the project did not only achieve the refurbishment but has led to an increased additional capacity of 3Ml/day. With the increased capacity, the municipality could uplift the moratorium on development that was placed previously. It should be noted that other bulk infrastructure projects such as the extension of Homevale WWTW and Ritchie; the refurbishment of Beaconsfield plant have been prioritized for both financial year 2010-11 and 2011-12. An application for the upgrading of the Notified Maximum Demand (NMD) from 120 MVA to 200 MVA was submitted to Eskom. This application will provide sufficient bulk electricity requirements but not mitigate the inherent risk of operating substations at maximum capacity. The present Notified Maximum Demand from Eskom is 120 MVA, but is limited to 112 MVA. Eskom has approved the municipal application for increased NMD (demand) from 120MVA to 140MVA. The infrastructure to be constructed will have a capacity of 200 MVA, this is in preparation for future needs. The Southridge Transformer was recently upgraded and has been commissioned.
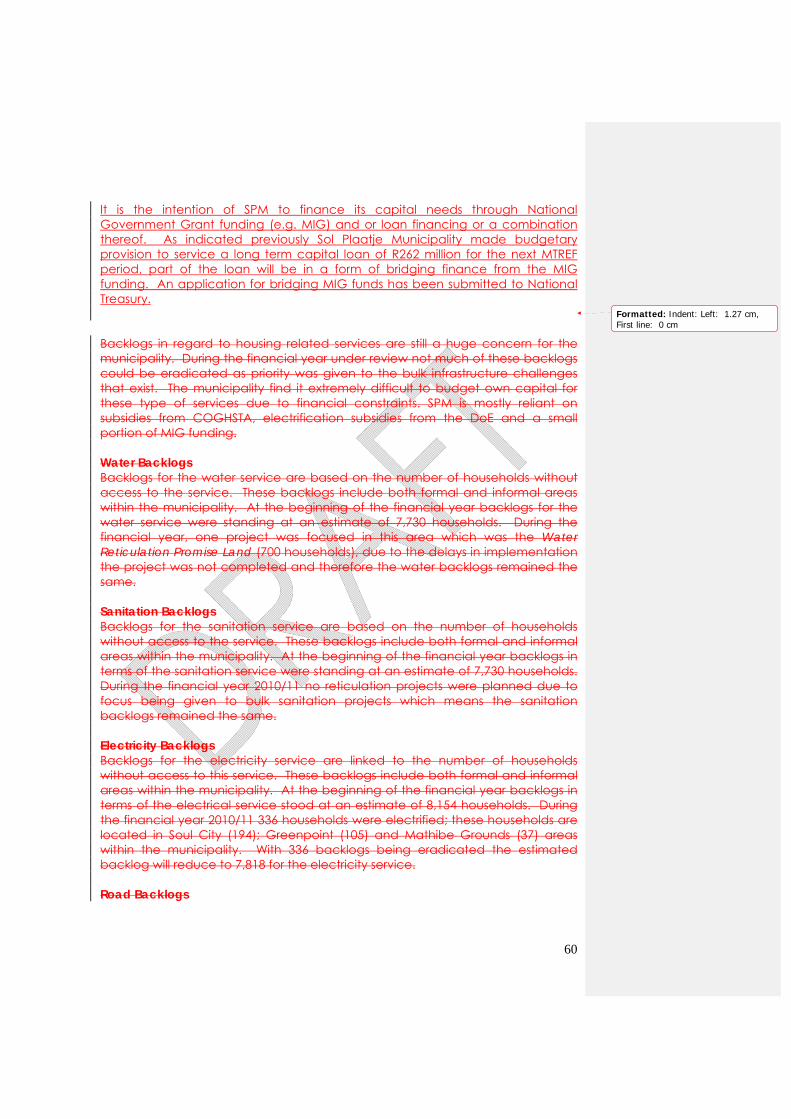
60
It is the intention of SPM to finance its capital needs through National Government Grant funding (e.g. MIG) and or loan financing or a combination thereof. As indicated previously Sol Plaatje Municipality made budgetary provision to service a long term capital loan of R262 million for the next MTREF period, part of the loan will be in a form of bridging finance from the MIG funding. An application for bridging MIG funds has been submitted to National Treasury.
Backlogs in regard to housing related services are still a huge concern for the municipality. During the financial year under review not much of these backlogs could be eradicated as priority was given to the bulk infrastructure challenges that exist. The municipality find it extremely difficult to budget own capital for these type of services due to financial constraints. SPM is mostly reliant on subsidies from COGHSTA, electrification subsidies from the DoE and a small portion of MIG funding. Water Backlogs Backlogs for the water service are based on the number of households without access to the service. These backlogs include both formal and informal areas within the municipality. At the beginning of the financial year backlogs for the water service were standing at an estimate of 7,730 households. During the financial year, one project was focused in this area which was the Water Reticulation Promise Land (700 households), due to the delays in implementation the project was not completed and therefore the water backlogs remained the same. Sanitation Backlogs Backlogs for the sanitation service are based on the number of households without access to the service. These backlogs include both formal and informal areas within the municipality. At the beginning of the financial year backlogs in terms of the sanitation service were standing at an estimate of 7,730 households. During the financial year 2010/11 no reticulation projects were planned due to focus being given to bulk sanitation projects which means the sanitation backlogs remained the same. Electricity Backlogs Backlogs for the electricity service are linked to the number of households without access to this service. These backlogs include both formal and informal areas within the municipality. At the beginning of the financial year backlogs in terms of the electrical service stood at an estimate of 8,154 households. During the financial year 2010/11 336 households were electrified; these households are located in Soul City (194); Greenpoint (105) and Mathibe Grounds (37) areas within the municipality. With 336 backlogs being eradicated the estimated backlog will reduce to 7,818 for the electricity service. Road Backlogs
Formatted: Indent: Left: 1.27 cm,First line: 0 cm
61
Backlogs on municipal roads are estimated based on the number of kilometers of roads not surfaced in the municipal jurisdiction. These backlogs include all dirt/earth and gravel roads within the residential areas but exclude backlogs relating to surfaced roads which are maintenance related. At the beginning of the financial year the roads backlogs were standing at an estimate of 205.5 kilometers. During the financial year 2010/11 at least 5.2 km of streets were constructed in various wards from different funding sources. With 5.2 km of streets being constructed during the financial year the remaining backlog is reduced to an estimated 200.3Km. Table: Service Delivery Backlogs
Despite the housing related backlogs the municipality has bulk infrastructure backlogs which are presently a priority. The Table below indicates the bulk infrastructure backlogs: Table: Bulk Infrastructure backlog
Bulk Infrastructure Backlog Homevale Waste Water Treatment Works 10 – 15 Ml per day Beaconsfield Waste Water Treatment Works 2 Ml per day Ritchie Sewerage Oxidation Plant 1, 5 Ml per day.
Ritchie Water Treatment Plant Refurbish and Upgrade existing infrastructure.
Bulk Electricity Supply (and network upgrade)
Additional 80 MVA Infrastructure on the Notified Maximum Demand (NMD)
Upgrade of key Electrical substations/transformers
Various substations/transformers to be upgraded as to receive the increased capacity
Riverton Water Treatment Plant Refurbish existing infrastructure to bring it to its optimum operational capacity
Carters Ridge and Newton Water Reservoirs
Linked to the above backlogs is old and ageing infrastructure that hampers development and service delivery and also impact negatively on the
Service Households Access to Water and Sanitation 7,730 Access to Electricity 7,818 Housing 8,290
Informal settlements to be formalized Approximately 10,000
Solid Waste Removal 2,000 households
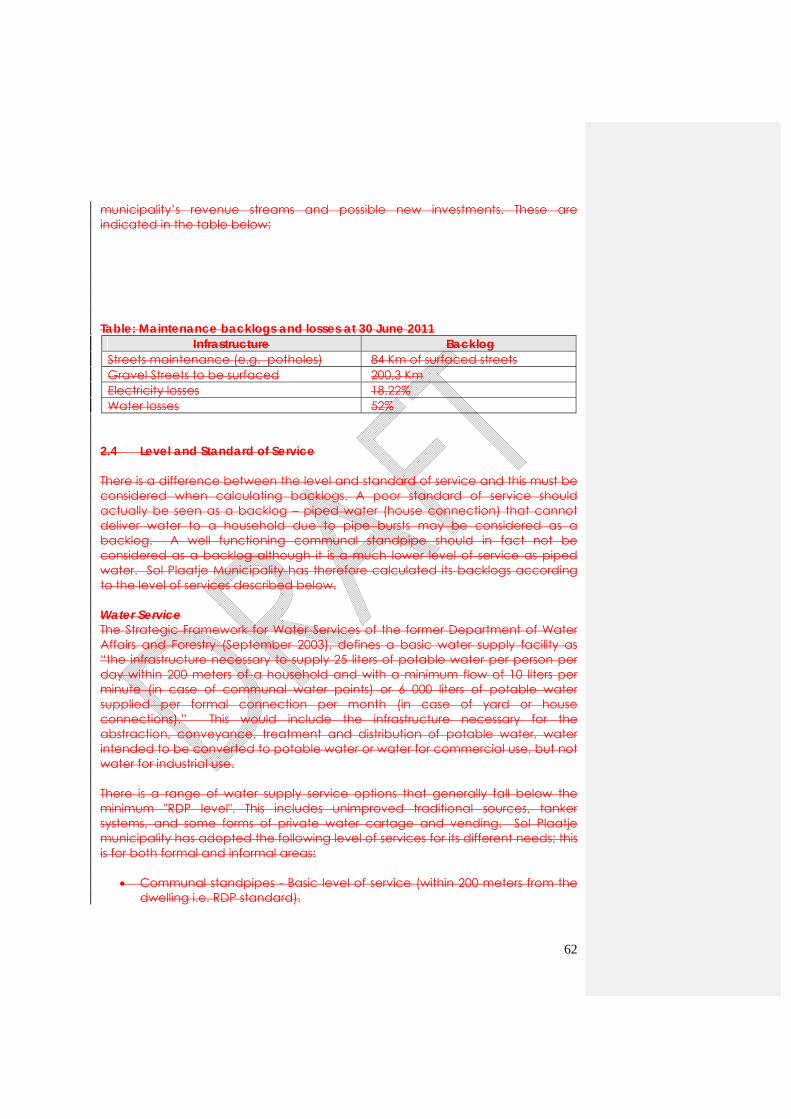
62
municipality’s revenue streams and possible new investments. These are indicated in the table below; Table: Maintenance backlogs and losses at 30 June 2011
Infrastructure Backlog Streets maintenance (e.g. potholes) 84 Km of surfaced streets Gravel Streets to be surfaced 200,3 Km Electricity losses 18,22% Water losses 52%
2.4 Level and Standard of Service There is a difference between the level and standard of service and this must be considered when calculating backlogs. A poor standard of service should actually be seen as a backlog – piped water (house connection) that cannot deliver water to a household due to pipe bursts may be considered as a backlog. A well functioning communal standpipe should in fact not be considered as a backlog although it is a much lower level of service as piped water. Sol Plaatje Municipality has therefore calculated its backlogs according to the level of services described below. Water Service The Strategic Framework for Water Services of the former Department of Water Affairs and Forestry (September 2003), defines a basic water supply facility as “the infrastructure necessary to supply 25 liters of potable water per person per day within 200 meters of a household and with a minimum flow of 10 liters per minute (in case of communal water points) or 6 000 liters of potable water supplied per formal connection per month (in case of yard or house connections).” This would include the infrastructure necessary for the abstraction, conveyance, treatment and distribution of potable water, water intended to be converted to potable water or water for commercial use, but not water for industrial use. There is a range of water supply service options that generally fall below the minimum "RDP level". This includes unimproved traditional sources, tanker systems, and some forms of private water cartage and vending. Sol Plaatje municipality has adopted the following level of services for its different needs; this is for both formal and informal areas:
Communal standpipes - Basic level of service (within 200 meters from the dwelling i.e. RDP standard).
63
Yard taps - Basic level of service (where the supply is to a single tap in the
yard, possibly with a connection to an external toilet of flush sanitation is used)
House connections - Full level of service (supply connected to a pipe work
system which runs to bathrooms and kitchen in the house). Sanitation Service The Cabinet approved the Strategic Framework for Water Services (2003), which defines a basic sanitation facility as: “The infrastructure necessary to provide a sanitation service which is safe, reliable, private, protected from the weather, ventilated, keeps smells to the minimum, is easy to keep clean, minimizes the risk of the spread of sanitation- related diseases by facilitating the appropriate control of disease carrying flies and pests, and enables safe and appropriate treatment and/or removal of human waste and wastewater in an environmentally sound manner.” A basic sanitation service is defined in the Strategic Framework for Water Services as: “The provision of a basic sanitation facility which is easily accessible to a household, the sustainable operation of the facility, including the safe removal of human waste and wastewater from the premises where this is appropriate and necessary, and the communication of good sanitation, hygiene and related practices.” The final choice of the type of service rests with the Water Services Authority (WSA). In order for the WSA to take such a decision they must ensure that it is practical as well as financially viable and sustainable. Several sanitation systems are widely applied in South Africa, but do not meet the basic level of service requirements. Bucket toilets and unimproved pit toilets are the most obvious, but problems have also been experienced with the operation and maintenance of other systems. Chemical toilets are prohibitively expensive for continuous use and should only be considered as a short-term and temporary measure (i.e. 3-5 months). Sol Plaatje municipality has adopted the following level of services for its different needs; this is for both formal and informal areas:
VIP toilets and other approved dry, on-site sanitation systems.
Septic tanks (usually used in areas not serviced with sewers but where full flush systems are installed, may also be an upgradeable option or as an option where the household takes some of the treatment responsibility from the municipal authority). Suitable for less densely populated areas with soil conditions that have good drainage properties.
Full water-borne sanitation (the household takes minimal responsibility for
treatment and disposal). Sanitation service levels need to be planned in conjunction with the availability of water resources and supply. Where flush systems are required, there must be
64
sufficient water available and the viability of the system must take the cost of supplying water into account. Electricity Service Electricity distribution (defined as electricity reticulation in the constitution) is a municipal function and supplied by the municipality, with Eskom’s distribution arm being a large scale service provider serving a large proportion of South Africa’s municipalities. The bulk supply up to the municipal boundary is not a municipal function but virtually the exclusive domain of Eskom. Costs for the total reticulation have been aggregated by service level and divided by the users served by a particular system hence the difference in cost of service. The level of service referred to here concerns the residential category that the municipality supplies. In terms of the Department of Energy (DoE) a basic provision of electricity that is subsidized is 20 AMP per household and in relation to Free Basic Electricity the proposed levels of service are 50kWh per household per month for a grid-based system for qualifying domestic consumers. Sol Plaatje municipality took a resolution to provide each new household with a 60 AMP grid connection. This decision was prompted by the fact that after developing low income areas households tent to upgrade their standard of living and therefore require a higher level of service which the municipality may not be ready to provide at the time, therefore to curb this the municipality provides a higher level of service to accommodate future upgrades. This approach may seem to be an expensive option but may also be cost effective in the long run. Roads Service Currently, there is not a national policy that defines a basic level of service for roads serving households in residential areas. However, the Municipal Infrastructure Investment Framework refers to "all-weather access to within 500 m of the dwelling". This could be interpreted as a „basic level of service‟. In urban areas, it is generally possible to improve upon this specification and to provide for access by a vehicle to each erf. In some rural areas, where there are very small, scattered settlements, it may not be feasible to provide all-weather access to within 500 m of every dwelling. Sol Plaatje municipality has adopted the following level of service options for its residential roads:
All-weather access to within 500 m of the dwelling Paved width (intermediate or full level of service) Hot premix or other black top surfaces Access to each erf with graded or gravel-paved road (basic) Access to each erf with a narrow paved road or a wider road with a
narrow paved width (intermediate or full level of service); and
65
Due to high rainfall leading to surface run-off; high traffic volumes, gravel roads are not preferred and instead paved roads are a preferable options when considering the mentioned issues. The adaptability and suitability of the proposed road surface to the stormwater drainage to be used is considered as it is a strong linkage that exists between roads and stormwater service options (in a similar manner that water and sanitation services are linked). i.e. some of these roads are constructed in such a way that they carry stormwater (serve a dual purpose). 2. 5. Relating Backlogs to Municipal Spending on Service Delivery Infrastructure The Sol Plaatje Municipal Council faces a unique challenge of capacity as well as ageing bulk infrastructure which is unable to provide to the needs of a growing city. The demand for growth in housing, commercial developments and other social and economic infrastructure has resulted in the city’s infrastructural capacity being overstretched. From the bulk infrastructure backlogs it is clear that current capacity is below the desired need. In addition due to age and lack of renewal (and inadequate maintenance) some of the reticulation infrastructure result in considerable losses e.g. 52% losses in water. The municipality undertook the identification of the most urgent infrastructure needs to unlock development and deal with maintenance issues. In support of this an infrastructure upgrade initiative was prioritized and the process of acquiring a DBSA loan commenced. This process is now at implementation stage whereby various infrastructure projects have been indentified and are underway. Amongst these projects the Non-Revenue Water Minimization (NRWM) study was initiated by both the Municipality and DBSA in an attempt to minimize the current water losses experienced. This project involves the analyzing of the water infrastructure to determine the extent of the losses in the network. The result of this study will yield recommended solutions towards minimizing water losses. Another highlight in the current initiatives is the successful completion of Homevale Wastewater Treatment Works (WWTW) Refurbishment project which was recently completed at a cost of over R60 million. The objective of this project was to restore the capacity of the plant which had dilapidated due to maintenance needs. The outcome of the project did not only achieve the refurbishment but has led to an increased additional capacity of 3Ml/day. With the increased capacity, the municipality could uplift the moratorium on development that was placed previously. It should be noted that other bulk infrastructure projects such as the extension of Homevale WWTW and Ritchie; the refurbishment of Beaconsfield plant have been prioritized for both financial year 2010-11 and 2011-12.
66
An application for the upgrading of the Notified Maximum Demand (NMD) from 120 MVA to 200 MVA was submitted to Eskom. This application will provide sufficient bulk electricity requirements but not mitigate the inherent risk of operating substations at maximum capacity. The present Notified Maximum Demand from Eskom is 120 MVA, but is limited to 112 MVA. Eskom has approved the municipal application for increased NMD (demand) from 120MVA to 140MVA. The infrastructure to be constructed will have a capacity of 200 MVA, this is in preparation for future needs. The Southridge Transformer was recently upgraded and is has been commissioned.
It is the intention of SPM to finance its capital needs through National Government Grant funding (e.g. MIG) and or loan financing or a combination thereof. As indicated previously Sol Plaatje Municipality made budgetary provision to service a long term capital loan of R262 million for the next MTREF period, part of the loan will be in a form of bridging finance from the MIG funding. An application for bridging MIG funds has been submitted to National Treasury. Grants Municipalities are responsible for planning municipal infrastructure and for using MIG to deliver the infrastructure. Sol Plaatje Municipality is one of the beneficiaries of such a grant and the funds are focused on addressing backlogs in water, sanitation, roads (including stormwater) and electricity (street lights). All projects identified by the municipality forms part of the IDP. Reporting relating to MIG issues confirms with DoRA requirements and MIG conditions. An amount of R34 494 000.00 was allocated at the beginning of the financial year. At year end 85% expenditure was reported as spent. The Sol Plaatje Municipality has planned and implemented projects ranging from; Street lights; Upgrading of Roads; Water and Sanitation bulk and reticulation infrastructure. The following projects were embarked on during 2010/11 Financial Year: PROJECT NAME Kimberley: Streetlights (Project 55) Homevale Wastewater Treatment Works (Project 243) Homevale Upgrading of Sewerage Works (Project 951) Galeshewe Bus and Taxi Routes (Project 107) Ritchie Wastewater Treatment Works (Project 244) The Promised Land Water Reticulation (Project 150) Beaconsfield: Upgrading of Wastewater Treatment Works ( Project 977)
The following deliverables were achieved under each project: PROJECT NAME PROJECT DELIVERABLES
67
PROJECT NAME PROJECT DELIVERABLES Kimberley: Streetlights (Project 72) National Code
Streetlights 14 and High Mast lights 1 were completed under this project.
Kimberley: Streetlights (Project 55)
Streetlights 21 and High Mast lights 1 were completed under this project.
Homevale Wastewater Treatment Works (Project 243)
The Rehabilitation of the Wastewater Treatment Works to its original operating capacity of 30Ml/Day. Out of this project an additional 3Ml/Day was achieved which resulted in the provisional uplift of the moratorium on development placed in 2008.
Homevale Upgrading of Sewerage Works (Project 951)
This project involves the extension of capacity at the Homevale WWTW. The professional planning and designs have now been completed. The tender process was being finalized at the end of the financial year. This project will continue into the new financial year.
Galeshewe bus and Taxi Routes (Project 107)
This involved the provision of roads to surfaced standards. At the end of the financial year the project was completed and 3,6km paved streets were achieved.
Ritchie Wastewater Treatment Works (Project 244)
The completed work for involved the planning and designs of the existing oxidation ponds in Ritchie in preparation for refurbishment and upgrading of the plant. At the end of the financial year the municipality had already called for tenders for the proposed work. A budget maintenance will be required for the continuation of the project. This project will continue into the new financial year.
The Promised Land Water Reticulation (Project 150)
This project entails the construction of a water reticulation network for the community of Promised Land. At the end on the financial year, planning and design was complete, the contractor had established site and ready to start with construction. This project will continue into the new financial year.
Beaconsfield: Upgrading of Wastewater Treatment Works (
The project involves the refurbishment of the Beaconsfield WWTW. Planning and Designs is
68
PROJECT NAME PROJECT DELIVERABLES Project 977) complete. Two contractors are on site since
April 2011 and the project will continue into the new financial year.
Though not a project the Project Management Unit set-up is financed from MIG funding this include equipment, personnel and other operational costs that are being incorporated to make the unit fully functional.
Despite the actual projects outputs, the following outcomes benefited the community of Sol Plaatje municipality through the MIG programme:
The refurbishment of bulk infrastructure led to the up-liftment of the moratorium on development, which resulted in development and possible economic growth within the city;
The community benefited from employment generated through Labour Intensive Methods of Construction which temporarily reduced the levels of poverty;
Reduction in crime through installation of high mast and street lights in some of the identified crime hot spots;
Improved access to residential and business areas through upgrading of streets
PROPOSED MIG MULTI-YEAR PLAN: 2011-2014
PROJECT NAME 2011/12 2012/13 2013/14 PMU R 1,378,000.00 R 1,466,914.00 R 1,547,595.00 Street lights (Projects 55 & 70) R 1,500,000.00 R 1,500,000.00 R0,00 Promise Land (700 erven-water) R 5,300 000.00 R0.00 R0.00 Promise Land (700 erven-water) R 0.00 R 2,000,000.00 R 10,000,000.00 Beaconsfield WWTW R 7,500,000.00 R0.00 R0.00 Ritchie WWTW R 15,250,000.00 R0.00 R0.00 Homevale WWTW R 14,435,000.00 R 18,090,000.00 R 34,832,220.00 Roads and Stormwater MIG Projects R0.00 R0.00 R 10,401,496.00 TOTAL R 45,363,000.00 R 23,057,000.00 R 56,781,716.00
2.6. Relevance to the Municipal IDP The rolling five-year Integrated Development Plan (IDP) contains key municipal plans and priorities for the current political term of office. Central to the
69
execution of the IDP is the need for economic growth and job creation as well as the need to maintain, upgrade and extend municipal infrastructure in order to facilitate much needed economic development. These considerations impact on all choices and decisions the SPM have to make. Marketing the city and attracting international and regional investment are also key elements in financing the execution of Sol Plaatje’s IDP. However, consistent underinvestment in the city’s existing and new productive infrastructure are threatening the foundations of the local economy as well as the provision of the agreed to level of service is a huge challenge to the financial sustainability of the Municipality. Sol Plaatje is further located within a weak economic region1 which, in considering the above challenges, had to creatively develop a strategy to ensure a long term sustainable development path. This strategy is founded in the Municipality’s “space-economy” - meaning the geographic distribution of settlements (large and small), the activities within them (residential, commercial, institutional, recreational, and so on), and the relationship of these settlements and activities to the infrastructure that connects and supports them, and links in turn to surrounding agriculture and nature areas. Related to maintaining and strengthening critical connections both physical and non-physical to the Municipality is managing Kimberley and existing outlying settlements as sustainable, attractive centres of living, services and work. Kimberley will not prosper without critical connections in a broader settlement pattern, and it cannot hope to maintain or strengthen these connections unless it is maintained as a place worth living and working in. This aspect has a number of dimensions. The first relates to service infrastructure, the basis for activity of all kinds in the city. Bulk infrastructure refurbishment, extension and maintenance have been under severe stress in the Municipality for a number of years, limiting opportunity for new investment and the viability of existing places of living, services and work. Creative partnerships will be required to plan, fund and implement the necessary work. 2.7 Approval of Land Use Change and Building Plans 2010/11 During this financial year the Sol Plaatje Municipality’s Land Use Management System was put in place in line with the Spatial Development Framework to enhance the spatial development of the municipal area. Approval of Land Use Change Applications In terms of legislation (Northern Cape Planning and Development Act, No. 7 of 1998), an application for the amendment of the zoning scheme should take approximately forty weeks on average. The moratorium on new developments 1 Frances Baard Growth and Development Strategy – December 2007
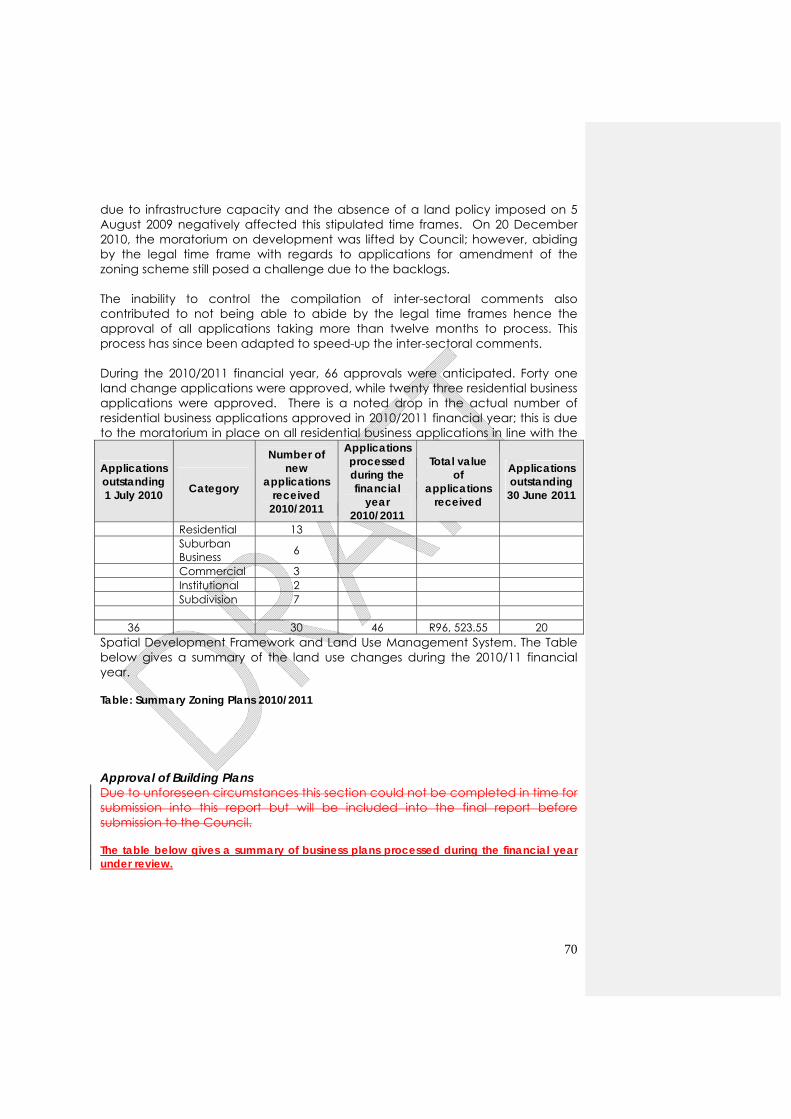
70
due to infrastructure capacity and the absence of a land policy imposed on 5 August 2009 negatively affected this stipulated time frames. On 20 December 2010, the moratorium on development was lifted by Council; however, abiding by the legal time frame with regards to applications for amendment of the zoning scheme still posed a challenge due to the backlogs. The inability to control the compilation of inter-sectoral comments also contributed to not being able to abide by the legal time frames hence the approval of all applications taking more than twelve months to process. This process has since been adapted to speed-up the inter-sectoral comments. During the 2010/2011 financial year, 66 approvals were anticipated. Forty one land change applications were approved, while twenty three residential business applications were approved. There is a noted drop in the actual number of residential business applications approved in 2010/2011 financial year; this is due to the moratorium in place on all residential business applications in line with the
Spatial Development Framework and Land Use Management System. The Table below gives a summary of the land use changes during the 2010/11 financial year. Table: Summary Zoning Plans 2010/2011
Approval of Building Plans Due to unforeseen circumstances this section could not be completed in time for submission into this report but will be included into the final report before submission to the Council. The table below gives a summary of business plans processed during the financial year under review.
Applications outstanding 1 July 2010
Category
Number of new
applications received
2010/2011
Applications processed during the financial
year 2010/2011
Total value of
applications received
Applications outstanding 30 June 2011
Residential 13
Suburban Business 6
Commercial 3 Institutional 2 Subdivision 7
36 30 46 R96, 523.55 20

71
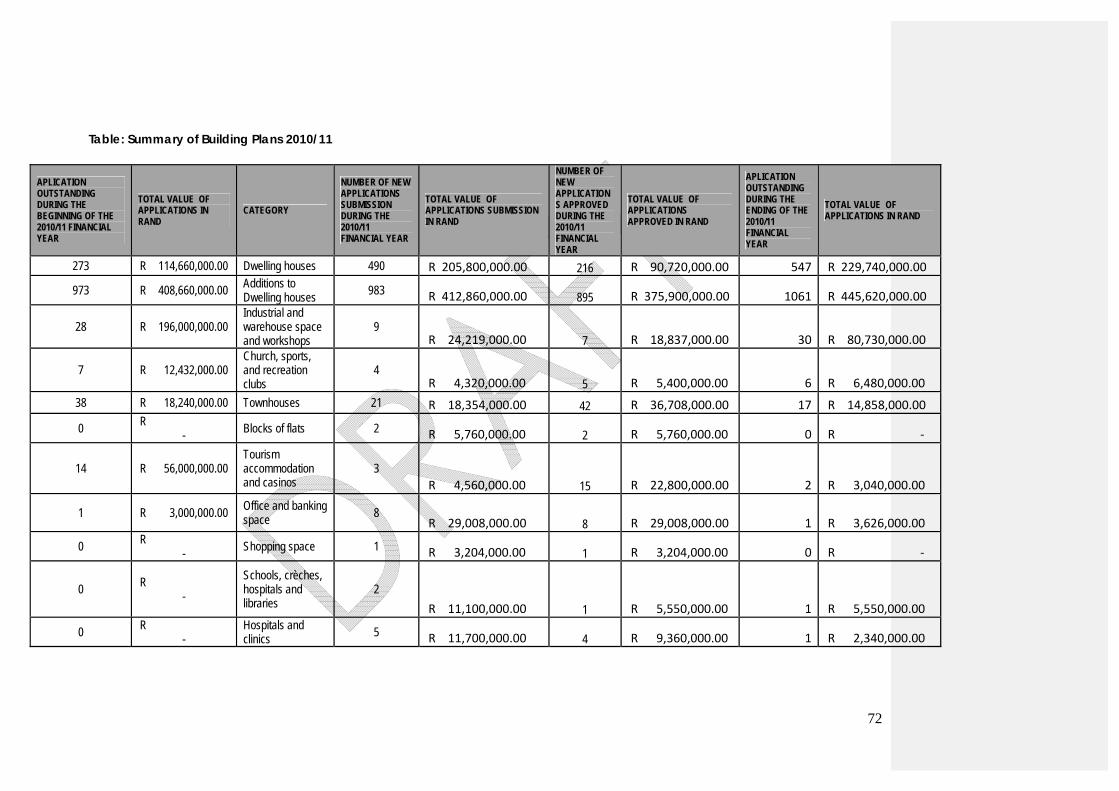
72
Table: Summary of Building Plans 2010/11
APLICATION OUTSTANDING DURING THE BEGINNING OF THE 2010/11 FINANCIAL YEAR
TOTAL VALUE OF APPLICATIONS IN RAND
CATEGORY
NUMBER OF NEW APPLICATIONS SUBMISSION DURING THE 2010/11 FINANCIAL YEAR
TOTAL VALUE OF APPLICATIONS SUBMISSION IN RAND
NUMBER OF NEW APPLICATIONS APPROVED DURING THE 2010/11 FINANCIAL YEAR
TOTAL VALUE OF APPLICATIONS APPROVED IN RAND
APLICATION OUTSTANDING DURING THE ENDING OF THE 2010/11 FINANCIAL YEAR
TOTAL VALUE OF APPLICATIONS IN RAND
273 R 114,660,000.00 Dwelling houses 490 R 205,800,000.00 216 R 90,720,000.00 547 R 229,740,000.00
973 R 408,660,000.00 Additions to Dwelling houses
983 R 412,860,000.00 895 R 375,900,000.00 1061 R 445,620,000.00
28 R 196,000,000.00 Industrial and warehouse space and workshops
9 R 24,219,000.00 7 R 18,837,000.00 30 R 80,730,000.00
7 R 12,432,000.00 Church, sports, and recreation clubs
4 R 4,320,000.00 5 R 5,400,000.00 6 R 6,480,000.00
38 R 18,240,000.00 Townhouses 21 R 18,354,000.00 42 R 36,708,000.00 17 R 14,858,000.00
0 R
- Blocks of flats 2 R 5,760,000.00 2 R 5,760,000.00 0 R ‐
14 R 56,000,000.00 Tourism accommodation and casinos
3 R 4,560,000.00 15 R 22,800,000.00 2 R 3,040,000.00
1 R 3,000,000.00 Office and banking space 8
R 29,008,000.00 8 R 29,008,000.00 1 R 3,626,000.00
0 R -
Shopping space 1 R 3,204,000.00 1 R 3,204,000.00 0 R ‐
0 R -
Schools, crèches, hospitals and libraries
2
R 11,100,000.00 1 R 5,550,000.00 1 R 5,550,000.00
0 R -
Hospitals and clinics 5 R 11,700,000.00 4 R 9,360,000.00 1 R 2,340,000.00
73
CHAPTER 3 - HUMAN RESOURCE AND OTHER ORGANISATIONAL MANAGEMENT
3.1 General Information Following a number of successive audit qualifications and queries, the Council and Executive Management Team of Sol Plaatje Municipality decided in March 2010 to commence with a multi-disciplinary assignment called Operation Clean Audit Report (OPCAR) aimed at achieving a clean audit in respect of all financial and institutional aspects raised in successive audit reports. Specialists in organisational development and human resources were contracted to assist the municipality in this endeavor. In October 2010 a first report on the results of the institutional interventions (OPCAR Phase 1) was released and included issues such as:
• An assessment of Gaps and a Revised Human Resource Policies and Procedures Handbook;
• The reconciliation of the payroll with the staff establishment and initial verification of contract workers (April May, June 2010 payroll);
• An assessment of the effectiveness of the Local Labour Forum, including recommendations for improvement;
• The micro organizational Structure and • A Human Resource Strategy Report
During November 2010 the OPCAR (institutional) activities were followed up, for example; with the following reports, namely:
• A detailed verification of contract workers, including extensive consultations with management, staff and unions and
• The confirmation of the current “as is” organogramme and collating of inputs pertaining to the “to be” operational/micro structure
These specialists worked in close collaboration with the Director Corporate Services, senior Human Resource officials and consulted representatives from all directorates as well as trade unions over several months to verify the list of contract workers and produce an up to date as-is organogramme for the municipality. This work is ongoing and will see an institutional transformation that can address the challenges facing the municipality in achieving its constitutional mandate.
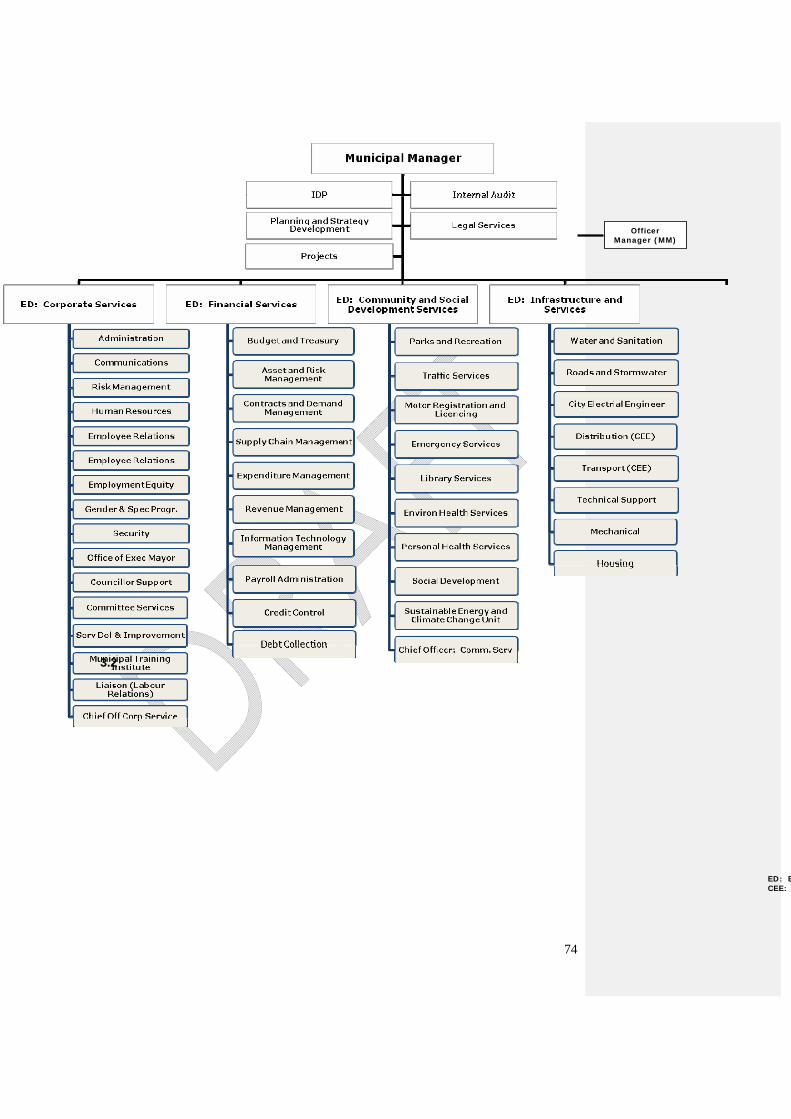
74
3.2
Officer Manager (MM)
ED: ECEE:
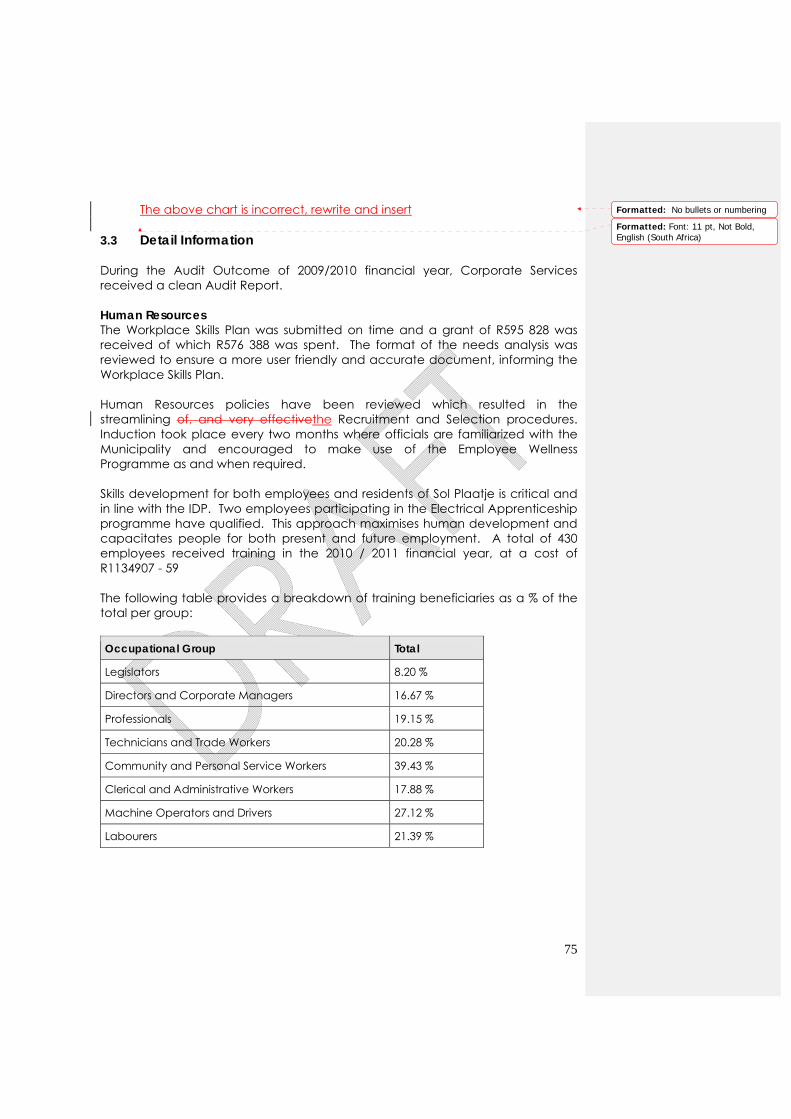
75
The above chart is incorrect, rewrite and insert 3.3 Detail Information During the Audit Outcome of 2009/2010 financial year, Corporate Services received a clean Audit Report. Human Resources The Workplace Skills Plan was submitted on time and a grant of R595 828 was received of which R576 388 was spent. The format of the needs analysis was reviewed to ensure a more user friendly and accurate document, informing the Workplace Skills Plan. Human Resources policies have been reviewed which resulted in the streamlining of, and very effectivethe Recruitment and Selection procedures. Induction took place every two months where officials are familiarized with the Municipality and encouraged to make use of the Employee Wellness Programme as and when required. Skills development for both employees and residents of Sol Plaatje is critical and in line with the IDP. Two employees participating in the Electrical Apprenticeship programme have qualified. This approach maximises human development and capacitates people for both present and future employment. A total of 430 employees received training in the 2010 / 2011 financial year, at a cost of R1134907 - 59 The following table provides a breakdown of training beneficiaries as a % of the total per group: Occupational Group Total
Legislators 8.20 %
Directors and Corporate Managers 16.67 %
Professionals 19.15 %
Technicians and Trade Workers 20.28 %
Community and Personal Service Workers 39.43 %
Clerical and Administrative Workers 17.88 %
Machine Operators and Drivers 27.12 %
Labourers 21.39 %
Formatted: No bullets or numbering
Formatted: Font: 11 pt, Not Bold,English (South Africa)
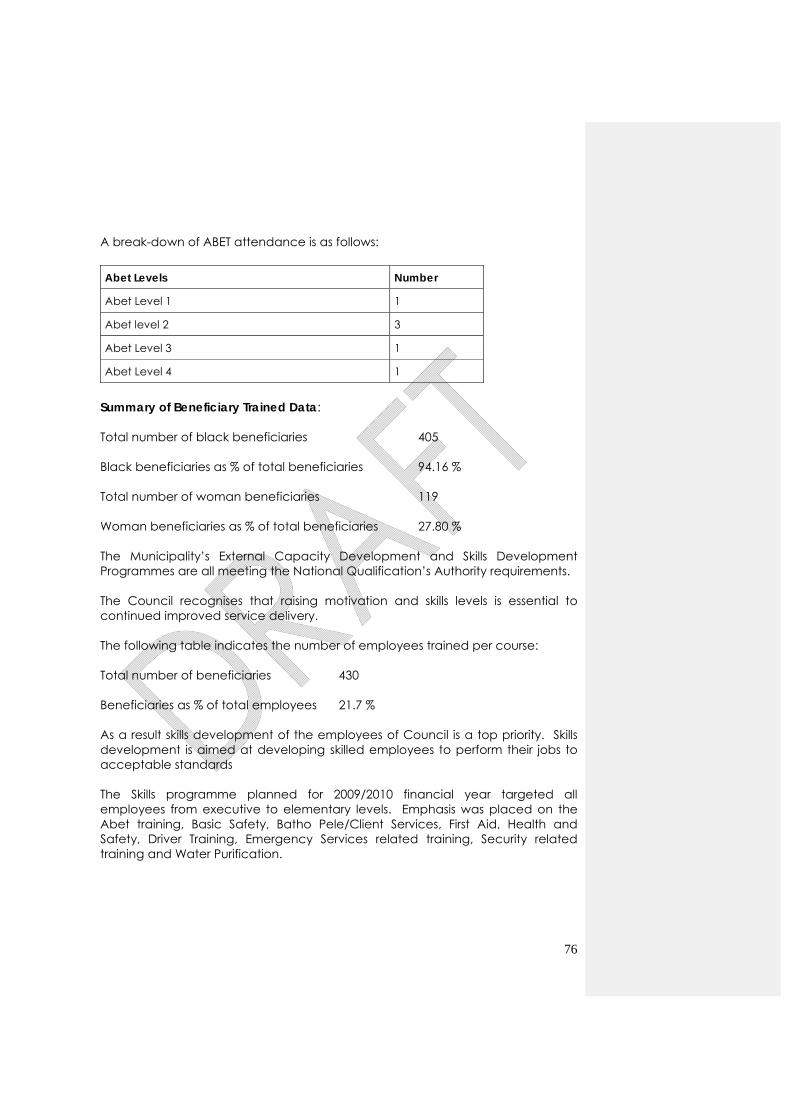
76
A break-down of ABET attendance is as follows: Abet Levels Number
Abet Level 1 1
Abet level 2 3
Abet Level 3 1
Abet Level 4 1
Summary of Beneficiary Trained Data: Total number of black beneficiaries 405 Black beneficiaries as % of total beneficiaries 94.16 % Total number of woman beneficiaries 119 Woman beneficiaries as % of total beneficiaries 27.80 % The Municipality’s External Capacity Development and Skills Development Programmes are all meeting the National Qualification’s Authority requirements. The Council recognises that raising motivation and skills levels is essential to continued improved service delivery. The following table indicates the number of employees trained per course: Total number of beneficiaries 430 Beneficiaries as % of total employees 21.7 % As a result skills development of the employees of Council is a top priority. Skills development is aimed at developing skilled employees to perform their jobs to acceptable standards The Skills programme planned for 2009/2010 financial year targeted all employees from executive to elementary levels. Emphasis was placed on the Abet training, Basic Safety, Batho Pele/Client Services, First Aid, Health and Safety, Driver Training, Emergency Services related training, Security related training and Water Purification.
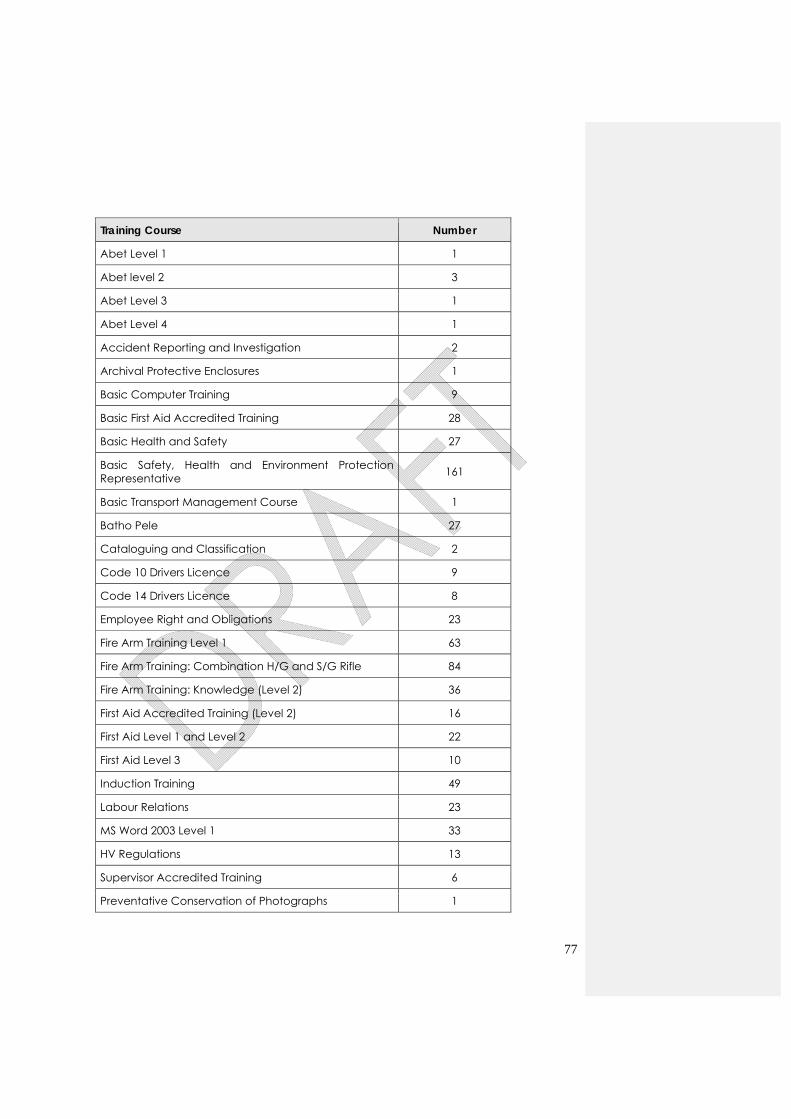
77
Training Course Number
Abet Level 1 1
Abet level 2 3
Abet Level 3 1
Abet Level 4 1
Accident Reporting and Investigation 2
Archival Protective Enclosures 1
Basic Computer Training 9
Basic First Aid Accredited Training 28
Basic Health and Safety 27
Basic Safety, Health and Environment Protection Representative 161
Basic Transport Management Course 1
Batho Pele 27
Cataloguing and Classification 2
Code 10 Drivers Licence 9
Code 14 Drivers Licence 8
Employee Right and Obligations 23
Fire Arm Training Level 1 63
Fire Arm Training: Combination H/G and S/G Rifle 84
Fire Arm Training: Knowledge (Level 2) 36
First Aid Accredited Training (Level 2) 16
First Aid Level 1 and Level 2 22
First Aid Level 3 10
Induction Training 49
Labour Relations 23
MS Word 2003 Level 1 33
HV Regulations 13
Supervisor Accredited Training 6
Preventative Conservation of Photographs 1
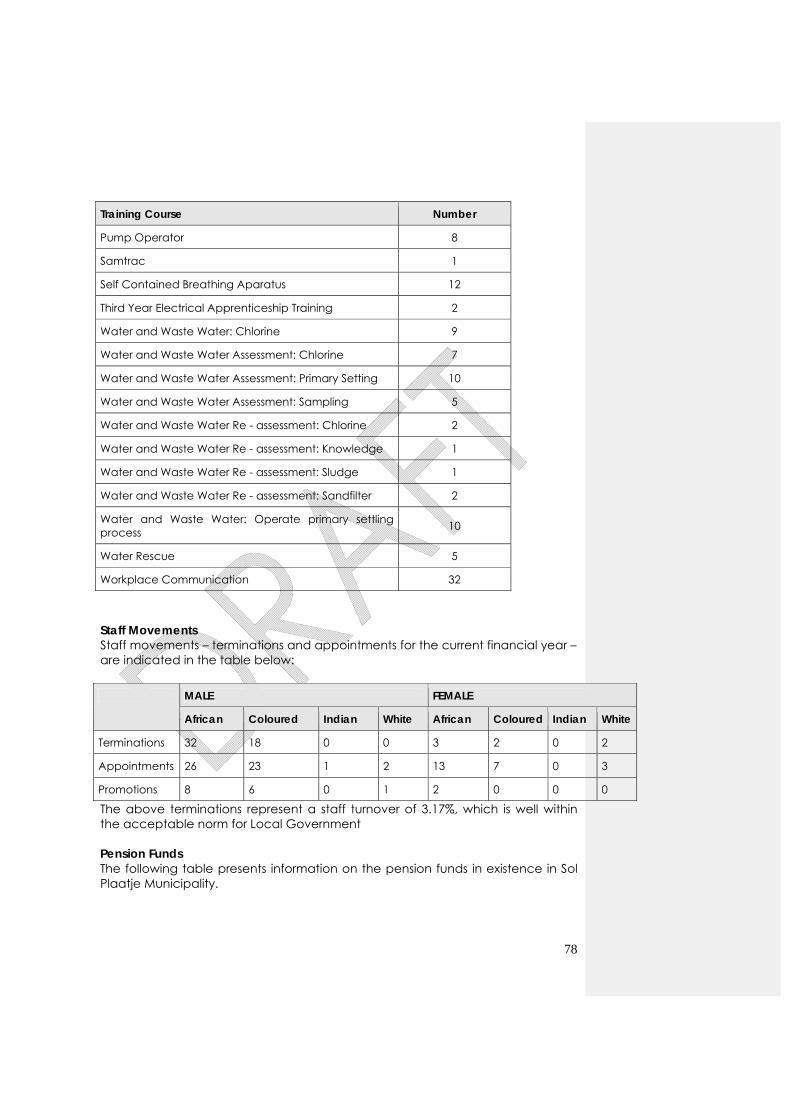
78
Training Course Number
Pump Operator 8
Samtrac 1
Self Contained Breathing Aparatus 12
Third Year Electrical Apprenticeship Training 2
Water and Waste Water: Chlorine 9
Water and Waste Water Assessment: Chlorine 7
Water and Waste Water Assessment: Primary Setting 10
Water and Waste Water Assessment: Sampling 5
Water and Waste Water Re - assessment: Chlorine 2
Water and Waste Water Re - assessment: Knowledge 1
Water and Waste Water Re - assessment: Sludge 1
Water and Waste Water Re - assessment: Sandfilter 2
Water and Waste Water: Operate primary settling process 10
Water Rescue 5
Workplace Communication 32
Staff Movements Staff movements – terminations and appointments for the current financial year – are indicated in the table below: MALE FEMALE
African Coloured Indian White African Coloured Indian White
Terminations 32 18 0 0 3 2 0 2
Appointments 26 23 1 2 13 7 0 3
Promotions 8 6 0 1 2 0 0 0
The above terminations represent a staff turnover of 3.17%, which is well within the acceptable norm for Local Government Pension Funds The following table presents information on the pension funds in existence in Sol Plaatje Municipality.
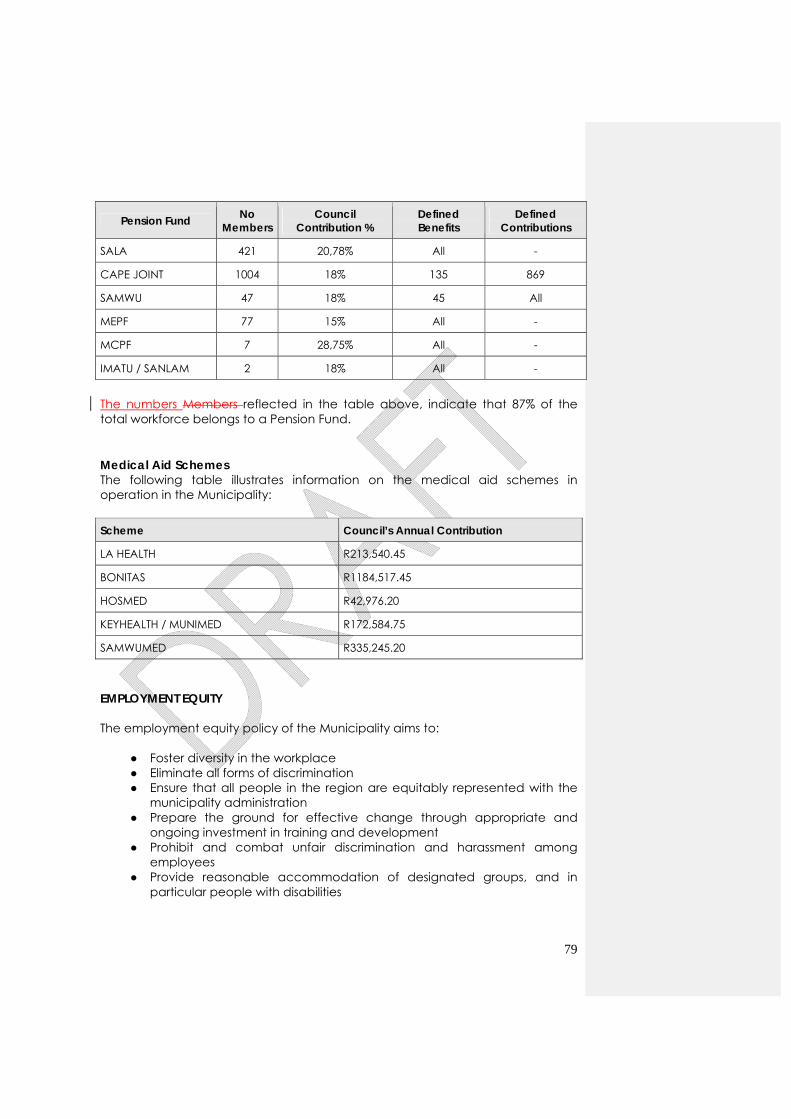
79
Pension Fund No Members
Council Contribution %
Defined Benefits
Defined Contributions
SALA 421 20,78% All -
CAPE JOINT 1004 18% 135 869
SAMWU 47 18% 45 All
MEPF 77 15% All -
MCPF 7 28,75% All -
IMATU / SANLAM 2 18% All -
The numbers Members reflected in the table above, indicate that 87% of the total workforce belongs to a Pension Fund. Medical Aid Schemes The following table illustrates information on the medical aid schemes in operation in the Municipality: Scheme Council’s Annual Contribution
LA HEALTH R213,540.45
BONITAS R1184,517.45
HOSMED R42,976.20
KEYHEALTH / MUNIMED R172,584.75
SAMWUMED R335,245.20
EMPLOYMENT EQUITY The employment equity policy of the Municipality aims to:
● Foster diversity in the workplace ● Eliminate all forms of discrimination ● Ensure that all people in the region are equitably represented with the
municipality administration ● Prepare the ground for effective change through appropriate and
ongoing investment in training and development ● Prohibit and combat unfair discrimination and harassment among
employees ● Provide reasonable accommodation of designated groups, and in
particular people with disabilities
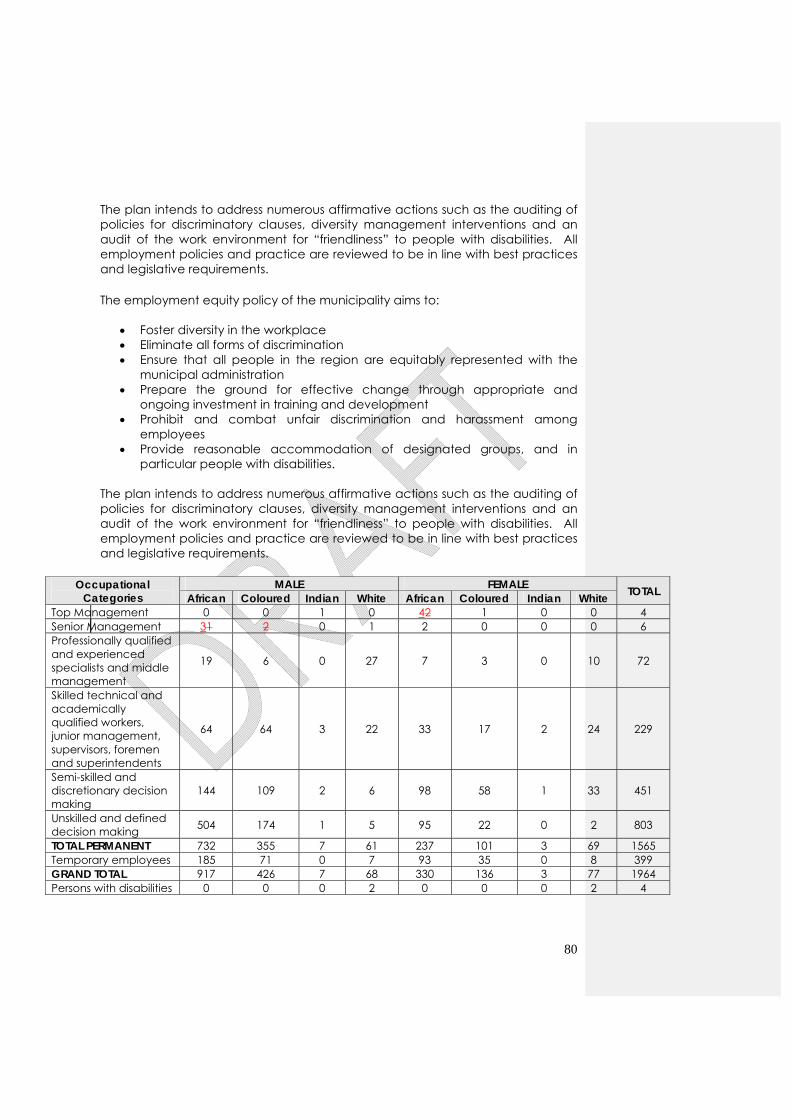
80
The plan intends to address numerous affirmative actions such as the auditing of policies for discriminatory clauses, diversity management interventions and an audit of the work environment for “friendliness” to people with disabilities. All employment policies and practice are reviewed to be in line with best practices and legislative requirements. The employment equity policy of the municipality aims to:
Foster diversity in the workplace Eliminate all forms of discrimination Ensure that all people in the region are equitably represented with the
municipal administration Prepare the ground for effective change through appropriate and
ongoing investment in training and development Prohibit and combat unfair discrimination and harassment among
employees Provide reasonable accommodation of designated groups, and in
particular people with disabilities. The plan intends to address numerous affirmative actions such as the auditing of policies for discriminatory clauses, diversity management interventions and an audit of the work environment for “friendliness” to people with disabilities. All employment policies and practice are reviewed to be in line with best practices and legislative requirements.
Occupational Categories
MALE FEMALE TOTAL African Coloured Indian White African Coloured Indian White Top Management 0 0 1 0 42 1 0 0 4 Senior Management 31 2 0 1 2 0 0 0 6 Professionally qualified and experienced specialists and middle management
19 6 0 27 7 3 0 10 72
Skilled technical and academically qualified workers, junior management, supervisors, foremen and superintendents
64 64 3 22 33 17 2 24 229
Semi-skilled and discretionary decision making
144 109 2 6 98 58 1 33 451
Unskilled and defined decision making 504 174 1 5 95 22 0 2 803
TOTAL PERMANENT 732 355 7 61 237 101 3 69 1565 Temporary employees 185 71 0 7 93 35 0 8 399 GRAND TOTAL 917 426 7 68 330 136 3 77 1964 Persons with disabilities 0 0 0 2 0 0 0 2 4
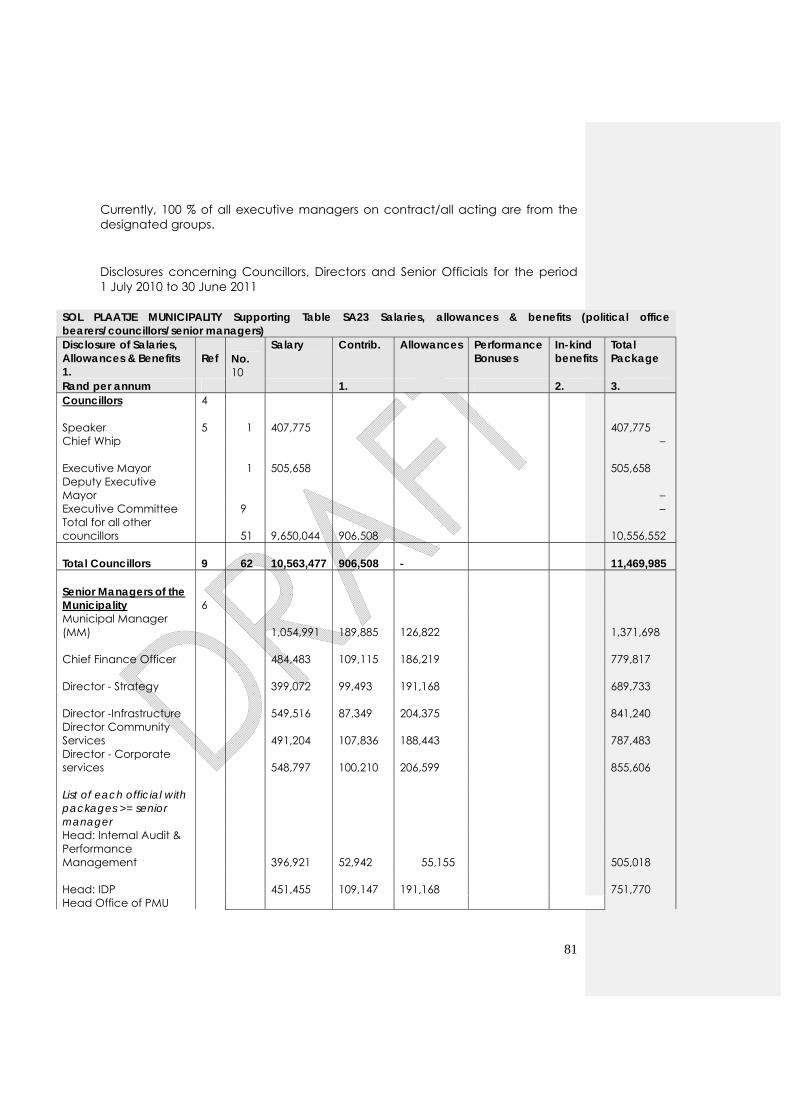
81
Currently, 100 % of all executive managers on contract/all acting are from the designated groups. Disclosures concerning Councillors, Directors and Senior Officials for the period 1 July 2010 to 30 June 2011
SOL PLAATJE MUNICIPALITY Supporting Table SA23 Salaries, allowances & benefits (political office bearers/councillors/senior managers) Disclosure of Salaries, Allowances & Benefits 1.
Ref No. 10
Salary Contrib. Allowances Performance Bonuses
In-kind benefits
Total Package
Rand per annum 1. 2. 3. Councillors 4
Speaker 5 1 407,775
407,775
Chief Whip –
Executive Mayor 1 505,658
505,658
Deputy Executive Mayor – Executive Committee 9 – Total for all other councillors 51
9,650,044
906,508
10,556,552
Total Councillors 9 62 10,563,477
906,508 -
11,469,985
Senior Managers of the Municipality 6 Municipal Manager (MM)
1,054,991
189,885
126,822
1,371,698
Chief Finance Officer 484,483
109,115
186,219
779,817
Director - Strategy 399,072
99,493
191,168
689,733
Director -Infrastructure 549,516
87,349
204,375
841,240
Director Community Services
491,204
107,836
188,443
787,483
Director - Corporate services
548,797
100,210
206,599
855,606
List of each official with packages >= senior manager Head: Internal Audit & Performance Management
396,921
52,942 55,155
505,018
Head: IDP 451,455
109,147
191,168
751,770
Head Office of PMU
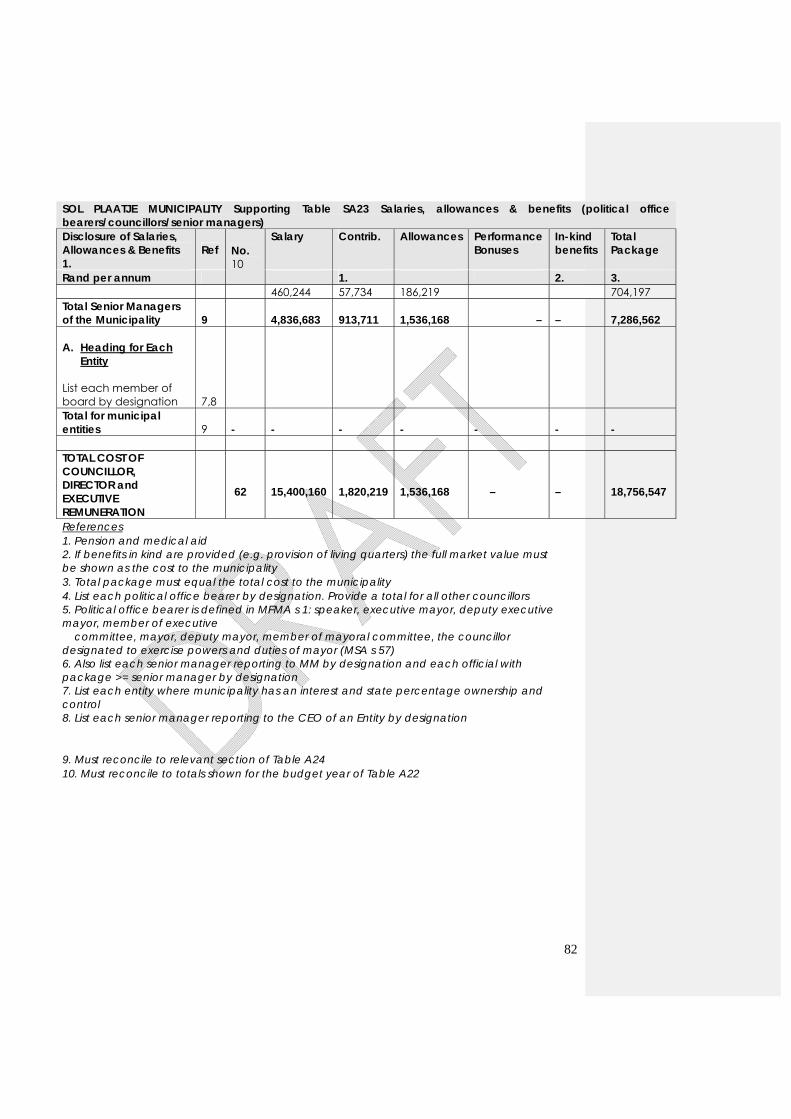
82
SOL PLAATJE MUNICIPALITY Supporting Table SA23 Salaries, allowances & benefits (political office bearers/councillors/senior managers) Disclosure of Salaries, Allowances & Benefits 1.
Ref No. 10
Salary Contrib. Allowances Performance Bonuses
In-kind benefits
Total Package
Rand per annum 1. 2. 3. 460,244 57,734 186,219 704,197
Total Senior Managers of the Municipality 9
4,836,683
913,711
1,536,168 –
–
7,286,562
A. Heading for Each
Entity List each member of board by designation 7,8 Total for municipal entities 9 - - - - - - - TOTAL COST OF COUNCILLOR, DIRECTOR and EXECUTIVE REMUNERATION
62
15,400,160
1,820,219
1,536,168
–
–
18,756,547
References 1. Pension and medical aid 2. If benefits in kind are provided (e.g. provision of living quarters) the full market value must be shown as the cost to the municipality 3. Total package must equal the total cost to the municipality 4. List each political office bearer by designation. Provide a total for all other councillors 5. Political office bearer is defined in MFMA s 1: speaker, executive mayor, deputy executive mayor, member of executive committee, mayor, deputy mayor, member of mayoral committee, the councillor designated to exercise powers and duties of mayor (MSA s 57) 6. Also list each senior manager reporting to MM by designation and each official with package >= senior manager by designation 7. List each entity where municipality has an interest and state percentage ownership and control 8. List each senior manager reporting to the CEO of an Entity by designation 9. Must reconcile to relevant section of Table A24 10. Must reconcile to totals shown for the budget year of Table A22
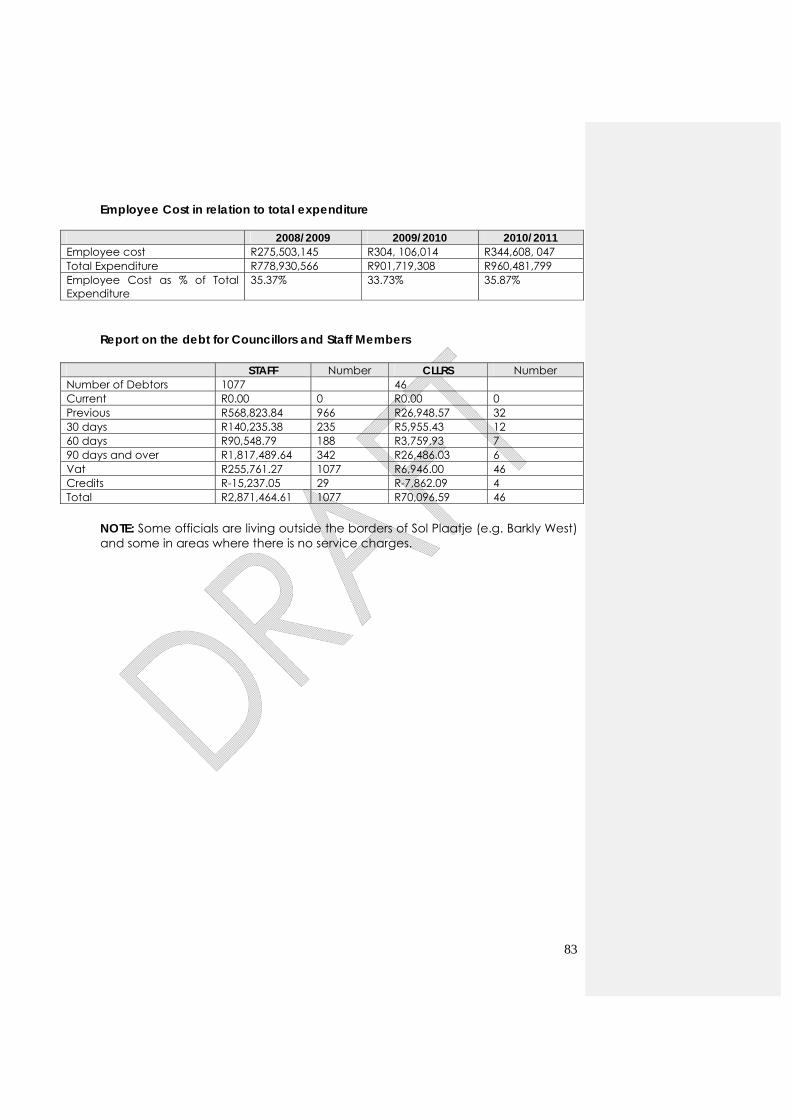
83
Employee Cost in relation to total expenditure
2008/2009 2009/2010 2010/2011 Employee cost R275,503,145 R304, 106,014 R344,608, 047 Total Expenditure R778,930,566 R901,719,308 R960,481,799 Employee Cost as % of Total Expenditure
35.37% 33.73% 35.87%
Report on the debt for Councillors and Staff Members
STAFF Number CLLRS Number Number of Debtors 1077 46 Current R0.00 0 R0.00 0 Previous R568,823.84 966 R26,948.57 32 30 days R140,235.38 235 R5,955.43 12 60 days R90,548.79 188 R3,759.93 7 90 days and over R1,817,489.64 342 R26,486.03 6 Vat R255,761.27 1077 R6,946.00 46 Credits R-15,237.05 29 R-7,862.09 4 Total R2,871,464.61 1077 R70,096.59 46
NOTE: Some officials are living outside the borders of Sol Plaatje (e.g. Barkly West) and some in areas where there is no service charges.
84
CHAPTER 4 - AUDITED STATEMENTS AND RELATED FINANCIAL INFORMATION
4.1. General Overview The 2010/2011 financial year was full of challenges especially in local government as was where we have seen in various towns and cities in the country, communities protesting for service delivery. Service delivery is at the core of local government but without adequate finances, the municipality seats with the difficulty of being unable to meet community expectations. Sol Plaatje Local Municipality finds itself in the same position as any other local municipalityies where the demand for services is high, and the payment levels for services rendered is at all time low levels. If one had to dissect the community of Sol Plaatje Local Municipality in terms of sectors, government and services sector are the majoronly two sectors that offer employment, as such employment opportunities are very scarce for unskilled labor. This statement supported by the extent of growth of the indigent households, thus requiring more funding from the municipality government fiscus. The mining sector in the Sol Plaatje Local Municipal area has been downsizing its operations since the global economic recession and though markets are slowly recovering, the mining giant is also hit by the depleted natural resources, thus contributing tremendously to unemployment and job losses. On the other hand, as people lose jobs and those new in the job market cannot secure or find employment, the demand for municipal services is increasing, whilst the payment levels are steadily decreasing. The number of indigent household is increasing exponentially year on year and government subsidies will in future not be sufficient to subsidies citizens who cannot afford municipal services. The other observation in the economy of Sol Plaatje Local Municipality is the fact that young pupils study outside the city, in other provinces to obtain post Matric qualification and after they graduate, do not return to seek employment within the city, thus leaving the elderly behind who will have to take care of everything including the municipal account. With the policy of free for all water, the threat to revenue enhancement cannot be left unnoticed which is something worth reviewing by council and administration. All of these and other observations have led to rather an average performance of the municipality for the period.
85
4.2. FINANCIAL PERFORMANCE Sol Plaatje Local Municipality has been working hard during the past years and has strived with evident improvements on general compliance with legislation. The municipalityWe are is finally getting the basics right. However, supply chain management remains a management concern. We are working hard to capacitate the division with skills and expertise. Continuous research is being done on valuable lessons that can be learnt from case law, continuous interaction with provincial treasury and regular meetings with various committees responsible for the implementation of this policy and related legislation and practice notes. Like all other business and government entities, Sol Plaatje Local Municipality is subjected to credit rating. Over the last four (4) years, our credit rating has been stable at A3.za, which is not the best but SPMwe are is one of the few municipalities that maintained their credit rating despite the credit crunch and high job losses that pose a huge risk in the cash flow position and increased debtors balances in arrears. The municipalityWe spent lot of time on internal controls to ensure that management is assured of compliance and ideal way of executing responsibilities within the financial services directorate and the results of these efforts will bear fruits in the short to medium term. Performance management is implemented and will soon become the order of the day. This will enable management to monitor the outputs and outcomes as agreed upon with staff at the beginning of the period. 4.3. HIGH LEVEL SUMMARY OF PERFOMANCE PER SECTOR Financial Services directorate is responsible for the following areas - Financial administration - Revenue management - Expenditure management - Supply chain management and contracts administration - Budget and treasury office - Assets management - Information communication technology
4.3.1 FINANCIAL ADMINISTRATION This section of financial management is responsible for providing management guidance and direction on issues of financial management, planning process and the work of staff, management of outcomes and outputs, ensuring general compliance with accounting framework and local government legislation and advice the municipal manager, senior managers and executive mayor on financial management and reporting issues. We facilitate the process of policy review, public participation processes and adoption of policies and budget.
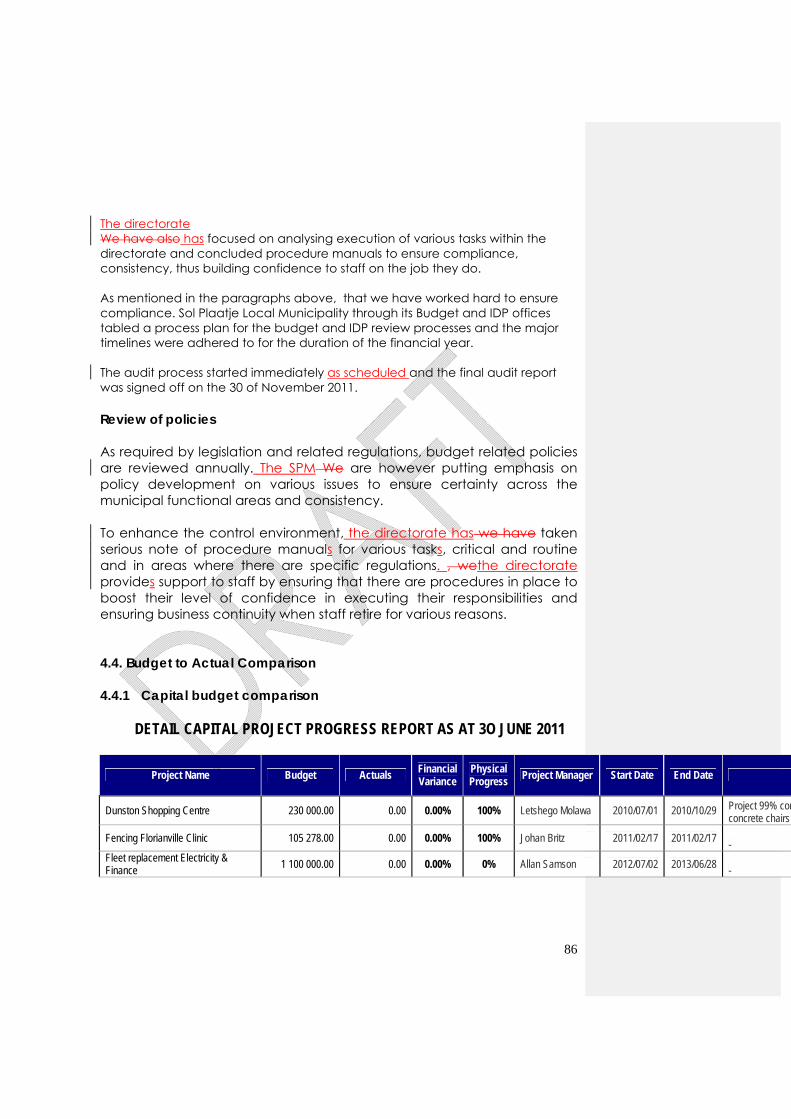
86
The directorate We have also has focused on analysing execution of various tasks within the directorate and concluded procedure manuals to ensure compliance, consistency, thus building confidence to staff on the job they do. As mentioned in the paragraphs above, that we have worked hard to ensure compliance. Sol Plaatje Local Municipality through its Budget and IDP offices tabled a process plan for the budget and IDP review processes and the major timelines were adhered to for the duration of the financial year. The audit process started immediately as scheduled and the final audit report was signed off on the 30 of November 2011. Review of policies As required by legislation and related regulations, budget related policies are reviewed annually. The SPM We are however putting emphasis on policy development on various issues to ensure certainty across the municipal functional areas and consistency. To enhance the control environment, the directorate has we have taken serious note of procedure manuals for various tasks, critical and routine and in areas where there are specific regulations. , wethe directorate provides support to staff by ensuring that there are procedures in place to boost their level of confidence in executing their responsibilities and ensuring business continuity when staff retire for various reasons. 4.4. Budget to Actual Comparison 4.4.1 Capital budget comparison
DETAIL CAPITAL PROJECT PROGRESS REPORT AS AT 3O JUNE 2011
Project Name Budget Actuals Financial Variance
Physical Progress
Project Manager Start Date End Date
Dunston Shopping Centre 230 000.00 0.00 0.00% 100% Letshego Molawa 2010/07/01 2010/10/29 Project 99% comconcrete chairs
Fencing Florianville Clinic 105 278.00 0.00 0.00% 100% Johan Britz 2011/02/17 2011/02/17 -
Fleet replacement Electricity & Finance 1 100 000.00 0.00 0.00% 0% Allan Samson 2012/07/02 2013/06/28 -
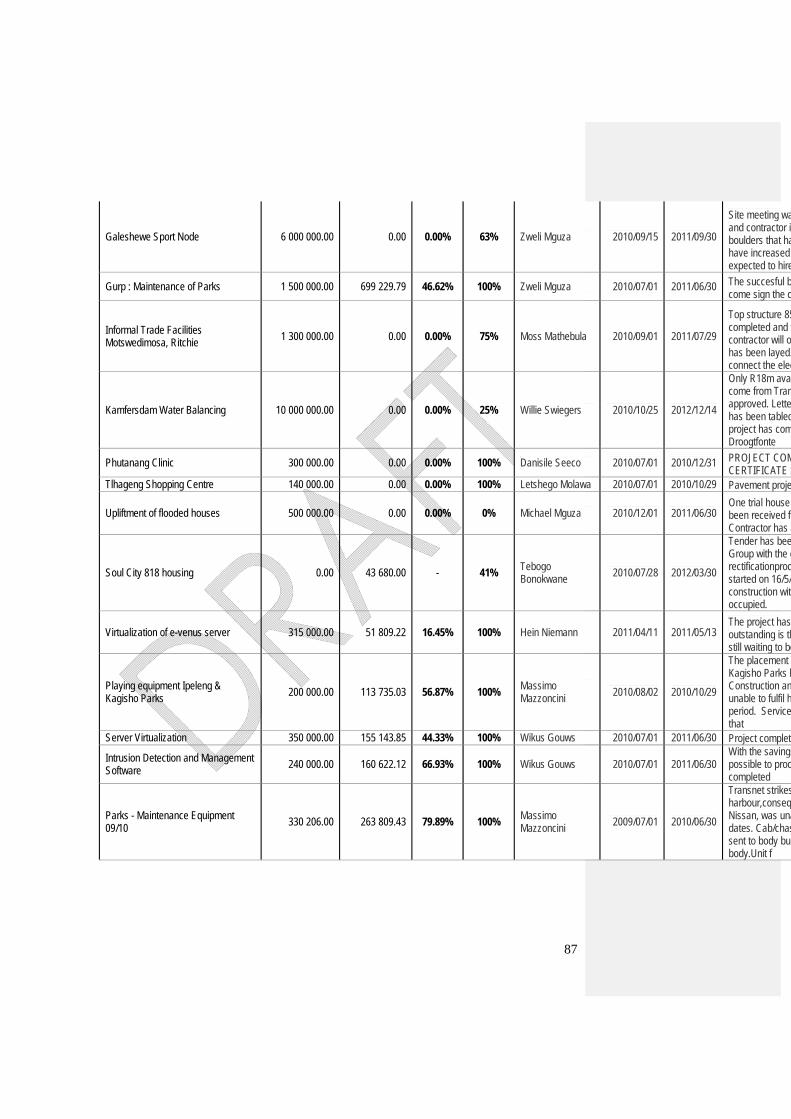
87
Galeshewe Sport Node 6 000 000.00 0.00 0.00% 63% Zweli Mguza 2010/09/15 2011/09/30
Site meeting waand contractor isboulders that hahave increased expected to hire
Gurp : Maintenance of Parks 1 500 000.00 699 229.79 46.62% 100% Zweli Mguza 2010/07/01 2011/06/30 The succesful bcome sign the c
Informal Trade Facilities Motswedimosa, Ritchie 1 300 000.00 0.00 0.00% 75% Moss Mathebula 2010/09/01 2011/07/29
Top structure 85completed and tcontractor will ohas been layed.connect the elec
Kamfersdam Water Balancing 10 000 000.00 0.00 0.00% 25% Willie Swiegers 2010/10/25 2012/12/14
Only R18m avacome from Tranapproved. Lettehas been tabledproject has comDroogtfonte
Phutanang Clinic 300 000.00 0.00 0.00% 100% Danisile Seeco 2010/07/01 2010/12/31 PROJECT COMCERTIFICATE S
Tlhageng Shopping Centre 140 000.00 0.00 0.00% 100% Letshego Molawa 2010/07/01 2010/10/29 Pavement proje
Upliftment of flooded houses 500 000.00 0.00 0.00% 0% Michael Mguza 2010/12/01 2011/06/30 One trial house been received foContractor has a
Soul City 818 housing 0.00 43 680.00 - 41% Tebogo Bonokwane
2010/07/28 2012/03/30
Tender has beeGroup with the drectificationprocstarted on 16/5/construction witoccupied.
Virtualization of e-venus server 315 000.00 51 809.22 16.45% 100% Hein Niemann 2011/04/11 2011/05/13 The project has outstanding is thstill waiting to be
Playing equipment Ipeleng & Kagisho Parks 200 000.00 113 735.03 56.87% 100%
Massimo Mazzoncini 2010/08/02 2010/10/29
The placement oKagisho Parks hConstruction anunable to fulfil hperiod. Service that
Server Virtualization 350 000.00 155 143.85 44.33% 100% Wikus Gouws 2010/07/01 2011/06/30 Project complete
Intrusion Detection and Management Software
240 000.00 160 622.12 66.93% 100% Wikus Gouws 2010/07/01 2011/06/30 With the savingspossible to proccompleted
Parks - Maintenance Equipment 09/10
330 206.00 263 809.43 79.89% 100% Massimo Mazzoncini
2009/07/01 2010/06/30
Transnet strikesharbour,conseqNissan, was unadates. Cab/chassent to body buibody.Unit f
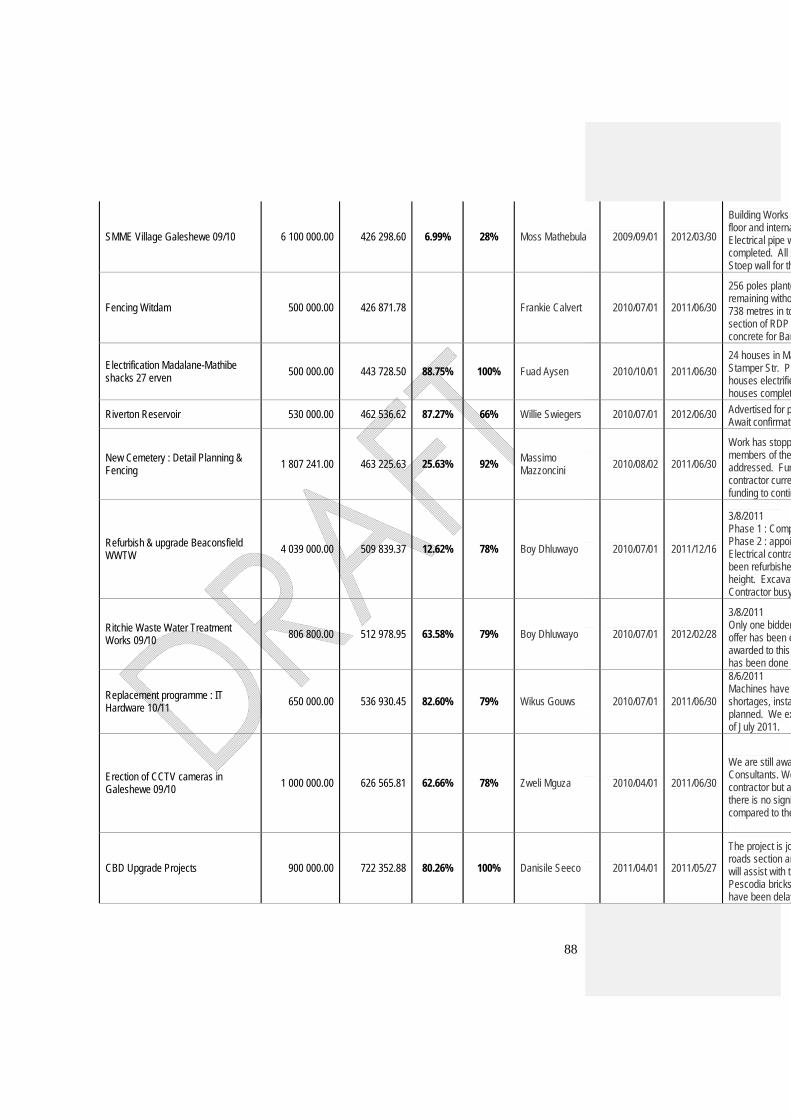
88
SMME Village Galeshewe 09/10 6 100 000.00 426 298.60 6.99% 28% Moss Mathebula 2009/09/01 2012/03/30
Building Works floor and internaElectrical pipe wcompleted. All sStoep wall for th
Fencing Witdam 500 000.00 426 871.78 Frankie Calvert 2010/07/01 2011/06/30
256 poles planteremaining witho738 metres in tosection of RDP concrete for Bar
Electrification Madalane-Mathibe shacks 27 erven
500 000.00 443 728.50 88.75% 100% Fuad Aysen 2010/10/01 2011/06/30
24 houses in MaStamper Str. Prhouses electrifiehouses complet
Riverton Reservoir 530 000.00 462 536.62 87.27% 66% Willie Swiegers 2010/07/01 2012/06/30 Advertised for pAwait confirmati
New Cemetery : Detail Planning & Fencing
1 807 241.00 463 225.63 25.63% 92% Massimo Mazzoncini
2010/08/02 2011/06/30
Work has stoppmembers of the addressed. Furcontractor currefunding to contin
Refurbish & upgrade Beaconsfield WWTW
4 039 000.00 509 839.37 12.62% 78% Boy Dhluwayo 2010/07/01 2011/12/16
3/8/2011 Phase 1 : CompPhase 2 : appoiElectrical contrabeen refurbisheheight. ExcavatContractor busy
Ritchie Waste Water Treatment Works 09/10 806 800.00 512 978.95 63.58% 79% Boy Dhluwayo 2010/07/01 2012/02/28
3/8/2011 Only one bidderoffer has been eawarded to this has been done t
Replacement programme : IT Hardware 10/11
650 000.00 536 930.45 82.60% 79% Wikus Gouws 2010/07/01 2011/06/30
8/6/2011 Machines have shortages, instaplanned. We exof July 2011.
Erection of CCTV cameras in Galeshewe 09/10 1 000 000.00 626 565.81 62.66% 78% Zweli Mguza 2010/04/01 2011/06/30
We are still awaConsultants. Wecontractor but athere is no signicompared to the
CBD Upgrade Projects 900 000.00 722 352.88 80.26% 100% Danisile Seeco 2011/04/01 2011/05/27
The project is joroads section anwill assist with thPescodia brickshave been delay
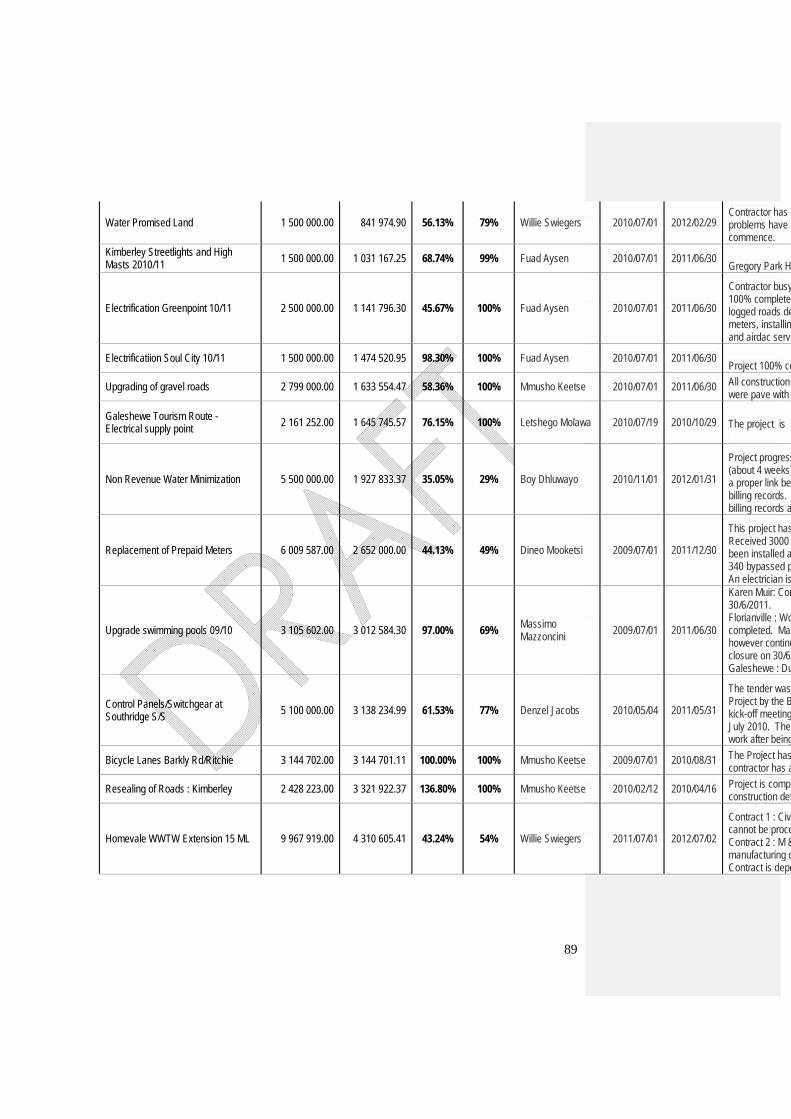
89
Water Promised Land 1 500 000.00 841 974.90 56.13% 79% Willie Swiegers 2010/07/01 2012/02/29 Contractor has eproblems have bcommence.
Kimberley Streetlights and High Masts 2010/11 1 500 000.00 1 031 167.25 68.74% 99% Fuad Aysen 2010/07/01 2011/06/30
Gregory Park H
Electrification Greenpoint 10/11 2 500 000.00 1 141 796.30 45.67% 100% Fuad Aysen 2010/07/01 2011/06/30
Contractor busy100% complete logged roads demeters, installinand airdac servi
Electrificatiion Soul City 10/11 1 500 000.00 1 474 520.95 98.30% 100% Fuad Aysen 2010/07/01 2011/06/30 Project 100% co
Upgrading of gravel roads 2 799 000.00 1 633 554.47 58.36% 100% Mmusho Keetse 2010/07/01 2011/06/30 All construction were pave with
Galeshewe Tourism Route - Electrical supply point 2 161 252.00 1 645 745.57 76.15% 100% Letshego Molawa 2010/07/19 2010/10/29 The project is 1
Non Revenue Water Minimization 5 500 000.00 1 927 833.37 35.05% 29% Boy Dhluwayo 2010/11/01 2012/01/31
Project progress(about 4 weeks)a proper link betbilling records. billing records a
Replacement of Prepaid Meters 6 009 587.00 2 652 000.00 44.13% 49% Dineo Mooketsi 2009/07/01 2011/12/30
This project hasReceived 3000 been installed a340 bypassed pAn electrician is
Upgrade swimming pools 09/10 3 105 602.00 3 012 584.30 97.00% 69% Massimo Mazzoncini 2009/07/01 2011/06/30
Karen Muir: Com30/6/2011. Florianville : Wocompleted. Maihowever continuclosure on 30/6/Galeshewe : Du
Control Panels/Switchgear at Southridge S/S 5 100 000.00 3 138 234.99 61.53% 77% Denzel Jacobs 2010/05/04 2011/05/31
The tender was Project by the Bkick-off meetingJuly 2010. The work after being
Bicycle Lanes Barkly Rd/Ritchie 3 144 702.00 3 144 701.11 100.00% 100% Mmusho Keetse 2009/07/01 2010/08/31 The Project hascontractor has a
Resealing of Roads : Kimberley 2 428 223.00 3 321 922.37 136.80% 100% Mmusho Keetse 2010/02/12 2010/04/16 Project is complconstruction def
Homevale WWTW Extension 15 ML 9 967 919.00 4 310 605.41 43.24% 54% Willie Swiegers 2011/07/01 2012/07/02
Contract 1 : Civcannot be proceContract 2 : M &manufacturing oContract is depe
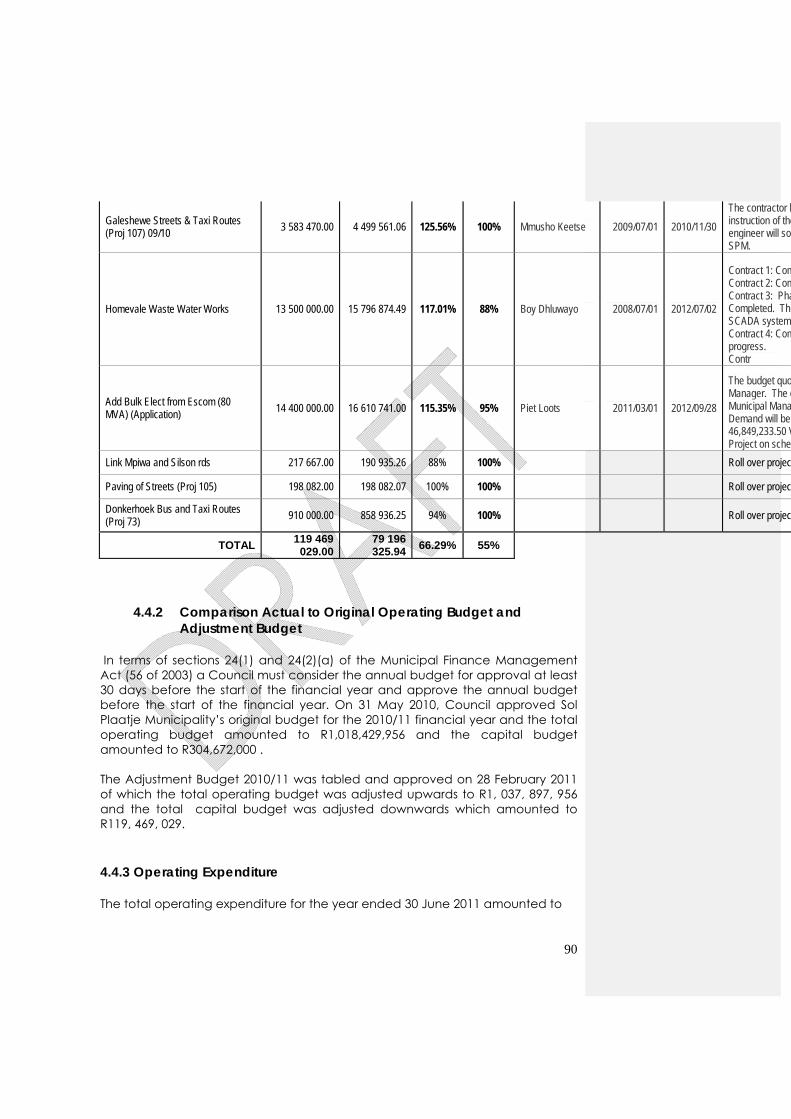
90
Galeshewe Streets & Taxi Routes (Proj 107) 09/10 3 583 470.00 4 499 561.06 125.56% 100% Mmusho Keetse 2009/07/01 2010/11/30
The contractor hinstruction of theengineer will sooSPM.
Homevale Waste Water Works 13 500 000.00 15 796 874.49 117.01% 88% Boy Dhluwayo 2008/07/01 2012/07/02
Contract 1: ComContract 2: ComContract 3: PhaCompleted. TheSCADA system Contract 4: Comprogress. Contr
Add Bulk Elect from Escom (80 MVA) (Application) 14 400 000.00 16 610 741.00 115.35% 95% Piet Loots 2011/03/01 2012/09/28
The budget quoManager. The qMunicipal ManaDemand will be 46,849,233.50 VProject on sched
Link Mpiwa and Silson rds 217 667.00 190 935.26 88% 100% Roll over projec
Paving of Streets (Proj 105) 198 082.00 198 082.07 100% 100% Roll over projec
Donkerhoek Bus and Taxi Routes (Proj 73)
910 000.00 858 936.25 94% 100% Roll over projec
TOTAL 119 469 029.00
79 196 325.94
66.29% 55%
4.4.2 Comparison Actual to Original Operating Budget and
Adjustment Budget In terms of sections 24(1) and 24(2)(a) of the Municipal Finance Management Act (56 of 2003) a Council must consider the annual budget for approval at least 30 days before the start of the financial year and approve the annual budget before the start of the financial year. On 31 May 2010, Council approved Sol Plaatje Municipality’s original budget for the 2010/11 financial year and the total operating budget amounted to R1,018,429,956 and the capital budget amounted to R304,672,000 . The Adjustment Budget 2010/11 was tabled and approved on 28 February 2011 of which the total operating budget was adjusted upwards to R1, 037, 897, 956 and the total capital budget was adjusted downwards which amounted to R119, 469, 029. 4.4.3 Operating Expenditure The total operating expenditure for the year ended 30 June 2011 amounted to
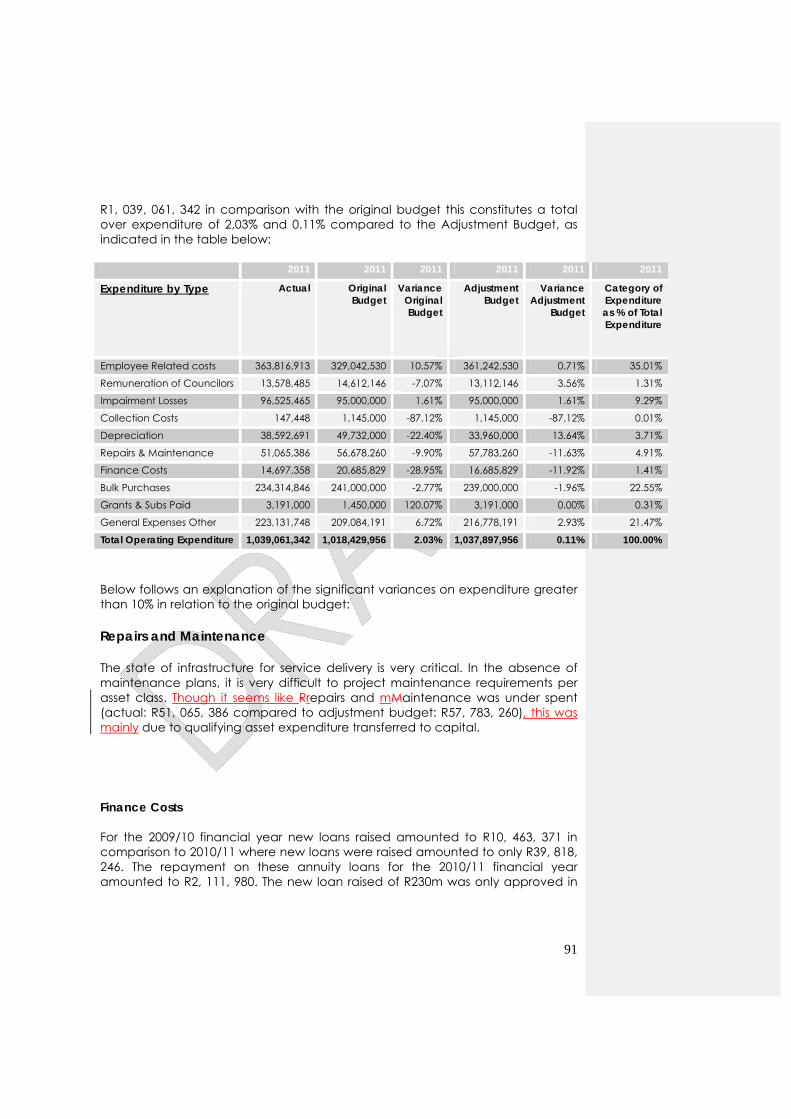
91
R1, 039, 061, 342 in comparison with the original budget this constitutes a total over expenditure of 2,03% and 0.11% compared to the Adjustment Budget, as indicated in the table below: 2011 2011 2011 2011 2011 2011
Expenditure by Type Actual Original Budget
Variance Original Budget
Adjustment Budget
Variance Adjustment
Budget
Category of Expenditure as % of Total Expenditure
Employee Related costs 363,816,913 329,042,530 10.57% 361,242,530 0.71% 35.01%
Remuneration of Councilors 13,578,485 14,612,146 -7.07% 13,112,146 3.56% 1.31%
Impairment Losses 96,525,465 95,000,000 1.61% 95,000,000 1.61% 9.29%
Collection Costs 147,448 1,145,000 -87.12% 1,145,000 -87.12% 0.01%
Depreciation 38,592,691 49,732,000 -22.40% 33,960,000 13.64% 3.71%
Repairs & Maintenance 51,065,386 56,678,260 -9.90% 57,783,260 -11.63% 4.91%
Finance Costs 14,697,358 20,685,829 -28.95% 16,685,829 -11.92% 1.41%
Bulk Purchases 234,314,846 241,000,000 -2.77% 239,000,000 -1.96% 22.55%
Grants & Subs Paid 3,191,000 1,450,000 120.07% 3,191,000 0.00% 0.31%
General Expenses Other 223,131,748 209,084,191 6.72% 216,778,191 2.93% 21.47%
Total Operating Expenditure 1,039,061,342 1,018,429,956 2.03% 1,037,897,956 0.11% 100.00%
Below follows an explanation of the significant variances on expenditure greater than 10% in relation to the original budget: Repairs and Maintenance The state of infrastructure for service delivery is very critical. In the absence of maintenance plans, it is very difficult to project maintenance requirements per asset class. Though it seems like Rrepairs and mMaintenance was under spent (actual: R51, 065, 386 compared to adjustment budget: R57, 783, 260), this was mainly due to qualifying asset expenditure transferred to capital. Finance Costs For the 2009/10 financial year new loans raised amounted to R10, 463, 371 in comparison to 2010/11 where new loans were raised amounted to only R39, 818, 246. The repayment on these annuity loans for the 2010/11 financial year amounted to R2, 111, 980. The new loan raised of R230m was only approved in
92
February 2011. The loan was phased in over three years and this resulted in the municipality having a substantial saving on interest for the current year. Grants and Subsidies Paid The grants to the festivals are to promote economic growth. The subsidy to the SPCA is to assist the municipality to care for stray animals and other related tasks. The subsidy is paid on an annual basis. General Expenses The over expenditure on General expenses is attributable to two major items namely transfer of non-qualifying asset expenditure transferred from capital to operational and bypassed prepaid meters amounting to R21m and R10m respectively. Impairment Losses The total amount on Impairment Losses was overspent due to the impairment of debtors being increased. The calculation of Impairment losses was changed from a global to individual debtor impairment as required by the GRAP standards.
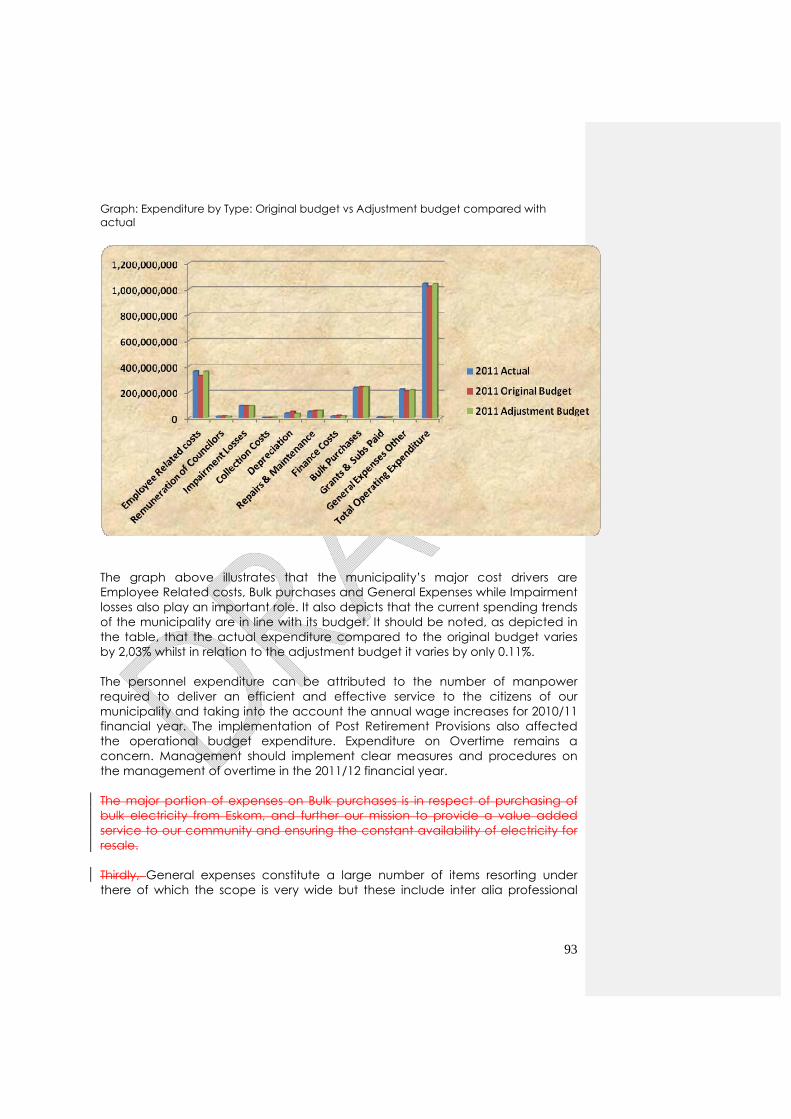
93
Graph: Expenditure by Type: Original budget vs Adjustment budget compared with actual
The graph above illustrates that the municipality’s major cost drivers are Employee Related costs, Bulk purchases and General Expenses while Impairment losses also play an important role. It also depicts that the current spending trends of the municipality are in line with its budget. It should be noted, as depicted in the table, that the actual expenditure compared to the original budget varies by 2,03% whilst in relation to the adjustment budget it varies by only 0.11%. The personnel expenditure can be attributed to the number of manpower required to deliver an efficient and effective service to the citizens of our municipality and taking into the account the annual wage increases for 2010/11 financial year. The implementation of Post Retirement Provisions also affected the operational budget expenditure. Expenditure on Overtime remains a concern. Management should implement clear measures and procedures on the management of overtime in the 2011/12 financial year. The major portion of expenses on Bulk purchases is in respect of purchasing of bulk electricity from Eskom, and further our mission to provide a value added service to our community and ensuring the constant availability of electricity for resale. Thirdly, General expenses constitute a large number of items resorting under there of which the scope is very wide but these include inter alia professional
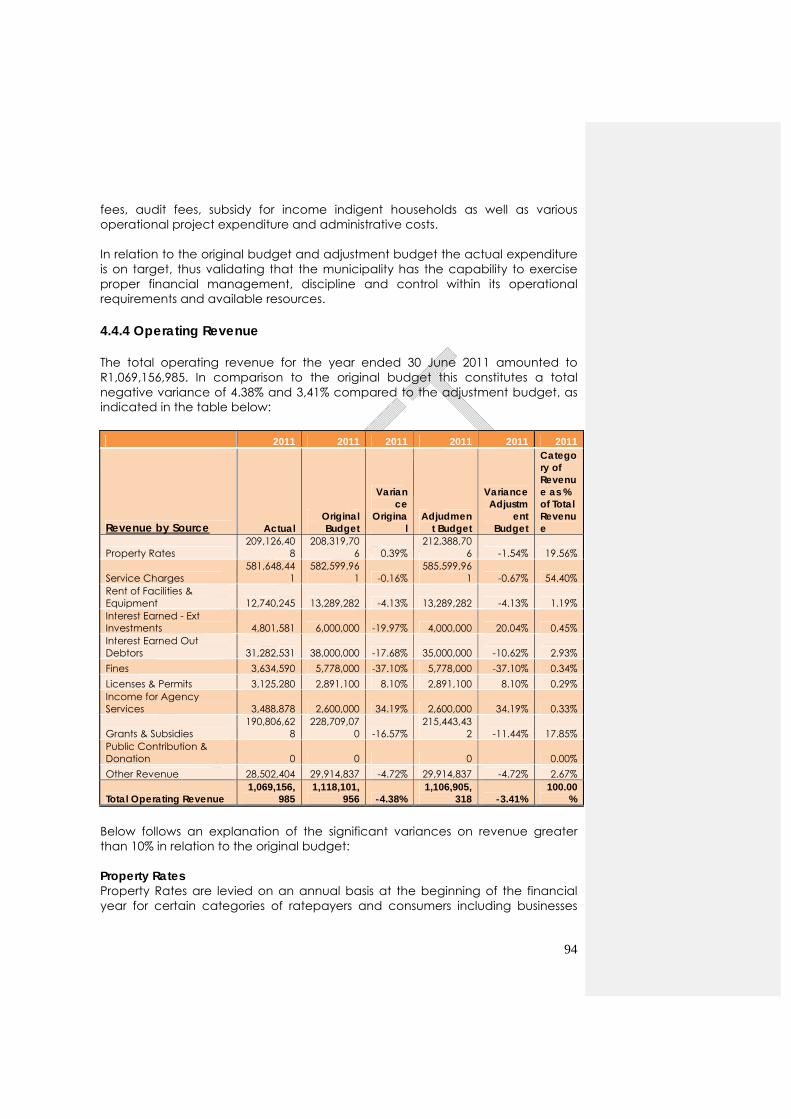
94
fees, audit fees, subsidy for income indigent households as well as various operational project expenditure and administrative costs. In relation to the original budget and adjustment budget the actual expenditure is on target, thus validating that the municipality has the capability to exercise proper financial management, discipline and control within its operational requirements and available resources. 4.4.4 Operating Revenue The total operating revenue for the year ended 30 June 2011 amounted to R1,069,156,985. In comparison to the original budget this constitutes a total negative variance of 4.38% and 3,41% compared to the adjustment budget, as indicated in the table below: 2011 2011 2011 2011 2011 2011
Revenue by Source Actual Original Budget
Variance
Original
Adjudment Budget
Variance Adjustm
ent Budget
Category of Revenue as % of Total Revenue
Property Rates 209,126,40
8 208,319,70
6 0.39% 212,388,70
6 -1.54% 19.56%
Service Charges 581,648,44
1 582,599,96
1 -0.16% 585,599,96
1 -0.67% 54.40% Rent of Facilities & Equipment 12,740,245 13,289,282 -4.13% 13,289,282 -4.13% 1.19% Interest Earned - Ext Investments 4,801,581 6,000,000 -19.97% 4,000,000 20.04% 0.45% Interest Earned Out Debtors 31,282,531 38,000,000 -17.68% 35,000,000 -10.62% 2.93% Fines 3,634,590 5,778,000 -37.10% 5,778,000 -37.10% 0.34% Licenses & Permits 3,125,280 2,891,100 8.10% 2,891,100 8.10% 0.29% Income for Agency Services 3,488,878 2,600,000 34.19% 2,600,000 34.19% 0.33%
Grants & Subsidies 190,806,62
8 228,709,07
0 -16.57% 215,443,43
2 -11.44% 17.85% Public Contribution & Donation 0 0 0 0.00% Other Revenue 28,502,404 29,914,837 -4.72% 29,914,837 -4.72% 2.67%
Total Operating Revenue 1,069,156,
985 1,118,101,
956 -4.38% 1,106,905,
318 -3.41% 100.00
%
Below follows an explanation of the significant variances on revenue greater than 10% in relation to the original budget: Property Rates Property Rates are levied on an annual basis at the beginning of the financial year for certain categories of ratepayers and consumers including businesses
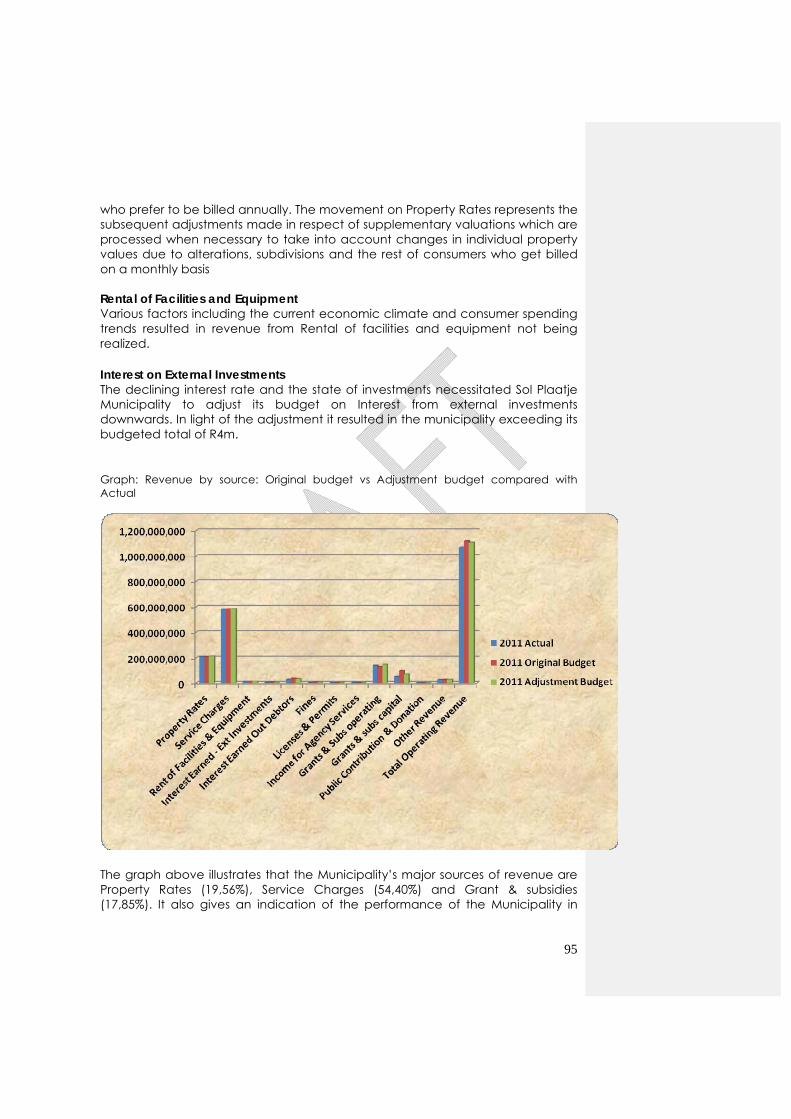
95
who prefer to be billed annually. The movement on Property Rates represents the subsequent adjustments made in respect of supplementary valuations which are processed when necessary to take into account changes in individual property values due to alterations, subdivisions and the rest of consumers who get billed on a monthly basis Rental of Facilities and Equipment Various factors including the current economic climate and consumer spending trends resulted in revenue from Rental of facilities and equipment not being realized. Interest on External Investments The declining interest rate and the state of investments necessitated Sol Plaatje Municipality to adjust its budget on Interest from external investments downwards. In light of the adjustment it resulted in the municipality exceeding its budgeted total of R4m. Graph: Revenue by source: Original budget vs Adjustment budget compared with Actual
The graph above illustrates that the Municipality’s major sources of revenue are Property Rates (19,56%), Service Charges (54,40%) and Grant & subsidies (17,85%). It also gives an indication of the performance of the Municipality in
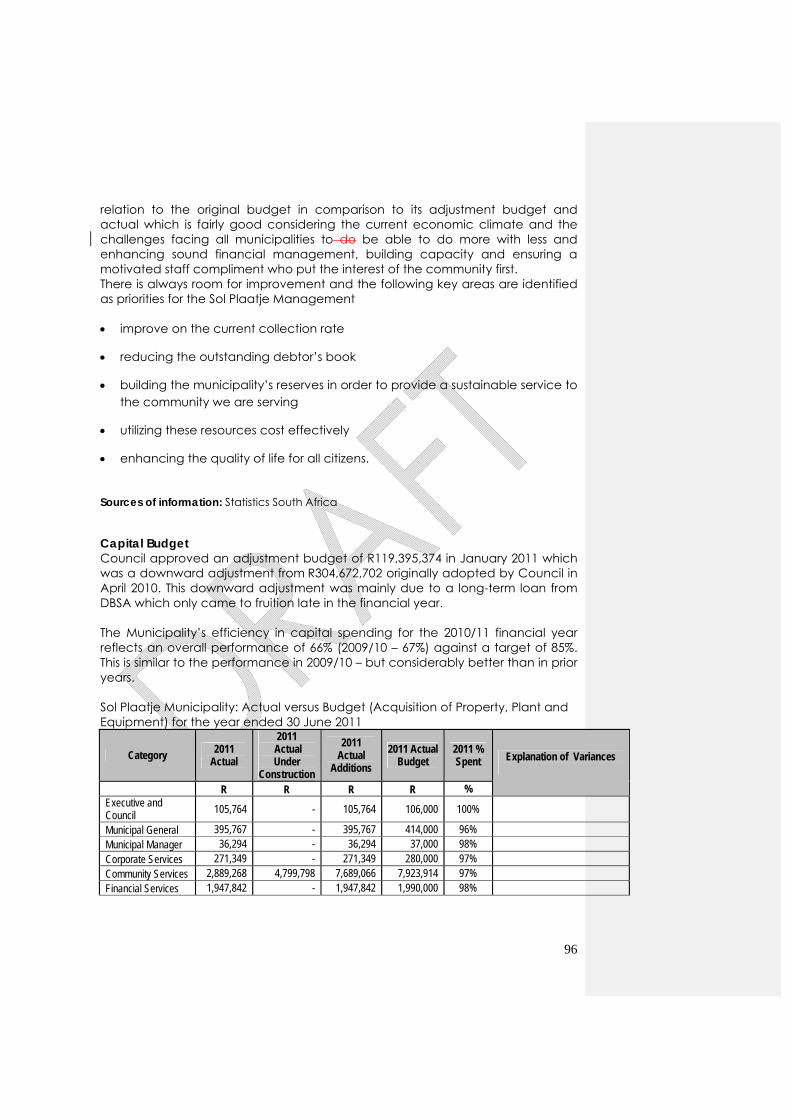
96
relation to the original budget in comparison to its adjustment budget and actual which is fairly good considering the current economic climate and the challenges facing all municipalities to do be able to do more with less and enhancing sound financial management, building capacity and ensuring a motivated staff compliment who put the interest of the community first. There is always room for improvement and the following key areas are identified as priorities for the Sol Plaatje Management improve on the current collection rate
reducing the outstanding debtor’s book
building the municipality’s reserves in order to provide a sustainable service to the community we are serving
utilizing these resources cost effectively
enhancing the quality of life for all citizens.
Sources of information: Statistics South Africa Capital Budget Council approved an adjustment budget of R119,395,374 in January 2011 which was a downward adjustment from R304,672,702 originally adopted by Council in April 2010. This downward adjustment was mainly due to a long-term loan from DBSA which only came to fruition late in the financial year. The Municipality’s efficiency in capital spending for the 2010/11 financial year reflects an overall performance of 66% (2009/10 – 67%) against a target of 85%. This is similar to the performance in 2009/10 – but considerably better than in prior years. Sol Plaatje Municipality: Actual versus Budget (Acquisition of Property, Plant and Equipment) for the year ended 30 June 2011
Category 2011 Actual
2011 Actual Under
Construction
2011 Actual
Additions
2011 Actual Budget
2011 % Spent Explanation of Variances
R R R R % Executive and Council 105,764 - 105,764 106,000 100%
Municipal General 395,767 - 395,767 414,000 96%
Municipal Manager 36,294 - 36,294 37,000 98%
Corporate Services 271,349 - 271,349 280,000 97%
Community Services 2,889,268 4,799,798 7,689,066 7,923,914 97%
Financial Services 1,947,842 - 1,947,842 1,990,000 98%
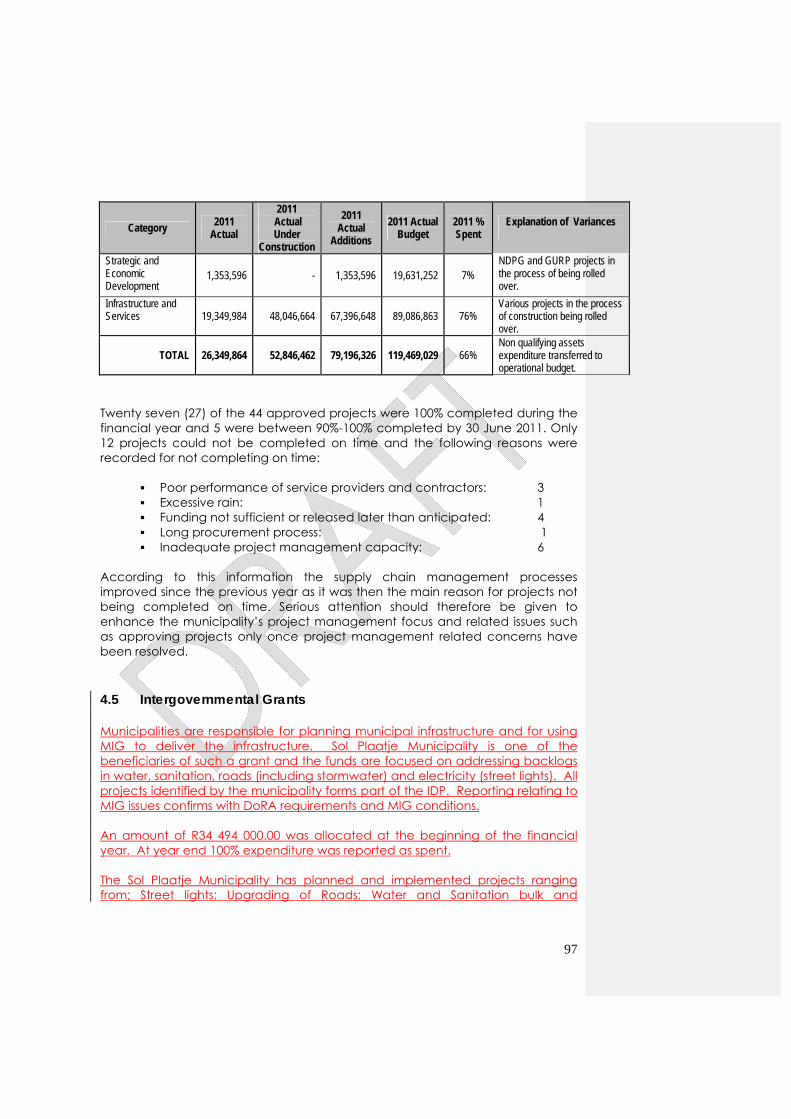
97
Category 2011 Actual
2011 Actual Under
Construction
2011 Actual
Additions
2011 Actual Budget
2011 % Spent
Explanation of Variances
Strategic and Economic Development
1,353,596 - 1,353,596 19,631,252 7% NDPG and GURP projects in the process of being rolled over.
Infrastructure and Services 19,349,984 48,046,664 67,396,648 89,086,863 76%
Various projects in the process of construction being rolled over.
TOTAL 26,349,864 52,846,462 79,196,326 119,469,029 66% Non qualifying assets expenditure transferred to operational budget.
Twenty seven (27) of the 44 approved projects were 100% completed during the financial year and 5 were between 90%-100% completed by 30 June 2011. Only 12 projects could not be completed on time and the following reasons were recorded for not completing on time:
Poor performance of service providers and contractors: 3 Excessive rain: 1 Funding not sufficient or released later than anticipated: 4 Long procurement process: 1 Inadequate project management capacity: 6
According to this information the supply chain management processes improved since the previous year as it was then the main reason for projects not being completed on time. Serious attention should therefore be given to enhance the municipality’s project management focus and related issues such as approving projects only once project management related concerns have been resolved. 4.5 Intergovernmental Grants Municipalities are responsible for planning municipal infrastructure and for using MIG to deliver the infrastructure. Sol Plaatje Municipality is one of the beneficiaries of such a grant and the funds are focused on addressing backlogs in water, sanitation, roads (including stormwater) and electricity (street lights). All projects identified by the municipality forms part of the IDP. Reporting relating to MIG issues confirms with DoRA requirements and MIG conditions. An amount of R34 494 000.00 was allocated at the beginning of the financial year. At year end 100% expenditure was reported as spent. The Sol Plaatje Municipality has planned and implemented projects ranging from; Street lights; Upgrading of Roads; Water and Sanitation bulk and
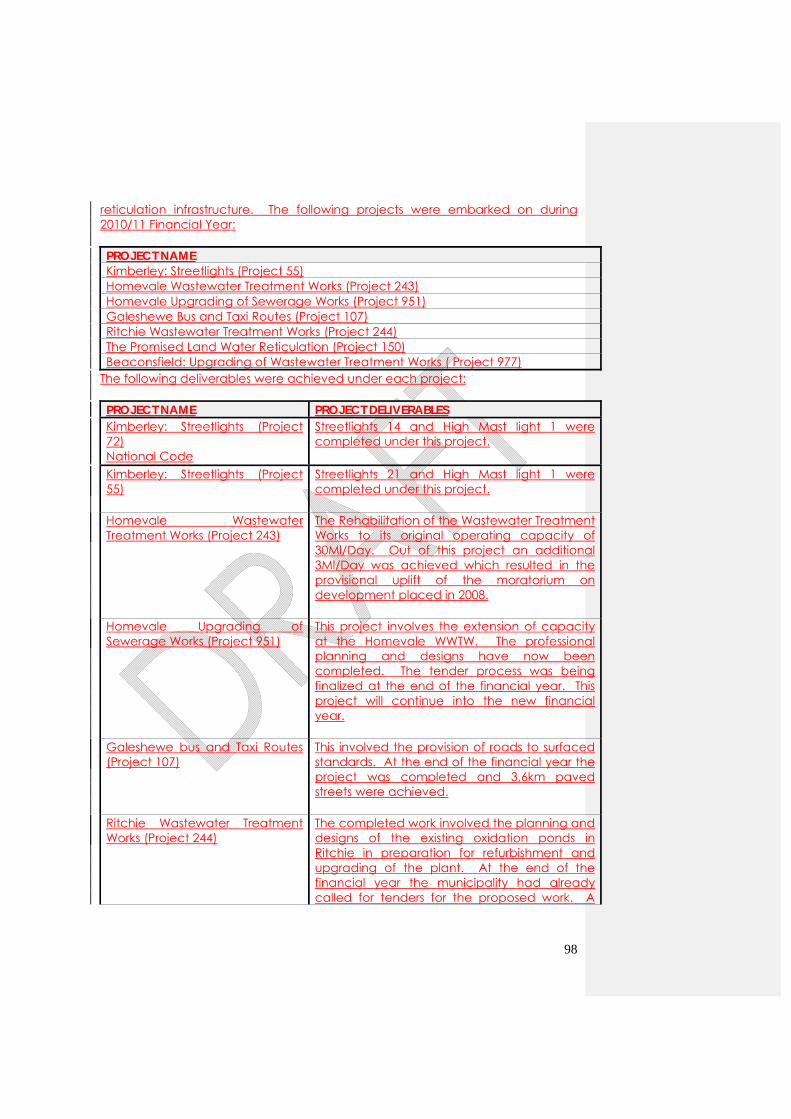
98
reticulation infrastructure. The following projects were embarked on during 2010/11 Financial Year: PROJECT NAME Kimberley: Streetlights (Project 55) Homevale Wastewater Treatment Works (Project 243) Homevale Upgrading of Sewerage Works (Project 951) Galeshewe Bus and Taxi Routes (Project 107) Ritchie Wastewater Treatment Works (Project 244) The Promised Land Water Reticulation (Project 150) Beaconsfield: Upgrading of Wastewater Treatment Works ( Project 977)
The following deliverables were achieved under each project: PROJECT NAME PROJECT DELIVERABLES Kimberley: Streetlights (Project 72) National Code
Streetlights 14 and High Mast light 1 were completed under this project.
Kimberley: Streetlights (Project 55)
Streetlights 21 and High Mast light 1 were completed under this project.
Homevale Wastewater Treatment Works (Project 243)
The Rehabilitation of the Wastewater Treatment Works to its original operating capacity of 30Ml/Day. Out of this project an additional 3Ml/Day was achieved which resulted in the provisional uplift of the moratorium on development placed in 2008.
Homevale Upgrading of Sewerage Works (Project 951)
This project involves the extension of capacity at the Homevale WWTW. The professional planning and designs have now been completed. The tender process was being finalized at the end of the financial year. This project will continue into the new financial year.
Galeshewe bus and Taxi Routes (Project 107)
This involved the provision of roads to surfaced standards. At the end of the financial year the project was completed and 3,6km paved streets were achieved.
Ritchie Wastewater Treatment Works (Project 244)
The completed work involved the planning and designs of the existing oxidation ponds in Ritchie in preparation for refurbishment and upgrading of the plant. At the end of the financial year the municipality had already called for tenders for the proposed work. A
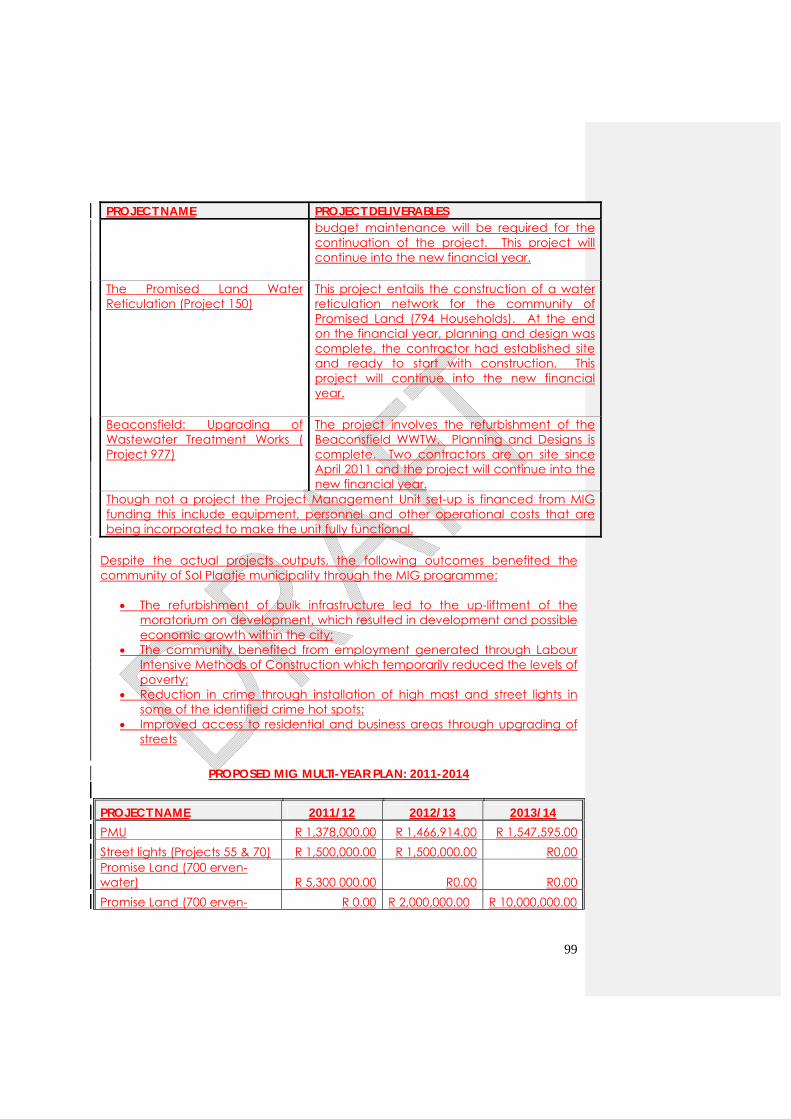
99
PROJECT NAME PROJECT DELIVERABLES budget maintenance will be required for the continuation of the project. This project will continue into the new financial year.
The Promised Land Water Reticulation (Project 150)
This project entails the construction of a water reticulation network for the community of Promised Land (794 Households). At the end on the financial year, planning and design was complete, the contractor had established site and ready to start with construction. This project will continue into the new financial year.
Beaconsfield: Upgrading of Wastewater Treatment Works ( Project 977)
The project involves the refurbishment of the Beaconsfield WWTW. Planning and Designs is complete. Two contractors are on site since April 2011 and the project will continue into the new financial year.
Though not a project the Project Management Unit set-up is financed from MIG funding this include equipment, personnel and other operational costs that are being incorporated to make the unit fully functional.
Despite the actual projects outputs, the following outcomes benefited the community of Sol Plaatje municipality through the MIG programme:
The refurbishment of bulk infrastructure led to the up-liftment of the moratorium on development, which resulted in development and possible economic growth within the city;
The community benefited from employment generated through Labour Intensive Methods of Construction which temporarily reduced the levels of poverty;
Reduction in crime through installation of high mast and street lights in some of the identified crime hot spots;
Improved access to residential and business areas through upgrading of streets
PROPOSED MIG MULTI-YEAR PLAN: 2011-2014
PROJECT NAME 2011/12 2012/13 2013/14 PMU R 1,378,000.00 R 1,466,914.00 R 1,547,595.00 Street lights (Projects 55 & 70) R 1,500,000.00 R 1,500,000.00 R0,00 Promise Land (700 erven-water) R 5,300 000.00 R0.00 R0.00 Promise Land (700 erven- R 0.00 R 2,000,000.00 R 10,000,000.00
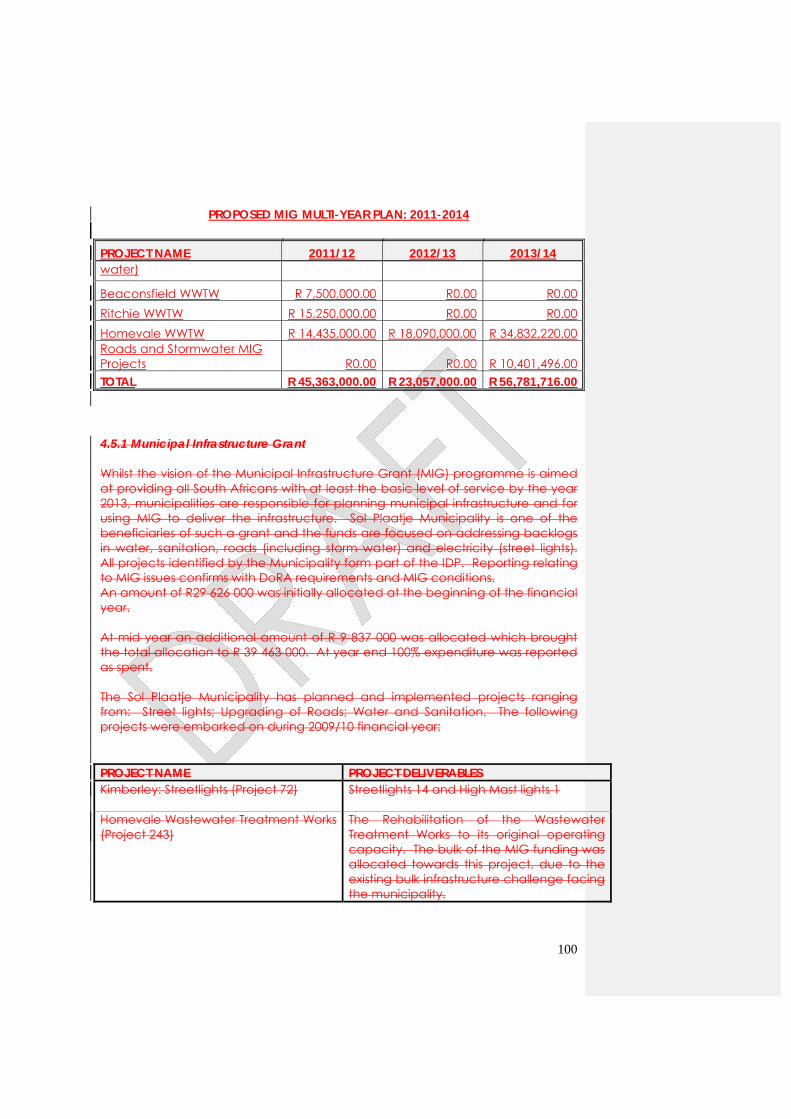
100
PROPOSED MIG MULTI-YEAR PLAN: 2011-2014 PROJECT NAME 2011/12 2012/13 2013/14 water)
Beaconsfield WWTW R 7,500,000.00 R0.00 R0.00 Ritchie WWTW R 15,250,000.00 R0.00 R0.00 Homevale WWTW R 14,435,000.00 R 18,090,000.00 R 34,832,220.00 Roads and Stormwater MIG Projects R0.00 R0.00 R 10,401,496.00 TOTAL R 45,363,000.00 R 23,057,000.00 R 56,781,716.00 4.5.1 Municipal Infrastructure Grant Whilst the vision of the Municipal Infrastructure Grant (MIG) programme is aimed at providing all South Africans with at least the basic level of service by the year 2013, municipalities are responsible for planning municipal infrastructure and for using MIG to deliver the infrastructure. Sol Plaatje Municipality is one of the beneficiaries of such a grant and the funds are focused on addressing backlogs in water, sanitation, roads (including storm water) and electricity (street lights). All projects identified by the Municipality form part of the IDP. Reporting relating to MIG issues confirms with DoRA requirements and MIG conditions. An amount of R29 626 000 was initially allocated at the beginning of the financial year. At mid year an additional amount of R 9 837 000 was allocated which brought the total allocation to R 39 463 000. At year end 100% expenditure was reported as spent. The Sol Plaatje Municipality has planned and implemented projects ranging from: Street lights; Upgrading of Roads; Water and Sanitation. The following projects were embarked on during 2009/10 financial year: PROJECT NAME PROJECT DELIVERABLES Kimberley: Streetlights (Project 72)
Streetlights 14 and High Mast lights 1
Homevale Wastewater Treatment Works (Project 243)
The Rehabilitation of the Wastewater Treatment Works to its original operating capacity. The bulk of the MIG funding was allocated towards this project, due to the existing bulk infrastructure challenge facing the municipality.
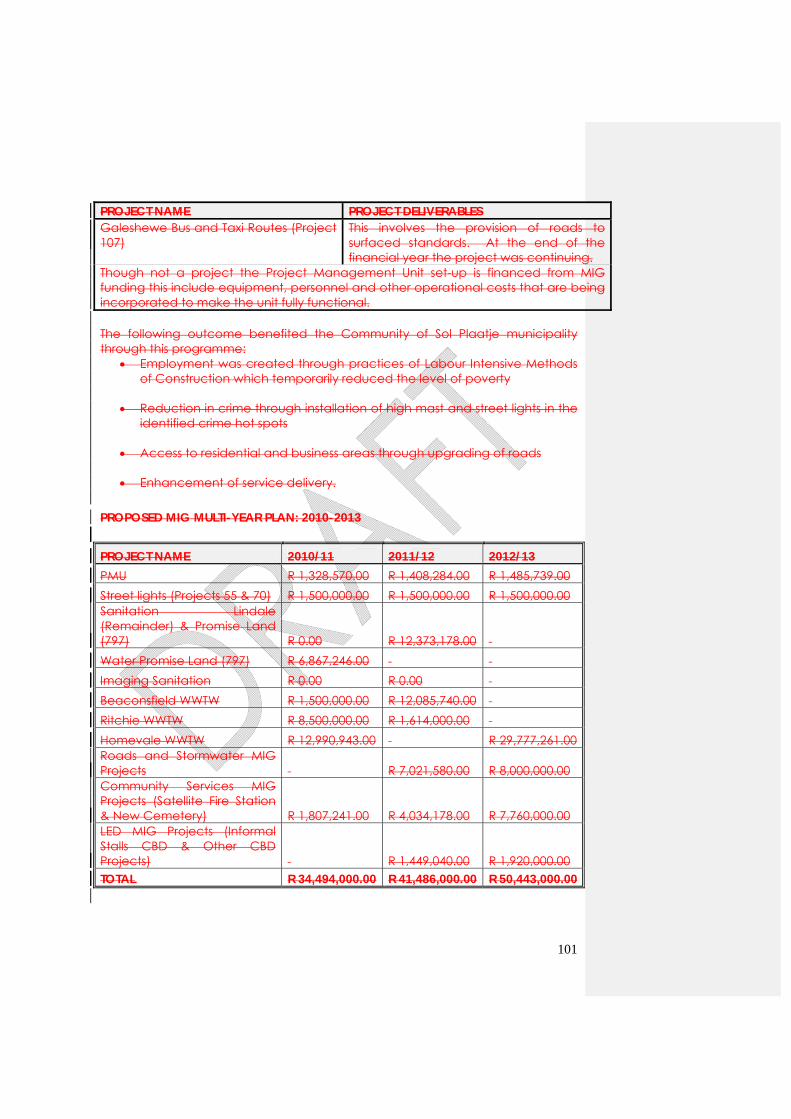
101
PROJECT NAME PROJECT DELIVERABLES Galeshewe Bus and Taxi Routes (Project 107)
This involves the provision of roads to surfaced standards. At the end of the financial year the project was continuing.
Though not a project the Project Management Unit set-up is financed from MIG funding this include equipment, personnel and other operational costs that are being incorporated to make the unit fully functional. The following outcome benefited the Community of Sol Plaatje municipality through this programme:
Employment was created through practices of Labour Intensive Methods of Construction which temporarily reduced the level of poverty
Reduction in crime through installation of high mast and street lights in the
identified crime hot spots Access to residential and business areas through upgrading of roads Enhancement of service delivery.
PROPOSED MIG MULTI-YEAR PLAN: 2010-2013
PROJECT NAME 2010/11 2011/12 2012/13 PMU R 1,328,570.00 R 1,408,284.00 R 1,485,739.00 Street lights (Projects 55 & 70) R 1,500,000.00 R 1,500,000.00 R 1,500,000.00 Sanitation Lindale (Remainder) & Promise Land (797) R 0.00 R 12,373,178.00 Water Promise Land (797) R 6,867,246.00 Imaging Sanitation R 0.00 R 0.00 Beaconsfield WWTW R 1,500,000.00 R 12,085,740.00 Ritchie WWTW R 8,500,000.00 R 1,614,000.00 Homevale WWTW R 12,990,943.00 R 29,777,261.00 Roads and Stormwater MIG Projects R 7,021,580.00 R 8,000,000.00 Community Services MIG Projects (Satellite Fire Station & New Cemetery) R 1,807,241.00 R 4,034,178.00 R 7,760,000.00 LED MIG Projects (Informal Stalls CBD & Other CBD Projects) R 1,449,040.00 R 1,920,000.00 TOTAL R 34,494,000.00 R 41,486,000.00 R 50,443,000.00
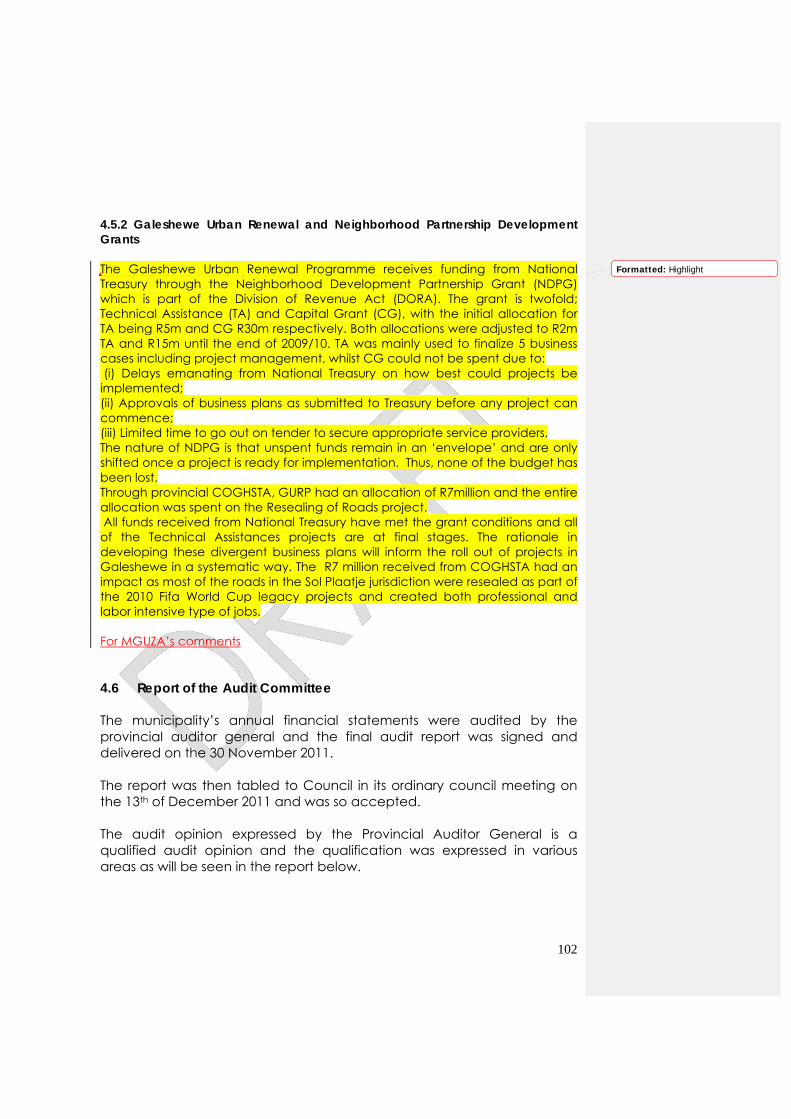
102
4.5.2 Galeshewe Urban Renewal and Neighborhood Partnership Development Grants The Galeshewe Urban Renewal Programme receives funding from National Treasury through the Neighborhood Development Partnership Grant (NDPG) which is part of the Division of Revenue Act (DORA). The grant is twofold; Technical Assistance (TA) and Capital Grant (CG), with the initial allocation for TA being R5m and CG R30m respectively. Both allocations were adjusted to R2m TA and R15m until the end of 2009/10. TA was mainly used to finalize 5 business cases including project management, whilst CG could not be spent due to: (i) Delays emanating from National Treasury on how best could projects be implemented; (ii) Approvals of business plans as submitted to Treasury before any project can commence; (iii) Limited time to go out on tender to secure appropriate service providers. The nature of NDPG is that unspent funds remain in an ‘envelope’ and are only shifted once a project is ready for implementation. Thus, none of the budget has been lost. Through provincial COGHSTA, GURP had an allocation of R7million and the entire allocation was spent on the Resealing of Roads project. All funds received from National Treasury have met the grant conditions and all of the Technical Assistances projects are at final stages. The rationale in developing these divergent business plans will inform the roll out of projects in Galeshewe in a systematic way. The R7 million received from COGHSTA had an impact as most of the roads in the Sol Plaatje jurisdiction were resealed as part of the 2010 Fifa World Cup legacy projects and created both professional and labor intensive type of jobs. For MGUZA’s comments
4.6 Report of the Audit Committee
The municipality’s annual financial statements were audited by the provincial auditor general and the final audit report was signed and delivered on the 30 November 2011. The report was then tabled to Council in its ordinary council meeting on the 13th of December 2011 and was so accepted. The audit opinion expressed by the Provincial Auditor General is a qualified audit opinion and the qualification was expressed in various areas as will be seen in the report below.
Formatted: Highlight
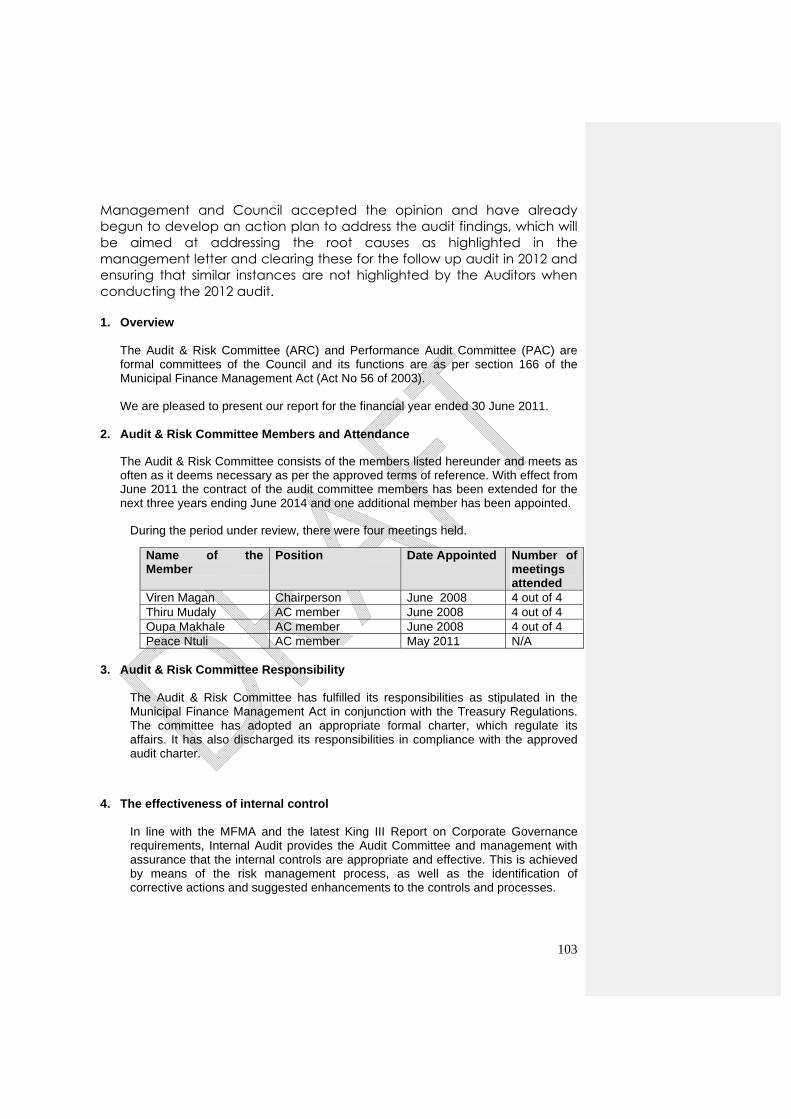
103
Management and Council accepted the opinion and have already begun to develop an action plan to address the audit findings, which will be aimed at addressing the root causes as highlighted in the management letter and clearing these for the follow up audit in 2012 and ensuring that similar instances are not highlighted by the Auditors when conducting the 2012 audit. 1. Overview
The Audit & Risk Committee (ARC) and Performance Audit Committee (PAC) are formal committees of the Council and its functions are as per section 166 of the Municipal Finance Management Act (Act No 56 of 2003). We are pleased to present our report for the financial year ended 30 June 2011.
2. Audit & Risk Committee Members and Attendance
The Audit & Risk Committee consists of the members listed hereunder and meets as often as it deems necessary as per the approved terms of reference. With effect from June 2011 the contract of the audit committee members has been extended for the next three years ending June 2014 and one additional member has been appointed.
During the period under review, there were four meetings held.
Name of the Member
Position Date Appointed Number of meetings attended
Viren Magan Chairperson June 2008 4 out of 4 Thiru Mudaly AC member June 2008 4 out of 4 Oupa Makhale AC member June 2008 4 out of 4 Peace Ntuli AC member May 2011 N/A
3. Audit & Risk Committee Responsibility
The Audit & Risk Committee has fulfilled its responsibilities as stipulated in the Municipal Finance Management Act in conjunction with the Treasury Regulations. The committee has adopted an appropriate formal charter, which regulate its affairs. It has also discharged its responsibilities in compliance with the approved audit charter.
4. The effectiveness of internal control
In line with the MFMA and the latest King III Report on Corporate Governance requirements, Internal Audit provides the Audit Committee and management with assurance that the internal controls are appropriate and effective. This is achieved by means of the risk management process, as well as the identification of corrective actions and suggested enhancements to the controls and processes.
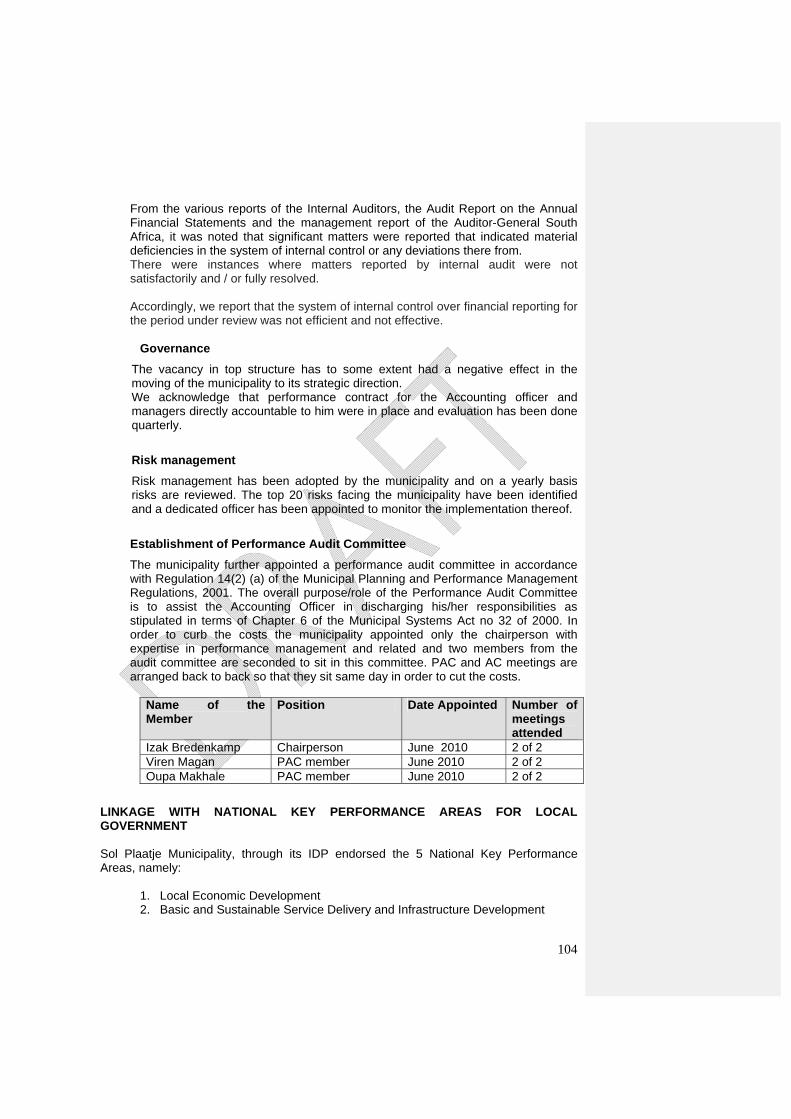
104
From the various reports of the Internal Auditors, the Audit Report on the Annual Financial Statements and the management report of the Auditor-General South Africa, it was noted that significant matters were reported that indicated material deficiencies in the system of internal control or any deviations there from. There were instances where matters reported by internal audit were not satisfactorily and / or fully resolved.
Accordingly, we report that the system of internal control over financial reporting for the period under review was not efficient and not effective.
Governance
The vacancy in top structure has to some extent had a negative effect in the moving of the municipality to its strategic direction. We acknowledge that performance contract for the Accounting officer and managers directly accountable to him were in place and evaluation has been done quarterly.
Risk management
Risk management has been adopted by the municipality and on a yearly basis risks are reviewed. The top 20 risks facing the municipality have been identified and a dedicated officer has been appointed to monitor the implementation thereof.
Establishment of Performance Audit Committee
The municipality further appointed a performance audit committee in accordance with Regulation 14(2) (a) of the Municipal Planning and Performance Management Regulations, 2001. The overall purpose/role of the Performance Audit Committee is to assist the Accounting Officer in discharging his/her responsibilities as stipulated in terms of Chapter 6 of the Municipal Systems Act no 32 of 2000. In order to curb the costs the municipality appointed only the chairperson with expertise in performance management and related and two members from the audit committee are seconded to sit in this committee. PAC and AC meetings are arranged back to back so that they sit same day in order to cut the costs.
Name of the Member
Position Date Appointed Number of meetings attended
Izak Bredenkamp Chairperson June 2010 2 of 2 Viren Magan PAC member June 2010 2 of 2 Oupa Makhale PAC member June 2010 2 of 2
LINKAGE WITH NATIONAL KEY PERFORMANCE AREAS FOR LOCAL GOVERNMENT
Sol Plaatje Municipality, through its IDP endorsed the 5 National Key Performance Areas, namely:
1. Local Economic Development 2. Basic and Sustainable Service Delivery and Infrastructure Development

105
3. Municipal Financial Viability and Management 4. Municipal Institutional Development and Transformation 5. Good Governance and Public Participation
Within each of the KPA’s the Municipality developed its own strategic objectives – to address its own unique key priority issues. These emphasis shifts were needed on the one hand to make the objectives attainable in the specific context of the SPM circumstances and on the other to emphasize the overarching objectives related to the space-economy and long term growth To ensure that the above objective will be met the following was done:
1. Strategic and operational plans with budget alignment for each area 2. The appointment of a performance manager 3. The implementation of a performance management system to allow for dash
board reporting 4. The signing of performance contracts with the MM and the section 56/57
managers 5. Quarterly performance reviews of the MM and sections 56/57 managers
The following remains a challenge that will be addressed in the future:
1. A more effective use of the performance management system to ensure that data is current and accurate
2. Further alignment of the KPA and KPI with the IDP budget and specific attention of making the KPI more specific and measurable for performance reviews
3. The implementation of performance management principles that will include corrective action for poor performance and reward for exceptional performance
5. Submission of in- year management and monthly/ quarterly reports in terms of the Municipal Finance Management Act and the Treasury Regulations.
The committee has been informed by management that the monthly/ quarterly in-year management reports were compiled and submitted timeously as required in terms of legislation, however we are of the opinion that the information reported to some extent lacked the detail description to enable the reader to understand and interpret correctly.
6. Evaluation of Financial Statements
We have:
Reviewed and discussed the audited annual financial statements to be included in the annual report, with the Auditor-General South Africa and the Accounting Officer.
Reviewed the Auditor-General South Africa’s management report and management’s response thereto;
Reviewed changes in accounting policies and practices ;
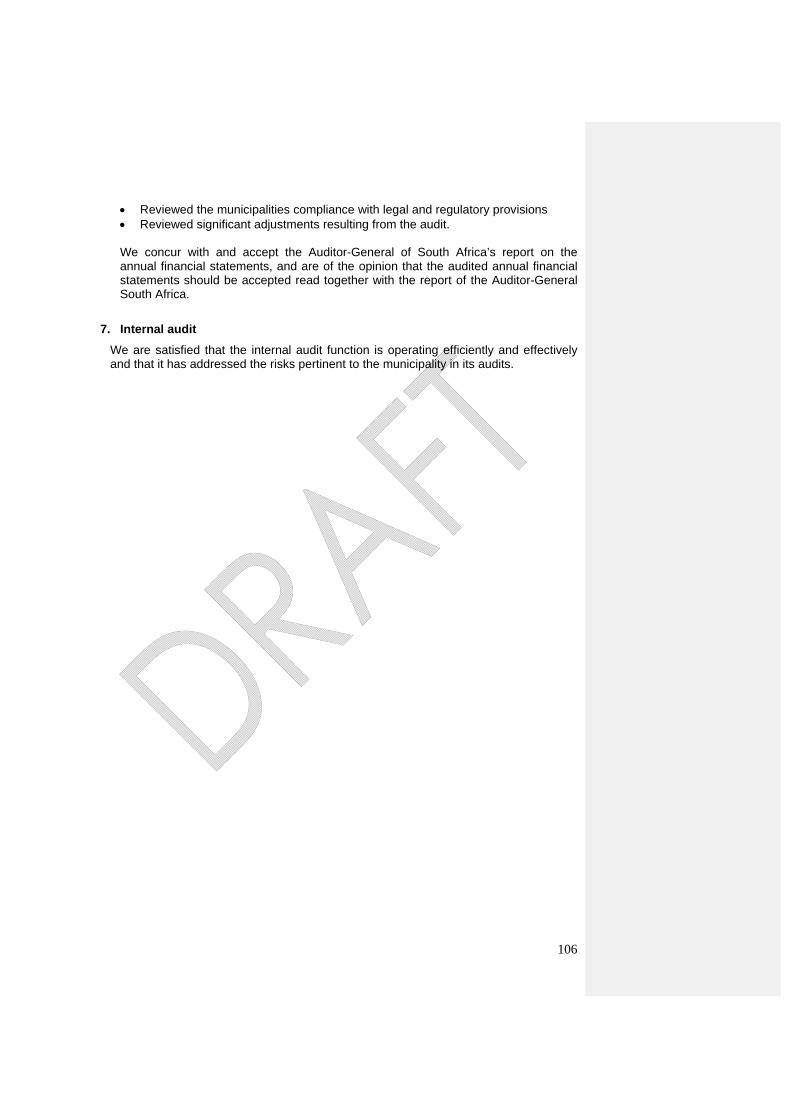
106
Reviewed the municipalities compliance with legal and regulatory provisions Reviewed significant adjustments resulting from the audit.
We concur with and accept the Auditor-General of South Africa’s report on the annual financial statements, and are of the opinion that the audited annual financial statements should be accepted read together with the report of the Auditor-General South Africa.
7. Internal audit
We are satisfied that the internal audit function is operating efficiently and effectively and that it has addressed the risks pertinent to the municipality in its audits.
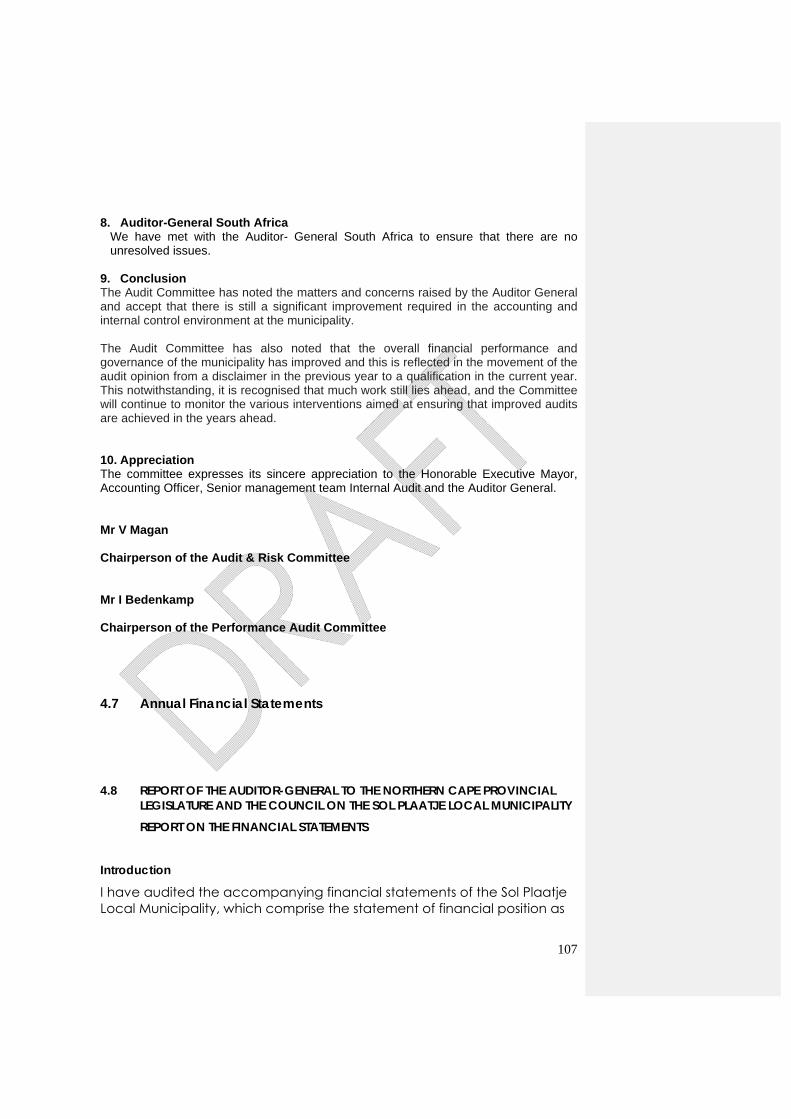
107
8. Auditor-General South Africa
We have met with the Auditor- General South Africa to ensure that there are no unresolved issues.
9. Conclusion The Audit Committee has noted the matters and concerns raised by the Auditor General and accept that there is still a significant improvement required in the accounting and internal control environment at the municipality. The Audit Committee has also noted that the overall financial performance and governance of the municipality has improved and this is reflected in the movement of the audit opinion from a disclaimer in the previous year to a qualification in the current year. This notwithstanding, it is recognised that much work still lies ahead, and the Committee will continue to monitor the various interventions aimed at ensuring that improved audits are achieved in the years ahead. 10. Appreciation The committee expresses its sincere appreciation to the Honorable Executive Mayor, Accounting Officer, Senior management team Internal Audit and the Auditor General. Mr V Magan Chairperson of the Audit & Risk Committee
Mr I Bedenkamp Chairperson of the Performance Audit Committee
4.7 Annual Financial Statements 4.8 REPORT OF THE AUDITOR-GENERAL TO THE NORTHERN CAPE PROVINCIAL
LEGISLATURE AND THE COUNCIL ON THE SOL PLAATJE LOCAL MUNICIPALITY REPORT ON THE FINANCIAL STATEMENTS
Introduction
I have audited the accompanying financial statements of the Sol Plaatje Local Municipality, which comprise the statement of financial position as
108
at 30 June 2011, and the statement of financial performance, statement of changes in net assets and cash flow statement for the year then ended, and a summary of significant accounting policies and other explanatory information, as set out on pages XX to XX. Accounting officer’s responsibility for the financial statements The accounting officer is responsible for the preparation and fair presentation of the financial statements in accordance with the South African Standards of Generally Recognised Accounting Practice (SA Standards of GRAP), the requirements of the Municipal Finance Management Act of South Africa, 2003 (Act No. 56 of 2003) (MFMA) and Division of Revenue Act of South Africa, 2010 (Act No. 1 of 2010, as amended) (DoRA), and for such internal control as management determines necessary to enable the preparation of financial statements that are free from material misstatement, whether due to fraud or error. Auditor-General’s responsibility As required by section 188 of the Constitution of the Republic of South Africa, 1996 (Act No. 108 of 1996) and section 4 of the Public Audit Act of South Africa, 2004 (Act No. 25 of 2004) (PAA), my responsibility is to express an opinion on the financial statements based on my audit. I conducted my audit in accordance with International Standards on Auditing and General Notice 1111 of 2010 issued in Government Gazette 33872 of 15 December 2010. Those standards require that I comply with ethical requirements and plan and perform the audit to obtain reasonable assurance about whether the financial statements are free from material misstatement. An audit involves performing procedures to obtain audit evidence about the amounts and disclosures in the financial statements. The procedures selected depend on the auditor’s judgement, including the assessment of the risks of material misstatement of the financial statements, whether due to fraud or error. In making those risk assessments, the auditor considers internal control relevant to the entity’s preparation and fair presentation of the financial statements in order to design audit procedures that are appropriate in the circumstances, but not for the purpose of expressing an opinion on the effectiveness of the entity’s internal control. An audit also includes evaluating the appropriateness of accounting policies used and the reasonableness of accounting estimates made by management, as well as evaluating the overall presentation of the financial statements. I believe that the audit evidence I have obtained is sufficient and appropriate to provide a basis for my qualified audit opinion.
109
Basis for qualified opinion Property, plant and equipment Property, plant and equipment amounting to R792 556 915 (2010: R749 931 361) was disclosed in note 9 to the financial statements. I was unable to obtain sufficient appropriate audit evidence to conclude on the completeness and existence of property, plant and equipment, due to the following: Property, plant and equipment amounting to R45 140 946 could not be verified due to incorrect or inaccurate locations included in the asset register. Physically identified infrastructure assets, community assets and other assets could not be traced to the asset register. Property, plant and equipment amounting to R926 211 was incorrectly included as repairs and maintenance instead of being capitalised as property, plant and equipment. Alternative procedures were attempted, including the utilisation of global positioning system locations and computer-assisted techniques, to search for the items causing the differences. However, the entity’s records did not permit the application of alternative audit procedures regarding the existence and completeness of property, plant and equipment. The SA Standards of GRAP, GRAP 17 Property, Plant and Equipment states that subsequent to initial recognition at cost, an item of property, plant and equipment should be carried at cost less accumulated depreciation and accumulated impairment losses or at a revalued amount less accumulated depreciation and accumulated impairment losses. Depreciation and accumulated depreciation as disclosed in note 9 to the financial statements were calculated: using incorrect useful lives; using incorrect depreciation percentages; using inaccurate purchase dates; not taking residual values into account; work in progress assets commissioned during the year not yet fully componentised depreciation calculated on land when in accordance with the accounting policy land is not depreciated. This resulted in depreciation amounting to R38 592 691 disclosed in the statement of financial performance being overstated by R9 685 553, accumulated depreciation amounting to R380 867 201 being overstated by R64 184 481, and accumulated surplus amounting to R835 632 534 being understated by R54 498 908. Investment property Investment property amounting to R115 349 700 (2010: R116 116 467) was disclosed in note 11 to the financial statements. The completeness of investment property could not be confirmed due to the investment property register not including all items identified as investment property. The entity’s records did not permit the application of alternative audit procedures regarding the completeness of amounts disclosed as investment property. Consequently, I did not obtain all the information and explanations I considered necessary to satisfy myself as to the completeness of investment property.
110
Intangible assets Intangible assets amounting to R2 485 582 (2010: R3 425 875) were disclosed in note 10 to the financial statements. The completeness of intangible assets could not be confirmed due to the intangible asset register not including all software and computer programs. The entity’s records did not permit the application of alternative audit procedures regarding the completeness of amounts disclosed as intangible assets. Consequently, I did not obtain all the information and explanations I considered necessary to satisfy myself as to the completeness of intangible assets. Receivables Trade receivables from exchange and non-exchange transactions amounting to R267 878 824 (2010: R268 976 993) were disclosed in notes 4 and 5 to the financial statements. The existence and valuation of receivables amounting to R131 855 166 (2010: R34 554 473) could not be confirmed, as sufficient appropriate audit evidence could not be obtained. Alternative procedures could not be performed due to the lack of available documentation. Paragraph 69 of SA Standards of GRAP 1 Presentation of Financial Statements states that the standard uses the term non-current assets to include tangible, intangible and financial assets of a long-term nature. Receivables as disclosed in the statement of financial position were overstated by R7 559 787 and long-term receivables understated by the same amount, due to receivables that were of a long-term nature being classified as current assets. Paragraph 4.2.7 of the municipal indigent management policy states that debt write-off for indigent households should occur every two years, subject to the re-verification of the indigent status. Consumer debtors as disclosed in the statement of financial position were understated by R24 346 564 and the bad debt write-off as disclosed in the statement of financial performance was overstated by the same amount, as the status of indigents was not verified before the write-off. Revenue The completeness of conventional metered water and electricity revenue amounting to R381 771 218 (2010: R304 172 557) included in service charges amounting to R571 405 692 (2010: R471 453 386), as disclosed in note 24 to the financial statements, could not be confirmed. Sufficient appropriate audit evidence could not be obtained, as meters identified for the current and prior year during the physical verification of water and electricity meters were not included in the meter reading listings. The readings on these meters had not been recorded, indicating a potentially material understatement of revenue. Alternative procedures could not be performed due to the lack of documented evidence regarding the reading of these meters. Irregular expenditure The completeness of irregular expenditure of R40 480 889 (2010: R102 005 664) as disclosed in note 45 to the financial statements could not be confirmed, as sufficient appropriate audit evidence could not be obtained to confirm that the municipality had adhered to proper supply chain management (SCM) processes. The weaknesses in the system over document control did not permit the application of alternative procedures.
111
Expenditure The occurrence and accuracy of expenditure amounting to R8 878 380 (2010: R1 418 284) included in general expenditure amounting to R212 983 878 (2010: R175 944 576), as disclosed in note 36 to the financial statements, could not be confirmed, as it was not supported by sufficient appropriate audit evidence. No alternative procedures could be considered in the absence of supporting documentation. Qualified opinion In my opinion, except for the possible effects of the matters described in the basis for qualified opinion paragraphs, the financial statements present fairly, in all material respects, the financial position of the Sol Plaatje Local Municipality as at 30 June 2011, and its financial performance and cash flows for the year then ended, in accordance with SA Standards of GRAP and the requirements of the MFMA and DoRA. Emphasis of matters I draw attention to the matters below. My opinion is not modified in respect of these matters: Significant uncertainties With reference to note 51.2 to the financial statements, the municipality is the defendant or the claimant in several lawsuits. The ultimate outcome of the matters cannot presently be determined, and no provision for any liability that may result has been made in the financial statements. Restatement of corresponding figures As disclosed in note 39 to the financial statements, the corresponding figures for 30 June 2010 have been restated as a result of errors discovered during 2010-11 in the financial statements of the Sol Plaatje Municipality at, and for the year ended, 30 June 2010. Material losses and impairments A significant provision for the impairment of receivables was created, which constituted 49,19% (R258 924 531) of the total trade receivable balance (R526 378 019). As disclosed in note 4.3 to the financial statements, the municipality wrote off bad debts amounting to R246 368 291 during the year, mainly consisting of indigent debtors. The write-off of the debtors was mainly due to the municipality not implementing its credit control policy related to indigent usage in excess of subsidised amounts. No measures were implemented to limit consumption by indigents in excess of their subsidised amounts. The municipality suffered a significant water loss during the year under review of 17,54% (2010: 15,38%), with an estimated value of R23 279 988 (2010: R10 126 587). REPORT ON OTHER LEGAL AND REGULATORY REQUIREMENTS In accordance with the PAA and in terms of General Notice 1111 of 2010 issued in Government Gazette 33872 of 15 December 2010, I include below my findings on the annual performance report as set out on pages XX to XX and material non-compliance with laws and regulations applicable to the municipality.
112
Predetermined objectives Usefulness of information The following criterion is relevant to the findings below: Measurability: Indicators are well defined and verifiable, and targets are specific, measurable and time bound. Audit findings Planned and reported targets were not time bound (measurability) For the selected programme (basic service delivery), 14% of the planned and reported targets were not time bound in identifying the nature and the required level of performance. Reliability of information The following criteria are relevant to the findings below: Validity: Actual reported performance has occurred and pertains to the entity. Accuracy: Amounts, numbers and other data relating to reported actual performance have been recorded and reported appropriately. Audit findings Reported performance against targets was not valid and accurate when compared to source information (reliability) The following material reported target was recalculated and did not agree to the information disclosed in the annual performance report:
For the selected programme (basic service delivery), 29% of the reported targets were not valid and accurate based on the source information or evidence provided. The validity and accuracy of the reported performance against targets could not be confirmed as no supporting source information was provided (reliability) For the selected programme (basic service delivery), the accuracy of 10% of the reported targets could not be established, as sufficient appropriate audit evidence could not be provided. Compliance with laws and regulations Strategic planning and performance management Contrary to the requirement of section 41 of the MSA, the system applied by the municipality was not devised in such a way that it could serve as an early warning indicator of underperformance. The key performance indicators did not include all general key performance indicators as set out by Northern Cape’s provincial growth and development strategy for 2014, applicable to the municipality, as prescribed in terms of section 43(1) of the MSA. Budgets
Target Reported in performance report Recalculated Electricity connection
336 houses 294 houses
113
The municipality incurred expenditure in excess of the limits of the amounts provided for in the votes in the approved budget, in contravention of section 15 of the MFMA. Annual financial statements, performance report and annual report The financial statements submitted for auditing were not prepared in all material respects in accordance with the requirements of section 122 of the MFMA. Material misstatements in current assets, liabilities, revenue, expenditure and disclosure items identified by the auditors were subsequently corrected, but the uncorrected material misstatements resulted in the financial statements receiving a qualified audit opinion. The municipal council did not adopt an oversight report containing the council’s comments on the annual report within two months from the date on which the 2009-10 annual report was tabled in the council, as required by section 129(1) of the MFMA. Human resource management Some employees earned overtime in excess of 30% of their monthly compensation, contrary to section 10(1) of the Basic Conditions of Employment Act of South Africa, 1997 (Act No. 75 of 1997). Contrary to the Income Tax Act of South Africa, 1994 (Act No. 164 of 1994), no employee tax was deducted on ex gratia payments to employees. The councillor remuneration paid was in excess of the amount gazetted, contrary to section 167 of the MFMA. Procurement management The accounting officer did not take all reasonable steps to ensure that the municipality had and maintained a management, accounting and information system that recognised expenditure when it was incurred, as required by section 65(2)(b) of the MFMA. Sufficient appropriate audit evidence could not be obtained that invitations for competitive bidding had been advertised for the required minimum period, as per SCM Regulation 22(1) and 22(2). The performance of contractors and providers was not monitored on a monthly basis, as required by section 116(2)(b) of the MFMA. The contract performance measures and the methods whereby they were monitored were insufficient to ensure effective contract management, as per the requirements of section 116(2)(c) of the MFMA. Five service providers failed to declare if they were in the service of the state, as required by SCM Regulation 13(c). Awards were made to these providers, who were persons in the service of other state institutions, in contravention of the requirements of SCM Regulation 44. Two contracts were extended or modified to the extent that competitive bidding processes were circumvented, contrary to the requirement of a fair SCM system in section 112 of the MFMA. Two contracts were extended without tabling the reasons for the proposed amendment in the council of the municipality, as required by section 116(3) of the MFMA. Sufficient appropriate audit evidence could not be obtained that contracts and quotations had been procured in accordance with legislative requirements and the SCM policy.
114
Asset management The accounting officer did not take all reasonable steps to ensure that the municipality had and maintained an effective system of internal control for assets, as required by section 63(2)(c) of the MFMA. Revenue management The credit control and debt collection policy was not maintained and implemented for all debtors in arrears, as required by section 96(b) of the MSA. INTERNAL CONTROL In accordance with the PAA and in terms of General Notice 1111 of 2010 issued in Government Gazette 33872 of 15 December 2010, I considered internal control relevant to my audit, but not for the purpose of expressing an opinion on the effectiveness of internal control. The matters reported below are limited to the significant deficiencies that resulted in the basis for the qualified opinion, the findings on the annual performance report and the findings on compliance with laws and regulations included in this report. Leadership The council did not exercise specific oversight responsibility over financial and performance reporting, compliance with laws and regulations as well as internal control. The action plans compiled to address the previous year’s audit findings were not monitored and reviewed to determine if the reported progress on the plans related to actual improvements. The delays in the approval of management’s recommendation to consolidate supply chain and contract management led to management being unable to address weaknesses in asset management and SCM, which resulted in non-compliance with the relevant regulations. In turn, non-compliance with SCM prescripts gave rise to irregular expenditure. Management proposed the establishment of a fully fledged asset management unit within the finance directorate to enable the accounting officer to exercise his responsibilities as required in terms of section 63(2)(c) of MFMA. As this unit was not approved and established in time it led to insufficient capacity within the municipality to deal with the responsibilities of identifying, safeguarding and maintaining the movable and immovable assets of the municipality. Exception reports were not developed and utilised on a monthly basis to ensure the completeness, existence and accuracy of transactions within the areas where high volumes of transactions were processed, such as revenue, receivables, salaries and wages. The chief financial officer’s focus on the development and enhancement of internal controls within financial management responsibilities led to the inadequate monitoring of these controls during the year, as some pertinent reconciliations were not performed as per policy requirements. The leadership did not adequately monitor the municipality’s compliance with laws, regulations and internally designed policies and procedures, as management mainly focused on the establishment and strengthening of the internal control environment. As a result, material non-compliance issues were noted.
115
Financial and performance management The different directorates within the municipality did not take collective responsibility for the disclosures within the financial statements, performance reporting and compliance with laws and regulations. The control environments related to financial and performance reporting did not reside within the budget and treasury office or the integrated development plan unit, but with every directorate within the municipality. The lack of a fully fledged asset management section within the finance directorate led to the inability to componentise newly acquired infrastructure assets and update asset registers timeously, resulting in significant calculation errors on depreciation. The financial statements and other information to be included in the annual report were not adequately reviewed for completeness and accuracy prior to submission for auditing. The financial statements were subject to material corrections resulting from the audit, which can be attributed to the lack of a risk assessment, weaknesses in the design and implementation of internal control in respect of financial management and financial reporting, and weaknesses in the information systems. This also resulted in the prior year’s audit findings not being substantially addressed in certain instances. The municipality did not prepare quarterly interim financial statements to identify and rectify any financial statement errors early on. The chief financial officer and the municipal manager should review the financial statements for completeness and accuracy, and submit them to the internal audit unit for review. The municipal council did not write off debtors confirmed to be non-recoverable, resulting in a qualification on the existence of debtors. The municipality did not review and monitor compliance with applicable laws and regulations. The municipality did not have a delegated employee that had been trained and had the necessary technical skills to address and monitor new legislative changes affecting the municipality. Record management and maintenance disciplines were not included in the daily key controls, and reviewed and monitored by a management member at the appropriate level. Governance Due to the focus on financial sustainability and infrastructure development for service delivery, monitoring and supervision were not satisfactorily undertaken to enable an assessment of the effectiveness of internal controls over financial and performance reporting. Internal controls were not monitored to prevent, detect and correct material misstatements in financial reporting and reporting on predetermined objectives. The capacity of the internal audit unit had to be supplemented, as consultants were sourced to assist with the internal audit plan. The recommendations of the internal audit unit were not implemented. OTHER REPORTS Investigations
116
Investigations are being conducted by the Public Protector to probe the manner in which SCM processes were adhered to. The investigations were still ongoing at the reporting date. Kimberley 30 November 2011
7.1 The Audit Action Plan – Clean Audit The municipality developed the action plan to address audit findings The major focus of the action plan is to address assets, revenue related qualifications and other compliance matters that were emphasised in the audit report (performance management report, compliance with legislation There are engagements with National Treasury to resolve some of the issues raised and the Auditor General is kept abreast of the progress
117
Limitation of scope is a major risk but there are mitigating programmes that have been put in place to ensure that documents are properly managed and responsibilities are assigned to custodians in each section especially in the finance All efforts are put in place to ensure that an improved audit opinion is achieved 7.1.1 Action Plan Achievements A compliant asset register Componentised infrastructure Clearing of disclosure related qualifications Reduction of limitations of scope Improved internal control environment through regular policy reviews and development of procedure manuals Review of organisational structure with the view of strengthening supervisory controls and segregation of powers More coordinated audit process Increase in transparent reporting in line with legislative requirements Maintain an acceptable confidence level on the going concern of the municipality THE ANNUAL FINANCIAL STATEMENTS The Accounting Officer of the municipality submitted the annual financial statements to the Auditor General on the 30th of August 2011 in line with the requirements of the Municipal Finance Management Act (56 of 2003) section 126 (1)(a). The audited financial statements for the year ended 30 June 2011 will be added to this report once the annual audit has been completed. The audited financial statements are included as an annexure to this report. Report of the Audit Committee CHAPTER 5 - FUNCTIONAL AREA SERVICE DELIVERY REPORTING

118
Attached as Annexure A is a comprehensive list of information on each functional area (GFS sub-function) as provided by the Sol Plaatje Municipality. It includes an overview, description and detailed analysis of each function.