Soil water regime under barley with long-term tillage–residue systems
16
Ž . Soil & Tillage Research 45 1998 59–74 Soil water regime under barley with long-term tillage–residue systems Baldev Singh a, ) , D.S. Chanasyk b , W.B. McGill b a Department of Soil and Water Engineering, Punjab Agricultural UniÕersity, Ludhiana, India b Department of Renewable Resources, UniÕersity of Alberta, Edmonton, Alberta, Canada Received 20 March 1997; accepted 13 October 1997 Abstract It is imperative to develop management practices that help maintain a favorable soil water regime for crop growth as well as conserve the soil. This paper reports on soil water dynamics of a Ž . fine-textured and well-drained Typic Cryoboroll Black Chernozemic cropped to spring barley Ž . Hordeum Õulgare L. in western Canada under three tillage–residue systems: no-tillage with straw on the surface, and roto-tillage to a 10-cm depth with straw removed or incorporated. Measurements were made in the 9th and 10th year after treatment establishment. In the shallow Ž zone of 0–7.5 cm, soil water content was generally significantly greater by a maximum 8%, . absolute in the no till qstraw treatment plots than that in either of the two-tillage treatment plots in both study years and was affected more by tillage than by straw. To a depth of 20 cm, the no till qstraw treatment plots had as much as 12 mm more water than did the till qno straw treatment plots, with the till qstraw treatment plots having intermediate values generally closer to those of the no till qstraw treatment plots. To this depth, early in the season, straw was the main factor affecting soil water; later, tillage became important. The trend in soil water content at all depths was no till qstraw )till qstraw )till qno straw, with similar and wetter soil water regimes for the two straw-retaining treatments most of the time than for the till qno straw treatment. The importance of straw in soil water conservation is clearly demonstrated. Grain and dry matter water use efficiencies for the no till qstraw treatment plots were significantly lower Ž . 22 and 15%, respectively than those for the two-tillage treatments in only one of the two study years, likely due to climatic conditions which favored the generally drier tillage treatments. q 1998 Elsevier Science B.V. Keywords: Soil water regime; Tillage system; No till; Crop residues; Barley ) Corresponding author. 0167-1987r98r$19.00 q 1998 Elsevier Science B.V. All rights reserved. Ž . PII S0167-1987 97 00067-6
-
Upload
baldev-singh -
Category
Documents
-
view
214 -
download
1
Transcript of Soil water regime under barley with long-term tillage–residue systems

Ž .Soil & Tillage Research 45 1998 59–74
Soil water regime under barley with long-termtillage–residue systems
Baldev Singh a,), D.S. Chanasyk b, W.B. McGill b
a Department of Soil and Water Engineering, Punjab Agricultural UniÕersity, Ludhiana, Indiab Department of Renewable Resources, UniÕersity of Alberta, Edmonton, Alberta, Canada
Received 20 March 1997; accepted 13 October 1997
Abstract
It is imperative to develop management practices that help maintain a favorable soil waterregime for crop growth as well as conserve the soil. This paper reports on soil water dynamics of a
Ž .fine-textured and well-drained Typic Cryoboroll Black Chernozemic cropped to spring barleyŽ .Hordeum Õulgare L. in western Canada under three tillage–residue systems: no-tillage withstraw on the surface, and roto-tillage to a 10-cm depth with straw removed or incorporated.Measurements were made in the 9th and 10th year after treatment establishment. In the shallow
Žzone of 0–7.5 cm, soil water content was generally significantly greater by a maximum 8%,.absolute in the no tillqstraw treatment plots than that in either of the two-tillage treatment plots
in both study years and was affected more by tillage than by straw. To a depth of 20 cm, the notillqstraw treatment plots had as much as 12 mm more water than did the tillqno strawtreatment plots, with the tillqstraw treatment plots having intermediate values generally closer tothose of the no tillqstraw treatment plots. To this depth, early in the season, straw was the mainfactor affecting soil water; later, tillage became important. The trend in soil water content at alldepths was no tillqstraw) tillqstraw) tillqno straw, with similar and wetter soil waterregimes for the two straw-retaining treatments most of the time than for the tillqno strawtreatment. The importance of straw in soil water conservation is clearly demonstrated. Grain anddry matter water use efficiencies for the no tillqstraw treatment plots were significantly lowerŽ .22 and 15%, respectively than those for the two-tillage treatments in only one of the two studyyears, likely due to climatic conditions which favored the generally drier tillage treatments.q 1998 Elsevier Science B.V.
Keywords: Soil water regime; Tillage system; No till; Crop residues; Barley
) Corresponding author.
0167-1987r98r$19.00 q 1998 Elsevier Science B.V. All rights reserved.Ž .PII S0167-1987 97 00067-6

( )B. Singh et al.rSoil & Tillage Research 45 1998 59–7460
1. Introduction
Soil water dynamics result from complex interactions among current and pastoccurrences of weather conditions, soil properties, cropping patterns and agricultural
Ž .management practices De Jong and Bootsma, 1988 . In the absence of irrigation, suchas over a major part of the Canadian prairies, crop success largely depends on the soilwater content at seeding, and on growing-season precipitation and efficiency of itsstorage in the soil profile. Thus, it is imperative to develop and utilize managementpractices that help maintain a favorable soil water regime for optimal crop growth anddevelopment.
The soil water regime represents a balance among four processes: evaporation,transpiration, infiltration and internal drainage. These processes are controlled, in part,by the water retention and transmission properties of soil. Tillage–residue managementsystems variably affect these soil hydraulic properties, and thus alter the soil waterregime. No-tillage systems maintain a substantial crop residue cover on the soil, whichmay increase infiltration and reduce water runoff. In addition, residue cover reduces
Ževaporation and can increase snow trapping Moody et al., 1963; Gauer et al., 1982;.Smika and Unger, 1986; Rydberg, 1990 . Thus, no-tillage systems generally result in a
more efficient storage of precipitation. To the extent that tillage–residue systems alterrooting depth, they regulate water uptake and thereby indirectly modify soil waterregimes.
Many studies reported greater soil water contents under conservation tillage systemsŽ . Ž .with surface residues than under conventional tillage, both in drier arid and semiarid
Ž . Žand wetter subhumid and humid regions e.g., Gauer et al., 1982; Grevers et al., 1986;. Ž .Heer and Krenzer, 1989; Radford et al., 1992 . Jones et al. 1969 and Blevins et al.
Ž .1971 attributed higher soil water content under reduced tillage systems to reducedŽ .evaporation mainly due to a greater residue cover and greater ability to store water
Ž .under no-tillage systems. For a silt loam in Kentucky a relatively humid location ,evaporation from May through September was 2.4 times greater under conventional
Ž .tillage than under no-tillage Phillips, 1984 . This difference provided 18% more waterŽ .for transpiration by no-tillage corn Zea mays L. than for conventional tillage corn
during the growing season. Whether the increased soil water under conservation tillagesystems actually benefits crop growth depends on prevailing micrometeorologicalconditions, crop growth stage, water retention properties of the soil and other conditionsin the soil environment that may limit plant growth.
Not much is known regarding the soil water dynamics as affected by long-termtillage–residue management under the soil, site and agroclimatic conditions of westernCanada. The objective of the present research was to quantify the dynamics of the soil
Ž .water regime during a crop barley growing season under three long-term tillage andresidue management systems on a well-drained, well aggregated and fine-textured Typic
Ž .Cryoboroll Black Chernozemic in central Alberta. An additional objective was todiscover if the soil water supply during the growing season was adequate for cropgrowth under these management systems.

( )B. Singh et al.rSoil & Tillage Research 45 1998 59–74 61
2. Materials and methods
2.1. Experimental site and soil
The research was conducted in the 9th and 10th year after establishment of tillage–re-sidue management systems on field plots located at the Ellerslie Research StationŽ X X .53825 N, 113833 W, 694 m above sea level of the University of Alberta. The soil wasdeveloped from lacustrine deposits of the Proglacial Lake Edmonton. It is classified as
Žfine loamy, mixed, Typic Croyoboroll according to Soil Taxonomy Pluth, D.J., personal.communication, 1990 and a Black Chernozemic according to the Canadian System of
Ž . ŽSoil Classification Crown and Greenlee, 1978 . It is a clay loam 39% clay, 41% silt.and 20% sand in the 0–15 cm depth with 9.8% organic matter. It is naturally well
aggregated, is nearly level, has good internal drainage and has a moderate swell-shrinkpotential.
Ž .The climate is subhumid, cryoboreal. The 30-year 1951–1980 average daily maxi-Ž .mum and minimum air temperatures are 7.6 and 4.18C whole year , 22.4 and 9.68C
Ž . Ž .July and y11.5 and y21.78C January . The average annual precipitation is 452 mmŽ .of which 75% occurs as rain and the rest as snow. Approximately 60% 274 mm of the
Ž .total precipitation occurs during the growing season May–August . Ellerslie has anaverage 109 frost-free days per year. Grain barley is the most popular crop in the regionand it is raised without irrigation.
2.2. Tillage–residue treatments
Ž . Ž .Three systems were studied: 1 no-tillage, threshed straw retained on the surface; 2Ž .conventional tillage roto-tillage to a 10-cm depth , threshed straw retained and incorpo-
Ž .rated into the surface soil; and 3 conventional tillage, all straw and most of the stubbleremoved. For the no-tillage treatment, crop was seeded directly at a 5-cm depth with aseed drill. Conventional tillage involved roto-tillage to a depth of approximately 10 cmin late fall and at seeding. The treatments, replicated four times in a randomizedcomplete block design, were repeated each year. The plots were continuously cropped tospring grain barley. The growing season extended from May 19 to August 29 in 1988and from May 26 to September 1 in 1989. The crop was adequately fertilized. Weedswere controlled mainly with herbicides.
3. Measurements and calculations
3.1. Soil water
Soil water content was measured at seeding, harvest and at approximately weeklyŽintervals in all plots, with a pre-calibrated neutron probe depth moisture gauge Model
.503 Hydroprobe, Campbell Pacific Nuclear, Martinez, CA . One open-ended neutronŽ .probe access tube aluminum, 50 mm i.d. was installed in each plot with a hydraulic

( )B. Singh et al.rSoil & Tillage Research 45 1998 59–7462
coring unit. Readings were taken in 10-cm increments at depths of 15 to 95 cm. Two16-s readings were taken at each depth. The reading at 15 cm was used as a measure ofsoil water in the 7.5- to 20-cm depth. For all other readings, a 10-cm diameter sphere of
Ž .influence was used. Surface 0–7.5 cm soil water content was measured on fourlocations adjacent to an access tube using another neutron probe in conjunction with an
Ž .hydrogenous shield Chanasyk and Naeth, 1988 .Total profile soil water to a given depth was calculated as:
n
TSW s Ø PTÝz Õ i iis1
Ž . Ž . nwhere TSW samount of water mm present in depth z mm of the soil; zsÝ T ;z is1 iŽ . Ž 3 y3.T s thickness mm of soil layer i; Ø svolumetric water content m m of soili Õ i
layer i; and nsnumber of layers in the considered soil profile. In this study controldepths of 20, 50 and 100 cm were chosen for comparison of TSW among treatments.
Rainfall and air temperature were measured during the growing season within 50 mof the research site. Long-term records of these data for the site were obtained from
Ž .Environment Canada 1982 .
3.2. Water use efficiency
Grain and straw yields were determined by hand-harvesting the crop from a central2.3-m2 area in each plot. Grain yield was expressed on an oven-dry basis and straw
Ž .yield on an air-dry basis. Water use efficiency was calculated as the mass kg of grainŽ . Ž .or dry matter produced per unit land area ha per unit water use mm . Dry matter at
harvest was the sum of grain and straw yields.
3.3. Statistical analyses
ŽFor each measurement date, soil water content at selected depths 7.5, 15, 45 and 85. Ž .cm was statistically analyzed using a completely randomized block design RBD . Total
Ž .soil water TSW computed for 0–20, 0–50 and 0–100 cm depths was similarlyanalyzed. Data were tested for homogeneity of variance using Cochran and Bartlett–Boxtests. The UANOVA procedure of the SPSSx statistical program was used for analysisof variance. The least square means were computed and used when an observation was
Ž .missing. The F-test Steel and Torrie, 1980 was used to determine significant tillageeffects, and the least significant difference test was used to separate treatment means at a5% level of significance.
4. Results and discussion
4.1. Growing season precipitation and air temperature
Total precipitation for the 1988 and 1989 growing seasons was 323 and 293 mm,respectively. The May to August precipitation was 18% more and 7% more than the

( )B. Singh et al.rSoil & Tillage Research 45 1998 59–74 63
Table 1Ž .Rainfall and average air temperatures during the growing season May–August of 1988 and 1989, and the
long-term normal for the same months at the study site
Month Precipitation Air temperaturea1988 1989 LTN 1988 1989 LTN
May 17 53 45 14.7 10.5 10.3June 110 61 78 16.7 15.0 14.0July 118 110 84 16.4 17.5 16.0August 78 69 67 15.7 15.5 14.9Total 323 293 274Average 15.9 14.6 13.8
a Ž .Long-term normal 1951–1980 .
Ž .1951–1980 average in 1988 and 1989, respectively Table 1 . Rainfall in 1989 was morefrequent and better distributed though smaller in amount than in 1988. It rained on 58days during the 99-day growing season in 1989 compared with 35 days during the103-day growing season in 1988. There were two distinct rainless periods in 1988, oneof 10 days immediately after sowing and a second of 18 days from July 19 to August 5.
Ž .Average May–August inclusive air temperature was 15.98C in 1988 and 14.68C inŽ .1989 with a long-term normal LTN for the period of 13.88C. Each month in this period
Ž .in 1988 and 1989 had mean air temperatures)LTN, more so in 1988 Table 1 . May1988 was particularly warm and dry with the average temperature being 4.28C greaterthan the LTN for the month. Only 17-mm rain was received in this month as comparedwith the long-term average of 45 mm.
4.2. Soil water content with time
Ž .Water content of the 0–7.5 cm depth interval Fig. 1a and b was the most dynamicof all depth intervals. Soil water content in this depth interval was generally significantlygreater in the no tillqstraw treatment than that in either of the two tillage treatments inboth 1988 and 1989, with these latter two treatments generally having similar soil waterto 7.5 cm both years. The tillqno straw treatment was generally the driest. There weresignificant differences in soil water in this depth interval at the start of both growingseasons, but there were none by the end of them. In both years, soil water content for the0–7.5 cm depth interval was greater at the end of the growing season than at the start.
After an appreciable rain, soil water contents to 7.5 cm for all treatments were similarŽnote especially the period in 1989, 35–50 days after seeding and again at the end of the
.growing season in 1989 . However, with continued dry conditions, the no tillqstrawtreatment plots had an appreciably greater water content than the tillqno straw
Žtreatment plots, the difference on an absolute basis reaching as high as 8% note.especially the period in 1989, 58 to 67 days after seeding . This is likely a result of
reduced evaporation due to a substantial residue cover in the no-till treatment plotsŽ .Singh et al., 1994 .
( )B. Singh et al.rSoil & Tillage Research 45 1998 59–7464
Ž . Ž . ŽFig. 1. Total soil water content of the 0–7.5 cm depth interval in a 1988 and b 1989. Soil water contentsŽ .on a given date with the same letters are not significantly different P F0.05 .
Ž .Laboratory equivalent of y1500 kPa wilting point soil water contents for the 0–7.5cm zone were 25.2, 22.1 and 20.8% for the no tillqstraw, tillqstraw and tillqno
Ž .straw treatments, respectively Singh et al., 1996 . Thus, soil water contents were belowŽwilting point in the uppermost 7.5 cm zone at three sampling times in 1988 days 16, 62
. Ž .and 72 after seeding and also on three sampling days in 1989 days 12, 25 and 78 .However, treatment trends were dissimilar in 1988 and 1989. For example, on theabove-mentioned three sampling dates in 1988 all treatment plots had similar soil water

( )B. Singh et al.rSoil & Tillage Research 45 1998 59–74 65
contents. On the three days in 1989, only the two tillage treatment plots had watercontents below the wilting point, with the soil water contents of no tillqstraw treatment
Ž .plots being at least 6% vrv higher than those of the two tillage treatment plots.ŽHowever, no permanent wilting of the crop was observed at the site plant water status
.was not measured . This means that the plants were extracting water below the y1500ŽkPa potential in the 0–7.5 cm layer approximately 50% of the total root mass and 43%
Ž .of the total root length at grain formation stage were present in this zone Singh, 1991 ,the soil below the 7.5-cm depth was able to supply water to the plants at a rate sufficientto meet the evapotranspiration requirements andror the plants were stressed onlytemporarily. Root extraction below y1500 kPa has been observed in several instancesŽ .Marshall and Holmes, 1988 .
Ž .Laboratory equivalent of y10 kPa field capacity soil water contents for the 0–7.5cm zone were 38.3, 37.7 and 37.6% for the no tillqstraw, tillqstraw and tillqno
Ž .straw treatments, respectively vrv; Singh et al., 1996 . Soil water contents in theŽ .uppermost 7.5 cm approached field capacity only once in 1988 day 81 , yet came close
Ž .to it several times in 1989 days 8, 16, 43, 87 and 99 after seeding . The soil watercontents on day 43 after seeding were the highest recorded during the 2 years of soilwater measurements. There were no significant differences due to treatment in soil wateron this date nor on the measurement date before nor on the date after, indicating a ratherwet period. Interestingly, immediately after this period, the no tillqstraw treatment
Žplots had a significantly greater soil water content in this zone for almost 3 weeks the.two tillage treatment plots had similar soil water contents during this period . Generally,
the two tillage treatment plots had similar soil water contents throughout the entire studyŽ .period being significantly different on only one date in each of the two years . This
indicates that in the relatively shallow zone of 0–7.5 cm, tillage affects soil watercontent more than straw management.
Ž .Larney and Lindwall 1995 found that the available water in the 0–15 cm depthŽ .interval in the spring under winter wheat Triticum aestiÕum L. was greatest with zero
Ž . Ž .tillage. Unger and McCalla 1980 and Smika and Unger 1986 , after a review ofliterature, concluded that various tillage systems altered the soil water regime primarilythrough their effects on residue cover which reduced evaporation and increased infiltra-
Žtion. In this well aggregated soil, the infiltration rate was high with all treatments Singh.et al., 1996 ; therefore, infiltration and runoff might be only small factors in the
observed soil water content differences due to treatment differences. Blevins et al.Ž .1971 attributed greater soil water contents under conservation tillage systems toreduced evaporation under residue cover, and also to a greater ability to store waterunder no-tillage due to different pore size distributions. In the present study, treatmentdifferences in soil water retention, particularly near the ‘field capacity’ range, were very
Ž .small Singh et al., 1996 .Water content at a 15-cm depth was always the lowest in tillqno straw treatment
plots in both years, being generally significantly different from that in the other twoŽ .treatment plots Fig. 2a and b . The two straw treatments resulted in significantly
different soil water contents on only 3 of 13 measurement dates in 1988 and only 2 of14 dates in 1989. The similar soil water contents for the straw treatments at this depthshowed straw retention to be more important to soil water retention than tillage, opposite

( )B. Singh et al.rSoil & Tillage Research 45 1998 59–7466
Ž . Ž .Fig. 2. Total soil water content at the 15-cm depth in a 1988 and b 1989. Soil water contents on a givenŽ .date with the same letters are not significantly different P F0.05 .
Žto the trend observed for the uppermost 7.5 cm. Only once in each year between 70 and.80 days after seeding , and only in tilled treatment plots, did the water content at this
depth approach the wilting point. In both years, the tillqstraw treatment plots generallyhad a marginally higher water content at the 15-cm depth than did the no tillqstrawtreatment plot up to about mid-season. Later in the season, its water content was mostlybetween those for the other two treatments, followed by a similarity to that for thetillqno straw treatment for the last 20 days of the growing season. A vigorous crop in
Ž .the tillqstraw system plots Singh, 1991 probably extracted more water for transpira-tion in the later stages of crop growth.

( )B. Singh et al.rSoil & Tillage Research 45 1998 59–74 67
In both years, the tillqno straw treatment plots had the lowest water content even atdepths of 45 cm and 85 cm, the difference due to no tillqstraw and tillqno straw
Ž . Ž .treatments generally being -3% vrv absolute data not shown . Treatment differ-ences were non-significant at all times at the 85-cm depth in both years, and at all but 3times in 1988 and one time in 1989 at the 45-cm depth.
( )4.3. Total soil water TSW
The no tillqstraw treatment plots had significantly more total soil water in 0–20-cmŽ .depth interval TSW20 than the tillqno straw treatment plots at all measurement times
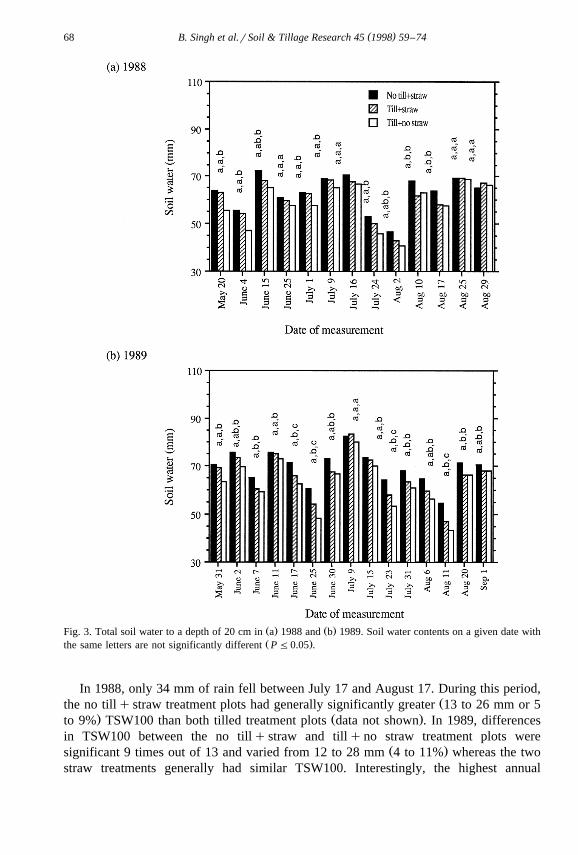
Ž .in both years, except near harvest in 1988 Fig. 3a and b . The difference varied betweenŽ . Ž . Ž . Ž .3 mm 6% and 9 mm 18% in 1988 and between 2 mm 3% and 12 mm 26% inŽ .1989. Note that percentage values in the brackets are relative differences. The
tillqstraw treatment plots generally had intermediate TSW20, usually closer to that forthe no tillqstraw treatment plots up to nearly mid-season, and to that for the tillqno
Žstraw treatment plots during dry periods note especially August 10 and 17, 1988 and all.3 July dates in 1989 . Thus, early in the season, straw appeared to be the main factor
affecting soil water; later tillage was paramount.Precipitation in August 1988 recharged soil water in all treatment plots, resulting in
Ž .non-significant differences in TSW20 on August 25 and 29, 1988 Fig. 3a . In laterAugust 1989, the usual pattern of significantly higher TSW20 in no tillqstraw than inthe tillqno straw treatment plots was evident, as was the intermediate position due to
Ž .the tillqstraw treatment on September 1 Fig. 3b .ŽLowest annual TSW20 was measured on August 2, 1988, and August 11, 1989 Fig.
.3a and b . The magnitudes of TSW20 were similar due to a given treatment for bothyears, likely indicating major depletion of available soil water prior to these dates.Highest annual TSW20 occurred on July 16, 1988 and July 9, 1989, and there were nosignificant differences in TSW on these dates, indicating equivalent recharge efficienciesof the three treatments.
Ž .Trends in total water to a 50-cm depth TSW50 was generally similar to those inŽ .TSW20 data not shown . Differences in TSW50 due to the no tillqstraw and tillqno
straw treatments were generally significant on more measurement dates in 1989 than inŽ . Ž1988, and varied from 6 to 16 mm 4 to 12% in 1988 except the last two
. Ž .measurements , and 4 to 18 mm 2 to 12% in 1989.General trends of total soil water due to treatments in the 0–100 cm profile
Ž . ŽTSW100 were remarkably similar to those of 0–20 and 0–50 cm depths data not. Žshown , implying that the soil water regime was affected to a 100-cm depth the greatest
.depth monitored by the tillage–residue systems. Differences due to treatments wereagain significant for a greater number of measurements in 1989 than in 1988, a generalreflection of different rainfall amounts and distribution in the two years. Other microme-teorological parameters such as total solar and net radiation, air temperature, relativehumidity and wind speed might also have contributed to the observed differencesthrough their influence on evapotranspiration. These results are similar to those of
Ž .Radford et al. 1992 who found that in southwestern Queensland zero tillage withstubble resulted in the greatest soil water accumulation during fallow periods, but whenstubble was removed, zero tillage resulted in extremely low water storage.
( )B. Singh et al.rSoil & Tillage Research 45 1998 59–7468
Ž . Ž .Fig. 3. Total soil water to a depth of 20 cm in a 1988 and b 1989. Soil water contents on a given date withŽ .the same letters are not significantly different P F0.05 .
In 1988, only 34 mm of rain fell between July 17 and August 17. During this period,Žthe no tillqstraw treatment plots had generally significantly greater 13 to 26 mm or 5
. Ž .to 9% TSW100 than both tilled treatment plots data not shown . In 1989, differencesin TSW100 between the no tillqstraw and tillqno straw treatment plots were
Ž .significant 9 times out of 13 and varied from 12 to 28 mm 4 to 11% whereas the twostraw treatments generally had similar TSW100. Interestingly, the highest annual

( )B. Singh et al.rSoil & Tillage Research 45 1998 59–74 69
Ž . ŽTSW100 occurred on June 15, 1988 same date as TSW20 and on July 9, 1989 also.same date as for TSW20 . There were no significant differences in TSW100 due to
treatments on six consecutive dates between June 15 and July 24 in 1988, but only onJune 30 and July 15, 1989. Average profile soil water on these dates exceeded 30%Ž .vrv .
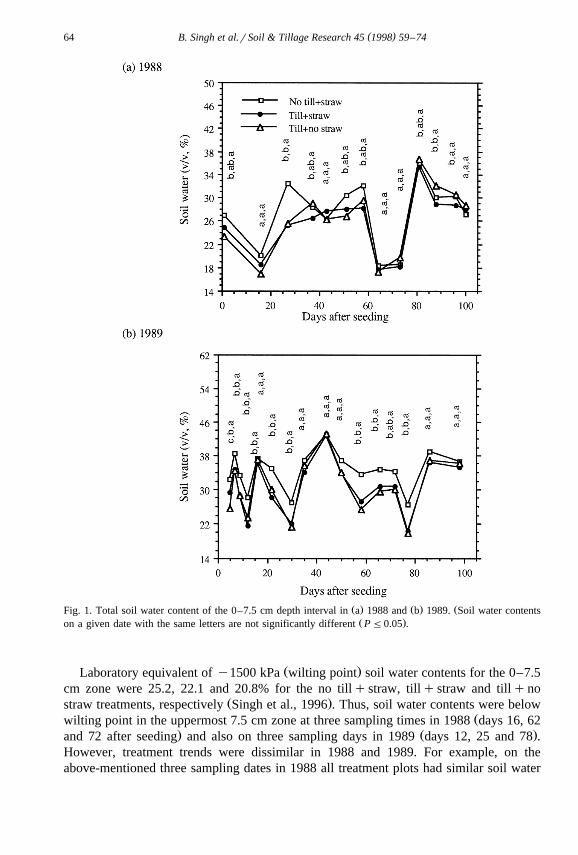
4.4. Soil water profiles
During wet soil conditions, soil profiles generally had a maximum water content atŽ .depths of 15 and 25 cm Fig. 4a , generally declining slightly at greater depths. Only
Ž .during times of very dry conditions was this bulge not evident Fig. 4b . This bulge wasŽ .not due to a horizon interface ArB interface lies below it and thus must have been due
to a past or present tillage effect, although the bulge is evident even for the no-tilltreatment. The characteristic shape of soil water distribution with depth was similar for
Ž .all treatments under wet conditions Fig. 4a , with the tillqstraw treatment resulting ingreater soil water contents at most depths G15 cm. The greatest difference in soil wateroccurred near the surface with the no tillqstraw treatment plots having the greatestsurface soil water. Greater water content of the surface soil in the no tillqstrawtreatment plots under wet conditions was attributed mainly to lower evaporation in this
Ž .system. Differences in soil water due to treatments was generally -2% absolute atdepths G65 cm.
Ž .Under dry conditions Fig. 4b the no tillqstraw treatment had the highest soil waterat almost all depths, with the tillqno straw treatment generally having the lowest soilwater at these same depths. The tillqstraw treatment had soil water contents intermedi-ate between the other two treatments. As under wet conditions, soil water due to
Ž .treatments differed by -2% absolute at depths G65 cm. Under dry conditions, themoisture gradients at all depths in all treatments were directed upwards, indicating alarge evapotranspiration requirement. Water was being depleted from the entire soilprofile, with the maximum extraction occurring from approximately the top 60 cm. Thisindicates that the potential rooting depth of barley in the experimental soil was
Ž .approximately 60 cm. Root growth measurements confirmed this Singh, 1991 .Treatment-averaged soil water content at a depth of 95 cm under dry conditions was
Ž .approximately 5–6% absolute lower than that under wet conditions, indicating adynamic soil water regime throughout the entire zone of soil monitored. The tillage–re-sidue treatments affected soil water throughout the 1.0-m profile in both study yearsacross all measurement dates.
Trends in soil water distribution with depth for all measurement dates as affected bytillage–residue systems were generally similar to those for total accumulated waterdescribed above: tillqno straw generally resulting in the lowest soil water at mostdepths, with the no tillqstraw treatment resulting in generally the greatest soil watercontent at a given depth. Soil water in the tillqstraw treatment plots was the mostdynamic; sometimes highest, sometimes equal to that with the no tillqstraw treatmentand at times, at depths greater than 60 cm, the lowest soil water.
At seeding time in both years, the tillqno straw treatment plots consistently had theŽ .lowest soil water to 7.5 cm, at 15 cm, TSW20, TSW50 and TSW100 data not shown .

( )B. Singh et al.rSoil & Tillage Research 45 1998 59–7470
Ž . Ž .Fig. 4. Profile soil water on a June 15, 1988 and b August 2, 1988.
These soil water parameters were similar for the two straw treatments at this time,indicating the greater role of straw than tillage. Treatment differences at the beginning ofthe growing season indicate different storage efficienciesrcapacities andror differentevaporation rates among the treatments over the snowmelt to seeding period. Seedingoccurred at least one month after snowmelt so the effects of the tillage–residue systemson snowmelt infiltration would have been masked by seeding time. Differential snowtrapping was likely not a factor, however, because the no till treatment plots, which were

( )B. Singh et al.rSoil & Tillage Research 45 1998 59–74 71
Table 2Ž . Ž . Ž .Frequency distributions for total soil water to depths of 20 TSW20 , 50 TSW50 and 100 cm TSW100 for
the 2-year study
Ž .Class mm No tillqstraw Tillqstraw Tillqno straw
TSW2081–85 1 1 076–80 1 0 171–75 8 3 166–70 6 10 761–65 8 5 756–60 1 5 651–55 2 1 146–50 1 2 341–45 0 1 2
TSW50181–190 2 2 0171–180 6 6 3161–170 4 4 6151–160 10 5 3141–150 2 5 5131–140 2 2 7121–140 0 2 1111–120 0 0 1
TSW100350–369 2 4 1330–349 9 6 3310–329 7 6 7290–309 7 7 8270–289 1 3 5250–269 0 0 2
the only plots with stubble standing, had very short stubble. At several locations on theŽ .Canadian prairies, Grevers et al. 1986 observed a greater soil water gain with zero till
than with conventional till during the autumn to seeding period. They ascribed thisprimarily to reduced evaporation between snowmelt and seeding under residue-coveredzero till system.
Ž .Even when the crop canopy was fully developed 66 days after sowing , the trend inŽsoil water content at all depths was no tillqstraw) tillqstraw) tillqno straw data
. Ž .not shown . Frequency distributions for TSW20, TSW50 and TSW100 Table 2 clearlydemonstrate the similar and wetter soil water regimes with the two straw-retainingtreatments most of the time, with straw removal generally creating a much drier regime.This again demonstrates the importance of straw in soil water conservation.
4.5. Seasonal water use, yield and water use efficiency
Ž .Seasonal seeding–harvest total water use was not significantly different amongŽtreatments in either study year, averaging 316 mm in 1988 and 281 mm in 1989 Table

( )B. Singh et al.rSoil & Tillage Research 45 1998 59–7472
Table 3Ž .Seasonal total water use, grain yield, and grain yield water use efficiency WUE , and dry matter water use
efficiencyaTillage–residue Seasonal Grain yield Grain WUE Dry matter WUE
y1 y1 y1 y1 y1Ž . Ž . Ž .system total water kg ha kg ha mm kg ha mmŽ .use mm
1988bNo tillqstraw 317 A 3264 B 10.4 B 23.3 B
Tillqstraw 320 A 4137 A 13.0 AB 27.2 ATillqno straw 313 A 4257 A 13.7 A 27.5 A
1989No tillqstraw 276 A 2541 A 9.2 A 20.6 ATillqstraw 288 A 2932 A 10.2 A 23.3 ATillqno straw 280 A 2663 A 9.5 A 22.8 A
a Dry matter yield at harvestsgrain yield plus straw yield.b Means in a column followed by a common letter are not significantly different at P F0.05. Comparisons arewithin-years only.
.3 . Grain yield, grain WUE and dry matter WUE for the no tillqstraw treatment plotswere lower than those for the two tillage treatment plots in both 1988 and 1989,although significantly only in 1988. This result is unexpected given the consistentlywetter soil profiles in the no tillqstraw treatment plots. It may be due to above-normalprecipitation in both study years. Measurements in years with below normal precipita-tion would be expected to show the advantage of no tillqstraw treatment.
ŽAll parameter values were lower in 1989 than in 1988 average yield across.treatments in 1989 was only 70% that in 1988 , perhaps due to the drier and cooler
Ž .conditions in 1989 than in 1988 Table 1 .
4.6. Management implications
The effect of tillage on soil water content is not clear in the literature. Heer andŽ . Ž .Krenzer 1989 on a silt loam Argiustoll in Oklahoma and Gauer et al. 1982 on four
soils varying from sandy loam to clay in southern Manitoba, reported consistentlygreater water contents throughout the 1.2- and 1.35-m profile with a no-till as compared
Ž .with a conventional tillage system. In contrast, Blevins et al. 1971 observed effects oftillage system on soil water content of a silt loam in Kentucky only to a depth of 60 cm
Ž .while Larney and Lindwall 1995 reported that at their site in southern Alberta croprotation has a greater effect on soil water than did tillage and that zero tillage hadrelatively little effect on available water to a 1.5-m depth.
The differences in reported results may relate to characteristics of the soils beingstudied. Tillage and straw management may regulate soil water in two ways: throughtheir alteration of soil characteristics or their effect on hydrologic processes that altersoil water. The relative importance of each may vary depending on inherent soil

( )B. Singh et al.rSoil & Tillage Research 45 1998 59–74 73
characteristics. For example, the soil in this study was well aggregated and the organicmatter content was high. The influence of treatments that act on such soils directly, astillage, may be mitigated by inherent soil characteristics; e.g., if soil inherent character-istics are generally favorable then even though tillage improves them, the overall effecton soil water content is small. In this study, the influence of tillage on soil water wasgreatest for the uppermost 7.5 cm. The lack of significant differences in soil water at
Ž .greater depths between straw-retained treatments no-till vs. tillage was reflected innon-significant differences in their soil water retention at both y10 and y1500 kPa,saturated hydraulic conductivity, steady-state infiltration or cumulative water intake after
Ž .1 h Singh et al., 1996 . This may not be true for soils that have poor aggregationandror organic matter levels. Zero tillage may be helpful on these soils by keeping poresize distribution suitable for water transmission, and in such conditions may be thedominant factor. On the other hand, management practices, such as straw retention, thatalter evaporation or albedo would be expected to change the soil water regime,regardless of inherent soil characteristics. Hence, their influence on soil water would beexerted even in well aggregated soils.
5. Conclusions
The three long-term tillage–residue management systems affected the soil waterregime to a depth of 100 cm, the greatest depth monitored. Differences due to treatmentswere significant even at the beginning of the growing season. In the 0–7.5 cm zone,tillage had a greater effect on soil water than straw retention.
The tillqno straw treatment generally resulted in the lowest soil water contents at alldepths. The no tillqstraw treatment had the highest near-surface soil water for most ofthe growing season. Total soil water to depths of 20, 50 and 100 cm was generallysignificantly lower in the tillqno straw treatment plots than in the no tillqstrawtreatment plots. The tillqstraw treatment resulted in intermediate soil water status, orhighest under wet conditions. The results clearly show the importance of straw retentionto soil water conservation. Differences in grain and dry matter water use efficiency dueto treatments were significant in only one of the two study years, likely due to climaticconditions, which favored the generally drier tillage treatments.
Acknowledgements
The authors thank Dr. M.P.K. Nyborg for allowing access to his research plots. Theauthors gratefully acknowledge funding from Farming for the Future of Alberta Agricul-ture and the National Sciences and Engineering Research Council of Canada. Technicalassistance was provided by K. Ostermann and J. Thurston. Dr. T. Taerum and Dr. R.T.Hardin assisted with the statistical analyses. The Canadian Government provided aCommonwealth Scholarship to the senior author.
( )B. Singh et al.rSoil & Tillage Research 45 1998 59–7474
References
Blevins, R.L., Cook, D., Phillips, S.H., Phillips, R.E., 1971. Influence of no-tillage on soil moisture. Agron. J.63, 593–596.
Chanasyk, D.S., Naeth, M.A., 1988. Measurement of near-surface soil moisture with a hydrogeneouslyshielded neutron probe. Can. J. Soil Sci. 68, 171–176.
Crown, P.H., Greenlee, G.M., 1978. Guidebook for a soils and land use tour in the Edmonton Region. 11thCongress of International Society of Soil Science, Edmonton, Alberta, 102 pp.
De Jong, R., Bootsma, A., 1988. Estimated long-term soil moisture variability on the Canadian prairies. Can.J. Soil Sci. 68, 307–321.
Environment Canada, 1982. Canadian Climate Normals: 1951–1980. Prairie Provinces, Atmospheric Environ-ment Service, Canadian Climate Program.
Gauer, E., Shaykewich, C.F., Stobbe, E.H., 1982. Soil temperature and soil water under zero tillage inManitoba. Can. J. Soil Sci. 62, 311–325.
Grevers, M.C., Kirkland, J.A., De Jong, E., Rennie, D.A., 1986. Soil water conservation under zero andconventional tillage systems on the Canadian prairies. Soil Tillage Res. 8, 265–276.
ŽHeer, W.F., Krenzer, E.G. Jr., 1989. Soil water availability for spring growth of winter wheat Triticum.aestiÕum L. as influenced by early growth and tillage. Soil Tillage Res. 14, 185–196.
Jones, J.N. Jr., Moody, J.E., Lillard, J.H., 1969. Effects of tillage, no-tillage, and mulch on soil water and plantgrowth. Agron. J. 61, 719–721.
Larney, F.J., Lindwall, C.W., 1995. Rotation and tillage effects on available soil water for winter wheat in asemi-arid environment. Soil Tillage Res. 36, 111–127.
Marshall, T.J., Holmes, J.W., 1988. Plants and soil water, Chap. 12, 2nd edn. Soil Physics. Cambridge Univ.Press, Cambridge, p. 314.
Moody, J.E., Jones, J.N., Lillard, J.H., 1963. Influence of straw mulch on soil moisture, soil temperature, andthe growth of corn. Soil Sci. Soc. Am. Proc. 27, 700–703.
Ž .Phillips, R.E., 1984. Soil moisture. In: Phillips, R.E., Phillips, S.H. Eds. , No-tillage Agriculture: Principlesand Practices. Van Nostrand-Reinhold, New York, pp. 66–86.
Radford, B.J., Gibson, G., Nielsen, R.G.H., Butler, D.G., Smith, G.D., Orange, D.N., 1992. Fallowingpractices, soil water storage, plant-available soil nitrogen accumulation and wheat performance insouthwest Queensland. Soil Tillage Res. 22, 73–93.
Rydberg, T., 1990. Effects of ploughless tillage and straw incorporation on evaporation. Soil Tillage Res. 17,303–314.
Singh, B., 1991. The long-term effects of tillage and residue management on the soil, physical environmentand on barley growth. Unpubl. PhD Diss. Dept. of Soil Science, Univ. of Alberta, Edmonton, 213 pp.
Singh, B., Chanasyk, D.S., McGill, W.B., Nyborg, M.P.K., 1994. Residue and tillage management effects onsoil properties of a Typic Cryoboroll under continuous barley. Soil Tillage Res. 32, 117–133.
Singh, B., Chanasyk, D.S., McGill, W.B., 1996. Soil hydraulic properties of an Orthic Black Chernozem underlong-term tillage and residue management. Can. J. Soil Sci. 76, 63–71.
Ž .Smika, D.E., Unger, P.W., 1986. Effect of surface residues on soil water storage. In: Stewart, B.A. Ed. , Adv.Soil Sci., 5, pp. 111–138.
Steel, R.G.D., Torrie, J.H., 1980. Principles and Procedures of Statistics: A Biometrical Approach, 2nd edn.New York, NY, 633 pp.
Unger, P.W., McCalla, T.M., 1980. Conservation tillage systems. Adv. Agron. 33, 1–58.