Soil Survey Investigations of Freshwater...
35
Soil Survey Investigations of Freshwater Subaqueous Soils Jonathan Bakken Department of Environmental Sciences University of Rhode Island Summer 2010 Workshop
Transcript of Soil Survey Investigations of Freshwater...

Soil Survey Investigations of Freshwater
Subaqueous Soils
Jonathan BakkenDepartment of Environmental Sciences
University of Rhode IslandSummer 2010 Workshop

Overview: Introduction – Statement of Research
Project Objectives
Research Methods and Procedures
Data Analysis
Summary/Conclusion
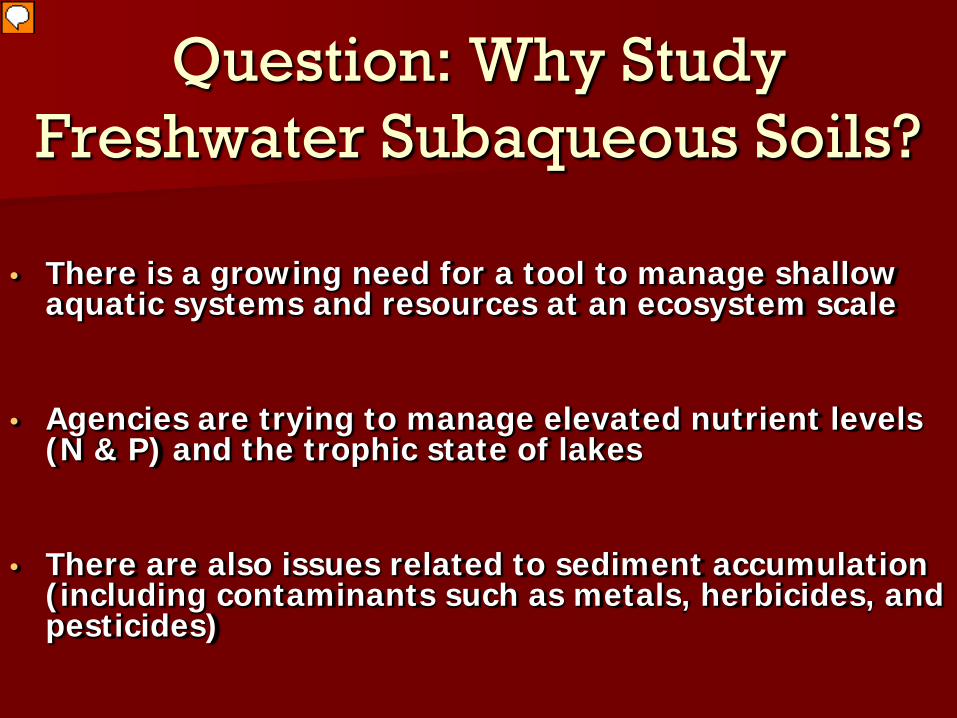
Question: Why Study Freshwater Subaqueous Soils?
• There is a growing need for a tool to manage shallow aquatic systems and resources at an ecosystem scale
• Agencies are trying to manage elevated nutrient levels (N & P) and the trophic state of lakes
• There are also issues related to sediment accumulation (including contaminants such as metals, herbicides, and pesticides)
Presenter
Presentation Notes
AND lake associations!

Question: Why Study Freshwater Subaqueous Soils?
• There has been an explosion in the population of invasive species
• Environments should be managed in ensure long-termsustainability
• Previous work mainly focused on coastal (estuarine)subaqueous soils
Presenter
Presentation Notes
Previous Work: estuarine – had management implications that could possibly relate in similar ways to freshwater systems. It needs further investigation. The NRCS has received various requests for fresh water information for technical soil services (i.e. dam removal sites).
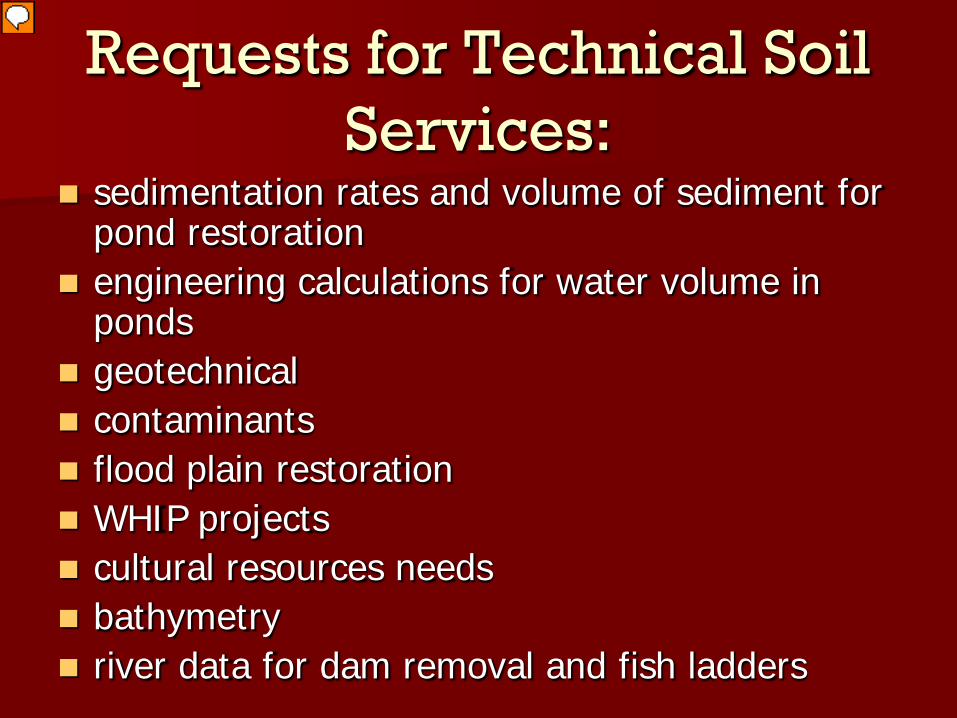
Requests for Technical Soil Services:
sedimentation rates and volume of sediment for pond restoration
engineering calculations for water volume in ponds
geotechnical contaminants flood plain restoration WHIP projects cultural resources needs bathymetry river data for dam removal and fish ladders
Presenter
Presentation Notes
Wildlife Habitat Incentives Program

Why Study Freshwater Subaqueous Soils?
The goal of my study is to begin to develop an understanding of the variations and distributions of freshwater subaqueous soils and to answer some of the commonly asked questions regarding the mapping, classification, and interpretation of these soils.

Specific Project Objectives: Subaqueous soil maps for 3 created and 3 natural
freshwater lakes or ponds
Characterization data for the most common soil types in each water body
Carbon pools by area (Mg/ha) for each of the mapping units
P, N, and As distribution maps and related interpretations
Relationships between landscape unit/soil type/soil properties and invasive species distribution
Presenter
Presentation Notes
MAPS: if freshwater subaqueous soils differ between created (reservoir) and natural (lake) systems? (comparison of sed. rates, Carbon sequestration, N and P accum., etc.) Characterization data: no one has done it before for freshwater systems, only coastal CARBON: What are the pools and sequestration (storage) rates like in freshwater subaqueous soils, compared to coastal? (natural vs. created) P and N: how strongly are these levels linked to invasives species? INVASIVE SPECIES: i’ll make observations of the distribution of inv. plant species and investigate relationships between soil type, nutrient concentrations, and invasive species.

Specific Project Objectives (cont.)
Sedimentation rates with interpretations/relationship to land-use-history
Recommendations for changes to Soil Taxonomy
Recommendations for methods and protocols for mapping freshwater subaqueous soils
Recommendations for mapping created and natural freshwater subaqueous soils based on soil-landscape relationships
Presenter
Presentation Notes
LAND-USE-HISTORY: Each watershed leading to a created system will have a different size and land-use history. Thus we will investigate relationships between these watershed characteristics and land-use-histories relative to sedimentation, nutrient contamination, etc. Soil Taxonomy: All previous (recent) changes to “the keys” were for coastal systems Methods and protocols: GPR can’t be used in coastal areas (salt water). GPR has problems in areas with high levels of SAV.

3 Created Freshwater
Lakes (impound-
ments)
Presenter
Presentation Notes
Watersheds are mainly composed of forest, residential-commercial, and agricultural land uses. The 3 impoundments are part of a RI NRCS/DEM focus on invasive species in freshwater systems. All of the sites have been monitored for water quality parameters (pH, D.O., temp. clarity, P, N, etc.) since 2000 by URI’s Watershed Watch program. All water tests, we will look at the soil.
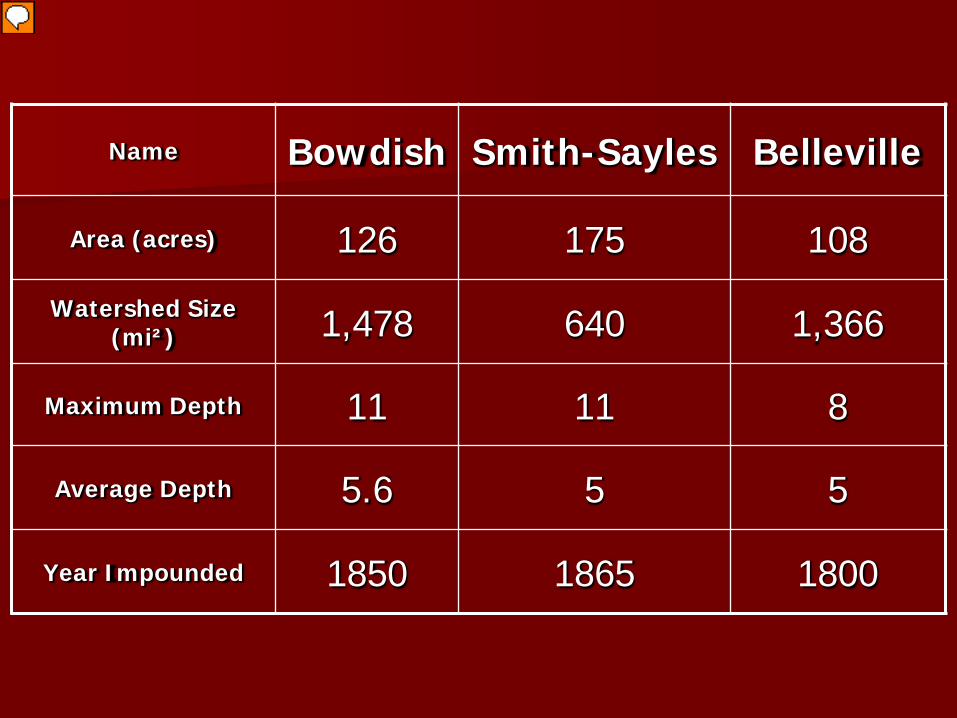
Name Bowdish Smith-Sayles Belleville
Area (acres) 126 175 108
Watershed Size (mi²) 1,478 640 1,366
Maximum Depth 11 11 8
Average Depth 5.6 5 5
Year Impounded 1850 1865 1800
Presenter
Presentation Notes
Year of impoundment will help us take a look at sed. rates and C sequestration rates, because we will be able to find the original buried surface layer which will act as time 0.

3 Natural Freshwater Lakes
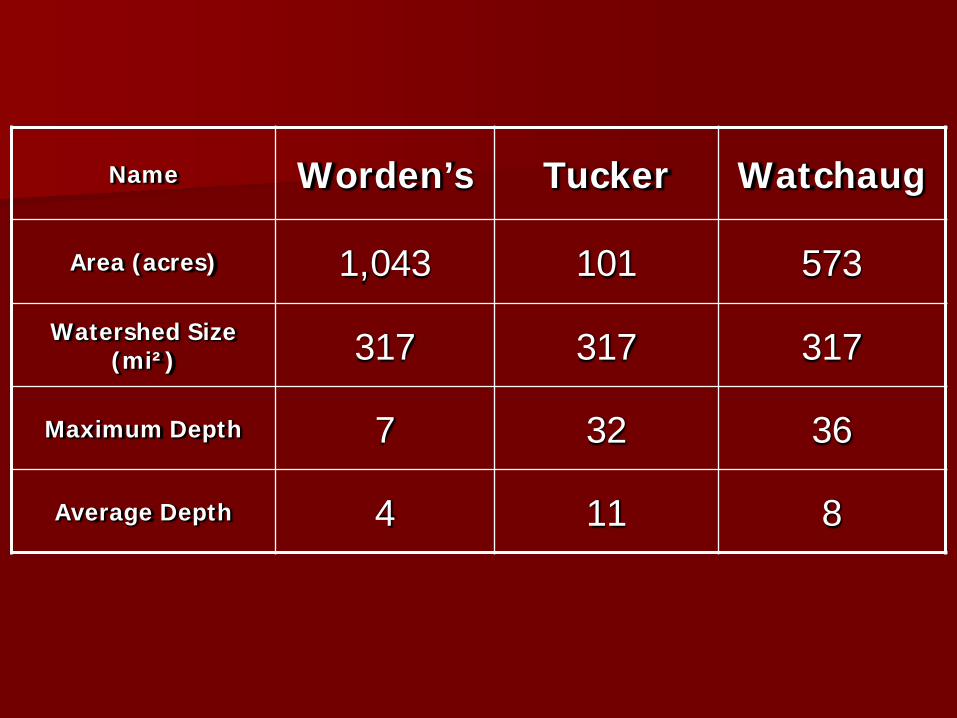
Name Worden’s Tucker Watchaug
Area (acres) 1,043 101 573
Watershed Size (mi²) 317 317 317
Maximum Depth 7 32 36
Average Depth 4 11 8

BowdishSmith & Sayles
Belleville
Wordens
TuckerWatchaug
Presenter
Presentation Notes
Most people WANT information on these lakes…not randomly chosen.

Research Methods and Procedures:
(Data collection in the field)
Bathymetric Analysis
Ground-Penetrating Radar
Soil Sampling

Bathymetry!

Bathymetric Analysis Detailed bathymetric maps of each study area will be
created
Ground-penetrating radar (GPR), surveying rods, fathometer, and GPS used to collect the depth of water and at known locations
Points taken at 10s intervals traveling at a speed of 4-10kph in track lines 20 to 40 meters apart
Ground-truthing of data will be conducted to assure accuracy
This data will help create contour lines and subaqueous soils maps

Ground-Penetrating Radar
(GPR) Ground penetrating radar
utilizes radio frequency waves to detect subsurface features
GPR’s operate at frequencies between 20 and 1000 MHz
Waves reflect when they encounter a change in the electrical properties of sediment
Presenter
Presentation Notes
An antenna, which is pulled across the surface of the ground, transmits a signal that penetrates the subsurface. As this signal passes through various layers of sediment, it is reflected back up and received by the antenna. The "signals" that are picked up are displayed graphically on a computer. The lower frequencies give lower resolution, penetrating approximately 30 m. Higher frequencies show better resolution, but do not penetrate as far. Attenuation (loss of energy) occurs when the wave penetrates a soil with a high electric conductivity (such as clay). Thick layers of clay can limit the penetration of the waves to less than a meter.

Fathometer
O
• Fathometers utilize echo-sounding technology to detect the bottom of a water body; this gives us water depth
• Some accuracy problems can occur in densely vegetated lakes; ground-truth!
• Soundings/tracks can be saved directly into the unit
• The unit also acts as a regular GPS unit

Bathymetric Map

Soil Sampling
Conducted during both winter and summer months
Soils will be sampled to an average depth of 100-150 cm; water <2.5m deep
Standard bucket auger, MacCauley peat sampler, or vibracore will be used
GPS locations!


Soil Sampling (cont.)
All samples will be described following standard procedures (Munsell color, texture, coarse fragments, water depth, etc.)
Additional samples will be taken as needed with a vibra-corer or MacCauley sampler to further support the statistical analysis and to capture the variability and extent of soil types
Date of dam completion in each of the impounded systems will mark time zero for soils analysis
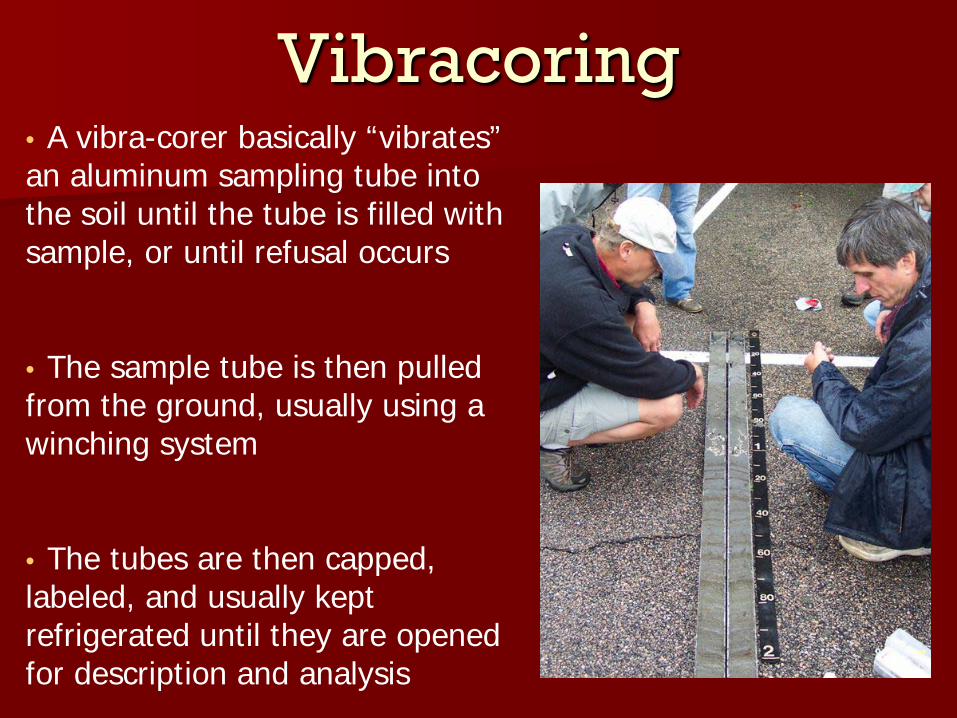
Vibracoring• A vibra-corer basically “vibrates” an aluminum sampling tube into the soil until the tube is filled with sample, or until refusal occurs
• The sample tube is then pulled from the ground, usually using a winching system
• The tubes are then capped, labeled, and usually kept refrigerated until they are opened for description and analysis

Subaqueous Soils Map
Presenter
Presentation Notes
This is a draft (preliminary) copy of the soil survey map for Bowdish. This was mapped using GPR data, ground-truthing, and soil cores taken during the survey.

Research Methods and Procedures(Data analysis in the lab):
pH and Electrical conductivity
Particle size distribution (PSD) and percent coarse fragments
Total Arsenic
Nitrogen, Carbon, and Phosphorus

pH (soil Reaction)
pH (soil) – the degree of acidity or alkalinity
of a soil
Important for nutrient availability, microbial
reactions, and classification
Electrical Conductivity
Electrical conductivity (EC) – gives us an
indirect measurement of the salt content of a
soil
Can affect soil pH, plant growth, and
water quality
Presenter
Presentation Notes
pH levels also affect the complex interactions among soil chemicals. Phosphorus (P) for example requires a pH between 6.0 and 7.5 and becomes chemically immobile outside this range, forming insoluble compounds with iron (Fe) and aluminium (Al) in acid soils and with calcium (Ca) in calcareous soils.
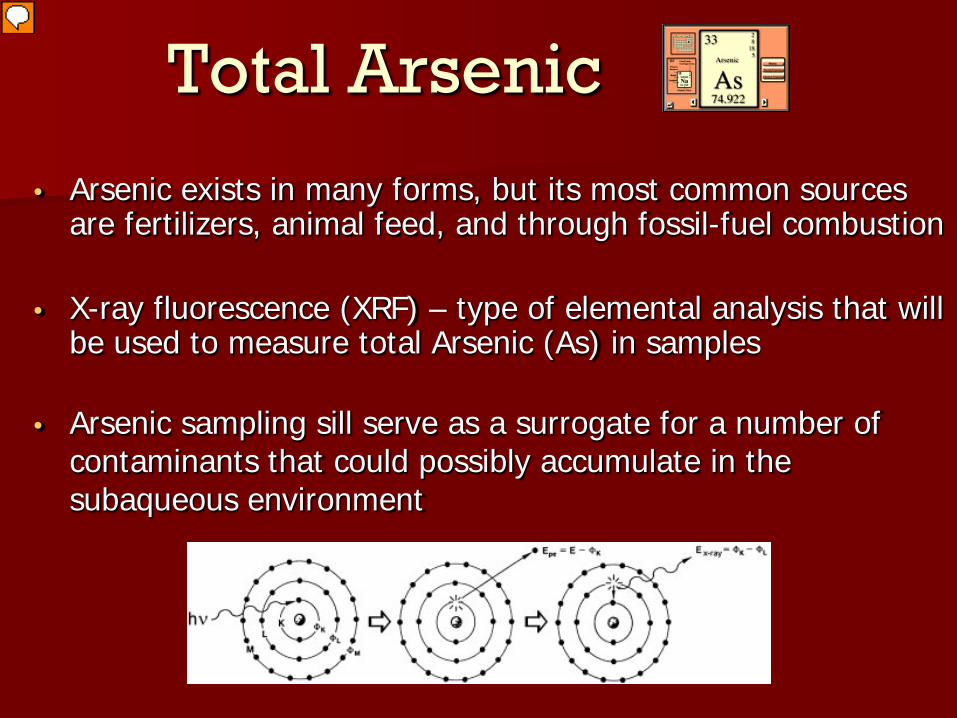
Total Arsenic
• Arsenic exists in many forms, but its most common sources are fertilizers, animal feed, and through fossil-fuel combustion
• X-ray fluorescence (XRF) – type of elemental analysis that will be used to measure total Arsenic (As) in samples
• Arsenic sampling sill serve as a surrogate for a number of contaminants that could possibly accumulate in the subaqueous environment
Presenter
Presentation Notes
We’ll be able to see which subaqueous landscapes are most likely to accumulate sediments. XRF – high energy X-rays displace electrons, and a light (fluorescence) is emitted that is unique to each element you are analyzing. The intensity of light emitted is proportional to the element’s concentration. Since each element has electrons with more or less unique energy levels, the wavelength of light emitted is characteristic of the element. And the intensity of light emitted is proportional to the elements concentration.

Total Carbon/Total Nitrogen
• Soil organic Carbon will be determined using the Loss-on-Ignition (LOI) method
• Carbon and Nitrogen Analyzer: used to measure total carbon and nitrogen for each sample collected
• Carbon pools will be determined on an area basis for the upper meter of the soil by summing the carbon stored in each horizon for each soil-landscape unit
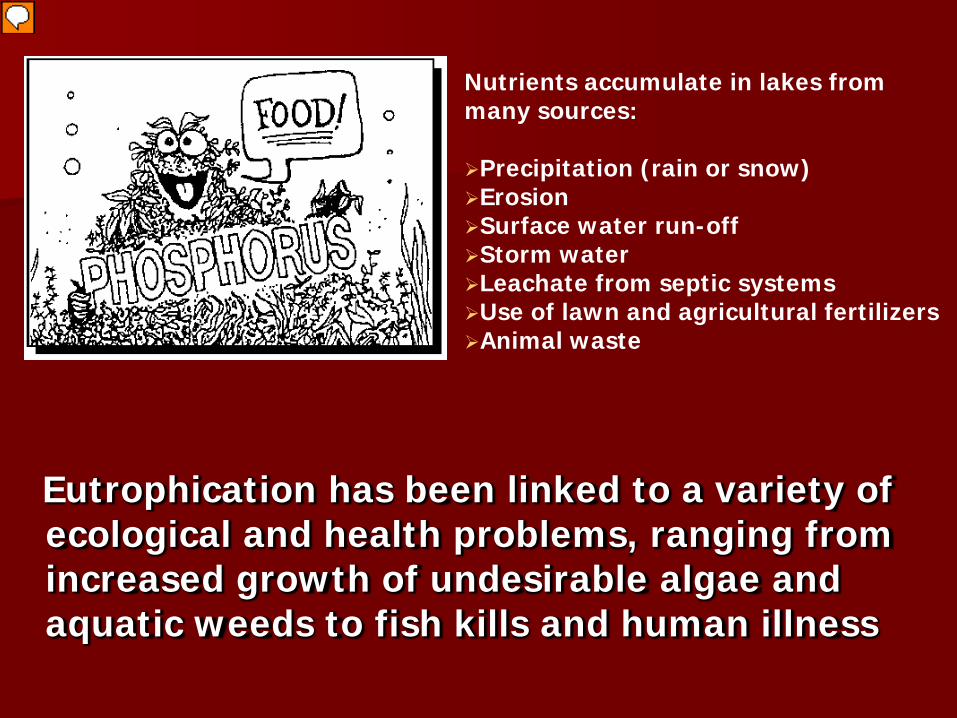
Eutrophication has been linked to a variety of ecological and health problems, ranging from increased growth of undesirable algae and aquatic weeds to fish kills and human illness
Nutrients accumulate in lakes from many sources:
Precipitation (rain or snow) Erosion Surface water run-off Storm water Leachate from septic systems Use of lawn and agricultural fertilizers Animal waste
Presenter
Presentation Notes
Also, golf courses. Some P could be “relic” or “legacy”...in the system from a long time ago...

Invasive Species
• Water quality and invasive species distribution data are both available for select water bodies in RI
• Invasive species distributions will be reviewed relative to soil type, landscape unit, and soil characteristics
• The ultimate goal will be to identify soil characteristics that explain the most variability in invasive species distribution
Presenter
Presentation Notes
as of 12/16/2009 (RIDEM): Bowdish – variable milfoil Smith&Sayles – variable milfoil Belleville – fanwort, variable milfoil, water chestnut Wordens – fanwort, variable milfoil, water chestnut Tucker and Watchaug - CLEAN

Current Species Observed:
(as of 12/16/2009 (RIDEM)):
Bowdish – variable milfoil Smith & Sayles – variable milfoil Belleville – fanwort, variable milfoil, water
chestnutWordens – fanwort, variable milfoil, water
chestnut Tucker and Watchaug - CLEAN
Presenter
Presentation Notes
Little Floating Heart (yellow-flower) on Watchaug???

Invasive SpeciesEurasian Watermilfoil Water Chestnut
Curly-Leafed Pondweed FanwortVariable Leaf
Watermilfoil
Presenter
Presentation Notes
Water chestnut, culyleaf pondweed, variable watermilfoil, Eurasion watermilfoil, fanwort

Aquatic Species Websites:
• http://www.dem.ri.gov/programs/benviron/water/quality/surfwq/aisindex.htm
• http://des.nh.gov/organization/divisions/water/wmb/exoticspecies/index.htm
• http://www.mass.gov/dcr/watersupply/lakepond/downloads/aquatic_species.pdf
Presenter
Presentation Notes
Rhode Island Department of Environmental Management New Hampshire Department of Environmental Services Massachusetts Department of Conservation and Recreation
Summary/Conclusion
As subaqueous soil science progresses, a wide range of use and management interpretations are expected to be developed for use with freshwater subaqueous soil maps
Agencies managing freshwater resources have many unanswered questions regarding water quality, sedimentation, invasive species, nutrient inputs, carbon sequestration, contaminants, conservation, and restoration
This research is hopefully just a first step in answering some of these questions, and in helping to better understand these very diverse aquatic systems

Special Thanks To: Rhode Island and Connecticut Natural Resources Conservation Service (NRCS);
Jim Turenne, Maggie Payne, and Jill Phillips
National NRCS - funding
Rhode Island Department of Environmental Management (DEM)
University of Rhode Island Graduate School
Lab of Pedology and Soil Environmental Science: Dr. Mark Stolt, Chrissy Pruett, Alex Salisbury, and Matthew Ricker
Coastal Fellow – Mandy Padula