SOIL SCIENCE - icar-iirr.org
100
SOIL SCIENCE
Transcript of SOIL SCIENCE - icar-iirr.org

SOIL SCIENCE

Progress Report of Soil Science Coordinated Program(Rabi and Kharif 2017)
SOIL SCIENCE
CONTENTS
Chapter Title Page
Summary 5.1
5.1Long- term soil fertility management in rice – based croppingsystems (RBCS)
5.5
5.2Yield gap assessment and bridging the gap through site specificnutrient management in rice in farmers' fields
5.18
5.3Screening of germplasm for sodicity and management of sodic soilsin RBCS
5.27
5.4Nutrient use efficiency and soil productivity under early and latesown/ transplanted rice
5.42
5.5Screening of rice genotypes for tolerance to soil acidity and relatednutritional constraints
5.54
5.6 Monitoring soil quality and crop productivity under emerging riceproduction systems 5.67
5.7Yield maximization of rice through Site Specific NutrientManagement
5.76
5.8 Bio-intensive pest management (BIPM) in rice under organic farming 5.87
Map showing Soil Science AICRIP Funded and Voluntary centres 5.93
Appendix 1 Scientists involved in the coordinated program 2017 5.94
Appendix 2 Performance of Soil Science centres during 2017 5.95
Acknowledgements 5.96

IIRR Annual Progress Report 2017 Vol. 3-Soil Science
5.1
5. SOIL SCIENCE
Summary
The coordinated program in soil science addressed the issues related to sustaining
productivity of soil and crop systems on long-term basis, yield gap assessment and bridging
the gap from soil fertility point of view, germplasm screening and nutrient management in
sodic and acid soils, nutrient use efficiency and crop productivity under late planted
conditions, monitoring soil quality and productivity under emerging systems of rice
production, testing of computer based nutrient management tool, Nutrient Expert, developed
by IPNI for site specific nutrient management and collaborative trials with Agronomy and
Entomology in nutrient management and bio intensive pest management under organic
farming. A total of 8 trials were conducted during rabi 2016-17 and kharif 2017 in 14
locations (funded as well as voluntary centres) representing typical soil and crop systems and
important rice growing regions.
5.1. Long-term soil fertility management in rice-based cropping systems
In the 29th year of study on long term soil fertility management in RBCS, the treatments
RDF+5t FYM/ha and RDF were at par and significantly superior to other treatments in both
seasons at MTU and in rabi at TTB. FYM alone treatment was on par to RDF in rabi and
significantly superior to RDF in kharif at TTB. Nutrient omission resulted in yield reduction
at both centres in both seasons and response was more to N in heavy soils of MTU and to K
in light soils of TTB. Soil fertility status at the end of kharif 2017 indicated an improvement
in important soil properties in INM treatments at both locations. Linear trends of kharif rice
productivity over the years with current RDF indicated slightly positive growth in the delta
soils of MTU (3.6 kg grain/ha/year) and more positive growth in the acid alluvial soils of
TTB (24.3 kg/ha/year). Additional dose of FYM @5t/ha along with RDF improved the
growth rate substantially with 72 kg/ha/year at MTU and 71 kg/ha/year at TTB.
5.2. Yield gap assessment and bridging the gap through site specific nutrientmanagement in rice in farmers' fields
Yield and Technology gap is a major problem in increasing paddy production in the
irrigated ecosystems of the states. This trial was conducted in farmers’ fields around few
selected centres – Chinsurah, Faizabad Titabar and Maruteru to assess the variability in
nutrient supply, its relationship with rice yields at current recommended and farmers’

IIRR Annual Progress Report 2017 Vol. 3-Soil Science
5.2
fertilizer practices in some new farm sites and fine-tune the fertilizer nutrient requirement for
specific target yields (8 t/ha to maximum) in a given environment and validation of fertilizer
recommendations for targeted yields. Fertilizer recommendations estimated for specific yield
targets in the previous years in the farmers’ fields around Titabar were validated in
comparison with the current recommended and farmers’ fertilizer practices. The need was
assessed to ascertain the gaps of technology and compared the yield variations under RDF,
SSNM vis a vis farmers field yield gaps. Technology Yield Gap I was estimated based on our
recommended practice of SSNM and a target yield and technology Yield Gap 2 was
estimated based on our the RDF prevalent across the region as recommended by the research
farm /centre.
5.3 Screening of Germplasm for Sodicity and Management of Sodic Soils in RBCS
Rice yields at Kanpur and Mandya increased by 66-127% and 7-15.0% respectively
by NPK fertilization along with gypsum amendments. The genotypes viz., DRR Dhan 46,
DRR Dhan 42, DRR Dhan 45, DRR Dhan 43, DRR Dhan 44 and DRR Dhan 40 produced
the highest yields when supplemented with 100% GR (4.63-4.43 t/ha) and also under native
sodic conditions without gypsum application (2.21-2.00 t/ha), at Kanpur. IR 30864, DRR
Dhan 41, CSR 23, DRR Dhan 43, and DRR Dhan 40 recorded highest yields with 100% GR
application (5.89 t/ha-5.27 t/ha) and also exhibited tolerance to sodicity with yields ranging
from 5.33 – 4.95 t/ha at Mandya. In Faizabad, the genotypes NDRK 500051, IRSSTN 30,
IRSSTN 110, Jaya and NDRK 50063 recorded highest yields (5.06 -3.85 t/ha) without
gypsum amendment.
5.4 Nutrient use efficiency and soil productivity in early and late sown rice
Changing climatic conditions in many vulnerable areas are likely to influence
agricultural productivity by influencing crop calendar, crop growth and efficiency of inputs.
This study was conducted at twelve locations (Collaborative trial between Soil science and
Agronomy) to assess the extent of change in rice productivity and nutrient use efficiency due
to changing crop calendar and identify management options to mitigate the loss in yield and
nutrient use efficiency. At all the centres, the productivity was significantly influenced by the
time of crop establishment with normal sowing recording highest grain yields. The nutrient
management practice of 150% RDF + Zn with N in 3 splits either as 1/2 + 1/4 +1/4 or 1/3
+1/3 +1/3 performed better over others in terms of nutrient uptake and rice productivity.
Nutrient uptake was higher under normal planting which ranged from 98-124 kg N/ha, 17-66
IIRR Annual Progress Report 2017 Vol. 3-Soil Science
5.3
kg P/ha and 74-96 kg K/ha, while delayed planting (by both 15 and 30 days) and absolute
control resulted in higher nutrient use efficiencies.
5.5 Screening of rice genotypes for acid soils and related nutritional constraints
Application of lime amendments to acid soil and fertilization with double the rates of
PK fertilizer significantly increased yields ranging from 10- 23% at Moncompu, Raipur,
Ranchi and Titabar. At Moncompu, the genotypes responsive to liming were HRI 197, Uma,
27 P63 and DRR Dhan 42 while the acid tolerant genotypes were Uma, KAU 109 and DRR
Dhan 42. At Ranchi, the genotypes HRI 196, 27 P64, 27 P63 performed better under both
limed and acid soil conditions. Similary, Gitesh, Prafulla, and Aghonibora recorded superior
yields in comparison to other genotypes at Titabar in the treatments with and without liming.
At Raipur, Indira Maheswari and RP5974-3-2-8-38-12 recorded higher yields in all the three
nutrient management treatments viz., NPK(RD), NPK (RD)+Lime and N (RD)+double PK.
5.6 Monitoring soil quality and crop productivity under emerging rice productionsystems
The soil science trail on monitoring soil quality and crop productivity under emerging
rice production systems was conducted at four centres viz, Kanpur, Puducherry, Moncompu
and Pusa with three methods of crop establishment viz., transplanted rice (TPR); direct sown
rice under puddled conditions (DSR) and aerobic rice (AR, non-puddle, direct sown) with
zero or minimum tillage and with five different nutrient combinations with conjunctive use of
inorganic and organic sources of nutrients. The results indicated consistently superior
performance of transplanted rice over DSR and aerobic rice by 14-22% and13-19% at
Kanpur, Puducherry respectively while production systems at Moncompu indicated superior
performance of DSR over transplanted and aerobic rice by 14%. The result at Pusa indicated
slightly superior performance of AR over DSR and transplanted rice. In case of nutrient
management practices, maximum yields were obtained with RDF+50% NPK through
organics sources recorded significantly higher yield (6.14, 5.3 and 5.4 t/ha) Kanpur,
Puducherry and Pusa respectively, while, 100% recommended dose of fertilizer (RDF) of the
location (STCR based)+Zn+S on par and superior at Moncompu. All soil properties were not
influenced by methods of crop establishment at all locations. Nutrient uptake and use
efficiency was higher in transplanted rice followed by DSR and soil available nutrients were
high in the plots that received organic manures either alone or in combination with chemical
fertilizers.
IIRR Annual Progress Report 2017 Vol. 3-Soil Science
5.4
5.7 Yield maximization of rice through Site Specific Nutrient Management (SSNM)
The trail on site specific nutrient management is an essential proof to maintain the
balanced plant nutrition regime as evident from the crop responses in terms of plant yield. In
addition it also placed an emphasis on maintenance the soil health in a sustainable fashion as
excess applications were avoided. All the essential variables either plant or soils indicated
that the balanced fertilization either based the decision rules, which emanated from Nutrient
Expert, or regional fertilizer recommendation, which came out of the field studies or even
vegetation health as indicated by the leaf colour were better than other treatments. The data
indicated that majority test sites reported higher grain yields in SSNM based on Nutrient
Expert, which ranged from 3549 to 7601 kg ha-1. Similarly, in case of straw yield also SSNM
based on NE, LCC and recommended regional fertilizer recommendations were better than
control or other treatments. The beneficial effects of SSNM were also visible in the yield
components including tillers and panicles per m2 and 1000 grain weight, which contribute to
the yields. All this leads to a conclusion that that site specific nutrient management certainly
helped in realizing the best from the balanced nutrient management by avoiding the excess
fertilization, keeping the soil in healthy conditions by replenishing the removed nutrients by
the crops with a possible cut in the cost on the fertilizer management.
5.8. Bio - Intensive Pest Management (BIPM) in rice under Organic Farming
The results from the third year of study on “Bio-intensive pest management”
indicated the superiority of BIPM over farmers’ practice (FP) at five (CHN, IIRR, KJT, JDP
and TTB) out of ten locations (CHN, IIRR, JDP, KJT, LDN, PTB, PDU, RPR, RCI and TTB)
that recorded significantly higher grain yield (by 22-44%). Whereas, BIPM was on par to FP
at PDU and LDN; and inferior to FP at RPR, PTB and RCI in terms of grain yield. The
observations on pest incidence indicated the beneficial effect of BIPM at most of the
locations with reduced pest incidence and increased population of natural enemies. Important
physical, cooking and nutritional quality parameters of grain indicated marginal increase in
some of the parameters at most of the locations in BIPM over FP. Most of the soil properties
improved with organics in BIPM compared to FP in the third year after repeated application
of organics where organic carbon content increased by a minimum of 4 % at CHN to the
maximum of 46 % at IIRR in BIPM.

IIRR Annual Progress Report 2017 Vol. 3-Soil Science
5.5
Detailed report
5.1 Long term soil fertility management in rice-based cropping systems (RBCS)
Long-term studies with well-defined nutrient management treatments and cropping
systems were initiated in 1989-90 at four selected locations representing major rice growing
regions and cropping systems viz., Mandya (MND) in Karnataka (rice-cowpea, Deccan
Plateau), Maruteru (MTU) in Andhra Pradesh (rice-rice, Delta system), Titabar (TTB) in
Assam (rice-rice, Alluvial soils) and Faizabad (FZB) in Uttar Pradesh (rice – wheat, Indo
Gangetic plains) to study the dynamics of soil and crop productivity in relation to
management for identifying the constraints that affect the sustainability of a given production
system. The trial at Faizabad was discontinued during 2007-08 for lack of manpower support.
The trial could not be conducted at Mandya due to late release of canal water and there was
no provision for other source of irrigation. Hence, the results of 29th year of cropping i.e.,
rabi 2016-17 and kharif 2017 are presented for two centres viz., Maruteru (MTU) and Titabar
(TTB) in Tables 5.1.1 to 5.1.10 and Figs. 5.1.1 to 5.1.4.
Crop productivity and soil fertility during rabi 2016-17
Grain and straw yields of rabi rice at MTU and TTB are presented in Table
5.1.2. At MTU, grain yield ranged from 2.19 (control) to 7.13 t/ha (100%NPK ZnS) with a
mean of 5.31 t/ha. RDF and RDF+FYM treatments were at par. Omission of N, P, K, Zn and
S resulted in significant yield reduction by 0.54 t/ha in -S to 4.04 t/ha in -N plots. At Titabar,
grain yield ranged from 1.23 t/ha in control to 4.68 t/ha in RDF+FYM which was on par to
RDF (4.32 t/ha) while FYM alone treatment (4.12 t/ha) and RDF were at par. Here also,
omission of nutrients resulted in significant grain yield reduction by 0.07 t/ha in -Zn to 0.44
t/ha in -K plots. 50% reduction in RDF resulted in 35% yield reduction in silty clay soils of
TTB compared to 38% reduction in clay loam soil of MTU. Addition of organics was more
beneficial in TTB soils compared to MTU. Though STCR recommendation was at par to
100% RDF at both locations, it resulted in high N recommendation with low P and K at MTU
and high N and K doses at TTB.
Total nutrients (NPK) Uptake followed similar trend as that of grain yield with
maximum uptake in RDF+ 5t FYM/ha at both centres, MTU and TTB (Table 5.1.3). Addition
of organics increased the nutrient uptake at both locations and the effect was more positive at
TTB. In general, soil organic carbon and available nutrient status after harvest at Maruteru
IIRR Annual Progress Report 2017 Vol. 3-Soil Science
5.6
were higher when organic manures were added as a supplementary dose (RDF+FYM).
Control treatment recorded lowest values and organic carbon content with only FYM was on
par to RDF+FYM (Table 5.1.4).
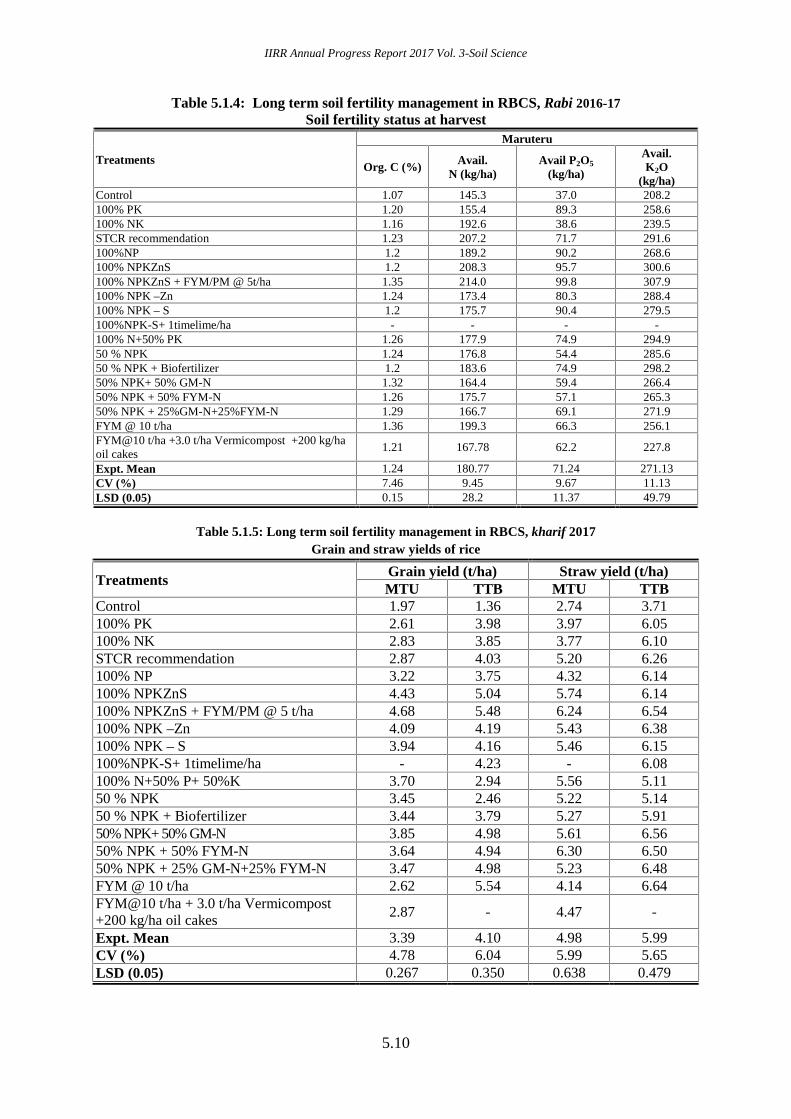
Crop productivity and soil fertility status during kharif 2017
At MTU, RDF and RDF+FYM recorded significantly higher grain yields (4.33-4.68
t/ha) than all other treatments and both these treatments were on par (Table 5.1.5). Omission
of major nutrients resulted in 27-41% yield loss while omission of micro nutrients resulted in
8-11% yield loss. At TTB, significantly higher yield was obtained with RDF+FYM (5.48t/ha)
and FYM alone (5.54 t/ha) treatments over RDF (5.04 t/ha) and these two treatments were on
par. Here, INM treatments (4.94-4.98 t/ha) were on par to RDF (5.04 t/ha). Response to
NPKZn and S was significant here at TTB similar to that at MTU with maximum yield loss
due to omission of major nutrients compared to micro nutrients. Unlike in rabi season, in
kharif, STCR recommendation resulted in significant yield reduction at both centres
compared to RDF. With regard to straw yield, except in control, where straw yield was very
less (2.74-3.71 t/ha), other treatments recorded higher straw yield without showing any
specific trend at both locations. The total nutrients (NPK) uptake by the above ground
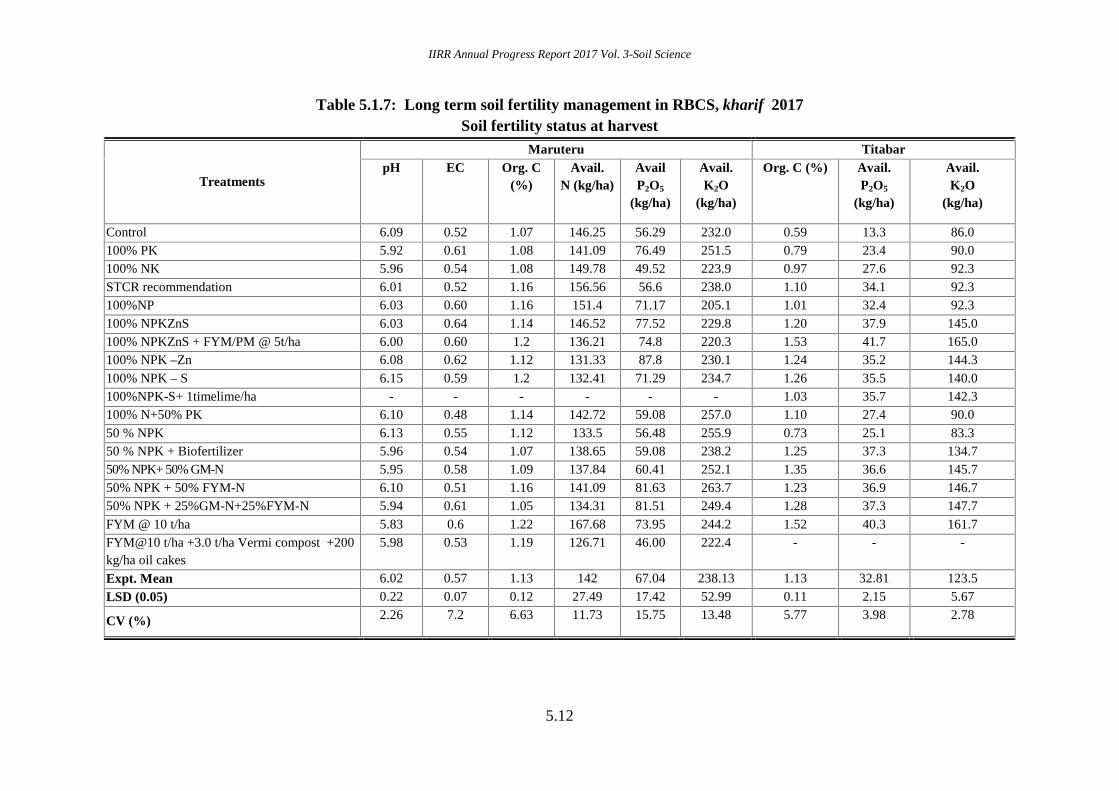
biomass was almost similar to that of grain yield trend at both locations (Table 5.1.6). Soil
fertility status at the end of kharif 2017 (Table 5.1.7 and Fig. 5.1.4) indicated an improvement
in important soil properties in INM treatments at both locations and maximum OC values
were observed with RDF+FYM and FYM alone treatments both at MTU (1.20-1.22%) and
TTB (1.52-1.53%). Control recorded the lowest values at both locations (1.07 and 0.59% at
MTU and TTB, respectively).
Long term changes in crop productivity and soil fertility over a period of 29 years
The trends in mean grain yields over 29 years (1989-2017) of kharif and rabi rice at
MTU and TTB by fitting to linear function using actual yields and the per cent change in
important soil properties in some important treatments were analysed and presented below.
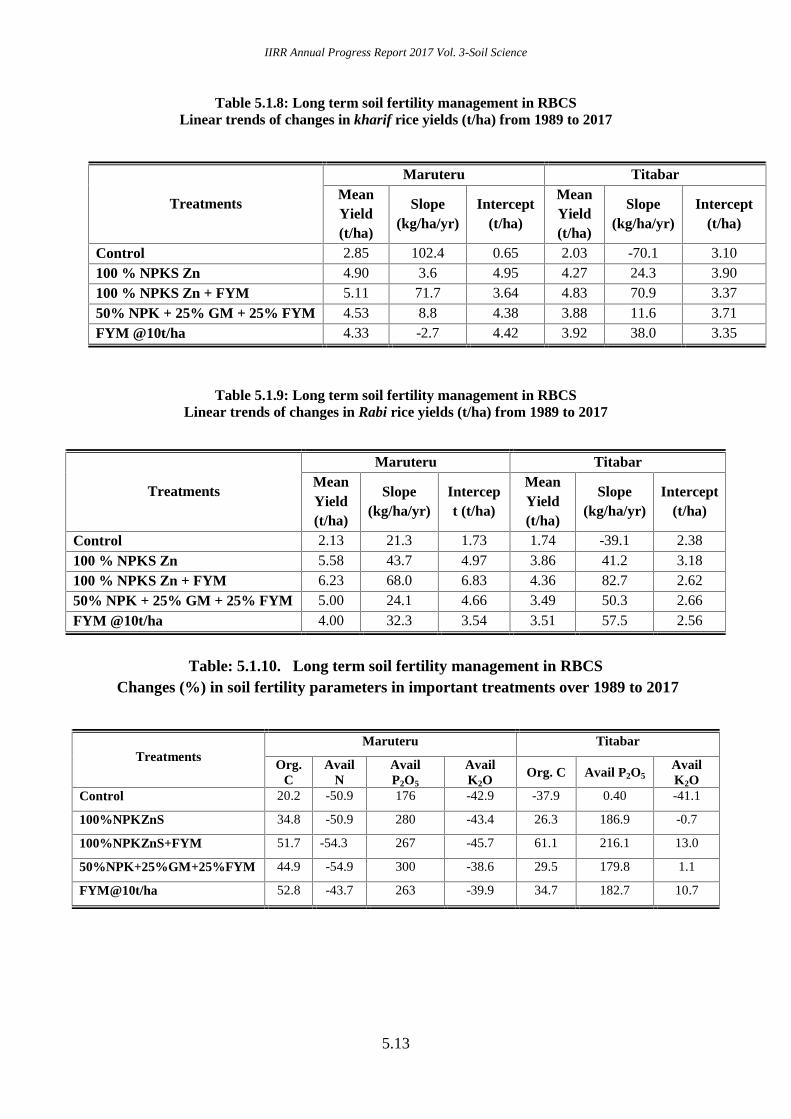
Trends in crop productivity (Table 5.1.8 and figs.5.1.1-5.1.3)
The treatment, RDF+5 t FYM/ha recorded maximum mean yield both at MTU (5.11
t/ha) and TTB (4.83 t/ha) with an average increase of 0.21 and 0.56 t/ha, respectively, at
MTU and TTB by this treatment over RDF. Linear trends of productivity over the years with
current RDF indicated slightly positive growth in the delta soils of MTU (3.6 kg
grain/ha/year) and more positive growth in the acid alluvial soils of TTB (24.3 kg/ha/year).

IIRR Annual Progress Report 2017 Vol. 3-Soil Science
5.7
Additional dose of FYM @5t/ha along with RDF improved the growth rate substantially with
72 kg/ha/year at MTU and 71 kg/ha/year at TTB.
During rabi (Table 5.1.9) also, RDF+5t FYM recorded maximum mean grain yield
both at MTU (6.23 t/ha) and TTB (4.36 t/ha) and this treatment recorded growth rate of 58
and 67 kg/ha/year at MTU and TTB, respectively. Growth rate was higher in kharif season
compared to rabi.
Changes in soil fertility
The per cent change in important soil fertility parameters compared to the initial
values were presented in Table 5.1.10 for two locations. There was a maximum decline in OC
in control treatment at TTB (-38%) and INM treatments recorded accumulation of OC with
maximum value in FYM alone treatment (53%) at MTU and in RDF+FYM at TTB (61%).
With regard to N, there was a decline in all treatments (-44 to - 55%) at MTU while P
accumulation was very high at both locations. In case of K also, change was -ve in all
treatments at MTU (-39 to -46 %) and in control (-4%) and RDF (-1%) at TTB with a
positive change in other treatments.
Summary
In the 29th year of study on long term soil fertility management in RBCS, the results
indicated the significantly superior performance of RDF+FYM and RDF over other
treatments at MTU in both seasons and in rabi at TTB. FYM alone treatment was on par to
RDF in rabi and significantly superior to RDF in kharif at TTB. At MTU, this treatment
(conjunctive use of RDF+5t FYM/ha) was on par to RDF during both seasons and during
rabi only at TTB. Omission of major nutrients resulted in maximum yield reduction
compared to micronutrients at both locations. Response was more to N application in heavy
soils of MTU and to K in light soils of TTB compared to other nutrients. INM and organics
alone treatments resulted in improvement of soil fertility and that reflected positively in rice
productivity at both locations.
IIRR Annual Progress Report 2017 Vol. 3-Soil Science
5.8
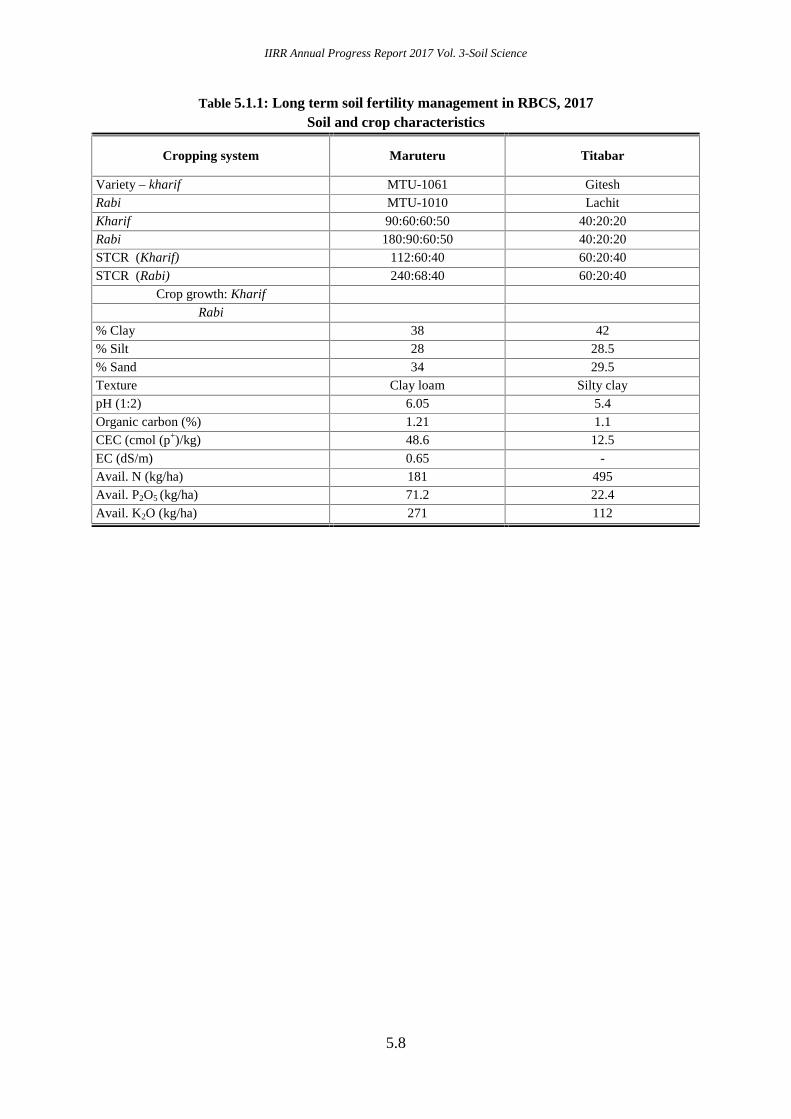
Table 5.1.1: Long term soil fertility management in RBCS, 2017Soil and crop characteristics
Cropping system Maruteru Titabar
Variety – kharif MTU-1061 GiteshRabi MTU-1010 LachitKharif 90:60:60:50 40:20:20Rabi 180:90:60:50 40:20:20STCR (Kharif) 112:60:40 60:20:40STCR (Rabi) 240:68:40 60:20:40
Crop growth: Kharif
Rabi% Clay 38 42% Silt 28 28.5% Sand 34 29.5Texture Clay loam Silty claypH (1:2) 6.05 5.4Organic carbon (%) 1.21 1.1CEC (cmol (p+)/kg) 48.6 12.5EC (dS/m) 0.65 -Avail. N (kg/ha) 181 495Avail. P2O5 (kg/ha) 71.2 22.4Avail. K2O (kg/ha) 271 112

IIRR Annual Progress Report 2017 Vol. 3-Soil Science
5.9
Table 5.1.2: Long term soil fertility management in RBCS, rabi 2016-17Grain and straw yields of rice
TreatmentsGrain yield (t/ha) Straw yield (t/ha)
Productivetillers
Maruteru Titabar Maruteru Titabar MaruteruControl 2.19 1.23 3.45 3.53 238100% PK 3.09 4.02 3.45 6.13 269100% NK 4.01 4.08 6.32 5.90 296STCR recommendation 6.85 4.37 8.17 6.32 360100% NP 6.43 3.88 6.84 5.50 427100% NPKZnS 7.13 4.32 7.56 6.18 422100% NPKZnS + FYM/PM @ 5t/ha 6.93 4.68 9.19 6.58 359100% NPK –Zn 6.38 4.25 7.19 6.03 405100% NPK – S 6.59 4.03 7.48 6.10 377100%NPK-S+1tlime/ha - 3.88 - 5.53 -100% N+50% PK 6.86 3.73 7.35 5.73 40450 % NPK 4.38 2.80 6.09 5.33 33250 % NPK + Biofertilizer 4.69 3.48 6.23 5.83 32550%NPK+ 50% GM-N 5.01 4.00 7.41 6.18 32750% NPK + 50% FYM-N 6.70 3.85 7.51 6.13 38550% NPK + 25% GM-N+25% FYM-N 5.99 3.95 7.32 5.97 391FYM @ 10 t/ha 4.83 4.12 5.05 6.37 282FYM @ 10 t/ha + Split application 2.18 3.44 5.53 297
Expt. Mean 5.31 3.80 6.47 5.85 226CV (%) 5.64 7.39 5.99 5.06 10.9
CD (0.05) 0.494 0.464 0.639 0.487 41
Table 5.1.3: Long term soil fertility management in RBCS, rabi 2016-17Total nutrient uptake (kg/ha)
TreatmentsMaruteru Titabar
N P K N P KControl 29.28 9.1 48.41 23.63 5.56 41.91100% PK 34.48 14.87 46.94 55.36 13.11 101.21100% NK 74.94 15.2 102.09 59.18 13.77 86.45STCR recommendation 120.92 30.9 105.38 65.73 15.98 93.53100% NP 105.1 25.56 103.8 59.83 12.82 81.69100% NPKZnS 115.16 26.62 114.45 76.23 15.14 100.03100% NPKZnS + FYM/PM @ 5t/ha 107 38.97 149.38 89.69 18.21 112.66100% NPK – Zn 102.12 24.58 125.14 72.64 14.52 95.13100% NPK – S 94.38 27.7 118.96 72.25 13.81 92.93100% NPK-S+1time lime/ha - - - 69.19 13.04 88.54100% N+50% PK 113.39 28.29 88.86 71.21 13.88 89.5950 % NPK 56.66 18.6 76.98 52.07 10.16 76.2150% NPK + Biofertilizer 64.19 21.98 76.81 65.46 13.54 86.8250% NPK+ 50% GM-N 80.95 23.57 82.03 70.59 14.15 94.0150% NPK + 50% FYM-N 90.47 28.42 93.98 69.3 14.52 93.7850% NPK + 25% GM-N+ 25% FYM-N 82.38 27.25 131.72 69.01 14.44 93.47FYM @ 10 t/ha 43.64 21.03 61.86 75.26 17.16 102.64FYM @ 10 t/ha + Split Vermi 24.29 11.75 64.59 - - -Expt. Mean 78.79 23.2 93.61 65.68 13.75 90.03CV (%) 24.19 11.88 26.71 5.91 2.2 9.14LSD (0.05) 31.45 4.55 41.25 6.41 9.76 13.58
IIRR Annual Progress Report 2017 Vol. 3-Soil Science
5.10
Table 5.1.4: Long term soil fertility management in RBCS, Rabi 2016-17Soil fertility status at harvest
Treatments
Maruteru
Org. C (%) Avail.N (kg/ha)
Avail P2O5
(kg/ha)
Avail.K2O
(kg/ha)Control 1.07 145.3 37.0 208.2100% PK 1.20 155.4 89.3 258.6100% NK 1.16 192.6 38.6 239.5STCR recommendation 1.23 207.2 71.7 291.6100%NP 1.2 189.2 90.2 268.6100% NPKZnS 1.2 208.3 95.7 300.6100% NPKZnS + FYM/PM @ 5t/ha 1.35 214.0 99.8 307.9100% NPK –Zn 1.24 173.4 80.3 288.4100% NPK – S 1.2 175.7 90.4 279.5100%NPK-S+ 1timelime/ha - - - -100% N+50% PK 1.26 177.9 74.9 294.950 % NPK 1.24 176.8 54.4 285.650 % NPK + Biofertilizer 1.2 183.6 74.9 298.250% NPK+ 50% GM-N 1.32 164.4 59.4 266.450% NPK + 50% FYM-N 1.26 175.7 57.1 265.350% NPK + 25%GM-N+25%FYM-N 1.29 166.7 69.1 271.9FYM @ 10 t/ha 1.36 199.3 66.3 256.1FYM@10 t/ha +3.0 t/ha Vermicompost +200 kg/haoil cakes
1.21 167.78 62.2 227.8
Expt. Mean 1.24 180.77 71.24 271.13CV (%) 7.46 9.45 9.67 11.13LSD (0.05) 0.15 28.2 11.37 49.79
Table 5.1.5: Long term soil fertility management in RBCS, kharif 2017Grain and straw yields of rice
TreatmentsGrain yield (t/ha) Straw yield (t/ha)MTU TTB MTU TTB
Control 1.97 1.36 2.74 3.71100% PK 2.61 3.98 3.97 6.05100% NK 2.83 3.85 3.77 6.10STCR recommendation 2.87 4.03 5.20 6.26100% NP 3.22 3.75 4.32 6.14100% NPKZnS 4.43 5.04 5.74 6.14100% NPKZnS + FYM/PM @ 5 t/ha 4.68 5.48 6.24 6.54100% NPK –Zn 4.09 4.19 5.43 6.38100% NPK – S 3.94 4.16 5.46 6.15100%NPK-S+ 1timelime/ha - 4.23 - 6.08100% N+50% P+ 50%K 3.70 2.94 5.56 5.1150 % NPK 3.45 2.46 5.22 5.1450 % NPK + Biofertilizer 3.44 3.79 5.27 5.9150% NPK+ 50% GM-N 3.85 4.98 5.61 6.5650% NPK + 50% FYM-N 3.64 4.94 6.30 6.5050% NPK + 25% GM-N+25% FYM-N 3.47 4.98 5.23 6.48FYM @ 10 t/ha 2.62 5.54 4.14 6.64FYM@10 t/ha + 3.0 t/ha Vermicompost+200 kg/ha oil cakes
2.87 - 4.47 -
Expt. Mean 3.39 4.10 4.98 5.99CV (%) 4.78 6.04 5.99 5.65LSD (0.05) 0.267 0.350 0.638 0.479

IIRR Annual Progress Report 2017 Vol. 3-Soil Science
5.11
Table 5.1.6: Long term soil fertility management in RBCS, kharif 2017Total nutrient uptake (kg/ha)
Treatments Maruteru TitabarN P K N P K
Control 25.99 14.13 32.51 16.93 4.92 40.94
100% PK 25.66 21.61 43.38 45.7 12.95 87.02
100% NK 38.07 22.42 51.9 49.74 10.54 86.14
STCR recommendation 38.89 21.82 72.25 54.15 14.72 90.54
100% NP 44.17 27.85 61.05 54.15 12.58 81.54
100% NPK + Zn + S 59.17 41.56 83.6 70.68 18.49 102.9
100% NPK + Zn + S + FYM/PM @ 5 t/ha 65.46 44.07 97.42 105.03 22.03 115.85
100% NPK –Zn 54.6 37.26 72.49 87.19 14.77 98.84
100% NPK – S53.02 32.65 70.73 86.84 14.15 97.01
100%NPK-S+ 1timelime/ha - - - 88.49 15.61 98.75
100% N+50% PK 51.96 28.75 64.19 63.04 9.89 72
50 % NPK 48.28 28.29 70.86 58.05 9.3 67.99
50 % NPK + Biofertilizer 46.91 26.91 73.64 80.28 13.4 94.2
50% NPK+ 50% GM-N 55.72 32.04 79.51 74.08 15.69 111.86
50% NPK+ 50% FYM-N 55.6 33.72 90.44 73.02 16.2 114.03
50% NPK +25% GM-N +25% FYM-N 36.66 31.47 77.62 71.92 16.87 105.1
FYM @ 10 t/ha 32.82 21.75 48.02 90.1 20.47 124.51
FYM@10t/ha +3.0 t/ha Vermicompost+200 kg/ha oil cakes
34.8 25.04 51.04 - - -
Expt. Mean 45.16 28.9 67.1 68.79 14.27 93.48
CV (%) 8.06 12.27 11.01 6.99 13.36 14.51
LSD (0.05) 6 5.85 12.19 7.93 3.15 124.6
IIRR Annual Progress Report 2017 Vol. 3-Soil Science
5.12
Table 5.1.7: Long term soil fertility management in RBCS, kharif 2017Soil fertility status at harvest
Treatments
Maruteru TitabarpH EC Org. C
(%)Avail.
N (kg/ha)AvailP2O5
(kg/ha)
Avail.K2O
(kg/ha)
Org. C (%) Avail.P2O5
(kg/ha)
Avail.K2O
(kg/ha)
Control 6.09 0.52 1.07 146.25 56.29 232.0 0.59 13.3 86.0100% PK 5.92 0.61 1.08 141.09 76.49 251.5 0.79 23.4 90.0100% NK 5.96 0.54 1.08 149.78 49.52 223.9 0.97 27.6 92.3STCR recommendation 6.01 0.52 1.16 156.56 56.6 238.0 1.10 34.1 92.3100%NP 6.03 0.60 1.16 151.4 71.17 205.1 1.01 32.4 92.3100% NPKZnS 6.03 0.64 1.14 146.52 77.52 229.8 1.20 37.9 145.0100% NPKZnS + FYM/PM @ 5t/ha 6.00 0.60 1.2 136.21 74.8 220.3 1.53 41.7 165.0100% NPK –Zn 6.08 0.62 1.12 131.33 87.8 230.1 1.24 35.2 144.3100% NPK – S 6.15 0.59 1.2 132.41 71.29 234.7 1.26 35.5 140.0100%NPK-S+ 1timelime/ha - - - - - - 1.03 35.7 142.3100% N+50% PK 6.10 0.48 1.14 142.72 59.08 257.0 1.10 27.4 90.050 % NPK 6.13 0.55 1.12 133.5 56.48 255.9 0.73 25.1 83.350 % NPK + Biofertilizer 5.96 0.54 1.07 138.65 59.08 238.2 1.25 37.3 134.750% NPK+ 50% GM-N 5.95 0.58 1.09 137.84 60.41 252.1 1.35 36.6 145.750% NPK + 50% FYM-N 6.10 0.51 1.16 141.09 81.63 263.7 1.23 36.9 146.750% NPK + 25%GM-N+25%FYM-N 5.94 0.61 1.05 134.31 81.51 249.4 1.28 37.3 147.7FYM @ 10 t/ha 5.83 0.6 1.22 167.68 73.95 244.2 1.52 40.3 161.7FYM@10 t/ha +3.0 t/ha Vermi compost +200kg/ha oil cakes
5.98 0.53 1.19 126.71 46.00 222.4 - - -
Expt. Mean 6.02 0.57 1.13 142 67.04 238.13 1.13 32.81 123.5
LSD (0.05) 0.22 0.07 0.12 27.49 17.42 52.99 0.11 2.15 5.67
CV (%) 2.26 7.2 6.63 11.73 15.75 13.48 5.77 3.98 2.78
IIRR Annual Progress Report 2017 Vol. 3-Soil Science
5.13
Table 5.1.8: Long term soil fertility management in RBCSLinear trends of changes in kharif rice yields (t/ha) from 1989 to 2017
Table 5.1.9: Long term soil fertility management in RBCSLinear trends of changes in Rabi rice yields (t/ha) from 1989 to 2017
Table: 5.1.10. Long term soil fertility management in RBCSChanges (%) in soil fertility parameters in important treatments over 1989 to 2017
Treatments
Maruteru TitabarMeanYield(t/ha)
Slope(kg/ha/yr)
Intercept(t/ha)
MeanYield(t/ha)
Slope(kg/ha/yr)
Intercept(t/ha)
Control 2.85 102.4 0.65 2.03 -70.1 3.10100 % NPKS Zn 4.90 3.6 4.95 4.27 24.3 3.90100 % NPKS Zn + FYM 5.11 71.7 3.64 4.83 70.9 3.3750% NPK + 25% GM + 25% FYM 4.53 8.8 4.38 3.88 11.6 3.71FYM @10t/ha 4.33 -2.7 4.42 3.92 38.0 3.35
Treatments
Maruteru TitabarMeanYield(t/ha)
Slope(kg/ha/yr)
Intercept (t/ha)
MeanYield(t/ha)
Slope(kg/ha/yr)
Intercept(t/ha)
Control 2.13 21.3 1.73 1.74 -39.1 2.38100 % NPKS Zn 5.58 43.7 4.97 3.86 41.2 3.18100 % NPKS Zn + FYM 6.23 68.0 6.83 4.36 82.7 2.6250% NPK + 25% GM + 25% FYM 5.00 24.1 4.66 3.49 50.3 2.66FYM @10t/ha 4.00 32.3 3.54 3.51 57.5 2.56
TreatmentsMaruteru Titabar
Org.C
AvailN
AvailP2O5
AvailK2O
Org. C Avail P2O5AvailK2O
Control 20.2 -50.9 176 -42.9 -37.9 0.40 -41.1
100%NPKZnS 34.8 -50.9 280 -43.4 26.3 186.9 -0.7
100%NPKZnS+FYM 51.7 -54.3 267 -45.7 61.1 216.1 13.0
50%NPK+25%GM+25%FYM 44.9 -54.9 300 -38.6 29.5 179.8 1.1
FYM@10t/ha 52.8 -43.7 263 -39.9 34.7 182.7 10.7

IIRR Annual Progress Report 2017 Vol. 3-Soil Science
5.14
Grain yield (t ha-1) at Maruteru
Grain yield (t ha-1) Titabar
Fig. 5.1.1 Long term effects of nutrient management on rice grain yields - Rabi(Mean of previous 28 years Vs. current year grain yield)
IIRR Annual Progress Report 2017 Vol. 3-Soil Science
5.14
Grain yield (t ha-1) at Maruteru
Grain yield (t ha-1) Titabar
Fig. 5.1.1 Long term effects of nutrient management on rice grain yields - Rabi(Mean of previous 28 years Vs. current year grain yield)
IIRR Annual Progress Report 2017 Vol. 3-Soil Science
5.14
Grain yield (t ha-1) at Maruteru
Grain yield (t ha-1) Titabar
Fig. 5.1.1 Long term effects of nutrient management on rice grain yields - Rabi(Mean of previous 28 years Vs. current year grain yield)

IIRR Annual Progress Report 2017 Vol. 3-Soil Science
5.15
Grain yield (t ha-1) at Maruteru
Grain yield (t ha-1) at Titabar
Fig.5.1.2 Long term effects of nutrient management on rice grain yields - kharif(Mean of previous 28 years Vs. current year grain yield)
0.00
1.00
2.00
3.00
4.00
5.00
6.00
Control 100%NPKZnS
IIRR Annual Progress Report 2017 Vol. 3-Soil Science
5.15
Grain yield (t ha-1) at Maruteru
Grain yield (t ha-1) at Titabar
Fig.5.1.2 Long term effects of nutrient management on rice grain yields - kharif(Mean of previous 28 years Vs. current year grain yield)
100%NPKZnS 100%NPK+FYM 50%+25%+25% FYM@10t/ha
1989-2016 mean 2017
IIRR Annual Progress Report 2017 Vol. 3-Soil Science
5.15
Grain yield (t ha-1) at Maruteru
Grain yield (t ha-1) at Titabar
Fig.5.1.2 Long term effects of nutrient management on rice grain yields - kharif(Mean of previous 28 years Vs. current year grain yield)
FYM@10t/ha
2017

IIRR Annual Progress Report 2017 Vol. 3-Soil Science
5.16
Maruteru
Titabar
Fig.5.1.3 Long term soil fertility mamangement in RBCSTrends in crop productivity (t/ha) (kharif) over 29 years (1989-2017)
IIRR Annual Progress Report 2017 Vol. 3-Soil Science
5.16
Maruteru
Titabar
Fig.5.1.3 Long term soil fertility mamangement in RBCSTrends in crop productivity (t/ha) (kharif) over 29 years (1989-2017)
IIRR Annual Progress Report 2017 Vol. 3-Soil Science
5.16
Maruteru
Titabar
Fig.5.1.3 Long term soil fertility mamangement in RBCSTrends in crop productivity (t/ha) (kharif) over 29 years (1989-2017)

IIRR Annual Progress Report 2017 Vol. 3-Soil Science
5.17
Org. Carbon content (%)
Available P2O5 content (kg/ha)
Available K2O content (kg/ha)Fig. 5.1.4 Long term effects of nutrient management on soil nutrient status– Kharif 2017
IIRR Annual Progress Report 2017 Vol. 3-Soil Science
5.17
Org. Carbon content (%)
Available P2O5 content (kg/ha)
Available K2O content (kg/ha)Fig. 5.1.4 Long term effects of nutrient management on soil nutrient status– Kharif 2017
IIRR Annual Progress Report 2017 Vol. 3-Soil Science
5.17
Org. Carbon content (%)
Available P2O5 content (kg/ha)
Available K2O content (kg/ha)Fig. 5.1.4 Long term effects of nutrient management on soil nutrient status– Kharif 2017
IIRR Annual Progress Report 2017 Vol. 3-Soil Science
5.18
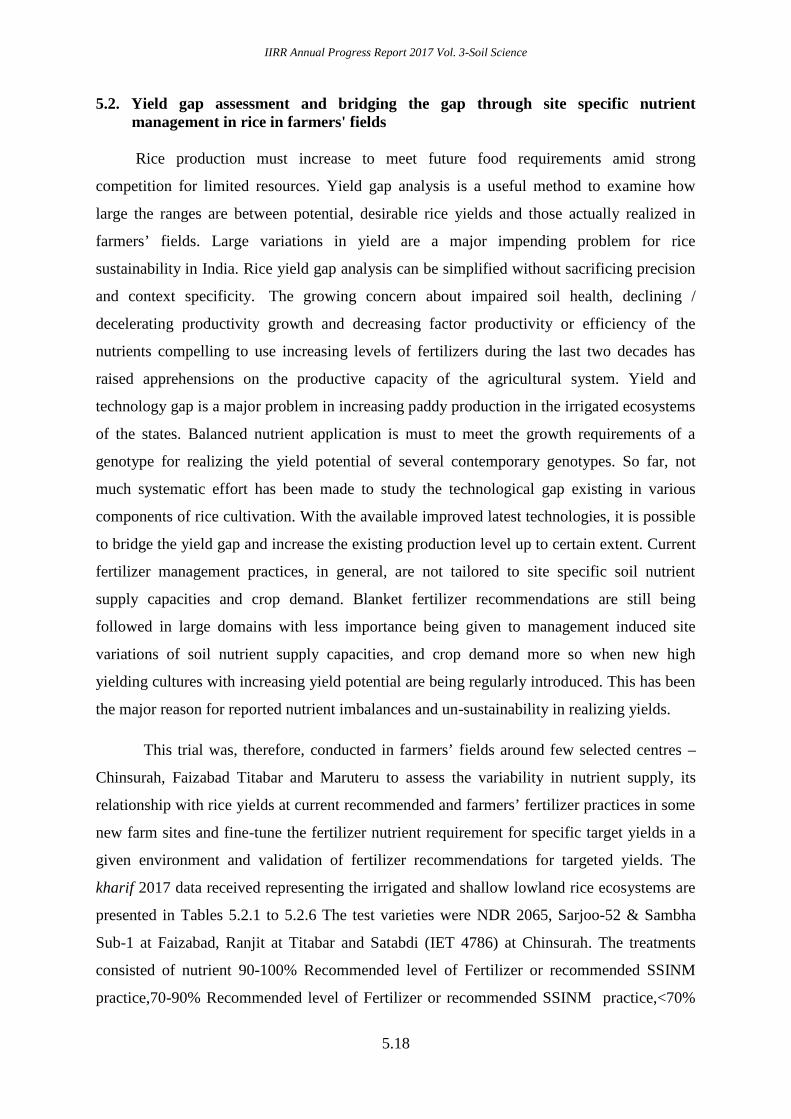
5.2. Yield gap assessment and bridging the gap through site specific nutrientmanagement in rice in farmers' fields
Rice production must increase to meet future food requirements amid strong
competition for limited resources. Yield gap analysis is a useful method to examine how
large the ranges are between potential, desirable rice yields and those actually realized in
farmers’ fields. Large variations in yield are a major impending problem for rice
sustainability in India. Rice yield gap analysis can be simplified without sacrificing precision
and context specificity. The growing concern about impaired soil health, declining /
decelerating productivity growth and decreasing factor productivity or efficiency of the
nutrients compelling to use increasing levels of fertilizers during the last two decades has
raised apprehensions on the productive capacity of the agricultural system. Yield and
technology gap is a major problem in increasing paddy production in the irrigated ecosystems
of the states. Balanced nutrient application is must to meet the growth requirements of a
genotype for realizing the yield potential of several contemporary genotypes. So far, not
much systematic effort has been made to study the technological gap existing in various
components of rice cultivation. With the available improved latest technologies, it is possible
to bridge the yield gap and increase the existing production level up to certain extent. Current
fertilizer management practices, in general, are not tailored to site specific soil nutrient
supply capacities and crop demand. Blanket fertilizer recommendations are still being
followed in large domains with less importance being given to management induced site
variations of soil nutrient supply capacities, and crop demand more so when new high
yielding cultures with increasing yield potential are being regularly introduced. This has been
the major reason for reported nutrient imbalances and un-sustainability in realizing yields.
This trial was, therefore, conducted in farmers’ fields around few selected centres –
Chinsurah, Faizabad Titabar and Maruteru to assess the variability in nutrient supply, its
relationship with rice yields at current recommended and farmers’ fertilizer practices in some
new farm sites and fine-tune the fertilizer nutrient requirement for specific target yields in a
given environment and validation of fertilizer recommendations for targeted yields. The
kharif 2017 data received representing the irrigated and shallow lowland rice ecosystems are
presented in Tables 5.2.1 to 5.2.6 The test varieties were NDR 2065, Sarjoo-52 & Sambha
Sub-1 at Faizabad, Ranjit at Titabar and Satabdi (IET 4786) at Chinsurah. The treatments
consisted of nutrient 90-100% Recommended level of Fertilizer or recommended SSINM
practice,70-90% Recommended level of Fertilizer or recommended SSINM practice,<70%
IIRR Annual Progress Report 2017 Vol. 3-Soil Science
5.19
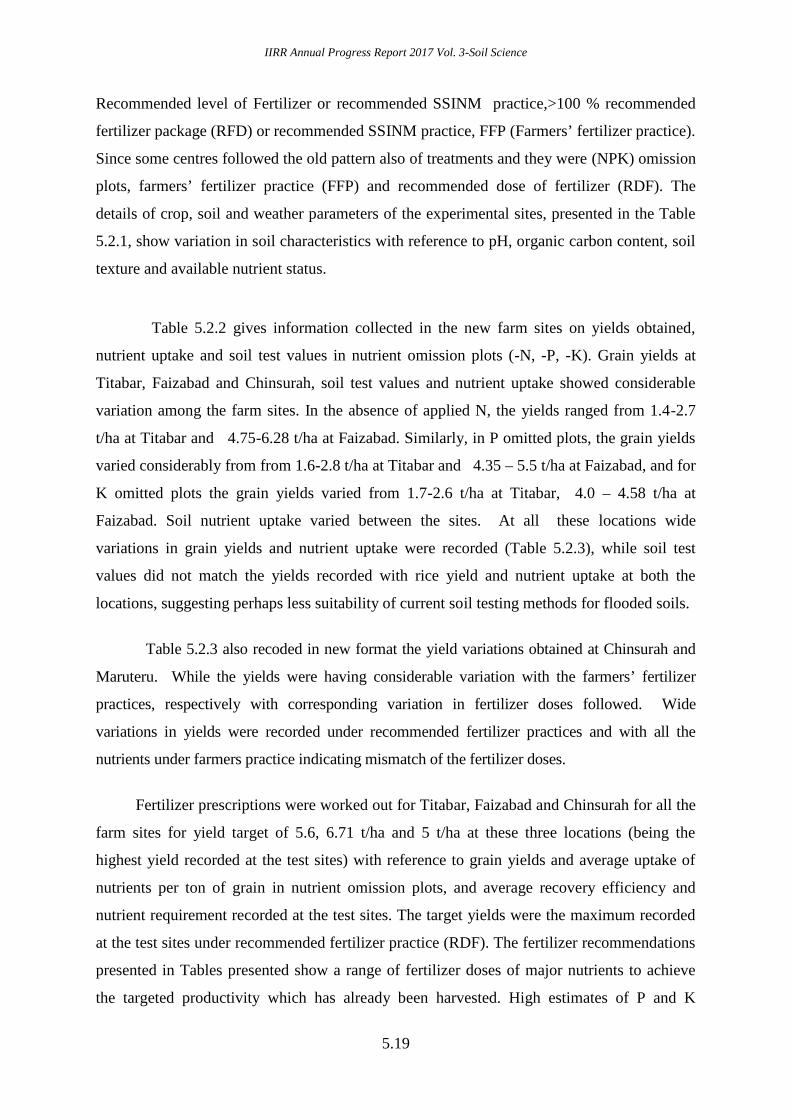
Recommended level of Fertilizer or recommended SSINM practice,>100 % recommended
fertilizer package (RFD) or recommended SSINM practice, FFP (Farmers’ fertilizer practice).
Since some centres followed the old pattern also of treatments and they were (NPK) omission
plots, farmers’ fertilizer practice (FFP) and recommended dose of fertilizer (RDF). The
details of crop, soil and weather parameters of the experimental sites, presented in the Table
5.2.1, show variation in soil characteristics with reference to pH, organic carbon content, soil
texture and available nutrient status.
Table 5.2.2 gives information collected in the new farm sites on yields obtained,
nutrient uptake and soil test values in nutrient omission plots (-N, -P, -K). Grain yields at
Titabar, Faizabad and Chinsurah, soil test values and nutrient uptake showed considerable
variation among the farm sites. In the absence of applied N, the yields ranged from 1.4-2.7
t/ha at Titabar and 4.75-6.28 t/ha at Faizabad. Similarly, in P omitted plots, the grain yields
varied considerably from from 1.6-2.8 t/ha at Titabar and 4.35 – 5.5 t/ha at Faizabad, and for
K omitted plots the grain yields varied from 1.7-2.6 t/ha at Titabar, 4.0 – 4.58 t/ha at
Faizabad. Soil nutrient uptake varied between the sites. At all these locations wide
variations in grain yields and nutrient uptake were recorded (Table 5.2.3), while soil test
values did not match the yields recorded with rice yield and nutrient uptake at both the
locations, suggesting perhaps less suitability of current soil testing methods for flooded soils.
Table 5.2.3 also recoded in new format the yield variations obtained at Chinsurah and
Maruteru. While the yields were having considerable variation with the farmers’ fertilizer
practices, respectively with corresponding variation in fertilizer doses followed. Wide
variations in yields were recorded under recommended fertilizer practices and with all the
nutrients under farmers practice indicating mismatch of the fertilizer doses.
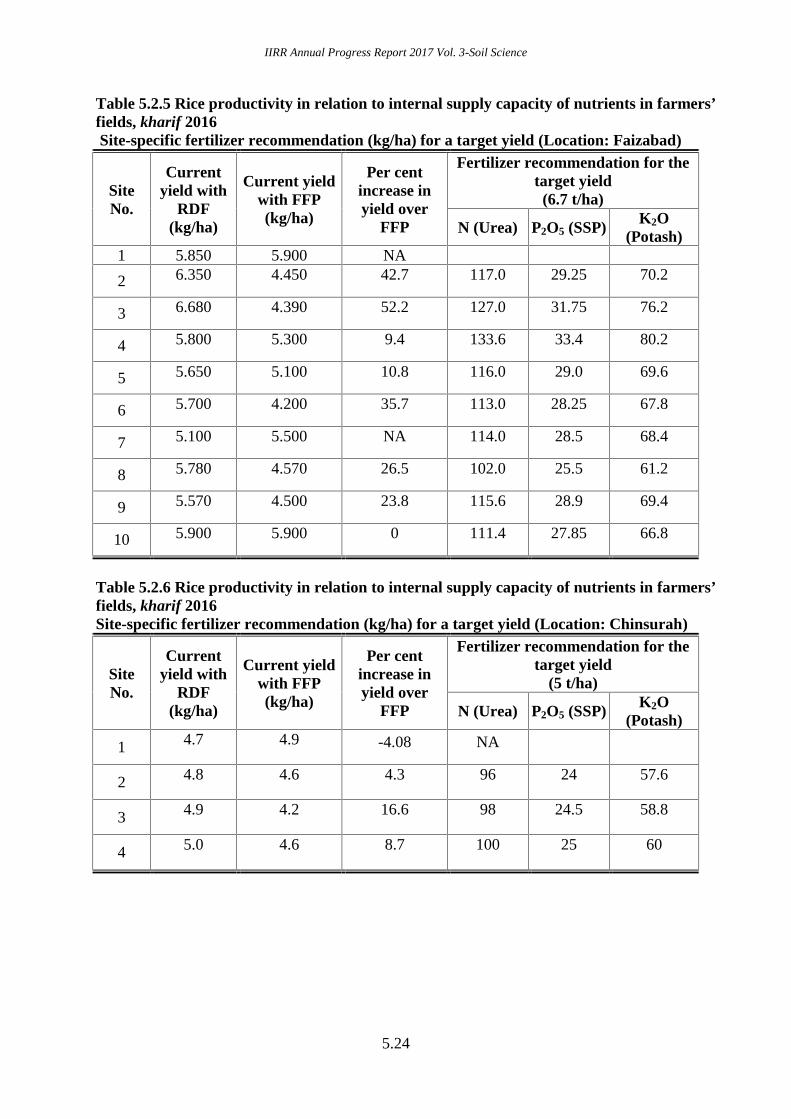
Fertilizer prescriptions were worked out for Titabar, Faizabad and Chinsurah for all the
farm sites for yield target of 5.6, 6.71 t/ha and 5 t/ha at these three locations (being the
highest yield recorded at the test sites) with reference to grain yields and average uptake of
nutrients per ton of grain in nutrient omission plots, and average recovery efficiency and
nutrient requirement recorded at the test sites. The target yields were the maximum recorded
at the test sites under recommended fertilizer practice (RDF). The fertilizer recommendations
presented in Tables presented show a range of fertilizer doses of major nutrients to achieve
the targeted productivity which has already been harvested. High estimates of P and K

IIRR Annual Progress Report 2017 Vol. 3-Soil Science
5.20
fertilizer requirements are due to lower recovery efficiency of applied P and higher
accumulation of potassium per ton of grain. The study, thus indicated ample scope for
improvement in nutrient use efficiency, and an attempt has been made to refine the current
blanket recommended dose of fertilizer based on site specific nutrient supply, nutrient use
efficiency and crop demand.
Yield Gap analysis
Yield gap analysis done for all farm fields sites. The need was assessed to ascertain
the gaps of technology and compared the yield variations under RDF, SSINM vis a vis
farmers field yield gaps. Technology Yield Gap I was estimated based on our recommended
practice of SSINM and a target yield and what was the prevalent grain yield in those farmers
sites and Yield Gap 2 was estimated based on our the RDF prevalent across the region as
recommended by the research farm /centre. This was compared with the performances at
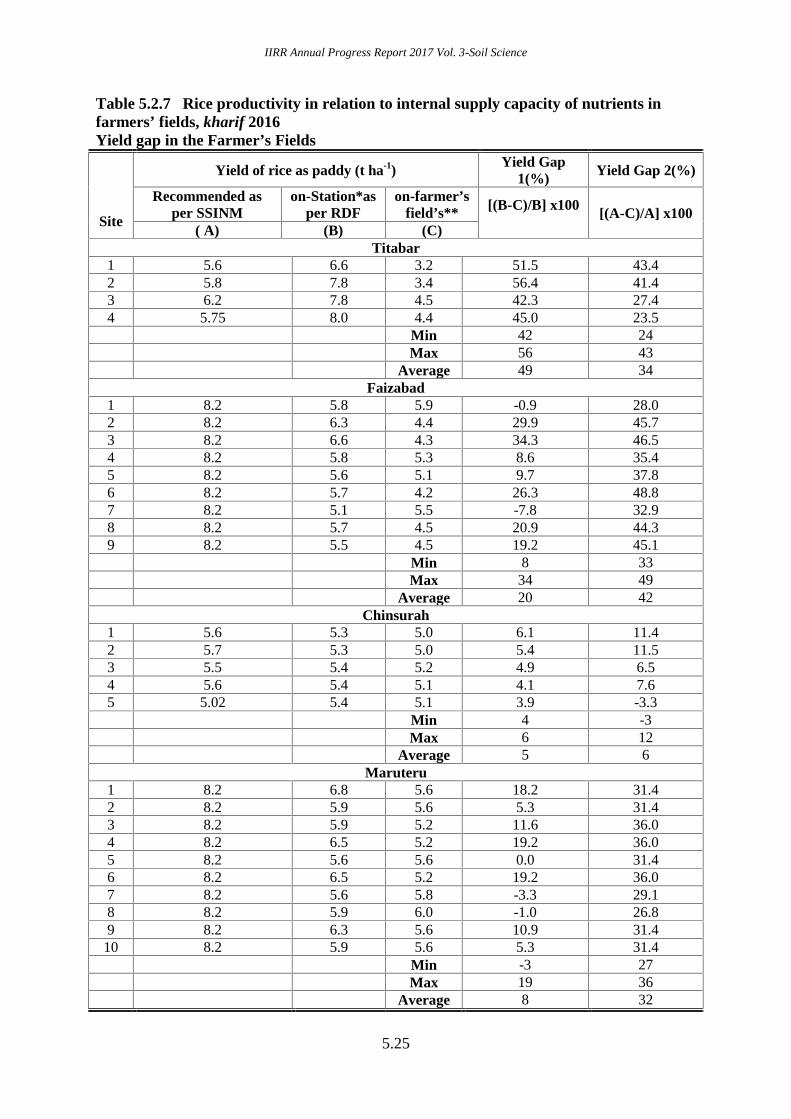
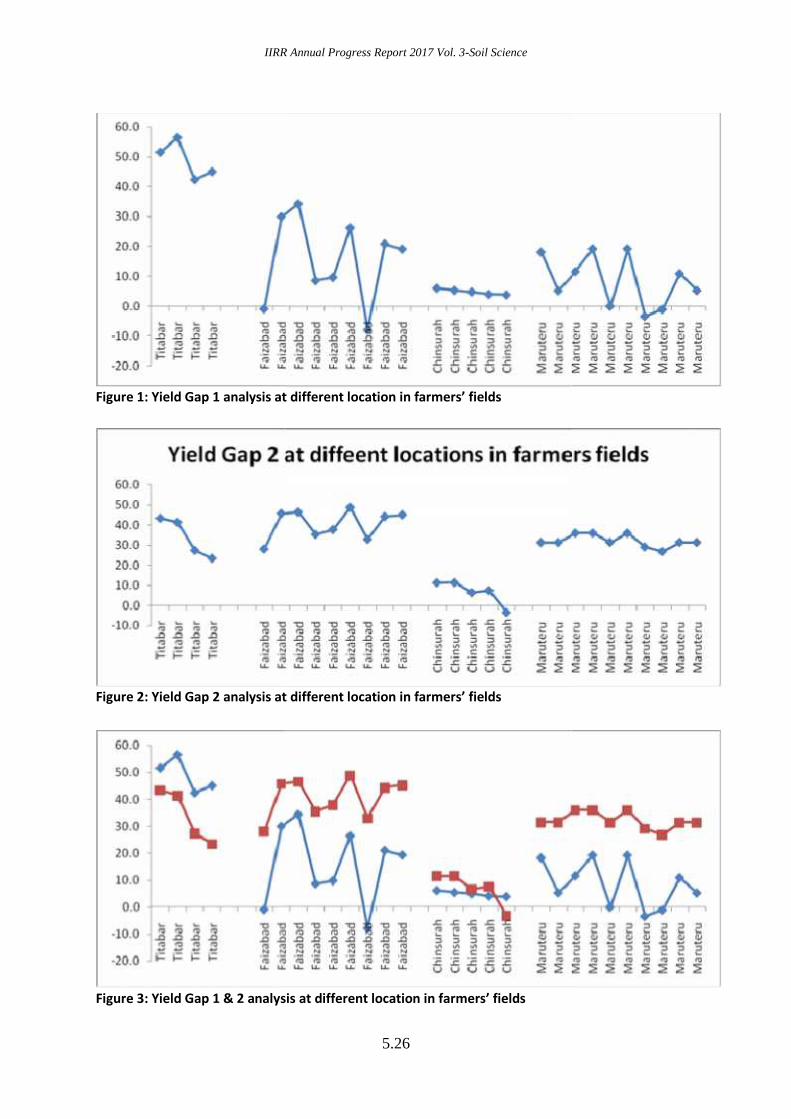
various farmers field selected. The results have been enlisted in the table no.5.2.6. Very high
yield gap 1 and 2 were noticed at Titabar almost to the tune of 50%. This shows a wide gap
of grain harvest existed. At Faizabad, yield Gap 1 was to the tune of almost 20% was almost
manageable. At chinsurah the yield gap analysis was the minimum since the targeted yields
fixed were comparatively low based on previous year’s performances. However, ample scope
existed at these centre to increase yields. At Maruteru, the yield gaps were not very high and
yields obtained at different farmers fields almost matched superior technology yields.
Summary:
This trial was conducted in farmers’ fields around few selected centres – Chinsurah,
Faizabad Titabar and Maruteru to assess the variability in nutrient supply, its relationship
with rice yields at current recommended and farmers’ fertilizer practices in some new farm
sites and fine-tune the fertilizer nutrient requirement for specific target yields in a given
environment and validation of fertilizer recommendations for targeted yields. The kharif 2017
data received representing the irrigated and shallow lowland rice ecosystems revealed wide
variations. Soil nutrient uptake varied between the sites matching with the dry matter yields.
In the absence of applied N, the yields ranged from 1.4-2.7 t/ha at Titabar and 4.75-6.28 t/ha
at Faizabad.. Similarly, in P omitted plots, the grain yields varied considerably from from
1.6-2.8 t/ha at Titabar and 4.35 – 5.5 t/ha at Faizabad, and for K omitted plots the grain
yields varied from 1.7-2.6 t/ha at Titabar, 4.0 – 4.58 t/ha at Faizabad. Soil nutrient uptake
varied between the sites. On an average each ton of grain accumulated 17.3, 5.0 and 32 kg N,

IIRR Annual Progress Report 2017 Vol. 3-Soil Science
5.21
P2O5 and K2O at Titabar, 24.5,12.2 and 21.1 kg N, P2O5 and K2O at Faizabad. Very high
yield gap 1 and 2 were noticed at Titabar almost to the tune of 50%. This shows a wide gap
of grain harvest existed. At Faizabad, yield Gap 1 was to the tune of almost 20% was almost
manageable. At Chinsurah the yield gap analysis was the minimum since the targeted yields
fixed were comparatively low based on previous year’s performances. However, ample scope
existed at these centre to increase yields. At Maruteru, the yield gaps were not very high and
yields obtained at different farmers fields almost matched superior technology yields.

IIRR Annual Progress Report 2017 Vol. 3-Soil Science
5.22
Table 5.2.1 Rice productivity in relation to internal supply capacity of nutrients in farmers’fields, kharif 2017
Soil, crop and weather dataParameter Titabar Faizabad Chinsurah Maruteru
Variety RanjitNDR 2065,Sarjoo-52 &
Sambha Sub-1Shatabdi (IET 4786)
NA
Crop growth Good Satisfactory Good NARFD (kgNPK/ha)
- 120:60:60 80-40-40NA
Farmers’fertilizer practice
(kg/ha) (FFP)
Varying,Varying,
N 80 –242;P 40 – 134;K 40 -1210
Varying,N 60P 30K 30
NA
% Clay - 23 - NA% Silt - 21 - NA
% Sand - 56 - NASoil Texture - Sandy Loam Clay loam NA
pH 5.06-5.7 7.3-7.6 6.8 NA
Org. carbon (%) 0.56-1.260.37 – 0.48
NANA
Avail. N (kg/ha) 188 - 297 175-230 297 NAAvail. P2O5
(kg/ha)19.8-32 19-27 57
NA
Avail. K2O(kg/ha)
165-274 200-230 348NA
Table 5.2.2 Rice productivity in relation to internal supply capacity of nutrients in farmers’fields, kharif 2017 - Soil nutrient supply potential assessed in nutrient omission plots
NutrientTitabar Faizabad
Minimum Maximum Mean* Minimum Maximum Mean**Grain yield (t/ha)
(-)N 1.4 2.7 2.2 4.75 6.28 5.52(-)P 1.6 2.8 2.1 4.35 5.55 4.85(-)K 1.7 2.6 2.2 4.0 4.56 4.27
Soil test values (kg/ha)N 320 488 3 81 175 210 190P2O5 15 28 21 19 27 23K2O 125 198 253 240 230 214
Nutrient uptake (kg/ha)N 30.4 45.6 38.1 107.5 173.4 135.6P2O5 6.4 16.3 10.6 44 84 59.2K2O 54.3 86.6 71.4 79.5 118.5 90.5

IIRR Annual Progress Report 2017 Vol. 3-Soil Science
5.23
Table 5.2.3 Rice productivity in relation to internal supply capacity of nutrients in farmers’fields, kharif 2017 - Soil nutrient uptake
Nutrient
Titabar FaizabadMeanyield(t/ha)
Meanuptake(kg/ha)
SNA(kg/t grain)
Meanyield(t/ha)
Meanuptake (kg/ha)
SNA(kg/t
grain)N 2.2 38.1 17.3 5.5 30.9 24.5P2O5 2.1 10.6 5.0 4.8 45.8 12.2K2O 2.2 71.4 32.5 4.2 34.5 21.1
Nutrient
Chinsurah Maruteru Mean uptake
Meanyield(t/ha)
Meanyield(t/ha)
SNA(kg/tgrain)
Meanuptake N(kg/ha)
Mean uptakeP2O5 (kg/ha)
Meanuptake
K2O(kg/ha)
T1 4.26 6.1 NA 173.3 23.6 301.4T2 4.50 5.3 NA 165.9 29.2 333.5T3 4.3 NA NA NA NA NAT4 4.87 6.12 NA 165.1 63.9 431.5T5 4.60 NA NA NA NA NASNA=Soil Nutrient Availability
Table 5.2.4 Rice productivity in relation to internal supply capacity of nutrients in farmers’fields, kharif 2017Site-specific fertilizer recommendation (kg/ha) for a target yield (Location: Titabar)
Site No.Current
yield withRDF (kg/ha)
Current yieldwith FFP(kg/ha)
Per centincrease in
yield over FFP
Fertilizer recommendation for thetarget yield
(5.6 t/ha)N (Urea) P2O5 (SSP) K2O (Potash)
1 4.6 1.5 360 92 23 55.22 3.8 1.6 280 76 19 45.63 3.9 2 290 78 19.5 46.84 3.8 1.9 280 76 19 45.65 3.9 1.6 290 78 19.5 46.86 3.9 1.3 290 78 19.5 46.87 3.4 2.1 240 68 17 40.88 3.8 1.9 280 76 19 45.69 5.5 2.1 450 110 27.5 6610 4.4 1.55 345 88 22 52.811 4.8 1.9 385 96 24 57.612 4.9 2.1 390 98 24.5 58.813 4.5 1.6 355 90 22.5 5414 5.4 2.1 440 108 27 64.815 4.8 1.9 380 96 24 57.616 4.8 2.1 380 96 24 57.617 4.7 2.1 375 94 23.5 56.418 5.6 2.2 460 112 28 67.219 4.9 2.1 395 98 24.5 58.820 5.2 2.3 425 104 26 62.4
IIRR Annual Progress Report 2017 Vol. 3-Soil Science
5.24
Table 5.2.5 Rice productivity in relation to internal supply capacity of nutrients in farmers’fields, kharif 2016Site-specific fertilizer recommendation (kg/ha) for a target yield (Location: Faizabad)
SiteNo.
Currentyield with
RDF(kg/ha)
Current yieldwith FFP(kg/ha)
Per centincrease inyield over
FFP
Fertilizer recommendation for thetarget yield
(6.7 t/ha)
N (Urea) P2O5 (SSP)K2O
(Potash)1 5.850 5.900 NA
2 6.350 4.450 42.7 117.0 29.25 70.2
3 6.680 4.390 52.2 127.0 31.75 76.2
4 5.800 5.300 9.4 133.6 33.4 80.2
5 5.650 5.100 10.8 116.0 29.0 69.6
6 5.700 4.200 35.7 113.0 28.25 67.8
7 5.100 5.500 NA 114.0 28.5 68.4
8 5.780 4.570 26.5 102.0 25.5 61.2
9 5.570 4.500 23.8 115.6 28.9 69.4
10 5.900 5.900 0 111.4 27.85 66.8
Table 5.2.6 Rice productivity in relation to internal supply capacity of nutrients in farmers’fields, kharif 2016Site-specific fertilizer recommendation (kg/ha) for a target yield (Location: Chinsurah)
SiteNo.
Currentyield with
RDF(kg/ha)
Current yieldwith FFP(kg/ha)
Per centincrease inyield over
FFP
Fertilizer recommendation for thetarget yield
(5 t/ha)
N (Urea) P2O5 (SSP) K2O(Potash)
1 4.7 4.9 -4.08 NA
2 4.8 4.6 4.3 96 24 57.6
3 4.9 4.2 16.6 98 24.5 58.8
4 5.0 4.6 8.7 100 25 60
IIRR Annual Progress Report 2017 Vol. 3-Soil Science
5.25
Table 5.2.7 Rice productivity in relation to internal supply capacity of nutrients infarmers’ fields, kharif 2016Yield gap in the Farmer’s Fields
Site
Yield of rice as paddy (t ha-1) Yield Gap1(%) Yield Gap 2(%)
Recommended asper SSINM
on-Station*asper RDF
on-farmer’sfield’s** [(B-C)/B] x100 [(A-C)/A] x100
( A) (B) (C)Titabar
1 5.6 6.6 3.2 51.5 43.42 5.8 7.8 3.4 56.4 41.43 6.2 7.8 4.5 42.3 27.44 5.75 8.0 4.4 45.0 23.5
Min 42 24Max 56 43
Average 49 34Faizabad
1 8.2 5.8 5.9 -0.9 28.02 8.2 6.3 4.4 29.9 45.73 8.2 6.6 4.3 34.3 46.54 8.2 5.8 5.3 8.6 35.45 8.2 5.6 5.1 9.7 37.86 8.2 5.7 4.2 26.3 48.87 8.2 5.1 5.5 -7.8 32.98 8.2 5.7 4.5 20.9 44.39 8.2 5.5 4.5 19.2 45.1
Min 8 33Max 34 49
Average 20 42Chinsurah
1 5.6 5.3 5.0 6.1 11.42 5.7 5.3 5.0 5.4 11.53 5.5 5.4 5.2 4.9 6.54 5.6 5.4 5.1 4.1 7.65 5.02 5.4 5.1 3.9 -3.3
Min 4 -3Max 6 12
Average 5 6Maruteru
1 8.2 6.8 5.6 18.2 31.42 8.2 5.9 5.6 5.3 31.43 8.2 5.9 5.2 11.6 36.04 8.2 6.5 5.2 19.2 36.05 8.2 5.6 5.6 0.0 31.46 8.2 6.5 5.2 19.2 36.07 8.2 5.6 5.8 -3.3 29.18 8.2 5.9 6.0 -1.0 26.89 8.2 6.3 5.6 10.9 31.410 8.2 5.9 5.6 5.3 31.4
Min -3 27Max 19 36
Average 8 32
IIRR Annual Progress Report 2017 Vol. 3-Soil Science
5.26
Figure 1: Yield Gap 1 analysis at different location in farmers’ fields
Figure 2: Yield Gap 2 analysis at different location in farmers’ fields
Figure 3: Yield Gap 1 & 2 analysis at different location in farmers’ fields
IIRR Annual Progress Report 2017 Vol. 3-Soil Science
5.26
Figure 1: Yield Gap 1 analysis at different location in farmers’ fields
Figure 2: Yield Gap 2 analysis at different location in farmers’ fields
Figure 3: Yield Gap 1 & 2 analysis at different location in farmers’ fields
IIRR Annual Progress Report 2017 Vol. 3-Soil Science
5.26
Figure 1: Yield Gap 1 analysis at different location in farmers’ fields
Figure 2: Yield Gap 2 analysis at different location in farmers’ fields
Figure 3: Yield Gap 1 & 2 analysis at different location in farmers’ fields

IIRR Annual Progress Report 2017 Vol. 3-Soil Science
5.27
5.3 Screening of Germplasm for Sodicity and Management of Sodic Soils in RBCS
Sodic soils have high soil pH (8.5 - 11.0) and exchangeable sodium percentage (ESP)
of greater or equal to 15, low organic matter content and a preponderance of carbonates and
bicarbonates of sodium or excess salt content which strongly modify the availability of
micronutrients and thereby crop productivity.Such soils can be managed in two ways viz.
either by growing a crop variety suitable for a particular soil or by ameliorating the soil
through the application of soil amendments. Keeping these points in view, a trial was initiated
in kharif 2014 to screen germplasm for tolerance to sodicity and higher rice productivity
under three levels of ameliorative gypsum application {(0, 50 and 100% gypsum
recommendation (GR)] in addition to the recommended dose of NPK. The results of the trial
conducted in rabi 2016-17 and kharif 2017 at Faizabad, Kanpur and Mandya are presented in
Tables 5.3.1 to 5.3.12.
Wheat yields (rabi 2016-17)
Gypsum application increased rabi wheat yields at Kanpur (Table 5.3.2). The highest
grain and straw yields were observed in 100% GR (4.25 and 5.04 t/ha) followed by 50% GR
(3.26 and 3.88 t/ha). The lowest grain and straw yields were observed in the treatment
without gypsum (1.63 t/ha and 1.96 t/ha, respectively).
Yield parameters (kharif 2017)
Significant differences were observed among different rice varieties for all the yield
parameters at Faizabad when cultivated under natural sodic conditions(Table 5.3.3). The
genotype NDRK 50051 produced the highest number of tillers/m2(304) and
panicles/m2(298)followed byIRSSTN 30 (299 tillers/m2 and 294 panicles/m2 respectively)
NDRK50063 (298 tillers/m2 and 295 panicles/m2 respectively). The genotype IRSSTN 151
produced the lowest number of tillers/m2 and panicles/m2 (183 and 179 respectively). The
number of filled grains/panicle ranged from a low 150 (NDRK 50060) to a high of 262
(IRSSTN 110). The highest 1000 grain weight was observed in IRSSTN 24 (26.0g), while the
genotype NDRK 50071 produced grains with the lowest 1000 grain weight (19.90 g).
Gypsum application at 50% GR and 100% GR increased the panicles/m2 and panicle
weight of the genotypes evaluated at Kanpur compared to the treatment without gypsum
(Table 5.3.4).The highest number of panicles was produced by DRR Dhan 46 (panicles
551/m2) after application of gypsum at 100 % GR. An increase of 31%-63% and 26% - 38%
in panicle/m2 and panicle weight was observed due to gypsum application. Among the

IIRR Annual Progress Report 2017 Vol. 3-Soil Science
5.28
varieties, DRR Dhan 42 produced the highest number of panicles/m2at 0% GR (360), 50%
GR (462) while at 100% GR the highest number of panicles/m2 were observed in DRR Dhan
46 (551) followed by DRR Dhan 42 (547).The genotype TI-63 produced 269, 368 and 456
panicles/m2 at 0, 50% GR and 100% GR respectively, the lowest among the seventeen
genotypes evaluated.
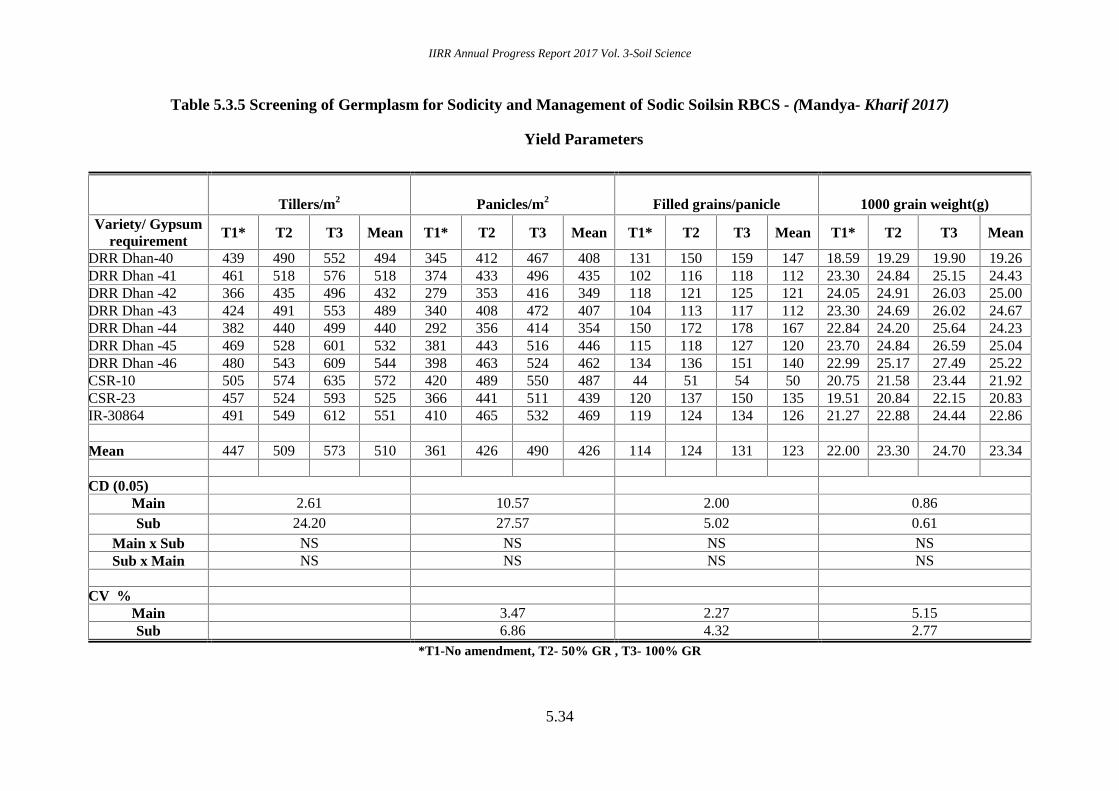
The yield parameters assessed at Mandya were significantly influenced by both
gypsum application and varietal differences, though no interactive effects were observed
(Table 5.3.5). Gypsum application at 50% GR and 100% GR resulted in 13.8-28.1, 18.0-35.7,
8.7-14.9 and 5.9-12.2 percent increases in tillers/m2, panicles/m2 filled grains/panicle and
1000 grain weight respectively, compared to control which did not receive gypsum. CSR 10,
among genotypes, produced the highest tillers (505, 574, 635), panicles/m2 (420, 489, 550)
and the lowest (44, 51, 54) filled grains/panicle at 0% 50% and 100% GR application,
respectively. The highest filled grains/panicle was observed in DRR Dhan 44 which produced
150, 172 and 178 grains in a panicle when supplied with 0% 50% and 100% GR. In the
treatment that did not receive gypsum (0% GR) the thousand grain weight of DRR Dhan 42
was highest (24.05g). DRR Dhan 46 produced grains with the highest thousand grain weight
(25.17 and 27.49 g) with gypsum application at 50% GR and 100% GR rates respectively.
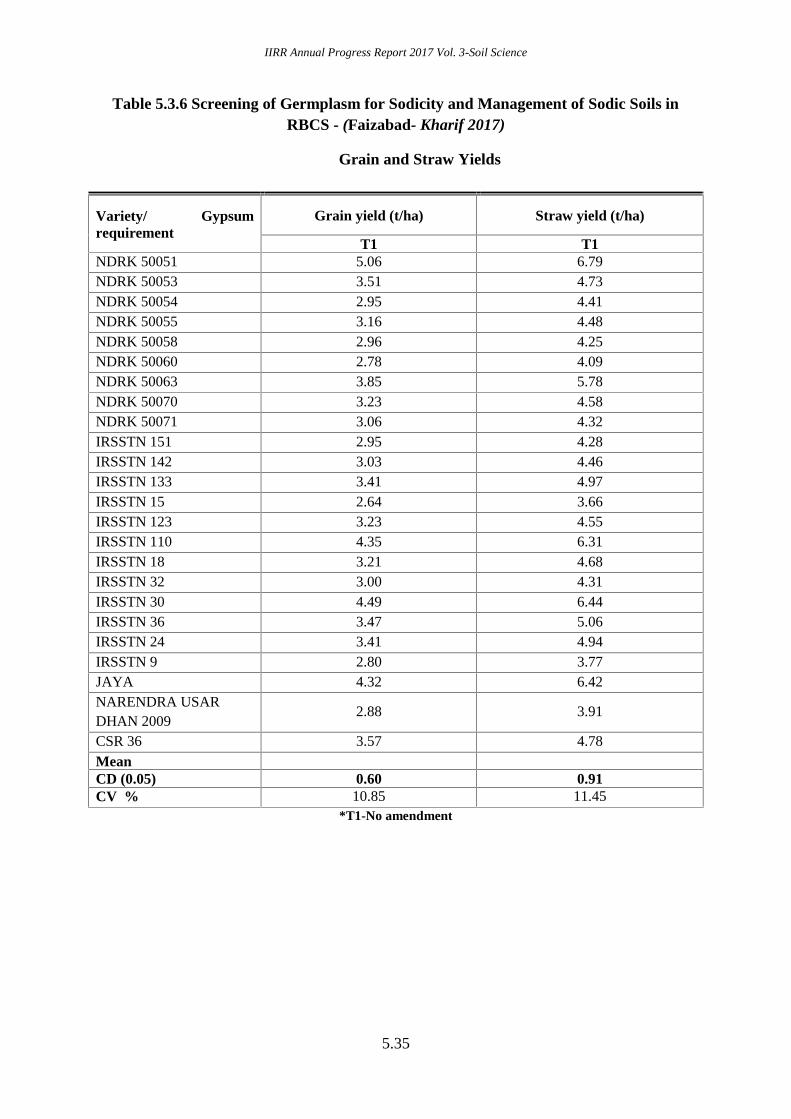
Grain and Straw yields (kharif 2017)
Grain and straw yields of the genotypes were significantly influenced by the sodic
conditions at Faizabad (Table 5.3.6). NDRK 500051 recorded the highest grain and straw
yields (5.06 t/ha and 6.79 t/ha respectively), followed by IRSSTN 30 (4.49 t/ha and 6.44 t/ha
respectively), IRSSTN 110 (4.35 t/ha and 6.31 t/ha respectively), Jaya (4.32 t/ha and 6.42 t/ha
respectively) and NDRK 50063(3.85 t/ha and 5.78t/ha respectively).The lowest yielding
genotype was IRSSTN 15 with grain and straw yields of 2.64 t/ha and 3.66 t/ha respectively.
Application of gypsum in conjunction with recommended dose of NPK significantly
influenced yields of kharif rice at Kanpur (Table 5.3.7). Grain and straw yields at 50% GR
and 100% GR increased over control (without gypsum amendment) by 66%-127% and 64% -
122% respectively. The highest grain yields of 4.63 t/ha, 4.57 t/ha, 4.50 t/ha, 4.48 t/ha and
4.43 t/ha was observed with DRR Dhan 46, DRR Dhan 42, DRR Dhan 45, DRR Dhan 43,
DRR Dhan 44 and DRR Dhan 40 respectively under recommended NPK + 100% GR
fertilization.Straw yield also followed similar trends with DRR Dhan 46 yielding 5.39 t/ha,
followed by DRR Dhan 42, DRR Dhan 45, DRR Dhan 43, DRR Dhan 44 and DRR Dhan 40
with straw yields ranging from 5.12-5.31 t/ha under the same fertilization regime.The same

IIRR Annual Progress Report 2017 Vol. 3-Soil Science
5.29
genotypes also performed better at 0% and 50% GR.Significant interaction effects were
observed between genotypes and gypsum application. DRR Dhan 46 fertilized with
recommended dose of NPK with 100% GR application recorded the highest grain and straw
yields (4.63 and 5.39 t/ha respectively).The genotype TI93 fertilized with only the
recommended dose of NPK recorded the lowest grain (1.49 t/ha) and straw (1.77 t/ha) yields.
Significantly higher grain and straw yield of rice was observed at Mandya due to
gypsum application compared to control which did not receive gypsum (Table 5.3.8). Grain
yields increased by 7% with 50% GR and by 15% with application of 100% GR. Straw yields
at 100% GR and 50% GR increased over control (without gypsum amendment) by 19% and
8%, respectively. Compared to all the genotypes evaluated, IR 30864 recorded the highest
yields at 0% GR (5.33 t/ha), 50% GR (5.72 t/ha) and 100% GR (5.89 t/ha). The other
genotypes that recorded higher yields at 100% GR are DRR Dhan 41 (5.57 t/ha), CSR 23
(5.51 t/ha), DRR Dhan 43 (5.49 t/ha) and DRR Dhan 40 (5.27 t/ha). In the treatment without
gypsum amendment also DRR Dhan 41 (5.27 t/ha), DRR Dhan 40 (4.95 t/ha), CSR 23 (4.64
t/ha) and DRR Dhan 43 (4.72 t/ha) produced the highest yields. Straw yields mostly followed
the same trends at Mandya.
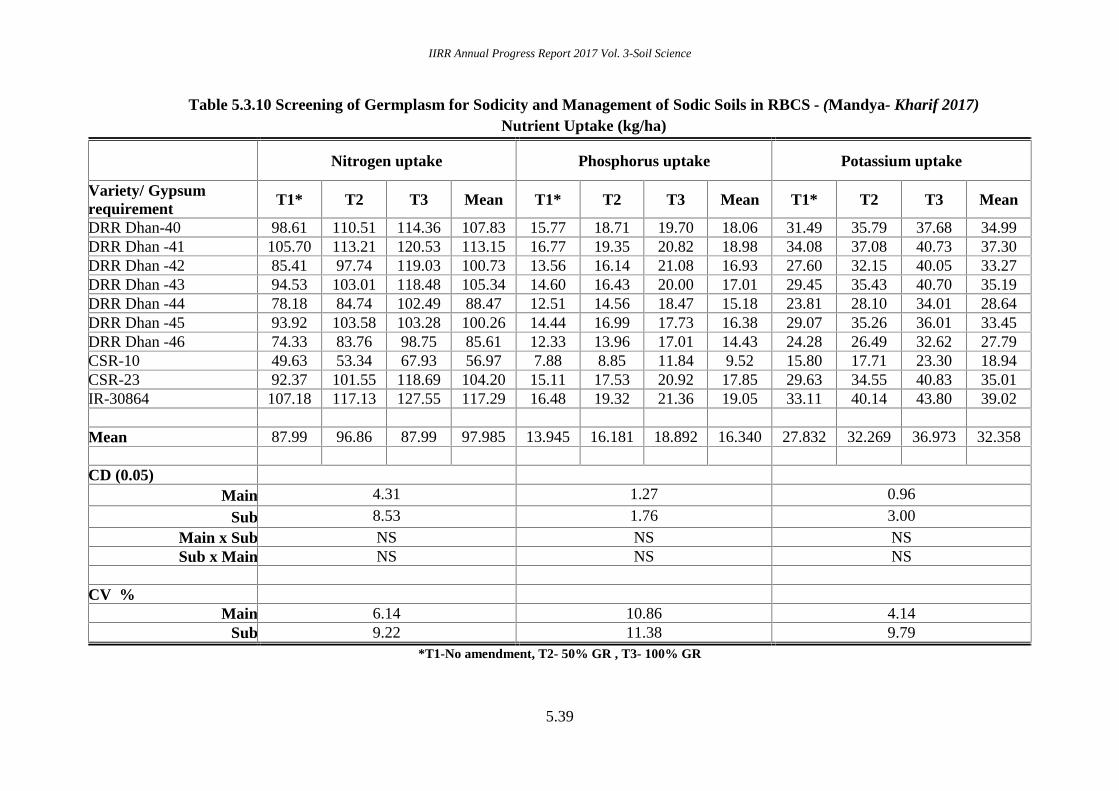
Nutrient uptakes (kharif 2017)
Nutrient uptake varied significantly between genotypes at Faizabad (Table 5.3.9). The
highest N uptake was recorded in IRRSTN 110 (121.79 kg/ha). Similar, comparable higher
nitrogen uptake was also observed in IRRSTN 30 (118.89 kg/ha), Jaya (115.75 kg/ha) and
NDRK 50051 (105.22 kg/ha). The highest P and K uptakes among the various genotypes
were also recorded by IRRSTN 110 (42.74 and 74.74 kg/ha respectively), IRRSTN 30 (48.74
and 76.69 kg/ha respectively), Jaya (45.66 and 74.55 kg/ha respectively) and NDRK 50051
(40.82 and 79.68 kg/ha respectively).NDRK 50054 recorded the lowest N uptake (54.13
kg/ha) while IRSSTN 9 displayed the lowest P and K uptake (19.69 and 39.55 respectively).
Gypsum application and varietal differences contributed to the differences in nutrient
uptake observed at Mandya (Table 5.3.10). Gypsum applied at 50% GR and 100% GR rates
in addition to the recommended doses of NPK increased nitrogen uptake (96.86 and 87.99
kg/ha respectively), phosphorus uptake (16.18 and 18.8 kg/ha respectively) and potassium
uptake (32.27 and 36.97 kg/ha respectively) compared to the control that received only NPK
fertilization (N, P and K uptake of 87.99, 13.94 and 27.83 kg/ha respectively). The genotype
IR30864 had the highest N, P and K uptake at 0%, 50% and 100%GR application with values
IIRR Annual Progress Report 2017 Vol. 3-Soil Science
5.30
ranging from 107.18-127.55 kg N/ha, 16.48 – 21.36 kg P/ha and 33.11-43.80 kg K/ha
followed by DRR Dhan 41.
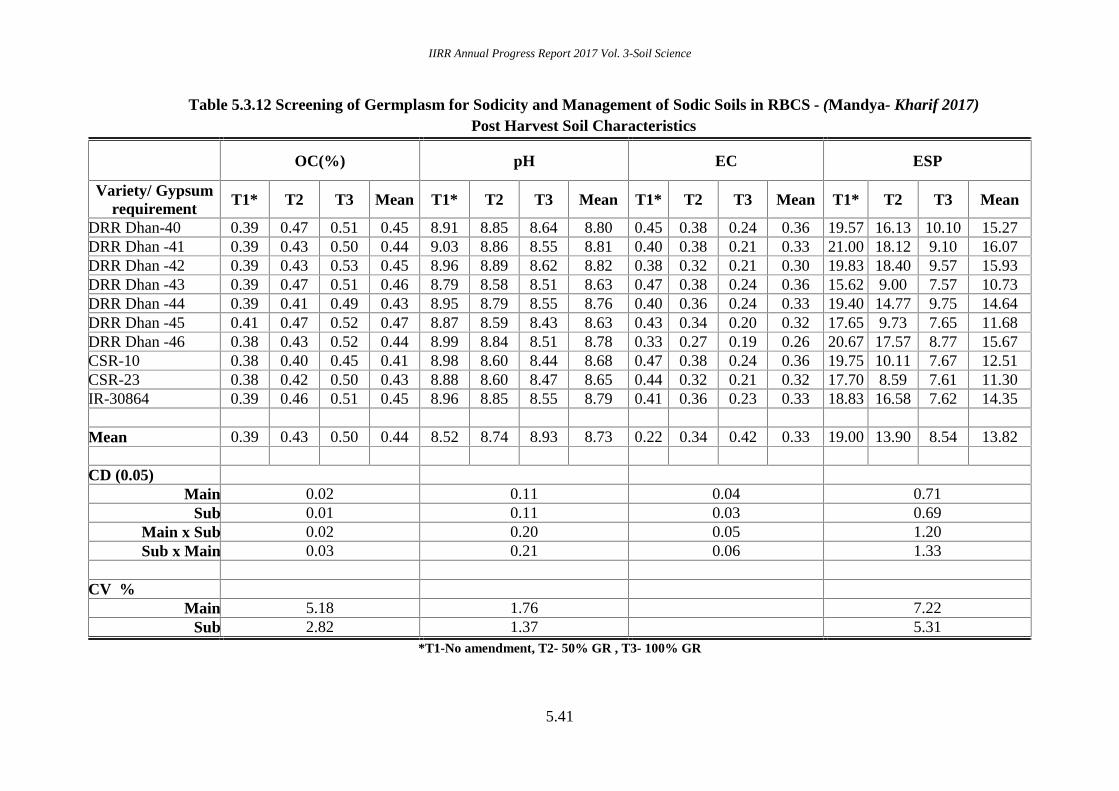
Post harvest soil characteristics
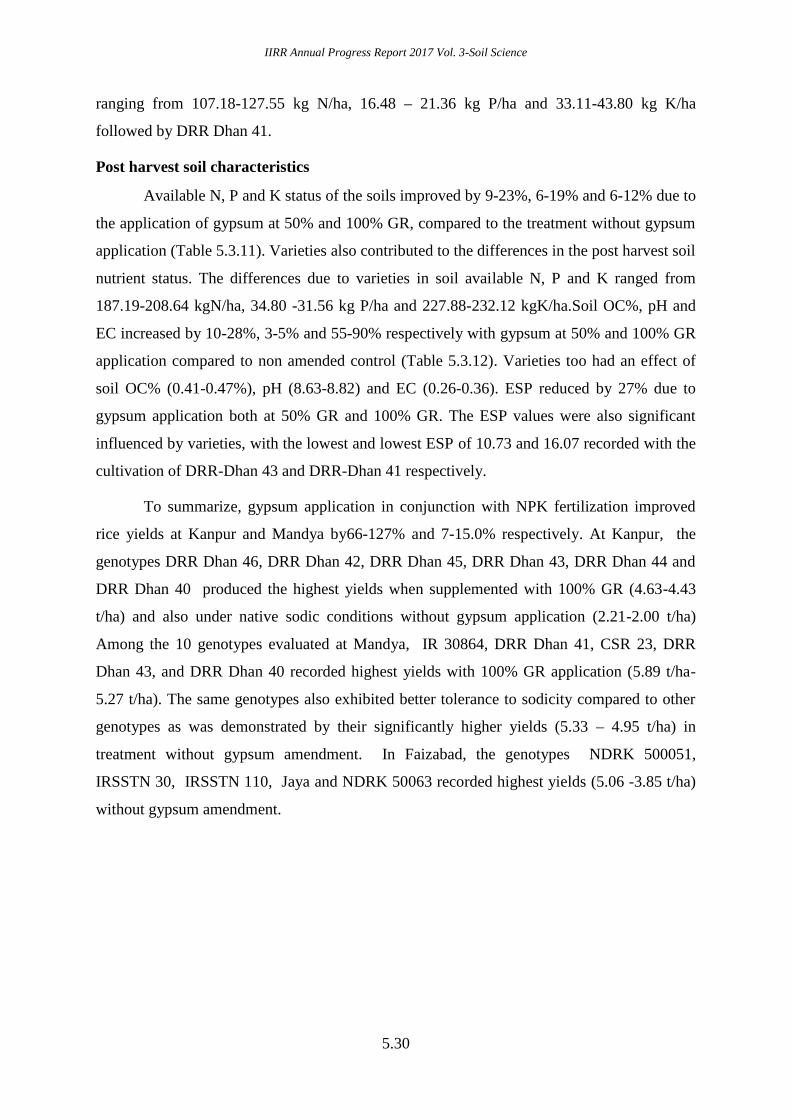
Available N, P and K status of the soils improved by 9-23%, 6-19% and 6-12% due to
the application of gypsum at 50% and 100% GR, compared to the treatment without gypsum
application (Table 5.3.11). Varieties also contributed to the differences in the post harvest soil
nutrient status. The differences due to varieties in soil available N, P and K ranged from
187.19-208.64 kgN/ha, 34.80 -31.56 kg P/ha and 227.88-232.12 kgK/ha.Soil OC%, pH and
EC increased by 10-28%, 3-5% and 55-90% respectively with gypsum at 50% and 100% GR
application compared to non amended control (Table 5.3.12). Varieties too had an effect of
soil OC% (0.41-0.47%), pH (8.63-8.82) and EC (0.26-0.36). ESP reduced by 27% due to
gypsum application both at 50% GR and 100% GR. The ESP values were also significant
influenced by varieties, with the lowest and lowest ESP of 10.73 and 16.07 recorded with the
cultivation of DRR-Dhan 43 and DRR-Dhan 41 respectively.
To summarize, gypsum application in conjunction with NPK fertilization improved
rice yields at Kanpur and Mandya by66-127% and 7-15.0% respectively. At Kanpur, the
genotypes DRR Dhan 46, DRR Dhan 42, DRR Dhan 45, DRR Dhan 43, DRR Dhan 44 and
DRR Dhan 40 produced the highest yields when supplemented with 100% GR (4.63-4.43
t/ha) and also under native sodic conditions without gypsum application (2.21-2.00 t/ha)
Among the 10 genotypes evaluated at Mandya, IR 30864, DRR Dhan 41, CSR 23, DRR
Dhan 43, and DRR Dhan 40 recorded highest yields with 100% GR application (5.89 t/ha-
5.27 t/ha). The same genotypes also exhibited better tolerance to sodicity compared to other
genotypes as was demonstrated by their significantly higher yields (5.33 – 4.95 t/ha) in
treatment without gypsum amendment. In Faizabad, the genotypes NDRK 500051,
IRSSTN 30, IRSSTN 110, Jaya and NDRK 50063 recorded highest yields (5.06 -3.85 t/ha)
without gypsum amendment.

IIRR Annual Progress Report 2017 Vol. 3-Soil Science
5.31
Table 5.3.1 Screening of Germplasm for Sodicity and Management of Sodic Soils inRBCS
Soil and Crop CharacteristicsParameter Kanpur Mandya Faizabad
Cropping system Rice - Wheat Rice Rice- Wheat
VarietyKharif (Rice) 17 genotypes 10 genotypes 24 genotypes
Rabi (Wheat) PBW-343 - -
RFD (Kg NPKZn/ha)Kharif
150:60:40:50 125:50:50:40 120:60:60:25
Gypsum requirement 16.0 t /ha -
% Clay 17 46.52 21
% Silt 34 35.24 55
% Sand 49 18.24 24
Soil Texture Clay Loam,TypicNatrustalf
Clay Slit Clay
pH (1:1) 10.2 9.063 9.2
Organic carbon (%) 0.18 0.368 0.38
CEC [c mol(p+)/kg] 12.27 34.7 -
EC (dS/m) 0.98 0.583 2.80
ESP (%) 78 22.58 -
Available N (kg/ha) 145.3 156.8 212
Available P2O5 (kg/ha) 28.5 27.4 22.5
Available K2O (kg/ha) 242.6 194.6 231.5
Table 5.3.2 Screening of Germplasm for Sodicity and Management of Sodic Soils inRBCS, (Kanpur- Rabi 2016-17)
Grain and Straw Yield of Rabi Wheat
Gypsum Req. Grain yield (t/ha) Straw yield (t/ha)
T1-No amendment 1.63 1.96T2- 50% GR 3.26 3.88T3- 100% GR 4.25 5.04
*T1-No amendment, T2- 50% GR , T3- 100% GR

IIRR Annual Progress Report 2017 Vol. 3-Soil Science
5.32
Table 5.3.3 Screening of Germplasm for Sodicity and Management of Sodic Soils inRBCS - (Faizabad- Kharif 2017)
Yield Parameters
Variety/ Gypsumrequirement
Tillers/m2 Panicles/m2 Filledgrains/panicle
1000 grainweight(g)
T1 T1 T1 T1NDRK 50051 304 298 254 23.30NDRK 50053 282 279 204 21.20NDRK 50054 269 266 172 22.20NDRK 50055 277 272 172 22.40NDRK 50058 256 251 155 20.90NDRK 50060 267 259 150 21.70NDRK 50063 298 295 242 23.80NDRK 50070 217 214 209 23.70NDRK 50071 192 190 228 19.90IRSSTN 151 183 179 158 23.40IRSSTN 142 201 198 255 23.30IRSSTN 133 245 241 260 22.70IRSSTN 15 217 212 221 23.40IRSSTN 123 271 267 238 24.30IRSSTN 110 286 279 262 20.60IRSSTN 18 266 261 226 20.30IRSSTN 32 294 288 150 21.20IRSSTN 30 299 294 257 24.50IRSSTN 36 271 267 231 22.90IRSSTN 24 301 295 185 26.00IRSSTN 9 259 255 163 24.40JAYA 297 291 258 22.70Narendra UsarDhan 2009 276 272 163 23.00CSR 36 276 272 242 24.70
CD (0.05) 42.87 41.62 21.02 1.01CV % 9.93 9.81 6.07 2.69
*T1-No amendment

IIRR Annual Progress Report 2017 Vol. 3-Soil Science
5.33
Table 5.3.4 Screening of Germplasm for Sodicity and Management of Sodic Soilsin RBCS - (Kanpur- Kharif 2017)
Yield Parameters
Panicles m-2 Panicle wt (g)Variety/ Gypsumrequirement
T1* T2 T3 Mean T1* T2 T3 Mean
DRR Dhan-40 340 444 537 440 1.28 1.62 1.76 1.55
DRR Dhan -41 332 430 536 432 1.28 1.60 1.76 1.55
DRR Dhan -42 360 462 547 456 1.32 1.64 1.80 1.59
DRR Dhan -43 350 451 538 446 1.30 1.63 1.80 1.58
DRR Dhan -44 339 440 535 438 1.29 1.62 1.79 1.57
DRR Dhan -45 356 455 539 450 1.31 1.63 1.80 1.58
DRR Dhan -46 357 459 551 456 1.34 1.65 1.82 1.60
HRI-196 282 396 473 383 1.21 1.54 1.68 1.48
HRI-197 302 400 515 406 1.22 1.56 1.69 1.49
27 P 22 309 400 524 411 1.22 1.57 1.69 1.49
27 P 36 318 414 541 424 1.25 1.59 1.72 1.52
27 P 63 320 425 540 429 1.27 1.59 1.75 1.54
28 P 09 317 408 534 420 1.23 1.58 1.71 1.51
B/V-243 297 396 497 397 1.21 1.55 1.69 1.48
B/V-344 312 409 535 418 1.22 1.58 1.70 1.50
TI-93 269 368 456 364 1.21 1.52 1.68 1.47
CSR-43 318 421 541 427 1.27 1.59 1.74 1.53
Mean 322 422 526 423 1.26 1.59 1.74 1.53
CD (0.05)
Main 3.14 5.51
Sub 4.70 5.35
Main x Sub 8.14 9.27
Sub x Main 8.46 0.01
CV %
Main 1.35 0.65
Sub 1.19 0.37
*T1-No amendment, T2- 50% GR , T3- 100% GR
IIRR Annual Progress Report 2017 Vol. 3-Soil Science
5.34
Table 5.3.5 Screening of Germplasm for Sodicity and Management of Sodic Soilsin RBCS - (Mandya- Kharif 2017)
Yield Parameters
Tillers/m2 Panicles/m2 Filled grains/panicle 1000 grain weight(g)Variety/ Gypsum
requirement T1* T2 T3 Mean T1* T2 T3 Mean T1* T2 T3 Mean T1* T2 T3 Mean
DRR Dhan-40 439 490 552 494 345 412 467 408 131 150 159 147 18.59 19.29 19.90 19.26DRR Dhan -41 461 518 576 518 374 433 496 435 102 116 118 112 23.30 24.84 25.15 24.43DRR Dhan -42 366 435 496 432 279 353 416 349 118 121 125 121 24.05 24.91 26.03 25.00DRR Dhan -43 424 491 553 489 340 408 472 407 104 113 117 112 23.30 24.69 26.02 24.67DRR Dhan -44 382 440 499 440 292 356 414 354 150 172 178 167 22.84 24.20 25.64 24.23DRR Dhan -45 469 528 601 532 381 443 516 446 115 118 127 120 23.70 24.84 26.59 25.04DRR Dhan -46 480 543 609 544 398 463 524 462 134 136 151 140 22.99 25.17 27.49 25.22CSR-10 505 574 635 572 420 489 550 487 44 51 54 50 20.75 21.58 23.44 21.92CSR-23 457 524 593 525 366 441 511 439 120 137 150 135 19.51 20.84 22.15 20.83IR-30864 491 549 612 551 410 465 532 469 119 124 134 126 21.27 22.88 24.44 22.86
Mean 447 509 573 510 361 426 490 426 114 124 131 123 22.00 23.30 24.70 23.34
CD (0.05)Main 2.61 10.57 2.00 0.86Sub 24.20 27.57 5.02 0.61
Main x Sub NS NS NS NSSub x Main NS NS NS NS
CV %Main 3.47 2.27 5.15Sub 6.86 4.32 2.77
*T1-No amendment, T2- 50% GR , T3- 100% GR
IIRR Annual Progress Report 2017 Vol. 3-Soil Science
5.35
Table 5.3.6 Screening of Germplasm for Sodicity and Management of Sodic Soils inRBCS - (Faizabad- Kharif 2017)
Grain and Straw Yields
Variety/ Gypsumrequirement
Grain yield (t/ha) Straw yield (t/ha)
T1 T1NDRK 50051 5.06 6.79NDRK 50053 3.51 4.73NDRK 50054 2.95 4.41NDRK 50055 3.16 4.48NDRK 50058 2.96 4.25NDRK 50060 2.78 4.09NDRK 50063 3.85 5.78NDRK 50070 3.23 4.58NDRK 50071 3.06 4.32IRSSTN 151 2.95 4.28IRSSTN 142 3.03 4.46IRSSTN 133 3.41 4.97IRSSTN 15 2.64 3.66IRSSTN 123 3.23 4.55IRSSTN 110 4.35 6.31IRSSTN 18 3.21 4.68IRSSTN 32 3.00 4.31IRSSTN 30 4.49 6.44IRSSTN 36 3.47 5.06IRSSTN 24 3.41 4.94IRSSTN 9 2.80 3.77JAYA 4.32 6.42NARENDRA USARDHAN 2009
2.88 3.91
CSR 36 3.57 4.78MeanCD (0.05) 0.60 0.91CV % 10.85 11.45
*T1-No amendment

IIRR Annual Progress Report 2017 Vol. 3-Soil Science
5.36
Table 5.3.7 Screening of Germplasm for Sodicity and Management of Sodic Soils inRBCS - (Kanpur- Kharif 2017)
Grain and Straw Yield
Grain yield (t/ha) Straw Yield (t/ha)
Variety/ Gypsum requirement T1* T2 T3 Mean T1* T2 T3 Mean
DRR Dhan-40 2.00 3.30 4.43 3.24 2.35 3.86 5.12 3.78
DRR Dhan -41 1.95 3.16 4.38 3.17 2.30 3.70 5.08 3.70
DRR Dhan -42 2.17 3.48 4.57 3.40 2.58 4.09 5.31 3.99
DRR Dhan -43 2.09 3.37 4.48 3.31 2.47 3.96 5.21 3.88
DRR Dhan -44 2.01 3.30 4.43 3.25 2.36 3.87 5.16 3.80
DRR Dhan -45 2.14 3.42 4.50 3.35 2.51 4.01 5.22 3.91
DRR Dhan -46 2.21 3.48 4.63 3.44 2.59 4.09 5.39 4.02
HRI-196 1.57 2.80 3.68 2.68 1.86 3.29 4.27 3.14
HRI-197 1.69 2.87 4.03 2.86 2.12 3.37 4.69 3.40
27 P 22 1.73 2.90 4.11 2.91 2.04 3.40 4.78 3.41
27 P 36 1.81 3.03 4.30 3.05 2.18 3.56 5.01 3.58
27 P 63 1.88 3.12 4.38 3.12 2.23 3.64 5.09 3.65
28 P 09 1.79 2.97 4.22 2.99 2.12 3.48 4.91 3.50
B/V-243 1.65 2.82 3.88 2.78 1.96 3.31 4.51 3.26
B/V-344 1.74 2.97 4.20 2.97 2.07 3.48 4.89 3.48
TI-93 1.49 2.58 3.56 2.54 1.77 3.03 4.11 2.97
CSR-43 1.85 3.09 4.34 3.09 2.19 3.63 5.06 3.62
Mean 1.87 3.10 4.24 3.07 2.22 3.63 4.93 3.59
CD (0.05)Main 0.02 0.02
Sub 0.03 0.05Main x Sub 0.06 0.08Sub x Main 0.06 0.08
CV %Main 1.07 0.76
Sub 1.13 1.47*T1-No amendment, T2- 50% GR , T3- 100% GR

IIRR Annual Progress Report 2017 Vol. 3-Soil Science
5.37
Table 5.3.8 Screening of Germplasm for Sodicity and Management of Sodic Soilsin RBCS - (Mandya- Kharif 2017)
Grain and Straw yields
Variety/ Gypsumrequirement Grain yield (t/ha) Straw yield (t/ha)
T1* T2 T3 Mean T1* T2 T3 MeanDRR Dhan-40 4.95 5.37 5.27 5.19 5.89 6.45 6.49 6.27DRR Dhan -41 5.27 5.47 5.57 5.43 6.24 6.62 6.91 6.59DRR Dhan -42 4.29 4.61 5.43 4.78 5.10 5.86 6.95 5.97DRR Dhan -43 4.72 5.00 5.49 5.07 5.65 6.07 6.83 6.18DRR Dhan -44 3.95 4.13 4.79 4.29 4.64 4.95 5.77 5.12DRR Dhan -45 4.61 5.04 4.86 4.84 5.53 5.99 5.83 5.79DRR Dhan -46 3.72 4.05 4.62 4.13 4.45 4.81 5.54 4.93CSR-10 2.48 2.58 3.15 2.74 2.98 3.11 3.89 3.33CSR-23 4.64 4.90 5.51 5.02 5.55 6.02 6.85 6.14IR-30864 5.33 5.72 5.89 5.65 6.37 6.83 7.39 6.86
Mean 4.40 4.69 5.06 4.71 5.23 5.66 6.24 5.75
CD (0.05)Main 0.24 0.24
Sub 0.43 0.49Main x Sub 0.74 0.84Sub x Main NS NS
CV %Main 7.23 5.91
Sub 9.54 8.99*T1-No amendment, T2- 50% GR , T3- 100% GR

IIRR Annual Progress Report 2017 Vol. 3-Soil Science
5.38
Table 5.3.9 Screening of Germplasm for Sodicity and Management of Sodic Soils inRBCS - (Faizabad- Kharif 2017)
N, P, K Uptake
Variety/ Gypsumrequirement
N uptake (kg/ha) P uptake (kg/haK uptake (kg/ha
T1 T1 T1NDRK 50051 105.22 40.82 79.68NDRK 50053 78.17 33.50 57.37NDRK 50054 54.13 28.10 44.45NDRK 50055 62.49 29.03 49.18NDRK 50058 58.88 24.09 41.80NDRK 50060 49.93 21.99 41.86NDRK 50063 91.12 40.90 67.61NDRK 50070 69.95 30.03 54.74NDRK 50071 72.93 26.91 52.82IRSSTN 151 66.76 25.34 48.09IRSSTN 142 77.90 28.44 50.77IRSSTN 133 90.16 34.34 57.59IRSSTN 15 63.10 21.83 42.12IRSSTN 123 87.07 29.79 50.95IRSSTN 110 121.79 42.74 74.74IRSSTN 18 87.54 34.93 55.33IRSSTN 32 74.60 31.25 54.16IRSSTN 30 118.89 48.74 76.69IRSSTN 36 89.95 34.13 57.42IRSSTN 24 80.43 29.59 53.14IRSSTN 9 54.27 19.69 39.55JAYA 115.75 45.66 74.75NARENDRA USARDHAN 2009
68.13 26.28 47.65
CSR 36 83.35 30.34 54.46
CD (0.05) 20.390 18.65 15.56CV % 15.49 9.68 14.14
*T1-No amendment
IIRR Annual Progress Report 2017 Vol. 3-Soil Science
5.39
Table 5.3.10 Screening of Germplasm for Sodicity and Management of Sodic Soils in RBCS - (Mandya- Kharif 2017)Nutrient Uptake (kg/ha)
Nitrogen uptake Phosphorus uptake Potassium uptake
Variety/ Gypsumrequirement
T1* T2 T3 Mean T1* T2 T3 Mean T1* T2 T3 Mean
DRR Dhan-40 98.61 110.51 114.36 107.83 15.77 18.71 19.70 18.06 31.49 35.79 37.68 34.99DRR Dhan -41 105.70 113.21 120.53 113.15 16.77 19.35 20.82 18.98 34.08 37.08 40.73 37.30DRR Dhan -42 85.41 97.74 119.03 100.73 13.56 16.14 21.08 16.93 27.60 32.15 40.05 33.27DRR Dhan -43 94.53 103.01 118.48 105.34 14.60 16.43 20.00 17.01 29.45 35.43 40.70 35.19DRR Dhan -44 78.18 84.74 102.49 88.47 12.51 14.56 18.47 15.18 23.81 28.10 34.01 28.64DRR Dhan -45 93.92 103.58 103.28 100.26 14.44 16.99 17.73 16.38 29.07 35.26 36.01 33.45DRR Dhan -46 74.33 83.76 98.75 85.61 12.33 13.96 17.01 14.43 24.28 26.49 32.62 27.79CSR-10 49.63 53.34 67.93 56.97 7.88 8.85 11.84 9.52 15.80 17.71 23.30 18.94CSR-23 92.37 101.55 118.69 104.20 15.11 17.53 20.92 17.85 29.63 34.55 40.83 35.01IR-30864 107.18 117.13 127.55 117.29 16.48 19.32 21.36 19.05 33.11 40.14 43.80 39.02
Mean 87.99 96.86 87.99 97.985 13.945 16.181 18.892 16.340 27.832 32.269 36.973 32.358
CD (0.05)Main 4.31 1.27 0.96
Sub 8.53 1.76 3.00Main x Sub NS NS NSSub x Main NS NS NS
CV %Main 6.14 10.86 4.14
Sub 9.22 11.38 9.79*T1-No amendment, T2- 50% GR , T3- 100% GR

IIRR Annual Progress Report 2017 Vol. 3-Soil Science
5.40
Table 5.3.11 Screening of Germplasm for Sodicity and Management of Sodic Soils in RBCS - (Mandya- Kharif 2017)
Post Harvest Nutrient Availability (kg/ha)
Available Nitrogen Available Phosphorus Available Potassium
Variety/ Gypsumrequirement T1* T2 T3 Mean T1* T2 T3 Mean T1* T2 T3 Mean
DRR Dhan-40 173.60 187.73 212.73 191.36 29.40 31.67 33.60 31.56 215.27 228.03 240.33 227.88DRR Dhan -41 175.70 182.93 216.57 191.73 30.17 31.67 35.17 32.33 218.50 231.63 244.87 231.67DRR Dhan -42 184.23 206.53 227.07 205.94 32.70 33.43 37.50 34.54 218.53 233.70 244.13 232.12DRR Dhan -43 179.60 193.43 226.87 199.97 30.57 33.43 36.73 33.58 218.43 225.80 242.57 228.93DRR Dhan -44 169.50 184.9 218.47 190.96 30.57 32.87 36.77 33.40 217.90 230.10 245.57 231.19DRR Dhan -45 175.90 193.93 216.8 195.54 30.83 33.80 37.57 34.07 217.10 231.77 244.83 231.23DRR Dhan -46 186.03 212.1 227.8 208.64 29.53 31.20 35.50 32.08 217.23 233.63 244.27 231.71CSR-10 173.30 182.43 205.83 187.19 31.63 33.47 37.90 34.33 216.40 230.30 244.53 230.41CSR-23 182.27 194.3 225.63 200.73 32.63 33.93 37.83 34.80 217.13 232.20 245.13 231.49IR-30864 185.87 205.17 226.5 205.84 30.50 31.67 36.13 32.77 218.53 226.03 242.80 229.12
Mean 178.60 194.35 220.43 197.79 30.853 32.853 36.853 33.346 217.50 230.32 243.90 230.58
CD (0.05)Main 6.71 1.05 4.24
Sub 7.42 1.31 5.60Main x Sub 12.86 2.27 9.69Sub x Main 13.81 2.38 10.06
CV %Main 4.73 4.38 2.57
Sub 3.97 4.16 2.57*T1-No amendment, T2- 50% GR , T3- 100% GR
IIRR Annual Progress Report 2017 Vol. 3-Soil Science
5.41
Table 5.3.12 Screening of Germplasm for Sodicity and Management of Sodic Soils in RBCS - (Mandya- Kharif 2017)Post Harvest Soil Characteristics
OC(%) pH EC ESP
Variety/ Gypsumrequirement
T1* T2 T3 Mean T1* T2 T3 Mean T1* T2 T3 Mean T1* T2 T3 Mean
DRR Dhan-40 0.39 0.47 0.51 0.45 8.91 8.85 8.64 8.80 0.45 0.38 0.24 0.36 19.57 16.13 10.10 15.27DRR Dhan -41 0.39 0.43 0.50 0.44 9.03 8.86 8.55 8.81 0.40 0.38 0.21 0.33 21.00 18.12 9.10 16.07DRR Dhan -42 0.39 0.43 0.53 0.45 8.96 8.89 8.62 8.82 0.38 0.32 0.21 0.30 19.83 18.40 9.57 15.93DRR Dhan -43 0.39 0.47 0.51 0.46 8.79 8.58 8.51 8.63 0.47 0.38 0.24 0.36 15.62 9.00 7.57 10.73DRR Dhan -44 0.39 0.41 0.49 0.43 8.95 8.79 8.55 8.76 0.40 0.36 0.24 0.33 19.40 14.77 9.75 14.64DRR Dhan -45 0.41 0.47 0.52 0.47 8.87 8.59 8.43 8.63 0.43 0.34 0.20 0.32 17.65 9.73 7.65 11.68DRR Dhan -46 0.38 0.43 0.52 0.44 8.99 8.84 8.51 8.78 0.33 0.27 0.19 0.26 20.67 17.57 8.77 15.67CSR-10 0.38 0.40 0.45 0.41 8.98 8.60 8.44 8.68 0.47 0.38 0.24 0.36 19.75 10.11 7.67 12.51CSR-23 0.38 0.42 0.50 0.43 8.88 8.60 8.47 8.65 0.44 0.32 0.21 0.32 17.70 8.59 7.61 11.30IR-30864 0.39 0.46 0.51 0.45 8.96 8.85 8.55 8.79 0.41 0.36 0.23 0.33 18.83 16.58 7.62 14.35
Mean 0.39 0.43 0.50 0.44 8.52 8.74 8.93 8.73 0.22 0.34 0.42 0.33 19.00 13.90 8.54 13.82
CD (0.05)Main 0.02 0.11 0.04 0.71
Sub 0.01 0.11 0.03 0.69Main x Sub 0.02 0.20 0.05 1.20Sub x Main 0.03 0.21 0.06 1.33
CV %Main 5.18 1.76 7.22
Sub 2.82 1.37 5.31*T1-No amendment, T2- 50% GR , T3- 100% GR

IIRR Annual Progress Report 2017 Vol. 3-Soil Science
5.42
5.4 Nutrient use efficiency and soil productivity in early and late sown rice
Rice and rice based cropping systems (RBCS) are the most important production
systems widely cultivated under diverse soil and agro ecological conditions including large
tracts of soils with in situ problems and management induced nutrient stresses. Changing
climatic conditions such as shifts in rainfall distribution and its intensity, changes in
temperature regimes in many vulnerable areas are likely to influence agricultural productivity
through their impact on land and water resources besides directly influencing crop calendar,
crop growth efficiency of inputs and profitability. While availability of resources determine
the cropping pattern and farm operations, shifts in crop calendar strongly influence crop
productivity potential as already reported through studies conducted under the coordinated
program. Keeping this in view, this study has been initiated in kharif 2011 at few selected
locations to assess the extent of change in rice productivity and nutrient use efficiency due to
changing crop calendar and identify management options to mitigate the loss in yield and
nutrient use efficiency. In the current year, the trial was conducted in collaboration with
Agronomy cooperators, at two locations in rabi (2016–17) at Maruteru (MTU) and at
Karaikal (KRK) and in kharif (2017) at twelve locations viz., Arundhatinagar (ADT), Chatha
(CHT), Faizabad (FZD), Kanpur (KNP), Khudwani (KHD), Ludhiana (LDH), Maruteru
(MTU), Pantnagar (PNT), Pusa (PSA), Rajendranagar (RJNR), Ranchi (RNC) and Titabar
(TTB), in collaboration with Agronomy.
The treatments consisted of three different times of crop establishment i.e., normal
sowing, late sowing (by 15 days after normal sowing) and very late sowing (by 30 days after
normal sowing) in in main plots and integrated multi-nutrient management approaches in sub
plots, as strategies to minimize the likely yield loss due to delay in transplanting. The data
from various centres are presented in Tables 5.4.1 to 5.4.7. The test varieties were Satabdi at
ADT, SRJ-70 at CHT, NDR 2065 at FZD, Rice Pant-12 at KNP, CO (R) 50 at KRK, Jhelum
at KHD, PR-126 at LDH, MTU-1061 and MTU-1153 at MTU, NDR-359 at PNT, RAU 724-
48-3 at Pusa, RNR 15048 at RJNR, Naveen at RNC and Shraboni at TTB. The details of
crop, soil and weather parameters of the experimental sites (Table 5.4.1) show variation in
soil characteristics with reference to pH, organic carbon content, soil texture and available
nutrient status.
IIRR Annual Progress Report 2017 Vol. 3-Soil Science
5.43
Rice productivity
Data presented in Table 5.4.2 show significant effect of planting/sowing time on rice
productivity with normal sowing recording highest grain yield of 5.87 t/ha at MTU in rabi
(2016-17) resulting in significantly higher yields over late sowing by 15 days and very late
sowing by 30 days by 7% and 11%, respectively. Similar trend was also observed for straw
yield as well. At KRK, the effect of planting/sowing time was not significant.
The effect of planting/sowing time significantly influenced the kharif (2017) rice
productivity at all the twelve centres (Tables 5.4.3). Normal sowing recorded highest grain
yield of 4.61, 3.94 4.62, 3.00, 5.80 and 4.38 t/ha at KNP, MTU, ADT, CHT, LDH, PNT and
RNC respectively while at FZD, KHD and PSA, RJNR and TTB it was at par with late
sowing (by 15 days). The yields with normal sowing were higher over late sowing by 8% at
KNP and 5% at MTU. Very late sowing (by 30 days) resulted in the lowest grain yields and
the reduction in grain yield varied from 9% at PSA to as high as 100% at RJNR as compared
to normal sowing. Similar trend was also observed for straw yield as well.
The average yield reduction across the locations was to the tune of 3% with a 15 day-
delay in planting which increased to 37% as the planting was further delayed by 30 days over
Normal planting.
Nutrient management practices significantly influenced the productivity at all the
twelve locations in kharif 2017. The nutrient management practice consisting of 150% RDF
+ Zn (N-3 splits @ 1/3 +1/3 +1/3 recorded the significantly higher grain yield of 5.69 t/ha at
FZD, 4.74 t/ha at ADT while it was on par with 150% RDF + Zn (N-3 splits @ 1/2 + 1/4
+1/4) at rest of the centres (KNP, KHD, MTU, LDH, PNT, RJNR, TTB and PSA). In rabi
too at MTU, these two treatments performed similarly. The effect of nutrient management
practices was not significant in rabi at KRK. Straw yield also followed a similar trend.
Across the locations, 150% of RDF + Zn gave better yields (4.97 – 5.04 t/ha) than other
treatment combinations.
The interaction effect of dates of sowing and nutrient management practices was
found significant at ARD and PNT for grain yield and at LDH for straw yield. At both the
locations, Normal planting with 150% RDF + Zn (N in 3 splits) gave significantly higher
grain yield (5.23 t/ha at ADT and 6.67 t/ha at PNT) as compared to other treatment
combinations (Table 5.4.3a).
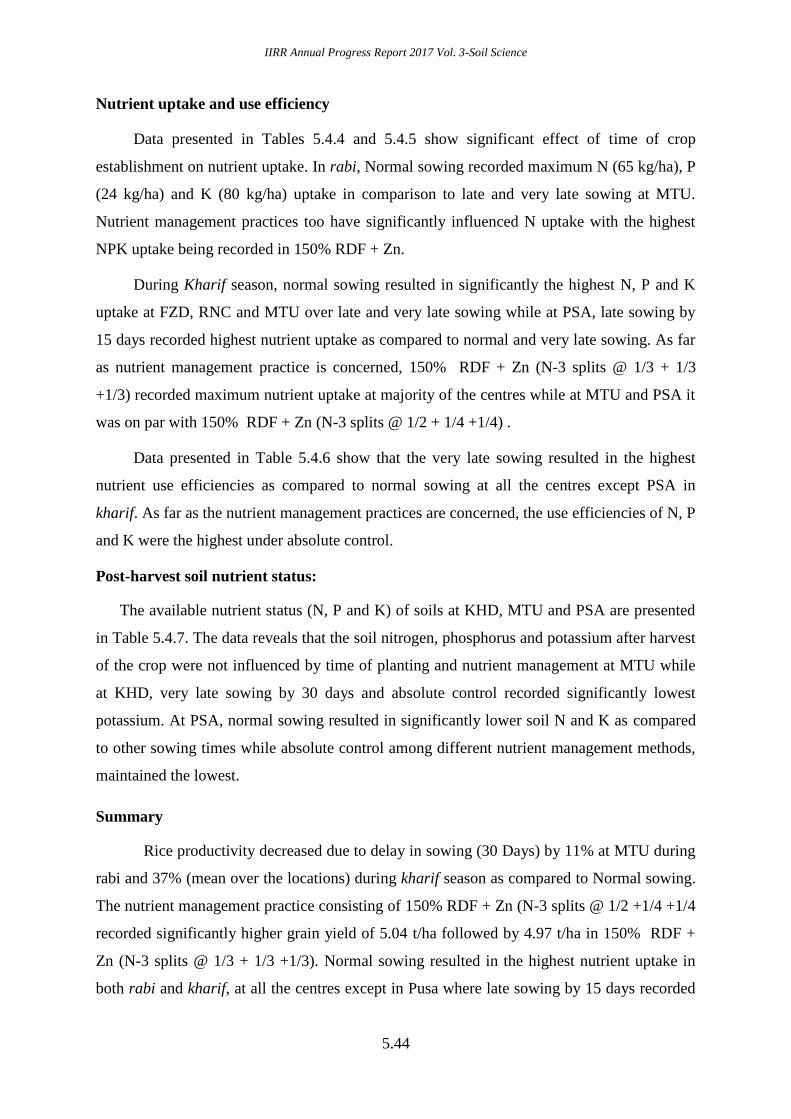
IIRR Annual Progress Report 2017 Vol. 3-Soil Science
5.44
Nutrient uptake and use efficiency
Data presented in Tables 5.4.4 and 5.4.5 show significant effect of time of crop
establishment on nutrient uptake. In rabi, Normal sowing recorded maximum N (65 kg/ha), P
(24 kg/ha) and K (80 kg/ha) uptake in comparison to late and very late sowing at MTU.
Nutrient management practices too have significantly influenced N uptake with the highest
NPK uptake being recorded in 150% RDF + Zn.
During Kharif season, normal sowing resulted in significantly the highest N, P and K
uptake at FZD, RNC and MTU over late and very late sowing while at PSA, late sowing by
15 days recorded highest nutrient uptake as compared to normal and very late sowing. As far
as nutrient management practice is concerned, 150% RDF + Zn (N-3 splits @ 1/3 + 1/3
+1/3) recorded maximum nutrient uptake at majority of the centres while at MTU and PSA it
was on par with 150% RDF + Zn (N-3 splits @ 1/2 + 1/4 +1/4) .
Data presented in Table 5.4.6 show that the very late sowing resulted in the highest
nutrient use efficiencies as compared to normal sowing at all the centres except PSA in
kharif. As far as the nutrient management practices are concerned, the use efficiencies of N, P
and K were the highest under absolute control.
Post-harvest soil nutrient status:
The available nutrient status (N, P and K) of soils at KHD, MTU and PSA are presented
in Table 5.4.7. The data reveals that the soil nitrogen, phosphorus and potassium after harvest
of the crop were not influenced by time of planting and nutrient management at MTU while
at KHD, very late sowing by 30 days and absolute control recorded significantly lowest
potassium. At PSA, normal sowing resulted in significantly lower soil N and K as compared
to other sowing times while absolute control among different nutrient management methods,
maintained the lowest.
Summary
Rice productivity decreased due to delay in sowing (30 Days) by 11% at MTU during
rabi and 37% (mean over the locations) during kharif season as compared to Normal sowing.
The nutrient management practice consisting of 150% RDF + Zn (N-3 splits @ 1/2 +1/4 +1/4
recorded significantly higher grain yield of 5.04 t/ha followed by 4.97 t/ha in 150% RDF +
Zn (N-3 splits @ 1/3 + 1/3 +1/3). Normal sowing resulted in the highest nutrient uptake in
both rabi and kharif, at all the centres except in Pusa where late sowing by 15 days recorded

IIRR Annual Progress Report 2017 Vol. 3-Soil Science
5.45
the highest values. As far as nutrient management practice is concerned, 150% RDF + Zn (N-
3 splits @ 1/2 +1/4 +1/4) recorded maximum nutrient uptake at all the centres both in rabi
and kharif.
Delayed sowing (by 15 and 30 days) in both the seasons (rabi and kharif) resulted in
higher nutrient use efficiencies at all the centres except Pusa where maximum use efficiencies
were recorded with normal sowing. As far as the nutrient management practices are
concerned, the use efficiencies of N, P and K were maximum under absolute control in all the
centres.

IIRR Annual Progress Report 2017 Vol. 3-Soil Science
5.46
Table: 5.4.1 Nutrient use efficiency and soil productivity in early and late sown riceCrop and soil characteristics
Parameter ADT CHT FZD KNP KRK KHD LDH MTU PNT PSA RJNR RNC TTBCropping system Rice Rice Rice Rice-Wheat Rice-Rice Rice - Rice-Rice Rice Rice-Wheat Rice - -Variety
KharifSatab
diSRJ-70 NDR 2065
Rice Pant-12
CO (R) 50 Jhelum PR-126MTU-1061
NDR-359
RAU 724-48-3
RNR15048
NaveenShrabo
ni
Rabi - - - - -MTU-1153
- -
RFD (KgNPKZn/ha)
Kharif - 40:20:10:20120:60:60:
10120:60:60:
25129:27:88
120:60:30
185:30:30
180:90:60
120:60:40
130:50:56:25
120:60:40
120:60:40
60:20:40
Rabi - - - - -180:90:6
0- -
Crop growthKharif Good Good Good Good - Good Good Good Good Good Good Good GoodRabi - - - - Good - Good - - - - -Soil data% clay - - 23 20.54 12.65 22 - 38 - 15 - - -% silt - - 21 56.69 10.5 37 - 28 - 32 - - -% sand - - 56 22.77 65.2 41 - 34 - 53 - - -
Soil Texture -Sandy Clay
LoamSandyLoam
SandyLoam
Sandy clayloam
Siltyclayloam
Sandyloam
Clayloam
SiltLoam
SandyLoam
BlackClay
-SiltyClayLoam
pH (1:1) - - 7.5 7.8 6.14 6.98 - 6.23 7.8 8.56 - 6.3 6.8Org. carbon (%) - - 0.42 0.41 0.56 1.15 - 1.15 - 0.62 - - -CEC [c mol(p+)/kg]
- - 13.8 - 21.4 - - 48.6 20 - - - -
EC (ds/m) - - 1.02 0.42 0.07 0.14 - 0.56 1.2 0.16 - - -Avail.N (kg/ha) - 245 212 230 107 220 470 173 231 197 - 230.3 394Avail.P2O5(kg/ha)
- 14 25 20 110 15 27 63 21 36 - 36 13
Avail. K2O(kg/ha)
- 146 230 174 206 269 67 227 219 206 - 159 209
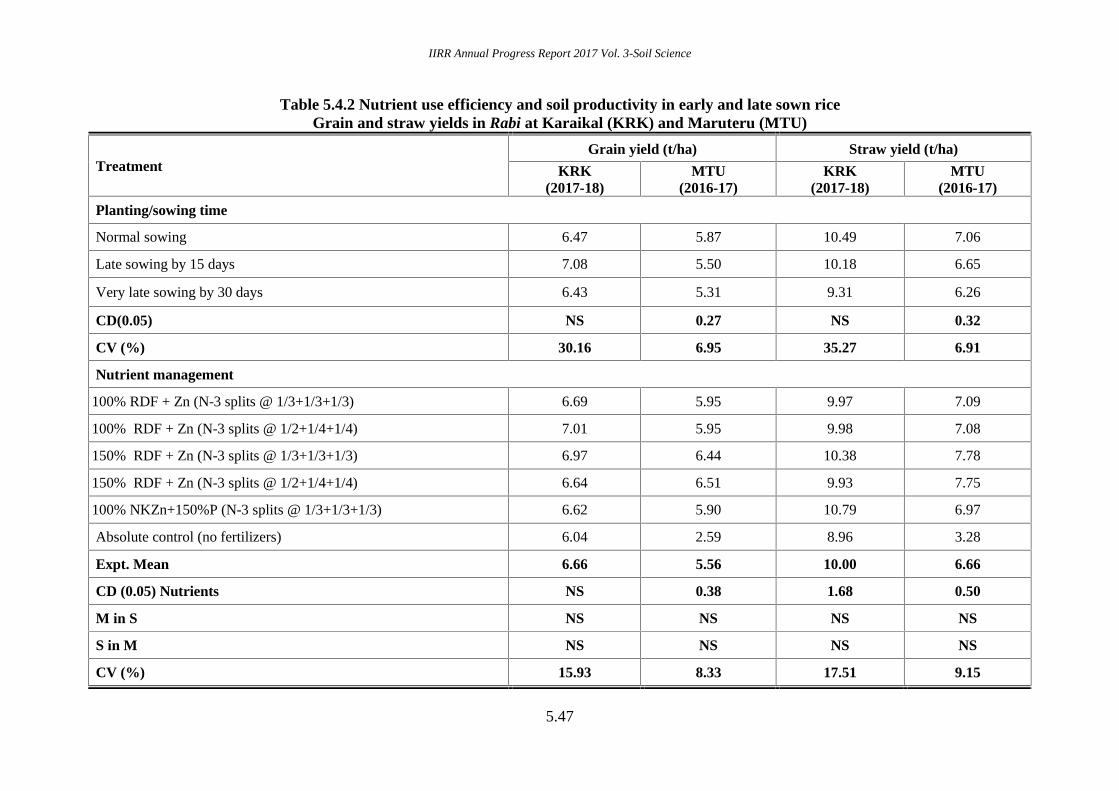
IIRR Annual Progress Report 2017 Vol. 3-Soil Science
5.47
Table 5.4.2 Nutrient use efficiency and soil productivity in early and late sown riceGrain and straw yields in Rabi at Karaikal (KRK) and Maruteru (MTU)
TreatmentGrain yield (t/ha) Straw yield (t/ha)
KRK(2017-18)
MTU(2016-17)
KRK(2017-18)
MTU(2016-17)
Planting/sowing time
Normal sowing 6.47 5.87 10.49 7.06
Late sowing by 15 days 7.08 5.50 10.18 6.65
Very late sowing by 30 days 6.43 5.31 9.31 6.26
CD(0.05) NS 0.27 NS 0.32
CV (%) 30.16 6.95 35.27 6.91
Nutrient management
100% RDF + Zn (N-3 splits @ 1/3+1/3+1/3) 6.69 5.95 9.97 7.09
100% RDF + Zn (N-3 splits @ 1/2+1/4+1/4) 7.01 5.95 9.98 7.08
150% RDF + Zn (N-3 splits @ 1/3+1/3+1/3) 6.97 6.44 10.38 7.78
150% RDF + Zn (N-3 splits @ 1/2+1/4+1/4) 6.64 6.51 9.93 7.75
100% NKZn+150%P (N-3 splits @ 1/3+1/3+1/3) 6.62 5.90 10.79 6.97
Absolute control (no fertilizers) 6.04 2.59 8.96 3.28
Expt. Mean 6.66 5.56 10.00 6.66
CD (0.05) Nutrients NS 0.38 1.68 0.50
M in S NS NS NS NS
S in M NS NS NS NS
CV (%) 15.93 8.33 17.51 9.15

IIRR Annual Progress Report 2017 Vol. 3-Soil Science
5.48
Table 5.4.3 Nutrient use efficiency and soil productivity in early and late sown riceGrain yields (Kharif 2017)
TreatmentGrain yield (t/ha)
ADT CHT FZD KNP KHD LDH MTU PNT PSA RJNR RNC TTB MeanPlanting/sowing timeNormal sowing 4.62 3.00 4.58 4.61 6.37 5.96 3.94 5.83 4.54 5.70 4.38 4.38 4.83Late sowing by 15 days 3.92 2.64 4.64 4.22 6.55 6.45 3.74 5.46 4.7 5.76 4.09 4.30 4.71Very late sowing by 30 days 4.13 1.83 3.38 3.7 4.57 4.69 3.1 3.13 4.11 2.84 3.30 3.61 3.53CD (0.05) 0.08 0.20 0.16 0.03 0.22 0.35 0.11 0.08 0.24 0.56 0.11 0.33CV (%) 3.21 12.27 5.28 2.73 6.43 10.44 6 2.71 5.83 19.69 4.64 13.44Nutrient management100% RDF + Zn (N-3 splits @ 1/3+1/3+1/3) 4.09 2.50 4.33 4.38 6.06 6.06 3.74 5.14 4.23 4.90 4.02 3.51 4.41100% RDF + Zn (N-3 splits @ 1/2+1/4+1/4) 4.42 2.67 3.94 4.32 6.10 5.84 3.8 4.85 4.47 5.26 4.15 4.32 4.51150% RDF + Zn (N-3 splits @ 1/3+1/3+1/3) 4.74 2.98 5.69 4.79 6.17 6.11 4.31 5.45 4.78 5.56 4.49 4.54 4.97150% RDF + Zn (N-3 splits @ 1/2+1/4+1/4) 4.59 3.06 5.3 4.71 6.52 6.29 4.35 5.39 4.97 5.84 4.68 4.75 5.04100% NKZn+150%P (N-3 splits @ 1/3+1/3+1/3) 4.01 - 4.12 4.56 6.38 5.92 3.85 5.19 4.49 4.91 4.25 4.27 4.72Absolute control (no fertilizers) 3.46 1.24 2.42 2.3 3.76 3.99 1.57 2.82 3.77 2.13 1.96 3.20 2.72Expt. Mean 4.22 2.49 4.30 4.18 5.83 5.70 3.60 4.81 4.45 4.77 3.92 4.10 4.36CD (0.05) Nutrients 0.15 0.31 0.18 0.11 0.39 0.4 0.31 0.24 0.54 0.59 0.34 0.36M in S 0.25 NS NS NS NS NS NS 0.42 NS NS NS NSS in M 0.24 NS NS NS NS NS NS 0.38 NS NS NS NSCV (%) 3.59 12.83 5.13 0.81 7.00 7.23 10.53 5.22 12.65 4.77 8.88 9.05
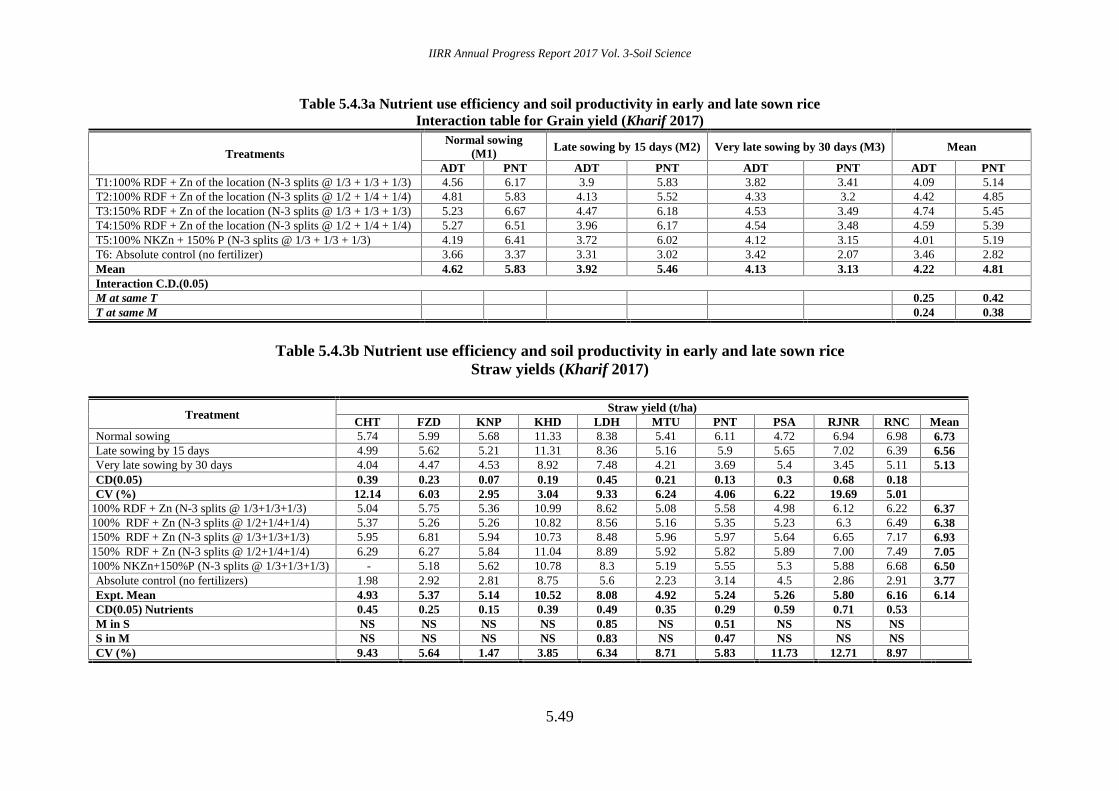
IIRR Annual Progress Report 2017 Vol. 3-Soil Science
5.49
Table 5.4.3a Nutrient use efficiency and soil productivity in early and late sown riceInteraction table for Grain yield (Kharif 2017)
TreatmentsNormal sowing
(M1) Late sowing by 15 days (M2) Very late sowing by 30 days (M3) Mean
ADT PNT ADT PNT ADT PNT ADT PNTT1:100% RDF + Zn of the location (N-3 splits @ 1/3 + 1/3 + 1/3) 4.56 6.17 3.9 5.83 3.82 3.41 4.09 5.14T2:100% RDF + Zn of the location (N-3 splits @ 1/2 + 1/4 + 1/4) 4.81 5.83 4.13 5.52 4.33 3.2 4.42 4.85T3:150% RDF + Zn of the location (N-3 splits @ 1/3 + 1/3 + 1/3) 5.23 6.67 4.47 6.18 4.53 3.49 4.74 5.45T4:150% RDF + Zn of the location (N-3 splits @ 1/2 + 1/4 + 1/4) 5.27 6.51 3.96 6.17 4.54 3.48 4.59 5.39T5:100% NKZn + 150% P (N-3 splits @ 1/3 + 1/3 + 1/3) 4.19 6.41 3.72 6.02 4.12 3.15 4.01 5.19T6: Absolute control (no fertilizer) 3.66 3.37 3.31 3.02 3.42 2.07 3.46 2.82Mean 4.62 5.83 3.92 5.46 4.13 3.13 4.22 4.81Interaction C.D.(0.05)M at same T 0.25 0.42T at same M 0.24 0.38
Table 5.4.3b Nutrient use efficiency and soil productivity in early and late sown riceStraw yields (Kharif 2017)
TreatmentStraw yield (t/ha)
CHT FZD KNP KHD LDH MTU PNT PSA RJNR RNC MeanNormal sowing 5.74 5.99 5.68 11.33 8.38 5.41 6.11 4.72 6.94 6.98 6.73Late sowing by 15 days 4.99 5.62 5.21 11.31 8.36 5.16 5.9 5.65 7.02 6.39 6.56Very late sowing by 30 days 4.04 4.47 4.53 8.92 7.48 4.21 3.69 5.4 3.45 5.11 5.13CD(0.05) 0.39 0.23 0.07 0.19 0.45 0.21 0.13 0.3 0.68 0.18CV (%) 12.14 6.03 2.95 3.04 9.33 6.24 4.06 6.22 19.69 5.01
100% RDF + Zn (N-3 splits @ 1/3+1/3+1/3) 5.04 5.75 5.36 10.99 8.62 5.08 5.58 4.98 6.12 6.22 6.37100% RDF + Zn (N-3 splits @ 1/2+1/4+1/4) 5.37 5.26 5.26 10.82 8.56 5.16 5.35 5.23 6.3 6.49 6.38150% RDF + Zn (N-3 splits @ 1/3+1/3+1/3) 5.95 6.81 5.94 10.73 8.48 5.96 5.97 5.64 6.65 7.17 6.93150% RDF + Zn (N-3 splits @ 1/2+1/4+1/4) 6.29 6.27 5.84 11.04 8.89 5.92 5.82 5.89 7.00 7.49 7.05100% NKZn+150%P (N-3 splits @ 1/3+1/3+1/3) - 5.18 5.62 10.78 8.3 5.19 5.55 5.3 5.88 6.68 6.50Absolute control (no fertilizers) 1.98 2.92 2.81 8.75 5.6 2.23 3.14 4.5 2.86 2.91 3.77Expt. Mean 4.93 5.37 5.14 10.52 8.08 4.92 5.24 5.26 5.80 6.16 6.14CD(0.05) Nutrients 0.45 0.25 0.15 0.39 0.49 0.35 0.29 0.59 0.71 0.53M in S NS NS NS NS 0.85 NS 0.51 NS NS NSS in M NS NS NS NS 0.83 NS 0.47 NS NS NSCV (%) 9.43 5.64 1.47 3.85 6.34 8.71 5.83 11.73 12.71 8.97

IIRR Annual Progress Report 2017 Vol. 3-Soil Science
5.50
Table 5.4.4 Nutrient use efficiency and soil productivity in early and late sown riceNutrient uptake (kg/ha), Nutrient use efficiency (kg grain/kg uptake) and Available nutrient status of soils (Rabi 2016-17) at Maruteru
TreatmentNutrient uptake (kg/ha) Nutrient use efficiency
(kg grain/kg uptake)Available Nutrient status of soils
(Kg/ha)
N P K N P K N P K
Planting/sowing time
Normal sowing 65.37 23.62 80.80 97.91 263.36 74.95 158.50 65.67 229.19
Late sowing by 15 days 50.86 20.79 73.77 119.80 271.74 76.45 165.12 56.82 224.83
Very late sowing by 30 days 47.50 18.81 68.74 129.00 292.74 80.05 173.22 63.28 225.21
CD (0.05) 2.66 1.61 5.18 - - - - - -
CV (%) 6.90 10.78 9.86 - - - - - -
Nutrient management
100% RDF + Zn (N-3 splits @ 1/3+1/3+1/3) 58.24 22.82 81.10 104.20 264.88 74.35 161.21 65.70 236.51
100% RDF + Zn (N-3 splits @ 1/2+1/4+1/4) 57.81 22.57 80.48 104.60 266.86 74.19 167.25 63.25 238.35
150% RDF + Zn (N-3 splits @ 1/3+1/3+1/3) 69.26 24.34 88.56 93.90 266.07 72.89 170.94 62.76 243.79
150% RDF + Zn (N-3 splits @ 1/2+1/4+1/4) 70.65 24.55 88.43 93.90 267.31 73.82 175.26 61.77 232.17
100% NKZn+150%P (N-3 splits @ 1/3+1/3+1/3) 57.00 24.62 80.11 105.70 241.14 74.09 174.44 70.20 236.09
Absolute control (no fertilizers) 14.48 7.56 27.95 191.10 349.23 93.57 144.57 47.86 171.53
Expt. Mean 54.58 21.07 74.44 115.60 275.92 77.15 165.60 61.92 226.41
CD (0.05) 5.44 1.83 6.45 - - - - - -
M in S NS NS NS - - - - - -
S in M NS NS NS - - - - - -
CV (%) 11.67 10.55 10.54 - - - - - -
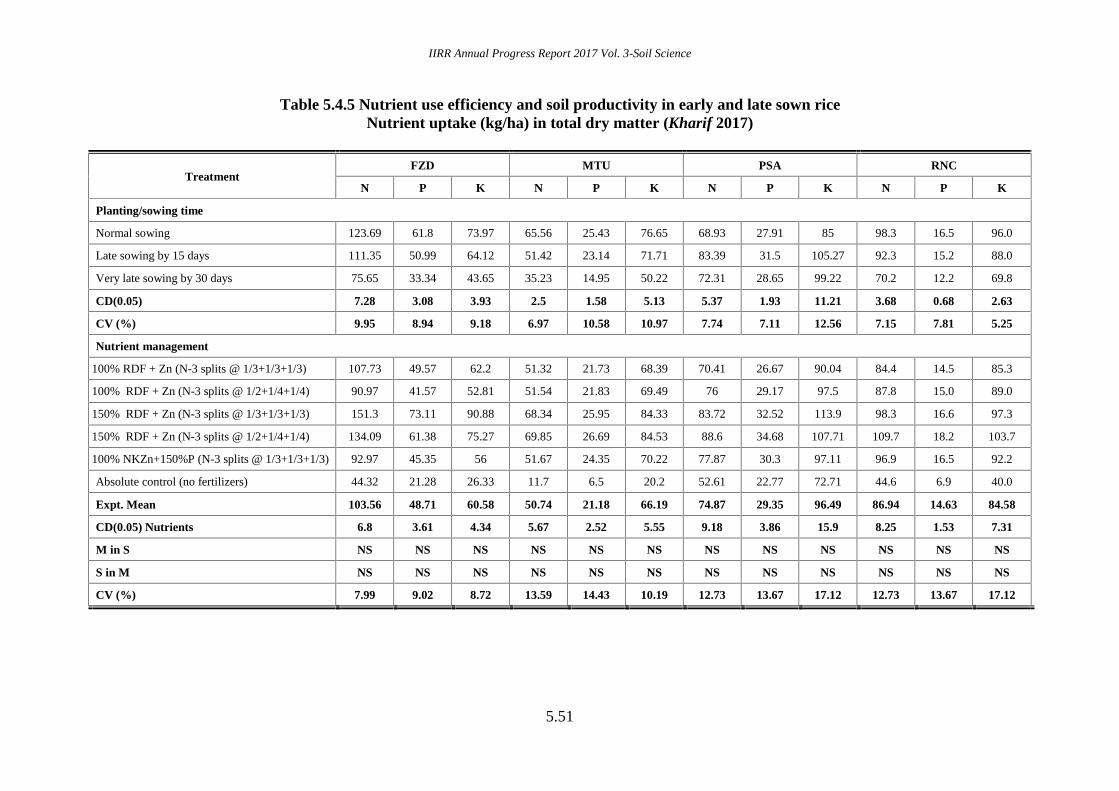
IIRR Annual Progress Report 2017 Vol. 3-Soil Science
5.51
Table 5.4.5 Nutrient use efficiency and soil productivity in early and late sown riceNutrient uptake (kg/ha) in total dry matter (Kharif 2017)
TreatmentFZD MTU PSA RNC
N P K N P K N P K N P K
Planting/sowing time
Normal sowing 123.69 61.8 73.97 65.56 25.43 76.65 68.93 27.91 85 98.3 16.5 96.0
Late sowing by 15 days 111.35 50.99 64.12 51.42 23.14 71.71 83.39 31.5 105.27 92.3 15.2 88.0
Very late sowing by 30 days 75.65 33.34 43.65 35.23 14.95 50.22 72.31 28.65 99.22 70.2 12.2 69.8
CD(0.05) 7.28 3.08 3.93 2.5 1.58 5.13 5.37 1.93 11.21 3.68 0.68 2.63
CV (%) 9.95 8.94 9.18 6.97 10.58 10.97 7.74 7.11 12.56 7.15 7.81 5.25
Nutrient management
100% RDF + Zn (N-3 splits @ 1/3+1/3+1/3) 107.73 49.57 62.2 51.32 21.73 68.39 70.41 26.67 90.04 84.4 14.5 85.3
100% RDF + Zn (N-3 splits @ 1/2+1/4+1/4) 90.97 41.57 52.81 51.54 21.83 69.49 76 29.17 97.5 87.8 15.0 89.0
150% RDF + Zn (N-3 splits @ 1/3+1/3+1/3) 151.3 73.11 90.88 68.34 25.95 84.33 83.72 32.52 113.9 98.3 16.6 97.3
150% RDF + Zn (N-3 splits @ 1/2+1/4+1/4) 134.09 61.38 75.27 69.85 26.69 84.53 88.6 34.68 107.71 109.7 18.2 103.7
100% NKZn+150%P (N-3 splits @ 1/3+1/3+1/3) 92.97 45.35 56 51.67 24.35 70.22 77.87 30.3 97.11 96.9 16.5 92.2
Absolute control (no fertilizers) 44.32 21.28 26.33 11.7 6.5 20.2 52.61 22.77 72.71 44.6 6.9 40.0
Expt. Mean 103.56 48.71 60.58 50.74 21.18 66.19 74.87 29.35 96.49 86.94 14.63 84.58
CD(0.05) Nutrients 6.8 3.61 4.34 5.67 2.52 5.55 9.18 3.86 15.9 8.25 1.53 7.31
M in S NS NS NS NS NS NS NS NS NS NS NS NS
S in M NS NS NS NS NS NS NS NS NS NS NS NS
CV (%) 7.99 9.02 8.72 13.59 14.43 10.19 12.73 13.67 17.12 12.73 13.67 17.12

IIRR Annual Progress Report 2017 Vol. 3-Soil Science
5.52
Table 5.4.6 Nutrient use efficiency and soil productivity in early and late sown riceNutrient use efficiency (kg grain/kg uptake) (Kharif 2017)
TreatmentFZD MTU PSA
NUE PUE KUE NUE PUE KUE NUE PUE KUE
Planting/sowing time
Normal sowing 40.61 81.57 68.18 73.66 182.64 58.68 66.58 163.84 61.08
Late sowing by 15 days 43.68 94.75 75.04 85.34 172.41 55.76 57.43 151.07 45.25
Very late sowing by 30 days 47.46 107.93 82.34 160.4. 334.97 100.80 57.76 145.13 42.10
Nutrient management
100% RDF + Zn (N-3 splits @ 1/3+1/3+1/3) 40.68 89.21 70.44 96.90 226.06 69.40 60.34 159.10 47.28
100% RDF + Zn (N-3 splits @ 1/2+1/4+1/4) 43.88 98.00 75.93 90.74 212.85 64.59 59.19 153.58 46.19
150% RDF + Zn (N-3 splits @ 1/3+1/3+1/3) 37.78 78.89 63.11 71.41 188.36 56.97 57.74 148.11 42.47
150% RDF + Zn (N-3 splits @ 1/2+1/4+1/4) 39.93 88.96 71.48 73.34 195.37 59.27 56.42 143.67 62.29
100% NKZn+150%P (N-3 splits @ 1/3+1/3+1/3) 44.91 94.20 75.24 92.70 191.61 65.35 57.79 149.58 46.44
Absolute control (no fertilizers) 56.32 119.23 94.93 213.71 365.80 114.89 72.01 166.03 52.21
Expt. Mean 43.92 94.75 75.19 106.47 230.01 71.74 60.59 153.34 49.48
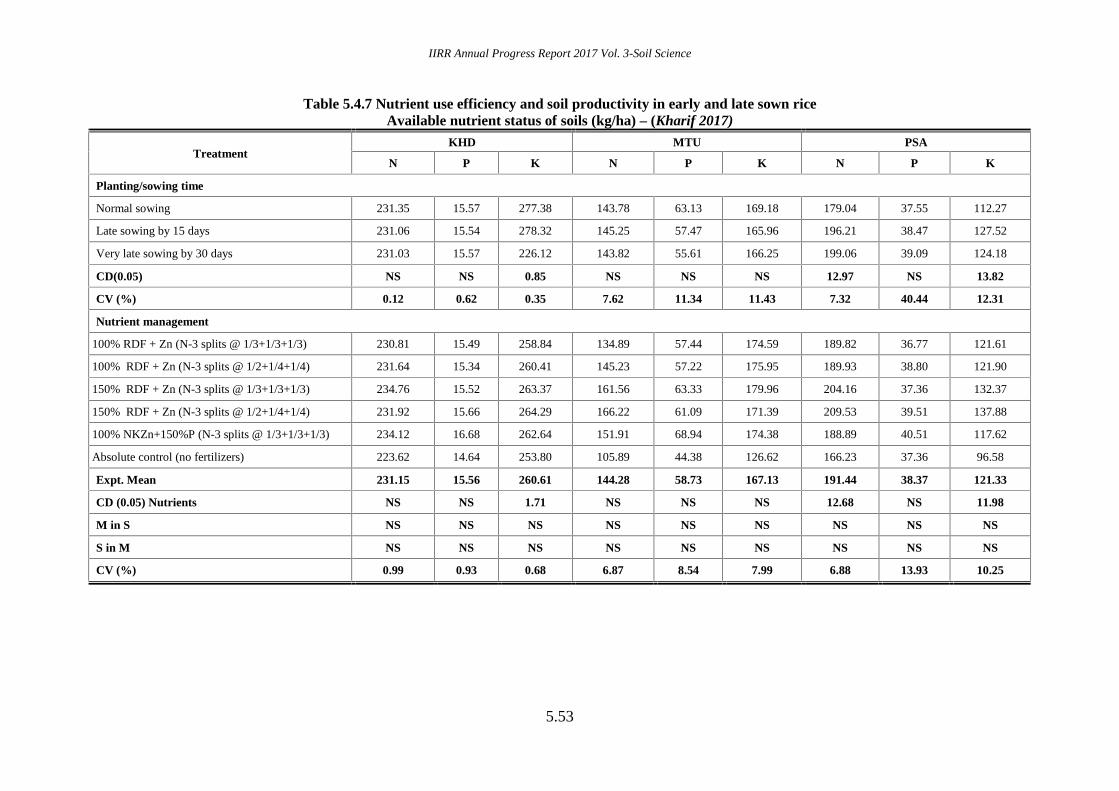
IIRR Annual Progress Report 2017 Vol. 3-Soil Science
5.53
Table 5.4.7 Nutrient use efficiency and soil productivity in early and late sown riceAvailable nutrient status of soils (kg/ha) – (Kharif 2017)
TreatmentKHD MTU PSA
N P K N P K N P K
Planting/sowing time
Normal sowing 231.35 15.57 277.38 143.78 63.13 169.18 179.04 37.55 112.27
Late sowing by 15 days 231.06 15.54 278.32 145.25 57.47 165.96 196.21 38.47 127.52
Very late sowing by 30 days 231.03 15.57 226.12 143.82 55.61 166.25 199.06 39.09 124.18
CD(0.05) NS NS 0.85 NS NS NS 12.97 NS 13.82
CV (%) 0.12 0.62 0.35 7.62 11.34 11.43 7.32 40.44 12.31
Nutrient management
100% RDF + Zn (N-3 splits @ 1/3+1/3+1/3) 230.81 15.49 258.84 134.89 57.44 174.59 189.82 36.77 121.61
100% RDF + Zn (N-3 splits @ 1/2+1/4+1/4) 231.64 15.34 260.41 145.23 57.22 175.95 189.93 38.80 121.90
150% RDF + Zn (N-3 splits @ 1/3+1/3+1/3) 234.76 15.52 263.37 161.56 63.33 179.96 204.16 37.36 132.37
150% RDF + Zn (N-3 splits @ 1/2+1/4+1/4) 231.92 15.66 264.29 166.22 61.09 171.39 209.53 39.51 137.88
100% NKZn+150%P (N-3 splits @ 1/3+1/3+1/3) 234.12 16.68 262.64 151.91 68.94 174.38 188.89 40.51 117.62
Absolute control (no fertilizers) 223.62 14.64 253.80 105.89 44.38 126.62 166.23 37.36 96.58
Expt. Mean 231.15 15.56 260.61 144.28 58.73 167.13 191.44 38.37 121.33
CD (0.05) Nutrients NS NS 1.71 NS NS NS 12.68 NS 11.98
M in S NS NS NS NS NS NS NS NS NS
S in M NS NS NS NS NS NS NS NS NS
CV (%) 0.99 0.93 0.68 6.87 8.54 7.99 6.88 13.93 10.25
IIRR Annual Progress Report 2017 Vol. 3-Soil Science
5.54
5.5 Screening of rice genotypes for acid soils and related nutritional constraints
Acid soils are wide spread in Eastern, North Eastern and coastal regions of the
Indian Peninsula and are poor in soil fertility and are associated with toxicity of iron in
lowlands, aluminum in the uplands, with depletion of Ca, Mg and K, deficiency of B, Mo and
Si. The soils also fix large quantities of soluble P which lead to sub optimal productivity of
crops. Management options include liming to correct soil acidity, balanced application of P,
K, and silicates and organic manuring besides growing tolerant cultures. In addition,
identification of suitable genotypes with high yield potential helps stabilize rice productivity.
The trial was, therefore, conducted at four centres viz., Moncompu (Kuttanad, Kerala, soil pH
5.3), Ranchi (Dumka, Jharkhand, soil pH 5.2), Raipur (Chhattisgarh, Soil pH 5.5), and
Titabar (Assam, soil pH 5.2) under low land conditions during kharif 2017 screening about
13 – 23 genotypes. The results are presented in Tables 5.5.1 – 5.5.11 and briefly discussed.
The genotypes were evaluated at 2 or 3 set of nutrient management treatments viz., NPK(RD)
and NPK (RD)+Lime at Ranchi; and NPK(RD), NPK (RD)+Lime and N (RD)+double PK at
Moncompu, Raipur and Titabar. Lime was applied @ 5.9, 4.0 q/ha at Moncompu and Ranchi,
respectively, while 5 and 1 t/ha at Raipur and Titabar, as per the location specific estimates of
lime requirement. The NPK doses applied were: 90-45-45 at Moncompu, 100-50-25 at
Ranchi 80-50-30 at Raipur, and 40-20-20 at Titabar.
Grain and straw yields
Grain yields at all the four locations were influenced by genotype and liming (Table
5.5.2-5.5.5). Recommended NPK + lime significantly increased grain yields by 23% and
straw yields by 25% compared to unlimed control (Recommended NPK) at Moncompu.
Application of recommended N+double PK was observed to increase grain and straw yields
by 10% and 14% respectively (Table 5.5.2). At Ranchi, significant increases in grain and
straw yields (18% and 19% respectively) were recorded due to the application recommended
NPK + lime when compared to unlimed control (Table 5.5.3). Supplementation of
recommended NPK with lime and doubling the PK appliction increased grain yields by 20%
and 7% respectively and straw yields by 19% and 8% respectively at Raipur (Table 5.5.4).
Recommended N+double PK and recommended NPK + lime significantly increased grain
yields by 11% - 17% compared to recommended NPK at Titabar (Table 5.5.5)
IIRR Annual Progress Report 2017 Vol. 3-Soil Science
5.55
Significant interaction effects of genotype and liming/ double PK application were
observed for grain yields at all the centers (5.5.2-5.5.5). At Moncompu (Table 5.5.2), the
highest yielding genotype was HRI 197 (5.11 t/ha) when fertilized with recommended NPK +
lime while HRI 196 yielded the lowest (0.62 t/ha) at recommended N + double PK. The
varieties which produced the highest grain and straw yields with recommended NPK and
liming was HRI 197 (5.11 and 9.58 t/ha respectively) followed by Uma (3.04 and 5.58 t/ha
respectively) and 27P63 (4.29 and 4.63 respectively). DRR Dhan 45 (4.76 and 5.11 t/ha) and
DRR Dhan 42 (4.19 t/ha and 4.50 t/ha) with the highest grain and straw yields respectively,
yielded the highest among the varieties. The genotypes Uma (4.51 t/ha), KAU 109 (3.84 t/ha)
and 27P63 (3.20 t/ha) produced the highest grain yields under unlimed conditons. The highest
yields at Ranchi (Table 5.5.3) was recorded in HRI 196 (7.17 t/ha) in the treatment
supplemented with lime application. The other genotypes with the highest yields in the limed
treatment are 27P 64 and 27 P 63 with a production of 6.67 and 5.72 t/ha. HRI 196, 27P 64
and 27 P 63 yielded the highest under unlimed acid conditions with yields of 6.03, 5.38 and
5.01 respectively. At Raipur, Indira Maheswari (5.89, 6.12 and 5.18 t/ha) and RP5974-3-2-8-
38-12 (5.45 6.32 and 5.77 t/ha) recorded higher grain yields than other varieties when
fertilized with recommended NPK, NPK + liming, recommended N+double PK respectively
(Table 5.5.4). The three genotypes viz., Gitesh (4.07, 4.38, and 4.13 t/ha ), Prafulla (4.60,
4.33 and 4.03 t/ha) and Aghonibora (3.92, 4.28 and 4.05 t/ha) produced higher grain yields at
Titabar than the other evaluated varieties with all the three fertilizer regimes of
recommended NPK, NPK + liming, recommended N+double PK respectively.
Nutrient uptakes
A 24% increase in P uptake was observed at Ranchi (Table 5.5.6) due to
supplementation of lime along with recommended NPK. HRI 197 and HRI 196 had the
highest P uptake of 10.93 kg/ha and 10.87 kg/ha respectively for the recommended NPK
treatment and an uptake of 13.83 and 14.40 kg /ha respectively when recommended NPK
was supplemented with lime. At Raipur fertilization regimes significantly influenced the
uptake of N and P but not K (Table 5.5.7). Among the varieties, Indira Maheswari recorded
the highest uptake of N (128.5 kg/ha), P (23.7 kg/ha) and K (197.9 kg/ha). Significantly
higher uptake of Zn and Cu was observed in the treatment that received recommended NPK
with liming (Table 5.5.8). Among the 23 genotypes tested, Indira Maheswari and RP5974-3-
2-8-38-12 recorded significantly higher micronutrient uptakes.

IIRR Annual Progress Report 2017 Vol. 3-Soil Science
5.56
Post harvest soil characteristics
Soil availability of NPK and micronutrients like Zn and Cu was not significantly
influenced by fertilization regimes and by genotypes at Raipur (Table 5.5.9 and Table
5.5.10). Availability of Mn and Fe were not influenced by application of fertilizers and
supplements, but varietal differences in the availability was observed (Table 5.5.10). No
influence of the treatments were observed for post harvest soil EC while the pH variations
due to genotypes were observed at Raipur (5.5.11).
Summary
Liming increased yields by 23%, 20%, 18% and 17% at Moncompu, Raipur, Ranchi and
Titabar. Double PK application along with recommended N also increased yields by 10% at
Moncompu,11% at Titabar and by 7% at Raipur. The genotypes responsive to liming were
HRI 197, Uma, 27 P63 and DRR Dhan 42 at Moncompu, HRI 196, 27 P64, 27 P63 at
Ranchi, Indira Maheswari, RP5974-3-2-8-38-12, Prathyasa, DRRH 92, Mahamaya at Raipur
and Gitesh, Prafulla, and Aghonibora at Titabar. Genotypes tolerant to native soil acidity
were Uma, KAU 109, DRR Dhan 42, 27P63 at Moncompu, Indira Maheswari, RP5974-3-2-
8-38-12, Safari 17, Bamleswari and DRRH-92 at Raipur, HRI 196, 27 P64, 27 P63 at
Ranchi and Gitesh, Prafulla 27P36 and Aghonibora at Titabar as they recorded superior
yields in comparison to other genotypes in the treatment without liming.

IIRR Annual Progress Report 2017 Vol. 3-Soil Science
5.57
Table 5.5.1 Screening of rice genotypes for soil acidity and related nutritionalconstraints (kharif 2017)
Soil and Crop dataParameters Moncompu Ranchi (Dumka) Raipur TitabarNumber of varietiesevaluated
14 13 23 16
Treatments followed
NPK (RD) NPK (RD) +
LIME@ 590kg/ha
N (RD) + doublePK
NPK (RD) NPK (RD) +
LIME @ 4 Q/ha
NPK (RD) NPK (RD) +
LIME@ 5t /ha N (RD) + double
PK
NPK (RD) NPK (RD) +
Lime @ 1t/ha N (RD) + double
PK
Rec. fert. Dose (kgN,P2O5 and K2O/ha)
90-45-45 100-50-25 80-50-30 40-20-40
Soil% Clay 64.3 23 38 42% Silt 24.7 34 36 28.5% Sand 11.0 43 26 29.5Soil texture Clay - Loam Silty claypH 5.34 5.2 5.5 5.2Org.carbon (%) 2.7 0.65 0.50 1.1CEC (me/100g) - 16 - 12.8EC ds/m - - 0.09 -Avail.N (kg/ha) - 320 119.8 485Avail. P2O5 (kg/ha) 90.03 28.4 17.78 22.30Avail. K2O (kg/ha) 200.94 185 144.7 142
Table 5.5.2. Screening of rice genotypes for soil acidity and related nutritionalconstraints (Moncompu- kharif 2017)
Grain and straw yields
VarietyGrain yield (t/ha) Straw yield (t/ha)
T1* T2 T3 Mean T1* T2 T3 MeanT1 93 1.62 2.47 2.84 2.31 1.93 2.68 3.14 2.58KAU 109 3.84 2.42 3.59 3.28 4.05 2.75 3.85 3.55HRI 197 2.07 5.11 3.72 3.64 2.33 5.98 4.03 4.11DRR Dhan 41 2.46 2.91 2.59 2.65 2.78 3.09 2.70 2.86DRR Dhan 43 1.46 1.65 1.87 1.66 1.63 1.84 2.06 1.84HRI – 196 2.64 3.03 0.62 2.10 2.88 3.24 0.77 2.30DRR Dhan 44 2.06 3.15 3.41 2.88 2.33 3.32 3.57 3.07DRR Dhan 46 1.78 3.43 1.82 2.34 2.07 3.60 2.06 2.5827P 36 2.72 3.38 0.84 2.31 2.87 3.53 0.99 2.46Uma 4.51 5.04 1.97 3.84 4.61 5.88 2.11 4.20DRR Dhan 40 2.36 3.43 3.95 3.24 2.49 3.69 4.30 3.4927P 63 3.20 4.29 3.96 3.82 3.37 4.63 4.28 4.09DRR Dhan 45 2.53 1.58 4.76 2.95 2.73 1.90 5.11 3.25DRR Dhan 42 3.14 3.09 4.19 3.47 3.48 3.26 4.50 3.75Mean 2.60 3.21 2.87 2.89 2.82 3.53 3.11 3.15CD (0.05) Main 0.11 0.10
Sub 0.28 0.29Main x Sub 0.49 0.50Sub x Main 0.49 0.49
CV% Main 5.99 5.34Sub 10.49 9.81
*T1=Recommended NPK, T2= Recommended NPK + Lime, T3= Recommended N + double PK

IIRR Annual Progress Report 2017 Vol. 3-Soil Science
5.58
Table 5.5.3. Screening of rice genotypes for soil acidity and related nutritionalconstraints (Ranchi -kharif 2017)
Grain and Straw Yield
VarietyGrain yield (t/ha) Straw yield (t/ha)
T1* T2 Mean T1* T2 Mean27P63 5.01 5.72 5.37 5.75 6.50 6.1327P64 5.38 6.67 6.02 5.50 6.94 6.22HRI 196 6.03 7.17 6.60 6.36 7.42 6.89HRI 197 5.19 6.55 5.87 5.37 6.75 6.06DRR-40 3.74 4.68 4.21 4.02 4.90 4.46DRR-41 4.57 5.19 4.88 4.87 5.71 5.29DRR-42 3.51 4.27 3.89 5.36 6.77 6.07DRR-43 4.35 5.26 4.80 8.10 9.17 8.64DRR-44 3.91 4.80 4.35 5.60 7.70 6.65DRR-45 3.59 4.15 3.87 4.06 4.67 4.36DRR-46 3.38 3.59 3.49 3.79 4.02 3.91TI-93 3.50 3.93 3.72 3.68 4.12 3.90MTU 7029 4.50 4.75 4.63 4.63 4.89 4.76Mean 4.36 5.13 4.75 5.16 6.12 5.64CD (0.05) Main 0.35 0.41
Sub 0.59 0.70Main x Sub 0.84 0.99Sub x Main 0.86 1.01
CV% Main 7.49 7.38Sub 10.74 10.7
*T1=Recommended NPK, T2= Recommended NPK + Lime

IIRR Annual Progress Report 2017 Vol. 3-Soil Science
5.59
Table 5.5.4. Screening of rice genotypes for soil acidity and related nutritionalconstraints (Raipur -kharif 2017)
Grain and straw yieldsGrain yield (t/ha) Straw yield (t/ha)
T1* T2 T3 Mean T1* T2 T3 MeanIndira Maheswari 5.89 6.12 5.18 5.73 7.32 9.53 7.44 8.10Mahamaya 4.05 4.98 4.45 4.49 5.21 5.77 5.76 5.58Danteswari 2.33 3.59 2.98 2.96 2.98 4.89 4.27 4.05Mahasugandha 3.36 4.43 3.72 3.84 4.62 6.11 5.27 5.33Safari -17 4.21 4.28 4.40 4.30 5.97 6.17 5.91 6.01Bamleswari 4.29 4.49 4.34 4.37 5.49 6.31 5.36 5.72DRR Dhan -42 3.66 3.88 3.91 3.82 4.93 5.40 4.89 5.07DRR Dhan -39 3.32 4.38 4.14 3.95 4.80 5.85 5.62 5.42DRR Dhan -43 3.81 4.54 4.05 4.14 4.95 5.62 5.33 5.3027P-36 3.94 4.81 4.21 4.32 4.97 5.76 5.22 5.3227P-32 3.92 4.58 4.09 4.20 4.82 5.65 5.28 5.2527P-37 4.07 4.72 4.54 4.44 5.08 5.77 5.73 5.5327P-63 3.73 4.35 4.05 4.05 4.69 6.20 5.06 5.3228 P -67 3.67 4.58 4.13 4.13 4.82 5.86 5.62 5.44KRH-4 3.73 4.93 4.13 4.26 5.25 5.76 5.19 5.40US-314 4.07 4.63 4.10 4.27 5.14 5.44 5.57 5.38DRRH -92 4.17 5.10 4.39 4.55 5.13 6.69 5.33 5.72Uma 3.46 3.57 3.13 3.39 4.40 4.82 4.93 4.72Prathyasa 3.67 5.25 4.02 4.31 5.01 6.03 5.33 5.46Sreyas 3.46 4.68 3.99 4.04 4.64 5.90 5.16 5.23RP5973-4-1-6-129-35 4.08 4.55 4.12 4.25 5.30 6.07 5.32 5.57RP5971-2-6-2-1-232 3.23 4.12 3.49 3.61 4.58 5.65 4.77 5.00RP5974-3-2-8-38-12 5.45 6.32 5.77 5.84 6.93 7.57 7.75 7.42Mean 3.89 4.65 4.15 4.23 5.09 6.04 5.48 5.54CD (0.05)
Main0.55 0.83
Sub 0.27 0.43Main x Sub 0.47 0.74Sub x Main 0.71 1.08
CV% Main 27.69 31.60Sub 6.89 8.29
*T1=Recommended NPK, T2= Recommended NPK + Lime, T3= Recommended N + double PK
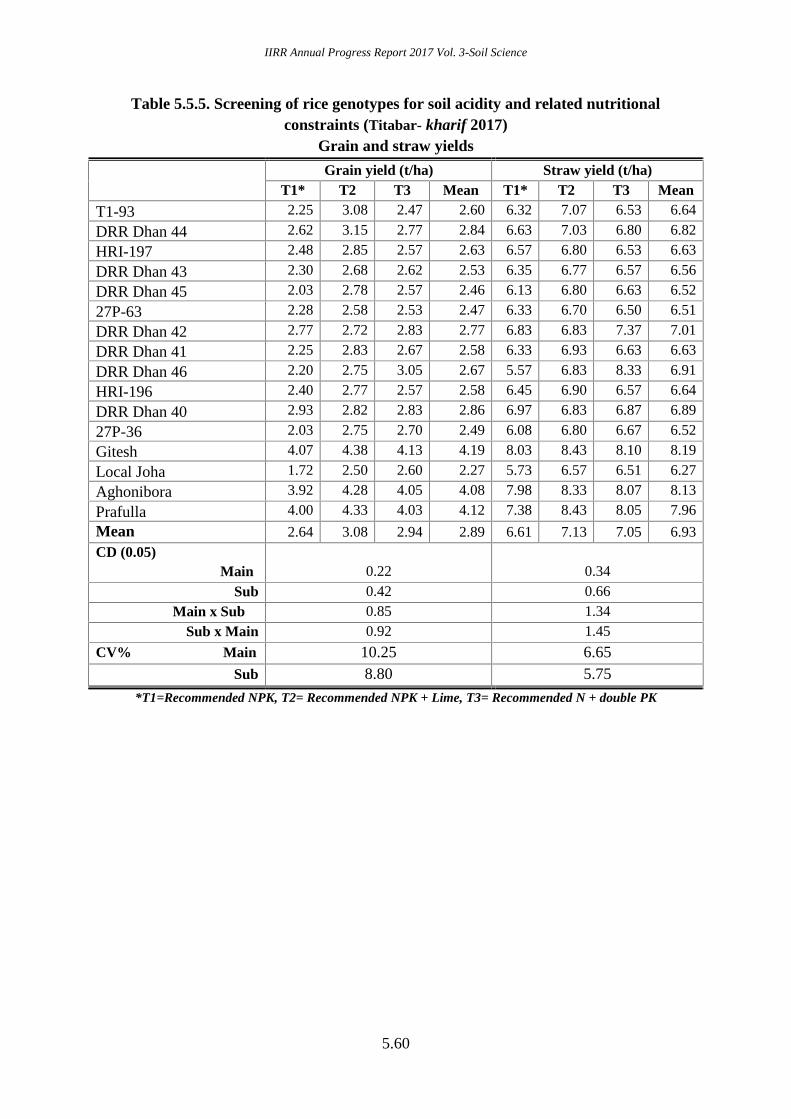
IIRR Annual Progress Report 2017 Vol. 3-Soil Science
5.60
Table 5.5.5. Screening of rice genotypes for soil acidity and related nutritionalconstraints (Titabar- kharif 2017)
Grain and straw yields
Grain yield (t/ha) Straw yield (t/ha)T1* T2 T3 Mean T1* T2 T3 Mean
T1-93 2.25 3.08 2.47 2.60 6.32 7.07 6.53 6.64
DRR Dhan 44 2.62 3.15 2.77 2.84 6.63 7.03 6.80 6.82
HRI-197 2.48 2.85 2.57 2.63 6.57 6.80 6.53 6.63
DRR Dhan 43 2.30 2.68 2.62 2.53 6.35 6.77 6.57 6.56
DRR Dhan 45 2.03 2.78 2.57 2.46 6.13 6.80 6.63 6.52
27P-63 2.28 2.58 2.53 2.47 6.33 6.70 6.50 6.51
DRR Dhan 42 2.77 2.72 2.83 2.77 6.83 6.83 7.37 7.01
DRR Dhan 41 2.25 2.83 2.67 2.58 6.33 6.93 6.63 6.63
DRR Dhan 46 2.20 2.75 3.05 2.67 5.57 6.83 8.33 6.91
HRI-196 2.40 2.77 2.57 2.58 6.45 6.90 6.57 6.64
DRR Dhan 40 2.93 2.82 2.83 2.86 6.97 6.83 6.87 6.89
27P-36 2.03 2.75 2.70 2.49 6.08 6.80 6.67 6.52
Gitesh 4.07 4.38 4.13 4.19 8.03 8.43 8.10 8.19
Local Joha 1.72 2.50 2.60 2.27 5.73 6.57 6.51 6.27
Aghonibora 3.92 4.28 4.05 4.08 7.98 8.33 8.07 8.13
Prafulla 4.00 4.33 4.03 4.12 7.38 8.43 8.05 7.96
Mean 2.64 3.08 2.94 2.89 6.61 7.13 7.05 6.93CD (0.05)
Main 0.22 0.34Sub 0.42 0.66
Main x Sub 0.85 1.34Sub x Main 0.92 1.45
CV% Main 10.25 6.65Sub 8.80 5.75
*T1=Recommended NPK, T2= Recommended NPK + Lime, T3= Recommended N + double PK

IIRR Annual Progress Report 2017 Vol. 3-Soil Science
5.61
Table 5.5.6. Screening of rice genotypes for soil acidity and related nutritionalconstraints (Ranchi -kharif 2017)
P uptake
VarietyP uptake (kg/ha)
T1* T2 Mean
27P63 10.07 12.47 11.27
27P64 9.73 13.37 11.55
HRI 196 10.87 14.40 12.63
HRI 197 10.93 13.83 12.38
DRR-40 8.27 10.80 9.53
DRR-41 9.17 10.50 9.83
DRR-42 7.20 8.63 7.92
DRR-43 9.30 12.33 10.82
DRR-44 8.10 11.10 9.60
DRR-45 6.97 8.30 7.63
DRR-46 7.47 8.33 7.90
TI-93 7.77 8.27 8.02
MTU 7029 9.07 10.03 9.55
Mean 8.84 10.95 9.89
CD (0.05)Main
0.83
Sub 1.22
Main x Sub NS
Sub x Main NS
CV% Main 8.56
Sub 10.66
*T1=Recommended NPK, T2= Recommended NPK + Lime
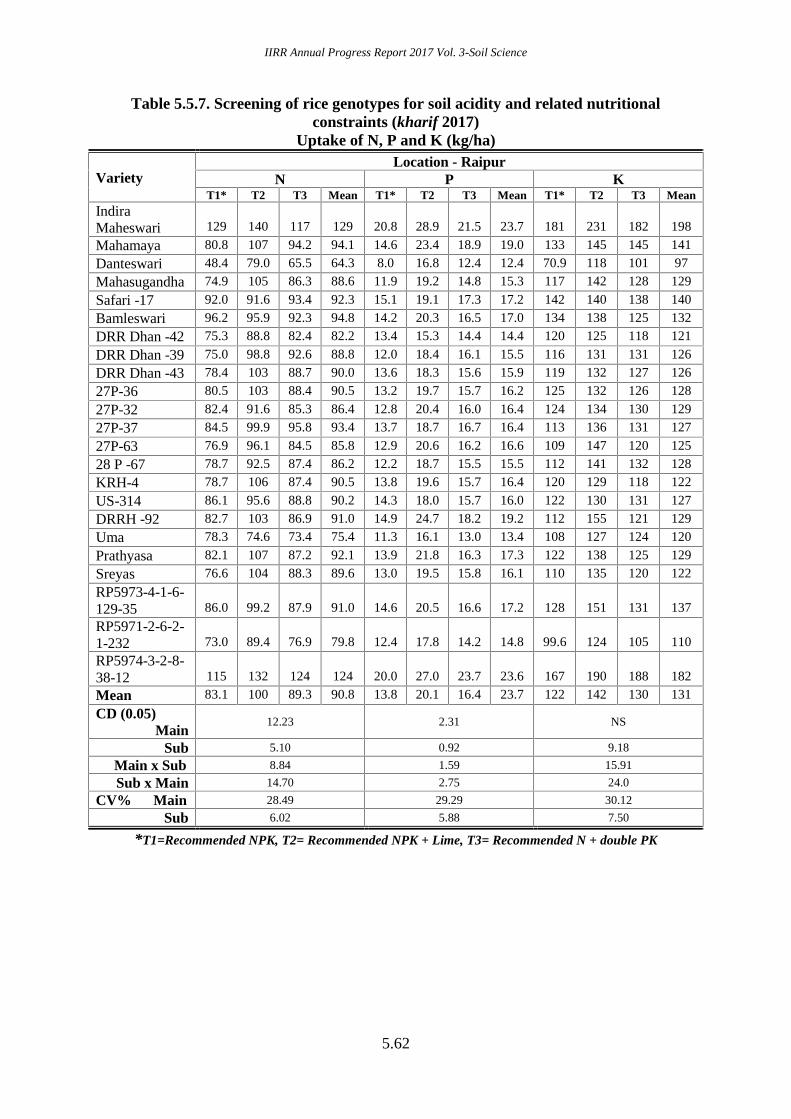
IIRR Annual Progress Report 2017 Vol. 3-Soil Science
5.62
Table 5.5.7. Screening of rice genotypes for soil acidity and related nutritionalconstraints (kharif 2017)
Uptake of N, P and K (kg/ha)
VarietyLocation - Raipur
N P KT1* T2 T3 Mean T1* T2 T3 Mean T1* T2 T3 Mean
IndiraMaheswari 129 140 117 129 20.8 28.9 21.5 23.7 181 231 182 198
Mahamaya 80.8 107 94.2 94.1 14.6 23.4 18.9 19.0 133 145 145 141
Danteswari 48.4 79.0 65.5 64.3 8.0 16.8 12.4 12.4 70.9 118 101 97
Mahasugandha 74.9 105 86.3 88.6 11.9 19.2 14.8 15.3 117 142 128 129
Safari -17 92.0 91.6 93.4 92.3 15.1 19.1 17.3 17.2 142 140 138 140
Bamleswari 96.2 95.9 92.3 94.8 14.2 20.3 16.5 17.0 134 138 125 132
DRR Dhan -42 75.3 88.8 82.4 82.2 13.4 15.3 14.4 14.4 120 125 118 121
DRR Dhan -39 75.0 98.8 92.6 88.8 12.0 18.4 16.1 15.5 116 131 131 126
DRR Dhan -43 78.4 103 88.7 90.0 13.6 18.3 15.6 15.9 119 132 127 126
27P-36 80.5 103 88.4 90.5 13.2 19.7 15.7 16.2 125 132 126 128
27P-32 82.4 91.6 85.3 86.4 12.8 20.4 16.0 16.4 124 134 130 129
27P-37 84.5 99.9 95.8 93.4 13.7 18.7 16.7 16.4 113 136 131 127
27P-63 76.9 96.1 84.5 85.8 12.9 20.6 16.2 16.6 109 147 120 125
28 P -67 78.7 92.5 87.4 86.2 12.2 18.7 15.5 15.5 112 141 132 128
KRH-4 78.7 106 87.4 90.5 13.8 19.6 15.7 16.4 120 129 118 122
US-314 86.1 95.6 88.8 90.2 14.3 18.0 15.7 16.0 122 130 131 127
DRRH -92 82.7 103 86.9 91.0 14.9 24.7 18.2 19.2 112 155 121 129
Uma 78.3 74.6 73.4 75.4 11.3 16.1 13.0 13.4 108 127 124 120
Prathyasa 82.1 107 87.2 92.1 13.9 21.8 16.3 17.3 122 138 125 129
Sreyas 76.6 104 88.3 89.6 13.0 19.5 15.8 16.1 110 135 120 122
RP5973-4-1-6-129-35 86.0 99.2 87.9 91.0 14.6 20.5 16.6 17.2 128 151 131 137
RP5971-2-6-2-1-232 73.0 89.4 76.9 79.8 12.4 17.8 14.2 14.8 99.6 124 105 110
RP5974-3-2-8-38-12 115 132 124 124 20.0 27.0 23.7 23.6 167 190 188 182
Mean 83.1 100 89.3 90.8 13.8 20.1 16.4 23.7 122 142 130 131
CD (0.05)Main
12.23 2.31 NS
Sub 5.10 0.92 9.18
Main x Sub 8.84 1.59 15.91
Sub x Main 14.70 2.75 24.0
CV% Main 28.49 29.29 30.12
Sub 6.02 5.88 7.50
*T1=Recommended NPK, T2= Recommended NPK + Lime, T3= Recommended N + double PK

IIRR Annual Progress Report 2017 Vol. 3-Soil Science
5.63
Table 5.5.8. Screening of rice genotypes for soil acidity and related nutritionalconstraints (kharif 2017)
Zn, Mn, Fe and Cu uptake (g/ha)
Variety
Location - Raipur
Zn Mn Fe Cu
T1* T2 T3 Mean T1* T2 T3 Mean T1* T2 T3 Mean T1* T2 T3 Mean
IndiraMaheswari
201 268 204 224 2851 2365 2330 2515 3455 3141 2918 3171 154 263 152 190
Mahamaya 156 201 184 180 2182 1791 2049 2007 2541 2400 2547 2496 117 171 104 131
Danteswari 89 166 134 130 1196 1448 1434 1359 1335 2050 1802 1729 77 147 92 105
Mahasugandha 124 185 149 153 1655 1879 1738 1757 2135 2542 2290 2322 123 148 114 128
Safari -17 206 183 193 194 1988 1808 1894 1897 2569 2309 2431 2436 143 159 118 140
Bamleswari 157 207 169 177 2261 2031 2044 2112 2202 2963 2401 2522 124 169 110 134
DRR Dhan -42
184 169 173 175 1712 1557 1626 1631 1909 2496 2140 2182 127 164 115 135
DRR Dhan -39
168 188 191 182 1609 1852 1851 1770 1944 2504 2365 2271 113 162 117 131
DRR Dhan -43
146 215 180 180 1848 1699 1776 1774 2037 2173 2096 2102 82 155 76 104
27P-36 176 201 183 187 1847 2036 1881 1922 1989 2431 2139 2186 170 175 146 164
27P-32 127 180 151 153 1538 1790 1636 1655 2089 2266 2158 2171 106 115 90 104
27P-37 161 239 209 203 1616 1732 1754 1701 2462 2578 2642 2561 108 184 107 133
27P-63 132 196 155 161 1333 1714 1461 1503 1965 2568 2173 2235 104 154 87 115
28 P -67 143 219 187 183 1457 1726 1639 1608 2021 2370 2270 2220 103 141 96 113
KRH-4 159 175 160 164 1489 1916 1619 1675 2419 2496 2342 2419 169 142 124 145
US-314 157 166 163 162 1652 1870 1762 1761 1837 2745 2281 2288 124 132 103 120
DRRH -92 172 258 196 209 1772 2161 1824 1919 2297 2740 2328 2455 123 191 103 139
Uma 172 143 162 159 1614 1549 1577 1580 2007 2056 2025 2029 126 119 107 117
Prathyasa 163 202 172 179 1964 2586 2119 2223 2292 2586 2308 2395 112 163 93 123
Sreyas 177 215 194 195 1440 2207 1772 1806 1920 2602 2215 2246 135 128 112 125
RP5973-4-1-6-129-35
169 232 188 196 1367 1777 1481 1542 2438 2437 2311 2395 158 198 140 165
RP5971-2-6-2-1-232
167 182 166 172 1317 1715 1425 1486 1722 2178 1835 1912 107 157 109 124
RP5974-3-2-8-38-12
206 230 227 221 2003 2484 2313 2267 2983 3384 3284 3217 249 252 209 237
Mean 161 201 178 180 1727 1900 1783 1803 2199 2522 2317 2346 129 165 114 136
CD (0.05)Main
25.87 NS NS 22.04
Sub 14.27 121 139 8.54
Main x Sub 24.71 210 240 14.80
Sub x Main 36.28 334 389 26.02
CV% Main 34.91 31.60 28.56 34.35
Sub 8.50 7.21 6.34 6.75
*T1=Recommended NPK, T2= Recommended NPK + Lime, T3= Recommended N + double PK

IIRR Annual Progress Report 2017 Vol. 3-Soil Science
5.64
Table 5.5.9. Screening of rice genotypes for soil acidity and related nutritionalconstraints (kharif 2017)
N, P and K status after harvest
Variety
Location - Raipur
N P K
T1* T2 T3 Mean T1* T2 T3 Mean T1* T2 T3 Mean
IndiraMaheswari
129 142 129 134 10.5 17.3 20.3 16.1 158 160 147 155
Mahamaya 142 129 142 138 20.6 10.6 17.3 16.2 138 158 160 152
Danteswari 163 142 129 145 18.7 20.6 10.6 16.6 179 138 158 158
Mahasugandha 134 163 142 146 17.9 18.7 20.6 19.1 140 179 138 152
Safari -17 129 133 163 142 20.3 17.9 18.7 16.0 147 140 179 155
Bamleswari 142 129 134 135 17.3 20.3 17.9 18.5 160 147 140 149
DRR Dhan -42 129 142 129 134 10.6 17.3 20.3 16.1 158 160 147 155
DRR Dhan -39 142 129 142 138 20.6 10.6 17.3 16.2 138 158 160 152
DRR Dhan -43 163 142 129 145 18.7 20.6 10.6 16.6 179 138 158 158
27P-36 134 163 142 146 17.9 18.7 20.6 19.1 140 179 138 152
27P-32 129 134 163 142 20.3 17.9 18.7 19.0 147 140 179 155
27P-37 142 129 134 135 17.3 20.3 17.9 18.5 160 147 140 149
27P-63 129 142 129 134 10.6 17.3 20.3 16.1 158 160 147 155
28 P -67 142 129 142 138 20.6 10.6 17.3 16.2 138 158 160 152
KRH-4 163 142 129 145 18.7 20.6 10.6 16.6 179 138 158 158
US-314 133 163 142 146 17.9 18.7 20.6 19.1 140 179 138 152
DRRH -92 129 134 129 131 20.3 17.9 13.6 17.3 147 140 158 148
Uma 142 129 134 135 17.3 20.3 17.9 18.5 160 147 140 149
Prathyasa 129 142 129 134 10.6 17.3 20.3 16.1 158 160 147 155
Sreyas 142 129 142 138 20.6 10.6 17.3 16.2 138 158 160 152
RP5973-4-1-6-129-35
163 142 129 145 18.7 20.6 10.6 16.6 179 138 158 159
RP5971-2-6-2-1-232
134 163 142 146 17.9 18.7 20.6 19.1 140 179 138 153
RP5974-3-2-8-38-12
129 134 129 131 20.3 17.9 13.6 17.3 147 140 158 149
Mean 140 140 139 140 17.6 17.4 17.3 17.5 154 154 154 154
CD (0.05)Main
NS NS NS
Sub NS NS NS
Main x Sub 26.10 6.23 NS
Sub x Main 25.58 6.13 52.37
CV% Main 2.69 8.73 4.17
Sub 11.57 22.10 21.53
*T1=Recommended NPK, T2= Recommended NPK + Lime, T3= Recommended N + double PK
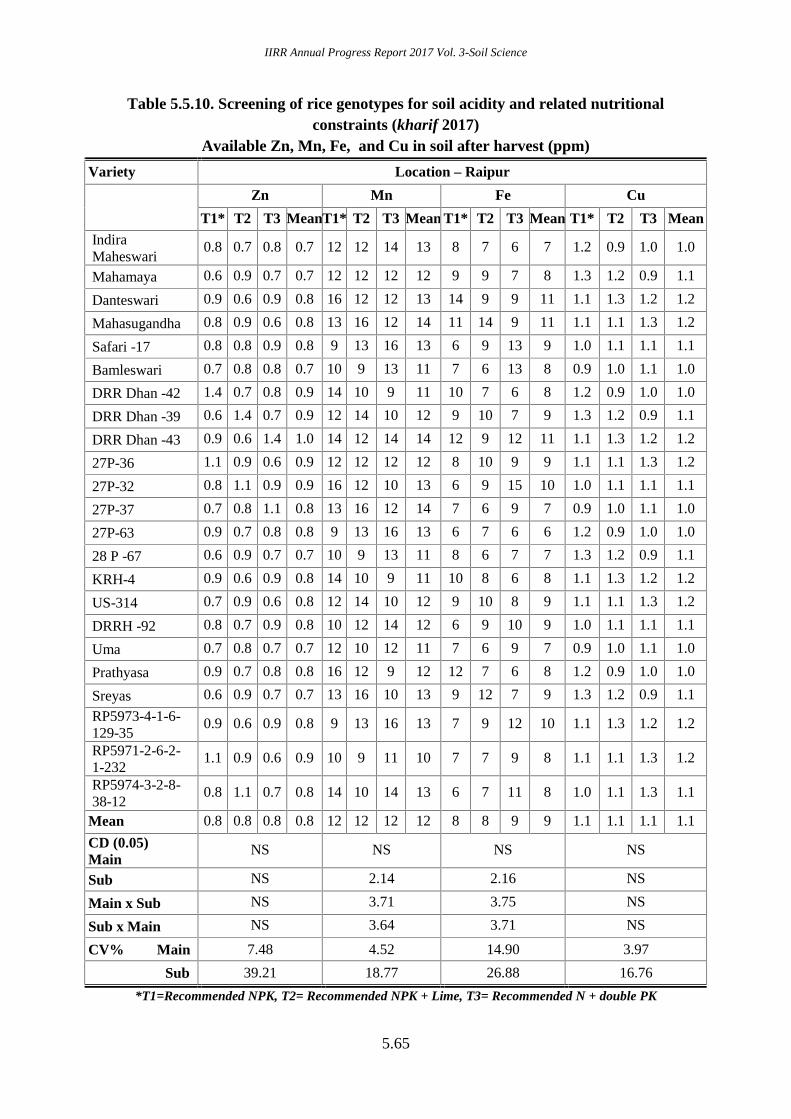
IIRR Annual Progress Report 2017 Vol. 3-Soil Science
5.65
Table 5.5.10. Screening of rice genotypes for soil acidity and related nutritionalconstraints (kharif 2017)
Available Zn, Mn, Fe, and Cu in soil after harvest (ppm)
Variety Location – Raipur
Zn Mn Fe Cu
T1* T2 T3 MeanT1* T2 T3 Mean T1* T2 T3 Mean T1* T2 T3 Mean
IndiraMaheswari
0.8 0.7 0.8 0.7 12 12 14 13 8 7 6 7 1.2 0.9 1.0 1.0
Mahamaya 0.6 0.9 0.7 0.7 12 12 12 12 9 9 7 8 1.3 1.2 0.9 1.1
Danteswari 0.9 0.6 0.9 0.8 16 12 12 13 14 9 9 11 1.1 1.3 1.2 1.2
Mahasugandha 0.8 0.9 0.6 0.8 13 16 12 14 11 14 9 11 1.1 1.1 1.3 1.2
Safari -17 0.8 0.8 0.9 0.8 9 13 16 13 6 9 13 9 1.0 1.1 1.1 1.1
Bamleswari 0.7 0.8 0.8 0.7 10 9 13 11 7 6 13 8 0.9 1.0 1.1 1.0
DRR Dhan -42 1.4 0.7 0.8 0.9 14 10 9 11 10 7 6 8 1.2 0.9 1.0 1.0
DRR Dhan -39 0.6 1.4 0.7 0.9 12 14 10 12 9 10 7 9 1.3 1.2 0.9 1.1
DRR Dhan -43 0.9 0.6 1.4 1.0 14 12 14 14 12 9 12 11 1.1 1.3 1.2 1.2
27P-36 1.1 0.9 0.6 0.9 12 12 12 12 8 10 9 9 1.1 1.1 1.3 1.2
27P-32 0.8 1.1 0.9 0.9 16 12 10 13 6 9 15 10 1.0 1.1 1.1 1.1
27P-37 0.7 0.8 1.1 0.8 13 16 12 14 7 6 9 7 0.9 1.0 1.1 1.0
27P-63 0.9 0.7 0.8 0.8 9 13 16 13 6 7 6 6 1.2 0.9 1.0 1.0
28 P -67 0.6 0.9 0.7 0.7 10 9 13 11 8 6 7 7 1.3 1.2 0.9 1.1
KRH-4 0.9 0.6 0.9 0.8 14 10 9 11 10 8 6 8 1.1 1.3 1.2 1.2
US-314 0.7 0.9 0.6 0.8 12 14 10 12 9 10 8 9 1.1 1.1 1.3 1.2
DRRH -92 0.8 0.7 0.9 0.8 10 12 14 12 6 9 10 9 1.0 1.1 1.1 1.1
Uma 0.7 0.8 0.7 0.7 12 10 12 11 7 6 9 7 0.9 1.0 1.1 1.0
Prathyasa 0.9 0.7 0.8 0.8 16 12 9 12 12 7 6 8 1.2 0.9 1.0 1.0
Sreyas 0.6 0.9 0.7 0.7 13 16 10 13 9 12 7 9 1.3 1.2 0.9 1.1
RP5973-4-1-6-129-35
0.9 0.6 0.9 0.8 9 13 16 13 7 9 12 10 1.1 1.3 1.2 1.2
RP5971-2-6-2-1-232
1.1 0.9 0.6 0.9 10 9 11 10 7 7 9 8 1.1 1.1 1.3 1.2
RP5974-3-2-8-38-12
0.8 1.1 0.7 0.8 14 10 14 13 6 7 11 8 1.0 1.1 1.3 1.1
Mean 0.8 0.8 0.8 0.8 12 12 12 12 8 8 9 9 1.1 1.1 1.1 1.1
CD (0.05)Main
NS NS NS NS
Sub NS 2.14 2.16 NS
Main x Sub NS 3.71 3.75 NS
Sub x Main NS 3.64 3.71 NS
CV% Main 7.48 4.52 14.90 3.97
Sub 39.21 18.77 26.88 16.76
*T1=Recommended NPK, T2= Recommended NPK + Lime, T3= Recommended N + double PK
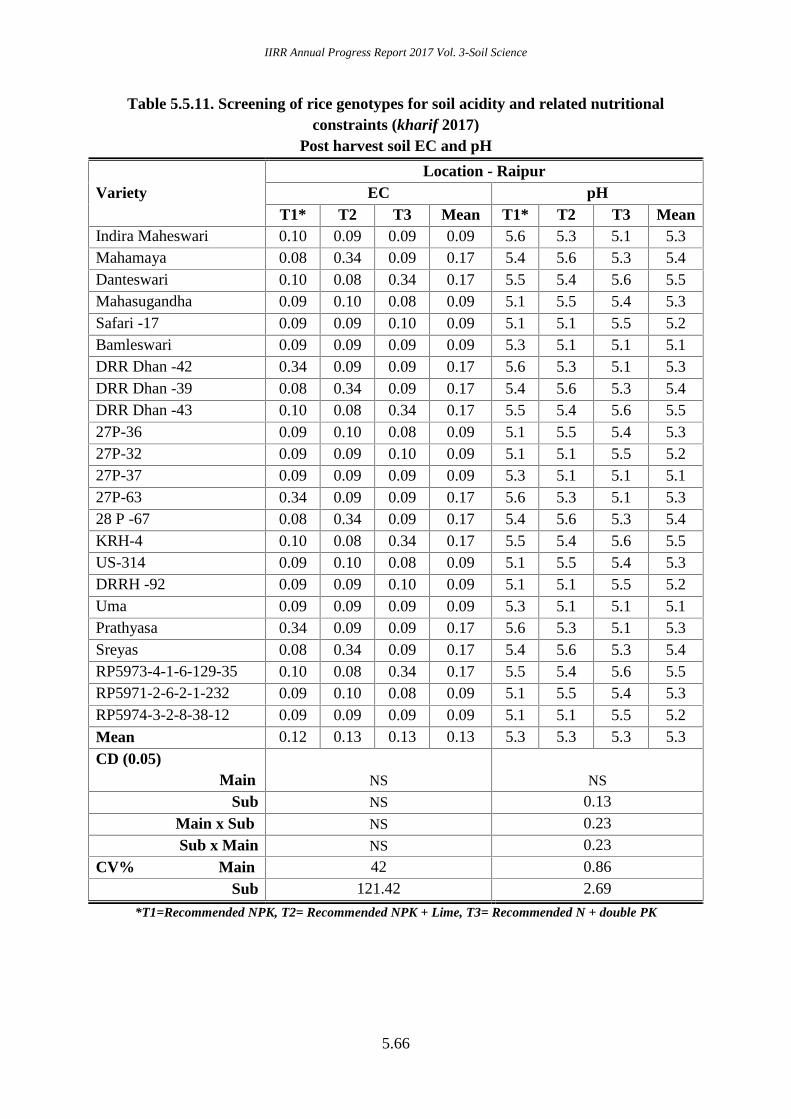
IIRR Annual Progress Report 2017 Vol. 3-Soil Science
5.66
Table 5.5.11. Screening of rice genotypes for soil acidity and related nutritionalconstraints (kharif 2017)
Post harvest soil EC and pH
VarietyLocation - Raipur
EC pHT1* T2 T3 Mean T1* T2 T3 Mean
Indira Maheswari 0.10 0.09 0.09 0.09 5.6 5.3 5.1 5.3Mahamaya 0.08 0.34 0.09 0.17 5.4 5.6 5.3 5.4Danteswari 0.10 0.08 0.34 0.17 5.5 5.4 5.6 5.5Mahasugandha 0.09 0.10 0.08 0.09 5.1 5.5 5.4 5.3Safari -17 0.09 0.09 0.10 0.09 5.1 5.1 5.5 5.2Bamleswari 0.09 0.09 0.09 0.09 5.3 5.1 5.1 5.1DRR Dhan -42 0.34 0.09 0.09 0.17 5.6 5.3 5.1 5.3DRR Dhan -39 0.08 0.34 0.09 0.17 5.4 5.6 5.3 5.4DRR Dhan -43 0.10 0.08 0.34 0.17 5.5 5.4 5.6 5.527P-36 0.09 0.10 0.08 0.09 5.1 5.5 5.4 5.327P-32 0.09 0.09 0.10 0.09 5.1 5.1 5.5 5.227P-37 0.09 0.09 0.09 0.09 5.3 5.1 5.1 5.127P-63 0.34 0.09 0.09 0.17 5.6 5.3 5.1 5.328 P -67 0.08 0.34 0.09 0.17 5.4 5.6 5.3 5.4KRH-4 0.10 0.08 0.34 0.17 5.5 5.4 5.6 5.5US-314 0.09 0.10 0.08 0.09 5.1 5.5 5.4 5.3DRRH -92 0.09 0.09 0.10 0.09 5.1 5.1 5.5 5.2Uma 0.09 0.09 0.09 0.09 5.3 5.1 5.1 5.1Prathyasa 0.34 0.09 0.09 0.17 5.6 5.3 5.1 5.3Sreyas 0.08 0.34 0.09 0.17 5.4 5.6 5.3 5.4RP5973-4-1-6-129-35 0.10 0.08 0.34 0.17 5.5 5.4 5.6 5.5RP5971-2-6-2-1-232 0.09 0.10 0.08 0.09 5.1 5.5 5.4 5.3RP5974-3-2-8-38-12 0.09 0.09 0.09 0.09 5.1 5.1 5.5 5.2Mean 0.12 0.13 0.13 0.13 5.3 5.3 5.3 5.3CD (0.05)
Main NS NS
Sub NS 0.13Main x Sub NS 0.23Sub x Main NS 0.23
CV% Main 42 0.86Sub 121.42 2.69
*T1=Recommended NPK, T2= Recommended NPK + Lime, T3= Recommended N + double PK
IIRR Annual Progress Report 2017 Vol. 3-Soil Science
5.67
5.6 Monitoring soil quality and crop productivity under emerging rice productionsystems
Depleted soil productivity and reduced ground water level are the main challenges in
present day agriculture. Water availability for agriculture in general for rice, in particular,
will be less in future and hence, we need to explore a new range of water saving
technologies for rice production. Same is the case with labour availability also as a result of
migration of agricultural labourers to other activities. Some of the newly emerging rice
production systems like direct seeded rice (DSR) and aerobic rice (AR) have potential to
perform better under such situations. But, these systems often result in lower yields, which
are attributed to nutritional disorders. Hence, optimum dose and schedule of fertilizer
application is necessary to achieve higher yields while sustaining soil health and productivity.
Keeping this in view, a medium term study was proposed to assess sustainability of evolving
rice production systems like AR, DSR vis-a-vis conventional transplanted system in terms of
productivity of cropping systems, soil quality, carbon sequestration potential and utilization
efficiency of resources and inputs. This trial was initiated during kharif 2015 and continued
during kharif 2017 at four locations (Kanpur, Puducherry, Moncompu and Pusa) with three
main plot treatments and five sub plot treatments. The main plot treatments included three
methods of crop establishment viz., transplanted rice (TPR); direct sown rice under puddled
conditions (DSR) and aerobic rice (AR, non-puddle, direct sown) with zero or minimum
tillage. The sub plot treatments included five different nutrient combinations viz., T1:100%
Recommended Dose of Fertilizer (RDF) of the location (STCR based)+Zn+S; T2:75%
RDF+25% through organics (GM, FYM, PM, VC etc. as in treatment No.3); T3:100%
recommended NPK through locally available organics ©; T4:100% RDF + 50% NPK through
organics ©; T5:2t/ha Vermi compost/ poultry manure +50%RDF with conjunctive use of
inorganic and organic sources of nutrients. The results are presented in Table 5.6.1 to 5.6.6.
The test varieties were NDR-2064 at Kanpur, CO-51 at Puducherry, Uma at Moncompu and
Rajendra Bhagwati at Pusa and the details of crop, soil characteristics of experimental sites
are presented in Table 5.6.1
Grain and Straw Yields
Grain and straw yield data are presented in Table 5.6.2. At Kanpur TPR recorded
significantly higher grain yield (6.3 t/ha) compared to DSR (5.5 t/ha) and AR (5.13 t/ha). At
Puducherry, TPR recorded significantly higher grain yield (5.4 t/ha) compared to DSR (4.65
t/ha) and AR (4.2 t/ha) and at Moncompu, DSR recorded significantly higher grain yield (6.9
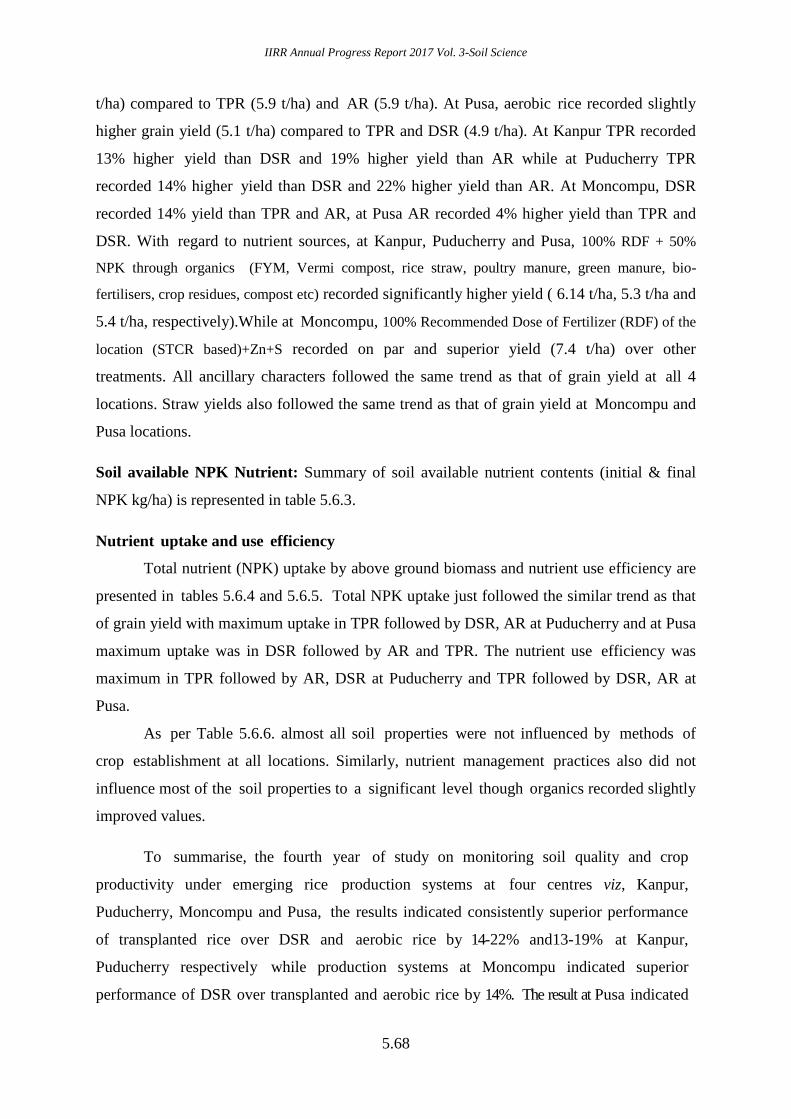
IIRR Annual Progress Report 2017 Vol. 3-Soil Science
5.68
t/ha) compared to TPR (5.9 t/ha) and AR (5.9 t/ha). At Pusa, aerobic rice recorded slightly
higher grain yield (5.1 t/ha) compared to TPR and DSR (4.9 t/ha). At Kanpur TPR recorded
13% higher yield than DSR and 19% higher yield than AR while at Puducherry TPR
recorded 14% higher yield than DSR and 22% higher yield than AR. At Moncompu, DSR
recorded 14% yield than TPR and AR, at Pusa AR recorded 4% higher yield than TPR and
DSR. With regard to nutrient sources, at Kanpur, Puducherry and Pusa, 100% RDF + 50%
NPK through organics (FYM, Vermi compost, rice straw, poultry manure, green manure, bio-
fertilisers, crop residues, compost etc) recorded significantly higher yield ( 6.14 t/ha, 5.3 t/ha and
5.4 t/ha, respectively).While at Moncompu, 100% Recommended Dose of Fertilizer (RDF) of the
location (STCR based)+Zn+S recorded on par and superior yield (7.4 t/ha) over other
treatments. All ancillary characters followed the same trend as that of grain yield at all 4
locations. Straw yields also followed the same trend as that of grain yield at Moncompu and
Pusa locations.
Soil available NPK Nutrient: Summary of soil available nutrient contents (initial & final
NPK kg/ha) is represented in table 5.6.3.
Nutrient uptake and use efficiency
Total nutrient (NPK) uptake by above ground biomass and nutrient use efficiency are
presented in tables 5.6.4 and 5.6.5. Total NPK uptake just followed the similar trend as that
of grain yield with maximum uptake in TPR followed by DSR, AR at Puducherry and at Pusa
maximum uptake was in DSR followed by AR and TPR. The nutrient use efficiency was
maximum in TPR followed by AR, DSR at Puducherry and TPR followed by DSR, AR at
Pusa.
As per Table 5.6.6. almost all soil properties were not influenced by methods of
crop establishment at all locations. Similarly, nutrient management practices also did not
influence most of the soil properties to a significant level though organics recorded slightly
improved values.
To summarise, the fourth year of study on monitoring soil quality and crop
productivity under emerging rice production systems at four centres viz, Kanpur,
Puducherry, Moncompu and Pusa, the results indicated consistently superior performance
of transplanted rice over DSR and aerobic rice by 14-22% and13-19% at Kanpur,
Puducherry respectively while production systems at Moncompu indicated superior
performance of DSR over transplanted and aerobic rice by 14%. The result at Pusa indicated

IIRR Annual Progress Report 2017 Vol. 3-Soil Science
5.69
slightly superior performance of AR over DSR and transplanted rice. In case of nutrient
management practices, maximum yields were obtained with RDF+50% NPK through
organics sources recorded significantly higher yield (6.14, 5.3 and 5.4 t/ha) Kanpur,
Puducherry and Pusa respectively, while, 100% recommended dose of fertilizer (RDF) of the
location (STCR based)+Zn+S on par and superior at Moncompu. Maximum nutrient uptake
efficiency was also higher in transplanted rice followed by DSR and soil available
nutrients were high in the plots that received organic manures either alone or in
combination with chemical fertilizers.
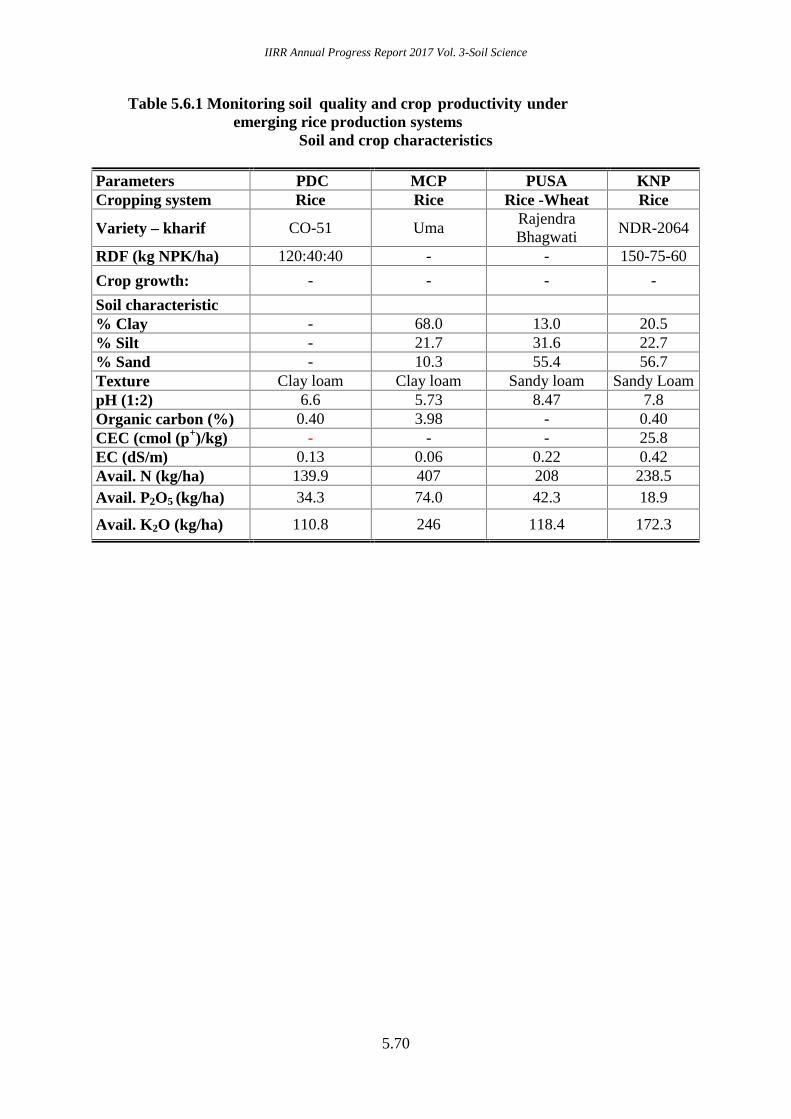
IIRR Annual Progress Report 2017 Vol. 3-Soil Science
5.70
Table 5.6.1 Monitoring soil quality and crop productivity underemerging rice production systems
Soil and crop characteristics
Parameters PDC MCP PUSA KNPCropping system Rice Rice Rice -Wheat Rice
Variety – kharif CO-51 UmaRajendraBhagwati
NDR-2064
RDF (kg NPK/ha) 120:40:40 - - 150-75-60
Crop growth: - - - -
Soil characteristic% Clay - 68.0 13.0 20.5% Silt - 21.7 31.6 22.7% Sand - 10.3 55.4 56.7Texture Clay loam Clay loam Sandy loam Sandy LoampH (1:2) 6.6 5.73 8.47 7.8Organic carbon (%) 0.40 3.98 - 0.40CEC (cmol (p+)/kg) - - - 25.8EC (dS/m) 0.13 0.06 0.22 0.42Avail. N (kg/ha) 139.9 407 208 238.5Avail. P2O5 (kg/ha) 34.3 74.0 42.3 18.9
Avail. K2O (kg/ha) 110.8 246 118.4 172.3
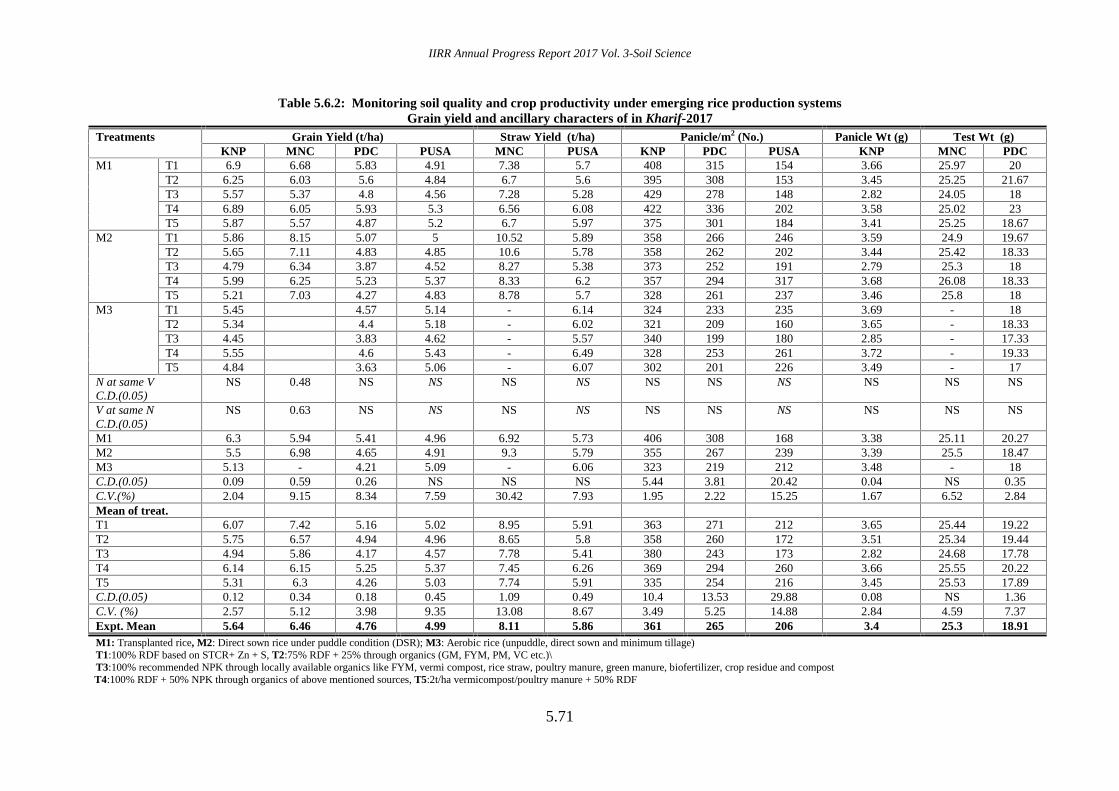
IIRR Annual Progress Report 2017 Vol. 3-Soil Science
5.71
Table 5.6.2: Monitoring soil quality and crop productivity under emerging rice production systemsGrain yield and ancillary characters of in Kharif-2017
Treatments Grain Yield (t/ha) Straw Yield (t/ha) Panicle/m2 (No.) Panicle Wt (g) Test Wt (g)KNP MNC PDC PUSA MNC PUSA KNP PDC PUSA KNP MNC PDC
M1 T1 6.9 6.68 5.83 4.91 7.38 5.7 408 315 154 3.66 25.97 20T2 6.25 6.03 5.6 4.84 6.7 5.6 395 308 153 3.45 25.25 21.67T3 5.57 5.37 4.8 4.56 7.28 5.28 429 278 148 2.82 24.05 18T4 6.89 6.05 5.93 5.3 6.56 6.08 422 336 202 3.58 25.02 23T5 5.87 5.57 4.87 5.2 6.7 5.97 375 301 184 3.41 25.25 18.67
M2 T1 5.86 8.15 5.07 5 10.52 5.89 358 266 246 3.59 24.9 19.67T2 5.65 7.11 4.83 4.85 10.6 5.78 358 262 202 3.44 25.42 18.33T3 4.79 6.34 3.87 4.52 8.27 5.38 373 252 191 2.79 25.3 18T4 5.99 6.25 5.23 5.37 8.33 6.2 357 294 317 3.68 26.08 18.33T5 5.21 7.03 4.27 4.83 8.78 5.7 328 261 237 3.46 25.8 18
M3 T1 5.45 4.57 5.14 - 6.14 324 233 235 3.69 - 18T2 5.34 4.4 5.18 - 6.02 321 209 160 3.65 - 18.33T3 4.45 3.83 4.62 - 5.57 340 199 180 2.85 - 17.33T4 5.55 4.6 5.43 - 6.49 328 253 261 3.72 - 19.33T5 4.84 3.63 5.06 - 6.07 302 201 226 3.49 - 17
N at same VC.D.(0.05)
NS 0.48 NS NS NS NS NS NS NS NS NS NS
V at same NC.D.(0.05)
NS 0.63 NS NS NS NS NS NS NS NS NS NS
M1 6.3 5.94 5.41 4.96 6.92 5.73 406 308 168 3.38 25.11 20.27M2 5.5 6.98 4.65 4.91 9.3 5.79 355 267 239 3.39 25.5 18.47M3 5.13 - 4.21 5.09 - 6.06 323 219 212 3.48 - 18C.D.(0.05) 0.09 0.59 0.26 NS NS NS 5.44 3.81 20.42 0.04 NS 0.35C.V.(%) 2.04 9.15 8.34 7.59 30.42 7.93 1.95 2.22 15.25 1.67 6.52 2.84Mean of treat.T1 6.07 7.42 5.16 5.02 8.95 5.91 363 271 212 3.65 25.44 19.22T2 5.75 6.57 4.94 4.96 8.65 5.8 358 260 172 3.51 25.34 19.44T3 4.94 5.86 4.17 4.57 7.78 5.41 380 243 173 2.82 24.68 17.78T4 6.14 6.15 5.25 5.37 7.45 6.26 369 294 260 3.66 25.55 20.22T5 5.31 6.3 4.26 5.03 7.74 5.91 335 254 216 3.45 25.53 17.89C.D.(0.05) 0.12 0.34 0.18 0.45 1.09 0.49 10.4 13.53 29.88 0.08 NS 1.36C.V. (%) 2.57 5.12 3.98 9.35 13.08 8.67 3.49 5.25 14.88 2.84 4.59 7.37Expt. Mean 5.64 6.46 4.76 4.99 8.11 5.86 361 265 206 3.4 25.3 18.91M1: Transplanted rice, M2: Direct sown rice under puddle condition (DSR); M3: Aerobic rice (unpuddle, direct sown and minimum tillage)T1:100% RDF based on STCR+ Zn + S, T2:75% RDF + 25% through organics (GM, FYM, PM, VC etc.)\T3:100% recommended NPK through locally available organics like FYM, vermi compost, rice straw, poultry manure, green manure, biofertilizer, crop residue and compostT4:100% RDF + 50% NPK through organics of above mentioned sources, T5:2t/ha vermicompost/poultry manure + 50% RDF

IIRR Annual Progress Report 2017 Vol. 3-Soil Science
5.72
Table 5.6.3: Monitoring soil quality and crop productivity under emerging rice production systemsSoil available NPK (kg/ha) in kharif-2017
M1: Transplanted rice, M2: Direct sown rice under puddle condition (DSR); M3: Aerobic rice (unpuddle, direct sown and minimum tillage)T1:100% RDF based on STCR+ Zn + S T2:75% RDF + 25% through organics (GM, FYM, PM, VC etc.)T3:100% recommended NPK through locally available organics like FYM, vermin compost, rice straw, poultry manure, green manure, biofertilizer, crop residue and compost etc.T4:100% RDF + 50% NPK through organics of above mentioned sources T5:2t/ha vermicompost/poultry manure + 50% RDF
TreatmentsKNP PDC PUSA
N P2O5 K2O Initial N Initial P Initial K Final N Final P Final K N P K
M1
T1 230.9 31.0 202.6 190.4 52.8 134.0 130.7 30.5 89.7 207.0 45.0 120.3T2 214.0 29.7 202.9 190.4 52.8 134.0 134.4 35.3 104.7 216.6 41.9 123.3T3 216.9 36.0 219.0 190.4 52.8 134.0 145.6 28.4 124.0 197.0 24.9 109.0T4 212.8 29.7 196.3 190.4 52.8 134.0 138.1 31.8 102.3 219.5 55.5 128.3T5 217.7 33.1 208.2 190.4 52.8 134.0 130.7 29.8 99.3 202.9 46.7 114.7
M2
T1 220.3 29.5 203.0 190.4 52.8 134.0 130.7 33.0 102.7 211.7 38.7 111.7T2 205.3 31.9 220.1 190.4 52.8 134.0 130.7 35.0 84.7 213.0 41.8 120.7T3 207.1 30.2 197.3 190.4 52.8 134.0 145.6 29.6 128.3 209.3 32.8 118.0T4 205.0 31.0 197.3 190.4 52.8 134.0 153.1 37.4 106.7 215.6 58.9 127.7T5 209.9 34.3 211.3 190.4 52.8 134.0 138.1 31.8 112.0 209.2 42.4 111.3
M3
T1 213.2 28.6 203.6 190.4 52.8 134.0 145.6 45.1 113.7 202.4 45.1 119.0T2 198.2 32.1 220.2 190.4 52.8 134.0 153.1 41.3 112.0 198.7 36.3 115.3T3 202.2 36.6 198.7 190.4 52.8 134.0 153.1 41.4 135.0 205.9 28.5 110.7T4 194.8 27.5 198.3 190.4 52.8 134.0 138.1 33.5 118.7 205.9 53.0 126.7T5 202.0 32.3 212.0 190.4 52.8 134.0 130.7 30.8 129.0 206.4 43.3 119.7
N at same V C.D.(0.05) NS 1.2 1.6 - - - - - - NS NS NSV at same N C.D.(0.05) NS 1.2 1.5 - - - - - - NS NS NS
M1 218.5 31.9 205.8 190.4 52.8 134.0 135.9 31.1 104.0 208.6 42.8 119.1M2 209.5 31.4 205.8 190.4 52.8 134.0 139.6 33.3 106.9 211.8 42.9 117.9M3 202.0 31.4 206.5 190.4 52.8 134.0 144.1 38.4 121.7 203.8 41.3 118.3
C.D.(0.05) 0.8 NS 0.3 - - - - - - 1.22 NS NSC.V.(%) 0.5 3.0 0.2 - - - - - - 0.90 8.08 9.28
Mean of treatments :T1 221.5 29.7 203.1 190.4 52.8 134.0 135.6 36.2 102.0 207.0 42.9 117.0T2 205.8 31.2 214.4 190.4 52.8 134.0 139.4 37.2 100.4 209.4 40.0 119.8T3 208.7 34.3 205.0 190.4 52.8 134.0 148.1 33.1 129.1 204.1 28.7 112.6T4 204.2 29.4 197.3 190.4 52.8 134.0 143.1 34.2 109.2 213.6 55.8 127.6T5 209.9 33.2 210.5 190.4 52.8 134.0 133.2 30.8 113.4 206.2 44.1 115.2
C.D.(0.05) 1.1 0.7 0.9 - - - - - - NS 4.51 5.53C.V. (%) 0.6 2.7 0.6 - - - - - - 3.37 10.96 4.80
Expt. Mean 210.0 31.6 206.0 190.4 52.8 134.0 139.9 34.3 110.8 208.1 42.3 118.4

IIRR Annual Progress Report 2017 Vol. 3-Soil Science
5.73
Table: 5.6.4: Monitoring soil quality and crop productivity under emerging rice production systemsTotal NPK (Kg/ha) and Zn (ppm) uptake
TreatmentsKNP PDC PUSA
N P K Zn N P K N P K
M1
T1 171.1 40.9 161.6 43.4 149.0 33.9 113.7 78.6 30.0 100.8T2 152.0 35.9 145.5 41.7 142.3 35.4 166.7 76.7 30.7 108.1T3 131.4 31.0 125.4 40.9 124.6 32.3 152.3 71.3 29.5 96.9T4 172.3 41.2 164.5 42.2 146.3 38.9 188.2 90.0 35.8 123.3T5 141.5 33.4 135.5 40.9 126.1 31.1 145.9 83.1 33.5 111.0
M2
T1 140.0 34.5 139.5 42.5 139.4 31.7 148.7 90.8 30.9 106.7T2 133.0 32.0 131.1 41.0 136.1 31.2 176.4 87.9 32.1 109.5T3 107.0 26.2 107.5 39.6 109.6 25.3 148.3 76.1 27.9 95.1T4 142.5 35.3 142.4 41.6 143.9 31.9 170.0 99.1 36.9 123.9T5 119.6 29.2 119.5 40.2 105.3 27.4 126.1 87.5 32.3 105.6
M3
T1 132.4 31.7 128.3 41.8 121.9 25.7 118.6 90.6 33.9 113.6T2 126.4 29.9 123.6 88.0 121.9 27.6 122.3 87.0 34.3 113.8T3 100.0 24.1 99.9 39.0 100.9 22.4 118.9 74.9 30.7 105.8T4 134.3 32.2 132.3 40.9 132.2 27.7 153.5 99.0 38.5 133.5T5 111.8 26.6 110.6 39.6 97.3 22.9 121.8 87.3 35.1 109.2
N at same V (C.D. 0.05) 4.17 1.09 3.82 NS NS NS NS NS NS NSV at same N (C.D. 0.05) 3.95 1.04 3.59 NS NS NS NS NS NS NS
M1 153.7 36.5 146.5 41.8 137.6 34.3 153.4 79.9 31.9 108.0M2 128.4 31.5 128.0 41.0 126.8 29.5 153.9 88.3 32.0 108.2M3 121.0 28.9 118.9 49.9 114.8 25.3 127.0 87.8 34.5 115.2
C.D.(0.05) 1.66 0.47 1.41 NS NS NS NS 2.3 NS NSC.V.(%) 1.60 1.89 1.39 55.45 NS NS NS 4.16 7.79 17.16
Mean of Treatments
T1 147.9 35.7 143.1 42.5 136.7 30.4 127.0 86.7 31.6 107.0T2 137.1 32.6 133.4 56.9 133.4 31.4 155.2 83.9 32.4 110.5T3 112.8 27.1 111.0 39.8 111.7 26.6 139.8 74.1 29.3 99.3T4 149.7 36.2 146.4 41.6 140.8 32.8 170.5 96.0 37.1 126.9T5 124.3 29.7 121.9 40.3 109.6 27.1 131.3 86.0 33.6 108.6
C.D.(0.05) 2.41 0.63 2.21 NS NS NS NS 8.44 2.97 11.05C.V. (%) 2.17 2.35 2.04 55.47 NS NS NS 10.17 9.32 10.28
Expt. Mean 134.4 32.3 131.1 44.2 126.4 29.7 144.8 85.3 32.8 110.5M1: Transplanted rice, M2: Direct sown rice under puddle condition (DSR); M3: Aerobic rice (unpuddle, direct sown and minimum tillage)T1:100% RDF based on STCR+ Zn + S, T2:75% RDF + 25% through organics (GM, FYM, PM, VC etc.)T3:100% recommended NPK through locally available organics like FYM, vermicompost, rice straw, poultry manure, green manure, biofertilizer, crop residue and compost etc.T4:100% RDF + 50% NPK through organics of above mentioned sources, T5:2t/ha vermicompost/poultry manure + 50% RDF
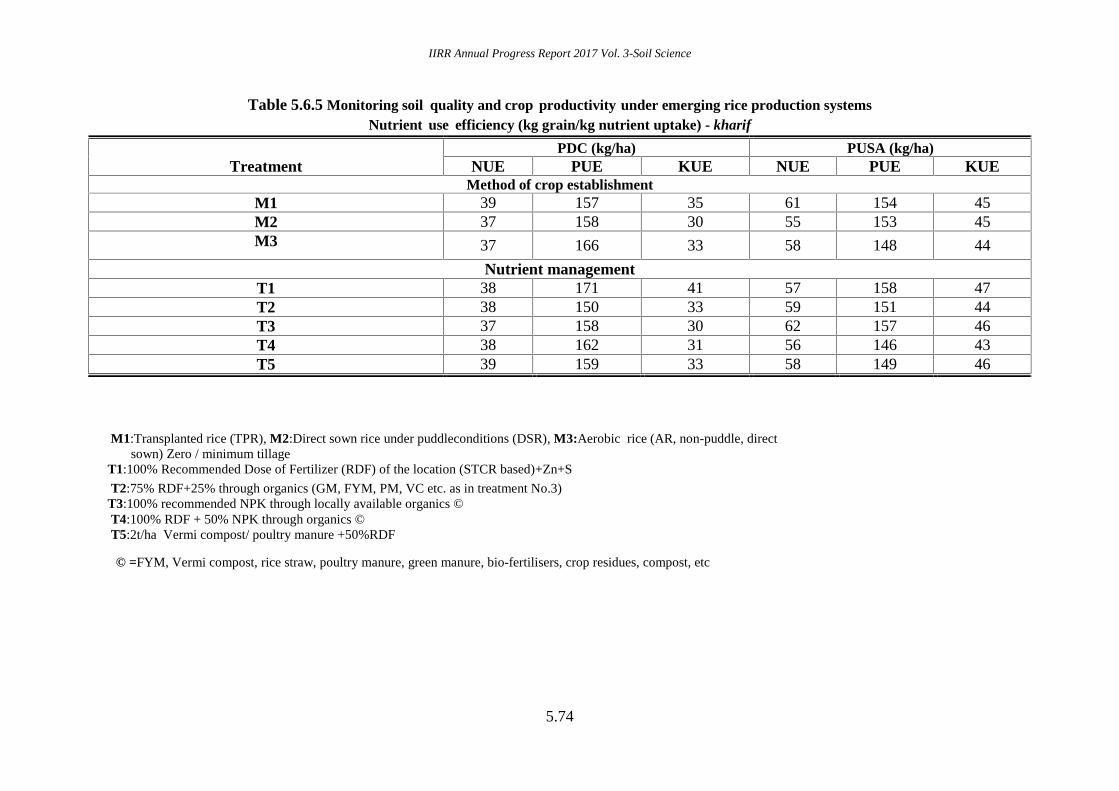
IIRR Annual Progress Report 2017 Vol. 3-Soil Science
5.74
Table 5.6.5 Monitoring soil quality and crop productivity under emerging rice production systemsNutrient use efficiency (kg grain/kg nutrient uptake) - kharif
TreatmentPDC (kg/ha) PUSA (kg/ha)
NUE PUE KUE NUE PUE KUEMethod of crop establishment
M1 39 157 35 61 154 45M2 37 158 30 55 153 45M3 37 166 33 58 148 44
Nutrient managementT1 38 171 41 57 158 47T2 38 150 33 59 151 44T3 37 158 30 62 157 46T4 38 162 31 56 146 43T5 39 159 33 58 149 46
M1:Transplanted rice (TPR), M2:Direct sown rice under puddleconditions (DSR), M3:Aerobic rice (AR, non-puddle, directsown) Zero / minimum tillage
T1:100% Recommended Dose of Fertilizer (RDF) of the location (STCR based)+Zn+S
T2:75% RDF+25% through organics (GM, FYM, PM, VC etc. as in treatment No.3)T3:100% recommended NPK through locally available organics ©T4:100% RDF + 50% NPK through organics ©T5:2t/ha Vermi compost/ poultry manure +50%RDF
© =FYM, Vermi compost, rice straw, poultry manure, green manure, bio-fertilisers, crop residues, compost, etc

IIRR Annual Progress Report 2017 Vol. 3-Soil Science
5.75
Table: 5.6.6: Monitoring soil quality and crop productivity under emerging rice production systems: Soil pH, E.C and organic carbon (Kg/ha)
TreatmentKNP PUSA PDC
pH O.C % pH E.C O.C % pH E.C
M1
T1 7.70 4.08 8.42 0.21 0.61 6.29 0.14T2 7.54 5.59 8.57 0.2 0.63 6.12 0.12T3 7.40 10.13 8.37 0.21 0.73 5.91 0.19T4 7.46 7.05 8.6 0.19 0.66 6.19 0.12T5 7.51 6.20 8.3 0.2 0.7 6.27 0.13
M2
T1 7.70 3.99 8.76 0.2 0.65 5.94 0.11T2 7.55 5.49 8.74 0.23 0.61 5.90 0.14T3 7.39 9.98 8.33 0.21 0.63 5.83 0.11T4 7.48 6.93 8.63 0.23 0.63 5.76 0.16T5 7.53 6.12 8.33 0.26 0.7 5.79 0.13
M3
T1 7.71 3.96 8.58 0.22 0.66 5.68 0.13T2 7.57 5.29 8.59 0.21 0.72 5.68 0.12T3 7.39 9.77 8.3 0.21 0.73 5.54 0.12T4 7.45 6.73 8.4 0.22 0.65 5.50 0.15T5 7.51 5.99 8.2 0.24 0.67 5.70 0.12
C.D.(0.05)N at same V NS 0.03 NS NS NS NS NSV at same N NS 0.03 NS NS NS NS NS
M1 7.52 6.61 8.45 0.20 0.67 6.16 0.14M2 7.53 6.50 8.56 0.23 0.64 5.84 0.13M3 7.53 6.35 8.41 0.22 0.69 5.62 0.13
C.D.(0.05) NS 0.02 NS 0.01 0.02 0.13 NSC.V.(%) 0.16 0.35 1.61 5.44 4.02 3.33 28.19
Mean of treatment:T1 7.70 4.01 8.59 0.21 0.64 5.97 0.13T2 7.55 5.46 8.63 0.21 0.65 5.90 0.13T3 7.39 9.96 8.33 0.21 0.70 5.76 0.14T4 7.46 6.90 8.54 0.21 0.65 5.82 0.14T5 7.52 6.10 8.28 0.23 0.69 5.92 0.13
C.D.(0.05) 0.01 0.02 0.17 NS 0.04 0.18 NSC.V. (%) 0.21 0.37 2.03 13.68 6.22 3.12 22.17
Expt. Mean 7.53 6.49 8.47 0.22 0.67 5.87 0.13M1: Transplanted rice, M2: Direct sown rice under puddle condition (DSR); M3: Aerobic rice (unpuddle, direct sown and minimum tillage)T1:100% RDF based on STCR+ Zn + S, T2:75% RDF + 25% through organics (GM, FYM, PM, VC etc.)T3:100% recommended NPK through locally available organics like FYM, vermicompost, rice straw, poultry manure, green manure, biofertilizer, crop residue and compostT4:100% RDF + 50% NPK through organics of above mentioned sources, T5:2 t/ha vermicompost /poultry manure + 50% RDF
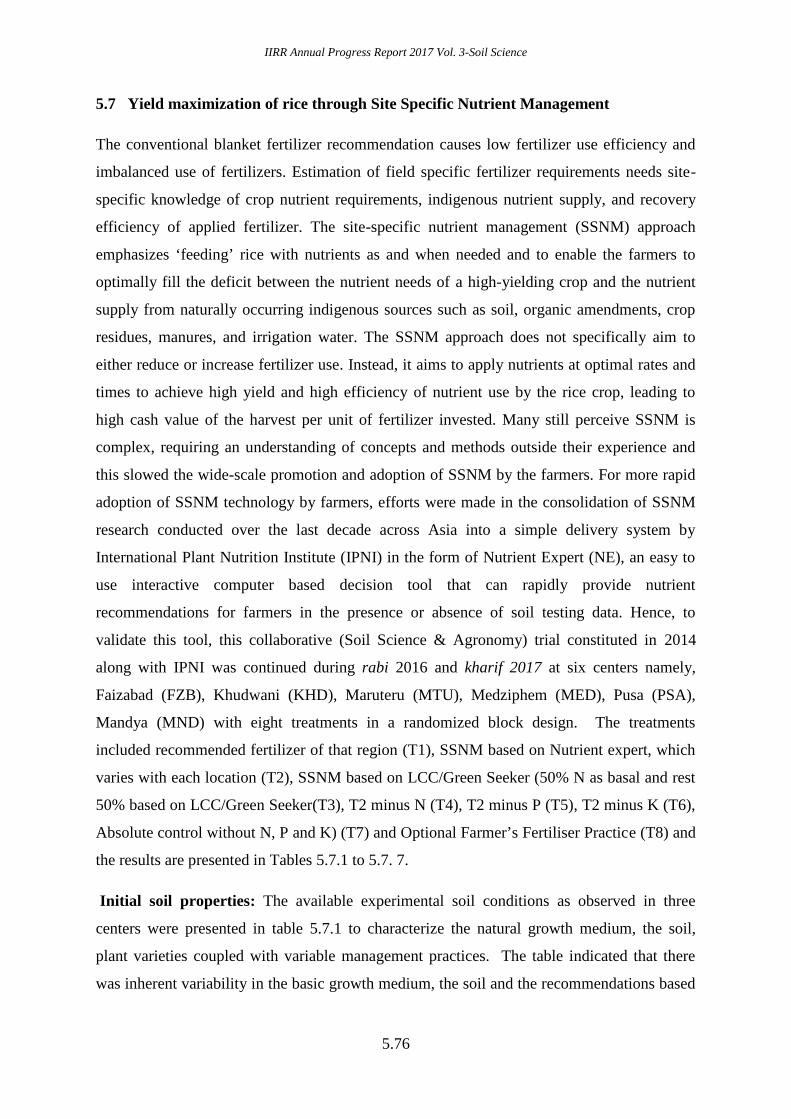
IIRR Annual Progress Report 2017 Vol. 3-Soil Science
5.76
5.7 Yield maximization of rice through Site Specific Nutrient Management
The conventional blanket fertilizer recommendation causes low fertilizer use efficiency and
imbalanced use of fertilizers. Estimation of field specific fertilizer requirements needs site-
specific knowledge of crop nutrient requirements, indigenous nutrient supply, and recovery
efficiency of applied fertilizer. The site-specific nutrient management (SSNM) approach
emphasizes ‘feeding’ rice with nutrients as and when needed and to enable the farmers to
optimally fill the deficit between the nutrient needs of a high-yielding crop and the nutrient
supply from naturally occurring indigenous sources such as soil, organic amendments, crop
residues, manures, and irrigation water. The SSNM approach does not specifically aim to
either reduce or increase fertilizer use. Instead, it aims to apply nutrients at optimal rates and
times to achieve high yield and high efficiency of nutrient use by the rice crop, leading to
high cash value of the harvest per unit of fertilizer invested. Many still perceive SSNM is
complex, requiring an understanding of concepts and methods outside their experience and
this slowed the wide-scale promotion and adoption of SSNM by the farmers. For more rapid
adoption of SSNM technology by farmers, efforts were made in the consolidation of SSNM
research conducted over the last decade across Asia into a simple delivery system by
International Plant Nutrition Institute (IPNI) in the form of Nutrient Expert (NE), an easy to
use interactive computer based decision tool that can rapidly provide nutrient
recommendations for farmers in the presence or absence of soil testing data. Hence, to
validate this tool, this collaborative (Soil Science & Agronomy) trial constituted in 2014
along with IPNI was continued during rabi 2016 and kharif 2017 at six centers namely,
Faizabad (FZB), Khudwani (KHD), Maruteru (MTU), Medziphem (MED), Pusa (PSA),
Mandya (MND) with eight treatments in a randomized block design. The treatments
included recommended fertilizer of that region (T1), SSNM based on Nutrient expert, which
varies with each location (T2), SSNM based on LCC/Green Seeker (50% N as basal and rest
50% based on LCC/Green Seeker(T3), T2 minus N (T4), T2 minus P (T5), T2 minus K (T6),
Absolute control without N, P and K) (T7) and Optional Farmer’s Fertiliser Practice (T8) and
the results are presented in Tables 5.7.1 to 5.7. 7.
Initial soil properties: The available experimental soil conditions as observed in three
centers were presented in table 5.7.1 to characterize the natural growth medium, the soil,
plant varieties coupled with variable management practices. The table indicated that there
was inherent variability in the basic growth medium, the soil and the recommendations based
IIRR Annual Progress Report 2017 Vol. 3-Soil Science
5.77
on this variability to realize the best from the performing crop plants. The message is that the
plant response needed to be studied in relation to the supply potentials of the soils.
Grain yield and straw yield
Mean grain yields ranged from 1936 kg ha-1 (MTU) to 7601 kg ha-1 (MND) among the
reported locations (Table 5.7.2). The documented results showed that four out of six test sites
registered the highest rice grain yield in T2 (SSNM based on Nutrient Expert) that ranged
from 3549 to 7601 kg ha-1.
Straw yield
There were differential responses to different treatments in terms of straw yield (Table 5.7.3).
For example, T1 registered the highest straw yield in three test locations (KHD, MED and
MTU) (4.7 to 6.8 tons ha-1) while three sites showed the highest response in T2 (SSNM with
NE based recommendations) with straw yield ranging from 4.5 to 8.3 tons ha-1 (rounded off
values). In one location only T3 (SSNM with LCC based recommendations) showed the
highest performance with 8.6 tons ha-1) in Mandya. Out of all, five sites registered the lowest
starw yield in T7. Overall, SSNM, with both NE and LCC based recommendations, proved to
a better option to realize the best possible as it provided for the balanced and probably higher
fertilizer inputs as seen in some instances. For want of some more information from some
centers, it is a bit difficult to reason the differential behavior.
Yield components
Yield components were presented in Tables 5.7.4, 5.7.5 and 5.7.6. Tiller number ranged from
134 - 634/m2 and panicle number ranged from 135 – 543/m2. In general, majority of tillers
/m2 were found in T2 where balanced nutrition was provided. Similarly, the higher panicle
number was also seen in T2 for similar reasons. With reference to 1000 grain weight, another
yield component, T2 recorded the highest weight in all four test sites reported in the table. It
was imperative that balanced nutrition, which contributes to precision agriculture to realize
higher numbers in yield components that helped realizing the best yield in return.
Nutrients Uptake: Total N P K uptake from six centers is presented in Table 5.7.7. In case
of total nitrogen, phosphorus and potassium uptake, majority of test sites recorded the highest
in T2 and or T3 where there were decisions based on the measured parameters thus resulting in
balanced fertilization of crop plants. However, there were instances of realizing the better
results in T1, which also was based on recommendations depending on the soil supply
IIRR Annual Progress Report 2017 Vol. 3-Soil Science
5.78
capacities. It was imperative from the results that fertilizer application based on soil supply
potentials coupled with plant requirements always yielded better results.
Soil available nutrients:
Soil available nutrients status after harvest is presented in Table 5.7.8. It was seen in several
instances that the available soil nitrogen was low in absolute control where nothing was
applied. Mean available N ranged from 113 (MTU) to 239 (MND) kg ha-1; P2O5 from 18
(MND) to 81 (MTU) kg ha-1; K2O from 117 (MND) to 311 (MTU) kg ha-1.
Summary:
The idea of better crop based soil management could be fulfilled with site specific nutrient
management resulting out of decision rules like that of Nutrient Expert or regional
recommended fertiliser schedules, which emanated from the specific studies or vegetation
health that is reflected by leaf colour were certainly better than other treatments. This finally
indicated that site specific nutrient management certainly helped in realizing the best from the
balanced nutrient management thereby reducing the costs by avoiding the excess fertilization
besides keeping the soil in healthy conditions by replenishing the removed nutrients by the
crops.

IIRR Annual Progress Report 2017 Vol. 3-Soil Science
5.79
Table 5.7.1: Yield maximization of rice through site specific Nutrient Management (kharif 2017): Soil and crop characteristics
Faizabad Mandya Marteru PusaVariety Sarjoo-52 IR-64 MTU-1061 RAU 1476-4-1
Kharif -RDF120:60:60:25
(NP2O5K2OZnSO4)100:50:50:20
(NP2O5K2OZnSO4)90:60:60
(NP2O5K2O)120:60:40:25
(NP2O5K2OZnSO4)
Nutrient Expert Dose141:51:69
(NP2O5K2O)132:42:67
(NP2O5K2O)118-27-45
(NP2O5K2O)132:27:62:25
(NP2O5K2OZnSO4)
FFP -107 : 39 : 114(NP2O5K2O)
110-72-40(NP2O5K2O)
80:40:35:25(NP2O5K2OZnSO4)
Crop growth: Kharif Good Excellent - -% Clay 23 38.62 38 25% Silt 21 34.23 28 32% Sand 56 27.15 34 52.5Texture Sandy loam Clay loam Clay loam Sandy loampH (1:2) 7.5 8.192 6.09 8.5Organic carbon (%) 0.42 0.47 1.05 0.61CEC (cmol (p+)/kg) 13.7 29.3 48.6 -EC (dS/m) 1.02 0.382 0.57 -Avail. N (kg/ha) 212 194.5 157 195.1Avail. P2O5 (kg/ha) 23 24.8 48 31.2Avail. K2O (kg/ha) 231 176.8 249 202.8DTPA – Zn (mg/kg) - - - 0.41

IIRR Annual Progress Report 2017 Vol. 3-Soil Science
5.80
Table 5.7.2: Yield maximization of rice through site specific Nutrient Management (kharif 2017)Grain yield of rice (kg ha-1)
Treatment Faizabad Khudwani Medziphema Mandya Pusa Maruteru Rajendranagar
T1: Recommended fertilizerrecommendation of that region
5079 3865 5088 6658 4917 4377 2243
T2: SSNM based on Nutrient Expert(Varies for each location)
6357 3549 5614 7601 5321 4139 2688
T3: SSNM based on LCC/ GreenSeeker (50% N as basal and rest50% based on LCC/ GreenSeeker). (The Dose of nutrientbased on the Nutrient Expert)
5511 3393 5351 7403 4874 3595 2380
T4: T2 minus N 3696 2658 3879 4131 4211 2593 1965
T5: T2 minus P 4407 2890 4397 4971 4712 3407 2226
T6: T2 minus K 4858 3218 4362 5974 4764 3463 2512
T7: Absolute control ( Without N:P: K)
3152 2010 3723 3318 3814 1936 1238
T8: Optional (FFP) - 3461 2252 6644 4659 3229 -
Exp. mean 4723 3131 4333 5837 4659 3342 2179
LSD (0.05) 387 320 1698 564 225 645 270
CV (%) 4.6 5.8 22.4 5.5 2.8 11 6.95
IIRR Annual Progress Report 2017 Vol. 3-Soil Science
5.81
Table 5.7.3: Yield maximization of rice through site specific Nutrient Management (kharif 2017) –Straw yield of rice (kg ha-1)
Treatment Faizabad Khudwani Medziphema Mandya Pusa Maruteru Rajendranagar
T1: Recommended fertilizer recommendation of thatregion
7332 4717 6761 8058 6240 5917 4168
T2: SSNM based on Nutrient Expert (Varies foreach location)
8343 4474 7502 9043 6518 4656 4638
T3: SSNM based on LCC/ Green Seeker (50% N asbasal and rest 50% based on LCC/ GreenSeeker). (The Dose of nutrient based on theNutrient Expert)
7694 3917 8600 8784 6154 4368 4433
T4: T2 minus N 5529 3435 5451 4848 5477 3209 3415
T5: T2 minus P 6581 3815 7139 5794 6071 3986 4540
T6: T2 minus K 5955 3911 7799 7251 5909 4208 4450
T7: Absolute control ( Without N: P: K) 4648 2835 6966 3916 5372 2544 2551
T8: Optional (FFP) 6583 4203 7249 8014 5703 3949
Exp. mean 6583 3913 7183 6964 5931 4105 4028
LSD (0.05) 473 542 1981 623 285 1093 186
CV (%) 4 7.9 15.7 5.1 2.7 15.2 2.6
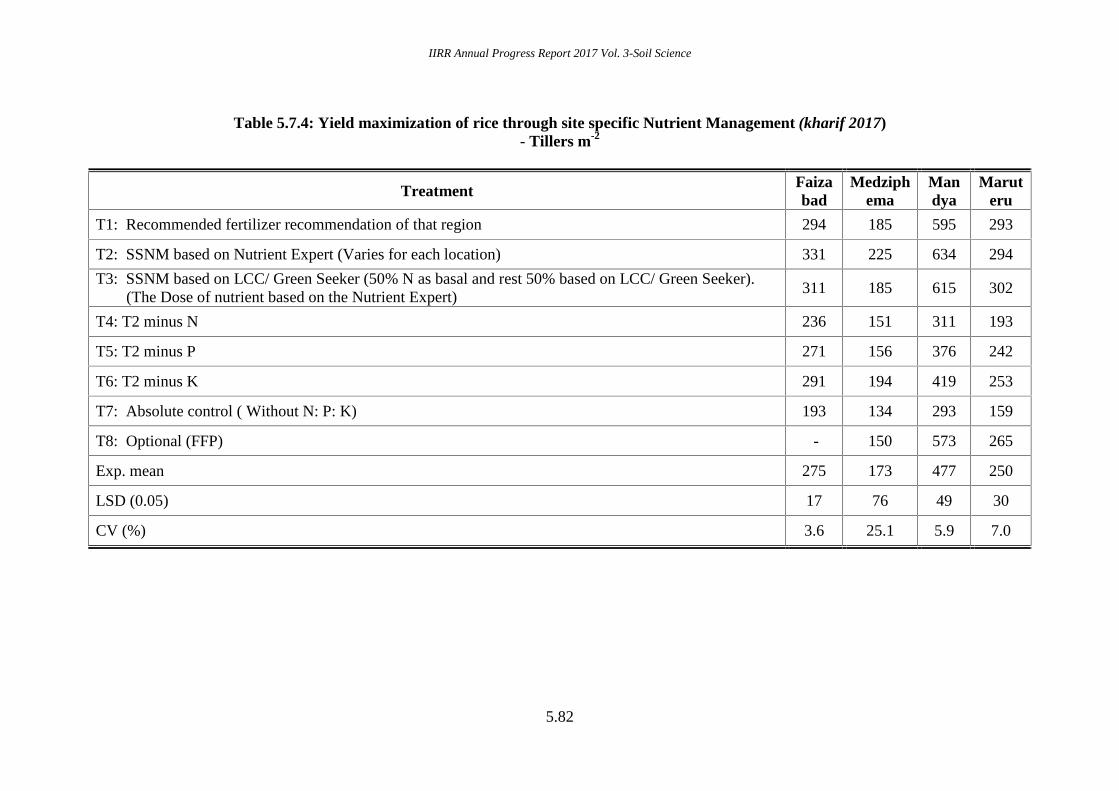
IIRR Annual Progress Report 2017 Vol. 3-Soil Science
5.82
Table 5.7.4: Yield maximization of rice through site specific Nutrient Management (kharif 2017)- Tillers m-2
Treatment Faizabad
Medziphema
Mandya
Maruteru
T1: Recommended fertilizer recommendation of that region 294 185 595 293
T2: SSNM based on Nutrient Expert (Varies for each location) 331 225 634 294
T3: SSNM based on LCC/ Green Seeker (50% N as basal and rest 50% based on LCC/ Green Seeker).(The Dose of nutrient based on the Nutrient Expert)
311 185 615 302
T4: T2 minus N 236 151 311 193
T5: T2 minus P 271 156 376 242
T6: T2 minus K 291 194 419 253
T7: Absolute control ( Without N: P: K) 193 134 293 159
T8: Optional (FFP) - 150 573 265
Exp. mean 275 173 477 250
LSD (0.05) 17 76 49 30
CV (%) 3.6 25.1 5.9 7.0
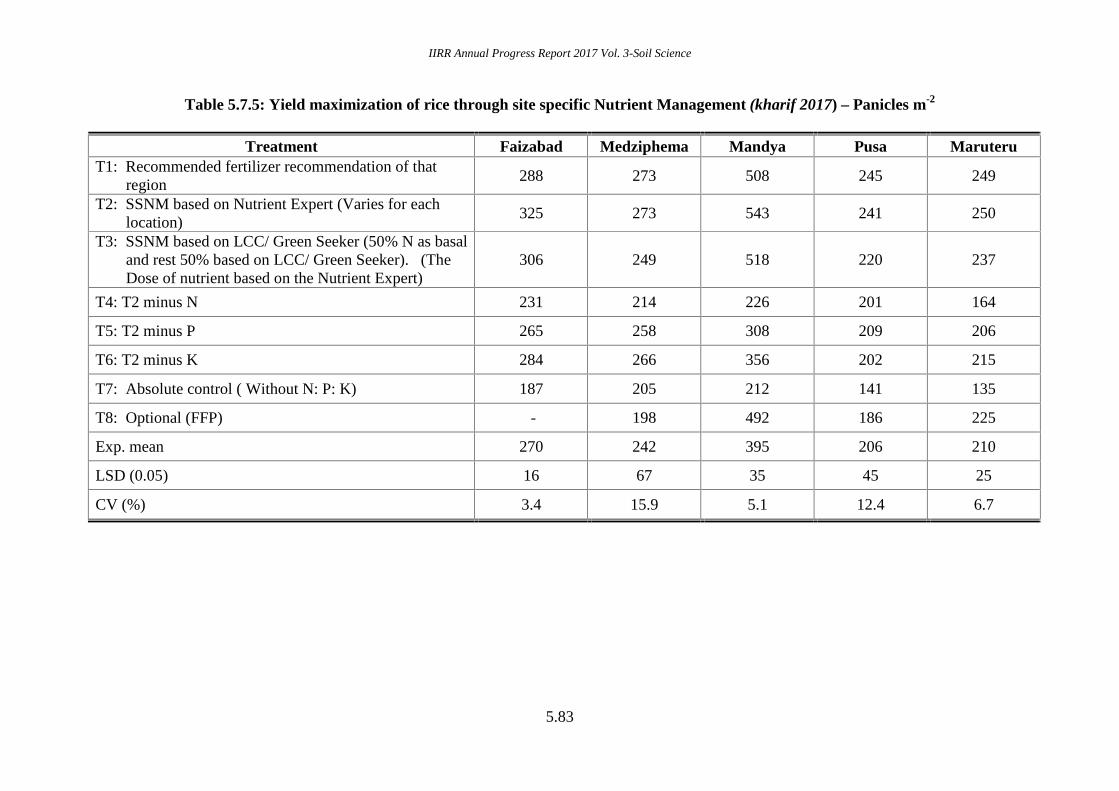
IIRR Annual Progress Report 2017 Vol. 3-Soil Science
5.83
Table 5.7.5: Yield maximization of rice through site specific Nutrient Management (kharif 2017) – Panicles m-2
Treatment Faizabad Medziphema Mandya Pusa MaruteruT1: Recommended fertilizer recommendation of that
region288 273 508 245 249
T2: SSNM based on Nutrient Expert (Varies for eachlocation)
325 273 543 241 250
T3: SSNM based on LCC/ Green Seeker (50% N as basaland rest 50% based on LCC/ Green Seeker). (TheDose of nutrient based on the Nutrient Expert)
306 249 518 220 237
T4: T2 minus N 231 214 226 201 164
T5: T2 minus P 265 258 308 209 206
T6: T2 minus K 284 266 356 202 215
T7: Absolute control ( Without N: P: K) 187 205 212 141 135
T8: Optional (FFP) - 198 492 186 225
Exp. mean 270 242 395 206 210
LSD (0.05) 16 67 35 45 25
CV (%) 3.4 15.9 5.1 12.4 6.7

IIRR Annual Progress Report 2017 Vol. 3-Soil Science
5.84
Table 5.7.6. Yield maximization of rice through site specific Nutrient Management (kharif 2017)- 1000 grain weight (g)
Treatment Faizabad Medziphema Mandya Pusa
T1: Recommended fertilizer recommendation of that region 24 19 26 20
T2: SSNM based on Nutrient Expert (Varies for each location) 25 20 28 20
T3: SSNM based on LCC/ Green Seeker (50% N as basal and rest 50% based on LCC/Green Seeker). (The Dose of nutrient based on the Nutrient Expert)
24 20 27 19
T4: T2 minus N 23 19 23 19
T5: T2 minus P 24 20 24 19
T6: T2 minus K 24 18 26 19
T7: Absolute control ( Without N: P: K) 23 18 23 19
T8: Optional (FFP) 24 19 27 19
Exp. mean 24 19 26 19
LSD (0.05) 0 2 3 1
CV (%) 0.7 7 6.8 1.4
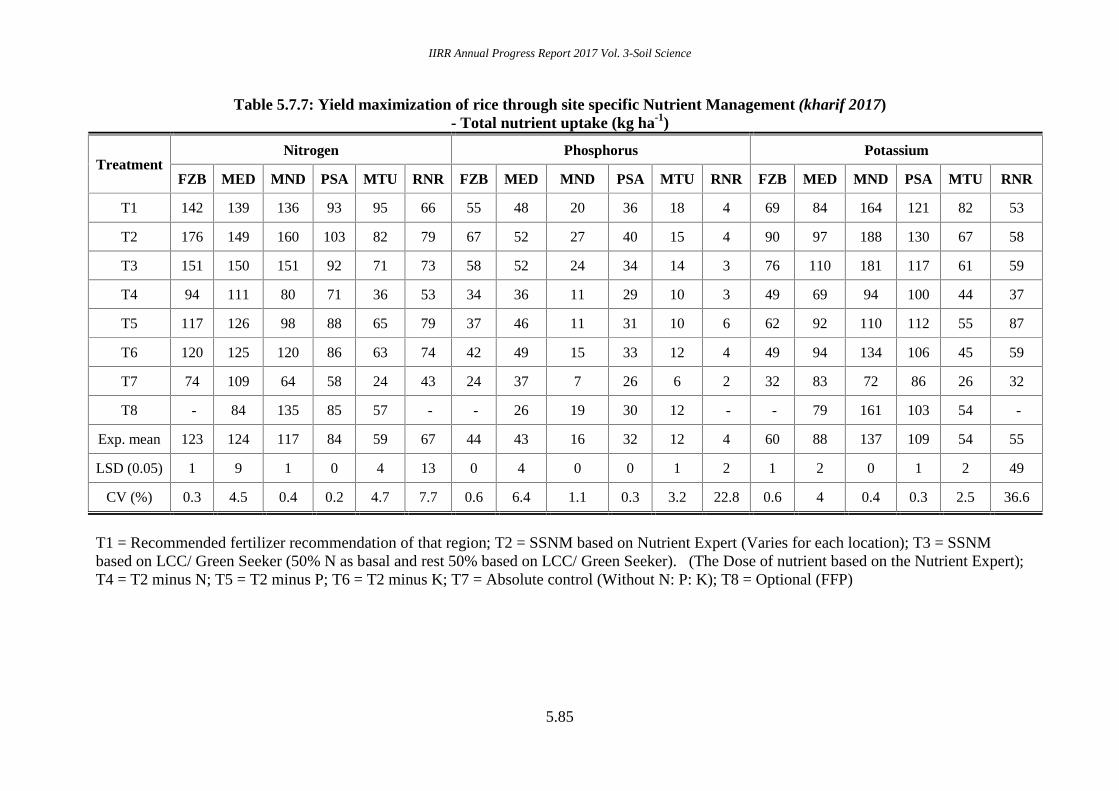
IIRR Annual Progress Report 2017 Vol. 3-Soil Science
5.85
Table 5.7.7: Yield maximization of rice through site specific Nutrient Management (kharif 2017)- Total nutrient uptake (kg ha-1)
TreatmentNitrogen Phosphorus Potassium
FZB MED MND PSA MTU RNR FZB MED MND PSA MTU RNR FZB MED MND PSA MTU RNR
T1 142 139 136 93 95 66 55 48 20 36 18 4 69 84 164 121 82 53
T2 176 149 160 103 82 79 67 52 27 40 15 4 90 97 188 130 67 58
T3 151 150 151 92 71 73 58 52 24 34 14 3 76 110 181 117 61 59
T4 94 111 80 71 36 53 34 36 11 29 10 3 49 69 94 100 44 37
T5 117 126 98 88 65 79 37 46 11 31 10 6 62 92 110 112 55 87
T6 120 125 120 86 63 74 42 49 15 33 12 4 49 94 134 106 45 59
T7 74 109 64 58 24 43 24 37 7 26 6 2 32 83 72 86 26 32
T8 - 84 135 85 57 - - 26 19 30 12 - - 79 161 103 54 -
Exp. mean 123 124 117 84 59 67 44 43 16 32 12 4 60 88 137 109 54 55
LSD (0.05) 1 9 1 0 4 13 0 4 0 0 1 2 1 2 0 1 2 49
CV (%) 0.3 4.5 0.4 0.2 4.7 7.7 0.6 6.4 1.1 0.3 3.2 22.8 0.6 4 0.4 0.3 2.5 36.6
T1 = Recommended fertilizer recommendation of that region; T2 = SSNM based on Nutrient Expert (Varies for each location); T3 = SSNMbased on LCC/ Green Seeker (50% N as basal and rest 50% based on LCC/ Green Seeker). (The Dose of nutrient based on the Nutrient Expert);T4 = T2 minus N; T5 = T2 minus P; T6 = T2 minus K; T7 = Absolute control (Without N: P: K); T8 = Optional (FFP)

IIRR Annual Progress Report 2017 Vol. 3-Soil Science
5.86
Table 5.7.8: Yield maximization of rice through site specific Nutrient Management- Soil fertility status (kg ha-1) at harvest
TreatmentAvailable N Available P2O5 Available K2O
MED MND PSA MTU MED MND PSA MTU MED MND PSA MTU
T1 214 216 214 156 24 38 36 78 199 196 212 290
T2 208 239 225 177 25 35 39 76 200 225 223 311
T3 199 227 214 170 25 38 34 78 194 210 206 275
T4 195 149 200 117 24 33 33 81 196 186 212 275
T5 210 209 210 161 25 21 31 64 200 183 200 285
T6 192 213 204 163 24 23 35 74 195 126 196 264
T7 200 132 191 113 24 18 28 53 197 117 181 244
T8 195 219 214 171 23 35 33 97 192 202 203 259
Exp. mean 202 200 209 153 24 30 34 75 197 181 204 275
CD(0.05) 37 18 10 22 3 6 9 7 10 17 14 64
CV (%) 10.3 5.1 2.7 8.2 7.2 11 15.4 5.2 2.9 5.4 3.8 13.4
T1 = Recommended fertilizer recommendation of that region; T2 = SSNM based on Nutrient Expert (Varies for each location); T3 = SSNMbased on LCC/ Green Seeker (50% N as basal and rest 50% based on LCC/ Green Seeker). (The Dose of nutrient based on the Nutrient Expert);T4 = T2 minus N; T5 = T2 minus P; T6 = T2 minus K; T7 = Absolute control (Without N: P: K); T8 = Optional (FFP)

IIRR Annual Progress Report 2017 Vol. 3-Soil Science
5.87
5.8 Bio - Intensive Pest Management (BIPM) in rice under Organic Farming
This trial was initiated during kharif 2015 in collaboration with Entomologists to
study the influence of organic farming on productivity, grain quality, soil health and Pest
dynamics in rice and also to develop a package of bio-intensive pest management (BIPM)
practices in organic farming. There are two treatments here viz., BIPM block and Farmers
Practice (FP) block. In BIPM block, all organic farming practices involving from seed
treatment, nursery application, nutrient and pest management using organic sources only
were practiced as per the technical programme. Whereas, in FP block, general POP with RDF
and need based application of insecticides were practiced. Each main block was divided into
6 smaller blocks and observations on pest incidence, yield parameters and grain yield were
recorded. Plant nutrient (NPK) uptake was calculated using nutrient concentration and dry
matter yield. Soil samples were collected before conducting experiment and after harvest and
were analysed for important soil properties. The trial was conducted at ten locations viz.,
[Chinsurah (CHN), IIRR (DRR), Jagdalpur (JDP), Karjat (KJT), Ludhiana (LDN), Pattambi
(PTB), Puducherry (PDU), Raipur (RPR), Ranchi (RCI) and Titabar (TTB)] during kharif
2017 and the results are presented in Tables 5.8.1 to 5.8.7.
Grain and straw yields and nutrients uptake
Out of ten locations, grain yield (Table 5.8.2) was significantly superior in BIPM block
compared to FP at five locations (CHN, IIRR, KJT, JDP and TTB) by recording 22-44%
higher grain yield in BIPM over FP. Whereas, both treatments were on par at PDU and LDN
though BIPM recorded higher yield over FP by 13% at PDU and lower yield by just 1% at
LDN. While at RPR, PTB and RCI, farmer’s practice (inorganic fertilizers and pesticides)
was significantly superior to BIPM treatment by 25, 46 and 17%, respectively. The crop in
organic manuring (BIPM) plots has been showing a steady increase in yields in the past three
years at IIRR. At CHN, during boro season also, BIPM recorded significantly higher values
of yield parameters over FP and it reflected in significantly higher grain yield by 13%
(Table 5.8.3). Straw yield followed the similar trend as that of grain yield at all locations.
With regard to nutrient (NPK) uptake, at IIRR, CHN and PDU (Table 5.8.4), BIPM treatment
recorded higher uptake of N, P K while at PTB, uptake was higher in FP plots compared to
BIPM treatment.
IIRR Annual Progress Report 2017 Vol. 3-Soil Science
5.88
Observations on Pest incidence
Bio intensive pest management through bio intensive approaches for managing pests
in organic rice cultivation indicated reduced pest incidence in BIPM plots at Chinsurah,
Titabar, Raipur and Karjat; and the pest incidence was on par at Ludhiana, Ranchi and IIRR
in BIPM and FP. The results also indicated an increase in natural enemy population in the
organic BIPM plots at all locations. The beneficial insects such as spiders and coccinellids
recorded in BIPM plots were significantly higher in numbers as compared to FP plots.
(detailed report is given in Entomology progress report).
Grain Quality characteristics
Important nutritional quality parameters estimated in brown and polished rice are
given in Table 5.8.5 and the data indicated no significant difference in N, P, K, Fe and Zn
contents between BIPM and FP across locations in most of the parameters. Similarly,
physical and cooking quality parameters presented in Table 5.8.6. were also similar in both
BIPM and FP without showing any particular trend in most of the parameters though
marginal increase in some parameters was observed in BIPM treatment.
Soil Properties after harvest
The important soil properties from five locations (CHN, IIRR, PTB, PDU and TTB)
are presented in Table 5.8.7. Almost all soil properties were superior in BIPM treatment at
most of the locations. The organic carbon content ranged from 1.05 – 1.38% in BIPM and
0.72 – 1.25% in FP treatment across locations. The increase was minimum (4 %) at CHN
and maximum (46 %) at IIRR. An improvement in soil available N,P and K was also noticed
at almost all locations in BIPM compared to FP.
Summary
From the third year of study on “Bio-intensive pest management”, it can be
summarized that out of ten locations (CHN, IIRR, JDP, KJT, LDN, PTB, PDU, RPR, RCI
and TTB), BIPM was significantly superior to FP at five locations (CHN, IIRR, KJT, JDP
and TTB); on par to FP at PDU and LDN; and inferior to FP at RPR, PTB and RCI in terms
of grain yield. The observations on pest incidence indicated the beneficial effect of BIPM at
most of the locations. Important physical, cooking and nutritional quality parameters
estimated in grain indicated marginal increase in some of the parameters at most of the
locations in BIPM over FP. Unlike in previous years, in this third year, most of the soil
properties improved with organics in BIPM compared to FP.

IIRR Annual Progress Report 2017 Vol. 3-Soil Science
5.89
Table 5.8.1 Bio-intensive Pest Management (BIPM) in Rice under Organic farmingSoil, Crop and weather data - Kharif 2017
Parameter Chinsurah IIRR Puducherry Titabar Pattambi Chinsurah(Boro)
Kajrat
Croppingsystem
Rice-Rice Rice-Rice Rice-RiceRice-Rice
Rice-Rice
Rice-Rice Rice-Rice
VarietySwarna-
Sub1TN 1 CoR51
KetekiJoha
-Khitish
(IET 4094)Awani
RDF (kgNPK/ha)
60-30-30 100:40:40 120:40:40 - - 120:60:60
Crop growth Satisfactory - Good Good - SatisfactorySoil Characteristics
% clay - - - - - - -% silt - - - - - - -% sand - - - - - - -Soil Texture Clay loam Clay Clay loam Clay Clay loampH (1:1) 7.43 8.1 6.29 5.5 2.58 7.1 6.66Org.carbon(%)
0.89 0.59 0.24 1.5 1.66 0.46 0.98
EC (dS/m) 0.36 0.30 0.14 - 1.171 0.20 0.24Avail.N(kg/ha)
213 201 156.8 347 297 235
Avail. P2O5
(kg/ha)141 85.2 24.6 16 6.14 88 24.6
Avail. K2O(kg/ha)
471 495 139 148 131.4 304 281
WeatherMax. Temp(ºC)
- 32.1 36.76 32.8 - - -
Min. Temp(ºC)
- 11.5 26.36 14.7 - - -
TotalRainfall(mm)
- 843 1584.7 1626 - - -
RH(%) - 74.2 80.94 85.1 - - -
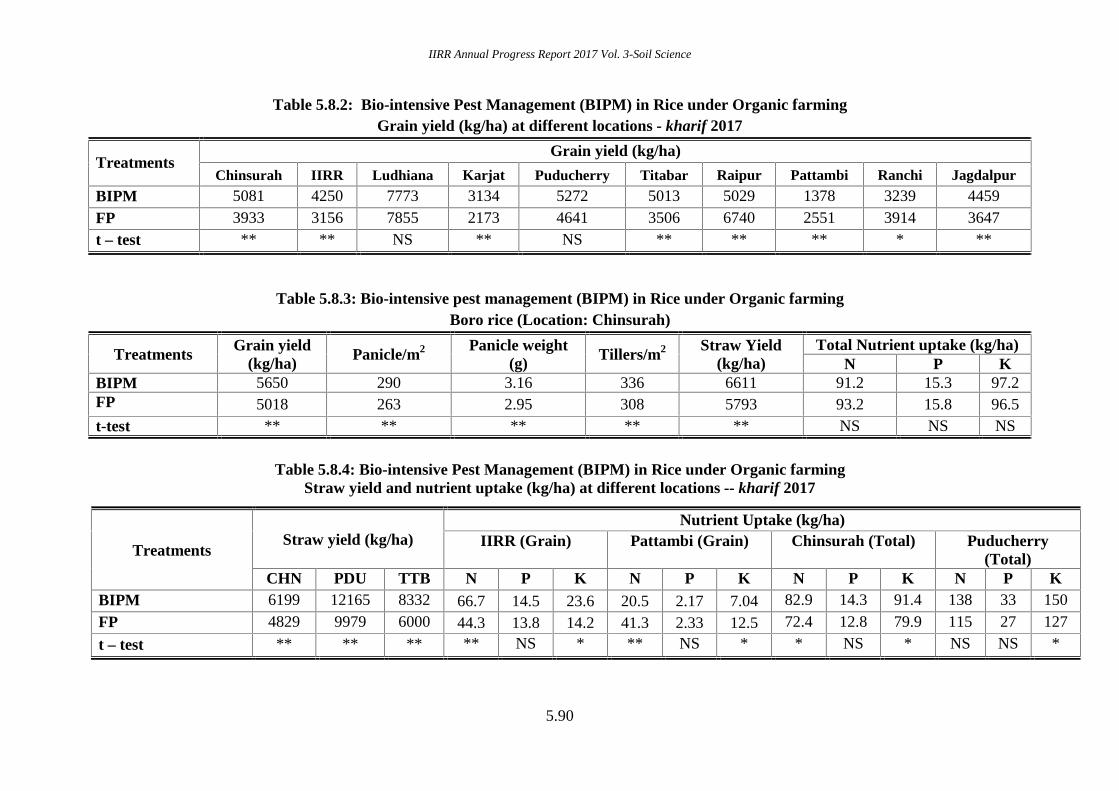
IIRR Annual Progress Report 2017 Vol. 3-Soil Science
5.90
Table 5.8.2: Bio-intensive Pest Management (BIPM) in Rice under Organic farmingGrain yield (kg/ha) at different locations - kharif 2017
TreatmentsGrain yield (kg/ha)
Chinsurah IIRR Ludhiana Karjat Puducherry Titabar Raipur Pattambi Ranchi Jagdalpur
BIPM 5081 4250 7773 3134 5272 5013 5029 1378 3239 4459FP 3933 3156 7855 2173 4641 3506 6740 2551 3914 3647t – test ** ** NS ** NS ** ** ** * **
Table 5.8.3: Bio-intensive pest management (BIPM) in Rice under Organic farmingBoro rice (Location: Chinsurah)
TreatmentsGrain yield
(kg/ha) Panicle/m2 Panicle weight(g) Tillers/m2 Straw Yield
(kg/ha)Total Nutrient uptake (kg/ha)
N P KBIPM 5650 290 3.16 336 6611 91.2 15.3 97.2FP 5018 263 2.95 308 5793 93.2 15.8 96.5t-test ** ** ** ** ** NS NS NS
Table 5.8.4: Bio-intensive Pest Management (BIPM) in Rice under Organic farmingStraw yield and nutrient uptake (kg/ha) at different locations -- kharif 2017
TreatmentsStraw yield (kg/ha)
Nutrient Uptake (kg/ha)IIRR (Grain) Pattambi (Grain) Chinsurah (Total) Puducherry
(Total)CHN PDU TTB N P K N P K N P K N P K
BIPM 6199 12165 8332 66.7 14.5 23.6 20.5 2.17 7.04 82.9 14.3 91.4 138 33 150FP 4829 9979 6000 44.3 13.8 14.2 41.3 2.33 12.5 72.4 12.8 79.9 115 27 127
t – test ** ** ** ** NS * ** NS * * NS * NS NS *

IIRR Annual Progress Report 2017 Vol. 3-Soil Science
5.91
5.8.5: Bio-intensive Pest Management (BIPM) in Rice under Organic farmingNutrient concentration (%) in rice grain - kharif 2017
Table 5.8.6: Bio-intensive Pest Management (BIPM) in Rice under Organic farmingPhysical and Cooking quality parameters - kharif 2017
Treatments Hull % Mill % HRR % KL KB L/B Grain type Grain chalkiness KLAC ER ASV AC% GC(mm)
IIRRBIPM 76.7 61.9 32.0 5.68 2.56 2.21 SB VOC 9.5 1.67 7.0 27.25 22FP 75.3 57.4 20.1 5.41 2.49 2.17 SB OC 9.9 1.82 7.0 26.25 23
Pattambi
BIPM 76.5 64.7 34.2 6.19 2.35 2.63 LB OC 11.5 1.85 7.0 25.57 30
FP 77.2 64.4 25.4 6.14 2.40 2.55 LB OC 11.0 1.79 7.0 23.78 44Chinsurah
BIPM 68.5 60.4 53.9 5.27 2.05 2.57 MS VOC - - 2.23 14.8 38FP 66.3 59.2 52.8 5.23 2.04 2.56 MS VOC - - 2.21 14.4 34
HRR- Head rice recovery; KL - Kernel length, KB - Kernel breadth, L/B - Length to breadth ratio of kernel, KLAC - Kernel length after cooking, ER – Elongation ratio,ASV- Alkali spreading value; AC- Amylose content; GC-Gel consistency; VOC-very occasionally chalkiness,OC-Occasionally chalkiness
TreatmentsPuducherry IIRR Pattambi Chinsurah Titabar
Grain Grain (Brown rice) Grain (Brown rice) Brown rice Polished rice Grain
N P K N P K N P K N P K Fe Zn Fe Zn N P KBIPM
1.25 0.27 0.43 1.48 0.32 0.53 1.61 0.15 0.51 1.52 0.23 0.18 17.5 15.7 1.87 9.4 0.65 0.14 0.55
FP1.28 0.27 0.44 1.51 0.47 0.49 1.49 0.09 0.49 1.38 0.21 0.15 16.4 15.2 1.83 9.4 0.57 0.12 0.50
t-test NS NS NS NS * NS * * NS * * NS * NS NS NS - - -
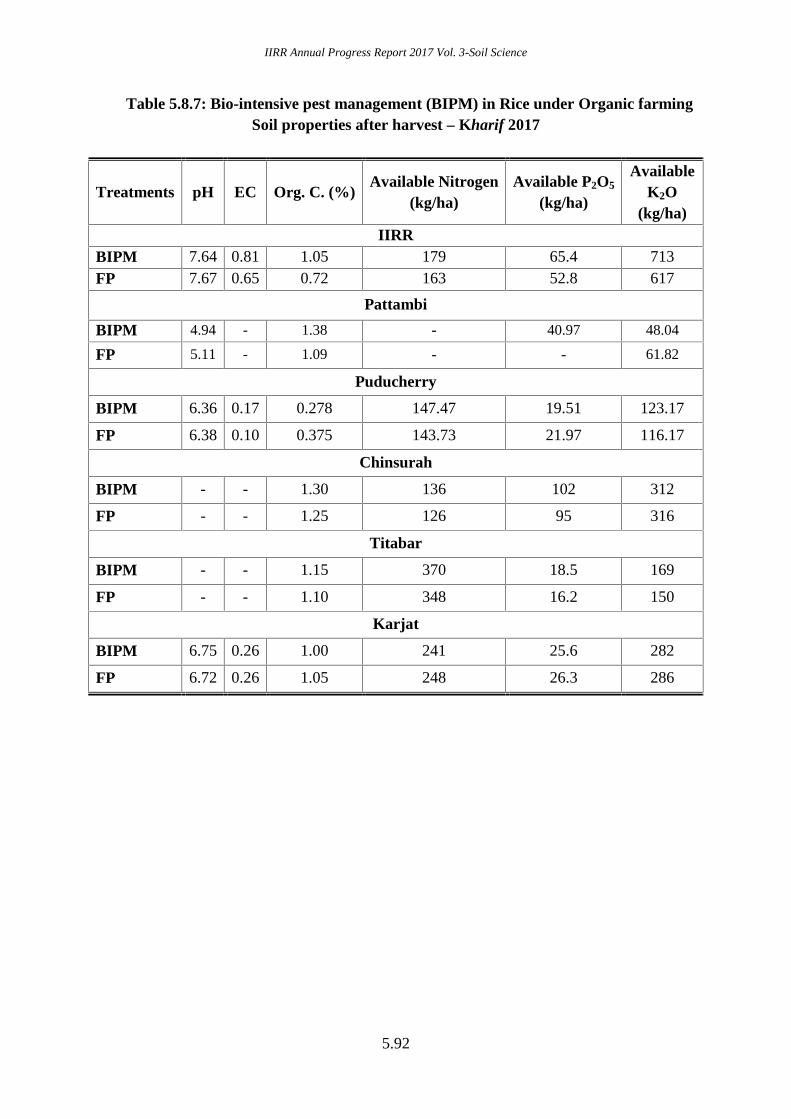
IIRR Annual Progress Report 2017 Vol. 3-Soil Science
5.92
Table 5.8.7: Bio-intensive pest management (BIPM) in Rice under Organic farmingSoil properties after harvest – Kharif 2017
Treatments pH EC Org. C. (%)Available Nitrogen
(kg/ha)Available P2O5
(kg/ha)
AvailableK2O
(kg/ha)IIRR
BIPM 7.64 0.81 1.05 179 65.4 713FP 7.67 0.65 0.72 163 52.8 617
Pattambi
BIPM 4.94 - 1.38 - 40.97 48.04
FP 5.11 - 1.09 - - 61.82
Puducherry
BIPM 6.36 0.17 0.278 147.47 19.51 123.17
FP 6.38 0.10 0.375 143.73 21.97 116.17
Chinsurah
BIPM - - 1.30 136 102 312
FP - - 1.25 126 95 316
Titabar
BIPM - - 1.15 370 18.5 169
FP - - 1.10 348 16.2 150
Karjat
BIPM 6.75 0.26 1.00 241 25.6 282
FP 6.72 0.26 1.05 248 26.3 286

IIRR Annual Progress Report 2017 Vol. 3-Soil Science
5.93
Map showing funded and voluntary centres of Soil Science AICRP, 2017-18

IIRR Annual Progress Report 2017 Vol. 3-Soil Science
5.94
Scientists involved in Soil Science Co-ordinated Programme 2017-18 (Appendix I)
S.No State Organization Location Name Designation Telephone E-mail
Funded centres
1AndhraPradesh
ANGRAU Maruteru Dr. A. Sireesha Scientist 09441415808 [email protected]
2 Assam AAU Titabar Dr. T.J. Ghose Principal Scientist 09435090297 [email protected] Bihar RAU Pusa Dr. Pankaj Singh Jr. Scientist 09430998401 [email protected] Karnataka UAS Mandya Dr. Umesh Jr. Scientist 09481191754 [email protected] Kerala KAU Moncompu Dr. Reena Mathews Assistant Professor 09446494769 [email protected]
6 Puducherry PJNCOA&RI KaraikalDr. A. BhaskarDr. L.Aruna Mohan
Professor & HeadAssistant Professor
09443165382094877 31178
[email protected]@gmail.com
7 Uttar Pradesh CSAUAT Kanpur Dr. B. N. Tripathi Jr. Soil Scientist 09935649510 [email protected]
Voluntary Centres
1Jammu&Kashmir
SEKUASTK KhudwaniDr. Aziz MujtabaAezum
Assistant Professor 09906531155 [email protected]
2 Chattisgarh IGKV Raipur Dr. Anurag Professor 09329602206 [email protected] Puducherry PKKVK Kurumbapet Dr. V. PrabhuKumar Incharge 09489052303 [email protected]
4 Uttar Pradesh NDUAT Faizabad Dr. Alok pandey Asst. Professor 09450763127 [email protected]
5 West Bengal Govt. of WB ChinsurahDr. Malay KumarBhowmick
Assistant Agronomist 09434239688 [email protected]
6 Jharkhand RAU, Ranchi Ranchi(Dumka) Dr. Purnendu B. Saha Soil Scientist 09934525212 [email protected]
Head quarters
1 ICAR ICAR -IIRR Hyderabad Dr. K. Surekha Principal Scientist 09440963382 [email protected]
2 ICAR ICAR -IIRR HyderabadDr. M.B.B. PrasadBabu
Principal Scientist 09666852265 [email protected]
3 ICAR ICAR -IIRR HyderabadDr. D.V.K.Nageswara Rao
Principal Scientist 09502382943 [email protected]
4 ICAR ICAR -IIRR Hyderabad Dr. Brajendra Principal Scientist 08247820872 [email protected]
5 ICAR ICAR -IIRR Hyderabad Dr. P.C. Latha Principal Scientist 09866282968 [email protected]
6 ICAR ICAR -IIRR Hyderabad Dr. Bandeppa Scientist 09555871091 [email protected]
7 ICAR ICAR-IIRR Hyderabad Mr. Gobinath, R. Scientist 09971720207 [email protected]
8 ICAR ICAR-IIRR Hyderabad Dr. Manasa, V. Scientist 08762497942 [email protected]

IIRR Annual Progress Report 2017 Vol. 3-Soil Science
5.95
List of cooperating centers of Soil Science and allotment of trials - 2017-2018 (Appendix II)S.No Locations
Trial 1 Trial 2 Trial 3 Trial 4 Trial 5 Trial 6 Trial 7 Trial 8 Total TotalAllotted
TotalConducted
Conducted%K R K K R K R K K R K R K R K R
1 Kanpur (F) - - - X X - - - X - - - - - 2 1 3 3 100
2 Maruteru (F) X X X - - X X - - - X X - - 4 3 7 7 100
3 Titabar (F) X X X - - - - X - - - - X - 4 1 5 5 100
4 Chinsurah (V) - - X - - - - - - - - - X - 2 0 2 2 100
5 Faizabad (V) - - X X - X - - - - X - - - 4 0 4 4 100
6 Karaikal (F) - - - - - X X - - - - - - - 1 1 2 2 100
7 Khudwani(V) - - - - - X - - NC - X - - - 3 0 3 2 67
8 Mandya(F) NC NC NC X - NC - - - - X - - - 5 1 6 2 33
9 Moncompu(F) - - - - - - - X X - NC - - - 3 0 3 2 67
10 Puducherry (V) - - - - - - - - X - - - X - 2 0 2 2 100
11Dumka(Ranchi)(V)
- - - - - - - X - - - - - - 1 0 1 1 100
12 Raipur(V) - - - - - - - X - - - - - - 1 0 1 1 100
13 Pusa(F) - - - - - X NC - X - X - - - 3 1 4 3 75
14 IIRR - - - - - - - - - - X - X - 2 0 2 2 100
Total allotted 3 3 5 3 1 6 3 4 5 0 7 1 4 0 37 8 45 38 84K – kharif R- Rabi; X Indented trials F – Funded center V – Voluntary center X-Conducted NC-Not conductedTrial No.1: Long- term soil fertility management in rice – based cropping systems (RBCS) (Kharif and rabi)Trial No.2: Yield gap assessment and bridging the gap through site specific integrated nutrient management in rice in farmers' fields (Kharif)Trial No.3: Screening of germplasm for sodicity and management of sodic soils in RBCS (Kharif and rabi)Trial No.4: Nutrient use efficiency and soil productivity under early and late sown/ transplanted rice (Kharif and rabi)Trial No.5: Screening of rice genotypes for tolerance to soil acidity and related nutritional constraints (Kharif)Trial No.6: Monitoring soil quality and crop productivity under emerging rice production systems (Kharif and rabi)Trial No.7: Yield maximization of rice through Site Specific Nutrient Management (Kharif and rabi)Trial No.8: Bio-intensive pest management (BIPM) in rice under organic farming (Kharif and rabi)
IIRR Annual Progress Report 2017 Vol. 3-Soil Science
5.96
ACKNOWLEDGEMENTS
Our thanks are due to the scientists of different co-operating
centres for the conduct of trials and timely reporting of soil science
coordinated programme. We thank the technical staff of Soil Science
department Shri CH. Sivanarayana Technical Officer (T-5) and
Shri C. Muralidhar Reddy (Senior Technical Assistant) for their
unstinted support in the conduct of trials at IIRR and data
compilation. We are extremely thankful to Dr. B. Sailaja, Principal
Scientist (Computer Application), IIRR, Smt S. Gayatrim and Mrs.
Sudha Madhuri for the critical support in statistical analysis of data
and preparation of map and the adhoc staff (Mrs. P. Madhuri, Ms.
Humera Quadriya, Mr. S. Mahesh and Mr. G. Srikanth) of the
department for their assistance in field studies and laboratory
analysis. We also thank Shri K. Ramulu, Technical Officer (T-5),
Plant Physiology Section for the help in page setting and printing of
the progress report.