SOIL REFERENCE BOOKLET FOR THE MACKAY DISTRICT
90
Soil-Specific Nutrient Management Guidelines for Sugarcane Production in the Mackay District SOIL REFERENCE BOOKLET FOR THE MACKAY DISTRICT Barry Salter Bernard Schroeder John Panitz David Calcino Andrew Wood Technical publication TE15001
Transcript of SOIL REFERENCE BOOKLET FOR THE MACKAY DISTRICT

Soil-Specific Nutrient ManagementGuidelines for Sugarcane Production in the Mackay District
SOIL REFERENCE BOOKLET FOR THE MACKAY DISTRICT
Barry SalterBernard SchroederJohn PanitzDavid CalcinoAndrew Wood
Technical publication TE15001


Soil-Specific Nutrient Management Guidelines for
Sugarcane Production in the Mackay District
By
Barry Salter 1, Bernard Schroeder 2, John Panitz 3,
David Calcino 4 and Andrew Wood 5
1 Sugar Research Australia, Mackay
2 University of Southern Queensland, Toowoomba; formerly Sugar Research Australia, Indooroopilly
3 Sugar Research Australia, Bundaberg
4 Sugar Research Australia, Meringa
5 Tanglewood Agricultural Services, Millaa Millaa

© Copyright 2015 by Sugar Research Australia Limited. All rights reserved. No part of the Soil-Specific Nutrient Management Guidelines for Sugarcane Production in the Mackay District (this publication), may be reproduced, stored in a retrieval system, or transmitted in any form or by any means, electronic, mechanical, photocopying, recording, or otherwise, without the prior permission of Sugar Research Australia Limited.
Disclaimer: In this disclaimer a reference to ‘SRA’, ‘we’, ‘us’ or ‘our’ means Sugar Research Australia Limited and our directors, officers, agents and employees. Although we do our very best to present information that is correct and accurate, we make no warranties, guarantees or representations about the suitability, reliability, currency or accuracy of the information we present in this publication, for any purposes. Subject to any terms implied by law and which cannot be excluded, we accept no responsibility for any loss, damage, cost or expense incurred by you as a result of the use of, or reliance on, any materials and information appearing in this publication. You, the user, accept sole responsibility and risk associated with the use and results of the information appearing in this publication, and you agree that we will not be liable for any loss or damage whatsoever (including through negligence) arising out of, or in connection with the use of this publication. We recommend that you contact our staff before acting on any information provided in this publication. Warning: Our tests, inspections and recommendations should not be relied on without further, independent inquiries. They may not be accurate, complete or applicable for your particular needs for many reasons, including (for example) SRA being unaware of other matters relevant to individual crops, the analysis of unrepresentative samples or the influence of environmental, managerial or other factors on production.
More information
We are committed to providing the Australian sugarcane industry with resources that will help to improve its productivity, profitability and sustainability.
A variety of information products, tools and events which complement this manual are available including:
• Information sheets and related articles
• Publications including soil guides, technical manuals and field guides
• Research papers
• Extension and research magazines
• E-newsletters and industry alerts
• Extension videos
• Online decision-making and identification tools
• Training events.
These resources are available on the SRA website and many items can be downloaded for mobile and tablet use. Hard copies for some items are available on request.
We recommend that you subscribe to receive new resources automatically. Simply visit our website and click on Subscribe to Updates.
www.sugarresearch.com.au
Contact details
Sugar Research Australia
PO Box 86
Indooroopilly QLD 4068 Australia
Phone: 07 3331 3333
Fax: 07 3871 0383
Email: [email protected]
ISBN: 978-0-9943215-0-3
About the authors ................................................................................................................................................
Acknowledgements .............................................................................................................................................
Glossary ................................................................................................................................................................
Introduction ........................................................................................................................................................
Chapter 1: Introduction to Mackay soils and their properties ...............................................................
Chapter 2: Principles for determining nutrient management guidelines ..........................................
Chapter 3: Description of Mackay sugarcane soils and guidelines for their management ...............
Kuttabul ......................................................................................................................................
Mirani ..........................................................................................................................................
Marian .........................................................................................................................................
Ossa .............................................................................................................................................
Pindi .............................................................................................................................................
Sandiford ....................................................................................................................................
Wollingford ................................................................................................................................
Calen ...........................................................................................................................................
Sunnyside ...................................................................................................................................
Wagoora ......................................................................................................................................
St Helens .....................................................................................................................................
Brightley .....................................................................................................................................
Victoria Plains ............................................................................................................................
Pioneer ........................................................................................................................................
Cameron ......................................................................................................................................
Marwood .....................................................................................................................................
Chapter 4: Nutrient requirements for specific blocks of sugarcane ......................................................
Chapter 5: Concluding remarks ..................................................................................................................
Appendix 1: How to determine soil texture ................................................................................................
Appendix 2: Guidelines for banded mill mud and mud/ash mixture ......................................................
Appendix 3: How to take a soil sample ........................................................................................................
Appendix 4: How to take a leaf sample ........................................................................................................
Further reading ....................................................................................................................................................
Table of contents
01
02
03
08
09
17
28
35
37
39
41
43
45
47
49
51
53
55
57
59
61
63
65
67
74
75
76
77
79
81

Soil-Specific Nutrient Management Guidelines
01
Dr Barry Salter is the Manager (Cropping Systems) with Sugar Research Australia based at Mackay. He has worked in the sugar industry for 14 years, formerly as a PhD student with the CRC for Sustainable Sugar Production. Apart from his current R&D role in sustainable nutrient management in sugarcane, he was also a member of the Sugar Yield Decline Joint Venture. He is currently working on various farming system and agronomic projects.
Prof Bernard Schroeder is Professor: Farming Systems within the National Centre for Engineering in Agriculture (NCEA) at the University of Southern Queensland in Toowoomba. Formerly he was a Principal Scientist with SRA and Leader of the Improved Cropping Systems Program with BSES Limited at Bundaberg/Indooroopilly. He has been involved in R,D&E associated with various aspects of soil fertility and crop nutrition for about 30 years. This experience has been gained largely within the Australian and South African sugar industries.
John Panitz is a Principal Technician (Nutrient Management) with Sugar Research Australia based at Bundaberg. He has worked in an RD&E environment since 1982, and, as a Variety Officer, has made a large contribution to the plant breeding program in the Southern Region. He then held the position of Extension Officer within the Bundaberg Sugar Services group. More recently, John has been part of the SIX EASY STEPS development and delivery team and is currently a member of the Improved Cropping Systems group investigating aspects of nutrient management, precision agriculture (PA) and crop agronomy. John brings with him a wealth of practical experience and the ability to communicate effectively across the full spectrum of people in the sugar industry.
David Calcino is a Development Officer with Sugar Research Australia based at Meringa Sugar Experiment Station south of Cairns. He commenced work with BSES Limited in 1975 and has had various roles related to sugar industry extension for 35 years including extension projects in Australia and Mauritius. In 2007, he was President of Australian Society of Sugar Cane Technologists and is currently a committee member of International Society of Sugar Cane Technologists. He was Technology Transfer Leader in the Cooperative Research Centre for Sustainable Sugar Production. David wrote Australian Sugarcane Nutrition Manual, is principal author of one book chapter, several research papers and other publications. His major area of interest is the extension of sugarcane nutrition and soil fertility information to the sugar industry.
Dr Andrew Wood worked for CSR Sugar Ltd (later Sucrogen) in the Herbert River district as Agronomist, Chief Technical Field Officer and Productivity Manager from 1981 to 2013. He is now a consultant with Tanglewood Agricultural Services. Apart from a good general knowledge of sugarcane production, he has been largely responsible for mapping and describing soils in the Herbert sugarcane district at a scale of 1:5000. This detailed mapping is unparalleled in any other sugarcane growing region in Australia. Andrew has led research projects covering many aspects of sugarcane production and is the author or co-author of over 150 scientific papers, books and reports.
About the authors

02
We thank the following contributors to this publication:
• Emilie Fillols for collating soils data for figures and tables
• Sam Henty and Jason Perna (formerly BSES Limited, Mackay) for technical assistance and reviewing the manuscript
• Rob Sluggett (Farmacist) for valuable technical information on local soils
• Bruce Drysdale and Andrew Weeks (Mackay Rural) for providing local information
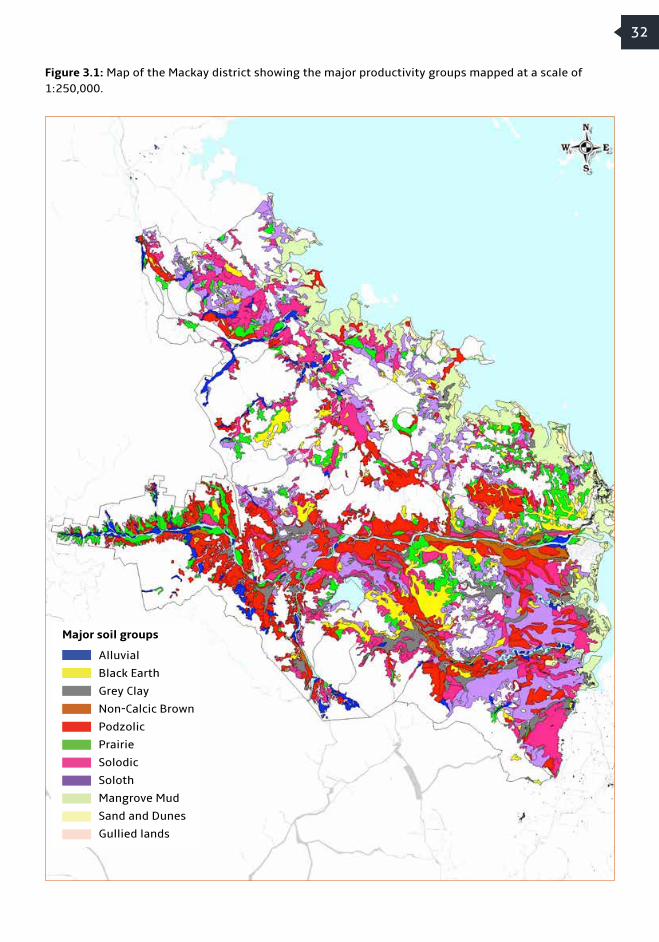
• Kevin Moore (Mackay Area Productivity Services) for providing Figure 3.1
• Cane growers in the Mackay district who kindly allowed access to their farms, for collection of soil samples and digging of inspection pits
• Dr Phil Moody (Department of Science, Information Technology and Innovation, Dutton Park) for providing valuable background information
• Queensland Department of Environment and Heritage Protection for their financial support and ongoing commitment to this project
The soil-specific guidelines in this publication are based on outcomes from various projects that were funded by the Sugar Research and Development Corporation and the Cooperative Research Centre for Sustainable Sugar Production. This support is also gratefully acknowledged.
Acknowledgments

Soil-Specific Nutrient Management Guidelines
03
It is inevitable that specialist and technical words have to be used in this publication. To assist those not familiar with some of these words, we have included a list of technical terms. This can be used as a reference source while reading the book.
Acidic cations: Positively charged ions of aluminium and hydrogen that give the soil CEC an acid reaction. Aluminium and hydrogen are always present in large quantities in the soil but they are only present on the CEC and in the soil solution if the soil pH is below 5.5.
Acid saturation: The proportion of the soil CEC occupied by the acidic cations aluminium and hydrogen. It appears on soil tests as aluminium saturation. Low acid saturation is desirable so that more of the CEC is available for storing nutrient cations.
Acid sulphate soils (ASS): Soils and sediments that contain sulphides capable of oxidising and producing sulphuric acid. These soils become problematic when they are exposed to air by construction of drains or other earthworks. Under such conditions the sulphide components of the iron compounds oxidise to sulphuric acid and produce actual acid sulphate soils with pH <4. In the saturated or reduced state these soils remain unaltered and have normal pHs mainly in the range of 5.5 to 7.5. These soils are referred to as potential acid sulphate soils.
Alluvial: Soils derived from recent stream deposits. These soils dominate floodplains.
Ameliorant: A substance added to soil that slowly improves its nutrient status and physical properties, usually beyond a single crop cycle. Examples are gypsum, lime and mill byproducts.
Amino nitrogen: A form of nitrogen found in sugarcane juice that can increase colour in sugar. It is caused by excessive amounts of nitrogen available from the soil or from fertiliser.
Anions: Negatively charged ions such as nitrate, phosphate and sulphate.
Base saturation: The proportion of the soil CEC occupied by the basic cations calcium, magnesium, potassium and sodium. In some soils the base saturation is quite high with possible effects on certain relative cation (e.g. K+) availability.
Cations: Positively charged ions that are held on to the negatively charged sites on the soil CEC. The major cations are calcium, potassium, magnesium and sodium.
CEC (Cation Exchange Capacity): A measure of a soil’s capacity to store and exchange cations. The value of the CEC is dependent on the amount and type of clay and on the amount of humus. CEC is expressed as milli-equivalents per 100 grams of soil (me%).
Glossary

04
Clay minerals: The basic building blocks of clay. They are made from the weathered minerals in rocks and include aluminium and silicate layers as well as oxides and hydroxides. (A mineral is a naturally occurring substance that has a definite chemical composition and an ordered structure).
Colluvial: The downslope movement and accumulation of sediment at the base of hills.
Colour: Soil colour refers to the colour of the soil when it is moist. A simple system using everyday terms is used in this booklet. Soil scientists use a more complicated system in which the colour is matched to a series of standard colours (Munsell Soil Colour Chart).
Compaction: A reduction in pore space in soil (meaning less air space and poorer infiltration rates) caused by machinery traffic and inappropriate tillage.
Conglomerate: A rock composed of worn pebbles cemented into a matrix of sand, silt, clay and other materials.
Critical level: The value for a nutrient in either a soil or leaf test above which a yield response is unlikely to occur when that nutrient is applied.
Decomposition: The breakdown of a complex substance to something simpler. The process can be caused by weathering, chemical change (increased acidification) or biological action.
Deficiency: A nutrient level below the critical level. In extreme cases a deficiency is reflected by plant symptoms such as leaf colour.
Denitrification: The conversion of the nitrate form of nitrogen to a gas. It occurs under waterlogged conditions in the presence of organic matter and suitable bacteria.
Dispersive soil: A dispersive soil usually has high levels of exchangeable sodium (ESP) which causes the soil particles to separate from each other when in contact with water, which results in a breakdown of soil structure.
District yield potential: This is determined from the best possible yield averaged over all soil types within a district. It is defined as the estimated highest average annual district yield (tonnes cane/hectare) multiplied by a factor of 1.2. This enables recognition of differences in the ability of districts to produce cane. The district yield potential for Mackay is 130 t cane/ha/year.
DTPA: Chemical used in soil analysis to extract micronutrients from the soil.
Duplex soil: A soil that has a sharp texture contrast between the surface soil and subsoil; i.e the A and B horizons. A duplex soil is often characterised by a sandy or loamy surface soil which changes abruptly to the clay subsoil.
ESP (Exchangeable sodium percentage): The percentage of the CEC occupied by sodium. ESP in the topsoil of more than 5% is undesirable as is causes soil structure to break down and results in poor physical properties of the surface soil.
Exchangeable nutrients: Essential nutrients (calcium, potassium, magnesium and sodium) present as cations associated with the soil CEC. They have the ability to exchange easily.
Flocculation: The natural grouping of clay particles which is an essential prerequisite for the formation of good soil structure.

05
Soil-Specific Nutrient Management Guidelines
Floodplain: Land adjacent to a watercourse subject to regular inundation and deposition of alluvial material.
Horizon: A layer of soil roughly parallel to the land surface which is distinct from the layers above and/or below it. Differences are based mainly on colour, texture and structure. Surface horizons are often not apparent in agricultural soils because of mixing caused by tillage operations.
Humus: Stabilised soil organic matter distinct from decomposing trash.
Jarosite: A pale yellow potassium iron sulphate mineral present in actual acid sulphate soils and is a byproduct of the oxidation of sulphides.
Leaching: The downward movement of water through the soil and the accompanied movement of soluble nutrients and suspended clay particles.
Massive structure: A soil with no apparent structure. Such soils are very lumpy, difficult to cultivate and set hard when dry.
Micronutrient: An essential nutrient that is required in very small quantities, <10 kg/ha/year, such as copper and zinc.
Mineralisation: The breakdown of humus (stabilised organic matter) and release of nutrients, especially nitrogen, sulphur and phosphorus.
Mottles: Patches of lighter or darker colour in soils often indicating the effects of poor drainage.
Mudstone: Sedimentary rock cosisting of consolidated mud.
New land: Land in its first crop cycle of sugarcane.
Nitric K: Potassium extracted with the use of strong nitric acid. It is a crude measure of the potassium reserve in the clay minerals.
Organic amendment: The addition of material high in organic matter which has the potential to improve soil condition and fertility. Examples are mill mud and mud-ash, compost, manures and cane and fallow crop residues.
Organic matter: Carbon in the soil derived from plant matter. It is composed of carbon, hydrogen and oxygen, but also contains nitrogen, phosphorus and sulphur. In this booklet organic matter is measured as organic carbon (org C) using the Walkley-Black procedure.
Parent material: The material (rock or alluvium) from which soils have formed.
Peds: Aggregates of soil particles, usually only found in undisturbed soil.
Permeability: The ability of soil to drain water through the profile. It is dependent on pore space and is reduced by compaction.
pH: The scale that is used to measure acidity and alkalinity. A pH of 7 is neutral, less than 7 is acidic, greater than 7 is alkaline. In this booklet, soil pH is the pH in a 1:5 soil:water suspension.

06
Phosphorus Buffer Index (PBI): A measure of the degree to which added P is held tightly onto soil particle surfaces and is unavailable for plant uptake.
Plant Available Water Capacity (PAWC): The amount of water in the soil profile within the rooting zone between field capacity (full) and permanent wilting point (dry).
Plastic limit: The lowest soil moisture content at which a soil is capable of being molded or deformed permanently by pressure.
Potential acid sulphate soils: Soils that contain sulphides that have the potential to generate sulphuric acid if disturbed (drained, excavated, etc) and exposed to air. P-sorption: The process by which phosphorus is held tightly onto soil particle surfaces and rendered relatively unavailable to plant uptake.
Pyrite: An iron sulphide mineral often found in potential acid sulphate soils in tidal swamps and other brackish sediments. When below the watertable, these minerals are relatively harmless. However, when exposed to air through falling water levels, the pyrite will oxidise and produce sulphuric acid and the soil mineral jarosite, which is indicative of an actual acid sulphate soil with a pH <4.
Readily Available Water (RAW): The amount of soil water within the rooting zone that can be easily accessed for plant growth. Irrigation management should aim to maintain soil moisture levels in the ‘readily available’ range. Sandstone: Sedimentary rock consisting of consolidated particles of quartz.
Sedimentary rocks: Formed by compressed sand, silt and clay particles deposited by rivers, streams, lakes and seas.
Shale: Fine-grained sedimentary rock formed in layers by the consolidation of silt and clay.
Siltstone: Sedimentary rock consisting of consolidated particles of silt.
Sodic soil: Soils having high exchangeable sodium levels (see ESP). Such soils have a poor structure, disperse easily and are prone to erosion.
Soil profile: A vertical section through the soil showing the arrangement of soil horizons.
Soil structure: The arrangement of soil particles into aggregates (peds) and the pore spaces between them.
Soil texture: A property that depends on the relative proportions of coarse sand (2–0.2 mm), fine sand (0.2–0.02 mm), silt (0.02–0.002 mm) and clay (<0.002 mm) but may be modified by organic matter or type of clay minerals. Stones or gravels >2 mm in size are removed from the soil to determine the soil texture.
Subsoil: Soil below the cultivated zone that shows the highest level of soil development, such as the highest concentration of clay or brighter soil colours. It is commonly sampled at the 40–60 cm depth, however some soils can also have topsoils that are as thick or thicker.
Terrace: A raised area adjacent to a watercourse that is formed by the uplift of an old floodplain.

07
Soil-Specific Nutrient Management Guidelines
Topography: The shape of the landscape, including height of hills, general slope and position of drainage lines.
Topsoil: The cultivated zone of soil commonly sampled at 0–20 cm depth.
Toxicity: A high level of nutrient that causes plant injury and/or reduction in growth.
Volatilisation: The loss of ammonia gas from soil, mainly associated with urea applied to the soil or trash surface.
Water-holding capacity: The amount of water a soil can hold after drainage of soil macropores only, i.e. water that is removed by gravity within 24 hours and can not be held in the soil.
Waterlogging: The saturation of soil with water so that all air is excluded (anaerobic). Under these conditions denitrification can occur.
Weathering: The decomposition of minerals into different-sized particles caused by carbon dioxide, water and biological processes.

Introduction
08
In the last 10 years, soil reference booklets for the Herbert, Proserpine, Johnstone, Bundaberg, Plane Creek, New South Wales and Isis districts, entitled Soil-Specific Management Guidelines for Sugarcane Production, were produced for the industry. These booklets describe the basic principles of soil management and present nutrient guidelines for a range of district soils. We are now in the position to present a similar booklet aimed at soil-specific nutrient management in the Mackay district. This is based on a methodology developed within an SRDC-funded project (Improved nutrient management in the Australian sugar industry) and research conducted in the area as part of an Australian Government-funded project (Improved adoption of best-practice nutrient management).
Our philosophy is that knowledge of soils should form the basis for making management decisions on-farm. Not only does soil type influence decisions on which variety to plant and how much fertiliser to apply, but it also influences the choice of tillage practices, planting techniques, drainage and irrigation requirements, and harvest scheduling. A major objective of this publication is to help growers integrate their knowledge of different soils. This includes the appearance of soils, their occurrence in the landscape, their properties and how they should be managed. Soil-specific guidelines as presented in this booklet represent a much more precise way of managing fertiliser inputs than the traditional ‘one size fits all’ approach. It provides a benchmark against which soils and soil analyses can be compared. However, it is not intended as a substitute for on-farm soil and leaf testing. Ideally, each block on the farm should be sampled every crop cycle for both soil and leaf analyses. A system of record-keeping should also be implemented for nutrient inputs, changes in soil fertility, and crop productivity and profitability.
This philosophy is particularly appropriate for the current circumstances in the Australian sugar industry. The escalating costs of fertiliser, the need to reduce production costs and mounting environmental pressures demand responsible soil and nutrient management. The guidelines in this booklet are aimed at providing best-practice soil and nutrient management for Mackay cane growers. Use of these will not only maintain or improve crop yields and soil fertility, but will also provide opportunities for cost reductions while enhancing sustainability and delivering better environmental outcomes by minimising possible off-site nutrient movement.

Soil-Specific Nutrient Management Guidelines
Sugarcane in the Mackay area is grown on a wide range of soils. The variation in soil properties is related to climate, parent material, topography and the action of organisms. The rock types in the catchment influence the mineralogy and nutrient status of soils that form by weathering. Through processes of erosion and sediment transport, soil material gradually moves downslope (colluvial action) into streams and rivers where it is mixed and eventually deposited on floodplains as alluvium during floods. Thus the geological composition of the catchment has a major bearing on the types of soil that form on the floodplains as well as on hillslopes. Time is also a critical component of soil formation. Older floodplains that are well above river flood levels will be affected more by weathering processes and will have lower levels of nutrients as they are older and more leached. Knowledge of how soils form is important in understanding soil fertility, soil chemical and physical properties, and reactions between soils and fertilisers. All of these properties combine to determine how well sugarcane can grow on any particular soil.
Soil formation and distribution
The Mackay area can be divided into three broad landform patterns based on geological history. These are:
1. Floodplains and creek flats of the major streams and creeks (mainly south of the Pioneer River)
2. Uplands on sedimentary rocks
3. Uplands on volcanic and intrusive rocks.
The river floodplains of the Pioneer River and other streams are formed by deposition of sediment. The youngest sediments occupy the lowest part of the landscape on channel benches adjacent to current stream channels. The main Pioneer floodplain is a broad, level to very gently undulating plain that occurs 3 to 5 m above the level of the existing river bed. Old floodplains or terraces occur towards the back of this main floodplain and are above current flood levels.
Floodplain soils can be grouped according to their position in the landscape. Since the coarsest sediments are quickly deposited when rivers are in flood, soils found on levees close to the main rivers tend to be sandy and well drained. Soils dominated by finer particles occur further away from the rivers, on the backplains and in swamps. These heavier textured soils are often poorly drained due to their high clay content. Soils in between these two areas consist mainly of sandy and loamy surface layers with clay subsoils (duplex soils). These soils have restricted drainage.
Sedimentary rock formations of the hills are made up of sandstone, siltstone, mudstone, shale and conglomerate. Soils developed on these formations are related to rock type and degree of weathering.
Chapter 1
09
Introduction to Mackay soils and their properties

10
For example, acid, red, yellow and grey duplex and gradational soils with sandy topsoils have formed on deeply weathered, coarse-grained sedimentary rocks, such as sandstone. Similarly, red and yellow duplex soils with clay loam surface soils occur on deeply weathered, fine-grained sedimentary rocks such as siltstone, mudstone and shale. Generally, all of these soils have bleached subsurface layers, which shows they have been extensively weathered and leached.
The uplands formed on volcanic rocks are composed of basic, intermediate and acid materials. The basic and intermediate rocks have the least amounts of quartz and give rise to moderately deep, strongly structured, red, brown and black gradational and non-cracking clay soils. They have clay loam to light clay topsoils overlying clay subsoils. The quartz-rich acid volcanic rocks usually produce sodic duplex soils with a sandy or loamy topsoil. The smaller areas of granitic rocks form moderately deep, brown, non-sodic duplex soils with clay loam topsoils or deep uniform sandy soils.
Most sugarcane is grown on the flat to very gently sloping floodplains associated with the Pioneer River and its tributaries, St Helens and Murray creeks to the north, and Bakers, Sandy and Alligator creeks to the south. The main soils on these floodplains are duplex with sandy loam to clay loam topsoils overlying clay subsoils that may be sodic. Significant areas of these soils are found south of Mackay and west of Marian. Cracking clays are also a significant soil group on the Pioneer River floodplain and occur further away from the rivers and creeks in the backplains and swamps. These heavy textured soils are poorly drained due to their high clay content and are found mainly at Victoria Plains and Brightley. Levees and terraces along the rivers and creeks usually have sandier soils that are more freely draining than the other floodplain soils.
Large areas of sugarcane are also grown on the upland soils derived from older geological formations, mainly of volcanic and sedimentary rocks, with smaller areas of granitic rocks. These soils have formed from weathering and erosion followed by colluvial and alluvial deposition. This results in shallower soils on the upper and mid-slopes and deeper soils on the lower slopes.
Acid sulphate soils occur in the mangrove, salt pan and salt marshes of the intertidal zones. These soils consist of black to dark grey muds and sands containing sulphides usually in the upper metre of the profile. Smaller areas containing acid sulphate material underlie some of the terraces along the lower reaches of rivers and creeks, but usually at depths greater than 2 m. As the acid sulphate material is relatively deep, shallow surface drains for sugarcane have not affected these sediments in the Mackay district.
The only other soil landscape used for growing sugarcane is found in the Andergove and Bucasia areas. These are former beach ridges and coastal dunes formed by wind and wave deposition. The soils here are deep, uniform sandy soils of low fertility. In recent years, less cane has been grown on these soils due to urban encroachment.
Position in the landscape
Because of the interactive effect of the soil-forming factors, the existence of soils with specific characteristics is predictable in the landscape. Soils differ according to their position in the landscape due to the interaction between topography, geology and climate. For example, a typical sequence of soils on weathered sedimentary rocks consists of red duplex soils on upper slopes, yellow duplex soils lower down, and grey duplex soils on lower slopes. On volcanic rocks, the sequence is red clays on the crest, brown clays on the mid-slopes, and black cracking clays on footslopes and in drainage depressions.
On floodplains, coarse soil particles are deposited on levees and terraces closest to rivers and creeks which form uniform sandy soils often with layers of gravel.

Further away from creeks and rivers in back plains and swamps, fine clay particles are deposited, resulting in heavy clay soils such as Victoria Plains. On rises and hills of the uplands, alluvial-colluvial soils have been deposited towards the bottom of slopes. Further up the slopes, soils have weathered and gradually eroded, leaving shallow, leached, acidic soils of low fertility that can be rocky and prone to erosion.
Soil field properties
In recognising the existence of a range of soil types, it is possible to classify them according to complex scientific systems. However, recognition of basic soil field properties such as colour, texture, structure, depth and position in the landscape enables the separation of soils into ‘user-friendly’ soil types. Soil type used in combination with soil chemical properties (from soil tests) will enable growers and their advisors to make informed decisions about appropriate nutrient management strategies on-farm.
Colour
The colour of soil is determined by the amount of organic matter present, iron oxide levels and the degree of aeration/moisture content. Dark-coloured soils have more organic matter than lighter-coloured soils. Well-drained soils have red or brown colours whereas poorer drainage is indicated by paler colours ranging from yellow, grading through to grey, light grey and even blue-grey (gleyed) in very poorly drained soils. Bleached horizons (containing little organic matter or iron) with mottles are indicative of seasonal saturation and intense leaching. The mottles form around larger soil pores and root channels where there is some oxygen. In this booklet, the colour descriptions relate to moist soils.
Soil texture
This is an important soil property as it affects soil structure (see below), the capacity of soil to hold air and water, the amount and availability of nutrients, and many other chemical properties. Management issues such as workability, trafficability, erodibility and root development are also associated with soil texture.
Soil texture is a measure of the relative proportions of the various-sized soil particles. The largest soil particles are sand and gravels while the smallest particles are referred to as clay. Silt particles are in between these two in size. Soils are classified as sand, loam or clay, depending on the proportions of these basic components. Clay particles, with their large surface area and negative charge, are the most reactive constituents of the soil as they give soils the ability to store positively charged nutrients such as potassium, sodium, calcium and magnesium. Whereas sandy soils with much lower surface area and negative charge are inherently less fertile as they have very little clay and can store less nutrients which are also more easily leached. The fine pores between the clay particles also allow them to store larger volumes of water. Actual texture (particle size distribution) can be determined in the laboratory. Alternatively, soil texture can be estimated in the field using the guidelines provided in Appendix 1.
Structure
Structure is the natural aggregation of the soil particles (sand, silt and clay) and organic matter into structural units called peds (aggregates). These peds can differ markedly in terms of size, shape and level of stability. Their presence in soil affects the way soils behave and the way they are managed. Structure also affects the growth of roots and plants. For instance, fine peds that easily fall apart indicate good soil structure and conditions that are conducive to plant growth, while large, tough peds that do not readily break down restrict root and water penetration and affect tillage operations.
11
Soil-Specific Nutrient Management Guidelines

Soil horizons
Horizons or layers develop over time as soils form. Horizon development varies with the type of soil parent material and organic matter. This can be further influenced by water through leaching or flooding. Each horizon has characteristics that relate to soil colour, texture and structure. These characteristics distinguish one horizon from another.
In farming, topsoil refers to the mixed surface horizons caused by tillage operations. Material below this is referred to as subsoil and it is usually characterised by a higher clay content or brighter colours than the surface soil. In some cases, shallow topsoil is mixed with subsoil through cultivation. This often changes the topsoil.
Chemical Properties
Clay particles and soil organic matter are largely responsible for the chemical properties of soils due to their reactivity and their small particle size which results in a large surface area.
Cation Exchange Capacity
Cation Exchange Capacity (CEC) refers to the amount of negative charge on the clay and organic matter particles that attracts positively charged chemicals called cations. The most common cations in soil are calcium (Ca), magnesium (Mg), potassium (K), sodium (Na) and aluminium (Al). As these cations are held electrostatically, they are not easily leached but can be exchanged for other cations, enabling plants to have access to them. Soils in the wetter tropical areas generally have lower CECs than soils in cooler or drier areas as they are more highly weathered and leached by the higher rainfall. As they become more acid from ongoing leaching, their CECs are commonly reduced. The CEC of soils in this booklet is defined as the Effective Cation Exchange Capacity (ECEC), which is the sum of the exchangeable cations (K+, Ca2+, Mg2+, Na+, Al3+ and H+) as measured in the laboratory. The ECEC is classified as very low (less than 2 me%), low (2–4 me%), medium (4–8 me%) or high (more than 8 me%).
Organic Matter
Soil organic matter is derived from the breakdown of plant and animal matter. It also has the ability to attract nutrients and has a greater cation exchange capacity than a similar mass of clay. Dark colour and good structure are indicators of high organic matter. Soils in the Mackay district have organic C contents of up to 2%. Organic matter, measured as organic carbon %, improves soil structure and is a source of nitrogen (N), phosphorus (P), sulphur (S) and trace elements. There is no optimum level of organic matter, but it is best to maintain it at the highest possible level. The organic matter content of a soil is determined by the balance between inputs of organic-matter-forming material and the breakdown (mineralisation) of the existing stabilised soil organic matter (humus). Green harvested sugarcane inputs about 10–15 t/ha in trash and 3 t/ha in roots per year, but 80% of this is lost by decomposition in the first year. In sandy soils with low clay contents, organic matter is the chief store for exchangeable cations. Organic matter is a major source of N, which is released by mineralisation (the process in which organic matter is broken down into its mineral components). The potential amount of N released from specific soils can be estimated using an N mineralisation index. This index is used to guide nitrogen fertiliser recommendations.
As mentioned earlier, building organic matter levels is difficult in tropical soils due to rapid decomposition rates as coastal areas are wetter and more humid. Breakdown of organic matter is accelerated by cultivation. Trash conservation following green cane harvesting and the use of fallow green manure crops are the major ways organic matter can be added to soil in sugarcane farming systems. Other methods of maintaining soil organic matter include reducing tillage operations, preventing soil erosion and use of imported organic matter sources such as mill mud, mud/ash and bagasse.
12

13
Soil-Specific Nutrient Management Guidelines
Acidity and soil pH
Acidity in soils is caused by excessive hydrogen (H) and aluminium (Al) ions on the cation exchange sites. Acidity is expressed in terms of pH: values less than 7 are acidic while those more than 7 are alkaline. Soil tests commonly include two measures of acidity: pH in water (pHwater) and pH in calcium chloride solution (pHCaCl2). In this booklet we consider only pH in water. Soil pH values greater than 5.5 are desirable for plant growth in the Mackay district. Under acidic conditions, Al is present in its soluble form and is toxic to most plants. Fortunately, Australian sugarcane varieties are fairly tolerant to high levels of Al. However, this does not apply to legume crops which may be grown as fallow crops. Consequently, regular additions of lime are essential, particularly if legume crops are going to be part of a farming system on acidic soils. Increased acidity (lower pH) is associated with reduced availability of N, P and S, while micronutrients such as copper (Cu) and zinc (Zn) become more available.
Low pH may reduce the CEC of some soils and cause the soil CEC to be dominated by the acidic cations H+ and Al3+. This reduces the storage capacity for nutrients such as Ca, Mg and K and can be critical, particularly on sandy soils that have a low CEC. Soil acidification is a natural process accelerated by the leaching of nitrate from nitrogen fertilisers and the removal of cane to the mill. Regular use of liming materials will reduce soil acidity, neutralise applied acidity arising from nitrogen fertiliser use and replace Ca and Mg (if using Mag lime or dolomite) withdrawn in the harvested crop.
Dispersion
Clay particles can remain either suspended (dispersed) in water or they can flocculate and settle. Soils that have a CEC dominated by calcium, magnesium and aluminium ions flocculate well and do not disperse easily in water. These soils are well structured which allows air and water to move freely through the soil. However, sodium-dominant soils with an exchangeable sodium percentage (ESP) greater than 5% are unstable when wet and disperse. Clays that disperse readily fill pore spaces and reduce permeability to both air and water, which hinders plant growth. Sodicity, salinity and acid sulphate soils
Sodic subsoils restrict rooting depth, reduce soil-water availability to roots and may increase susceptibility to surface erosion. Salinity is an issue for sugarcane grown on coastal and marine plains, and inland areas where watertables are above 0.5 m, causing salt accumulation in mid- and lower landscape positions. Acid sulphate soils (ASS) occur mainly in the intertidal areas of mangroves, salt pans and salt marshes. ASS also underlie some of the coastal landforms where sugarcane is grown, but it is usually quite deep (>2 m). In the Mackay region the areas of ASS outside of the intertidal zone are relatively minor when compared to coastal areas elsewhere in Queensland.
Plant nutrition
Plants require 16 elements for optimum growth. Carbon (C), hydrogen (H) and oxygen (O) are supplied from air and water. The other mineral elements can be divided into three groups:
• Macronutrients: nitrogen (N), phosphorus (P), potassium (K), calcium (Ca), sulphur (S) and magnesium (Mg) are required in relatively large amounts (20–200 kg/ha).
• Micronutrients: iron (Fe), copper (Cu), zinc (Zn), molybdenum (Mo), manganese (Mn), boron (B), and for some plants sodium (Na) are required in small amounts (less than 10 kg/ha/crop).
• Silicon (Si) is considered beneficial for plant growth and is required in fairly large quantities.

All of these nutrients are naturally available in soils. Some soils are able to supply more of a particular nutrient than other soils. Fertilisers and soil ameliorants are used to supplement these supplies of nutrients and prevent the mining of nutrients stored in our soils.
Nitrogen (N)
Research suggests that a crop of sugarcane requires about 1.4 kg N/t cane up to 100 tonnes cane per hectare and 1.0 kg N/t thereafter. To achieve sustainable crop production, maximum use must be made of all the available N sources within the N cycle (Figure 1.1). To do this, it is important to have an understanding of the transformations of N from one form to another.
Mineralisation of organic matter to ammonium and nitrate is ongoing; the amount released depends on the amount of organic matter and microbial activity. The rate of mineralisation is also dependent on temperature and moisture and will therefore vary through the year according to climatic conditions. However, irrespective of the actual rate of mineralisation, this N is available for plant uptake and should be taken into account when nitrogen requirements are calculated. Nitrate levels fluctuate considerably in the soil. They rise substantially after cultivation in some soils (those high in organic matter) and after fertilisation. They are reduced by crop removal and after heavy rainfall (by leaching and runoff) and waterlogging (denitrification). Ammonium-N is subject to volatilisation, a loss often associated with urea applied to the surface of a trash blanket. More detail is provided on these processes in Figure 1.1.
Figure 1.1: Schematic diagram of the nitrogen cycle.
As it is important to minimise nitrogen losses, the following strategies are suggested:
• Apply nitrogen according to the specific requirements of different soils based on their N mineralisation index (as shown in Chapter 2).
• Reduce nitrogen losses from leaching, runoff and denitrification by splitting applications of nitrogen and avoiding applications just before the wet season.
• Reduce the potential for denitrification by improving drainage and placing fertiliser on the cane row where waterlogging is less likely.
14
N Crop removal
Gaseous losses Crop
uptake
Organic NAmmonium-N
Clay minerals
Nitrate-NRun-off losses
Leaching losses
Crop residue
Denitrification
Volatilisation
Mineral-N
N inputs:
fertiliser &
atmosphere
Immobilisation

15
Soil-Specific Nutrient Management Guidelines
• Reduce the potential for ammonia volatilisation when urea is applied to the surface of a trash blanket by delaying application until a cane canopy has developed. Applying the urea below the soil surface removes the possibility of losses by volatilisation but could increase the risk of loss by denitrification if waterlogging occurs.
Phosphorus (P)
Phosphorus cycles between the various forms in soil (Figure 1.2), with some forms being more readily available than others. In some soils with high clay and/or organic matter content, phosphorus is held tightly onto soil particle surfaces by a process called P-sorption. More P fertiliser needs to be applied when P is strongly ‘sorbed’ as this P is relatively unavailable to plants. A new soil test, known as the Phosphorus Buffer Index (PBI), is now available to measure how strongly different soils sorb added phosphorus.
Figure 1.2: Soil phosphorus cycle.
Potassium (K)
Sugarcane needs potassium in large quantities mainly for the maintenance of water balance. On average, 150 kg K/ha is removed each year in cane harvested and sent to the mill. Plants luxury feed on potassium where surplus is available. Potassium is present in a number of distinct forms within soils. A schematic diagram of the potassium cycle is shown in Figure 1.3.
Lattice K is part of the clay structure and in some soils can represent a major part of the total K in the soil and provide a source of plant-available K. Slowly available non-exchangeable K exists in some K minerals and can also act as a source of exchangeable and solution K (plant-available forms). Potassium losses are possible with leaching of exchangeable and soil solution K, particularly from sandy soils and by erosion, which results in losses of lattice and non-exchangeable K reserves.
P Crop removal P
fertiliser inputs
Available soil P
Plant uptake
Crop residue
Organic matter P
Slowly available P
Clay-sorbed P
Chemically fixed P
Losses (erosion)

16Figure 1.3: Soil potassium cycle.
Calcium (Ca)
Calcium is essential for cane growth and for cell wall development. It is taken up as a positively charged cation from the soil solution. Soil reserves of Ca, which are held on the CEC, are supplemented by additions of liming materials and by gypsum. A cane crop removes about 30 kg Ca/ha/year but when applying lime, considerably more Ca than this is applied because of the need to control soil acidity.
Magnesium (Mg)
Magnesium is essential for plant photosynthesis as it is the main mineral constituent of chlorophyll. Like calcium, it is taken up from the soil solution and from the CEC, and total uptake is similar to calcium.
Sodium (Na)
Sodium is required in very small amounts for the maintenance of plant-water balance. It is stored on the CEC and can be taken up from the soil solution by plants. Sodium is readily supplied from rainfall, particularly in coastal areas. It can have a detrimental effect on soil structure even at low levels (ESP of around 5%) and at higher levels (ESP above 15%) can restrict plant growth and root development.
Sulphur (S)
Sugarcane requires sulphur in relatively large amounts of about 25 kg S/ha/year, which is used for plant structure and growth. Plants take up sulphur as sulphate which is more mobile in soils than phosphate and is therefore subject to leaching. Consequently, fertilising may need to supply more than that harvested in the crop. The main store of sulphur in soils is organic matter. The release of sulphur from the mineralisation of soil organic matter should be allowed for when developing fertiliser recommendations. Other natural sources of sulphur are rainfall and irrigation.
Micronutrients
Micronutrients are taken up by cane in much smaller quantities than the nutrients already mentioned and are generally regulators of plant growth. Both copper (Cu) and zinc (Zn) have been shown to be deficient in some Mackay soils, particularly low organic-matter sandy soils, whereas iron (Fe) and manganese (Mn) are usually well supplied. Little is known about the status of molybdenum (Mo) and boron (B) in Mackay soils.
Silicon
Deficiencies of silicon (Si) have been detected in Mackay, particularly on very sandy soils.
Crop removal
Crop uptake Fertiliser
K
K
Relatively unavailable (lattice) K
Slowly available non-exchangeable K
Readily available K (Soil solution K & Exchangeable K)
Erosion losses
Leaching losses

Soil-Specific Nutrient Management Guidelines
When developing nutrient management guidelines for the different soil types in the Mackay district the following factors were taken into account:
• Crop yield potential
• Nutrients removed in the harvested crop
• Nutrients returned to the soil in trash, fallow crops and mill byproducts
• Nutrients released by the mineralisation of soil organic matter
• Nutrients released by the weathering of soil minerals
• Nutrients fixed (held tightly) on soil particle surfaces
• Soil acidity
• Critical levels of nutrients as determined by soil analysis
• The balance and interactions of different nutrients, particularly those on the soil CEC
• The risk of nutrient-loss processes occurring.
A wide range of soil, physical and chemical properties were used to assist this process. Data were obtained from the analysis of samples taken from the soil reference sites, the Mackay sugar cane land suitability study (Holz and Shields, 1985), the Soil Manual for the Mackay-Proserpine Region, Central Queensland (Hardy and others, 2000) and a collection of Incitec soil analyses done on growers’ farms in the Mackay district. They were used to produce the bar graphs for each soil type in Chapter 3 and include:
• Soil particle size distribution, particularly clay % (soil texture)
• Soil organic carbon % (a measure of organic matter)
• Nitrogen mineralisation index (a measure of the amount of N released from the breakdown of soil organic matter)
• Soil pH (a measure of soil acidity)
• Cation exchange capacity (CEC)
• Exchangeable K, Ca, Mg and Na (cations held on the soil CEC)
• Nitric K (a crude measure of K reserves)
• Exchangeable sodium percentage or ESP (the % of the CEC occupied by sodium)
• Exchange acidity (a measure of acidic cations held on the CEC)
• Acid saturation (% of the CEC occupied by acidic cations)
• BSES and Colwell P (indices of available phosphorus)
• Phosphorus Buffer Index (PBI)
• Sulphur, copper and zinc.
Chapter 2
17
Principles for determining nutrient management guidelines

18
Nitrogen
(see Wood and others, 2003; Schroeder and others, 2006)
Nitrogen guidelines are now based on a combination of district yield potential and soil N mineralisation index. The district yield potential is determined from the best possible yield averaged over all soil types within a district and is defined as the estimated highest average annual district cane yield (tonnes cane/ha) multiplied by a factor of 1.2. The district yield potential for Mackay is 130 tonnes cane/ha (estimated highest average annual yield of 110 tonnes cane/ha multiplied by 1.2). This concept of district yield potential recognises differences in the ability of districts and regions to produce cane. For example, the Burdekin region with its fertile soils, higher temperatures and access to water has a higher yield potential than many other districts.
The district yield potential is used to establish the base N application rate according to an estimate, developed by CSIRO scientists. Accordingly, 1.4 kg N/t of cane is required up to a cane yield of 100 t/ha and 1 kg N per t/ha thereafter. With the new approach, however, inputs are adjusted according to the N mineralisation index, which is based on soil organic carbon (%) and is related to soil colour. Generally, the darker the soil, the more organic matter is present.
Seven N mineralisation index classes are recognised (very low, low, moderately low, moderate, moderately high, high and very high). With the district yield potential for the Mackay district set at 130 tonnes cane/hectare, the baseline N application rate is 170 kg N/ha. Adjustment to take account of the contribution of N from the soil organic matter (according to the N mineralisation index) results in a set of guidelines for N fertiliser inputs as shown in Table 2.1. If a sub-district or farm consistently produces higher yields than the district yield potential, the baseline N application rate should be adjusted upward by 1 kg N per tonne of cane above the district yield potential.
For example, if the average yield on a farm in the Mackay district, calculated over a ten-year period, is 140 tonnes cane/ha, then the baseline N application rate should be set at 180 kg N/ha. The N application rates based on the soil organic carbon would then be 10 kg N/ha greater than those shown in Table 2.1. The N application rates for replant or ratoon cane, in this case, would be 180 kg N/ha for soils with organic carbon content of <0.4%. Where the organic carbon content exceeded 2.4%, the appropriate N application rate would be 120 kg N/ha. Conversely, if a sub-district or farm consistently produces lower yields than the district yield potential, the baseline N application rate should be decreased using the same approach. Adjusted nitrogen guidelines for spatial and temporal variablity are the subject of current research.
Table 2.1: N mineralisation index and suggested nitrogen rates for replant and ratoon crops (see Schroeder and Wood, 2001).
N mineralisation index Organic Carbon (%) Suggested N rate for replant and ratoons
VL < 0.4 170
L 0.4–0.8 160
ML 0.8–1.2 150
M 1.2–1.6 140
MH 1.6–2.0 130
H 2.0–2.4 120
VH > 2.4 110

Soil-Specific Nutrient Management Guidelines
After determining the appropriate N application rate in this way, further discounting is required to recognise the contributions of other sources of N. These sources include N from legume fallow crops, harvested legume crops and application of mill byproducts and nitrogen remaining in soil after small crop production.
Determining N application rates for sugarcane following legume fallows
(see Bell and others, 2003; Garside and Bell, 2001)
Unlike N held in soil organic matter, legume N is readily available for plant uptake and should be treated the same way as fertiliser nitrogen for the purposes of calculating nitrogen requirement. Information published by scientists working in the Yield Decline Joint Venture has provided details on how to estimate the amount of legume N being returned to the soil from a legume crop. The amount of N available to the succeeding sugarcane crop will be dependent on the type of legume, how well it was grown and whether the grain was harvested. A summary of the calculations for various legume fallows is shown in Table 2.2. This information can then be used to adjust the amount of nitrogen fertiliser required for the different soils following different legume fallows. The values shown in BOLD in Table 2.2 are used as examples in Table 2.3.
Table 2.2: Calculation of N contribution from a fallow legume as supplied by the Sugar Yield Decline Joint venture (see Schroeder and others, 2005).
* MJ Bell, 2007
19
Legume crop
Fallow crop dry mass (t/ha)
N (%)
Total N contribution
(kg N/ha)
N contribution if grain harvested
(kg/ha)
Soybean
8
3.5
360 120
6 270 90
4 180 60
2 90 30
Peanut*
8
3.0 n/a
125
6 100
4 65
2 25
Cowpea
8
2.8
290 100
6 220 75
4 145 50
2 70 25
Lablab
8
2.3
240 80
6 180 60
4 120 40
2 60 20

Table 2.3: Effect of fallow management on N requirement (see Schroeder and others, 2005).
Modifying N application rates for sugarcane where mill byproducts have been used
The amount of N applied needs to be discounted for up to 3 years after application of mill byproducts. The amount of N to be subtracted from N application rates following the use of mud and mud/ash mixture is set out in Table 2.4.
Table 2.4: Amounts of N to be subtracted from N application rates following the use of mill by-products.
If mill byproducts are applied in a band on the row, refer to Appendix 2.
Phosphorus
Two techniques are used to decide how much P fertiliser is required. Firstly, a BSES-critical level is used to determine the quantity of P fertiliser required. This is then modified by the soil’s ability to fix added P (P-sorption), which determines how much of the fertiliser P will be available to the crop.
20
CropN mineralisation index
VL L ML M MH H VH
Replant cane and ratoon after replant 170 160 150 140 130 120 110
Plant cane after a grass/bare fallow 150 140 130 120 110 100 90
Plant cane after a poor legume crop (e.g. 2 t/ha cowpea green manure: N rate minus 70 kg N/ha)
100 90 80 70 60 50 40
Plant cane after a good legume crop (e.g. 6 t/ha soybean: N rate minus 270 kg N/ha)
Nil Nil Nil Nil Nil Nil Nil
Plant cane after a good legume crop harvested for grain (e.g 6 t/ha soybean: N rate minus 90 kg N/ha)
80 70 60 50 40 30 20
First ratoon after a good legume crop 170 160 150 140 130 120 110
Second ratoon after a good legume crop 170 160 150 140 130 120 110
Product Application rateTo be subtracted from the appropriate N application rate
Plant crop First ratoon Second ratoon
Mill Mud 150 wet t/ha 80 kg N/ha 40 kg N/ha 20 kg N/ha
Mud/Ash 150 wet t/ha 50 kg N/ha 20 kg N/ha 10 kg N/ha

The P-sorption class of each soil is based on the Phosphorus Buffer Index (PBI) which is measured in the laboratory (Table 2.5). It can also be estimated from the clay % and organic matter content of a particular soil (Table 2.6).
Table 2.5: P sorption classes based on PBI (see Burkitt, 2000).
Table 2.6: P sorption classes based on Org C (%) and texture class (see Wood and others, 2003).
Clay percentage is not given on most soil tests but can be estimated from a soil texture determination. If that is not available then an estimate of texture can be made from the cation exchange capacity of the soil as shown in Table 2.7.
Table 2.7: Estimate of soil texture class from CEC.
Currently, some older sugarcane areas do not require any P fertiliser due to their long history of P fertilisation. New land, on the other hand, is often deficient in available P, with BSES P values less than 5 and requires P fertiliser in the first crop cycle (Table 2.8). The guidelines in Table 2.8 are based on a combination and subsequent re-interpretation of information supplied by Calcino (1994), Bramley and Wood (2000) and Burkitt and others (2000). Soils with very low P sorption (PBI <70) have an additional risk of phosphate leaching and run-off, which may create environmental risk.
Soil-Specific Nutrient Management Guidelines
21
P sorption class PBI
Low < 140
Moderate 140–280
High > 280
Org C (%) Sand (< 24% clay) Loam (24–36% clay) Clay (> 36% clay)
< 0.6 % Low Low Moderate
0.6–1.2 % Low Moderate Moderate
1.2–1.8 % Moderate High High
> 1.8 % High High High
CEC (me%) Texture class
< 4.0 Sand
4–8 Loam
> 8 Clay

22
BSES P in soil test (mg/kg) P sorption class Suggested phosphorus application (kg/ha)
> 60 All Nil P for at least 2 crop cycles
50–60 All Nil P for 1 crop cycle
Plant Ratoon
40–50
Low 20 0
Moderate 20 5
High 20 10
30–40
Low 20 10
Moderate 20 15
High 20 20
20–30
Low 20 10
Moderate 20 20
High 30 25
10–20
Low 30 15
Moderate 30 20
High 40 30
5–10
Low 30 20
Moderate 40 30
High 50 40
< 5
Low 40 20
Moderate 60 30
High 80 40
Table 2.8: Phosphorus guidelines for old and new land (see Schroeder and others, 2006).
Discounts should be made where mill byproducts have been used because they are a source of P (Table 2.9).
If mill byproducts are applied in a band on the row, refer to Appendix 2.
Mill and mud/ash mixture (applied at 150 wet t/ha)
Apply nil P for at least 2 crop cycles

Soil-Specific Nutrient Management Guidelines
23
Replant and ratoon (kg/ha K)
Nitric K(meq/100 g)
Exchangeable K (meq/100 g)
< 0.26 0.26–0.30 0.31–0.35 0.36–0.40 0.41–0.45 > 0.45
< 0.70
120 (sand) 100 (sand) 80 (sand) 50 (sand) Nil (sand)
Nil
120 (loam) 100 (loam) 100 (loam) 80 (loam) 50 (loam)
120 (clay) 100 (clay) 100 (clay) 100 (clay) 80 (clay)
> 0.70
100 (sand) 80 (sand) 50 (sand) Nil (sand) Nil (sand)
100 (loam) 100 (loam) 80 (loam) 50 (loam) Nil (loam)
100 (clay) 100 (clay) 100 (clay) 80 (clay) 50 (clay)
Potassium
Potassium fertiliser guidelines are based on two measures of soil potassium: readily available or exchangeable K (potassium in the soil solution and on the CEC) and reserve or nitric K (slowly available, non-exchangeable potassium).
The maximum recommended K rate for Mackay is 120 kg K/ha, which is slightly less than the amount of K removed in the harvested sugarcane crop when trash is retained. This upper limit on K applied is to avoid luxury consumption of K by the crop (resulting in reduced juice quality) and leaching losses on low CEC soils. It is justified by the relatively high K reserves on some soils that slowly but continuously become available. Hence, fallow plant requires less K than replant or ratoons.
Soil-critical levels for exchangeable K are dependent on clay content, and soils are assigned into one of three textural classes: sand (<24% clay); loam (24–36% clay); and clay (>36% clay). Potassium fertiliser recommendations can then be derived as shown in Table 2.10.
Table 2.10: Potassium fertiliser guidelines (see Wood and Schroeder, 2004).
Plant (kg/ha K)
Nitric K(meq/100 g)
Exchangeable K (meq/100 g)
< 0.20 0.20–0.25 0.26–0.30 0.31–0.35 0.36–0.40 > 0.40
< 0.70
100 (sand) 80 (sand) 50 (sand) 50 (sand) Nil (sand)
Nil
120 (loam) 100 (loam) 80 (loam) 50 (loam) Nil (loam)
120 (clay) 120 (clay) 100 (clay) 80 (clay) 50 (clay)
> 0.70
80 (sand) 50 (sand) Nil (sand) Nil (sand) Nil (sand)
100 (loam) 80 (loam) 50 (loam) Nil (loam) Nil (loam)
100 (clay) 100 (clay) 80 (clay) 50 (clay) Nil (clay)

24
Discounts should be made where mill byproducts have been used because they are sources of K (Table 2.11).
Table 2.11: Amounts of K to be subtracted from K appliaction rates following the use of mill byproducts.
Product Application rateTo be subtracted from the appropriate K application rate
Plant crop First ratoon
Mill mud 150 wet t/ha 40 kg K/ha Nil
Mud/ash 150 wet t/ha 120 kg K/ha Nil
If mill byproducts are applied in a band on the row refer to Appendix 2.
Sulphur
As the mineralisation of soil organic matter is a source of sulphur, S fertilising guidelines are based on the nitrogen mineralisation index. Soils are placed in one of three N mineralisation classes and then soil sulphate-critical levels are used to calculate sulphur fertiliser rates (Table 2.12). Discounts should be made where mill byproducts have been used because they supply S (Table 2.13).
Table 2.12: Sulphur fertiliser guidelines (kg S/ha) for plant and ratoon crops.
Table 2.13: Amounts of S to be subtracted from S appliaction rates following the use of mill byproducts.
If mill byproducts are applied in a band on the row refer to Appendix 2.
Product Application rateTo be subtracted from the appropriate S application rate
Plant crop First ratoon Second ratoon
Mill mud 150 wet t/ha 10 kg K/ha 10 kg K/ha 10 kg K/ha
Mud/ash 150 wet t/ha 10 kg K/ha 10 kg K/ha Nil
Sulphate S
(mg/kg)
N mineralisation index
VL – L ML – M MH – H
< 5 25 20 15
5–10 15 10 5
11–15 10 5 0
> 15 0 0 0

Soil-Specific Nutrient Management Guidelines
25
Lime
(see Aitken, 2000; Nelson and others, 2000; Wood and others, 2003)
Lime is used to neutralise soil acidity and to supply calcium. Soils are constantly being acidified through the use of nitrogen fertiliser, removal of nutrients in the harvested crop and by leaching of nitrate. Maintenance applications of about 2 tonnes lime/ha each crop cycle are needed to neutralise this effect. The more N fertiliser is used, the greater is the lime requirement. In addition, some forms of nitrogen fertiliser acidify more than others (ammonium sulphate acidifies more than urea which acidifies more than calcium ammonium nitrate). Some soil tests include liming estimates to a target pH of 5.5, 6.0 and 6.5. The liming estimate aimed at a soil pH of 5.5 should be used where available, otherwise the guidelines in Table 2.14 can be applied. Lime is recommended when soil pH falls below 5.5 (Table 2.14) and when exchangeable Ca is below the critical value of 1.5 me% (Table 2.15). Discounts are necessary where mill byproducts have been used (Table 2.16).
Table 2.14: Lime guidelines for acid soils (when pHwater < 5.5).
CEC (meq/100 g) Suggested lime application (tonnes/ha)
< 2.0 1.25
2.0–4.0 2.5
4.0–8.0 4.0
> 8.0 5.0
Ca (meq/100 g) Suggested lime application (tonnes/ha)
> 0.2 3.0
0.2–0.4 2.5
0.4–0.6 2.0
0.6–0.8 1.5
0.8–1.1 1.0
1.1–1.5 0.5
Table 2.15: Ag lime guidelines based on exchangeable Ca (adapted from Calcino and others, 2000).
Table 2.16: Amounts of lime to be subtracted from lime appliaction rates following the use of mill byproducts.
Mud or mud/ash mixture (applied at 150 wet t/ha)
Subtract 2 t/ha Ag Lime from next application

26
Magnesium
Magnesium guidelines are based on soil-critical levels for exchangeable magnesium (Table 2.17). While a magnesium level of 10–20% of CEC is desirable, levels above 50% of CEC can occur on some soils. This may affect soil physical properties, making the soils prone to hard-setting and possibly causing germination difficulties. However, subsequent growth does not appear to be affected, provided all nutrients are above their critical levels and soil pH is above 5.5.
Table 2.17: Magnesium guidelines for plant crops (adapted from Calcino, 1994).
Sodium
Sodium does not need to be applied to sugarcane but needs to be reduced when the exchangeable sodium percentage (ESP) is above 5% of the CEC in the topsoil. Where this occurs it is suggested that subsoil samples be taken to determine ESP in the soil profile and specialist advice be sought on possible remedial activities. Gypsum is the normal ameliorant for sodic soils because it is relatively soluble. However, lime is an alternative on acidic soils. Rates of application are dependent on exchangeable sodium percentage (ESP). Guidelines are provided in Table 2.18.
Table 2.18: Gypsum requirement for sodic soils (see Nelson, 2000).
Micronutrients
Copper and zinc guidelines are based on previously determined soil critical values (Table 2.19). The BSES zinc test is appropriate for acidic soils. The DTPA soil test should be used if soil pH is greater than 6.5. In this booklet, only DTPA results have been reported. Copper and zinc are most often required on low CEC and very sandy soils. Leaf analysis is also a suitable method of diagnosing whether micronutrient applications are required. Heavy applications of Ag lime may induce deficiencies, particularly of zinc, when micronutrient levels are marginal.
Soil test (me% Mg) < 0.05 0.06–0.10 0.11–0.15 0.16–0.20 0.21–0.25 > 0.25
Mg rate (kg/ha) 150 125 100 75 50 0
ESP (%) Gypsum rate (tonnes/ha)
< 5 0
5–10 2
10–15 4
> 15 6

Soil-Specific Nutrient Management Guidelines
27
Table 2.19: Copper and zinc guidelines (see Calcino and others, 2000).
Micronutrient Soil test value Suggested application rate
DTPA soil test
Copper < 0.2 mg Cu/kg 10 kg Cu/ha once per crop cycle
Zinc < 0.3 mg Zn/kg 10 kg Zn/ha once per crop cycle
BSES zinc test
Zinc < 0.6 mg Zn/kg 10 kg Zn/ha once per crop cycle
Sulphuric acid (0.005M)
Calcium chloride (0.01M)
Rating Suggested application
rate
Si (mg/kg)
< 70 and < 10 Low
Calcium silicate at 4 t/haor
Cement at 3 t/haor
Mill mud/ash at 150 wet t/ha
Silicon
Two soil tests are appropriate for assessing silicon deficiencies. These are based on calcium chloride extractable Si and dilute sulphuric acid extractable Si. The latter is sometimes referred to as BSES-Si. Ameliorants are only required if both of the Si test values are low (Table 2.20). Leaf analysis is appropriate for assessing whether crops have been able to take up adequate amounts of Si.
Table 2.20: Silicon guidelines for plant cane (Calcino and others, 2001; Berthelsen and others, 1999).

28
Chapter 3
This chapter presents information on the location, appearance, properties and management requirements of the main soils producing cane in the Mackay district. The 51 soil mapping units described in the Mackay sugarcane land suitability study have been condensed into different soil groups based on colour and texture (Table 3.1). These groups have been further condensed into 13 productivity groups (Table 3.1; Figure 3.1).
Table 3.1: Classification and grouping of Mackay cane producing soils.
* An asterisk indicates the mapping units that were selected as representative of the soil group. Prod. Class is the class of productivity for each soil – Class 1 describes a soil with a high productivity potential, while Class 5 describes a soil with a very poor productivity potential. Page numbers indicate where descriptions of particular soils can be found in this booklet.
Description of Mackay sugarcane soils and guidelines for their management
Productivity group
Soil groups and brief description
Mapping unit
Australian Soil Classification
Area (%)
Prod. Class
Page
Yellow-red podzolic
Clay loam Uruba Chromosol 1.5 3-4
Sandy loamMunbura Chromosol 0.7 3
Kuttabul* Chromosol 3.9 3 35
Yellow-gleyed podzolic
Sandy clay loamDunwold Chromosol 2.6 3
Gargett Chromosol 2.6 3
Sandy loam (alluvial) Mirani* Chromosol 2.7 3 37
Sand Neils Chromosol 0.2 3
PodzolicSandy clay loam (alluvial)
Marian* Chromosol 4.6 1-2 39

Soil-Specific Nutrient Management Guidelines
Continued
29
Productivity group
Soil groups and brief description
Mapping unit
Australian Soil Classification
Area (%)
Prod. Class
Page
Soloth
Sandy clay loam
Whiptail Sodosol 3.1 3
Mentmore Sodosol 2.7 3-4
Belmunda Sodosol 0.8 3-4-5
Balberra Sodosol 1.1 3
Ossa* Sodosol 4.2 3 41
Seaforth Sodosol 0.8 3
Pindi* Sodosol 3.9 3 43
PalmyraSodosol or Kurosol
0.5 3
AllandaleSodosol or Kurosol
0.2 3
Loamy sand KinchantSodosol or Kurosol
1.1 4
Sandy clay loam (alluvial soil)
Sandiford* Sodosol 4.2 2-3 45
Solodic
Sandy clay loamWollingford* Sodosol 4.5 3 47
Jumper Sodosol 1.1 3
Sandy clay loam (alluvial)
Eton Sodosol 1 2
Narpi Sodosol 2.4 2-3
Calen* Sodosol 9 2 49
Silty clay loam (alluvial)
Sunnyside* Sodosol 3 3 51

30
Continued
Productivity group
Soil groups and brief description
Mapping unit
Australian Soil Classification
Area (%)
Prod. Class
Page
Prairie soils
ClayRoyston Dermosol 0.5 3
Netherdale Tenosol 0.6 3
Clay loam
Wagoora* Dermosol 2.1 2-3 53
Nabilla Dermosol 1.6 2-3
MartinDermosol to Chromosol
0.6 3
Kungurri Dermosol <0.1 3
Finch Hatton Dermosol 1.2 3
Glenella Dermosol 1.6 2-3
Kowari Dermosol 0.2 3
Sandy clay loam Habana Dermosol 1 3
Sandy clay loam (alluvial)
St Helens* Dermosol 1.7 1-2 55
Grey clayClay (alluvial)
Brightley* Vertosol 5.7 2 57
Benholme Vertosol 0.8 3
Dundula Vertosol 1 3
Clay Etowrie Dermosol 1.1 2-3
Black earthBlack clay (alluvial)
Victoria Plains*
Vertosol 7.2 2 59
Black brown clay Silent Grove Vertosol 2 2-3
Non-calcic brown soils
Sandy clay loam Farleigh Chromosol 1.9 3
Sandy clay loam (alluvial)
Pioneer* Chromosol 1.8 1 61
Alluvial soilsSandy clay loam
Cameron*Rudosol or Kandosol
2.1 2-3 63
Tanallo Kandosol 0.9 3
Loamy sand Murray Rudosol 1 3-4

Soil-Specific Nutrient Management Guidelines
31
Continued
Productivity group
Soil groups and brief description
Mapping unit
Australian Soil Classification
Area (%)
Prod. Class
Page
Yellow earth Sandy loam Mulei Kandosol 0.2 3
Krasnozem Clay Pinnacle Ferrosol 0.1 2
Sands or dunes
Sand
Marwood* Chromosol 0.2 3 65
Andergrove Tenosol 0.8 4
Septimus Tenosol <0.1 3
Frontal dunes Rudosol 0.3 5
32
Figure 3.1: Map of the Mackay district showing the major productivity groups mapped at a scale of 1:250,000.
Alluvial
Black Earth
Grey Clay
Non-Calcic Brown
Podzolic
Prairie
Solodic
Soloth
Mangrove Mud
Sand and Dunes
Gullied lands
Major soil groups

Soil-Specific Nutrient Management Guidelines
33
Location of soils
Each soil is found in a particular part of the landscape. One Mackay landscape section is shown in Figure 3.2. It illustrates where each soil group occurs and its relationship to the river system and different topographic features.
Figure 3.2: Example of a landscape representation of the alluvial plains in the Mackay district.
Pioneer River
Channel benches and active levees
Old levees associated with larger rivers
Slightly elevated terraces
Lowest part of the landscape/back swamp
Pioneer MiraniMarian BrightleyCalen Victoria Plains

34
Soil reference sites
Sixteen soil reference sites representative of the major soil groups were established and are indicated by asterisks in Table 3.1. Profiles were excavated for describing field appearance of each soil type. Representative topsoil (0–20 cm) and subsoil (40–60 cm) samples were taken from the surrounding cane area. These samples were analysed in laboratories for a range of chemical and physical properties.
In the rest of this chapter, information on the occurrence, formation, field appearance and chemical and physical properties of these 16 soils are provided in a two-page format. Bar graphs are used to represent the soil analytical data on a scale from very low to very high for each reference site and for similar soils sampled on growers’ farms. Guidelines are given for the management of nutrient applications, tillage, water and environmental risks. Nutrient management guidelines are provided for different crop classes, such as fallow plant, replant and ratoons. However, specific nutrient guidelines following the use of legume crops and mill byproducts are not included and readers need to refer to the information in Chapter 2. The nutrient management guidelines are for the reference sites. They are only intended to be used as a guide for nutrient inputs when recent soil and/or leaf tests are not available for specific blocks.
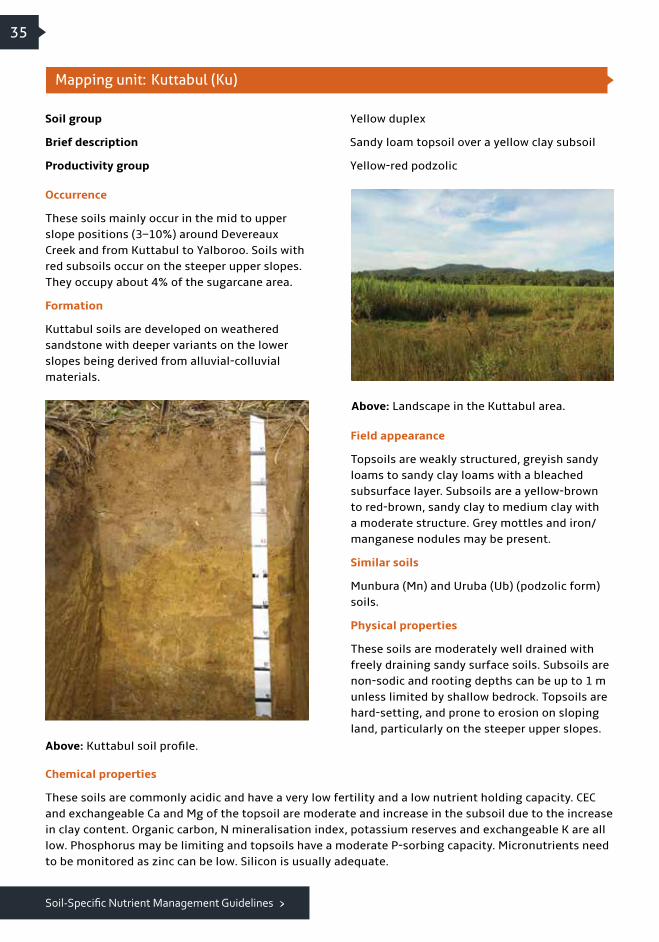
Soil-Specific Nutrient Management Guidelines
35
Soil group Yellow duplex
Brief description Sandy loam topsoil over a yellow clay subsoil
Productivity group Yellow-red podzolic
Mapping unit: Kuttabul (Ku)
Above: Kuttabul soil profile.
Field appearance
Topsoils are weakly structured, greyish sandy loams to sandy clay loams with a bleached subsurface layer. Subsoils are a yellow-brown to red-brown, sandy clay to medium clay with a moderate structure. Grey mottles and iron/manganese nodules may be present.
Similar soils
Munbura (Mn) and Uruba (Ub) (podzolic form) soils.
Physical properties
These soils are moderately well drained with freely draining sandy surface soils. Subsoils are non-sodic and rooting depths can be up to 1 m unless limited by shallow bedrock. Topsoils are hard-setting, and prone to erosion on sloping land, particularly on the steeper upper slopes.
Occurrence
These soils mainly occur in the mid to upper slope positions (3–10%) around Devereaux Creek and from Kuttabul to Yalboroo. Soils with red subsoils occur on the steeper upper slopes. They occupy about 4% of the sugarcane area.
Formation
Kuttabul soils are developed on weathered sandstone with deeper variants on the lower slopes being derived from alluvial-colluvial materials.
Above: Landscape in the Kuttabul area.
Chemical properties
These soils are commonly acidic and have a very low fertility and a low nutrient holding capacity. CEC and exchangeable Ca and Mg of the topsoil are moderate and increase in the subsoil due to the increase in clay content. Organic carbon, N mineralisation index, potassium reserves and exchangeable K are all low. Phosphorus may be limiting and topsoils have a moderate P-sorbing capacity. Micronutrients need to be monitored as zinc can be low. Silicon is usually adequate.

36
Nutrient management guidelines based on the reference site data
* increase soil pH** low calcium
Tillage and water management
These soils are usually easy to cultivate in order to obtain a good tilth. However, topsoils are hard-setting and prone to compaction which can be confined to the inter-rows with controlled traffic and minimal tillage. Green cane trash blanketing and the application of organic amendments can improve soil structure, tilth and soil porosity. Furrow irrigation is not suitable due to excessive slope. Overhead spray or trickle irrigation is a suitable option. Readily available water is moderately low (50–70 mm).
Environmental risk management
The surface soil is susceptible to erosion due to the high proportion of fine sand in the surface soil and the degree of slope. Care should be taken to ensure correct row direction and contouring where necessary on sloping ground. Minimum tillage, trash blanketing and grassed headlands and drains should be used to reduce the risk of erosion.
Crop situation
Lime t/ha*
N kg/ha
P kg/ha
K kg/ha
S kg/ha
Ca kg/ha**
Mg kg/ha
Cu kg/ha
Zn kg/ha
Fallow plant 4 140 20 100 0 200 0 0 0
Replant 4 160 20 120 0 200 0 0 0
Ratoon 0 160 10 120 0 0 0 0 0
Reference site and grower soil sample data
Reference site soil test values Median values from other sites
V L
ow
Lo
w
Mo
der
ate
Hig
h
V H
igh
Clay
Org
C
N m
in in
dex pH
CEC
Nit
ric
K
Exch
K
Exch
Ca
Exch
Mg
ESP
Aci
d s
at S
BSE
S P
PB
I
Zn Cu
Si (
H2S
O4)
Si (
CaCl
2)

Soil-Specific Nutrient Management Guidelines
37
Soil group Yellow duplex
Brief description Sandy loam topsoil over a mottled yellow-grey clay subsoil
Productivity group Yellow-gleyed podzolic
Mapping unit: Mirani (Mi)
Above: Mirani soil profile.
Field appearance
Topsoils are massive, brown-grey sandy loams to sandy clay loams with a bleached subsurface layer. Subsoils are mottled yellow or grey medium clays with a moderate structure. Iron and manganese nodules sometimes occur in the subsoil.
Similar soils
Dunwold (Du), Marian (Ma) and Gargett (Ga) soils.
Physical properties
These soils are imperfectly drained due to the slowly draining subsoil. Topsoils can be intermittently waterlogged and they are also prone to hard-setting and compaction. These soils can have a rooting depth of 1 m but this can be affected by waterlogging.
Occurrence
Mirani soils are found around Mirani and the coastal area south of the Pioneer River. They occur on old river levees on the alluvial plains and occupy about 3% of the sugarcane area.
Formation
Mirani soils have formed from alluvium. Most Mirani soils are found some distance from the nearest watercourse and often occur on slightly elevated plains.
Above: Landscape south-west of Mirani.
Chemical properties
These soils are acidic to neutral. The organic carbon and N mineralisation potential are low. The CEC of the topsoils is low, and although exchangeable K values are generally low, the reserves of potassium are moderate. Exchangeable Ca and Mg levels are moderate. BSES P values depend on previous fertiliser management and are usually moderate. Topsoils have low P-sorbing capacity. Low sulphur has been found at some sites. Micronutrients need to be monitored as zinc can be low. Silicon values are adequate.

38
Nutrient management guidelines based on the reference site data
* increase soil pH
Tillage and water management
These soils have a good moisture range for tillage and it is easy to obtain a good tilth. They are, however, hard-setting and prone to compaction, which can be reduced with controlled traffic and minimum tillage. Green cane trash blanketing and the application of organic amendments can improve surface soil structure, tilth and soil porosity. Laser grading and possibly subsurface drainage are required to avoid waterlogging where the topography is flat. Overhead irrigation is recommended due to the sandy topsoil and water applications should be frequent and of short duration to avoid waterlogging. Readily available water is moderately low (50–70 mm).
Environmental risk management
Loss of nitrate by denitrification can occur during wet periods or over-irrigation, which may result in a perched watertable. To reduce this risk, it is recommended that fertiliser applications be split, when possible.
Crop situation
Lime t/ha*
N kg/ha
P kg/ha
K kg/ha
S kg/ha
Ca kg/ha
Mg kg/ha
Cu kg/ha
Zn kg/ha
Fallow plant 2.5 140 20 80 0 0 0 0 0
Replant 2.5 160 20 100 0 0 0 0 0
Ratoon 0 160 10 100 0 0 0 0 0
Reference site and grower soil sample data
Reference site soil test values Median values from other sites
V L
ow
Lo
w
Mo
der
ate
Hig
h
V H
igh
Clay
Org
C
N m
in in
dex pH
CEC
Nit
ric
K
Exch
K
Exch
Ca
Exch
Mg
ESP
Aci
d s
at S
BSE
S P
PB
I
Zn Cu
Si (
H2S
O4)
Si (
CaCl
2)

Soil-Specific Nutrient Management Guidelines
39
Soil group Brown duplex
Brief description Sandy clay loam topsoil over a brown clay subsoil
Productivity group Podzolic
Mapping unit: Marian (Ma)
Above: Marian soil profile.
Field appearance
Topsoils are massive, grey sandy clay loams and may have a bleached subsurface layer. Subsoils are yellow-brown medium clays with a moderate structure. Some grey and brown mottles also occur.
Similar soils
Marian yellow B horizon variant (Ma 1), Dunwold (Du), Gargett (Ga) and Mirani (Mi) soils.
Physical properties
These soils range from moderately well drained to imperfectly drained depending on subsoil texture and slope. Topsoils are hard-setting and can be prone to compaction. These soils can have a rooting depth of 1 m.
Occurrence
Marian soils occur extensively along the Pioneer River and Cattle Creek. They occupy back slopes of levees where they are associated with Pioneer soils, and slightly elevated areas on the alluvial plain where they are associated with Calen soils. They occupy about 5% of the sugarcane area in the Mackay district.
Formation
Marian soils are formed from alluvium of mixed parent material deposited during flood events.
Above: Floodplain landscape with Marian soils.
Chemical properties
These soils are moderately fertile. The organic carbon and N mineralisation index are low. The CEC of the topsoil is moderate, while exchangeable Ca and Mg levels are low to moderate. Although exchangeable K values are generally low, the reserves of potassium are quite high. BSES P for the reference site is moderate but the median of grower sites have a very high BSES P, reflecting the different fertiliser history. Topsoils have a low P-sorbing capacity. Sulphur values are low and should be monitored. Zinc may also need to be monitored as it is low at some locations.

40
Nutrient management guidelines based on the reference site data
* increase soil pH** low calcium
Tillage and water management
These soils are hard-setting and prone to compaction, which can be alleviated with controlled traffic and minimum tillage. Green cane trash blanketing and application of organic amendments can improve surface soil structure, tilth and soil porosity. Most areas are suitable for furrow or overhead irrigation. Where soils are imperfectly drained, laser grading can improve surface drainage to reduce waterlogging. Readily available water is moderate (60–80 mm).
Environmental risk management
Loss of nitrogen by denitrification can occur, particularly when heavy rain or flooding occurs shortly after N application.
Reference site and grower soil sample data
Reference site soil test values Median values from other sites
V L
ow
L
ow
M
od
erat
e
Hig
h
V H
igh
Crop situation
Lime t/ha*
N kg/ha
P kg/ha
K kg/ha
S kg/ha
Ca kg/ha**
Mg kg/ha
Cu kg/ha
Zn kg/ha
Fallow plant 2.5 140 20 80 15 600 0 0 0
Replant 2.5 160 20 100 15 600 0 0 0
Ratoon 0 160 10 100 15 0 0 0 0
Clay
Org
C
N m
in in
dex pH
CEC
Nit
ric
K
Exch
K
Exch
Ca
Exch
Mg
ESP
Aci
d s
at S
BSE
S P
PB
I
Zn Cu
Si (
H2S
O4)
Si (
CaCl
2)
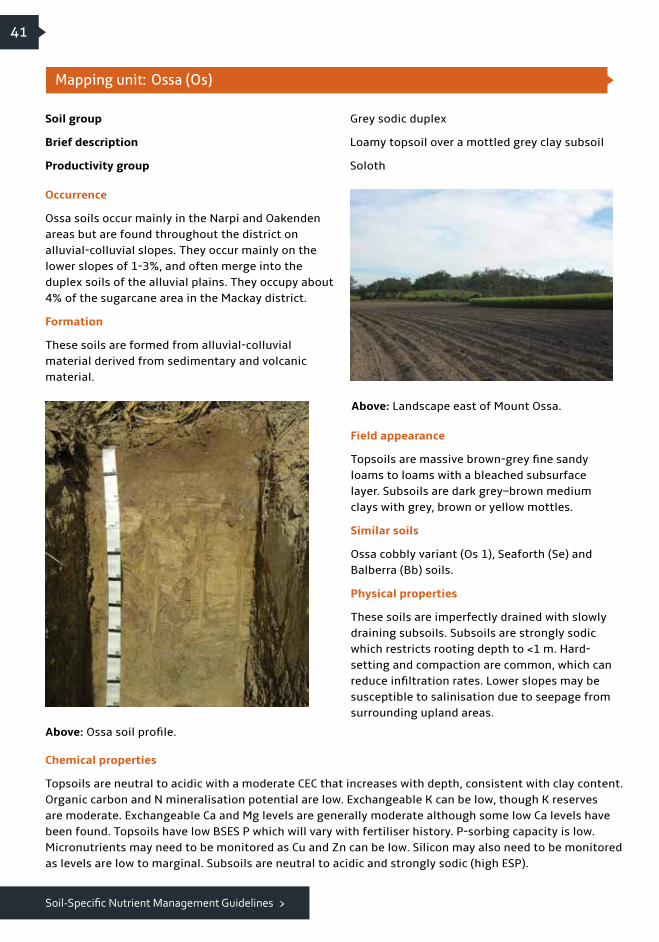
Soil-Specific Nutrient Management Guidelines
41
Soil group Grey sodic duplex
Brief description Loamy topsoil over a mottled grey clay subsoil
Productivity group Soloth
Mapping unit: Ossa (Os)
Above: Ossa soil profile.
Field appearance
Topsoils are massive brown-grey fine sandy loams to loams with a bleached subsurface layer. Subsoils are dark grey–brown medium clays with grey, brown or yellow mottles.
Similar soils
Ossa cobbly variant (Os 1), Seaforth (Se) and Balberra (Bb) soils.
Physical properties
These soils are imperfectly drained with slowly draining subsoils. Subsoils are strongly sodic which restricts rooting depth to <1 m. Hard-setting and compaction are common, which can reduce infiltration rates. Lower slopes may be susceptible to salinisation due to seepage from surrounding upland areas.
Occurrence
Ossa soils occur mainly in the Narpi and Oakenden areas but are found throughout the district on alluvial-colluvial slopes. They occur mainly on the lower slopes of 1-3%, and often merge into the duplex soils of the alluvial plains. They occupy about 4% of the sugarcane area in the Mackay district.
Formation
These soils are formed from alluvial-colluvial material derived from sedimentary and volcanic material.
Above: Landscape east of Mount Ossa.
Chemical properties
Topsoils are neutral to acidic with a moderate CEC that increases with depth, consistent with clay content. Organic carbon and N mineralisation potential are low. Exchangeable K can be low, though K reserves are moderate. Exchangeable Ca and Mg levels are generally moderate although some low Ca levels have been found. Topsoils have low BSES P which will vary with fertiliser history. P-sorbing capacity is low. Micronutrients may need to be monitored as Cu and Zn can be low. Silicon may also need to be monitored as levels are low to marginal. Subsoils are neutral to acidic and strongly sodic (high ESP).

42
Nutrient management guidelines based on the reference site data
* increase soil pH** low calcium*** calcium silicate at 4 t/ha or cement at 3 t/ha or mill ash at 150 wet t/ha
Tillage and water management
Topsoils are hard-setting and prone to compaction that can be alleviated by adopting controlled traffic and minimum tillage. Green cane trash blanketing and the application of organic amendments can improve soil structure, tilth and soil porosity. Furrow irrigation is not suitable due to excessive slope. These soils require frequent overhead or trickle irrigation. Rates should be low as readily available water capacities are low (40–60 mm) and infiltration rates are generally slow.
Environmental risk management
Ossa soils that occur on slopes up to 4% are moderately erodible. This can be controlled by making use of minimum tillage, trash blanketing, contour farming and grass headlands and drains. Loss of nitrogen by denitrification is a risk on lower slope positions that become intermittently waterlogged.
Reference site and grower soil sample data
Reference site soil test values Median values from other sites
Crop situation
Lime t/ha*
N kg/ha
P kg/ha
K kg/ha
S kg/ha
Ca kg/ha**
Mg kg/ha
Cu kg/ha
Zn kg/ha
Si
t/ha***
Fallow plant 2.5 140 20 50 0 200 0 10 0 Yes
Replant 2.5 160 20 100 0 200 0 10 0 Yes
Ratoon 0 160 10 100 0 0 0 10 0 0
V L
ow
L
ow
M
od
erat
e
Hig
h
V H
igh
Clay
Org
C
N m
in in
dex pH
CEC
Nit
ric
K
Exch
K
Exch
Ca
Exch
Mg
ESP
Aci
d s
at S
BSE
S P
PB
I
Zn Cu
Si (
H2S
O4)
Si (
CaCl
2)

Soil-Specific Nutrient Management Guidelines
43
Soil group Gravelly yellow sodic duplex
Brief description Gravelly sandy clay loam topsoil over a mottled yellow clay
Productivity group Soloth
Mapping unit: Pindi (Pi)
Above: Pindi soil profile.
Field appearance
Topsoils are massive brown-grey sandy clay loams with abundant iron-stained gravels and a bleached subsurface layer. Subsoils are coarsely structured, yellow-brown medium clays with grey and red mottles. Iron-stained gravels also occur in the lower subsoil.
Similar soils
Palmyra (Pa) and Seaforth (Se) soils.
Physical properties
These soils are imperfectly drained with slowly draining subsoils. Subsoils are strongly sodic which restricts the rooting depth to <1 m. The topsoils are hard-setting, usually with many stones and gravels and are prone to compaction and erosion.
Occurrence
Pindi soils occur on crests and hillslopes (slopes 3 to 6%) from Yalbaroo to Calen, south of Walkerston, from Brightley to Eton and at Kungurri. Pindi and Jumper soils are closely associated. Rock bars with shallow stony soils are common. They occupy about 4% of the sugarcane area in the Mackay district.
Formation
Pindi soils have developed on weathered fine-grained sedimentary rocks.
Above: Landscape north of Pindi Pindi.
Chemical properties
Topsoils are moderately to strongly acidic. Fertility is low due to the shallow sandy, gravelly topsoil. Topsoil CEC and exchangeable Ca and Mg are moderate although the organic carbon content and the levels of sulphur and exchangeable K are low. Reserves of K are generally low. Although the reference site has moderate BSES P, this value will vary according to fertiliser history. Topsoils have low P-sorbing capacities. Copper may need to be monitored as low to marginal levels have been recorded at some locations. Silicon is adequately supplied. Subsoils are neutral to acidic and are strongly sodic (high ESP).

44
Nutrient management guidelines based on the reference site data
* increase soil pH** low calcium
Tillage and water management
Topsoils are hard-setting and prone to compaction that can be alleviated by adopting controlled traffic and minimum tillage. Green cane trash blanketing and the application of organic amendments can improve soil structure, tilth and porosity. Furrow irrigation is not suitable due to excessive slope and rockiness. These soils require frequent overhead irrigation as the readily available water capacity is low (40–60 mm). Trickle irrigation may not be suitable due to the gravels and rocky outcrops.
Environmental risk management
These soils are highly erodible and run-off is the major nutrient loss pathway. Care should be taken to ensure correct row direction and contouring where necessary on sloping ground. Minimum tillage, trash blanketing and grassed headlands and drains are also recommended to minimise erosion and run-off losses.
Reference site and grower soil sample data
Reference site soil test values Median values from other sites
Crop situation
Lime t/ha*
N kg/ha
P kg/ha
K kg/ha
S kg/ha
Ca kg/ha**
Mg kg/ha
Cu kg/ha
Zn kg/ha
Fallow plant 2.5 140 20 100 15 400 0 0 0
Replant 2.5 160 20 120 15 400 0 0 0
Ratoon 0 160 0 120 15 0 0 0 0
V L
ow
L
ow
M
od
erat
e
Hig
h
V H
igh
Clay
Org
C
N m
in in
dex pH
CEC
Nit
ric
K
Exch
K
Exch
Ca
Exch
Mg
ESP
Aci
d s
at S
BSE
S P
PB
I
Zn Cu
Si (
H2S
O4)
Si (
CaCl
2)

Soil-Specific Nutrient Management Guidelines
45
Soil group Yellow sodic duplex
Brief description Sandy clay loam topsoil over a mottled yellow clay subsoil
Productivity group Soloth
Mapping unit: Sandiford (Sa)
Above: Sandiford soil profile.
Field appearance
Topsoils are massive grey-brown sandy clay loams with a bleached subsurface layer. Subsoils are yellow to grey medium clays with yellow, brown or grey mottles and a coarse structure. The subsoil may be underlain by buried layers of sand.
Similar soils
Mirani (Mi), Marian (Ma), Sunnyside (Su) and Calen (Cl) soils.
Physical properties
These soils are imperfectly drained and topsoils can be intermittently waterlogged. Subsoils can be sodic at depth, which generally does not limit rooting depth but can restrict water movement. Topsoils are prone to hard-setting and compaction. Some areas may be susceptible to salinisation caused by saltwater intrusion.
Occurrence
Sandiford soils mostly occur on the level alluvial plains south of the Pioneer River, around Bakers and Sandy Creeks. They are closely associated with Calen soils. They occupy about 4% of the sugarcane area in the Mackay district.
Formation
Sandiford soils have formed from floods depositing sands, silt and clay over a long period of time.
Above: Landscape between Rosella and Homebush.
Chemical properties
Topsoils are moderately acidic with moderate CEC that increases with depth and is consistent with an increase in clay content. Exchangeable Ca and Mg levels are also moderate. Organic carbon is very low and the N mineralisation index is low. Exchangeable K and sulphur levels are low. Reserves of K are
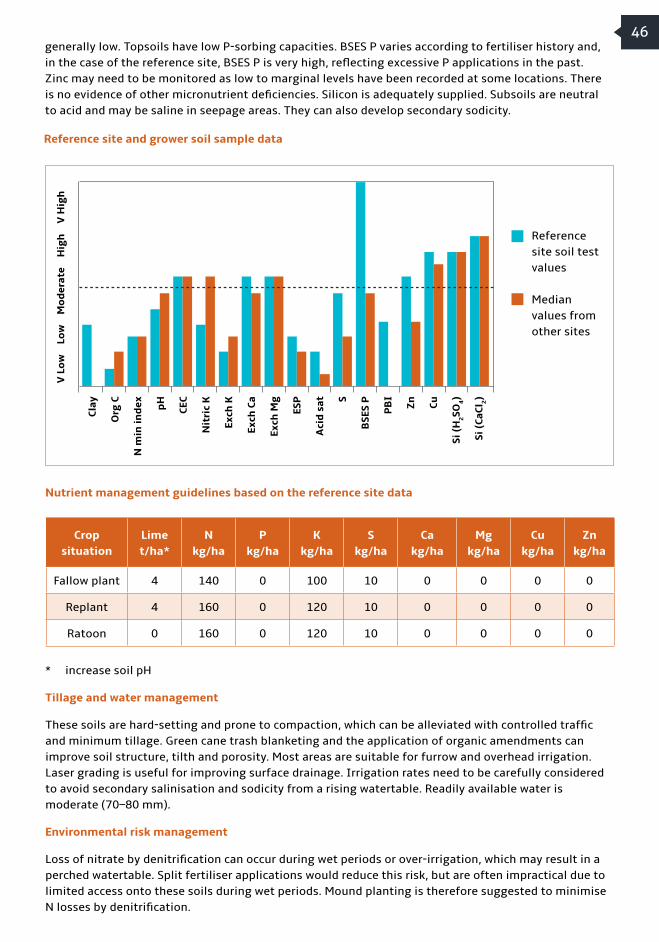
46
Nutrient management guidelines based on the reference site data
* increase soil pH
Tillage and water management
These soils are hard-setting and prone to compaction, which can be alleviated with controlled traffic and minimum tillage. Green cane trash blanketing and the application of organic amendments can improve soil structure, tilth and porosity. Most areas are suitable for furrow and overhead irrigation. Laser grading is useful for improving surface drainage. Irrigation rates need to be carefully considered to avoid secondary salinisation and sodicity from a rising watertable. Readily available water is moderate (70–80 mm).
Environmental risk management
Loss of nitrate by denitrification can occur during wet periods or over-irrigation, which may result in a perched watertable. Split fertiliser applications would reduce this risk, but are often impractical due to limited access onto these soils during wet periods. Mound planting is therefore suggested to minimise N losses by denitrification.
Reference site and grower soil sample data
Reference site soil test values Median values from other sites
Crop situation
Lime t/ha*
N kg/ha
P kg/ha
K kg/ha
S kg/ha
Ca kg/ha
Mg kg/ha
Cu kg/ha
Zn kg/ha
Fallow plant 4 140 0 100 10 0 0 0 0
Replant 4 160 0 120 10 0 0 0 0
Ratoon 0 160 0 120 10 0 0 0 0
generally low. Topsoils have low P-sorbing capacities. BSES P varies according to fertiliser history and, in the case of the reference site, BSES P is very high, reflecting excessive P applications in the past. Zinc may need to be monitored as low to marginal levels have been recorded at some locations. There is no evidence of other micronutrient deficiencies. Silicon is adequately supplied. Subsoils are neutral to acid and may be saline in seepage areas. They can also develop secondary sodicity.
V L
ow
L
ow
M
od
erat
e
Hig
h
V H
igh
Clay
Org
C
N m
in in
dex pH
CEC
Nit
ric
K
Exch
K
Exch
Ca
Exch
Mg
ESP
Aci
d s
at S
BSE
S P
PB
I
Zn Cu
Si (
H2S
O4)
Si (
CaCl
2)

Soil-Specific Nutrient Management Guidelines
47
Soil group Grey sodic duplex
Brief description Sandy clay loam topsoil over a mottled grey clay subsoil
Productivity group Solodic
Mapping unit: Wollingford (Wo)
Above: Wollingford soil profile.
Field appearance
Topsoils are massive brown-grey loams or sandy clay loams with a bleached subsurface layer. Subsoils are grey medium clays with many yellow mottles and a coarse structure. Lime nodules are also present in the lower subsoil.
Similar soils
Jumper (Jm) and Whiptail (Wh) soils.
Physical properties
These soils are slowly permeable and imperfectly drained. Subsoils are sodic, which restricts subsoil drainage but generally does not limit rooting depth. However, shallow bedrock can limit rooting depth to less than 1 m. They are prone to hard-setting and can be subject to erosion, depending upon slope. Lower slope positions may be susceptible to salinisation due to saline seepage from surrounding upland areas.
Occurrence
Wollingford soils occur on upper slopes (4–6%) throughout the Mackay district. They are closely associated with Whiptail soils. Wollingford soils occupy about 4% of the sugarcane area in the Mackay district.
Formation
Wollingford soils are developed on weathered acid volcanic rocks.
Above: Landscape in the Mia Mia area.
Chemical properties
Topsoils are neutral to acidic with a high CEC and high exchangeable Ca and Mg levels. Organic carbon is low and N mineralisation index is moderate. Although exchangeable K is usually low, very high K reserves have been recorded. Topsoils have low to moderate P-sorbing capacities. BSES P varies according to fertiliser history and, in the case of the reference site, BSES P is very high, reflecting excessive P applications in the past. Zinc may need to be monitored as low to marginal levels have been recorded. There is no evidence of other micronutrient deficiencies. Silicon is adequately supplied. Subsoils are alkaline and sodic, and saline in seepage areas.

48
Nutrient management guidelines based on the reference site data
* increase soil pH
Tillage and water management
Topsoils are prone to hard-setting and compaction, which can be alleviated by adopting controlled traffic and minimum tillage. Green cane trash blanketing will improve soil structure, tilth and porosity. Furrow irrigation is not suitable due to excessive slope. These soils require frequent applications of overhead irrigation at low rates. This recommendation is based on the low readily available water capacity of 40 to 60 mm, and will help avoid waterlogging. Salinity may develop in lower slope positions with excessive irrigation.
Environmental risk management
These soils have a moderate to high erosion hazard that can be reduced by minimum tillage, trash blanketing, contour farming, and grassed headlands and drains. Without erosion control measures there is a risk of off-site movement of sediment and attached nutrients. Secondary salinisation and seep development is possible in lower slope positions. Loss of nitrogen by denitrification is a risk on lower positions due to waterlogging resulting from the slowly permeable sodic subsoils. Split fertiliser applications are recommended to reduce these losses.
Reference site and grower soil sample data
Reference site soil test values Median values from other sites
Crop situation
Lime t/ha*
N kg/ha
P kg/ha
K kg/ha
S kg/ha
Ca kg/ha
Mg kg/ha
Cu kg/ha
Zn kg/ha
Fallow plant 5 130 0 100 5 0 0 0 0
Replant 5 150 0 100 5 0 0 0 0
Ratoon 0 150 0 100 5 0 0 0 0
V L
ow
L
ow
M
od
erat
e
Hig
h
V H
igh
Clay
Org
C
N m
in in
dex pH
CEC
Nit
ric
K
Exch
K
Exch
Ca
Exch
Mg
ESP
Aci
d s
at S
BSE
S P
PB
I
Zn Cu
Si (
H2S
O4)
Si (
CaCl
2)

Soil-Specific Nutrient Management Guidelines
49
Soil group Grey sodic duplex
Brief description Sandy clay loam topsoil over a mottled grey clay subsoil
Productivity group Solodic
Mapping unit: Calen (Cl)
Above: Calen soil profile.
Field appearance
Topsoils are massive grey sandy clay loams with a bleached subsurface layer. Subsoils are grey medium clays with many yellow- brown mottles and a coarse structure. Iron-manganese and lime nodules may also be present in the lower subsoil.
Similar soils
Narpi (Nr), Eton (Eo), Sunnyside (Su) and Sandiford (Sa) soils.
Physical properties
These soils are slowly permeable and imperfectly drained and therefore prone to intermittent waterlogging. Subsoils are sodic to strongly sodic at depth, which can limit the rooting depth to less than 1 m and restrict subsoil drainage. The topsoil is hard-setting and prone to compaction. Some areas may be susceptible to salinisation due to saline seep from surrounding upland areas.
Occurrence
Calen soils occur on slightly elevated areas on alluvial plains and are usually found some distance from the nearest creek or river. They are located throughout the Mackay area but major occurrences are around Calen and Mount Pelion and south of the Pioneer River. They occupy about 9% of the sugarcane area in the Mackay district and also occur in the Proserpine cane area.
Formation
Calen soils have formed from floods depositing sands, silt and clay over a long period of time.
Above: Landscape in the Cannon Valley area.
Chemical properties
Topsoils are neutral to acidic, and can sometimes be sodic. They have moderate CEC and moderate exchangeable Ca and Mg contents. Organic carbon and N mineralisation index are low. Exchangeable K is low, although K reserves are moderate. Although the reference site has moderate BSES P, this value will vary according to fertiliser history. Topsoils have low P-sorbing capacity. Zinc may need to be

50
Nutrient management guidelines based on the reference site data
* increase soil pH** sodicity (ESP)
Tillage and water management
Topsoils are prone to hard-setting and compaction which can be alleviated by adopting controlled traffic and minimum tillage. Green cane trash blanketing will improve soil structure, tilth and porosity. These soils require frequent applications of overhead irrigation at low rates to avoid waterlogging and secondary salinity. Laser grading should be considered to prevent waterlogging on areas with a flat topography. However, care needs to be exercised to avoid exposure of the sodic subsoil. Readily available water is moderate (60–80 mm).
Environmental risk management
Loss of nitrate by denitrification can occur during wet periods or over-irrigation, which may result in a perched watertable. To reduce the risk of dentrification, it is recommended that fertiliser applications be split. A potential for off-site movement of suspended sediment in irrigation water exists, depending on the extent of the slope and drill length. Construction of tail drains and sediment traps could help to alleviate the problem.
Crop situation
Lime t/ha*
Gypsum t/ha**
N kg/ha
P kg/ha
K kg/ha
S kg/ha
Ca kg/ha
Mg kg/ha
Cu kg/ha
Zn kg/ha
Fallow plant 4 2 130 20 100 0 0 0 0 0
Replant 4 2 150 20 100 0 0 0 0 0
Ratoon 0 0 150 0 100 0 0 0 0 0
Reference site and grower soil sample data
Reference site soil test values Median values from other sites
If more than one ameliorant is suggested, then application rates need to be rationalised. In this case, gypsum is not required if lime is used.
monitored as low to marginal levels have been recorded. There is no evidence of other micronutrient deficiencies. Silicon is adequately supplied. Subsoils are neutral to alkaline, strongly sodic and can be saline in seepage areas.
V L
ow
L
ow
M
od
erat
e
Hig
h
V H
igh
Clay
Org
C
N m
in in
dex pH
CEC
Nit
ric
K
Exch
K
Exch
Ca
Exch
Mg
ESP
Aci
d s
at S
BSE
S P
PB
I
Zn Cu
Si (
H2S
O4)
Si (
CaCl
2)

Soil-Specific Nutrient Management Guidelines
51
Soil group Grey duplex
Brief description Silty clay loam topsoil over mottled grey, heavy clay subsoil
Productivity group Solodic
Mapping unit: Sunnyside (Su)
Above: Sunnyside soil profile.
Field appearance
Topsoils are massive brownish-grey silty clay loams with a bleached surface and/or subsurface layer. Subsoils are grey heavy clays with many yellow mottles and a good structure. Lime nodules occur in the lower subsoil.
Similar soils
Calen (Cl), Narpi (Nr), Eton (Eo) and Sandiford (Sa) soils.
Physical properties
These soils are slowly permeable and imperfectly drained and therefore prone to intermittent waterlogging. Subsoils may be sodic. The topsoil is prone to crusting and hard-setting due to the high silt content. Infiltration rates are therefore low. Some areas may be susceptible to salinisation due to saline seepage.
Occurrence
Sunnyside soils occur on the floodplains of Sandy and Alligator Creeks. These soils are most extensive in the Sunnyside area but there are other occurrences near Homebush and Dunrock. It often merges with Ossa and Balberra soils. They occupy about 3% of the sugarcane area in the Mackay district.
Formation
Sunnyside soils are formed by floods depositing silts and clay over a long period.
Above: Landscape in the Sunnyside area.
Chemical properties
Topsoils are acidic with high CEC and exchangeable Ca and Mg contents. Organic carbon and N mineralisation index are low. Potassium reserves and exchangeable K are moderate. Although the reference site has moderate BSES P, this will vary according to fertiliser history. Topsoils have low P-sorbing capacity. Zinc may need to be monitored as low to marginal levels have been recorded. There is no evidence of other micronutrient deficiencies. Silicon is adequately supplied. Subsoils are alkaline and can be saline if in a seepage area.

52
Nutrient management guidelines based on the reference site data
* increase soil pH
Tillage and water management
The silty hard-setting surface soil has a narrow moisture range for cultivation, making it difficult to obtain a good tilth if the soil is too wet or too dry. The risk of compaction can be reduced with controlled traffic and minimum tillage. Green cane trash blanketing greatly improves soil structure, tilth and porosity. Laser grading is useful to prevent waterlogging on the flat landscape. Furrow irrigation is widely used on these soils, but infiltration may be restricted because of the silty nature of the topsoil. A high frequency of irrigation is required. Tail-water recycle pits are recommended to reduce nutrient losses off-farm. Care needs to be taken when blocks are laser graded to avoid exposure of sodic subsoils. Readily available water is moderate (70–90 mm).
Environmental risk management
Loss of nitrate by denitrification, following heavy rainfall and over-irrigating, is the major nitrogen loss pathway. Split fertiliser applications may reduce this risk, but are often impractical due to limited access onto these soils during wet periods.
Crop situation
Lime t/ha*
N kg/ha
P kg/ha
K kg/ha
S kg/ha
Ca kg/ha
Mg kg/ha
Cu kg/ha
Zn kg/ha
Fallow plant 4 140 20 50 10 0 0 0 0
Replant 4 160 20 100 10 0 0 0 0
Ratoon 0 160 10 100 10 0 0 0 0
Reference site analysis data
Reference site soil test values Insufficient growers samples available
V L
ow
L
ow
M
od
erat
e
Hig
h
V H
igh
Clay
Org
C
N m
in in
dex pH
CEC
Nit
ric
K
Exch
K
Exch
Ca
Exch
Mg
ESP
Aci
d s
at S
BSE
S P
PB
I
Zn Cu
Si (
H2S
O4)
Si (
CaCl
2)

Soil-Specific Nutrient Management Guidelines
53
Soil group Brown gradational soil
Brief description Brown structured clay soil
Productivity group Prairie soil
Mapping unit: Wagoora (Wg)
Above: Wagoora soil profile.
Field appearance
Topsoils are well structured, dark brown clay loams to light clays often with some stones and cobbles. Subsoils are yellow- brown to brown medium clays and well structured. Weathered bedrock usually occurs below 0.6 m.
Similar soils
Glenella (Gl), Martin (Mr), Kungurri (Kn), and Finch Hatton (Fn) soils.
Physical properties
Wagoora soils are deep, well drained and have a relatively high plant available water capacity. Rooting depth can be in excess of 1 m, depending on bedrock depth. Some profiles contain cobbles and stones. These soils have a well-developed fine structure, but will compact if cultivated when wet.
Occurrence
Wagoora soils occur on mid-slopes (3 to 6%) mainly north of the Pioneer River. They are often associated with rock outcrops. Wagoora soils occupy about 2% of the sugarcane area.
Formation
Wagoora soils have developed on volcanic rocks.
Above: Landscape near the Bruce Highway between Calen and Mount Pelion.
Chemical properties
These soils are weakly acidic to neutral. The CEC and exchangeable Ca and Mg levels are high throughout the profile. The organic carbon content and N mineralisation index are both moderately high. Potassium reserves and exchangeable K levels are low. Topsoils have high P-sorbing capacity and some profiles have a very low available P, depending on fertiliser history. Sulphur values are moderate and micronutrients are well supplied.

54
Nutrient management guidelines based on the reference site data
Tillage and water management
Wagoora soils are friable and are easily tilled. However, they are prone to compaction if infield operations are carried out when too wet. This problem can be reduced by controlled traffic and minimum tillage. Green cane trash blanketing is recommended for maintaining soil organic matter levels, soil structure, tilth and porosity. These soils often occur on undulating landscapes, and overhead irrigation is recommended. Readily available water is high (90–100 mm).
Environmental risk management
These soils have a moderate to high erosion hazard that can be reduced by minimum tillage, trash blanketing, contour farming, and grassed headlands and drains. Without erosion control measures, there is a risk of off-site movement of sediment and nutrients.
Crop situation
Lime t/ha
N kg/ha
P kg/ha
K kg/ha
S kg/ha
Ca kg/ha
Mg kg/ha
Cu kg/ha
Zn kg/ha
Fallow plant 0 110 40 120 0 0 0 0 0
Replant 0 130 40 120 0 0 0 0 0
Ratoon 0 130 30 120 0 0 0 0 0
Reference site analysis data
Reference site soil test values Insufficient growers samples available
V L
ow
L
ow
M
od
erat
e
Hig
h
V H
igh
Clay
Org
C
N m
in in
dex pH
CEC
Nit
ric
K
Exch
K
Exch
Ca
Exch
Mg
ESP
Aci
d s
at S
BSE
S P
PB
I
Zn Cu
Si (
H2S
O4)
Si (
CaCl
2)

Soil-Specific Nutrient Management Guidelines
55
Soil group Loamy alluvial soil
Brief description Sandy clay loam over a dark brown clay subsoil
Productivity group Prairie soil
Mapping unit: St Helens (St)
Above: St Helens soil profile.
Field appearance
Topsoils are massive brown, sandy clay loams to light clays. Subsoils are dark brown, light to medium clays that are well structured. Subsoils usually overlie buried layers of sands, clays or gravels.
Similar soils
Pioneer (Pn).
Physical properties
These soils are permeable and well drained. They have a rooting depth usually in excess of 1 m and a good water holding capacity. These soils are weakly hard-setting and prone to compaction.
Occurrence
St Helens soils occur on the channel benches, levees and floodplains of the major streams such as St Helens, Cattle Creek, Owens Creek and the Pioneer River. They occupy about 2% of the sugarcane area in the Mackay district.
Formation
St Helens soils are formed from fine sands, silts and clay deposited during floods.
Above: Landscape near the bank of St Helens Creek near Calen.
Chemical properties
These soils are weakly acidic with a moderately high fertility. Topsoil CEC and exchangeable Ca and Mg levels are moderate. Exchangeable potassium levels are moderate but this soil has very high K reserves. Organic carbon levels and N mineralisation index are low to moderate. Topsoils have moderate P-sorbing capacity and high to very high BSES P content, depending on fertiliser history. Sulphur values are low to moderate. Micronutrients are well supplied and silicon levels are adequate.

56
Nutrient management guidelines based on the reference site data
* increase soil pH
Tillage and water management
These soils are only moderately friable and can become hard-setting. Green cane trash blanketing and applications of organic amendments will improve soil structure, tilth and porosity. As these soils are prone to compaction, controlled traffic and minimum tillage are recommended. They are well drained but prone to flooding. They are suited to furrow or overhead irrigation with medium to high flow rates required for furrow irrigation. Readily available water is moderate (60–80 mm).
Environmental risk management
Maintenance of soil cover is desirable as there is a risk of erosion with these soils. As flooding occurs, loss of nitrogen by denitrification is possible, so split applications of N are suggested. These soils will also be susceptible to N leaching as they are freely draining.
Crop situation
Lime t/ha*
N kg/ha
P kg/ha
K kg/ha
S kg/ha
Ca kg/ha
Mg kg/ha
Cu kg/ha
Zn kg/ha
Fallow plant 4 120 0 0 5 0 0 0 10
Replant 4 140 0 50 5 0 0 0 10
Ratoon 0 140 0 50 5 0 0 0 0
Reference site and grower soil sample data
Reference site soil test values Median values from other sites
V L
ow
L
ow
M
od
erat
e
Hig
h
V H
igh
Clay
Org
C
N m
in in
dex pH
CEC
Nit
ric
K
Exch
K
Exch
Ca
Exch
Mg
ESP
Aci
d s
at S
BSE
S P
PB
I
Zn Cu
Si (
H2S
O4)
Si (
CaCl
2)

Soil-Specific Nutrient Management Guidelines
57
Soil group Grey cracking clay
Brief description Grey cracking clay
Productivity group Grey clay
Mapping unit: Brightley (Bt)
Above: Brightley soil profile after tillage.
Field appearance
Topsoils are grey to black, self-mulching light clays. Subsoils are well-structured, grey medium clays often with yellow or brown mottles at depth. Lime nodules are also present in the lower subsoil.
Similar soils
Benholme (Bh) and Dundula (Dn) soils.
Physical properties
These soils have a low permeability, are poorly drained and can remain wet for long periods. They are also subject to flooding due to their position in the landscape. Rooting depth is usually at least 1 m and they have a high water-holding capacity. Topsoils are weakly self-mulching and crack strongly in the dry season. They are also prone to compaction if infield operations are conducted when too wet. Some areas may be susceptible to secondary salinisation due to saline seep from surrounding upland areas. Sodic subsoils can occur at some locations.
Occurrence
Brightley soils occur on back plains and low-lying depressions on the floodplains and creek flats throughout the Mackay region. These soils occupy about 6% of the sugarcane area in the Mackay district.
Formation
Brightley soils are formed by floods depositing mainly silts and clays. Most of these soils are located some distance from the nearest creek or river.
Above: Landscape to the west of Eton.
Chemical properties
The topsoils are slightly acidic and have moderate to high fertility. The CEC and exchangeable cations are very high and are dominated by Ca and Mg. The organic carbon content and N mineralisation index are low. Potassium reserves are very high while exchangeable K is moderate. Although the reference site has a very low BSES P, this value will vary according to fertiliser history. Topsoils have low P-sorbing capacities. Sulphur values are generally satisfactory and there is no evidence of micronutrient deficiencies. Silicon is adequately supplied. Subsoils are alkaline and may be sodic at some locations.

58
Nutrient management guidelines based on the reference site data
Tillage and water management
Because these soils become unworkable when too wet or too dry, there is only a brief opportunity to till these soils successfully. They are well suited to controlled traffic and permanent bed cropping systems that restrict compaction to the inter-rows. If compaction occurs, these soils have an ability to self-repair through their shrink-swell properties. Green cane trash blanketing will help maintain soil structure, tilth and porosity. Overhead and furrow irrigation can be used but irrigation rates need to be matched to soil moisture conditions to avoid waterlogging and the potential for secondary salinity. Laser grading is required for improving surface drainage and to reduce the risk of waterlogging. However, care must be taken in some locations to avoid exposing sodic subsoils. Readily available water is high (90–100 mm).
Environmental risk management
Loss of nitrogen by denitrification is a risk due to waterlogging. Strategies to reduce these losses include laser grading, mound planting, placement of nitrogen fertiliser into the mound and split fertiliser applications. Harvesting blocks early to encourage early growth and nutrient uptake is also likely to reduce the risk of nitrogen losses.
Crop situation
Lime t/ha
N kg/ha
P kg/ha
K kg/ha
S kg/ha
Ca kg/ha
Mg kg/ha
Cu kg/ha
Zn kg/ha
Fallow plant 0 140 30 0 10 0 0 0 0
Replant 0 160 30 50 10 0 0 0 0
Ratoon 0 160 20 50 10 0 0 0 0
Reference site and grower soil sample data
Reference site soil test values Median values from other sites
V L
ow
L
ow
M
od
erat
e
Hig
h
V H
igh
Clay
Org
C
N m
in in
dex pH
CEC
Nit
ric
K
Exch
K
Exch
Ca
Exch
Mg
ESP
Aci
d s
at S
BSE
S P
PB
I
Zn Cu
Si (
H2S
O4)
Si (
CaCl
2)

Soil-Specific Nutrient Management Guidelines
59
Soil group Black cracking clay
Brief description Black cracking clay
Productivity group Black earth
Mapping unit: Victoria Plains (Vc)
Above: Victoria Plains soil profile.
Field appearance
Topsoils are self-mulching black clays. Surface cracks can be as wide as 3–5 cm during the dry season. Subsoils are black structured heavy clays becoming grey with yellow or brown mottles at depth. Lime nodules also occur in the lower subsoil.
Similar soils
Silent Grove (Sg) and Brightley (Bt).
Physical properties
These soils have a low permeability, are poorly drained and can remain wet for long periods. They are also subject to flooding. Rooting depth is usually at least 1 m and they have a high water-holding capacity. They are strongly self-mulching soils and crack strongly during the dry season. They are prone to compaction if infield operations are conducted when too wet.
Occurrence
Victoria Plains soils occur mainly on the backplains of the Pioneer River floodplain and also on the creek flats of the minor streams to the north of Mackay. They are commonly associated with Brightley soils. They occupy about 7% of the sugarcane area in the Mackay district.
Formation
These soils are formed in low-lying areas of the floodplains where silt and clay have been deposited. They are usually located some distance from the nearest creek or river. Above: Victoria Plains soil near Eton.
Chemical properties
Topsoils are pH neutral, but increase in the subsoil. Organic carbon and N mineralisation index are moderate. They have a high fertility status although BSES P can vary according to fertiliser history. Topsoils usually have moderate P-sorbing capacity. The CEC and exchangeable Ca and Mg contents are very high and also increase with depth with increasing clay content. Exchangeable and non-exchangeable K reserves are moderate. Zinc needs to be monitored as low to marginal levels have been recorded at some locations. There is no evidence of other micronutrient deficiencies. Silicon is very high.

60
Nutrient management guidelines based on the reference site data
* The risk of N losses by denitrification suggests close attention be paid to management strategies to reduce the impact of waterlogging.
Tillage and water management
As these soils become unworkable when too wet or too dry, there is only a brief opportunity to till them successfully. They are well suited to controlled traffic and permanent, raised-bed cropping systems that restrict compaction to the inter-rows. If compaction occurs, they have an ability to self-repair due to their shrink-swell properties. Green cane trash blanketing will help maintain soil structure, tilth and porosity. Overhead and furrow irrigation can be used on these soils but irrigation rates need to be matched to soil moisture conditions. Higher infiltration rates will be achieved when surface cracking is evident. Laser grading is required to improve surface drainage. Readily available water is high (90–100 mm).
Environmental risk management
Loss of nitrogen by denitrification is a risk due to frequent waterlogging. Strategies to reduce these losses include laser grading, mound planting, placement of nitrogen fertiliser into the mound and split fertiliser applications. Harvesting blocks early to encourage early growth and nutrient uptake is also likely to reduce the risk of nitrogen losses.
Crop situation
Lime t/ha
N kg/ha*
P kg/ha
K kg/ha
S kg/ha
Ca kg/ha
Mg kg/ha
Cu kg/ha
Zn kg/ha
Fallow plant 0 120 20 50 5 0 0 0 10
Replant 0 140 20 100 5 0 0 0 10
Ratoon 0 140 10 100 5 0 0 0 10
Reference site and grower soil sample data
Reference site soil test values Median values from other sites
V L
ow
L
ow
M
od
erat
e
Hig
h
V H
igh
Clay
Org
C
N m
in in
dex pH
CEC
Nit
ric
K
Exch
K
Exch
Ca
Exch
Mg
ESP
Aci
d s
at S
BSE
S P
PB
I
Zn Cu
Si (
H2S
O4)
Si (
CaCl
2)

Soil-Specific Nutrient Management Guidelines
61
Soil group Brown alluvial soil
Brief description Clay loam over a reddish brown clay subsoil
Productivity group Non-calcic brown soil
Mapping unit: Pioneer (Pn)
Above: Pioneer soil profile.
Field appearance
Topsoils are grey-brown sandy clay loams to clay loams with a massive to weak structure. Subsoils are brown to red medium clays with a massive to moderate structure. A variant with a red subsoil also occurs mainly on Sandy Creek. Subsoils often overlie buried sandy layers.
Similar soils
St Helens (St) and Farleigh (Fl).
Physical properties
These soils are permeable and well drained. They have a rooting depth usually in excess of 1 m and a good water-holding capacity. The topsoil is hard-setting and prone to compaction. Minor soil erosion can occur on the back slopes of the levees where slopes are around 4%.
Occurrence
Pioneer soils occur extensively along levees of the Pioneer River, and Bakers and Sandy Creeks. They occupy about 2% of the sugarcane area in the Mackay district.
Formation
These soils are formed by floods depositing sand, silt and clay on the levees and benches adjacent to creeks and rivers.
Above: Landscape on the Pioneer River levee at Walkerston.
Chemical properties
Topsoils tend to be acidic and have moderate fertility. They have a moderate CEC and exchangeable Ca and Mg contents that increase with depth and clay content. Organic carbon and N mineralisation index are low. Exchangeable K concentrations are low, but K reserves are high. Topsoils have a low P-sorbing capacity. BSES P values are often high due to repeated application of mill byproducts. Sulphur values are generally satisfactory, although locations with low sulphur have been found. Micronutrients are well supplied and silicon levels are adequate.

62
Reference site and grower soil sample data
Reference site soil test values Median values from other sites
Nutrient management guidelines based on the reference site data
* increase soil pH
Tillage and water management
These soils have a wide moisture range for cultivation and are easily tilled to produce a fine seedbed. They are prone to hard-setting, but compaction can be restricted to the interrow with controlled traffic. Green cane trash blanketing will improve soil structure, tilth and porosity. These soils are permeable and have good drainage. Overhead or furrow irrigation with medium to high flow rates is suitable. Readily available water is moderate to high (80–100 mm).
Environmental risk management
Maintenance of a soil cover is recommended to reduce off-site movement of sediment and nutrients. Excessive P applications should be avoided.
Crop situation
Lime t/ha*
N kg/ha
P kg/ha
K kg/ha
S kg/ha
Ca kg/ha
Mg kg/ha
Cu kg/ha
Zn kg/ha
Fallow plant 2.5 130 0 80 5 0 0 0 0
Replant 2.5 150 0 100 5 0 0 0 0
Ratoon 0 150 0 100 5 0 0 0 0
V L
ow
L
ow
M
od
erat
e
Hig
h
V H
igh
Clay
Org
C
N m
in in
dex pH
CEC
Nit
ric
K
Exch
K
Exch
Ca
Exch
Mg
ESP
Aci
d s
at S
BSE
S P
PB
I
Zn Cu
Si (
H2S
O4)
Si (
CaCl
2)

Soil-Specific Nutrient Management Guidelines
63
Soil group Loamy alluvial soil
Brief description Sandy clay loam over a sandy or gravelly subsoil
Productivity group Alluvial soil
Mapping unit: Cameron (Cm)
Above: Cameron soil profile.
Field appearance
Topsoils are massive grey-brown sandy clay loams or clay loams. They overlie either buried sandy layers with gravel or structureless brown sandy clay loam to sandy clay subsoils.
Similar soils
Tanallo (Ta) and Murray (Mu).
Physical properties
These soils are permeable and freely draining. They have a rooting depth in excess of 1 m, but the water-holding capacity varies according to the thickness and clay content of the underlying loam, sand and gravel layers. Topsoils are weakly hard-setting and prone to compaction.
Occurrence
Cameron soils are found adjacent to the major streams throughout the Mackay district. They occur with Murray and St Helens soils on river banks and terraces. They occupy about 2% of the sugarcane area in the Mackay district.
Formation
These soils are formed on recently deposited sand, silt and gravel on the levees and terraces adjacent to creeks and rivers.
Above: Landscape on the bank of St Helens Creek north-east of Calen.
Chemical properties
These soils are weakly acidic with low organic carbon and N mineralisation index. Topsoil CEC is moderate and exchangeable Ca and Mg are well supplied. Exchangeable potassium is low, but K reserves are high. Topsoils have low P-sorbing capacities and BSES P values vary according to fertiliser history. Sulphur values are moderately low and micronutrients are well supplied.

64
Reference site and grower soil sample data
Reference site soil test values Median values from other sites
Nutrient management guidelines based on the reference site data
Tillage and water management
These soils are easily tilled to produce a seedbed, are well drained but are subject to occasional flooding. They are prone to hard-setting. Compaction can be restricted to the interrow with controlled traffic. Green cane trash blanketing and the application of organic amendments can improve soil structure, tilth, porosity and plant-available water capacity. Frequent, light, overhead irrigations should be used on these sandy soils. Readily available water capacity is moderately low (50 to 60 mm).
Environmental risk management
Loss of nitrate by leaching may occur during periods of excessive rainfall or irrigation. To reduce this risk, it is strongly recommended that nitrogen fertiliser applications be split. Due to the proximity of waterways and streams, there is a risk of off-site movement of P, particularly due to the low P-sorbing capacity of these soils. Maintenance of riparian zones is essential. Excessive P applications should be avoided.
Crop situation
Lime t/ha
N kg/ha
P kg/ha
K kg/ha
S kg/ha
Ca kg/ha
Mg kg/ha
Cu kg/ha
Zn kg/ha
Fallow plant 0 140 20 80 15 0 0 0 0
Replant 0 160 20 100 15 0 0 0 0
Ratoon 0 160 10 100 15 0 0 0 0
V L
ow
L
ow
M
od
erat
e
Hig
h
V H
igh
Clay
Org
C
N m
in in
dex pH
CEC
Nit
ric
K
Exch
K
Exch
Ca
Exch
Mg
ESP
Aci
d s
at S
BSE
S P
PB
I
Zn Cu
Si (
H2S
O4)
Si (
CaCl
2)

Soil-Specific Nutrient Management Guidelines
65
Soil group Gleyed duplex soil
Brief description Loamy coarse sand over coarse sandy loam
Productivity group Sand
Mapping unit: Marwood (Mw)
Above: Marwood soil profile.
Field appearance
Topsoils are massive, dark grey-brown loamy coarse sand. Subsoils are massive yellowish brown coarse sandy loams, grading into light grey coarse sandy clay loams with distinct yellow mottles.
Similar soils
Munburra (Mn).
Physical properties
These coarse sandy soils are susceptible to drought as they have a low plant-available water capacity (50–70 mm). Topsoils are massive and sandy with a high permeability. Rooting depth can be up to 1 m, depending on the amount of rock and stones in the profile. Soils on steeper slopes are subject to erosion. Overhead irrigation is recommended to restrict water losses by deep drainage.
Occurrence
Marwood soils occur on the lower slopes of a small area of hills south of Mackay. They occupy less than 1% of the sugarcane area.
Formation
These soils have formed in weathered material derived from granite that contains large quantities of coarse gritty sand.
Above: Landscape in the Marwood area.
Chemical properties
Marwood soils have a low fertility. Organic carbon, N mineralisation index and CEC are very low. While topsoil pH is above 6, mag-lime is recommended to supplement low exchangeable calcium and magnesium levels. Exchangeable potassium is extremely low but K reserves are moderate. BSES P is high in the reference soil but P-sorbing capacity is very low, making it difficult for these soils to retain P fertiliser. The reference soil has very low levels of sulphur and zinc. It is suggested that micronutrient and silicon levels be monitored using leaf analysis.

66
Nutrient management guidelines based on the reference site data
Tillage and water management
Frequent, light, overhead irrigations should be used due to the sandy nature of these soils and their low plant-available water capacity. Green cane trash blanketing and the application of organic amendments will improve soil structure, tilth and water-holding capacity. Tillage should be kept to a minimum to conserve moisture and organic matter. Minimum tillage in association with controlled traffic is recommended for these soils.
Environmental risk management
Loss of nitrate by leaching can occur during periods of excessive rainfall or irrigation. To reduce this risk, it is recommended that fertiliser applications be split. There is also a risk of off-site movement of P due to their low P-sorbing capacity. Care needs to be taken not to apply large amounts of P in a single application. Where these soils occur on slopes, they are prone to erosion. This can be minimised with grassed headlands and waterways, minimum or zero tillage and green cane trash blanketing. Without erosion control measures there is a risk of off-site movement of sediment and nutrients.
Crop situation
Lime t/ha
N kg/ha
P kg/ha
K kg/ha
S kg/ha
Ca kg/ha*
Mg kg/ha
Cu kg/ha
Zn kg/ha
Fallow plant 0 150 0 80 25 200 75 0 10
Replant 0 170 0 100 25 200 75 0 10
Ratoon 0 170 0 100 25 0 0 0 0
Reference site analysis data
Reference site soil test values Insufficient growers samples available
V L
ow
L
ow
M
od
erat
e
Hig
h
V H
igh
Clay
Org
C
N m
in in
dex pH
CEC
Nit
ric
K
Exch
K
Exch
Ca
Exch
Mg
ESP
Aci
d s
at S
BSE
S P
PB
I
Zn Cu
Si (
H2S
O4)
Si (
CaCl
2)

Soil-Specific Nutrient Management Guidelines
The guidelines for managing nutrient inputs according to soil type (Chapter 3) should be refined for specific blocks of cane by making use of some important tools such as soil testing, leaf analysis, juice analysis, and an integrated nutrient management package.
Soil testing
Soil testing provides useful information about the chemical (and some physical) properties of a soil and serves as a basis for determining specific nutrient inputs for a particular block of sugarcane. There are four important steps involved in this process. Each should be carried out with care to ensure meaningful results.
1. Sample collection Collect soil samples according to the guidelines provided in Appendix 3.
2. Sample analysis Submit samples to a reputable laboratory for analysis.
3. Interpretation of results and calculating nutrient inputs Ensure sound interpretation of the results and appropriate fertiliser recommendations by having an understanding of the basic process and getting advice from accredited advisors.
4. Fertiliser applications Apply fertilisers at the appropriate rates and keep records of nutrient inputs.
Interpretation of soil test values
With the exception of N, soil tests are interpreted by comparing the actual soil analysis data with established critical values. As shown in Figure 4.1, a critical value for a particular nutrient is that soil test value above which any further yield response to the applied nutrient is unlikely.
Soil test results therefore indicate those nutrients that are present in adequate quantities (and are readily available to the crop), and those nutrients that are lacking (and need to be applied).
Chapter 4
67
Nutrient requirements for specific blocks of sugarcane

As indicated in Chapter 2, nitrogen requirement is based on the yield potential for the district and the N mineralisation index, which depends on the organic carbon content (%) of the soil. Actual soil test values are interpreted by using the information provided in Chapter 2.
An example of a soil test report (Figure 4.2) shows the numerical soil test values from a commercial laboratory (column 2) and a representation of these values within the range from low (deficient) to excess/toxic. These values are used to assess the amount of each nutrient required by the crop for optimum production.
Figure 4.1: An example of a nutrient response curve for sugarcane.
68
Rel
ativ
e yi
eld
(%
)
Soil test value0 10 20 30 40 50
120110100
908070605040302010
0Deficiency Adequacy Toxicity
or excess

Soil-Specific Nutrient Management Guidelines
69
Soil test report
Trading Name: Field Name:
Location: Mackay district Section of Field: Rep1
Contact Name: SRA Mackay GPS Latitude: GPS Longitude:
Work Phone: Sample Type: Depth: 0–20 cm
Adviser: Lab Report Number: Sampling Date:
Phone: Crop: Sugarcane
Stage: Plough-out/Replant Target Yield: 130 tonnes/ha
Low < Optimum Satisfactory > Opt/Norm High Excess/Toxic
pH (1:5 water) 6
Electr. Conduct dS/m 0.05
Organic C (%) 1.3
Sulphate S (MCP) mg/kg 5
P (BSES) mg/kg 280
K (Nitric) me% 1.1
K (Amm. Acetate) me% 0.16
Ca (Amm. Acetate) me% 4.2
Mg (Amm. Acetate) me% 1.7
Aluminium (KCl) me% 0.047
Na (Amm. Acetate) me% 0.07
Copper (DTPA) mg/kg 0.86
Zinc (DTPA) mg/kg 2
Zinc (HCl) mg/kg -
Mn (DTPA) mg/kg 11
Silicon (CaCl2) mg/kg 28
Silicon (BSES) mg/kg 160
ECEC me% 6.18
Aluminium saturation % 0.76
Sodium % of cations (ESP) 1.1
Phos. Buffer Index (PBI) 77
Colour (Munsell) Greyish brown
Texture Sandy clay loam
Figure 4.2: Example of a soil test report from a commercial laboratory.

70
Appropriate nutrient inputs for this soil test report are calculated as follows (using the guidelines in Chapter 2):
Nitrogen
N requirement is 140 kg N/ha because the N mineralisation index is MODERATE due to an Org C (%) value of 1.3%. This requirement is appropriate for replant cane and ratoon cane after replant, but is modified according to the effect of fallow management or the use of ameliorants such as mill mud and/or mill ash. If, for example, the plant cane followed a grass/bare/poor legume fallow, the plant crop N requirement is 120 kg N/ha.
Phosphorus
0 kg P/ha is required for plant cane because the BSES P value is 280 mg/kg and the P sorption class is LOW as indicated by a PBI of 77. If a PBI value was not available, P sorption could also have been estimated as being LOW using texture and % Org C. No maintenance dressings of P are required in subsequent ratoon crops in this case.
NB: As clay content is not normally reported in soil tests it is reasonable to use an approximate clay content determined from the ECEC (Table 2.7) or using the ‘soil texturing’ method described in Appendix 1. In this analysis, the soil texture class estimated from ECEC of 6.18 me% is ‘Loam’.
Potassium
K requirement is 100 kg K/ha because the Nitric K value is more than 0.7 me%, the texture is described as a loam (24–36% clay) and an exchangeable K value of 0.16 me%. 100 kg K/ha is needed for each ratoon crop.
Sulphur
S requirement is 10 kg S/ha for the plant and all ratoon crops because the soil sulphur value is 5 mg/kg and the N mineralisation index is known to be MODERATE (as described above).
Magnesium
No Mg is required for the plant and all ratoon crops because the exch. Mg value is 1.7 me%.
Copper and zinc
Although leaf analysis is the preferred means of determining micronutrient requirements, the soil tests indicate that no zinc and no copper are required because the values are above the critical values shown in Table 2.15.
Silicon
No silicon is required because both soil tests (BSES and CaCl2) are above the respective critical values shown in Table 2.16.
Lime
No lime is required because the soil pH(water) value is above 5.5.

Soil-Specific Nutrient Management Guidelines
71
A summary of the nutrient requirement for the entire crop cycle in this example (Plant crop and three successive ratoons) is as follows:
Leaf analysis
Leaf sampling offers an appropriate means of checking on the adequacy of fertiliser recommendations and nutrient inputs to a block of sugarcane. It allows adjustment of fertiliser rates in the subsequent crop (or in the current crop if the cane was young enough at the time of sampling). It also allows possible nutrient problems associated with ‘poor cane’ to be identified and is an important tool for monitoring nutrient trends at different scales (cane block, farm and region). Leaf sampling instructions are supplied in Appendix 4. Leaf analysis results are interpreted according to the third leaf critical values shown in Table 4.3. It should be noted that third leaf N values decrease as the season progresses.
Table 4.3: Third leaf nutrient critical values for sugarcane.
An example of a leaf analysis report is shown in Figure 4.4. Apart from showing the actual analysis data and appropriate critical values for the full range of nutrients, the bar graphs provide an easy-to-understand interpretation, with the red dotted line indicating satisfactory levels. Statements below the bar graph add to this interpretation.
Nutrient Month of sampling Third leaf critical nutrient value
N
Nov – mid Jan 1.90 %
Mid Jan – Feb 1.80 %
Mar – May 1.70 %
P
Nov – May
0.19 %
K 1.10 %
Ca 0.20 %
Mg 0.08 %
S 0.13 %
Cu 2 mg/kg
Zn 15 mg/kg
Mn 15 mg/kg
Si 0.55 %
Crop N kg/ha P kg/ha K kg/ha S kg/ha
Replant cane 140 0 100 10
Ratoon crops 140 0 100 10
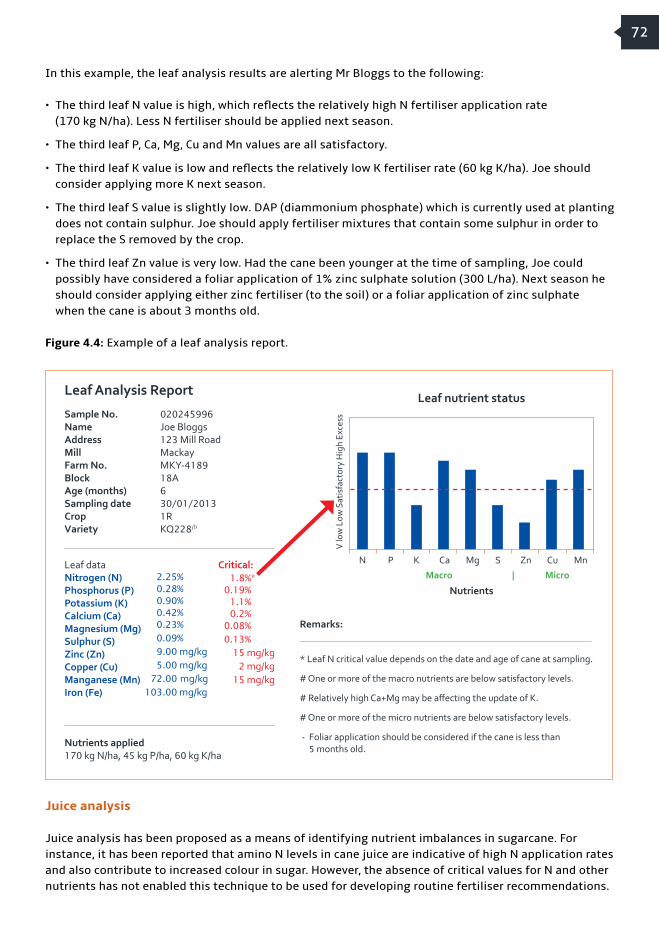
72
In this example, the leaf analysis results are alerting Mr Bloggs to the following:
• The third leaf N value is high, which reflects the relatively high N fertiliser application rate (170 kg N/ha). Less N fertiliser should be applied next season.
• The third leaf P, Ca, Mg, Cu and Mn values are all satisfactory.
• The third leaf K value is low and reflects the relatively low K fertiliser rate (60 kg K/ha). Joe should consider applying more K next season.
• The third leaf S value is slightly low. DAP (diammonium phosphate) which is currently used at planting does not contain sulphur. Joe should apply fertiliser mixtures that contain some sulphur in order to replace the S removed by the crop.
• The third leaf Zn value is very low. Had the cane been younger at the time of sampling, Joe could possibly have considered a foliar application of 1% zinc sulphate solution (300 L/ha). Next season he should consider applying either zinc fertiliser (to the soil) or a foliar application of zinc sulphate when the cane is about 3 months old.
Figure 4.4: Example of a leaf analysis report.
Juice analysis
Juice analysis has been proposed as a means of identifying nutrient imbalances in sugarcane. For instance, it has been reported that amino N levels in cane juice are indicative of high N application rates and also contribute to increased colour in sugar. However, the absence of critical values for N and other nutrients has not enabled this technique to be used for developing routine fertiliser recommendations.
Leaf Analysis Report
Sample No. 020245996Name Joe BloggsAddress 123 Mill RoadMill MackayFarm No. MKY-4189Block 18AAge (months) 6Sampling date 30/01/2013Crop 1RVariety KQ228A
Nutrients applied170 kg N/ha, 45 kg P/ha, 60 kg K/ha
Remarks:
* Leaf N critical value depends on the date and age of cane at sampling.
# One or more of the macro nutrients are below satisfactory levels.
# Relatively high Ca+Mg may be affecting the update of K.
# One or more of the micro nutrients are below satisfactory levels.
- Foliar application should be considered if the cane is less than 5 months old.
Leaf dataNitrogen (N)Phosphorus (P)Potassium (K) Calcium (Ca)Magnesium (Mg)Sulphur (S)Zinc (Zn)Copper (Cu)Manganese (Mn)Iron (Fe)
2.25% 0.28% 0.90% 0.42% 0.23%
0.09%
9.00 mg/kg 5.00 mg/kg 72.00 mg/kg103.00 mg/kg
Critical: 1.8%* 0.19% 1.1% 0.2% 0.08%
0.13%
15 mg/kg 2 mg/kg 15 mg/kg
N P K Ca Mg S Zn Cu Mn
V lo
w L
ow S
atis
fact
ory
Hig
h Ex
cess
Macro | Micro
Nutrients
Leaf nutrient status

Soil-Specific Nutrient Management Guidelines
73
Integrated nutrient management
Analytical results for a single soil or leaf sample are of limited value. Of much more benefit is the concept of integrated nutrient management, which includes the use of a range of different activities for determining nutrient inputs to a particular cane block. In brief, the integrated nutrient package consists of six steps:
1. Knowing which soils occur in each block of your farm
2. Understanding the properties of each soil and the nutrient processes and loss pathways likely to occur in each soil.
3. Regular soil testing (blocks should be sampled before every crop cycle).
4. Developing a plan of fertiliser applications for each block covering a whole crop cycle (covering a plant crop and at least three successive ratoons). This can be achieved using knowledge of the nutrient requirement of each soil and implementing soil/site-specific fertiliser recommendations.
5. Using leaf analysis as a check on the adequacy of fertiliser recommendations (enabling modifications to the fertiliser plans).
6. Maintaining a good record-keeping system which enables informed decisions to be made based on block histories and longer-term nutrient management strategies.
Implementation of this system on-farm will lead to best practice nutrient management and sustainable sugarcane production.

Chapter 5
74
Concluding remarks
Soils are complex physical, chemical and biological systems that store and release nutrients for crop growth – they are not simply for holding up plants. The amount and rate of release of nutrients from different soils and the reactions between soils and fertilisers need to be taken into account when developing nutrient guidelines. This complexity is appreciated by cane growers in the Mackay district who have an excellent understanding of the different soil types occurring on their farms and recognise that different management practices are appropriate for different soils. The information presented in this booklet is intended to reinforce this local soil knowledge and provide an easily understood system for soil and nutrient management. It focuses much more than current systems on the chemical, physical and biological properties of different soils.
Our new philosophy focuses on the management of different soils to enhance their ability to store and supply a wide range of nutrients to the crop. It emphasises the importance of improving levels of soil organic matter and has the long-term goal of improving soil fertility through the enhancement of natural soil processes and nutrient cycles. It differs from current approaches in the following ways:
• Lime is recommended for the amelioration of soil acidity even though many soils are well supplied with calcium.
• Our nutrient management guidelines take into account the release of N, P and S in the soil through the mineralisation of soil organic matter. Our N guidelines, in particular, are lower than previous recommendations. This is particularly important given current concerns regarding elevated levels of nitrate in the waters of the Great Barrier Reef lagoon.
• We recognise that soils differ in their capacity to sorb added P fertiliser and render it less available to sugarcane crops. We therefore interpret the standard BSES P test somewhat differently for different soils.
• Our K guidelines are broadly similar to previous recommendations but take into account differences in soil texture. They are higher than previous K application rates and recognise the low exchangeable K levels in nearly all Mackay soils. They can be justified by the fact that we have not been replacing crop removal of K and have thus been exploiting soil K reserves.
We hope that the information in this booklet will improve the local awareness and understanding of different soils and how they can be managed for sustainable sugarcane production. While growers can use the management guidelines directly for their different soils, the booklet also explains the way in which the nutrient management guidelines have been derived so that growers can make informed judgements on how to manage their soils. It also provides guidelines for interpreting soil and leaf analyses. We hope this will encourage growers to make greater use of these important nutrient management tools.

Characteristics of the soil bolus and ribbonLength of the ribbon (mm)
Textural grade
Approximate clay %
Sandy feel, no coherence, with single grains sticking to fingers
Nil Sand 0–10
Sandy feel, slight coherence, with discolouration of fingers
5–15 Loamy sand 5–15
Sandy feel, slight coherence 15–25 Sandy loam 10–20
Spongy, greasy feel, with coherence, but no obvious sandiness or silkiness
25 Loam 10–24
Smooth, silky feel, with distinct coherence 25 Silt loam 10–24
Sandy feel but with distinct coherence 25–40 Sandy clay loam 20–30
Smooth feel with strong coherence and no obvious sand grains
40–50 Clay loam 25–40
Smooth, silky feel with distinct coherence 40–50 Silty clay loam 25–40
Easily moulded with sandy feel 50–75 Sandy clay 25–50
Easily moulded with smooth and silky feel 50–75 Light clay/silty clay 35–45
Easily moulded (like plasticine), smooth feel, but with resistance to shearing
+ 75 Medium/heavy clay > 45
How to determine soil texture
The texture of a soil is defined as the relative proportions of sand, silt and clay particles in the soil. In the laboratory, the particle size distribution is determined by measuring the percentages of each of these particles in a particular soil. In the field, the field texture grade of a soil (sand, sandy loam, loam, clay loam, silty clay loam, clay, etc.) can be estimated by observing the behaviour of a small handful of soil, moistened with enough water to ensure that a ball (bolus) can be formed with kneading and then pressed between thumb and forefinger to produce a ribbon. The texture is determined by noting certain characteristics of the moistened soil and comparing the length (in mm) of this ribbon with the ranges indicated in the following table.
Appendix 1
75
Left: Forming the ball (bolus) of soil and pressing it into a ribbon.
Below: Simplified guide to determining soil texture.

Appendix 2
76
Guidelines for banded mill mud and mud/ash mixture
Mill mud supplied by Racecourse and Farleigh mills
Information contained in this appendix is based on estimates only and therefore should be used only as guidelines. Further research is required to refine these recommendations.
Typical nutrient content of mill mud and estimated available nutrients when applied at 50 t/ha banded on the row
Mud/ash mixture supplied by Marian mill
Typical nutrient content of mud/ash and estimated available nutrients when applied at 50 t/ha banded on the row
Mud 50 t/ha Estimated available nutrients (kg/ha)
NutrientsTypical nutrient content (kg/ha)
1st crop 2nd crop 3rd and 4th crop
Nitrogen 140 25 15 0
Phosphorus 140 sufficient sufficient sufficient
Potassium 40 0 0 0
Sulphur 15 0 0 0
Calcium (0.7 t/ha lime) 240 sufficient sufficient sufficient
Mud/ash 50 t/ha Estimated available nutrients (kg/ha)
NutrientsTypical nutrient content (kg/ha)
1st crop 2nd crop 3rd and 4th crop
Nitrogen 100 15 0 0
Phosphorus 100 Sufficient SufficientCheck with leaf test in 3rd crop
Potassium 60 40 0 0
Sulphur 15 0 0 0
Calcium (0.5 t/ha lime) 180 Sufficient Sufficient Sufficient

Appendix 3
Soil-Specific Nutrient Management Guidelines
How to take a soil sample
Soil tests in the laboratory are carried out on a 10 g sample which is taken from about 500 g of soil submitted to the laboratory. Usually this 500 g sample is a sub-sample of about 10 kg of soil which ideally should be sampled from a block of cane (average 2 hectare area) that contains about 6000 tonnes of soil in the plough layer.
Soil: 6000 tonnes 5–10 kg 500 g 10 g
The 10 g of soil analysed in the laboratory is a sub-sample of the soil sample collected in the field and represents around 1.6 parts per billion. In view of this it is extremely important that a soil sample is representative of the volume of soil from which it is collected. This is achieved by collecting adequate soil from the block being sampled using a standard procedure.
Soil sampling procedure
• Determine the area (or block) to be sampled. Ensure that it does not exceed 2 or 3 hectares and that it is relatively uniform in soil type. In large blocks, consider taking multiple samples. If a block consists of more than one distinct soil type, sample each separately. Avoid sampling areas that differ in crop growth or where large amounts of mill mud or other ameliorants have been dumped. Again, sample such areas separately if necessary.
• Sampling is traditionally done with an auger (either a turning auger or a soil coring tube) to a depth of 20 cm.
• At least 10 or 12 ‘augerings’ should be collected from the area, using a zigzag or grid pattern. The basic principle is that more augerings are better than less.
Soil sample
77
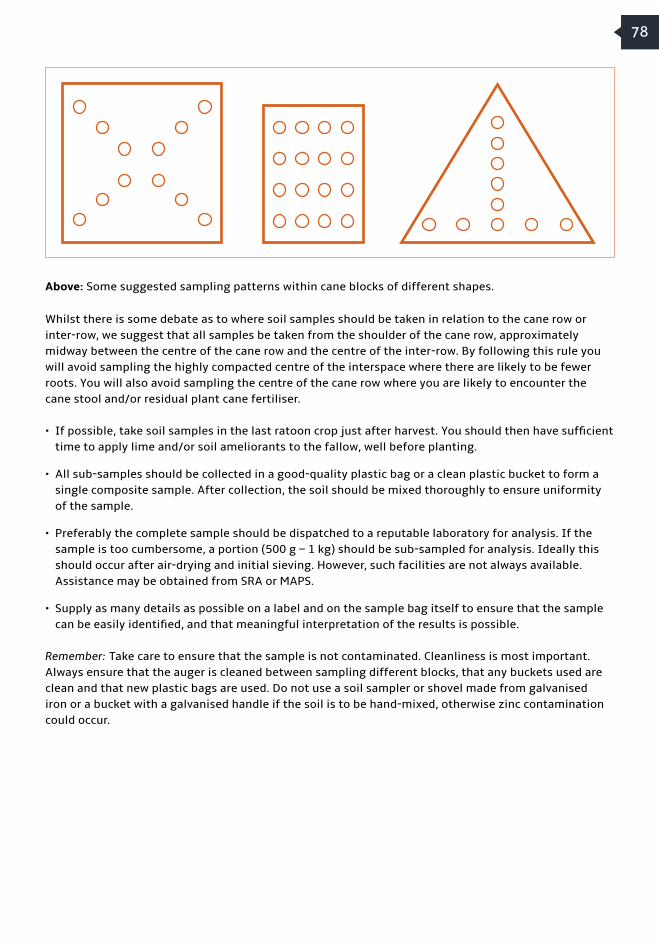
Above: Some suggested sampling patterns within cane blocks of different shapes.
Whilst there is some debate as to where soil samples should be taken in relation to the cane row or inter-row, we suggest that all samples be taken from the shoulder of the cane row, approximately midway between the centre of the cane row and the centre of the inter-row. By following this rule you will avoid sampling the highly compacted centre of the interspace where there are likely to be fewer roots. You will also avoid sampling the centre of the cane row where you are likely to encounter the cane stool and/or residual plant cane fertiliser.
• If possible, take soil samples in the last ratoon crop just after harvest. You should then have sufficient time to apply lime and/or soil ameliorants to the fallow, well before planting.
• All sub-samples should be collected in a good-quality plastic bag or a clean plastic bucket to form a single composite sample. After collection, the soil should be mixed thoroughly to ensure uniformity of the sample.
• Preferably the complete sample should be dispatched to a reputable laboratory for analysis. If the sample is too cumbersome, a portion (500 g – 1 kg) should be sub-sampled for analysis. Ideally this should occur after air-drying and initial sieving. However, such facilities are not always available. Assistance may be obtained from SRA or MAPS.
• Supply as many details as possible on a label and on the sample bag itself to ensure that the sample can be easily identified, and that meaningful interpretation of the results is possible.
Remember: Take care to ensure that the sample is not contaminated. Cleanliness is most important. Always ensure that the auger is cleaned between sampling different blocks, that any buckets used are clean and that new plastic bags are used. Do not use a soil sampler or shovel made from galvanised iron or a bucket with a galvanised handle if the soil is to be hand-mixed, otherwise zinc contamination could occur.
78

Appendix 4
How to take a leaf sample
Step 1
Step 2
Step 3
• Select leaves from stalks of average height.
• Sample the third leaf from the top of the stalk (as shown on the diagram). Counting from the top of the plant, the first leaf is the one that is more than half-unrolled. The third leaf usually corresponds to the top visible dewlap.
• Collect 30–40 leaves at random from across the entire block of sugarcane being sampled.
• Fold the leaves in half (top to base) and cut a 100–150 mm length from these folded leaves (giving a total 200–300 mm section of each leaf). Retain these middle 200–300 mm sections of the leaf blades and discard the remaining top and bottom sections.
• Strip out and discard the midrib from each 200–300 mm section.
• Bundle the leaf strips together and attach a label with sample details.
• Place the sample in a cool environment (polystyrene cooler) until it can be dried in an oven (at about 60°C) or in a dry well-ventilated area.
• Once the sample is dry, place it in a clean paper bag or envelope, and send it to a reputable laboratory for analysis.
100 mm
12
3
Soil-Specific Nutrient Management Guidelines
79

To ensure meaningful interpretation of the analysis results, make sure that the following guidelines are adhered to:
• Cane is sampled during the prescribed leaf-sampling season (December to April).
• Cane is the correct age (3–7 months) at the time of sampling.
• Cane has been growing vigorously during the month before sampling.
• Cane is not affected by moisture stress at the time of sampling.
• Cane is also unaffected by any other factors, such as disease, insect damage.
• At least 6 weeks has passed since fertiliser applications.
It is important that leaves are sampled correctly and that all the details requested by the testing laboratory are supplied as accurately as possible. This will enable meaningful interpretation of the analysis results.
80

Further reading
The material covered in this booklet includes information drawn from various sources. This expertise and knowledge is gratefully acknowledged, particularly in relation to the following publications and/or reports. The list also provides details of some further reading options.
Aitken, R.L. (2000). Control of acidity and soil acidification. In Bruce, R.C. (ed.) Sustainable Nutrient Management in Sugarcane Production Shortcourse. CRC for Sustainable Sugar Production, Townsville, pp. 59-62.
Bell, M.J. Halpin, N.V., Garside, A.L., Stirling, G.R., Moody, P.W. and Robotham, B.G. (2003). Evaluating combinations of fallow management, controlled traffic and tillage options in prototype sugarcane systems at Bundaberg. Proceedings of the Australian Society of Sugar Cane Technologists, 25: (CD-ROM)
Berthelsen, S., Hurney, A.P., Kingston, G. Rudd, A., Garside, A.L. and Noble, A.D. (2001). Plant cane responses to silicated products in the Mossman, Innisfail and Bundaberg districts. Proceedings of the Australian Society of Sugar Cane Technologists, 23: 297-303.
Bramley, R.G.V. and Wood, A.W. (2000). Risk assessment of phosphorus (P) loss and guidelines for P use in lower Herbert soils. Final Report, SRDC, Project CLW010.
Bruce, R.C. (ed.) (2000). Sustainable Nutrient Management in Sugarcane Production Shortcourse. CRC for Sustainable Sugar Production, Townsville.
Bruce, R.C. (ed.) (2002). Managing Soils, Nutrients and the Environment for Sustainable Sugar Production. CRC for Sustainable Sugar Production, Townsville.
Burkitt, L.L., Moody, P.W., Gourley, C.J.P and Hannah, M.C. (2000). A simple phosphorus buffering index for Australian soils. Australian Journal of Soils Research 40, 497 – 513.
Calcino, D.V. (1994). Australian Sugarcane Nutritional Manual. BSES/SRDC, Indooroopilly.
Calcino, D.V., Kingston, G. and Haysom, M.B.C. (2000). Nutrition of the plant. In: Hogarth, D.M. and Allsopp, P.G. (eds). Manual of Cane Growing. Bureau of Sugar Experiment Stations, Indooroopilly, pp 153-193.
Donnollan, T.E., Wilson, P.R., Zund, P.R. and Irvine, S.A., (1988). Soils and Irrigated Land Suitability of the Bundaberg Area, South East Queensland. Land Resources Bulletin, Department of Natural Resources, Brisbane.
Garside, A.L. and Bell, M.J. (2001). Fallow legumes in the Australian sugar industry: Review of recent research findings and implications for the sugarcane production system. Proceedings of the Australian Society of Sugar Cane Technologists, 23: 230-235.
Soil-Specific Nutrient Management GuidelinesSoil-Specific Nutrient Management Guidelines
81
Hardy, S.M., Gooley, R., Mason, F. and James, A.G. (2000). Soil manual for the Mackay-Proserpine region, Central Queensland. Department of Natural Resources, Brisbane.
Hogarth, D.M. and Allsopp, P.G. (eds.) (2000). Manual of Cane Growing. Bureau of Sugar Experiment Stations, Indooroopilly.
Holtz, G.K. and Shields, P.G. (1985). Mackay sugar cane land suitability study. Part 1. Land Resource inventory and Part 2. Land suitability. Queensland Department of Primary Industries, Brisbane.
Muller, P.G. and Coutts, A.J. (2005). Acid sulfate soils and estuarine water quality of the Mackay district. Volume 1: Acid sulfate soil report. Department of Natural Resources and Mines, Brisbane.
Nelson, P.N. (2000). Field Guide for Diagnosis of Sodic Soils in the Australian Sugar Industry. CRC for Sustainable Sugar Production Technical Publication, Townsville.
Peverill, K.I., Sparrow, L.A. and Reuter, D.J. (1999). Soil Analysis: An Interpretation Manual. CSIRO Publishing, Collingwood.
Schroeder, B.L., Hubert, J.W., Hubert, C., Hubert, F.G., Panitz, J.H., Wood, A.W. and Moody, P.W. (2007). Recognising differences in soil type to guide nutrient inputs on-farm – A case study from Bundaberg. Proceedings of the Australian Society of Sugar Cane Technologists, 29: 138-148.
Schroeder, B.L., Moody, P.W. and Wood, A.W. (2003). Improved nutrient management in the Australian sugar industry. Final Report, SRDC, Project BSS232.
Schroeder, B.L., Panitz, J.H., Wood, A.W., Moody, P.W. and Salter, B. (2007). Soil-Specific Nutrient Management Guidelines for Sugarcane Production in the Bundaberg District. Technical Publication TE07004, BSES Limited, Indooroopilly.
Schroeder, B.L. and Wood, A.W. (2001). Assessment of the nitrogen mineralising potential of soils in two different landscapes in the Australian sugar industry – implications for N fertiliser management. Proceedings of the Australian Society of Sugar Cane Technologists, 23: 281-288.
Schroeder, B.L., Wood, A.W., Hardy, S., Moody, P.W., and Panitz, J.H. (2006). Soil-Specific Nutrient Management Guidelines for Sugarcane Production in the Proserpine District. Technical Publication TE04003, BSES Limited, Indooroopilly.
Schroeder, B.L., Wood, A.W., Moody, P.W., Bell, M.J. and Garside, A.J. (2005). Nitrogen fertiliser guidelines in perspective. Proceedings of the Australian Society of Sugar Cane Technologists, 27: 291-304.
Schroeder, B.L., Wood, A.W., Moody, P.W., Panitz, J.H., Agnew, J.R., Sluggett, R.J. and Salter, B (2006). Delivering nutrient management guidelines to growers in the central region of the Australian sugar industry. Proceedings of the Australian Society of Sugar Cane Technologists, 28: 142-154.
Schroeder, B.L., Wood, A.W., Moody, P.W., Stewart, R.L., Panitz, J.H., and Benn, J. (2007). Soil-specific Nutrient Management Guidelines for Sugarcane Production in the Johnstone Catchment. BSES Technical Publication TE07001.
White, R.E. (1997). Principles and Practices of Soil Science. 3rd Edition. Blackwell Science Ltd, Oxford.
Wood, A.W., Noble, A.D. and Bramley, R.G.V. (2002). Improving the environment for sugarcane growth through the amelioration of soil acidity. Final Report, SRDC, Project CSR024.
82

Soil-Specific Nutrient Management Guidelines
83
Wood, A.W. and Schroeder, B.L. (2004). Potassium: A critical role in sugarcane production, particularly in drought conditions. Proceedings of the Australian Society of Sugar Cane Technologists, 26: CD-ROM.
Wood, A.W., Schroeder, B.L. and Stewart, R.L. (2003). Soil Specific Management Guidelines for Sugarcane Production. Soil Reference Booklet for the Herbert District. CRC for Sustainable Sugar Production Technical Publication, Townsville.
Wood, A.W., Schroeder, B.L., Stewart, R.L. and Roth, C.H. (2003). A reference booklet for cane growers on the nutrition and fertilising of sugarcane for different soil types. Final Report, SRDC, Project CSR026.


Sugar Research Australia Limited
ABN 16 163 670 068
Head Office
50 Meiers Road
Indooroopilly QLD 4068
Australia
Postal Address
PO Box 86
Indooroopilly QLD 4068
Australia
Tel 07 3331 3333
Fax 07 3871 0383
Email [email protected]
Web sugarresearch.com.au