Soil Potassium Dynamics - sdaba.org · – T. E. Bates, ISU PhD Dissertation (1961) – Haby, et...
53
Soil Potassium Dynamics Jim Friedericks Outreach & Education Advisor
Transcript of Soil Potassium Dynamics - sdaba.org · – T. E. Bates, ISU PhD Dissertation (1961) – Haby, et...

Soil Potassium Dynamics
Jim Friedericks Outreach & Education Advisor

Potassium dynamics in soil
• Why are these results so different? – A 4 year sampling plan – Results don’t reflect
management practices – What’s going on?
Soil Test K – 2009
Soil Test K – 2013

Putting Soil Results in Context
100
125
150
175
200
225
K, p
pm
Average Soil K test levels
Spring (K) Potassium
Fall (K) Potassium
Fifteen years of Iowa samples.

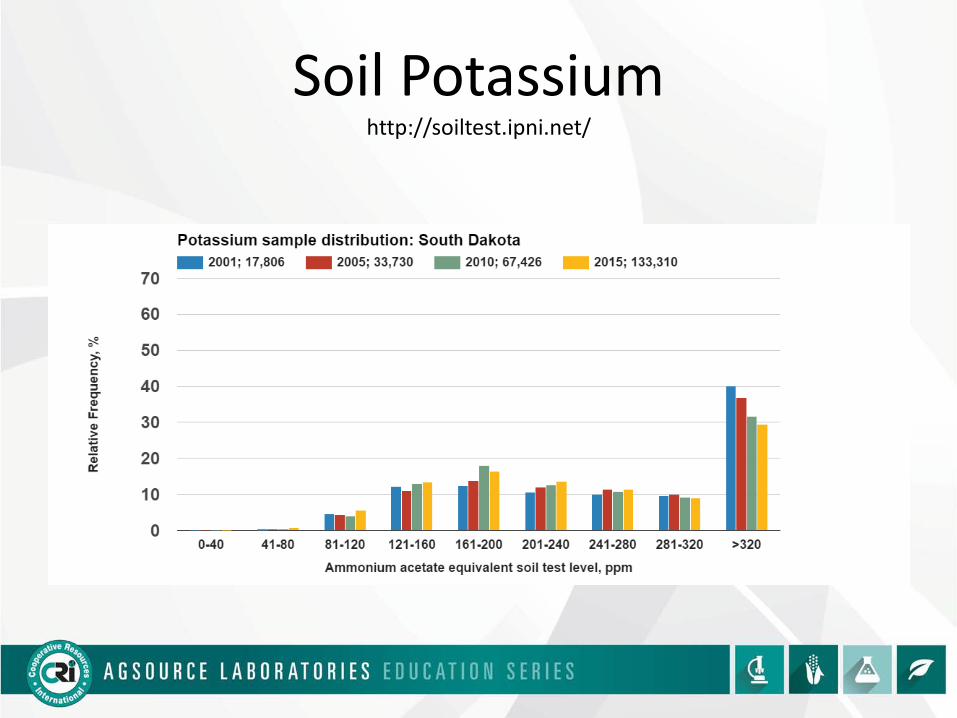
Soil Potassium http://soiltest.ipni.net/

Soil Potassium http://soiltest.ipni.net/

Soil Potassium http://soiltest.ipni.net/

Soil Potassium http://soiltest.ipni.net/

• What influences soil test potassium values? – Soil clay structure and cation exchange – Soil sampling variability – Fertilizer Recommendations
Potassium dynamics in soil

Soil clay has several forms but the 2:1 clays are common in this area.
Silica tetrahedral layer
Alumina octahedral layer
Silica tetrahedral layer
2:1 Clays
Derived from minerals rich in potassium, calcium and magnesium

Clay crystals form in layers
Two layers of silica and one of alumina
• Charges come from substitution of – Al+3 for Si+4
– Mg+2 for Al+3
– These internal charges
attract cations (K, Ca, Mg, etc) to the surface

The negative charges in the crystal attract cations to the surface of the clay layer. Variable spacing between the layers depends on the hydration radius of the adsorbed ions.
Silica tetrahedral layer
Alumina octahedral layer
Silica tetrahedral layer
Variable spacing between layers.
2:1 Clays
- - - - - - - - - - - -
- - - - - - - - - - - -
- - - - - - - - - - - -
- - - - - - - - - - - -
Ca2+ K+ Na+ Mg2+ K+ NH4+

Clay structures
Variable spacing between layers.
2:1 Clays
Ca2+ K+ Na+ Mg2+ K+ NH4+
Ca2+
K+
The negative charges in the crystal are able to attract cations to the surfaces of the clay layers.
- - - - - - - - - - - -
- - - - - - - - - - - -
- - - - - - - - - - - -
- - - - - - - - - - - - Ca2+ K+ Na+ Mg2+ K+ NH4
+
Ca2+ K+ Na+ Mg2+ K+ NH4+

Clay structures
Variable spacing between layers.
2:1 Clays
K+ K+ K+ K+ K+ K+ K+
Water associated with the cations causes the layers to open up.
- - - - - - - - - - - - - - - - - - - - - - - - - - - - - - - - - - -
- - - - - - - - - - - - - - - - - - - - Ca2+ K+ Na+ Mg2+ K+ NH4
+
Ca2+ K+ Na+ Mg2+ K+ NH4+
- - - - - - - - - - - -

Clay types

Potassium and clays • Clays are layers of charged particles
that absorb cations including K
• Different proportion of K exist in the
soil at any one given time – Fixed (physically part of the soil
composition) (90-95% of total K – Non-exchangeable (slowly
exchangeable) (8 – 5 % of total K) • Distributed within individual sheets
– Exchangeable (and solution K) (1-2% of total K))
non-exchangeable K

Clay types

Potassium Extraction
Replace all the adsorbed cations with other cations
Ammonium exchange
Ca2+ Mg2+ K+ NH4+
Ca2+ Mg2+ K+ H+
Ca2+ Mg2+ K+
NH4+
NH4+
NH4+
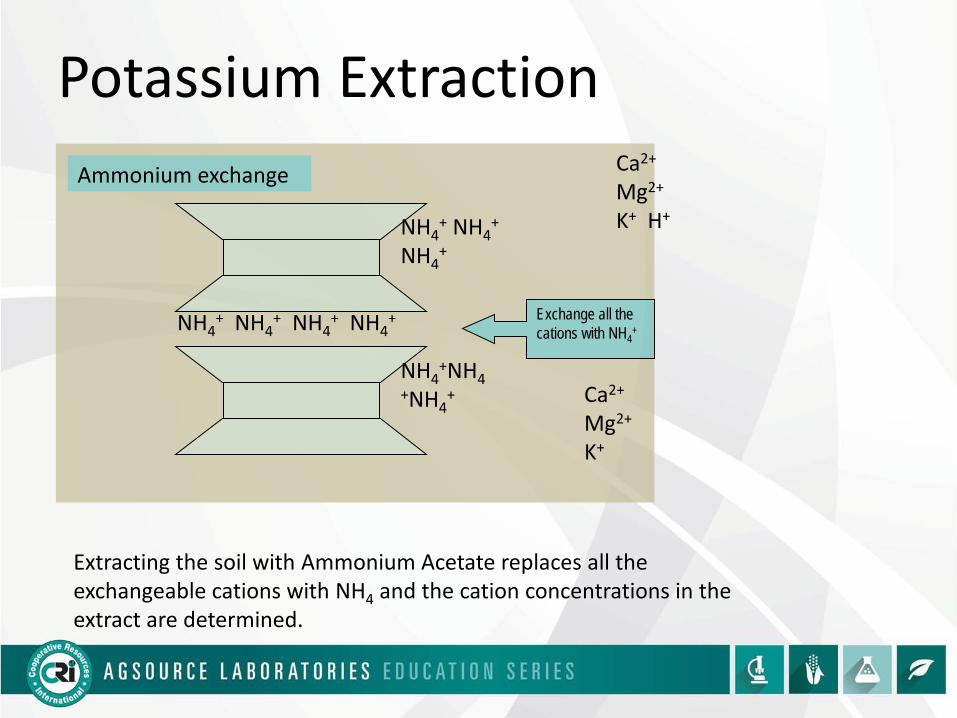
Potassium Extraction
Exchange all the cations with NH4
+
Ammonium exchange
NH4+ NH4
+ NH4+ NH4
+
Ca2+ Mg2+ K+ H+
Ca2+ Mg2+ K+
NH4+ NH4
+
NH4+
NH4+NH4
+NH4+
Extracting the soil with Ammonium Acetate replaces all the exchangeable cations with NH4 and the cation concentrations in the extract are determined.

Cation Exchange Capacity
• Typical for Central Iowa: • Clay Loams • 4 – 6 % OM • 6.5 – 7.5 pH

Base Saturation
• Basic cations are determined by extraction with ammonium – either ammonium acetate or Mehlich 3 solution.
• Acidity is determined by the buffer pH and is calculated from an estimate of the CEC.

Base Saturation Ions adsorbed on clay and
humus surfaces are exchangeable and in equilibrium with the soil solution. The sum of the cations adsorbed on solid surfaces is the cation exchange capacity, CEC. H+ is acidic, the rest are bases.

Base Saturation

Measuring Soil Fertility
• Accuracy – how close to the true value? – Degree of variability – Bias in all results
• Precision – how repeatable is the result? – Uncertainty of result
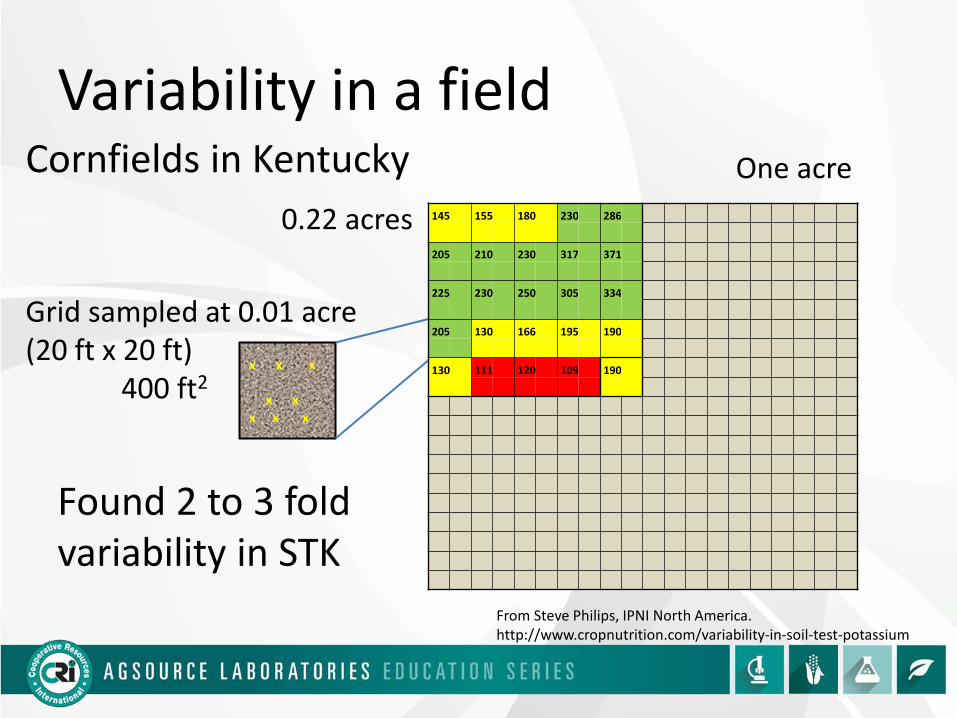
Variability in a field Cornfields in Kentucky
0.22 acres
Grid sampled at 0.01 acre (20 ft x 20 ft) 400 ft2
x x x x x x x x
Found 2 to 3 fold variability in STK
One acre 145 155 180 230 286
205 210 230 317 371
225 230 250 305 334
205 130 166 195 190
130 111 120 109 190
From Steve Philips, IPNI North America. http://www.cropnutrition.com/variability-in-soil-test-potassium

How much variability? 490 ft.2 Approximately 0.01 acre
x x x x x x x x
9 ft2 is the largest area that had the same K value, Or 3 ft between points with the same K value
Oklahoma pasture Sampled on one foot grids
From Steve Philips, IPNI North America. http://www.cropnutrition.com/variability-in-soil-test-potassium

How many cores make a good quality sample?
22% ---- 17% ----
15 – 23 ppm 16 – 22 ppm
50%

Soil Variability • Soil profile variability
– Requires consistent sampling strategies
– Is magnified by management practices

• Soil test K decreases with depth, with the greatest concentration at the 0-2” depth.
• A composite soil sample 0-6” represents a profile average.
• Crop root density Is maximum between 2 and 8 inch depth.
STK vs Soil Depth
-14
-12
-10
-8
-6
-4
-2
00 50 100 150 200 250
Dep
th In
ches
Soil K (ppm)
Independence Iowa Site 2006
Miller, 2013

What about yearly variability?
• Why are these results so different? – A 4 year sampling plan – Results don’t reflect
management practices – What’s going on?
Soil Test K – 2009
Soil Test K – 2013

Putting Soil Results in Context
100
125
150
175
200
225
K, p
pm
Average Soil K test levels
Spring (K) Potassium
Fall (K) Potassium
Fifteen years of Iowa samples.
Soil Potassium http://soiltest.ipni.net/

Making Recommendations Soil Test Ranges for Potassium
Nutrient Level Classification
Soil Test Potassium ppm
Very Low 0 - 40
Low 41 - 80
Medium / Optimum 81 - 120
High 121 - 160
Very High 161+

Making Recommendations Calibration table for the Soil Test Classifications.
Nutrient Level Classification
Probability of seeing response to fertilizer
Very Low >80 %
Low 60 %
Medium / Optimum 40 %
High 20 %
Very High <20 %

Making Recommendations
• Potassium recommendations equations
– Fertilizer Recommendations Guide SDSU EC750
Crop Unit K2O
Corn bu = (1.166 - (0.0073 x STK)) x YG *
Corn silage ton = (9.50 - (0.06 x STK)) x YG *
Soybeans bu = (2.2 – (0.0183 x STK)) x YG
Wheat bu = (2.71 – (0.017 x STK)) x YG
Alfalfa ton = (55.71- (0.38 x STK)) x YG

Making Recommendations • What does it take to maintain the soil fertility? • Supply the crop nutrient removal rates
– How many pounds of the nutrient is removed?
– Compiled from NCR state extension publications
Crop Unit P2O5 K2O
Corn bu 0.32 – 0.43 0.22 – 0.29
Corn silage ton 2.7 – 3.5 7 - 9
Soybeans bu 0.72 – 0.83 1.2 – 1.4
Wheat bu 0.5 – 0.6 0.27 – 0.35
Alfalfa ton 6 – 13 43 – 60

K Removal and Soil K Trends from ISU Research plots
Villavicencio and Mallarino, 2011
-500
-400
-300
-200
-100
0
100
120
140
160
180
-800
-600
-400
-200
0
80
100
120
140
-800
-600
-400
-200
0
90
110
130
150
Cum
ulat
ive
K R
emov
al w
ith H
arve
st (k
g K
ha-1
)
-800
-600
-400
-200
0
Soil-
Test
K (m
g kg
-1)
150
175
200
225
250
Year1 2 3 4 5 6 7 8 9 10 11 12 13 14 15 16
Cum
ulat
ive
K R
emov
al w
ith G
rain
Har
vest
(kg
K h
a-1)
-600
-400
-200
0So
il-Te
st K
(mg
kg-1
)
150
200
250
300
NE SE
North SW
NW
STKSTK
STK
STK
STK
Year1 2 3 4 5 6 7 8 9 10 11 12 13 14 15 16
-600-500-400-300-200-100
0
130
150
170
190MEANS
CornSoybean
CornSoybean

Soil Potassium http://soiltest.ipni.net/

What else impacts K variability?
• Crop nutrient uptake rates and K leaching from stover. – Differs with crop – Is rainfall dependent
Oltmans and Mallarino, ISU 2011

What else impacts K variability?
• Wetting and drying cycles.
• Temperature extremes.

History of Moist soil analyses • Observation that drying affects measured K
has been around since the 1920’s – J.L. Steenkamp, (1928) – O.J. Attoe, (1947) – T. E. Bates, ISU PhD Dissertation (1961) – Haby, et al. (1988) – P. Barbagelata, ISU PhD Dissertation, (2006)
• Common observations – Difference (wet vs. dried) is soil dependent – Higher rate of drying yields general positive bias – Difference relates to native K abundance

Moist K vs Dry Soil Test K Re
lativ
e Yi
eld
(%)
Wet K (ppm)
Rela
tive
Yiel
d (%
)
Standard K (ppm)
P. Barbagelata, 2006 (ISU PhD dissertation)

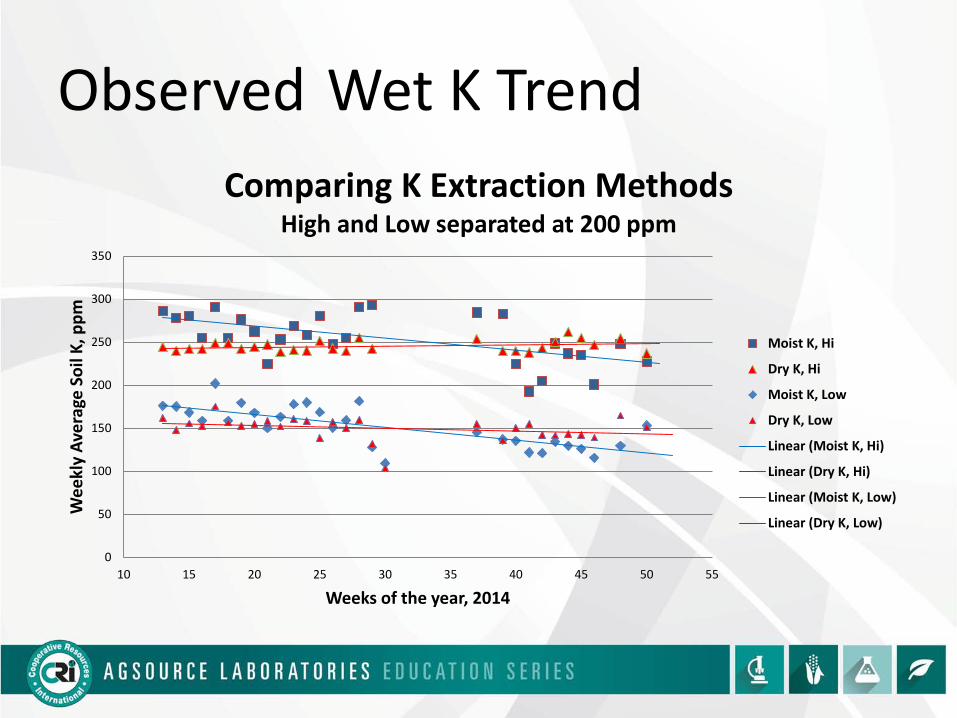
Observed Wet K Trend
0
50
100
150
200
250
9/18 9/28 10/8 10/18 10/28 11/7 11/17 11/27 12/7
K, p
pm
Analysis Date
Daily averages
Avg K
Avg Wet K
• Differences diminished over the season,
Fall 2013

Observed Wet K Trend
0
50
100
150
200
250
300
350
10 15 20 25 30 35 40 45 50
Wee
kly
Aver
age
Soil
K, p
pm
Weeks of the year, 2014
Comparing K Extraction Methods
Moist K
Dry K
Linear (Moist K)
Linear (Dry K)
0
50
100
150
200
250
300
350
10 15 20 25 30 35 40 45 50 55
Wee
kly
Aver
age
Soil
K, p
pm
Weeks of the year, 2014
Comparing K Extraction Methods High and Low separated at 200 ppm
Moist K, Hi
Dry K, Hi
Moist K, Low
Dry K, Low
Linear (Moist K, Hi)
Linear (Dry K, Hi)
Linear (Moist K, Low)
Linear (Dry K, Low)
Observed Wet K Trend

0
50
100
150
200
250
300
Moist K, Low Dry K, Low Moist K, Hi Dry K, Hi
K, p
pm
Mean monthly value in each range
Potassium Levels by Method
4/30/2014
5/29/2014
6/30/2014
8/6/2014
09/16/14
10/31/14
11/24/14
12/22/14
Observed Wet K Trend

ISU research on Moist K
Mallarino et al., 2012 (data 2001 - 2006)
Moist Soil K (ppm)0 50 100 150 200 250 300 350 400
Drie
d/M
oist
K R
atio
1.0
2.0
3.0
4.0
5.0
Soil Moisture (%)5 10 15 20 25 30 35
Drie
d/M
oist
K R
atio
1.0
2.0
3.0
4.0
5.0

0
1
2
3
4
5
6
0 50 100 150 200 250 300 350 400 450
Dry
K/W
et K
Wet K, ppm
Dry to Wet K Ratio (Dry K/Wet K) vs Wet K
Oct
Nov
Dec
Sept
Log. (Oct)
Log. (Nov)
Log. (Dec)
Log. (Sept)
Fall 2014
Observed Wet K Trend

0
1
2
3
4
5
6
0 50 100 150 200 250 300 350 400 450
Dry
K/W
et K
Wet K, ppm
Spring 2014
March-April
May
June
July-Aug
Log. (March-April)
Log. (May)
Log. (June)
Log. (July-Aug)
Log. (July-Aug)
Observed Wet K Trend

0
50
100
150
200
250
300
350
10 15 20 25 30 35 40 45 50 55
Wee
kly
Aver
age
Soil
K, p
pm
Weeks of the year, 2014
Comparing K Extraction Methods High and Low separated at 200 ppm
Moist K, Hi
Dry K, Hi
Moist K, Low
Dry K, Low
Linear (Moist K, Hi)
Linear (Dry K, Hi)
Linear (Moist K, Low)
Linear (Dry K, Low)
Observed Wet K Trend

Potassium recommendations • Base Saturation recommends
that the level be 2 – 7% of CEC.
• Sufficiency level recommends a level of 150 – 200 ppm.
• Which is right?
Rela
tive
Yiel
d %
Soil test K, ppm
P. Barbagelata, 2006 (ISU PhD dissertation)

Potassium recommendations
200 ppm K maintenance 5% of CEC target
ppm K to get to 5% of CEC
K2O build amount
CEC as % K sat as ppm K in soil if 75 ppm K in soil rate, lbs *
Over 5 years lbs K2O/year
10 5.1 (.05*10)*390 = 195 195-75 = 120 960 192
15 3.4 (.05*15)*390 = 292 292-75 = 217 1736 347
20 2.6 (.05*20)*390 = 390 390-75 = 315 2520 504
25 2.1 (.05*25)*390 = 487 487-75 = 412 3296 659
30 1.7 (.05*30)*390 = 585 585-75 = 510 4080 816
To change a soil with 75 ppm K
* Includes the factor of 8 lbs of K2O needed to raise the test level by 1 ppm

Outreach & Education
Jim Friedericks [email protected]
515-836-4444
AgSource Laboratories 1701 Detroit Street Ellsworth, IA 50075

Thank you