SOIL MOISTURE CONDITIONS IN VEGETATED CUT SLOPES AND ...
49
SOIL MOISTURE CONDITIONS IN VEGETATED CUT SLOPES AND POSSIBLE IMPLICATIONS FOR STABILITY GEO REPORT No. 140 N.C. Evans & J.S. Lam GEOTECHNICAL ENGINEERING OFFICE CIVIL ENGINEERING DEPARTMENT THE GOVERNMENT OF THE HONG KONG SPECIAL ADMINISTRATIVE REGION
Transcript of SOIL MOISTURE CONDITIONS IN VEGETATED CUT SLOPES AND ...

SOIL MOISTURE CONDITIONS IN VEGETATED CUT SLOPES
AND POSSIBLE IMPLICATIONS FOR
STABILITY
GEO REPORT No. 140
N.C. Evans & J.S. Lam
GEOTECHNICAL ENGINEERING OFFICE
CIVIL ENGINEERING DEPARTMENT
THE GOVERNMENT OF THE HONG KONG
SPECIAL ADMINISTRATIVE REGION

SOIL MOISTURE CONDITIONS IN VEGETATED CUT SLOPES
AND POSSIBLE IMPLICATIONS FOR
STABILITY
GEO REPORT No. 140
N.C. Evans & J.S. Lam
This report was originally produced in September 2002 as GEO Discussion Note No. DN 4/2002

- 2 -
© The Government of the Hong Kong Special Administrative Region
First published, December 2003
Prepared by:
Geotechnical Engineering Office, Civil Engineering Department, Civil Engineering Building, 101 Princess Margaret Road, Homantin, Kowloon, Hong Kong.
- 3 -
PREFACE
In keeping with our policy of releasing information which may be of general interest to the geotechnical profession and the public, we make available selected internal reports in a series of publications termed the GEO Report series. The GEO Reports can be downloaded from the website of the Civil Engineering Department (http://www.ced.gov.hk) on the Internet. Printed copies are also available for some GEO Reports. For printed copies, a charge is made to cover the cost of printing.
The Geotechnical Engineering Office also publishes guidance documents as GEO Publications. These publications and the printed GEO Reports may be obtained from the Government’s Information Services Department. Information on how to purchase these documents is given on the last page of this report.
R.K.S. Chan Head, Geotechnical Engineering Office
December 2003

- 4 -

- 5
CONTENTS
Page No.
Title Page 1
PREFACE 3
FOREWORD 4
CONTENTS 5
1. INTRODUCTION 7
2. CUT SLOPE DESIGN 7
3. THEORY 8
3.1 Water Balance 8
3.2 Enhanced Infiltration 9
3.3 Evapotranspiration 10
3.4 Cyclic Pore Pressures 10
3.5 Root Zone Effects 10
3.6 Topography 11
4. FIELD DATA 11
4.1 Soil Suction and Pore Pressure 11
4.1.1 Soil Suction in Chunamed and Vegetated Slopes (1) 11
4.1.2 The Mid-Levels Study 12
4.1.3 Soil Suction in Chunamed and Vegetated Slopes (2) 13
4.1.4 Effects of Changing Slope Surface Cover 13
4.1.5 Soil Suction in Vegetated Slopes 14
4.1.6 Instrumentation of a Natural Vegetated Slope 14
4.2 Infiltration and Runoff 16
5. PERFORMANCE OF VEGETATED SLOPES 17
5.1 Statistics 17
5.2 Case Studies 17
5.2.1 Route Twisk 17
5.2.2 Clearwater Bay Road 18

- 6
Page No.
6. DISCUSSION 18
6.1 Theory 18
6.1.1 Slope Setting 18
6.1.2 Enhanced Infiltration 19
6.1.3 Progressive Instability 19
6.2 Field Data 19
6.3 Performance Data 20
7. CONCLUSIONS 21
8. RECOMMENDATIONS 21
8.1 Slope Design 21
8.2 Further Work 22
8.2.1 Suction and Pore Pressure Effects 22
8.2.2 Progressive Instability 22
8.2.3 Performance Data 23
9. REFERENCES 23
LIST OF TABLES 26
APPENDIX A: DATA FROM MCFARLANE (1981) 30
APPENDIX B: DATA FROM ANDERSON (1984) 33
APPENDIX C: DATA FROM EVANS & LAM (2002) 40
APPENDIX D: ANALYSIS OF LPM SLOPE PERFORMANCE 44

- 7
1. INTRODUCTION
Vegetation has always been the preferred surface cover option for slopes constructed or upgraded by CED, and is now increasingly being used by other Works Departments. Coupled with the rapid increase in numbers of LPM slopes in recent years, and improved technology for greening slopes, this has led to a large increase in the numbers of slopes with vegetated covers. The Geotechnical Manual for Slopes (GCO, 1984) makes it clear that this is the preferred option, and that vegetation should be the primary protection method for all engineered slopes in soil and weathered rock. It has long been policy that all Government slopes should be green, and justification is now needed for providing a hard cover to any Government soil cut or fill slope. In November 2001 the Slope Safety Technical Review Board considered vegetated slope covers and made the following recommendation.
“The Board recommends that field studies be carried out on vegetated slopes, to verify the impact of vegetation on water balance and infiltration that leads to moisture migration and changes in soil suction. This will alleviate any surprises and ensure that safety is not being compromised by expanded use of vegetated slopes.”
This Note discusses how vegetated covers might affect slope stability, looks at the performance record of vegetated LPM slopes in Hong Kong, examines data already available on pore pressures and suctions beneath hard and vegetated slope covers, and makes some recommendations on design issues and future research. The Note is restricted to soil cut slopes.
2. CUT SLOPE DESIGN
The design process usually follows the guidelines given in the Geotechnical Manual for Slopes (the Manual). Slopes are supposed to be designed using the groundwater level assumed to be associated with a 10-year return period rainstorm. The Manual recommends that groundwater is monitored through a wet season, and provides a number of techniques for extrapolating monitored levels to the ten-year condition. In reality, groundwater monitoring can be somewhat haphazard, and slopes are sometimes designed with limited wet-season groundwater data. The requirement to design to a ten-year water level is taken into account as a matter of judgement, based on the individual circumstances of each slope and the availability of monitoring data. The usual approach is to assume groundwater levels somewhat higher than the maximum measured. The Manual also recommends that perched water tables should be taken into account where they might occur.
Slope stability analysis for design usually involves classical limit-equilibrium methods, with groundwater represented by a fixed water table height, ru coefficient or pore-pressure field (Wilkinson et al, 2001). Perched water tables are input where they are considered likely.
The possible role of shallow surface failures in the design process is a little unclear. Although the Manual specifically states that rapid non-circular liquefaction-style failures in the surface layers of soil, fill and colluvium are very common, it provides no specific

- 8
guidance as to how to analyse this condition.
The Manual recognises that vegetated covers can have both adverse and beneficial effects on stability, and that the associated hydrological factors are difficult to quantify. The Manual recommends that until data from local studies are available, new slope designs with vegetative cover should allow for direct infiltration, but should ignore the possible beneficial mechanical (rooting) effects. Where it can be clearly demonstrated that direct surface infiltration is a critical control of stability (as opposed to infiltration in the catchment above the slope), and stability cannot be improved by flattening the slope, then impermeable surface protection should be considered.
Prescriptive measures are an alternative to the fully-designed approach. The application of the prescriptive measures recommended in GEO Report No. 56 (Wong & Pang, 1996) is limited to soil cut slopes below a certain height with no adverse geological or hydrogeological features. No additional design or groundwater assessment is involved, and the construction methods involved are deliberately robust. The prescriptive measures recommended comprise soil nails for reinforcement, improved surface and subsurface drainage, and shotcrete, no-fines concrete or vegetated surface covers.
3. THEORY
3.1 Water Balance
When rain falls on a slope and its upstream catchment, a certain amount evaporates directly, more is recycled to the atmosphere by plant evapotranspiration, and some, the amount varying with soil moisture and rainfall intensity, will run off. The remainder passes into the soil. When the moisture-retention of the upper organic and root-zone soils is exceeded, the surplus becomes available to the groundwater system (base flow).
The groundwater regime associated with a particular slope is a function of a number of inputs. Direct infiltration of rainfall through the slope surface is only one of these. Others that need to be considered include:
(a) Transient groundwater movement within the partially saturated zone above the water table resulting from infiltration upslope, complicated by factors such as permeability contrasts within the regolith, piping, and pre-existing tension cracks. Cutoff drains are recommended to intercept such flows, but their presence and efficiency cannot be guaranteed.
(b) Deeper groundwater (the permanent “water table”) - which is affected both by the regional setting and by local baseflow from the partially saturated zone.
(c) Direct infiltration of surface runoff from upslope through the slope face - theoretically this should not occur with a crest drain in place and functioning properly.

- 9
(d) Leaking water-carrying services.
(e) Other factors that need to be considered when assessing infiltration associated with rainfall include runoff (which varies with slope cover, soil condition and rainfall intensity/duration), and evapotranspiration, which returns variable amounts of moisture to the atmosphere.
The relative contribution to the groundwater system of rainfall infiltration through a slope surface will therefore vary depending on a combination of factors at a given site. Water balance techniques are a possible way of visualising and analysing the surface, subsurface and groundwater systems associated with slopes.
3.2 Enhanced Infiltration
This is the most obvious result of using a vegetated as opposed to a hard cover. Infiltration will result both from rain falling directly on the slope and from any overland flow from upslope. Slope roughness will encourage ponding and will reduce runoff. Plant roots will further encourage infiltration by enhancing the permeability of the soil within the root zone.
A subtle factor relating to runoff (hence infiltration) on vegetated slopes relates to the specific plant type and the percentage of cover achieved. During heavy rain a mature grass cover can become flattened to the ground, where it acts as a semi-permeable cover enhancing runoff (and decreasing infiltration) as compared to a bare soil slope (but not to a hard cover).
The immediate effects of enhanced infiltration during rain will be a loss of soil suction and/or an increase in pore pressure. The rate, magnitude and depth of these water pressure effects will obviously be a function of the individual slope geology and morphology (including any surface/subsurface drainage) and the nature of the rainfall. Analytical work on the progress of wetting bands through volcanic (fine) and granitic (coarse) soils (Sun et al, 1998) suggests that this mechanism is the main cause of the relatively high number of shallow failures in weathered volcanic rocks in Hong Kong. This theoretical work indicates that the lower permeabilities associated with volcanic soils result in full saturation and maximum infiltration occurring at relatively modest rainfall intensities. The associated wetting band advances slowly but destroys suction completely. By contrast, in granitic soils with higher permeability, more intense rainfall is necessary to achieve only partial saturation, and the associated wetting band advances more rapidly, but does not destroy suction completely.
Kasim et al (1998a) presented theoretical work predicting that suction in a given soil will not disappear unless the steady-state rainfall flux approaches the coefficient of saturated permeability of the soil. This finding supports the conclusions of Sun et al (1998) as discussed above.
A secondary effect of enhanced infiltration through a vegetated slope face (as opposed to a slope with a hard cover, rather than a pre-existing natural slope) is a potential increase in base flow to any deeper groundwater system. Enhanced baseflow will tend to cause a rise in the deeper groundwater (again, as compared to the situation beneath a hard cover). Whether

- 10
this is significant or not will depend on the nature of the regional groundwater regime, the duration and intensity of the rainfall, and the size and topographic setting of the slope face. It can be speculated that runoff will be relatively low, and baseflow relatively high, on granitic as opposed to volcanic soils, due to the effects of permeability and rate of wetting band advance.
3.3 Evapotranspiration
Evapotranspiration is the combined effect of evaporation from the soil and transpiration by plants. The process removes moisture from the upper parts of the soil and the root zone. The depth of the root zone is partly dependent on the vegetation type. Grass is the usual cover on steep slopes, and has shallow (less than 0.5 m) root systems. Shrubs and small trees are often used on less steep slopes, and can develop root systems of up to 2 m in depth. Evapotranspiration will tend to reduce pore-pressure/increase soil suction in the upper parts of the soil profile, as compared to a hard cover slope. Beneath a hard cover transpiration will be negligible, and evaporation will be constrained by the thickness and permeability of the cover and the intimacy of its contact with the underlying soil. The rates of evapotranspiration on a vegetated slope vary with temperature and sunlight (which affect both direct evaporation and plant activity), and soil moisture.
3.4 Cyclic Pore Pressures
The combination of enhanced infiltration and evapotranspiration on vegetated slopes will logically be an increase in the magnitude of pore pressure cycling (positive and negative) as compared to slopes with hard covers. This is probably particularly true at shallow depth.
Lacerda & Santos (2000) discuss the role of cyclic pore pressures in initiating failures in colluvial/residual soil slopes in Rio de Janeiro. They conclude that for initially intact residual soils, the number of cycles to failure is proportional to the cyclic pore pressure ratio. For instance, a cyclic pore pressure ratio of 67% is estimated to lead to failure after 400 cycles. It is possible that this mechanism operates on vegetated soil cut slopes, where the cut exposes initially deeper material to cyclic pore pressures not previously experienced.
3.5 Root Zone Effects
As discussed above, root action in the upper part of the soil profile can be expected to enhance permeability in this zone, which can range in thickness from less than 0.5 m to over 2 m. This, in turn, could lead to the formation of a hydraulic boundary (permeability contrast) at the base of the root zone. The plant root systems might take a number of years to develop and reach full depth. Conversely, root systems left in place beneath a hard cover (most likely at the crest or upper part of a cut slope) might take some years to decay. Relict root systems might also enhance permeability.
Root systems can also reinforce the upper parts of a soil profile. Collison and Anderson (1996) used a combined hydrology/stability model to calculate the impact of a vegetation cover on slope stability. Their hypothesis was that the negative hydrological

- 11
implications of allowing a cover to develop might offset the mechanical benefits of soil reinforcement by roots. Although this work primarily compared vegetated slopes with bare soil slopes, the conclusions also have implications for vegetated as opposed to hard cover slopes. The authors carried out model simulations on a wide range of slope types. Their results indicate that the balance between positive and negative effects on slope stability is mainly a function of the percentage change in soil permeability and the height of the slope. The authors identify the development of a permeability contrast at the base of the root zone as a cause of increased pore pressure. This contrast will be most pronounced in soils of low initial permeability. The model simulations also suggested that the possible beneficial effects of vegetation (root reinforcement) are outweighed by the negative hydrological impacts as slope height increases.
3.6 Topography
Anderson (1984) recognised the possible complications introduced by variable slope and backslope topographies. To quote his report:
“… in topographically more complex conditions, and especially where there are significant hillslope hollows immediately backslope, then the dominant controls on soil suction response in the near surface zone need no longer be one dimensional. Moreover, the groundwater response in such conditions need not be infiltration controlled, but may be influenced by complex three-dimensional interactions. This has clear implications for modelling strategies. Also, in terms of possible maintenance of zones of near surface saturation, several studies have shown that hollows or dishes in backslope topography can initiate soil water convergence. The result is a concentration of higher pore pressures (or lower suctions) than in cut slopes where the backslope topography is regular. Where the convergence process occurs in humid temperate climates it has been demonstrated that localised zones of saturation can be maintained for several days and weeks in the absence of rainfall.”
Wilkinson et al (2001) extended the modelling work of Collison & Anderson (1996) to include the effects of slope concavity and backslope conditions (i.e. groundwater concentration). One of their conclusions was that steep slopes at risk from deeper-seated groundwater driven instability may be affected relatively more by slope and backslope topography than by surface cover.
4. FIELD DATA
4.1 Soil Suction and Pore Pressure
4.1.1 Soil Suction in Chunamed and Vegetated Slopes (1)
Mcfarlane (1981) reported tensiometer installations at five locations at King’s Park,

- 12
Lung Cheung Road, Happy Valley, Kennedy Town and Po Shan Road. These comprised groups of tensiometers at depths of up to 3 m, in slopes with both vegetated and chunam covers. The instruments were monitored weekly for 2 years. The sites at Kings Park and Lung Chung Road are of most interest to the present study as they both involved adjacent vegetated and chunamed cut slopes in CDG. The chunam at the Kings Park site was in “poor” condition, while that at the Lung Cheung Road site was in good condition. The conclusions of this early work can be summarised as follows:
(a) The largest and most rapid changes in soil suction occur at shallow depths.
(b) Loss of suction during rainstorms is similar in vegetated slopes and in slopes with “poor” chunam cover.
(c) Suctions beneath chunam in good condition are only slightly affected by rainfall, as long as the surface protection extends well upslope.
(d) The recovery of suction after a rainstorm is seriously impaired by the presence of chunam, even if it is poor condition. An alternative way to view this is to note that evapotranspiration is a powerful mechanism for restoring suction.
Appendix A contains summary plots of the data obtained from these two sites.
4.1.2 The Mid-Levels Study
The Mid-Levels Study (GCO, 1982 and Chipp et al, 1982) reported extensive tensiometer data for predominantly natural slopes in the Mid-Levels area of Hong Kong Island. Over 200 tensiometers were involved, over 80 of which recorded data automatically at intervals of two to 60 minutes. The general conclusions from this work are as follows:
(a) Colluvium and CDG tend to lose suction during the wet season to depths of approximately 20 m, even during dry years. All measured suctions in colluvium fell rapidly to zero or near zero after rainfall.
(b) CDV retains suction at depth during the wet season.
(c) At several locations and depths positive pore pressures of up to 5 kN/sq m were measured after rainfall.
(d) Evapotranspiration during the dry season caused upward flow to depths of about 4 m.

- 13
4.1.3 Soil Suction in Chunamed and Vegetated Slopes (2)
This is a comprehensive report addressing all aspects of measuring, predicting and using soil suction by Anderson (1984). Anderson reviewed previous work and concluded there was as yet no comprehensive field study of suction/pore pressure responses under different types of cover. Previous work had relied on point observations.
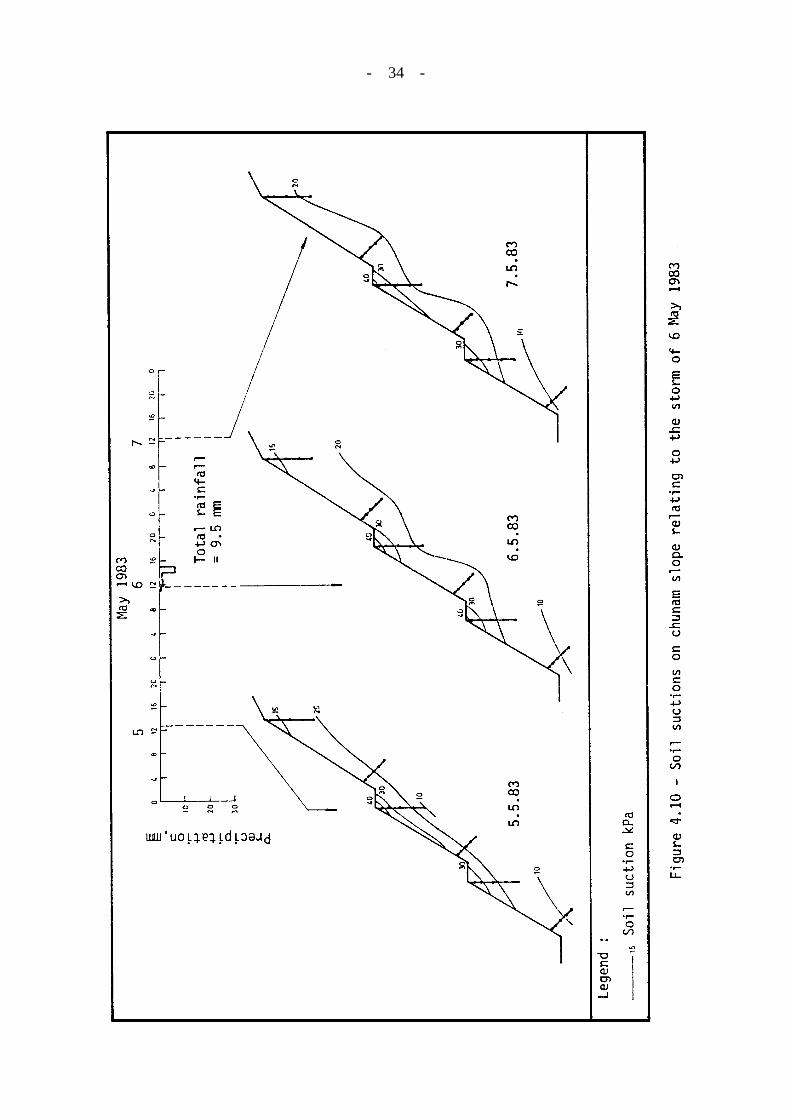
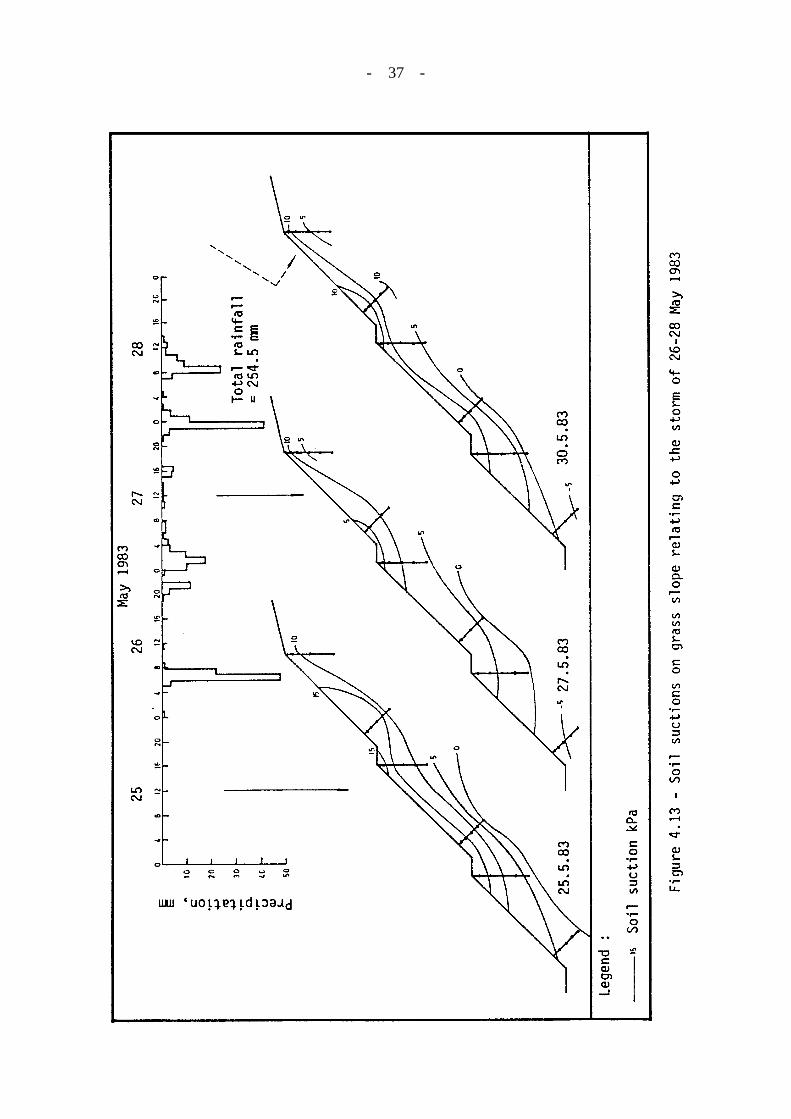
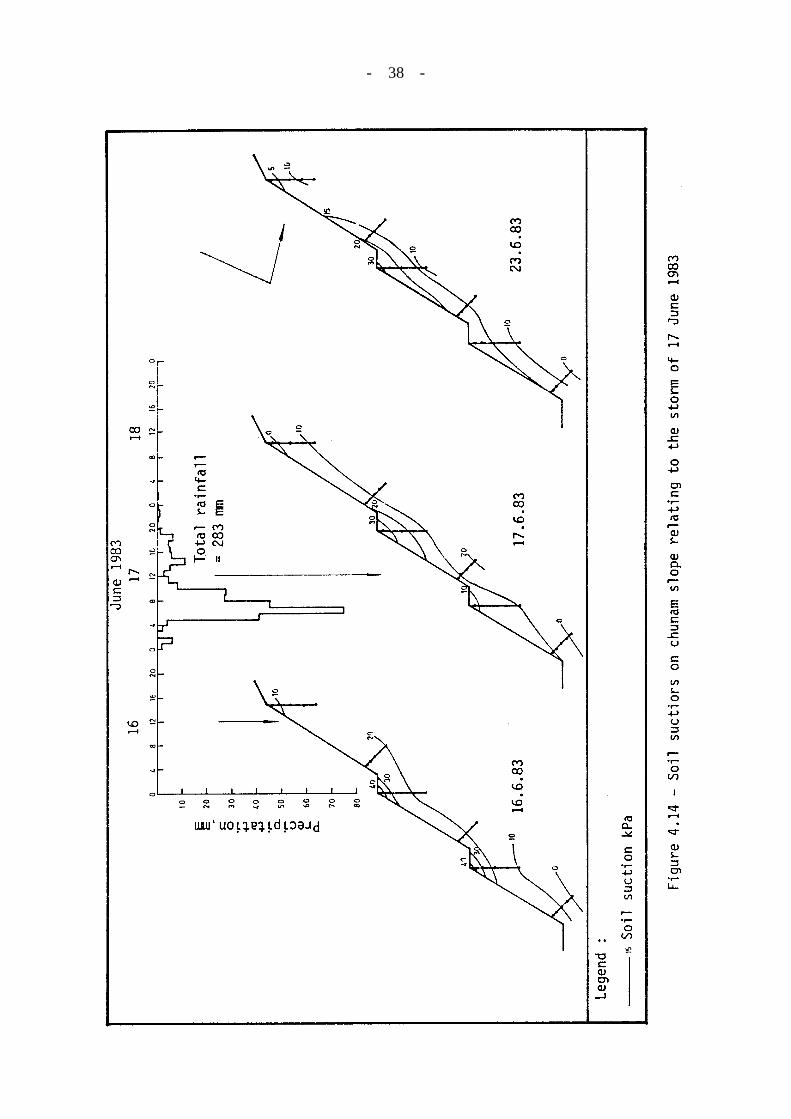
Two slopes in CDG on Clearwater Bay Road approximately 300 m apart and 25 m high were therefore instrumented with jetfill tensiometers. The site is located at an altitude of approximately 200 m and the backslope topography is relatively subdued, with natural terrain rising perhaps 50 m. One slope had a chunam cover and the other was vegetated. Tensiometer readings were taken daily. Rainfall data were taken from a raingauge approximately 0.8 km from the site. Runoff was measured. Data were obtained and analysed for late April through June 1983. Plots of the loss and recovery of suction under the slopes during three rainstorms are contained in Appendix B. The following conclusions were reached:
(a) There was evidence that significant recharge occurred from the unprotected area above the chunam slope during prolonged low intensity rainfall. However, the downslope extent of this influence was limited, and was confined to part of the upper slope.
(b) The chunam slope maintained higher suctions than the grass slope, except after prolonged low intensity rainfall as mentioned above. The mean difference in suction between the grass and chunam slopes at mid-slope locations was in excess of 10 kPa at depths of up to 4 m.
(c) At shallow depths (about 1 m), suction increase after rainfall ceases is more rapid under grass than under chunam. This is inferred to be a result of transpiration demand. At 3 m depth there is no difference.
4.1.4 Effects of Changing Slope Surface Cover
Li et al (1995) looked at six cut slopes on the northern boundary of the Tsz Wan Shan public housing estate were upgraded under the LPM programme between 1981 and 1983, due to a history of instability and groundwater problems. The slopes have a maximum height of about 65 m, and are located beneath natural terrain rising about 400 m above the site. Seepage was observed from colluvium and CDG during the works and chunam cover was installed. The suggestion is that the cover was installed because the seepage was observed, although the logic of this decision is not entirely clear as persistent seepage would seem to suggest groundwater throughflow from upslope, and the surface cover to the slope would not affect this significantly. The site was redeveloped in 1989, and it was proposed to strip the chunam and vegetate the slopes to improve the local environment. Concern was expressed about possible adverse effects on the stability of the slopes.

- 14
A series of instrumented field trials were carried out in four adjoining areas in colluvium and CDG. Automatic (vibrating wire) piezometers were installed and a series of rainstorms of 2-hr and 8-hr durations of return period at least 10 years were simulated by spraying water over the instrumented slopes, not over the catchment as a whole. The chunam cover was progressively stripped during the trials, and the slopes hydroseeded. Thermal conductivity sensors were tried for the automatic measurement of soil suction, but these proved to have a slow response and were not ultimately used. Hence no suction data were obtained. Sitework and monitoring took place between January 1991 and August 1993. Piezometer readings were taken every 15 minutes during the simulations and every 30 minutes during and after natural rainstorms.
The main conclusion of the study was that the observed perched and main water tables in the trial areas were apparently controlled by the large natural catchment above the slopes. Piezometric responses and lag times after rainfall suggested that both water tables were principally fed by infiltration and throughflow from upslope. It was concluded that, at this site, slope cover was not likely to have significant impacts on the hydrogeology. A further finding was that the automatic piezometer monitoring indicated much higher “perched water levels” (presumed to mean pore pressures) in the surface colluvium than were previously measured manually or assumed in analyses.
4.1.5 Soil Suction in Vegetated Slopes
Lim et al (1996) describe a field instrumentation program carried out to monitor negative pore-water pressure in a residual soil slope in Singapore. Suction response to rainfall was measured under a canvas-covered grassed surface, a grassed surface and a bare ground surface. Instrumentation used included standpipe piezometers, jet-fill tensiometers (automatic recording) and a raingauge.
Changes in suction due to rainfall decreased rapidly with depth, and were most significant on the bare slope and least significant on the canvas-covered slope. Vegetation was observed to increase soil suction. Positive pore pressures were observed above the groundwater table, at a depth of about 1.5 m. The authors note that most landslides in residual soils consist of relatively shallow slips above the groundwater table.
4.1.6 Instrumentation of a Natural Vegetated Slope
Evans & Lam (2002) document an area of natural terrain above the North Lantau Expressway, east of Tung Chung on Lantau Island, that has been monitored since the summer of 1999. The site is being studied to collect time-stamped data on ground movements, groundwater and rainfall. All data from the site are available in digital form.
The site comprises approximately 2.5 ha of terrain, with slopes of 30º to 40º in weathered volcanic rock. The site comprises the interfluve between two perennial streams, and is part of the lower slopes (the bottom 120 m) of a significant hill that rises to about 530 mPD. Ground movements at the site include high-mobility moderately deep slump-type failures in 4-12 m of regolith on convex 30-40º slopes, and shallow slab-slide type failures of limited mobility on a concave/planar slope of 25-35º in 3-6 m of regolith. Old backscarps
- 15
and tension cracks in the area suggest a long history of movement. The last significant movement occurred in August 1999 (Typhoon Sam).
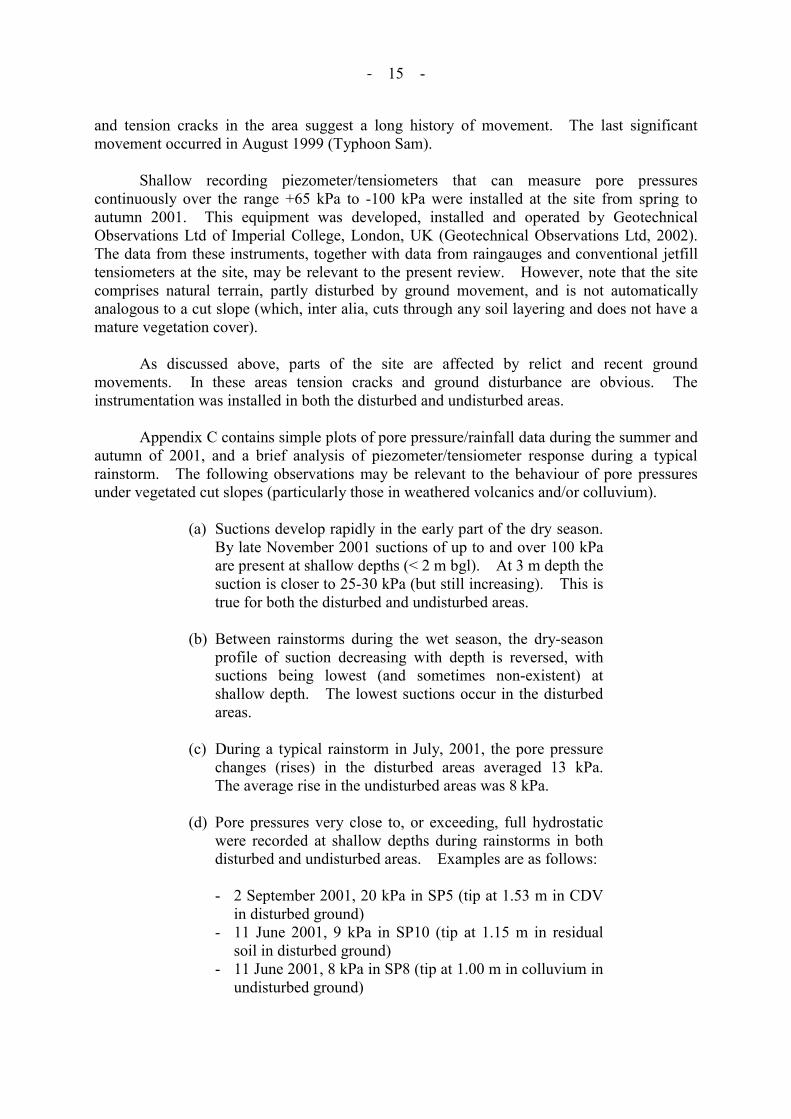
Shallow recording piezometer/tensiometers that can measure pore pressures continuously over the range +65 kPa to -100 kPa were installed at the site from spring to autumn 2001. This equipment was developed, installed and operated by Geotechnical Observations Ltd of Imperial College, London, UK (Geotechnical Observations Ltd, 2002). The data from these instruments, together with data from raingauges and conventional jetfill tensiometers at the site, may be relevant to the present review. However, note that the site comprises natural terrain, partly disturbed by ground movement, and is not automatically analogous to a cut slope (which, inter alia, cuts through any soil layering and does not have a mature vegetation cover).
As discussed above, parts of the site are affected by relict and recent ground movements. In these areas tension cracks and ground disturbance are obvious. The instrumentation was installed in both the disturbed and undisturbed areas.
Appendix C contains simple plots of pore pressure/rainfall data during the summer and autumn of 2001, and a brief analysis of piezometer/tensiometer response during a typical rainstorm. The following observations may be relevant to the behaviour of pore pressures under vegetated cut slopes (particularly those in weathered volcanics and/or colluvium).
(a) Suctions develop rapidly in the early part of the dry season. By late November 2001 suctions of up to and over 100 kPa are present at shallow depths (< 2 m bgl). At 3 m depth the suction is closer to 25-30 kPa (but still increasing). This is true for both the disturbed and undisturbed areas.
(b) Between rainstorms during the wet season, the dry-season profile of suction decreasing with depth is reversed, with suctions being lowest (and sometimes non-existent) at shallow depth. The lowest suctions occur in the disturbed areas.
(c) During a typical rainstorm in July, 2001, the pore pressure changes (rises) in the disturbed areas averaged 13 kPa. The average rise in the undisturbed areas was 8 kPa.
(d) Pore pressures very close to, or exceeding, full hydrostatic were recorded at shallow depths during rainstorms in both disturbed and undisturbed areas. Examples are as follows:
- 2 September 2001, 20 kPa in SP5 (tip at 1.53 m in CDV in disturbed ground)
- 11 June 2001, 9 kPa in SP10 (tip at 1.15 m in residual soil in disturbed ground)
- 11 June 2001, 8 kPa in SP8 (tip at 1.00 m in colluvium in undisturbed ground)
- 16
(e) Pore pressure/suction response time during rainstorms increases with depth. Responses at shallow depth can be very fast (less than 1 hour), and peaks are likely to be missed by conventional manual piezometers and tensiometers.
4.2 Infiltration and Runoff
Two slopes at the Chinese University campus were studied by Hsu et al (1983), one with vegetation and one with a chunam cover. The soil is believed to have been colluvium derived from weathered granite. The objectives were to compare soil moisture and runoff characteristics between the two slopes. Soil moisture was measured with a neutron probe. Monitoring took place from June 1981 to October 1982. Rainfall and runoff were measured by conventional means. The following conclusions were reached:
(a) For rainfall of less than 10 mm/hr, the grass slope generated approximately 4% runoff, and the chunam slope approximately 25%.
(b) For rainfall of higher intensity, the grass slope generated an average of 12% runoff and the chunam slope 50%, although the runoff was also related to rainfall duration as well as intensity.
Following recommendations from Anderson (1984) - see Section 4.1.3 above - to obtain additional data on infiltration and runoff in Hong Kong, five slopes were instrumented in 1984 and data collection began in the wet season of that year. A further two slopes were instrumented later and data were collected from seven slopes in 1985. This work is described in Premchitt et al (1992).
The seven slopes studied included the two decomposed granite cut slopes (chunam and grass cover) on Clearwater Bay Road studied by Anderson. The additional slopes comprised two decomposed granite cut slopes with tree cover in Tsuen Wan, and two decomposed granite cut slopes with grass cover in Chuk Yuen. One decomposed volcanic fill slope with grass cover in Sai Kung was also studied. The main conclusions of the study can be summarised as follows:
(a) For the vegetated slopes, little runoff is produced until cumulative rainfall has reached about 20-40 mm. This is interpreted to be a result of limited initial abstraction (take-up by vegetation), coupled with large initial infiltration. The effect is less apparent for the chunam slope, where significant runoff is generated as soon as rain starts to fall.
(b) The estimated potential infiltration through the chunam slope was consistently low, with an average runoff coefficient of 93% for rainfall greater than 50 mm. The

- 17
equivalent runoff coefficients for the vegetated slopes ranged from 27% to 67%, being highest for the volcanic fill slope.
5. PERFORMANCE OF VEGETATED SLOPES
5.1 Statistics
As part of this review, a statistical evaluation of the relative performance of vegetated and shotcreted cut slopes upgraded under the LPM programme has been carried out. The analysis was restricted to LPM slopes as consistent records are available for these, and they form a manageable and broadly representative sample. Details of the analysis are contained in Appendix D.
Table 1 shows the distribution of slope cover types, recorded failures and overall failure rates. The failure rates do not account for the change in slope population over time. True failure rates would be number of failures over population for a given period (i.e. every year), but this is a more complex analysis which the data do not support at present. Table 2 also lists failure volumes, depths and geology where these data are available. The following observations can be made from Tables 1 and 2:
(a) Overall major failure rates of vegetated and shotcreted soil cut slopes are very similar (0.4% and 0.3% respectively).
(b) Approximately 4.8% of vegetated and 0.9% of shotcreted slopes have experienced minor failures.
5.2 Case Studies
There have been a number of investigations of failures of vegetated slopes, both LPM and non-LPM. These are summarised and referenced in Table 3. This is not a proper statistical sample, as it documents only those failures investigated. One interesting observation that can be made from Table 3 is that for all the major failures, the man-made slope formed a significant percentage of the entire slope (over 20% in all cases). This is not the case for minor failures. Two of these documented failures are of particular interest, as follows:
5.2.1 Route Twisk
In June 2001, four minor shallow landslides occurred on three vegetated soil cut slopes along Route Twisk. The failures were all less than 0.5 m deep and none involved more than 3 m3 of material. Nevertheless, the incidents caused some concern as they involved slopes recently upgraded under the LPM. An investigation took place and is reported in detail in GEO (2000).
The three slopes were originally constructed before 1963 and were upgraded in 2000. The upgrading involved stripping of shotcrete, installation of soil nails, a row of raking drains

- 18
at the slope toe, and an erosion control mat. The slopes vary in height between 3 m and 18 m, and are all relatively small when compared to the substantial natural slopes behind them. Vegetation was well established on the slope faces when the failures took place. Maximum hourly and daily rainfalls at the closest raingauges during the failure period were 78 mm and 187 mm respectively. Three of the failures occurred in completely decomposed rhyolite, colluvium and completely decomposed tuff respectively, with the soil described as sandy silt/clay in all three cases. The fourth failure occurred in completely decomposed granodiorite, and the soil in this case was described as sandy silt. In all four cases the integrity of the soil nails was assessed not to have been compromised.
The GEO investigation attributed all these failures to enhanced infiltration through the slope face resulting in saturation and build-up of transient water pressures at shallow depth. It is also noted that the provision of a row of raking drains at the slope toe would not have affected this process. The possible role of soil suction (and its loss) is not discussed. The enhanced infiltration was further attributed to poor detailing of the surface cover and surface drainage, particularly a lack of surface drains to intercept water at low points on the slope and slope berms. Inadequacies in the anchoring of the erosion control mat were also noted.
5.2.2 Clearwater Bay Road
A 500 m3 failure occurred in a vegetated slope on New Clearwater Bay Road in July 1994. Failure depth was about 3 m. The slope had been upgraded under the LPM in October 1992. The failure was about 3 m deep and involved both colluvium and the underlying CDG. The slope is about 20 m high, and is located beneath a natural slope which rises about 80 m above the slope crest.
The LPM works had involved removal of the original chunam cover and hydroseeding, with additional surface drainage channels. The slope gradient was not altered, and soil nails were not installed. Although a full investigation was not carried out, the failure was attributed to the change in infiltration characteristics and groundwater response (specifically perching or seepage pressures) arising from the removal of the hard cover.
6. DISCUSSION
6.1 Theory
6.1.1 Slope Setting
The relative contribution of rainfall infiltration though a slope surface to the overall groundwater regime (i.e. the “deep” groundwater and any persistent throughflow/perching in the unsaturated zone) will depend on a combination of factors at any given site. Groundwater beneath a relatively small cut slope at the base of a large natural slope will probably be dominated by the groundwater system associated with the natural slope. Conversely, beneath a relatively large cut slope at the base of a relatively small natural slope, direct infiltration through the slope face could form a more significant part of the overall slope hydrology. Hillslope hollows above a cut slope can be expected to enhance groundwater convergence and throughflow in any given situation.

- 19
6.1.2 Enhanced Infiltration
Enhanced infiltration of rainfall through a vegetated (as opposed to hard cover) cut slope surface will result in a loss of soil suction and/or an increase in positive pore pressures in the unsaturated zone directly beneath the slope. The rate, magnitude and depth of these effects will vary with soil properties.
In lower permeability soils (such as decomposed volcanics) the infiltration capacity of the soil is quickly reached, leading to total loss of suction at shallow depths at relatively modest rainfall intensities. Runoff will be relatively high. Effects at depth will be limited and will take longer to occur.
In soils with higher permeabilities (such as colluvium and weathered granites) it takes more intense rainfall to exceed the infiltration capacity. Runoff will be lower. Loss of suction will be less than for volcanic soils under the same conditions, but will occur to greater depths in the same time.
To summarise, under a given (moderate) rainstorm, and other factors being equal, vegetated cut slopes in fine soils will tend to fail at shallow depths, while equivalent slopes in coarser soils might not be affected. As rainfall intensity increases, slopes in coarser soils might also be affected, and at a greater depth than the slopes in fine soils. As rainfall duration increases, there might be tendency for suction/pore pressure effects to begin to affect slopes in fine soils to greater depths.
6.1.3 Progressive Instability
The combined effects of enhanced infiltration and evapotranspiration in the root zone will lead to significant cycling of suctions/pore pressures beneath vegetated slopes. Pore pressure cycles will be both long-term (dry season-wet season) and short term (individual rainstorms). This might lead to progressive loss of strength in the upper part of the soil profile (with the effects probably being felt deeper in coarse than in fine soils). Those parts of the slope furthest from the original ground profile might be most susceptible to this mechanism. The timescale over which any strength loss might occur is not known.
The formation of a permeability contrast at the base of a developing root zone in previously unvegetated soil is another possible mechanism for progressive instability.
6.2 Field Data
The available field data (see Section 4) broadly support the theoretical considerations discussed above. Conclusions from the field data can be grouped as follows:
(a) Slopes with hard cover in good condition maintain higher suction during rainfall than vegetated slopes. (Anderson, 1984; McFarlane, 1981)
(b) The groundwater hydrology of slopes at the base of large

- 20
natural catchments tends to be dominated by throughflow from upslope, which controls both the deep groundwater table and any significant perched water tables. This is true for both vegetated and hard cover slopes. However, loss of suction at shallow depth beneath a hard cover tends to be limited to the upper parts of slopes, and tends to be related to rainfall of long duration rather than high intensity. (Anderson, 1984; Li et al, 1995)
(c) The largest suctions beneath vegetated slopes, and the largest and fastest changes in suctions, occur at shallow depth (down to perhaps 3-4 m). The speed and magnitude of suction loss is increased if the ground is disturbed. (Evans & Lam, 2002; Lim et al, 1996; McFarlane, 1981)
(d) Suctions of over 100 kPa at shallow depth beneath vegetated slopes in the dry season can cycle to positive pore pressures that can approach or even exceed hydrostatic during rainstorms. (Evans & Lam, 2002; Li et al, 1995; Lim et al, 1996; GCO, 1982)
(e) Evapotranspiration assists with rapid recovery of suction beneath vegetated slopes to depths of 3-4 m. A hard cover in poor condition (cracked and leaking) induces loss of suction approaching that which would occur beneath a vegetated slope. However, suction will not recover as quickly as beneath a vegetated slope due to the much lower rates of evapotranspiration. (Anderson, 1984; McFarlane, 1981; GCO, 1982)
(f) Coarser soils (decomposed granites) beneath vegetated slopes can lose suction during the wet season to depths of 20 m. Suction loss in finer soils (decomposed volcanics) tends to be restricted to shallow depths. (GCO, 1982)
(g) Runoff from slopes in fine soils (decomposed volcanics) is higher than from slopes in coarser soils (decomposed granites). (Premchitt et al, 1992)
6.3 Performance Data
Based on the sample studied, it seems that vegetated cut slopes have a significantly higher rate of minor (shallow) failure than shotcreted slopes. This is in accordance with both theory and field data, and is probably attributable to enhanced infiltration of rainwater, possibly coupled with progressive instability from cyclic strength loss and development of permeability contrasts.
Data on major failures of vegetated cut slopes are limited, but it is interesting to note

- 21
that these appear to occur where the cut slope comprises a significant part of the entire slope/backslope system (and enhanced infiltration can therefore be expected to affect the overall groundwater regime).
These observations are also in agreement with theory and field measurements.
7. CONCLUSIONS
(a) Vegetated cut slopes can be expected to have a significantly higher rate of minor (shallow) failure than slopes with a hard cover. This is almost certainly due to enhanced infiltration directly through the slope face causing suction loss and positive pore pressures at shallow depths. Contributing factors might be the development of a permeability contrast at the base of the root zone, and progressive strength loss due to cycling of positive and negative pore pressures in the upper parts of the soil profile. It is possible that slopes in CDV might be most prone to shallow failures of this nature.
(b) If a vegetated cut slope forms a significant proportion (perhaps 15-20% or more) of a complete slope system (cut slope plus backslope topography), enhanced infiltration through the cut slope face might have a significant effect on the overall slope hydrology. In theory this effect might be most noticeable, and occur to a greater depth, in slopes comprising coarser (more permeable) soils. The potential for larger than normal failures under these circumstances is apparent.
8. RECOMMENDATIONS
8.1 Slope Design
When designing a cut slope with a vegetated cover, and particularly if the works involve replacing an existing hard cover, the following points should be considered in addition to the normal stability assessments.
(a) If the cut slope forms a relatively insignificant proportion of the overall slope (cut slope plus backslope) the main concern will be localised shallow failures caused by enhanced infiltration directly through the slope face. Careful attention should be paid to surface drainage and protection detailing to ensure that:
- drains are adequately sized to prevent overflow onto the slope face;
- ponding cannot occur;

- 22
- erosion control measures are adequate and properly anchored; and
- a maintenance programme ensures satisfactory long-term performance.
In addition, consideration should be given to installing short prescriptive raking drains within the slope face. Note that raking drains at the slope toe will have minimal impact on this type of instability.
(b) If the cut slope does form a significant proportion of the overall slope (cut slope plus backslope), and particularly if the slope is in relatively permeable material, care must be taken to ensure that design water levels within the slope as a whole account for enhanced infiltration. Note that recorded water levels might not be a reliable guide to future water levels if a hard cover is being replaced with vegetation. Additional deep drainage might be necessary. Careful attention must also be paid to surface drainage and protection to prevent localised shallow failures as discussed above.
8.2 Further Work
8.2.1 Suction and Pore Pressure Effects
Earlier work has provided significant amounts of data on the differences in soil suction/pore pressure response beneath vegetated and hard cover slopes, allowing the probable effects of replacing hard cover with vegetation to be inferred. However, if resources permit, it would be preferable to confirm the inferences made with long-term monitoring of conditions beneath slopes before, during and after a change in cover. Recent advances in technology permit more detailed and possibly more accurate data to be obtained than was the case some years ago, and this is another incentive to carry out additional monitoring. Any such monitoring programme would necessarily be a medium-term commitment, extending over several years.
8.2.2 Progressive Instability
The possible role of progressive instability in vegetated slope in Hong Kong has not been investigated in detail. As discussed earlier, two potential mechanisms exist; soil strength loss due to cycling of positive and negative pore pressures, and development of permeability contrasts as a result of maturing vegetation. If these mechanisms are significant there are obvious implications for the design process.
Investigation of cyclic pore pressure effects would require: establishing realistic annual and hourly/daily pore pressure cycles for a range of conditions/depths (we have some data on this already); high quality undisturbed sampling of suitable soils (i.e. those not yet exposed to significant pore pressure cycles); and high quality laboratory work to simulate pore pressure cycles and to measure any resulting losses in strength.

- 23
Investigation of the possible development of permeability contrasts would require: high-quality undisturbed sampling through a range of soil profiles (preferably vegetated slopes at different stage of maturity); and laboratory permeability testing (preferably for saturated permeability).
A simpler approach, which might make a feasible pilot study, would involve careful trial pitting and insitu permeability testing.
There is obviously much potential for collaboration with research institutions on topics such as these.
8.2.3 Performance Data
The performance data presented in this Note should be reviewed as new data become available. Of particular interest is the performance of steep vegetated slopes, which have become more widespread in recent years.
9. REFERENCES
Anderson, M.G. (1984). Prediction of Soil Suction for Slopes in Hong Kong. GCO Publication No. 1/84, Geotechnical Engineering Office, Civil Engineering Department, Hong Kong, 242 p.
Collison, A.J.C. & Anderson, M.G. (1996). Using a combined hydrology/stability model to identify suitable conditions for landslide prevention by vegetation in the humid tropics. Earth Surface Processes and Landforms, Vol. 21, pp 737-747.
Chipp, P.N., Clare, D.G., Henkel, D.J. & Pope, R.G. (1982). Field measurement of suction in colluvium covered slopes in Hong Kong. Proceedings of the 7th South East Asian Geotechnical Conference, 22-26 November 1982, Hong Kong, pp 49-62.
Evans, N.C. & Lam, J.S. (2002). Tung Chung East - Ground Movement and Groundwater Monitoring. Technical Note TN 4/2002. Geotechnical Engineering Office, Civil Engineering Department, Hong Kong, 105 p.
GEO (1982). Mid-Levels Study. Public Works Department, Hong Kong, 264 p.
GEO (1998a). Detailed Study of the Landslide at Shing Mun Tunnel Road, Route 5, Tai Wai, on 2 July 1997. Landslide Study Report LSR 26/98. Halcrow Asia Partnership for Geotechnical Engineering Office, Hong Kong, 37 p.
GEO (1998b). Detailed Study of the Landslide at Hok Tsuen Road, Sai Kung, on 3 July 1997. Landslide Study Report LSR 21/98. Halcrow Asia Partnership for Geotechnical Engineering Office, Hong Kong, 42 p.

- 24
GEO (1999a). Detailed Study of the Landslide at Tai Po Road near Chak On Estate on 9 June 1998. Landslide Study Report LSR 18/99. Fugro Scott Wilson Joint Venture for Geotechnical Engineering Office, Hong Kong, 99 p.
GEO (1999b). Detailed Study of the Landslide at Yue Sun Garden, Wo Mei, on 9 June 1998. Landslide Study Report 8/99. Fugro Scott Wilson Joint Venture for Getechnical Engineering Office, Hong Kong, 82 p.
GEO (2000). Detailed Study of the 24 August 1999 Landslide at Tsing Yi Road, Tsing Yi Island. Fugro Maunsell Scott Wilson Joint Venture for Geotechnical Engineering Office, Hong Kong, 99 p.
GEO (2002). Review of the June 2000 Landslides on Slopes Nos. 6SE-D/C52, 6SE-B/C4 and 6N-D/C6 along Route Twisk, Tsuen Wan. Landslide Investigation Division, Geotechnical Engineering Office, Civil Engineering Department, Hong Kong, 38 p.
Kasim, F., Fredlund, D.G. & Gan, J.K.M. (1998a). The effect of steady-state rainfall on long term matric suction conditions in soil. In Slope Engineering in Hong Kong, Li, Kay & Ho (eds). Balkema, Rotterdam, pp 75-82.
Kasim, F., Gan, J.K.M. & Fredlund, D.G. (1998b). Application of the Soil-Water Characteristic Curve to Seepage and Slope Stability Problems. Report for Geotechnical Engineering Office, Civil Engineering Department, Hong Kong, 67 p.
Hsu, S.I, Lam, K.C. and Chan, K.S. (1983). A Study of Soil Moisture and Runoff Variation in Hillslopes. Occasional Paper No. 45, Department of Geography, Chinese University of Hong Kong, 57 p.
Lacerda, W.A. & Santos, J.R. (2000). Water table fluctuation - a cause of slide initiation in residual and colluvial soils in tropical regions. Landslides in Research, Theory and Practice. Thomas Telford, London, pp 877-880.
Li, F.H, Au Yeung, W.K. & Chan, C.Y. (1995). Instrumented field trials of rainstorm simulations in connection with the replacement of a chunam slope cover with vegetation for a major slope. Proceedings of the HKIE Geotechnical Division Annual Seminar, 1995, 30 p.
Lim, T.T., Rahardjo, H., Chang, M.F. & Fredlund, D.G. (1996). Effect of rainfall on matric suctions in a residual soil slope. Canadian Geotechnical Journal, vol. 33, pp 618-628.
McFarlane, J. (1981). Soil Suction and its Relation to Rainfall. GCO Report No. 13/81. Geotechnical Control Office, Hong Kong.
Premchitt, J., Lam, T.S.K., Shen, J.M. & Lam, H.F. (1992). Rainstorm Runoff on Slopes. GEO Report No. 12. Geotechnical Engineering Office, Civil Engineering Department, Hong Kong, 211 p.

- 25
Sun, H.W., Wong, H.N. & Ho, K.K.S. (1998). Analysis of infiltration in unsaturated ground. In Slope Engineering in Hong Kong, Li, Kay & Ho (eds). Balkema, Rotterdam, pp 101-109.
Wilkinson, P.L., Lloyd, D.M., Anderson, M.G. & Endicott, L.J. (2001). Hydrology-stability modelling: the importance of vegetation, slope plan topography and upslope boundary conditions. ATC Workshop. 14th SEAGC.
Wong, H.N. & Pang, L.S. (1996). Application of Prescriptive Measures to Soil Cut Slopes. GEO Report No. 56. Geotechnical Engineering Office, Civil Engineering Department, Hong Kong, 52 p.

- 26 -
LIST OF TABLES
Table Page No. No.
1 Overall Failure Rates of Vegetated and Shotcreted LPM 27 Cut Slopes
2 Failure Characteristics of Vegetated and Shotcreted LPM 28 Cut Slopes
3 Investigations of Vegetated Cut Slope Failures 29

- 27 -
Table 1 - Overall Failure Rates of Vegetated and Shotcreted LPM Cut Slopes
Slope Cover Total
Slopes Major Failures
(%) Minor Failures
(%) Total Failures
(%)
Vegetation 250 1 (0.40%) 12 (4.80%) 13 (5.20%)
Shotcrete 646 2 (0.31%) 6 (0.93%) 8 (1.24%)
Bare 5 0 0 0
Hybrid 214 1 (0.47%) 6 (2.80%) 7 (3.27%)
Unclassified 79 2 (2.53%) 5 (6.33%) 7 (8.86%)
TOTAL 1194 6 (0.4%) 29 (2.3%) 35 (2.8%)
Notes: (1)
(2) (3)
Failure percentages for bare slopes not considered statistically significant due to small sample size. Failures are those recorded after LPM works completed. “Vegetated slope” = more than 70% vegetated surface, “Shotcreted slope” = more than 70% shotcreted surface.

- 28 -
Table 2 - Failure Characteristics of Vegetated and Shotcreted LPM Cut Slopes
LPM Slope No. Failure Volume
(m3)
Failure Depth (m)
Completion Date
Failure Date
Geology
Vegetated slopes
6NE-D/C 6 3 < 0.5 2/00 6/01 CDG
10NE-BC 101 1 - 11/98 8/99 N/A
11NW-A/C 56 1 - 3/92 6/98 CDG
6NE-B/C 5 2 - 2/88 7/94 CDV
6SE-D/C 52 2 < 0.5 5/00 7/01 CDV
6SE-B/C 4 3 < 0.5 6/00 7/01 CDV/col
11SW-A/C 107 3.5 - 8/89 5/92 CDV
11NW-D/C 59 4 - 12/99 4/00 CDG
3SE-C/C 23 10 - 7/91 9/93 N/A
7NW-B/CR 26 20 - 11/93 7/94 N/A
7NW-B/CR 27 20 - 11/93 7/94 CDG
11SW-D/CR 52 30 - 5/89 5/92 CDG
11NE-A/C 53 500 3.0 10/92 7/94 CDG
Shotcreted slopes
11SE-B/C 69 0.1 - 6/89 4/93 col
11SW-A/C 155 0.5 - 12/87 6/92 N/A
11NE-D/C 44 0.5 - 6/86 8/94 CDG
11NW-D/CR 10 0.6 0.2 11/89 8/99 CDG
9SW-D/C 3 2 - 10/90 9/93 CDV
11SE-B/C 36 25 0.8 8/89 8/99 N/A
11NE-A/C 21 100 - 1/91 6/98 CDG
11NE-D/C 4 150 - 4/86 7/94 CDG

- 29 -
Tab
le 3
- I
nves
tiga
tion
s of
Veg
etat
ed C
ut S
lope
Fai
lure
s
Loc
atio
n F
ailu
reD
ate
Bui
ldD
ate
Age
at
Fai
lure
G
eolo
gy
Slo
peH
eigh
t B
acks
lope
Hei
ght
Slo
pe a
s %
of T
otal
Slo
pe
Fai
lure
Vol
ume
Fai
lure
Dep
th
Soi
lN
ails
? L
PM
Slo
pe?
Pre
viou
sIn
stab
ilit
y?
Rai
nfal
lE
xtre
mes
at
Fai
lure
R
ef
Rou
te T
wis
k (a
)
6/01
5/00
13
mon
ths
CD
V
10 m
80
0 m
1%
2
< 0
.5 m
Y
es
Yes
N
o
1 hr
78
mm
24 h
r 18
7 m
m
GE
O(2
002)
Rou
te T
wis
k (b
) 6/
00
12m
onth
s C
ollu
vium
/C
DV
13
m
40 m
25
%
3 <
0.5
m
Yes
Y
es
No
Rou
te T
wis
k (c
) C
DV
2
< 0
.5 m
Rou
te T
wis
k (d
) 2/
00
16m
onth
s C
DG
18
m
600
m
3%
3 <
0.5
m
Yes
Y
es
No
Cle
arw
ater
Bay
Roa
d 7/
94
10/9
2 21
mon
ths
CD
G
20 m
80
m
20%
50
0 3
m
No
Yes
N
o N
/A
N/A
Shi
ng M
unT
unne
l Roa
d 7/
97
12/8
9 7
1/2
year
s C
DG
70
m
270
m
21%
?
Dee
p N
o N
o Y
es
(dee
p)
2 hr
, 38
yrs
31 d
ays,
34
yrs
GE
O(1
998a
)
Hok
Tsu
en R
oad,
Sai
Kun
g 7/
97
1978
9
year
s C
DV
17
m
12 m
59
%
250
2.4
m
No
No
No
31 d
ays,
40
yrs
GE
O(1
998b
)
Tai
Po
Roa
d, n
ear
Cha
k O
n E
stat
e 6/
98
12/9
7 6
CD
G
14 m
0
100%
14
00
4 m
N
o N
o Y
es
12 h
r, 1
0 yr
s
24 h
r, 1
0 yr
s
GE
O
(199
9a)
Yue
Sun
Gar
den,
Wo
Mei
(a)
6/98
N
/A
> 3
7ye
ars
CD
V
15 m
14
m
52%
200
2
No
No
Yes
12
hr,
30
yrs
24 h
r, 3
2 yr
s
GE
O(1
999b
) Y
ue S
un G
arde
n,W
o M
ei (
b)
1100
3
Yue
Sun
Gar
den,
Wo
Mei
(c)
50
1
Tsi
ng Y
i Roa
d,T
sing
Yi
8/99
19
80
19 y
ears
C
DG
(w
ith
dyke
) 40
m
30 m
57
%
300
2 m
N
o N
o Y
es
48 h
r, 5
0 yr
s
4 da
ys, 2
0 yr
s
GE
O
(200
0)

- 30 -
APPENDIX A
DATA FROM MCFARLANE (1981)

- 31 -

- 32 -

- 33
APPENDIX B
DATA FROM ANDERSON (1984)
- 34

- 35

- 36
- 37
- 38

- 39

- 40
APPENDIX C
DATA FROM EVANS & LAM (2002)

Pre
ssur
e (k
Pa)
P
ress
ure
(kP
a)
Pre
ssur
e (k
Pa)
2001
/7/3
00:
00
2001
/7/3
09:
00
2001
/7/3
18:
00
2001
/7/4
03:
00
2001
/7/4
12:
00
2001
/7/4
21:
00
2001
/7/5
06:
00
2001
/7/5
15:
00
2001
/7/6
00:
00
2001
/7/6
09:
00
Rainstorm 24-28/6/2001
-20
-15
-10
-5
0
5
10
15
20
0
10
20
30
40
50
60
2001
/6/2
2 00
:00
2001
/6/2
2 09
:00
2001
/6/2
2 18
:00
2001
/6/2
3 03
:00
2001
/6/2
3 12
:00
2001
/6/2
3 21
:00
2001
/6/2
4 06
:00
2001
/6/2
4 15
:00
2001
/6/2
5 00
:00
2001
/6/2
5 09
:00
- 41
-40
-30
-20
-10
0
10
20
0
10
20
30
40
50
60
70
80
90
Rainstorm 5-9/7/2001
SP1 SP2 SP3 SP4 SP5 SP6 SP7 SP8 SP9 SP10
Rainfall Profile and Pore Pressures Measured by Shallow Piezometers During Rainstorms
2001
/6/8
00:
00
2001
/6/8
08:
00
2001
/6/8
16:
00
2001
/6/9
00:
00
2001
/6/9
08:
00
2001
/6/9
16:
00
2001
/6/1
0 00
:00
2001
/6/1
0 08
:00
2001
/6/1
0 16
:00
2001
/6/1
1 00
:00
2001
/7/6
18:
0020
01/6
/25
18:0
020
01/6
/11
08:0
0
2001
/7/7
03:
0020
01/6
/26
03:0
0
Rainstorm 10-13/6/2001
-20
-15
-10
-5
0
5
10
15
20
0
5
10
15
20
25
30
35 20
01/6
/11
16:0
0
2001
/7/7
12:
0020
01/6
/26
12:0
020
01/6
/12
00:0
0
2001
/7/7
21:
0020
01/6
/26
21:0
020
01/6
/12
08:0
0
2001
/7/8
06:
0020
01/6
/27
06:0
020
01/6
/12
16:0
0
2001
/7/8
15:
0020
01/6
/13
00:0
020
01/6
/27
15:0
0
2001
/7/9
00:
00
2001
/7/9
09:
00
2001
/7/9
18:
00
2001
/7/1
0 03
:00
2001
/7/1
0 12
:00
2001
/7/1
0 21
:00
2001
/7/1
1 06
:00
2001
/7/1
1 15
:00
2001
/7/1
2 00
:00
2001
/6/2
8 00
:00
2001
/6/2
8 09
:00
2001
/6/2
8 18
:00
2001
/6/2
9 03
:00
2001
/6/2
9 12
:00
2001
/6/2
9 21
:00
2001
/6/3
0 06
:00
2001
/6/3
0 15
:00
2001
/7/1
00:
00
2001
/6/1
3 08
:00
2001
/6/1
3 16
:00
2001
/6/1
4 00
:00
2001
/6/1
4 08
:00
2001
/6/1
4 16
:00
2001
/6/1
5 00
:00
2001
/6/1
5 08
:00
2001
/6/1
5 16
:00
2001
/6/1
6 00
:00
Hou
rly
Rai
nfal
l (m
m)
Hou
rly
Rai
nfal
l (m
m)
Hou
rly
Rai
nfal
l (m
m)

20
01
/10
/10
Pre
ssur
e (k
Pa)
P
ress
ure
(kP
a)
Pre
ssur
e (k
Pa)
20
01
/8/2
6 0
0:0
02
00
1/7
/12
00
:00
00
:00
20
01
/10
/11
20
01
/7/1
2 0
8:0
02
00
1/8
/26
17
:00
Rainstorm 28/8-9/9/2001
-100
-80
-60
-40
-20
0
20
0
1
2
3
4
5
6
7
8
9
10
20
:00
20
01
/10
/13
16
:00
20
01
/10
/15
12
:00
20
01
/10
/17
08
:00
20
01
/10
/19
04
:00
20
01
/10
/21
00
:00
20
01
/10
/22
20
:00
20
01
/10
/24
16
:00
20
01
/10
/26
12
:00
20
01
/8/2
7 1
0:0
0
20
01
/8/2
8 0
3:0
0
20
01
/8/2
8 2
0:0
0
20
01
/8/2
9 1
3:0
0
20
01
/8/3
0 0
6:0
0
20
01
/8/3
0 2
3:0
0
20
01
/8/3
1 1
6:0
0
20
01
/9/1
09
:00
20
01
/9/2
02
:00
- 42
-20
-15
-10
-5
0
5
10
15
20
0
10
20
30
40
50
60
70
80
Period 10/10-24/11/2001
T1 T2 T3 T4 T5 T6 T7 T8 T9 T10
SP1 SP2 SP3 SP4 SP5 SP6 SP7 SP8 SP9 SP10
Rainfall Profile and Pore Pressures Measured by Shallow Piezometers During Rainstorms
Rainstorm 14-17/7/2001
-40
-30
-20
-10
0
10
20
0
10
20
30
40
50
60
20
01
/10
/28
08
:00
20
01
/7/1
2 1
6:0
0
20
01
/7/1
3 0
0:0
0
20
01
/7/1
3 0
8:0
0
20
01
/7/1
3 1
6:0
0
20
01
/7/1
4 0
0:0
0
20
01
/7/1
4 0
8:0
0
20
01
/7/1
4 1
6:0
0
20
01
/7/1
5 0
0:0
0
20
01
/7/1
5 0
8:0
02
00
1/1
0/3
00
4:0
02
00
1/9
/2 1
9:0
02
00
1/7
/15
16
:00
20
01
/11
/1 0
0:0
0
20
01
/9/3
12
:00
20
01
/7/1
6 0
0:0
02
00
1/1
1/2
20
:00
20
01
/9/4
05
:00
20
01
/7/1
6 0
8:0
02
00
1/1
1/4
16
:00
20
01
/9/4
22
:00
20
01
/7/1
6 1
6:0
02
00
1/1
1/6
12
:00
20
01
/9/5
15
:00
20
01
/9/6
08
:00
20
01
/9/7
01
:00
20
01
/9/7
18
:00
20
01
/9/8
11
:00
20
01
/9/9
04
:00
20
01
/9/9
21
:00
20
01
/9/1
0 1
4:0
0
20
01
/9/1
1 0
7:0
0
20
01
/9/1
2 0
0:0
0
20
01
/11
/8 0
8:0
0
20
01
/11
/10
04
:00
20
01
/11
/12
00
:00
20
01
/11
/13
20
:00
20
01
/11
/15
16
:00
20
01
/11
/17
12
:00
20
01
/11
/19
08
:00
20
01
/11
/21
04
:00
20
01
/11
/23
00
:00
20
01
/11
/24
20
:00
20
01
/7/1
7 0
0:0
0
20
01
/7/1
7 0
8:0
0
20
01
/7/1
7 1
6:0
0
20
01
/7/1
8 0
0:0
0
20
01
/7/1
8 0
8:0
0
20
01
/7/1
8 1
6:0
0
20
01
/7/1
9 0
0:0
0
20
01
/7/1
9 0
8:0
0
20
01
/7/1
9 1
6:0
0
20
01
/7/2
0 0
0:0
0
Hou
rly R
ainf
all (
mm
) H
ourly
Rai
nfal
l (m
m)
Hou
rly R
ainf
all (
mm
)

- 43
Groundwater Response during Rainstorm of 5-9 July, 2001 - Tung Chung East
Tip depth (mbgl)
Surface elevation (mPD)
Time to peak after first
response (hrs)
Ground condition
Soil type at tip
Dry season suction (kPa)
Storm response
(kPa)
Storm range (kPa)
SP1 2.5 50 14 U CDV 70 -4/+2 6
SP2 3.0 32 24 D Col 30 -7/+3 10
SP3 2.0 33 10 U CDV 80 -7/+4 11
SP4 2.73 66 14 D CDV 30 -7/+17 24
SP5 1.53 66 9 D CDV 80 -2/+16 18
SP6 3.0 48 12 U CDV 25 -5/+8 13
SP7 2.62 91 - U CDV ~10 - -
SP8 1.0 91 9 U Col > 100 -4/+5 9
SP9 3.0 74 17 D CDV 25 -5/0 5
SP10 1.15 74 9 D Residual > 100 -2/+8 10
Note: SP1-SP10 are shallow recording piezometer/tensiometers.
Ground Tip depth
(mbgl)
Pre-storm average suction
(kPa)
Average storm response (kPa)
Average storm peak pore
pressure (kPa)
Average dry season suction
(kPa)
Average time to peak (hrs)
D < 2 m 0 14 12 > 100 9 > 2 m -6.3 13 6.7 28 18
U < 2 m -5.5 10 4.5 > 100 9.5 > 2 m -7.0 6.3 -0.6 35 13
Notes: (1) D - disturbed ground. (2) U - undisturbed ground.

- 44
APPENDIX D
ANALYSIS OF LPM SLOPE PERFORMANCE

- 45

- 46

- 47

- 48