Soil Laboratory Properties Summary Acland Coal … F... · Acland Coal – Soils Chemical &...
32
Acland Coal – Soils Chemical & Physical properties assessment December 07 For P W Baker ESSA Pty Ltd Page 1 REPORT Soil Laboratory Properties Summary Acland Coal Project For P W Baker & Assoc By D E Baker BSc ASSSI Environmental Soil Solutions Australia 11 December 2007
Transcript of Soil Laboratory Properties Summary Acland Coal … F... · Acland Coal – Soils Chemical &...
Acland Coal – Soils Chemical & Physical properties assessment December 07
For P W Baker ESSA Pty Ltd
Page 1
REPORT
Soil Laboratory Properties Summary Acland Coal Project
For P W Baker & Assoc
By D E Baker BSc ASSSI Environmental Soil Solutions Australia 11 December 2007

Acland Coal – Soils Chemical & Physical properties assessment December 07
For P W Baker ESSA Pty Ltd
Page 2
Report Introduction
Laboratory chemical and physical measurements of soil characteristics of soils sampled by PW Baker from Acland Coal Project Site (ACP) provide a quantifiable reference base for many purposes and uses of the soil types represented. Within the Acland Coal Project Site (ACP), a total of 11 soil profiles (a total of 89 soil samples) were taken for laboratory analysis to represent the soil profiles listed in Table D1 below. Each site chosen had Soil Chemistry and Physics for the soil it represents. Table D1. Soil Profile Sites for Laboratory Analysis
Soil Profiles Acland Coal Project
Number of Samples
Per Profile
Profile Site S2 Lab Nos 716 – 724 9
Profile Site S12 Lab Nos 725 – 733 9
Profile Site S18 Lab Nos 734 – 742 9
Profile Site S28 Lab Nos 743 – 751 9
Profile Site S36 Lab Nos 752 – 760 9
Profile Site S38 Lab Nos 761 – 768 9
Profile Site S50 Lab Nos 769 – 777 9
Profile Site S80 Lab Nos 778 – 780 3
Profile Site S87 Lab Nos 781 – 787 9
Profile Site S96 Lab Nos 788 – 795 9
Profile Site S101 Lab Nos 796 – 804 9
Project Total 89 Discussion of laboratory results, by each soil property measured, are presented in this Analytical Data Report. Analytical results are discussed for individual soil profiles and significant differences occurring for each profile sampled. A total of 89 soil samples from 11 profiles as listed in Table D1 were submitted for laboratory analysis. The samples were analysed by the Agricultural Chemistry Laboratory (ACL) Analytical Services Laboratory. Soil Analysis Methods used are as listed in Annex D and follow the Methods of soil analysis per Rayment & Higgenson (1992) “ Australian Laboratory Methods Handbook” (ALHS). The range of analyses performed for each representative soil profile was similar to those recommended in Table 1 of the manual “Interpreting Soil Analyses” by Baker and Eldershaw (1993), and are listed in Table D2 in this report.

Acland Coal – Soils Chemical & Physical properties assessment December 07
For P W Baker ESSA Pty Ltd
Page 3
Table D2. Range of laboratory analyses performed on representative profiles Acland Coal Project
Soil Test Parameter*
P 0-10 P 10-
20 P 20-
30 P 30-
40 P 40-
50 P 50-60 P 60-70 P 70-80 P 80-90
pH (1:5 Water) X X X X X X X X X
EC, (1:5 Water) X X X X X X X X X
Cl*, (1:5 Water)
X X X X X X X X X
Cations (Alcoholic, pH 8.5) X X X X
CEC X X X X
ESP X X X X
NO3-N, (1:5 Water)
X
Org. Carbon X
Sulfate - S X
Bicarbonate P X
B, Cu, Zn, Mn, Fe (trace elements)
X
% ADM X X X X
PSA (particle size distribution)
X X X
-1500 kPa (wilting point) 15 Bar
X X X
Dispersion Ratio. R1
(Dispersion Rating) X X X
Notes: * For full explanation of terms, see Annex E and ALHS. P = ‘Representative Profile’ i.e. a profile chosen as representing a particular soil; the median of
the range in characteristics is usually chosen for sampling. The sampling intervals are assumed to provide quantitative expression to the profile characteristics within each soil layer.
Px = Sample depth analysed X = This analysis is determined, blanks are not determined.
Acland Coal – soils chemical & physical properties assessment December 07
For P W Baker ESSA Pty Ltd
Page 4
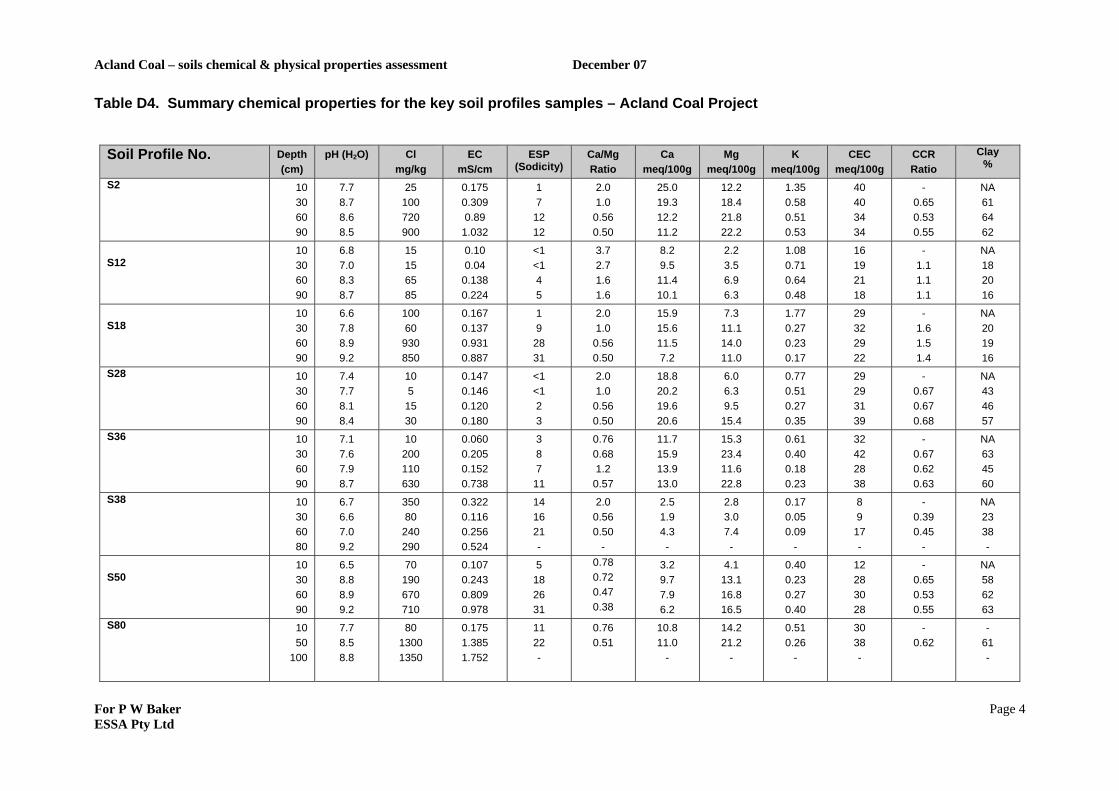
Table D4. Summary chemical properties for the key soil profiles samples – Acland Coal Project
Soil Profile No. Depth (cm)
pH (H2O) Cl mg/kg
EC mS/cm
ESP (Sodicity)
Ca/Mg Ratio
Ca meq/100g
Mg meq/100g
K meq/100g
CEC meq/100g
CCR Ratio
Clay %
S2 10 30 60 90
7.7 8.7 8.6 8.5
25 100 720 900
0.175 0.309 0.89
1.032
1 7
12 12
2.0 1.0
0.56 0.50
25.0 19.3 12.2 11.2
12.2 18.4 21.8 22.2
1.35 0.58 0.51 0.53
40 40 34 34
- 0.65 0.53 0.55
NA 61 64 62
S12
10 30 60 90
6.8 7.0 8.3 8.7
15 15 65 85
0.10 0.04
0.138 0.224
<1 <1 4 5
3.7 2.7 1.6 1.6
8.2 9.5
11.4 10.1
2.2 3.5 6.9 6.3
1.08 0.71 0.64 0.48
16 19 21 18
- 1.1 1.1 1.1
NA 18 20 16
S18
10 30 60 90
6.6 7.8 8.9 9.2
100 60
930 850
0.167 0.137 0.931 0.887
1 9
28 31
2.0 1.0
0.56 0.50
15.9 15.6 11.5 7.2
7.3 11.1 14.0 11.0
1.77 0.27 0.23 0.17
29 32 29 22
- 1.6 1.5 1.4
NA 20 19 16
S28 10 30 60 90
7.4 7.7 8.1 8.4
10 5
15 30
0.147 0.146 0.120 0.180
<1 <1 2 3
2.0 1.0
0.56 0.50
18.8 20.2 19.6 20.6
6.0 6.3 9.5
15.4
0.77 0.51 0.27 0.35
29 29 31 39
- 0.67 0.67 0.68
NA 43 46 57
S36 10 30 60 90
7.1 7.6 7.9 8.7
10 200 110 630
0.060 0.205 0.152 0.738
3 8 7
11
0.76 0.68 1.2
0.57
11.7 15.9 13.9 13.0
15.3 23.4 11.6 22.8
0.61 0.40 0.18 0.23
32 42 28 38
- 0.67 0.62 0.63
NA 63 45 60
S38 10 30 60 80
6.7 6.6 7.0 9.2
350 80
240 290
0.322 0.116 0.256 0.524
14 16 21 -
2.0 0.56 0.50
-
2.5 1.9 4.3 -
2.8 3.0 7.4 -
0.17 0.05 0.09
-
8 9
17 -
- 0.39 0.45
-
NA 23 38 -
S50
10 30 60 90
6.5 8.8 8.9 9.2
70 190 670 710
0.107 0.243 0.809 0.978
5 18 26 31
0.78 0.72 0.47 0.38
3.2 9.7 7.9 6.2
4.1 13.1 16.8 16.5
0.40 0.23 0.27 0.40
12 28 30 28
- 0.65 0.53 0.55
NA 58 62 63
S80
10 50
100
7.7 8.5 8.8
80 1300 1350
0.175 1.385 1.752
11 22 -
0.76 0.51
10.8 11.0
-
14.2 21.2
-
0.51 0.26
-
30 38 -
- 0.62
- 61 -

Acland Coal – soils chemical & physical properties assessment December 07
For P W Baker ESSA Pty Ltd
Page 5
Soil Profile No. Depth (cm)
pH (H2O) Cl mg/kg
EC mS/cm
ESP (Sodicity)
Ca/Mg Ratio
Ca meq/100g
Mg meq/100g
K meq/100g
CEC meq/100g
CCR Ratio
Clay %
S87 10 30 60 70
8.4 8.7 8.6 8.7
10 170
1150 1020
0.183 0.283 1.033 1.111
1 12 20 -
3.3 1.8 1.2 -
23.4 18.1 19.5
-
7.0 9.9
15.7 -
0..94 0.38 0.42
-
28 30 41 -
- 0.57 0.61
-
- 52 67 -
S96 10 30 60
8.1 7.9 7.9
10 5
10
0.166 0.233 0.191
<1 <1 1
3.4 3.0 1.9
50.9 48.1 43.2
14.7 16.0 22.2
1.56 1.21 1.09
66 69 66
- 0.89 0.85
- 77 77
S101 10 30 60 90
5.4 7.5 8.6 8.9
15 10 20 30
0.096 0.095 0.309 0.372
<1 6
11 16
0.78 0.63 0.56 0.33
5.0 10.2 9.1 5.8
6.4 16.0 17.2 17.4
1.05 0.35 0.38 0.51
27 31 25 25
- 0.40 0.35 0.34
- 70 70 73

Acland Coal – soils chemical & physical properties assessment December 07
For P W Baker ESSA Pty Ltd
Page 6
The laboratory chemical and physical analyses for all 11 profiles examined in detail are appended in Appendix A along with soil chemical and physical properties profile data sheets. Chemical properties of the soil profiles are summarised in Table D4. Soil pH
Soil Reaction (or pH) Soil pH provides an estimate of a soils’ acidity or alkalinity. It is an important measurement since hydrogen and hydroxyl ions have a direct influence on soil conditions and plant growth. Indirect effects are associated with changes in solubility or activity of various biologically important mineral elements and processes which occur according to the soil pH level. Determination of soil pH was on air-dry (40oC) soil of <2mm and employed a 1:5 soil:deionised water suspension. No correction for residual moisture in the air-dry soil is or should be made. Values in the surface 10 cm of soils are most critical in fertility studies, but profile trends should also be taken into account as they affect plant rooting depth and if excavated may be unsuitable as a growing media. In the discussion of the soil pH via 1:5 soil:water (pH H2O) as reported in this section. Soil pH using dilute calcium chloride (pH CaCl2) was not determined as its use is in situations where soil pH is strongly acid which these soils are not. The most acidic surface soil pH was encountered in the 0 – 10cm layers of the following profiles:
• S12 (with pH H2O of 6.8); and • S18 (with pH H2O of 6.6); and • S38 (with pH H2O of 6.7); and • S50 (with a acid pH of 6.5 recorded for water); and • S101 (with the most acidic surface pH of 5.4 in the A horizon
The remaining profiles have neutral to alkaline surface soil pH in the 0 – 10cm layers Profiles S36 (neutral pH), and S2, S28, S80, S87, S96 which are mildly to moderately alkaline (pH 7.4 – pH 8.4) Soil pH trends with depth Apart from the S96 (where pH is rated moderately alkaline throughout the sampled profile) all other sites studied have increasingly alkaline pH with increasing depth. All have a profile trend to 0.9 m to moderately (pH 8.4) to very strongly alkaline (pH 9.2). The most strongly alkaline subsoils are in the S18, S38 & S50 profiles. For best results with pastures and crops on surface soils a pH H2O (1:5) of 6.5–7.5 is recommended. Where the surface soil pH H2O is less than 6.5, lime application is recommended to decrease soil acidity and exchangeable aluminium, which may become available at these pH levels.

Acland Coal – soils chemical & physical properties assessment December 07
For P W Baker ESSA Pty Ltd
Page 7
Graphs of soil pH change with depth in the profile are illustrated in Figure 1 in Appendix A. Soil Salinity Soil salinity is a measure of the total concentration of soluble salts present. The salts, which are dissolved in the soil water at any particular time, are free to move down the profile with drainage (leached) or into the plant roots (uptake). Soil salinity should always be interpreted in conjunction with the hydrology of the area concerned. Estimates of salinity hazard are derived from both electrical conductivity (EC), which indicates the total soluble salt content, and the more problematic soluble chloride ion concentration. There was considerable variation between soil profiles for both EC and chloride. The inter-profile variation becomes more marked with increasing depth. Sodium and chloride ions are usually the cause of soil salinity but other anions may be present in the soil solution. In this area, significant sulfate present as crystalline gypsum may be present in the deeper profile and contributes to the overall EC. Soil profiles analysed that contain significant gypsum were noted in S80 and to lesser extent in deeper subsoils such as S2, S36. The most saline profiles encountered are S2, S18, S80, S87, S50. Chloride concentration is at a maximum 0.0.135% in S 80 at 90 – 100cm, which theoretically accounts for an EC 1:5 (soil:water) of 0.89 mS/cm. This means that chloride accounts for 66% of the soluble salts in S80. A similar situation exists in S2, S18, S50, and S87. The S12, S28, S96, S101 profile site soils have low salinity in the 0.9 m of profile sampled. Of interest is the salt layers found in S38 where moderate salinity was found in the 0 – 10cm sample with the chloride lower deeper in the profile. Figure 2 shows the EC profile trends for all profiles while Figure 3 shows the Chloride (Cl) profile trends for all profiles.

Acland Coal – soils chemical & physical properties assessment December 07
For P W Baker ESSA Pty Ltd
Page 8
Soil Sodicity (ESP) and Dispersion Soil sodicity (ESP) has a detrimental effect on the physical properties of a soil. A soil with high sodicity has a tendency to lose aggregation and develop clay dispersion, cause an impermeable ( low hydraulic conductivity) profile, surface crusting and poor aeration. Soil profiles with these properties in layers, if exposed, will disperse and significant dispersion (erosion) will occur. Sodicity is a measure of sodium (Na) and CEC content in a soil and is measured as ESP. ESP is defined as Exchangeable Na/CEC, expressed as a percent. Northcote and Skene (1972) defined three categories of sodicity using ESP:
• Non-Sodic (ESP <6) • Sodic (ESP 6-14) • Strongly Sodic (ESP 15+)
When, in addition to sodicity, the magnesium to calcium ratio (Mg:Ca) is less than 1, there is greater susceptibility of the soil to dispersion. Soil clay content and mineralogy can also influence dispersion. For example, the sodic cracking clays will allow water penetration while a sodic non cracking clay will not. S18, S38, S80, S87 and S 101 are the most sodic soil profiles in the study and are sodic to very strongly sodic in the upper 60 cm of the profile. ESP levels of up to 31 were found in S18 at 90 cm. In the deeper subsoils at 90 cm S18, S38, S50, S87 & S101 soils analysed are strongly sodic to very strongly sodic (ESP 15-30+). Site S38 is Sodic at surface and Strongly sodic to the 60cm tested. Emerson and Bakker (1973) found that soils with exchangeable magnesium dominating exchangeable calcium (Ca:Mg ratio <0.5 , especially) have an additional negative effect similar and additive to the ESP effect on clay dispersion. They found that in a red-brown earth the ESP required for soil dispersion was halved if associated with magnesium as the dominant cation. This additive effect is more pronounced in soils with higher clay content. For example, the S38, S50, S80 & S101 subsoils may be most affected by high levels of soil dispersion. These groups have strongly sodic subsoils with high clay content and Ca:Mg ratios at or below 0.5. However, the effect should be less pronounced in similar soils where gypsum may occur occurs in the profile, such as in S80. Figure 4 shows the ESP profile trends for selected profiles.

Acland Coal – soils chemical & physical properties assessment December 07
For P W Baker ESSA Pty Ltd
Page 9
Exchangeable cations and CEC
The proportions of exchangeable cations calcium (Ca), magnesium (Mg), potassium (K) and sodium (Na, already discussed as ESP) are important in assessing a soil’s ability to retain positively charged cations ( plant nutrients) and their distribution gives information on soil physical and chemical properties. Calcium dominant and co-dominant soils Soil profiles with calcium as the dominant cation in the surface layer occur in the S2, S12, S18, S28, S38, S87 and S96. This combined with the low ESP See Table D4 would indicate that these soil surfaces are non dispersive. In fact for S12, S96 these soils profiles would be rated non dispersive and suitable for plant growth in relation to Calcium. Generally, where exchangeable calcium and exchangeable magnesium are co-dominant (in equal concentrations) they remain co-dominant to only around 30 cm. Profiles that have co-dominant Ca and Mg are S 2, S 18 , S 28, S87. Profiles where magnesium is dominant are represented in the subsoils of S2, S18, S28, S38. Where magnesium is dominant throughout the profile and therefore of concern re soil dispersion risk are profile sites S50, S80, and S101. Critical levels for plant growth are not well defined for exchangeable potassium but levels in the surface need to be greater than a range from 0.2 meq/100g to 0.4 meq/100g. In general, the red S 38, S50 have not adequate exchangeable K (>0.4 meq/100g) in the upper subsoil. Exchangeable K becomes extremely low in the S38 below 30 cm with levels less than 0.1 meq/100g. For the clays, the surface levels are adequate and range from 1.77- > 0.4 meq/100g decreasing with depth .

Acland Coal – soils chemical & physical properties assessment December 07
For P W Baker ESSA Pty Ltd
Page 10
Soil Particle Size Distribution
Clay, silt, fine and coarse sand were determined by hydrometer to estimate the physical proportions of solid particles in the different size ranges. Clay size range is < 0.002 mm, silt is 0.002 – 0.02 mm up and fine sand and corse sand range from 0.02 mm to 2.0 mm. The highest clay percentages are found in the S101 & S96 profiles. Clay content in the subsoils is greater than 70%, as shown in Figure D4. Sites S2, S28 , S36, S50, S80 S87 have clay % in the range > 40 to <70% , these would be classed as medium to heavy clay soils. Sites S 12, S18, are soils with less 20% clay in the profile . Site S38 is intermediate clay with 23% at 30cm to 38% at 60cm (still sandy surfaced over light clay duplex soil). CEC to Clay Ratio (CCR) An indication of the clay mineral type in soils can be inferred from the CEC:clay ratio. Ratios of < 0.2 indicate a dominance of kandites and ratios of > 0.8 indicate a dominance of smectites, the expanding clays. CEC:clay ratios of 0.3-0.5 can indicate a substantial proportion of illites but ratios between 0.3 and 0.8 may also be due to mixed mineralogy. For the majority of the soils the CCR is in the range 0.6 to >1 depending on the profile the profile, irrespective of soil type and clay content. Two profiles occur with CCR >1 throughout the profile S12 & S18 which are low clay profiles. Illites are a prominent source of potassium and soils with a high proportion of these minerals tend to have high potassium levels throughout the profile. Though variable, potassium levels are generally present in moderate levels in many profiles except S38 & S50. The soils studied otherwise appear to be of mixed mineralogy and illites are probably present as a prominent component in some soils. Figure 5 shows the Clay content trends with depth for the soil profiles. Effective rooting depths and Calculated Plant Available Water Capacity (PAWC) The following data has been taken from the data report and uses the salinity profile features: Profile No Rooting depth (m) S2 0.6-0.9 S12 0.8-0.9 S18 0.5-0.6 S28 0.9 +

Acland Coal – soils chemical & physical properties assessment December 07
For P W Baker ESSA Pty Ltd
Page 11
S36 0.8 – 0.9 S38 0.8+ S50 0.6 – 0.7 S80 0.4 – 0.5 S87 0.3 – 0.5 S96 0.5 – 0.6 S101 0.8 – 0.9+ Root zone depths listed above have been used to reflect the effective rooting depth of maximum rooting species. Obviously for shallower rooting species such as perennial pastures and shallow rooting crops PAWC will be less. For deeper rooting crops and lucerne the maximum rooting depth can be used. The maximum rooting depth under rainfed conditions has also been determined as the depth to a chloride bulge and selected intermediate depths within each representative profile. The table below shows the maximum rooting depth and estimated PAWC (plant available water capacity) for each profile.
Soil Profile
Maximum rainfed rooting depth (m)
Calculated PAWC (mm) for root zones of -
0.3 m 0.6 m 0.9 m S2 0.9m 74 101 114
S12
0.9m 73 115 142
S18
0.6m 69 94 -
S28 0.9+ m 60 90 118 S36 0.9 m 76 105 134 S38 0.8 – 0.9 m 48 - 91@80cm
S50
0.8 m 72 112 133 @ 70cm
S80
0.6 – 0.7 m - 93
S87 0.3 – 0.5 m 67 82 - S96 0.5 – 0.6 m 88 - 124@80cm
S101 0.8 – 0.9+ m 82 126 151 The PAWC at the maximum rooting depth according to the chloride bulge has also been calculated for soils where the maximum varies from the standard root zone depths above and is < 1m:

Acland Coal – soils chemical & physical properties assessment December 07
For P W Baker ESSA Pty Ltd
Page 12
Soil Fertility
Summary soil fertility attributes for all the sampled profiles are contained in Table D5. Extractable Phosphorus Soil bicarbonate extractable P was determined for only each surface sample. No soil P exceeds 43 mg/kg ( except for the very high S 101) with most soils less than 20 mg/kg (low). The higher P values probably indicate soil P fertiliser additions. The lowest P was for S 87 and S36. It would seem that most unfertilised soil would benefit from some P fertiliser but P status should be checked before any pasture cropping enterprise is commenced on all soil types. The lowest extractable P measured was 4 mg/kg from S87 while S36 profile has a P concentration of 9 mg/kg. Organic Carbon and Total Nitrogen Surface soil status for organic carbon (Walkley and Black) and total (Kjeldahl) nitrogen (Total N) have been performed on the bulk 0-10 cm samples. The range of values for uncorrected Walkley and Black carbon is from <1.0 -3.4% (very low to medium) excluding the sample with 0.81% taken from sandy low clay soil, which is very low. The average level of Walkley and Black carbon is low for all soil types (except S18) and needs to be maintained or increased. Cultural practices such as trash retention, green manuring and stubble retention are recommended. The range of Total N values in the top 0-10 cm is 0.09% to 0.33% (low to moderate) the profileS18 has both the higher levels of Organic Carbon & Total Nitrogen. The lowest Total N are for S 38 and S36 & S50. The combined C:N ratio obtained for the bulk 0-10 cm samples averages 10.4 (range8.9 - 13) indicating satisfactory nitrogen mineralisation is occurring even for the higher C:N values. Commonly C:N ratios are 10 to 12 are for arable land so that at higher ratios significant N fertiliser inputs may be required to establish non leguminous crops and pastures.
Acland Coal – soils chemical & physical properties assessment December 07
For P W Baker ESSA Pty Ltd
Page 13
Trace Elements Most measured values indicate that the trace elements copper, zinc, iron and manganese are in adequate supply. Only Copper in S 36 & S 87 are rated low. Availability of zinc is influenced by soil pH and phosphate. When soil pH is alkaline some soils may show zinc deficiency when values are less than 0.8 mg/kg. Values in excess of this are recommended in these situations. Copper levels are generally adequate though levels are low in the 2 profiles mentioned above. Manganese levels are generally adequate but not high. Iron levels are generally adequate. Nitrate Nitrogen Water soluble nitrate nitrogen (NO3-N) is in low to medium supply in the top 10cm of 11 soils sampled. Levels are not adequate for the growth of most crops in sites where measured concentrations are 10mg/kg or less. Sulfate Sulphur Sulfate sulfur values range from 5 mg/kg (very low) to 24 mg/kg (medium) in the surface 10 cm. All of the soils however range from 4 to 20 mg/kg, in the very low to medium ranges. Generally, soils with less than 10 mg/kg are deficient. If high rates of P fertiliser are used on such soils then the adsorbed sulfate will be displaced (Blair 1979). Irrigation will also leach sulfate from the root zone. Sulfate is likely deficient especially in pastures. Soil sulfate levels should be checked on the soils with low to medium sulfate before any development or changes in cultural practice and soil amendments should be added if necessary.

Acland Coal – soils chemical & physical properties assessment December 07
For P W Baker ESSA Pty Ltd
Page 14
Table D5. Surface soil fertility of sampled profiles
Soil Profile Site Organic C %
P mg/kg
Cu mg/kg
Zn mg/kg
SO4 mg/k
g
NO3 mg/k
g
TotalN %
C:N Ratio
S2 2.4 23 1.7 1.0 12 6 0.228 11 S12
2.1 22 1.3 5.0 9 29 0.221 9.5
S18
3.4 20 1.9 5.4 12 19 0.328 10.3
S28 1.4 43 1.2 1.1 12 34 0.138 10.1 S36 1.1 9 1.8 0.35 5 3 0.11 10 S38 0.81 17 1.0 1.16 24 4 0.091 8.9 S50 1.2 19 1.2 0.7 11 16 0.12 10 S80 1.2 16 1.5 0.58 9 10 0.119 10 S87 1.4 4 1.6 0.38 9 22 0.146 9.6 S96 1.7 34 0.83 0.71 5 20 0.131 13 S101 1.7 113 1.0 1.99 23 31 0.143 12 APPENDIX A 1- Graphical representations of major soil properties By individual profile 2- Soil Laboratory Data Batch No 07/74, 30 November 2007 Acland Coal Project
Acland Coal – soils chemical & physical properties assessment December 07
For P W Baker ESSA Pty Ltd
Page 15
Project: ACLAND ML Soil Survey
All results in this report relate only to the items tested. Results are
expressed on an "as received basis".
Client Name: P Baker & Associates Contact: Peter Baker Sample Type: Soil Number of samples: 89

Acl
and
Coa
l – so
ils c
hem
ical
& p
hysi
cal p
rope
rtie
s ass
essm
ent
Dec
embe
r 07
For
P W
Bak
er
ESS
A P
ty L
td
Pa
ge 1
6
Env
iron
men
tal S
oil S
olut
ions
Aus
tral
ia P
ty L
td
So
il A
naly
sis R
epor
t
Bat
ch N
umbe
r: 0
7/74
D
ate
Rec
eive
d:22
/10/
2007
Dat
e C
ompl
eted
:30/
11/2
007
Clie
nt: P
Bak
er
Pr
inte
d: 3
0/11
/200
7 La
b N
o C
lient
Ref
No
Prof
ile
Dep
th
pH
EC
Cl
NO
3-N
Pb
ic
OC
SO
4-S
Ca
Mg
K
Na
CEC
ES
P
cm
m
S/cm
m
g/kg
m
g/kg
m
g/kg
%
m
g/kg
m
eq/1
00g
meq
/100
g m
eq/1
00g
meq
/100
g m
eq/1
00g
%
716
S2
0
- 10
7.7
0.17
5 25
6
23
2.4
12
25.0
12
.2
1.35
0.
31
40
1 71
7
S2
10 -
20
8.5
0.23
3 40
71
8
S2
20 -
30
8.7
0.30
9 10
0
19
.3
18.4
0.
58
2.7
40
7 71
9
S2
30 -
40
8.8
0.46
3 20
0
72
0
S2
40 -
50
8.7
0.55
4 29
0
72
1
S2
50 -
60
8.6
0.89
0 72
0
12
.2
21.8
0.
51
4.1
34
12
722
S2
60
- 70
8.
7 0.
760
510
723
S2
70
- 80
8.
6 1.
098
1000
72
4
S2
80 -
90
8.5
1.03
2 90
0
11
.2
22.2
0.
53
4.2
34
12
Lab
No
Clie
nt R
ef N
o Pr
ofile
D
epth
C
u Zn
M
n Fe
To
tal-
N
PSA
-C
S PS
A-
FS
PSA
-Si
lt PS
A-
Cla
y R
1 15
Bar
A
DM
C
cm
m
g/kg
m
g/kg
m
g/kg
m
g/kg
%
%
%
%
%
%
71
6
S2
0 - 1
0 1.
716
0.98
5 13
23
0.
228
71
7
S2
10 -
20
718
S2
20
- 30
5 21
15
61
0.
38
23
5.6
719
S2
30
- 40
72
0
S2
40 -
50
721
S2
50
- 60
8 19
12
64
0.
51
23
4.8
722
S2
60
- 70
72
3
S2
70 -
80
724
S2
80
- 90
8 19
12
62
0.
53
23
4.9
All r
esul
ts fo
r par
ticle
size
ana
lysi
s and
R1
are
repo
rted
on
oven
-dri
ed b
asis
(no
pre-
trea
tmen
t app
lied
to te
st sa
mpl
es)

Acl
and
Coa
l – so
ils c
hem
ical
& p
hysi
cal p
rope
rtie
s ass
essm
ent
Dec
embe
r 07
For
P W
Bak
er
ESS
A P
ty L
td
Pa
ge 1
7
Env
iron
men
tal S
oil S
olut
ions
Aus
tral
ia P
ty L
td
So
il A
naly
sis R
epor
t
Bat
ch N
umbe
r: 0
7/74
D
ate
Rec
eive
d:22
/10/
2007
Dat
e C
ompl
eted
:30/
11/2
007
Clie
nt: P
Bak
er
Pr
inte
d: 3
0/11
/200
7 La
b N
o C
lient
Ref
No
Prof
ile
Dep
th
pH
EC
Cl
NO
3-N
Pb
ic
OC
SO
4-S
Ca
Mg
K
Na
CEC
ES
P
cm
m
S/cm
m
g/kg
m
g/kg
m
g/kg
%
m
g/kg
m
eq/1
00g
meq
/100
g m
eq/1
00g
meq
/100
g m
eq/1
00g
%
725
S1
2 0
– 10
6.
8 0.
100
15
29
22
2.1
9 8.
2 2.
2 1.
08
<0.1
16
<1
72
6
S12
10 –
20
6.8
0.03
8 5
727
S1
2 20
– 3
0 7.
0 0.
040
15
9.5
3.5
0.71
0.
09
19
<1
728
S1
2 30
– 4
0 7.
2 0.
046
10
729
S1
2 40
– 5
0 7.
6 0.
070
30
730
S1
2 50
– 6
0 8.
3 0.
138
65
11.4
6.
9 0.
64
0.8
21
4 73
1
S12
60 –
70
8.6
0.21
4 90
73
2
S12
70 –
80
8.5
0.23
1 85
73
3
S12
80 –
90
8.7
0.22
4 85
10
.1
6.3
0.48
0.
96
18
5 La
b N
o C
lient
Ref
No
Prof
ile
Dep
th
Cu
Zn
Mn
Fe
Tota
l-N
PS
A-
CS
PSA
-FS
PS
A-
Silt
PSA
-C
lay
R1
15 B
ar
AD
MC
m
g/kg
m
g/kg
m
g/kg
m
g/kg
%
%
%
%
%
%
72
5
S12
0 - 1
0 1.
356
5.04
6 69
24
0.
221
72
6
S12
10 -
20
727
S1
2 20
- 30
8 27
9
59
0.26
18
2.
7 72
8
S12
30 -
40
729
S1
2 40
- 50
73
0
S12
50 -
60
4
19
9 69
0.
31
20
3.2
731
S1
2 60
- 70
73
2
S12
70 -
80
733
S1
2 80
- 90
9 24
13
56
0.
45
16
2.7
All r
esul
ts fo
r par
ticle
size
ana
lysi
s and
R1
are
repo
rted
on
oven
-dri
ed b
asis
(no
pre-
trea
tmen
t app
lied
to te
st sa
mpl
es)

Acl
and
Coa
l – so
ils c
hem
ical
& p
hysi
cal p
rope
rtie
s ass
essm
ent
Dec
embe
r 07
For
P W
Bak
er
ESS
A P
ty L
td
Pa
ge 1
8
Eni
ronm
enta
l Soi
l Sol
utio
ns A
ustr
alia
Pty
Ltd
Soil
Ana
lysi
s Rep
ort
B
atch
Num
ber:
07/
74
Dat
e R
ecei
ved:
22/1
0/20
07
D
ate
Com
plet
ed:3
0/11
/200
7 C
lient
: P B
aker
Prin
ted:
30/
11/2
007
Lab
No
Clie
nt R
ef N
o Pr
ofile
D
epth
pH
EC
C
l N
O3-
N
Pbic
O
C
SO4-
S C
a M
g K
N
a C
EC
ESP
cm
mS/
cm
mg/
kg
mg/
kg
mg/
kg
%
mg/
kg
meq
/100
g m
eq/1
00g
meq
/100
g m
eq/1
00g
meq
/100
g %
73
4
S18
0 - 1
0 6.
6 0.
167
100
19
20
3.4
12
15.9
7.
3 1.
77
0.27
29
1
735
S1
8 10
- 20
7.
1 0.
086
50
736
S1
8 20
- 30
7.
8 0.
137
60
15.6
11
.1
0.27
3.
0 32
9
737
S1
8 30
- 40
7.
9 0.
180
80
738
S1
8 40
- 50
8.
4 0.
327
290
739
S1
8 50
- 60
8.
9 0.
931
930
11.5
14
.0
0.23
8.
0 29
28
74
0
S18
60 -
70
9.0
1.05
5 10
70
741
S1
8 70
- 80
9.
1 0.
857
780
742
S1
8 80
- 90
9.
2 0.
887
850
7.2
11.0
0.
17
6.8
22
31
Lab
No
Clie
nt R
ef N
o Pr
ofile
D
epth
C
u Zn
M
n Fe
To
tal-
N
PSA
-C
S PS
A-
FS
PSA
-Si
lt PS
A-
Cla
y R
1 15
Bar
A
DM
C
cm
m
g/kg
m
g/kg
m
g/kg
m
g/kg
%
%
%
%
%
%
73
4
S18
0 - 1
0 1.
937
5.48
9 32
72
0.
328
73
5
S18
10 -
20
736
S1
8 20
- 30
6 22
19
54
0.
46
20
4.6
737
S1
8 30
- 40
73
8
S18
40 -
50
739
S1
8 50
- 60
8 17
17
60
0.
71
19
3.8
740
S1
8 60
- 70
74
1
S18
70 -
80
742
S1
8 80
- 90
7 20
27
49
0.
92
16
3.1
All r
esul
ts fo
r par
ticle
size
ana
lysi
s and
R1
are
repo
rted
on
oven
-dri
ed b
asis
(no
pre-
trea
tmen
t app
lied
to te
st sa
mpl
es)

Acl
and
Coa
l – so
ils c
hem
ical
& p
hysi
cal p
rope
rtie
s ass
essm
ent
Dec
embe
r 07
For
P W
Bak
er
ESS
A P
ty L
td
Pa
ge 1
9
Env
iron
men
tal S
oil S
olut
ions
Aus
tral
ia P
ty L
td
So
il A
naly
sis R
epor
t
Bat
ch N
umbe
r: 0
7/74
D
ate
Rec
eive
d:22
/10/
2007
Dat
e C
ompl
eted
:30/
11/2
007
Clie
nt: P
Bak
er
Pr
inte
d: 3
0/11
/200
7 La
b N
o C
lient
Ref
No
Prof
ile
Dep
th
Ph
EC
Cl
NO
3-N
Pb
ic
OC
SO
4-S
Ca
Mg
K
Na
CEC
ES
P
cm
M
s/cm
m
g/kg
m
g/kg
m
g/kg
%
m
g/kg
m
eq/1
00g
meq
/100
g m
eq/1
00g
meq
/100
g m
eq/1
00g
%
743
S2
8 0
– 10
7.
4 0.
147
10
34
43
1.4
12
18.8
6.
0 0.
77
<0.1
29
<1
74
4
S28
10 –
20
7.5
0.13
3 5
745
S2
8 20
– 3
0 7.
7 0.
146
5
20
.2
6.3
0.51
<0
.1
29
<1
746
S2
8 30
– 4
0 7.
9 0.
118
5
74
7
S28
40 –
50
8.0
0.12
2 10
74
8
S28
50 –
60
8.1
0.12
0 15
19
.6
9.5
0.27
0.
47
31
2 74
9
S28
60 –
70
8.4
0.19
2 35
75
0
S28
70 –
80
8.4
0.20
0 40
75
1
S28
80 –
90
8.4
0.18
0 30
20
.6
15.4
0.
35
1.29
39
3
Lab
No
Clie
nt R
ef N
o Pr
ofile
D
epth
C
u Zn
M
n Fe
To
tal-
N
PSA
-C
S PS
A-
FS
PSA
-Si
lt PS
A-
Cla
y R
1 15
Bar
A
DM
C
cm
m
g/kg
m
g/kg
m
g/kg
m
g/kg
%
%
%
%
%
%
74
3
S28
0 - 1
0 1.
244
1.09
4 19
14
0.
138
74
4
S28
10 -
20
745
S2
8 20
- 30
11
36
12
43
0.34
16
3.
6 74
6
S28
30 -
40
747
S2
8 40
- 50
74
8
S28
50 -
60
9
36
9 46
0.
34
18
4.0
749
S2
8 60
- 70
75
0
S28
70 -
80
751
S2
8 80
- 90
8 27
10
57
0.
43
22
4.7
All r
esul
ts fo
r par
ticle
size
ana
lysi
s and
R1
are
repo
rted
on
oven
-dri
ed b
asis
(no
pre-
trea
tmen
t app
lied
to te
st sa
mpl
es)

Acl
and
Coa
l – so
ils c
hem
ical
& p
hysi
cal p
rope
rtie
s ass
essm
ent
Dec
embe
r 07
For
P W
Bak
er
ESS
A P
ty L
td
Pa
ge 2
0
Env
iron
men
tal S
oil S
olut
ions
Aus
tral
ia P
ty L
td
So
il A
naly
sis R
epor
t
Bat
ch N
umbe
r: 0
7/74
D
ate
Rec
eive
d:22
/10/
2007
Dat
e C
ompl
eted
:30/
11/2
007
Clie
nt: P
Bak
er
Pr
inte
d: 3
0/11
/200
7 La
b N
o C
lient
Ref
No
Prof
ile
Dep
th
Ph
EC
Cl
NO
3-N
Pb
ic
OC
SO
4-S
Ca
Mg
K
Na
CEC
ES
P
cm
M
s/cm
m
g/kg
m
g/kg
m
g/kg
%
m
g/kg
m
eq/1
00g
meq
/100
g m
eq/1
00g
meq
/100
g m
eq/1
00g
%
752
36
0
– 10
7.
1 0.
060
10
3 9
1.1
5 11
.7
15.3
0.
61
1.09
32
3
753
36
10
– 2
0 7.
4 0.
111
40
754
36
20
– 3
0 7.
6 0.
205
200
15.9
23
.4
0.40
3.
5 42
8
755
36
30
– 4
0 7.
8 0.
272
255
756
36
40
– 5
0 7.
8 0.
076
10
757
36
50
– 6
0 7.
9 0.
152
110
13.9
11
.6
0.18
1.
88
28
7 75
8
36
60 –
70
8.3
0.34
9 33
0
75
9
36
70 –
80
8.6
0.56
7 50
0
76
0
36
80 –
90
8.7
0.73
8 63
0
13
.0
22.8
0.
23
4.3
38
11
Lab
No
Clie
nt R
ef N
o Pr
ofile
D
epth
C
u Zn
M
n Fe
To
tal-
N
PSA
-C
S PS
A-
FS
PSA
-Si
lt PS
A-
Cla
y R
1 15
Bar
A
DM
C
cm
m
g/kg
m
g/kg
m
g/kg
m
g/kg
%
%
%
%
%
%
75
2
36
0 - 1
0 1.
861
0.35
9 22
25
0.
110
75
3
36
10 -
20
754
36
20
- 30
4 23
11
63
0.
44
25
5.4
755
36
30
- 40
75
6
36
40 -
50
757
36
50
- 60
8 33
15
45
0.
32
17
3.4
758
36
60
- 70
75
9
36
70 -
80
760
36
80
- 90
7 23
9
60
0.41
22
4.
6
Al
l res
ults
for p
artic
le si
ze a
naly
sis a
nd R
1 ar
e re
port
ed o
n ov
en-d
ried
bas
is (n
o pr
e-tr
eatm
ent a
pplie
d to
test
sam
ples
)

Acl
and
Coa
l – so
ils c
hem
ical
& p
hysi
cal p
rope
rtie
s ass
essm
ent
Dec
embe
r 07
For
P W
Bak
er
ESS
A P
ty L
td
Pa
ge 2
1
Env
iron
men
tal S
oil S
olut
ions
Aus
tral
ia P
ty L
td
So
il A
naly
sis R
epor
t
Bat
ch N
umbe
r: 0
7/74
D
ate
Rec
eive
d:22
/10/
2007
Dat
e C
ompl
eted
:30/
11/2
007
Clie
nt: P
Bak
er
Pr
inte
d: 3
0/11
/200
7 La
b N
o C
lient
Ref
No
Prof
ile
Dep
th
Ph
EC
Cl
NO
3-N
Pb
ic
OC
SO
4-S
Ca
Mg
K
Na
CEC
ES
P
cm
M
s/cm
m
g/kg
m
g/kg
m
g/kg
%
m
g/kg
m
eq/1
00g
meq
/100
g m
eq/1
00g
meq
/100
g m
eq/1
00g
%
761
38
0
– 10
6.
7 0.
322
350
4 17
0.
81
24
2.5
2.8
0.17
1.
08
8 14
76
2
38
10 –
20
6.6
0.25
9 31
0
76
3
38
20 –
30
6.6
0.11
6 80
1.
9 3.
0 0.
05
1.42
9
16
764
38
30
– 4
0 6.
4 0.
242
240
765
38
40
– 5
0 7.
2 0.
225
220
766
38
50
– 6
0 7.
0 0.
256
240
4.3
7.4
0.09
3.
6 17
21
76
7
38
60 –
70
9.0
0.46
3 24
0
76
8
38
70 –
80
9.2
0.52
4 29
0
La
b N
o C
lient
Ref
No
Prof
ile
Dep
th
Cu
Zn
Mn
Fe
Tota
l-N
PS
A-
CS
PSA
-FS
PS
A-
Silt
PSA
-C
lay
R1
15 B
ar
AD
MC
cm
mg/
kg
mg/
kg
mg/
kg
mg/
kg
%
%
%
%
%
%
761
38
0
- 10
1.02
1 1.
168
59
40
0.09
1
762
38
10
- 20
76
3
38
20 -
30
31
40
6
23
0.85
7
1.5
764
38
30
- 40
76
5
38
40 -
50
766
38
50
- 60
24
32
10
38
0.88
15
2.
6 76
7
38
60 -
70
768
38
70
- 80
Al
l res
ults
for p
artic
le si
ze a
naly
sis a
nd R
1 ar
e re
port
ed o
n ov
en-d
ried
bas
is (n
o pr
e-tr
eatm
ent a
pplie
d to
test
sam
ples
)
Acl
and
Coa
l – so
ils c
hem
ical
& p
hysi
cal p
rope
rtie
s ass
essm
ent
Dec
embe
r 07
For
P W
Bak
er
ESS
A P
ty L
td
Pa
ge 2
2
Env
iron
men
tal S
oil S
olut
ions
Aus
tral
ia P
ty L
td
So
il A
naly
sis R
epor
t
Bat
ch N
umbe
r: 0
7/74
D
ate
Rec
eive
d:22
/10/
2007
Dat
e C
ompl
eted
:30/
11/2
007
Clie
nt: P
Bak
er
Pr
inte
d: 3
0/11
/200
7 La
b N
o C
lient
Ref
No
Prof
ile
Dep
th
pH
EC
Cl
NO
3-N
Pb
ic
OC
SO
4-S
Ca
Mg
K
Na
CEC
ES
P
cm
m
S/cm
m
g/kg
m
g/kg
m
g/kg
%
m
g/kg
m
eq/1
00g
meq
/100
g m
eq/1
00g
meq
/100
g m
eq/1
00g
%
769
50
0
- 10
6.5
0.10
7 70
16
19
1.
2 11
3.
2 4.
1 0.
40
0.59
12
5
770
50
10
- 20
8.
6 0.
134
50
771
50
20
- 30
8.
8 0.
243
190
9.7
13.1
0.
23
5.2
28
18
772
50
30
- 40
9.
0 0.
470
380
773
50
40
- 50
8.
7 0.
252
150
774
50
50
- 60
8.
9 0.
809
670
7.9
16.8
0.
27
7.7
30
26
775
50
60
- 70
9.
1 0.
967
780
776
50
70
- 80
9.
2 0.
963
680
777
50
80
- 90
9.
2 0.
978
710
6.2
16.5
0.
40
8.6
28
31
Lab
No
Clie
nt R
ef N
o Pr
ofile
D
epth
C
u Zn
M
n Fe
To
tal-
N
PSA
-C
S PS
A-
FS
PSA
-Si
lt PS
A-
Cla
y R
1 15
Bar
A
DM
C
cm
m
g/kg
m
g/kg
m
g/kg
m
g/kg
%
%
%
%
%
%
76
9
50
0 - 1
0 1.
196
0.72
4 38
47
0.
120
77
0
50
10 -
20
771
50
20
- 30
10
23
10
58
0.67
23
3.
6 77
2
50
30 -
40
773
50
40
- 50
77
4
50
50 -
60
8
19
11
62
0.82
25
4.
0 77
5
50
60 -
70
776
50
70
- 80
77
7
50
80 -
90
8
19
11
63
0.99
25
4.
3
Al
l res
ults
for p
artic
le si
ze a
naly
sis a
nd R
1 ar
e re
port
ed o
n ov
en-d
ried
bas
is (n
o pr
e-tr
eatm
ent a
pplie
d to
test
sam
ples
)

Acl
and
Coa
l – so
ils c
hem
ical
& p
hysi
cal p
rope
rtie
s ass
essm
ent
Dec
embe
r 07
For
P W
Bak
er
ESS
A P
ty L
td
Pa
ge 2
3
Env
iron
men
tal S
oil S
olut
ions
Aus
tral
ia P
ty L
td
So
il A
naly
sis R
epor
t
Bat
ch N
umbe
r: 0
7/74
D
ate
Rec
eive
d:22
/10/
2007
Dat
e C
ompl
eted
:30/
11/2
007
Clie
nt: P
Bak
er
Pr
inte
d: 3
0/11
/200
7 La
b N
o C
lient
Ref
No
Prof
ile
Dep
th
pH
EC
Cl
NO
3-N
Pb
ic
OC
SO
4-S
Ca
Mg
K
Na
CEC
ES
P
cm
m
S/cm
m
g/kg
m
g/kg
m
g/kg
%
m
g/kg
m
eq/1
00g
meq
/100
g m
eq/1
00g
meq
/100
g m
eq/1
00g
%
778
S8
0 0
- 10
7.7
0.17
5 80
10
16
1.
2 9
10.8
14
.2
0.51
3.
2 30
11
77
9
S80
40 -
50
8.5
1.38
5 13
00
11.0
21
.2
0.26
8.
3 38
22
78
0
S80
90 -
100
8.8
1.75
2 13
50
Lab
No
Clie
nt R
ef N
o Pr
ofile
D
epth
C
u Zn
M
n Fe
To
tal-
N
PSA
-C
S PS
A-
FS
PSA
-Si
lt PS
A-
Cla
y R
1 15
Bar
A
DM
C
cm
m
g/kg
m
g/kg
m
g/kg
m
g/kg
%
%
%
%
%
%
77
8
S80
0 - 1
0 1.
542
0.58
2 14
30
0.
119
77
9
S80
40 -
50
7
22
10
61
0.47
26
4.
5 78
0
S80
90 -
100
All r
esul
ts fo
r par
ticle
size
ana
lysi
s and
R1
are
repo
rted
on
oven
-dri
ed b
asis
(no
pre-
trea
tmen
t app
lied
to te
st sa
mpl
es)

Acl
and
Coa
l – so
ils c
hem
ical
& p
hysi
cal p
rope
rtie
s ass
essm
ent
Dec
embe
r 07
For
P W
Bak
er
ESS
A P
ty L
td
Pa
ge 2
4
Env
iron
men
tal S
oil S
olut
ions
Aus
tral
ia P
ty L
td
So
il A
naly
sis R
epor
t
Bat
ch N
umbe
r: 0
7/74
D
ate
Rec
eive
d:22
/10/
2007
Dat
e C
ompl
eted
:30/
11/2
007
Clie
nt: P
Bak
er
Pr
inte
d: 3
0/11
/200
7 La
b N
o C
lient
Ref
No
Prof
ile
Dep
th
pH
EC
Cl
NO
3-N
Pb
ic
OC
SO
4-S
Ca
Mg
K
Na
CEC
ES
P
cm
m
S/cm
M
g/kg
m
g/kg
m
g/kg
%
m
g/kg
m
eq/1
00g
meq
/100
g m
eq/1
00g
meq
/100
g m
eq/1
00g
%
781
87
0
- 10
8.4
0.18
3 10
22
4
1.4
9 23
.4
7.0
0.94
0.
18
28
1 78
2
87
10 -
20
8.6
0.21
3 40
78
3
87
20 -
30
8.7
0.28
3 17
0
18
.1
9.9
0.38
3.
6 30
12
78
4
87
30 -
40
8.5
0.46
1 42
0
78
5
87
40 -
50
8.5
0.75
7 79
0
78
6
87
50 -
60
8.6
1.03
3 11
50
19.5
15
.7
0.42
8.
4 41
20
78
7
87
60 -
70
8.7
1.11
1 10
20
Lab
No
Clie
nt R
ef N
o Pr
ofile
D
epth
C
u Zn
M
n Fe
To
tal-
N
PSA
-C
S PS
A-
FS
PSA
-Si
lt PS
A-
Cla
y R
1 15
Bar
A
DM
C
cm
m
g/kg
m
g/kg
M
g/kg
m
g/kg
%
%
%
%
%
%
78
1
87
0 - 1
0 1.
580
0.38
3 9
13
0.14
6
782
87
10
- 20
78
3
87
20 -
30
7
31
14
52
0.49
23
3.
7 78
4
87
30 -
40
785
87
40
- 50
78
6
87
50 -
60
4
18
12
67
0.60
29
5.
2 78
7
87
60 -
70
All r
esul
ts fo
r par
ticle
size
ana
lysi
s and
R1
are
repo
rted
on
oven
-dri
ed b
asis
(no
pre-
trea
tmen
t app
lied
to te
st sa
mpl
es)

Acl
and
Coa
l – so
ils c
hem
ical
& p
hysi
cal p
rope
rtie
s ass
essm
ent
Dec
embe
r 07
For
P W
Bak
er
ESS
A P
ty L
td
Pa
ge 2
5
Env
iron
men
tal S
oil S
olut
ions
Aus
tral
ia P
ty L
td
So
il A
naly
sis R
epor
t
Bat
ch N
umbe
r: 0
7/74
D
ate
Rec
eive
d:22
/10/
2007
Dat
e C
ompl
eted
:30/
11/2
007
Clie
nt: P
Bak
er
Pr
inte
d: 3
0/11
/200
7 La
b N
o C
lient
Ref
No
Prof
ile
Dep
th
pH
EC
Cl
NO
3-N
Pb
ic
OC
SO
4-S
Ca
Mg
K
Na
CEC
ES
P
cm
m
S/cm
m
g/kg
m
g/kg
m
g/kg
%
m
g/kg
m
eq/1
00g
meq
/100
g m
eq/1
00g
meq
/100
g m
eq/1
00g
%
788
96
0
- 10
8.1
0.16
6 10
20
34
1.
7 5
50.9
14
.7
1.56
<0
.1
66
<1
789
96
10
- 20
8.
0 0.
179
5
79
0
96
20 -
30
7.9
0.23
3 5
48.1
16
.0
1.21
0.
20
69
<1
791
96
30
- 40
7.
8 0.
189
10
792
96
40
- 50
7.
8 0.
139
5
79
3
96
50 -
60
7.9
0.19
1 10
43
.2
22.2
1.
09
0.76
66
1
794
96
60
- 70
8.
2 0.
283
5
79
5
96
70 -
80
8.4
0.19
4 5
Lab
No
Clie
nt R
ef N
o Pr
ofile
D
epth
C
u Zn
M
n Fe
To
tal-
N
PSA
-C
S PS
A-
FS
PSA
-Si
lt PS
A-
Cla
y R
1 15
Bar
A
DM
C
cm
m
g/kg
m
g/kg
m
g/kg
m
g/kg
%
%
%
%
%
%
78
8
96
0 - 1
0 0.
824
0.70
8 6
23
0.13
1
789
96
10
- 20
79
0
96
20 -
30
2
12
12
77
0.33
44
9.
0 79
1
96
30 -
40
792
96
40
- 50
79
3
96
50 -
60
2
11
11
77
0.36
45
8.
4 79
4
96
60 -
70
795
96
70
- 80
Al
l res
ults
for p
artic
le si
ze a
naly
sis a
nd R
1 ar
e re
port
ed o
n ov
en-d
ried
bas
is (n
o pr
e-tr
eatm
ent a
pplie
d to
test
sam
ples
)

Acl
and
Coa
l – so
ils c
hem
ical
& p
hysi
cal p
rope
rtie
s ass
essm
ent
Dec
embe
r 07
For
P W
Bak
er
ESS
A P
ty L
td
Pa
ge 2
6
Env
iron
men
tal S
oil S
olut
ions
Aus
tral
ia P
ty L
td
So
il A
naly
sis R
epor
t
Bat
ch N
umbe
r: 0
7/74
D
ate
Rec
eive
d:22
/10/
2007
Dat
e C
ompl
eted
:30/
11/2
007
Clie
nt: P
Bak
er
Pr
inte
d: 3
0/11
/200
7 La
b N
o C
lient
Ref
No
Prof
ile
Dep
th
pH
EC
Cl
NO
3-N
Pb
ic
OC
SO
4-S
Ca
Mg
K
Na
CEC
ES
P
cm
m
S/cm
m
g/kg
m
g/kg
m
g/kg
%
m
g/kg
m
eq/1
00g
meq
/100
g m
eq/1
00g
meq
/100
g m
eq/1
00g
%
796
10
1 0
- 10
5.4
0.09
6 15
31
11
3 1.
7 23
5.
0 6.
4 1.
05
<0.1
27
<1
79
7
101
10 -
20
6.7
0.08
8 15
79
8
101
20 -
30
7.5
0.09
5 10
10
.2
16.0
0.
35
1.72
31
6
799
10
1 30
- 40
8.
2 0.
188
10
800
10
1 40
- 50
8.
6 0.
287
15
801
10
1 50
- 60
8.
6 0.
309
20
9.1
17.2
0.
38
2.7
25
11
802
10
1 60
- 70
8.
7 0.
340
25
803
10
1 70
- 80
8.
8 0.
351
25
804
10
1 80
- 90
8.
9 0.
372
30
5.8
17.4
0.
51
4.0
25
16
Lab
No
Clie
nt R
ef N
o Pr
ofile
D
epth
C
u Zn
M
n Fe
To
tal-
N
PSA
-C
S PS
A-
FS
PSA
-Si
lt PS
A-
Cla
y R
1 15
Bar
A
DM
C
cm
m
g/kg
m
g/kg
m
g/kg
m
g/kg
%
%
%
%
%
%
79
6
101
0 - 1
0 1.
006
1.99
3 44
11
9 0.
143
79
7
101
10 -
20
798
10
1 20
- 30
3 15
15
70
0.
30
27
4.6
799
10
1 30
- 40
80
0
101
40 -
50
801
10
1 50
- 60
8 12
12
70
0.
52
27
4.2
802
10
1 60
- 70
80
3
101
70 -
80
804
10
1 80
- 90
7 11
11
73
0.
68
28
4.4
All r
esul
ts fo
r par
ticle
size
ana
lysi
s and
R1
are
repo
rted
on
oven
-dri
ed b
asis
(no
pre-
trea
tmen
t app
lied
to te
st sa
mpl
es)

Acl
and
Coa
l – so
ils c
hem
ical
& p
hysi
cal p
rope
rtie
s ass
essm
ent
Dec
embe
r 07
For
P W
Bak
er
ESS
A P
ty L
td
Pa
ge 2
7
Env
iron
men
tal S
oil S
olut
ions
Aus
tral
ia P
ty L
td
ME
TH
OD
DE
SCR
IPT
ION
S
So
il
R
efer
ence
: 07
/74
Page
: 13
of 1
5
M
etho
ds u
sed
to A
naly
se S
ampl
es
Ana
lyte
A
LH
S*
Unc
erta
inty
%
LO
Q
Uni
t N
ame
Met
hod
Des
crip
tion
pH
4A1
1.1
0.1
pH
pH
1:5
wat
er e
xtr,
pH m
eter
E
C
3A1
5.4
0.01
dS
/m
Elec
trica
l con
duct
ivity
1:
5 w
ater
ext
r, EC
met
er
Cl
5A2
10.0
10
.0
mg/
kg
Chl
orid
e 1:
5 w
ater
ext
r, (A
A) c
olor
imet
ric
N
O3-
N
7C2
6.7
1.0
mg/
kg
Nitr
ate-
nitro
gen
1M K
Cl e
xtr,
(AA
) col
orim
etric
NH
4-N
7C
2 7.
8 0.
6 m
g/kg
A
mm
oniu
m-n
itrog
en
1M K
Cl e
xtr,
(AA
) col
orim
etric
Bic
arb.
P
9B
2 16
.8
1.0
mg/
kg
Bic
arb.
ext.p
hosp
horu
s 0.
5M N
aHC
O3
@ p
H 8
.5, (
AA
) col
orim
etric
T
N
7A2
12.9
0.
01
%
Tota
l N
itrog
en
Sulp
huric
aci
d di
gest
, (A
A) c
olor
imet
ric
OC
8B
1 9.
7 0.
02
%
Org
anic
Car
bon
Wal
kley
& B
lack
, (H
2SO
4/K
2Cr2
O7)
, abs
.600
nm
Ca
(Neu
t)
15
A1
10.3
0.10
meq
/100
gEx
chan
geab
le c
alci
um1M
NH
4Cl
@ p
H 7
.0 sh
ake,
AA
SM
g (N
eut)
15
A1
6.6
0.10
m
eq/1
00g
Exch
ange
able
mag
nesi
um
1M N
H4C
l @
pH
7.0
shak
e, A
AS
N
a (N
eut)
15
A1
7.3
0.03
m
eq/1
00g
Exch
ange
able
cal
cium
1M
NH
4Cl
@ p
H 7
.0 sh
ake,
AA
S
K
(Neu
t)
15A
1 3.
9 0.
02
meq
/100
g Ex
chan
geab
le c
alci
um
1M N
H4C
l @
pH
7.0
shak
e, A
AS
E
CE
C
15J1
5.
0 1
meq
/100
g Ef
fect
ive
catio
n ex
.cap
acity
Su
m o
f exc
hang
eabl
e ca
tions
ESP
15
N1
5.0
3 %
Ex
chan
geab
le N
a%
(Exc
hang
eabl
e N
a/su
m o
f exc
h.ca
tions
)%
Sand
no
ref
22.1
1.
0 %
Pa
rticl
e si
ze, s
and
Hyd
rom
eter
, gra
vim
etric
Silt
no re
f 16
.6
1.0
%
Parti
cle
size
, silt
H
ydro
met
er, g
ravi
met
ric
C
lay
no re
f 12
.7
1.0
%
Parti
cle
size
, cla
y H
ydro
met
er, g
ravi
met
ric
*
Aus
tral
ian
Lab
orat
ory
Han
dboo
k of
Soi
l and
Wat
er C
hem
ical
Met
hods
(199
2)
Fo
r Man
ager
A
naly
tical
Ser
vice
s:

Acl
and
Coa
l – so
ils c
hem
ical
& p
hysi
cal p
rope
rtie
s ass
essm
ent
Dec
embe
r 07
For
P W
Bak
er
ESS
A P
ty L
td
Pa
ge 2
8
Env
iron
men
tal S
oil S
olut
ions
Aus
tral
ia P
ty L
td
ME
TH
OD
DE
SCR
IPT
ION
S
So
il
R
efer
ence
: 07
/74
Page
14
of 1
5
M
etho
ds u
sed
to A
naly
se S
ampl
es
A
naly
te
AL
HS*
U
ncer
tain
ty %
L
OQ
U
nit
Nam
e M
etho
d D
escr
iptio
n
C
a (A
lc)
15C
1 7.
2 0.
18
meq
/100
g Ex
chan
geab
le c
alci
um
1M N
H4C
l (al
coho
lic)
@ p
H 8
.5 le
ach,
AA
S M
g (A
lc)
15C
1 4.
7 0.
31
meq
/100
g Ex
chan
geab
le m
agne
sium
1M
NH
4Cl (
alco
holic
) @
pH
8.5
leac
h, A
AS
Na
(Alc
)
15
C1
9.6
0.09
m
eq/1
00g
Exch
ange
able
cal
cium
1M
NH
4Cl (
alco
holic
) @
pH
8.5
leac
h, A
AS
K
(Alc
)
15
C1
4.8
0.02
m
eq/1
00g
Exch
ange
able
cal
cium
1M
NH
4Cl (
alco
holic
) @
pH
8.5
leac
h, A
AS
CE
C
15I3
5.
7 1.
0 m
eq/1
00g
Cat
ion
Exch
ange
Cap
acity
K
NO
3 +
Ca(
NO
3)2
extr,
(AA
) col
orim
etric
D
TPA
-Cu
12A
1 17
.1
0.26
m
g/kg
D
TPA
ext
. cop
per
DTP
A e
xtra
ctio
n, A
AS
DT
PA-Z
n
12
A1
16.4
0.
10
mg/
kg
DTP
A e
xt. z
inc
DTP
A e
xtra
ctio
n, A
AS
DT
PA-M
n
12
A1
9.0
0.32
m
g/kg
D
TPA
ext
. man
gane
se
DTP
A e
xtra
ctio
n, A
AS
DT
PA-F
e
12
A1
13.0
0.
23
mg/
kg
DTP
A e
xt. i
ron
DTP
A e
xtra
ctio
n, A
AS
AD
MC
2A
1 11
.9
0.4
%
Air
Drie
d M
oist
ure
Cont
ent
Gra
vim
etric
ove
n dr
y @
105
C
R
1
N
A
20.2
N
A
D
ispe
rsio
n R
atio
R
atio
[Aqu
eous
dis
pers
ible
(Silt
+ C
lay)
:Tot
al (S
ilt +
Cla
y)]
SO4-
S
10B
3 11
.50.
6m
g/kg
Sulfa
te su
lfur
Ca(
H2P
O4)
2 @
pH
4.0
ext
ract
able
sulfa
te-s
ulfu
r, IC
POES
A
l
15
G1
NA
N
A
meq
/100
g Ex
chan
geab
le A
lum
iniu
m
Exch
. Hyd
roge
n an
d A
lum
iniu
m b
y 1M
KC
l H
+
15
G1
NA
N
A
meq
/100
g Ex
chan
geab
le A
cidi
ty
Exch
. Hyd
roge
n an
d A
lum
iniu
m b
y 1M
KC
l 15
Bar
NA
N
A
15
Bar
Ana
lysi
s Pr
essu
re P
late
/Gra
vim
etric
ove
n dr
y @
105
C
* A
ustr
alia
n L
abor
ator
y H
andb
ook
of S
oil a
nd W
ater
Che
mic
al M
etho
ds (1
992)
For M
anag
er
Ana
lytic
al S
ervi
ces:

Acl
and
Coa
l – so
ils c
hem
ical
& p
hysi
cal p
rope
rtie
s ass
essm
ent
Dec
embe
r 07
For
P W
Bak
er
ESS
A P
ty L
td
Pa
ge 2
9
Env
iron
men
tal S
oil S
olut
ions
Aus
tral
ia P
ty L
td
QU
AL
ITY
CO
NT
RO
L D
AT
A
S
oil
Page
: 15
of 1
5 *
Aus
tral
ian
Lab
orat
ory
Han
dboo
k of
Soi
l and
Wat
er C
hem
ical
Met
hods
(199
2)
A
ctua
l Val
ue
Acc
epta
nce
Crit
eria
A
ctua
l Val
ue
Acc
epta
nce
Crit
eria
Test
Met
hod
Uni
ts
[Ran
ge]
Te
st M
etho
d U
nits
Te
st S
oil
pH
pH
B
5.18
, 5.1
8, 5
.17,
5.17
5.
0 - 5
.3
D
TPA
-Cu
mg/
kg
SB
2.72
, 2.7
2 2.
37 -
3.25
EC
dS
/m
B
.298
, .30
2, .3
05, .
309
0.27
- 0.
32
D
TPA
-Zn
mg/
kg
SB
3.78
, 3.3
2 3.
15 -
3.81
Cl
mg/
kg
B
18, 2
0, 2
0, 2
0 10
- 35
DT
PA-M
n m
g/kg
SB
14
6, 1
42
97.7
- 14
9.0
NO
3-N
m
g/kg
B
13
, 13,
13,
14
10 -
16
D
TPA
-Fe
mg/
kg
SB
23.2
, 23.
2 24
.3 -
32.6
NH
4-N
m
g/kg
N
A
N
A
Su
flate
-sul
fur
mg/
kg
B
110,
115
96
- 12
0 B
icar
b.P
mg/
kg
B
56, 5
4 51
-75
15
Bar
%
G
24
, 23,
27,
27
23 -
30
Tot
al K
jeld
ahl N
%
S8
0.
227
0.19
5 - 0
.248
Ca
(Exc
h. c
atio
ns)p
H8.
5 m
eq/1
00g
S12
34.5
, 32.
6, 3
1.9
27.7
- 35
.4
Tot
al P
%
A
LS
Se
e A
LS R
epor
t
Mg
(Exc
h. c
atio
ns)p
H8.
5 m
eq/1
00g
S12
24.9
, 23.
4, 2
3.4
22.8
8 - 2
4.5
Org
anic
Car
bon
%
B
1.97
, 1.9
3 1.
82 -
2.3
N
a (E
xch.
cat
ions
)pH
8.5
meq
/100
g S1
2 2.
2, 2
.1, 2
.1
2.0
- 2.2
8
Ca
(Exc
h. c
atio
ns)p
H7
meq
/100
g B
6.96
- 8.
04
K
(E
xch.
cat
ions
)pH
8.5
meq
/100
g S1
2 1.
96, 1
.81,
1.8
2 1.
64 -
2.09
Mg
(Exc
h. c
atio
ns)p
H7
meq
/100
g B
1.88
- 2.
22
Na
(Exc
h. c
atio
ns)p
H7
meq
/100
g B
.057
- .1
82
K
(Exc
h. c
atio
ns)p
H7
meq
/100
g B
1.20
9 - 1
.411
Exc
h. A
cidi
ty
meq
/100
g
N
A
EC
EC
m
eq/1
00g
A
N
A
CE
C
meq
/100
g S1
2 63
, 62,
63
58 -
73
ESP
%
A
NA
Coa
rse
sand
%
B
2,
2, 2
, 2
1.4
- 2.8
Fine
San
d %
B
18
, 18,
17,
17
13.1
- 19
.1
Silt
%
B
21, 2
1, 2
2, 2
2 20
.2 -
26.1
Cla
y %
B
60
, 60,
59,
59
55.4
- 60
.2
R1
B
.1
8, .1
8, .1
8 0.
18 -
0.29
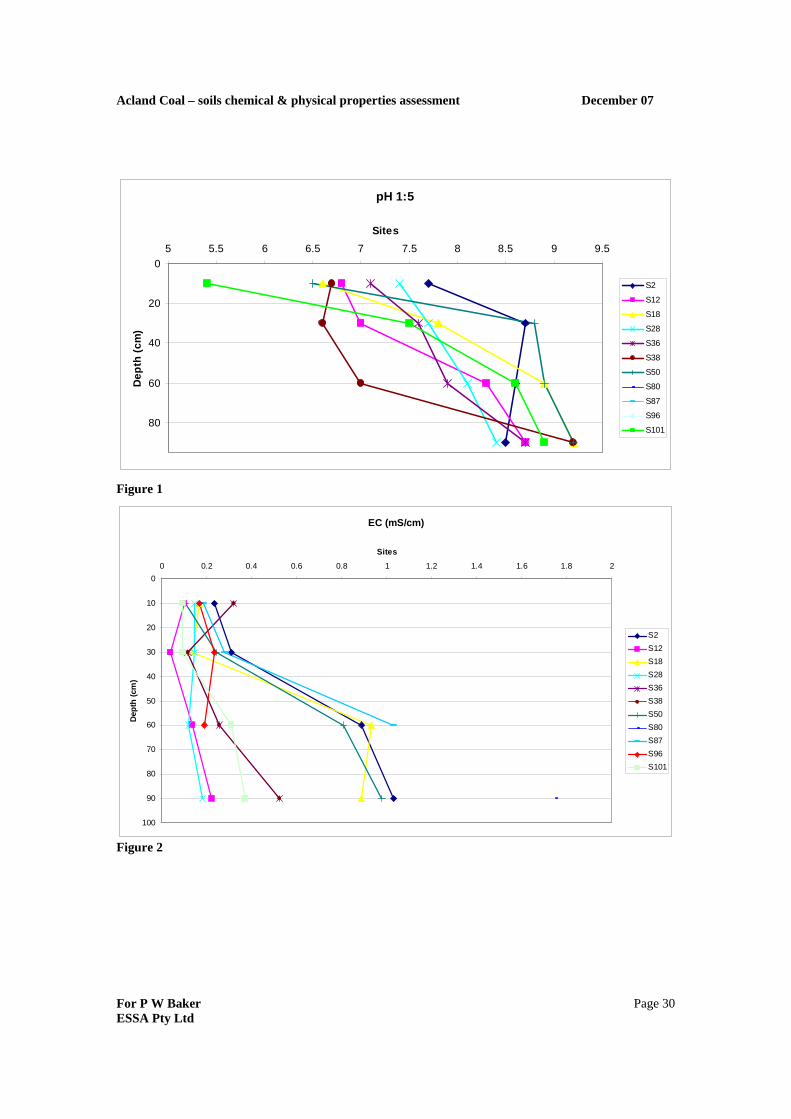
Acland Coal – soils chemical & physical properties assessment December 07
For P W Baker ESSA Pty Ltd
Page 30
pH 1:5
0
20
40
60
80
5 5.5 6 6.5 7 7.5 8 8.5 9 9.5
Sites
Dep
th (c
m)
S2
S12
S18
S28
S36
S38
S50
S80
S87
S96
S101
Figure 1
EC (mS/cm)
0
10
20
30
40
50
60
70
80
90
100
0 0.2 0.4 0.6 0.8 1 1.2 1.4 1.6 1.8 2
Sites
Dep
th (c
m)
S2S12S18S28S36S38S50S80S87S96S101
Figure 2

Acland Coal – soils chemical & physical properties assessment December 07
For P W Baker ESSA Pty Ltd
Page 31
ESP Sodicity
0
10
20
30
40
50
60
70
80
90
100
0 5 10 15 20 25 30 35
Sites
Dep
th (c
m)
S1S12S18S36S38S50S80S87S96S101
Figure 3
Chloride
0
10
20
30
40
50
60
70
80
90
100
0 200 400 600 800 1000 1200 1400 1600
Sites
Dep
th (c
m)
S2S12S18S28S36S38S50S80S87S96S101
Figure 4

Acland Coal – soils chemical & physical properties assessment December 07
For P W Baker ESSA Pty Ltd
Page 32
Clay %
20
30
40
50
60
70
80
90
100
0 10 20 30 40 50 60 70 80 90
Sites
Dep
th (c
m)
S2S12S18S28S36S38S50S80S87S96S101
Figure 5
R1 Dispersion Ratio
20
30
40
50
60
70
80
90
100
0 0.2 0.4 0.6 0.8 1 1.2
Sites
Dept
h (c
m)
S2S12S18S28S36S38S50S80S87S96S101
Figure 6