Soil denitrification - Forest Watershed Research...
36
Soil denitrification P.M. Murphy, M. Castonguay, Jae Ogilvie, P. Arp, Faculty of Forestry & Environmental Management Jag Bhatti, Canadian Forest Service, Edmonton, Alberta Atmospheric deposition NH4, NO3, H, S, Ca, Mg, K N, S, Ca, Mg, K Uplands: nitrification (hardwoods) Lowlands: denitrification DON, DOC, S, Ca, Mg, K DON, DOC, S, Ca, Mg, K N 2 O N 2 O DTW North American Forest Soil Conference, Blacksburg, Virginia, 20-22 June 2008
Transcript of Soil denitrification - Forest Watershed Research...
Soil denitrification P.M. Murphy, M. Castonguay, Jae Ogilvie, P. Arp, Faculty of Forestry & Environmental Management
Jag Bhatti, Canadian Forest Service, Edmonton, Alberta
Atmospheric deposition
NH4, NO3, H, S, Ca, Mg, K
N, S, Ca, Mg, K
Uplands: nitrification (hardwoods) Lowlands: denitrification
DON, DOC, S, Ca, Mg, K DON, DOC, S, Ca, Mg, K
N2ON2O
DTW
North American Forest Soil Conference, Blacksburg, Virginia, 20-22 June 2008

Soil denitrification: forest ecosysytem context
Soil leaching: SO42-, NO3
-, Ca 2+ , Mg 2+, K+, Al3+, Na+, Cl-, + , N + -
Atmospheric input for wet and dry deposition: H+, NH4
+, NO3-, SO4
2-, Ca2+ , Mg2+, K+, Na+, Cl-
Exports:
Soil weatheringCa, Mg, K, P
& acid buffering
Denitrificationincreases with
increasing soil wetness
Litter fall (S, N, Ca, Mg, K)
+ -
Forest Harvesting / Fires
Soil weatheringCa, Mg, K, P
& acid buffering Uptake (NH4+, NO3
-, Ca2+ , Mg2+, K+) Uptake (NH4+, NO3
-, Ca2+ , Mg2+, K+)
Litter fall (S, N, Ca, Mg, K)
, DOC, DON
NO3-

N application / denitrification rates (g / ha day): note relationship between de-nitrification and with soil wetness
Denitrification rates (g / ha day)

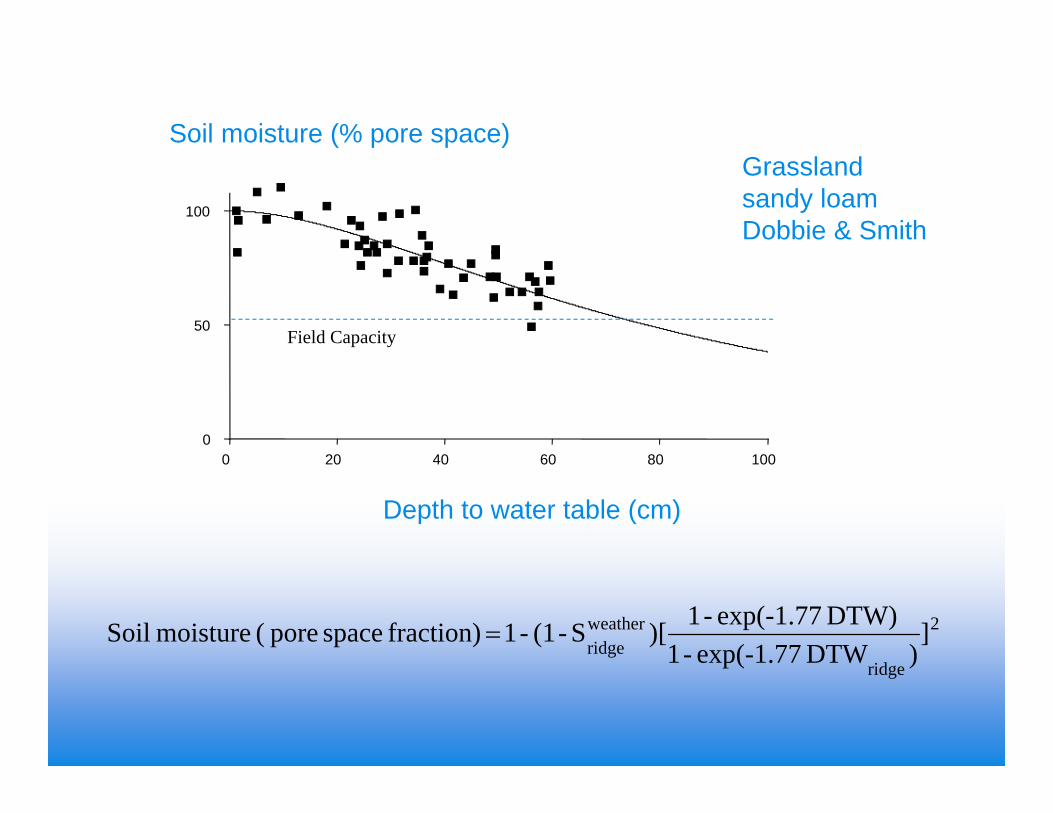
Modeling soil moisture (pore space fraction) and denitrification (kg / ha day)
2006 Heinen, pH); T, S, loads, (N f )yr ha (eqation Denitrific -1-1
AET) ty,permeabili soil y, topographather,f(daily we fraction) space pore (S,index Moisture Soil
Atmospheric deposition
NH4, NO3, H, S, Ca, Mg, K
N, S, Ca, Mg, K
Uplands: nitrification (hardwoods) Lowlands: denitrification
DON, DOC, S, Ca, Mg, K DON, DOC, S, Ca, Mg, K
N2ON2O
DTW
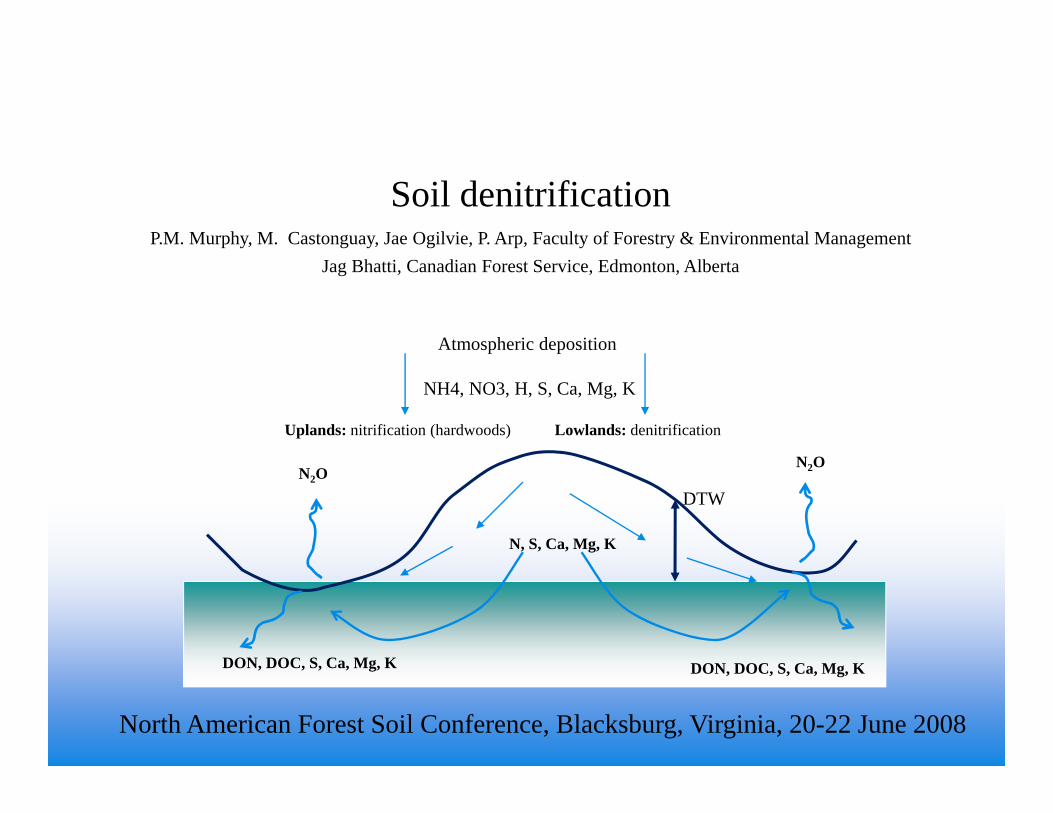
Depth to water, DTW0(cartographic index)
DEM surface
Mapped Streams
N2ON2O
N2O
p
ridge
weatherridge
])DTWexp(-k -1
DTW)exp(-k -1)[S-(1-1 fraction) space pore ( moisture Soil
0 20 40 60 80 1000
50
100
Depth to water table (cm)
Soil moisture (% pore space)
2
ridge
weatherridge
])DTW exp(-1.77-1
DTW) exp(-1.77-1)[S-(1-1 fraction) space pore ( moisture Soil
Grasslandsandy loamDobbie & Smith
Field Capacity

0 20 40 60 80 100-1
1
3
5
Soil moisture (S, % pore space)
log10denitrification (g-N ha-1 day-1 )
Meadow: y = 4.32 + 5.33 (1- S/100)
Field: y = 4.32 + 7.47(1- S/100)
Dobbie and Smith (2006)
Slope decreases with earlier onset of anaerobic condition, or with increasing biological oxygen demand within the soil.
Measurement variations and associated uncertainties are high: about one order of magnitude.
Dpot

log10(N2O flux, g ha-1 day-1)
0 20 40 60 80 100-1
0
1
2
3
4
Depth to water table (cm)
S)-(1 w- Dp )]yr ha (eq [Dlog -1-1a10
Grasslandsandy loamDobbie & Smith
Denitrification decreases rapidly with increasing depth to water , and decreasing soil moisture content

equation Arrhenius )]; 2881-
T1(
REa[- exp f
2006 Smith, and Dobbie from derived S)];-exp[-w(1 f
ExpertN ;NNNN290014
NNNNf
discharge stream
)DD -NNN(N]N-[NO3
f f f point stream above areawet
point stream above areacatchment )D -NNNN ,min(D
D
f f f )NNNN ,min(D D
T
S
immuptakefixdep
immuptakefixdepN
channels flow and areas wet a,uplandsa,immuptakefixdepstream
TSNuplandsa,immuptakefixdeppot
channels flow and areas wet a,
TSNimmuptakefixdeppotuplands a,
Soil denitrification (g/ha day): generalized model

0
10000
20000
30000
40000
0 10000 20000 30000 40000
Dpot (g NO2-N / ha day), from Heinen, 2006
Best-fitted Dpot (g NO2-N / ha day)
0.94r (%),OM 825(%)Sand 100.9D 2wwpot
Peat
Sand
LoamClay loam
Denitrification potential increases with increasing soil permeability

DEM

DEM + hydrographic
features

“Burn” hydrographic features into DEM
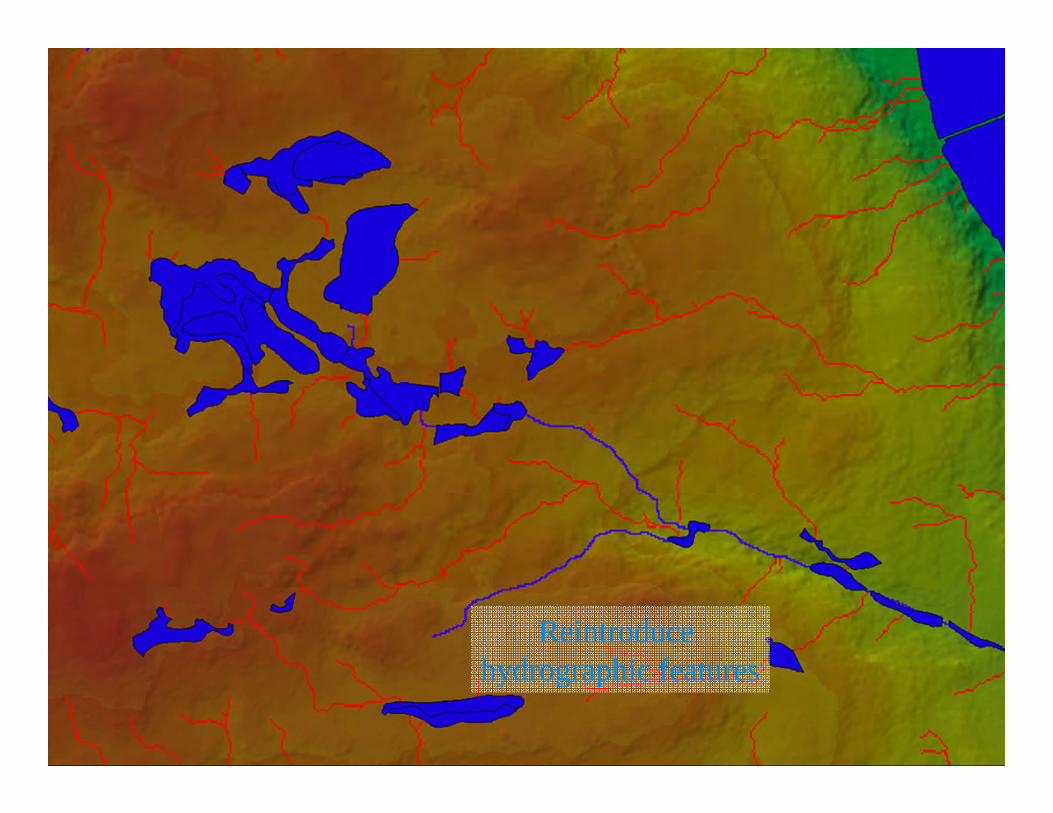
Reintroduce hydrographic features

Determine flow directions and accumulations

Determine depth-to-water next to all open water features
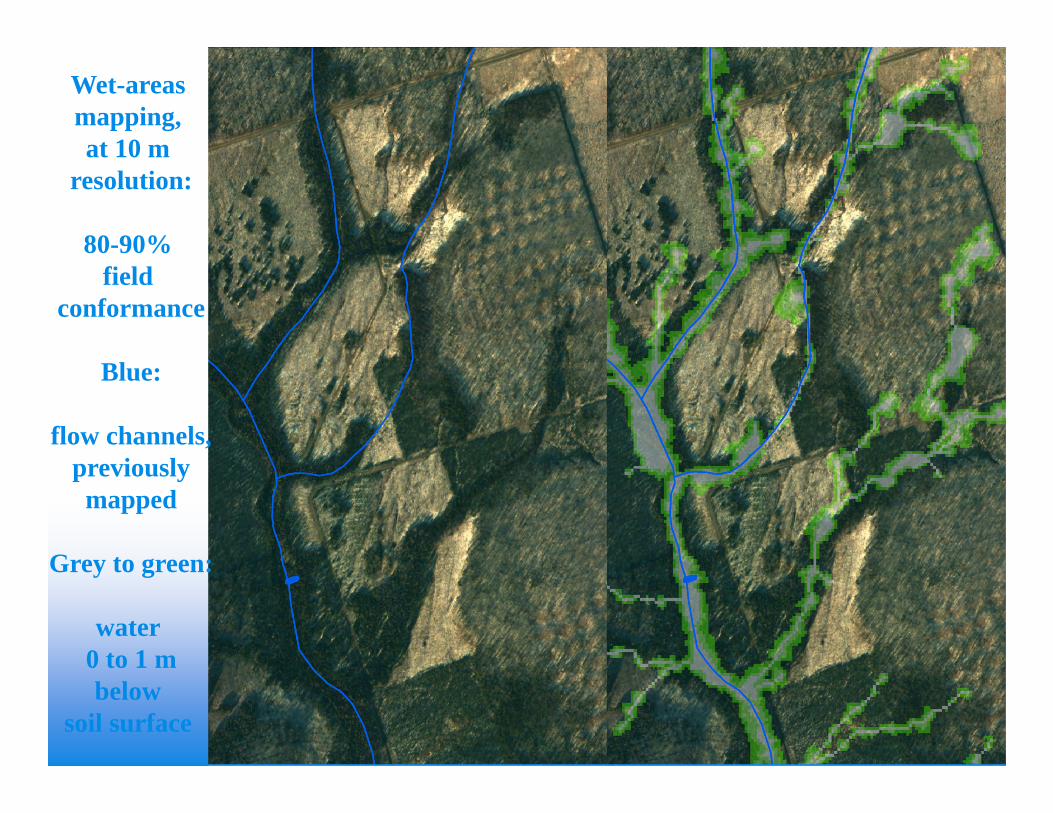
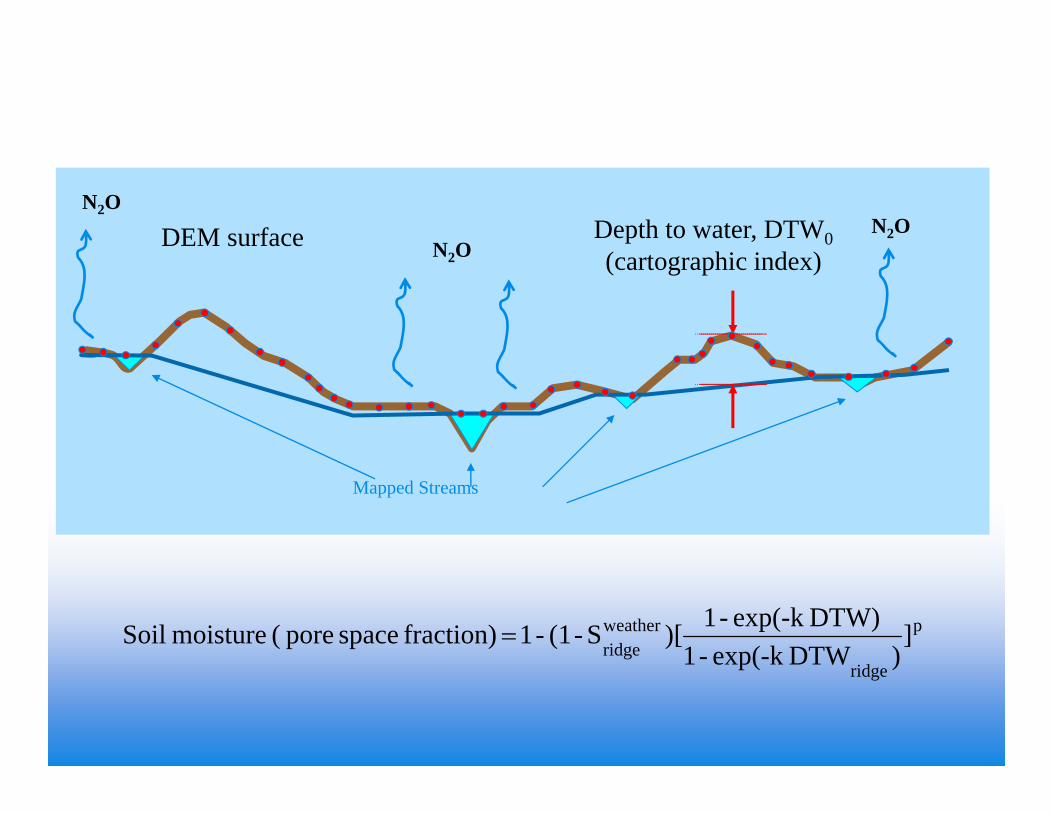
Wet-areas mapping, at 10 m
resolution:
80-90% field
conformance
Blue:
flow channels,previouslymapped
Grey to green:
water 0 to 1 mbelow
soil surface

…And Using it for Wet-Areas Coastal Mapping…Mapping extent of costal wetland features – Point Comeau, NB

…wet areas mapping for enhanced visualization …

0
5
10
15
20
25
30
35
40
45
50
RF RM RC UF UM UCSite Category
Den
itrifi
catio
n ra
te (k
g N
/ ha/
yr)
Potential denitrification rates in wet areas (RF, RM, RC)and even on fine-textured uplands (RF, RM, RC)
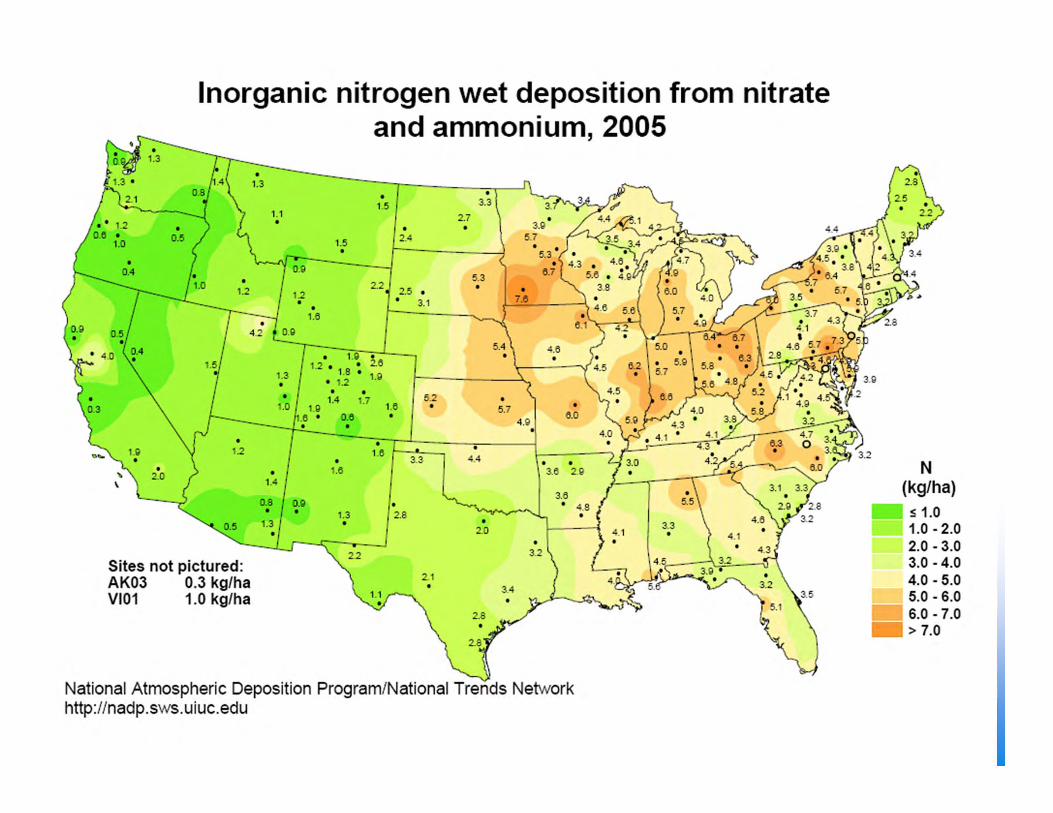
far exceed usual atmospheric N deposition rates (<1 to 8 kg N / ha year) for North America
Texture classes
F – fineM – mediumC - coarse
Nmax NADP

Depth to water (m)
Estimated denitrification rate (kg N ha / year)
for the same area, based on depth- to-water and corresponding literature-derived model
High- resolution mapping of flow channels (blue)
Same area, with depth-to-water overlay
-High-(blue
-
Modeling potential denitrification rates, at high (10 m) resolution

Upland soil acidification exceedances, eq / ha year related to BEC classes
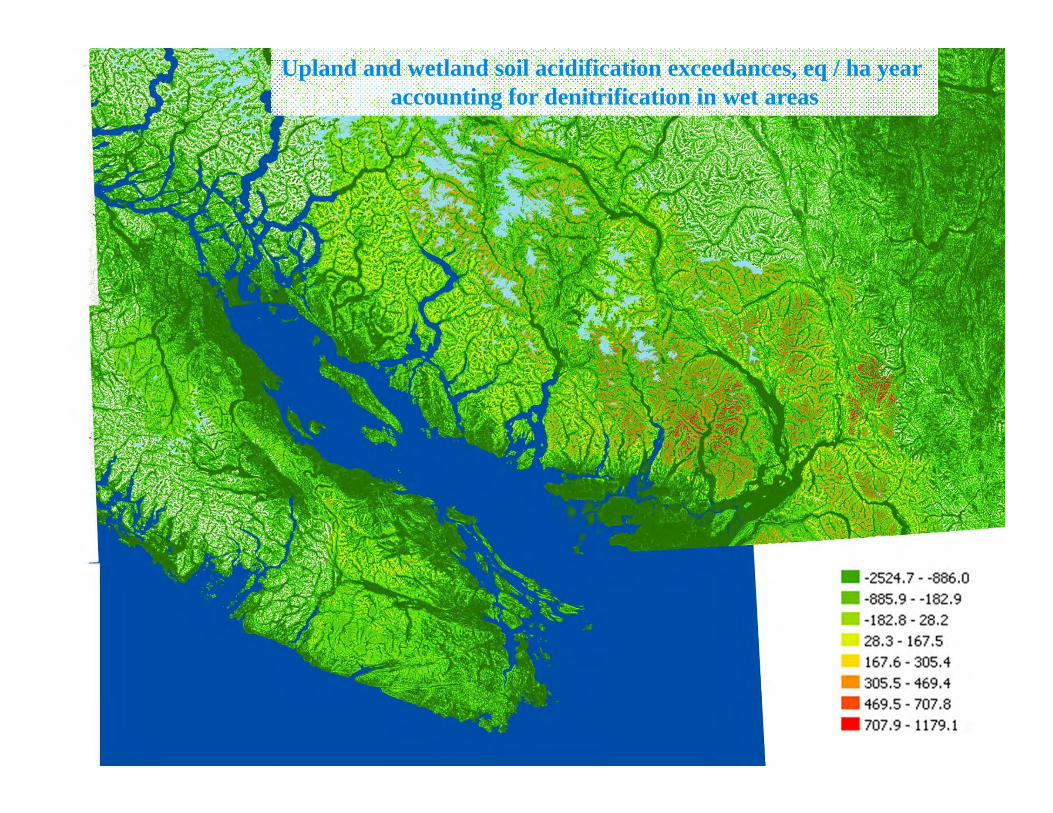
Upland and wetland soil acidification exceedances, eq / ha year accounting for denitrification in wet areas

Upland and wetland soil acidification exceedances, eq / ha year accounting for denitrifcation in wet areas

…considering the replenishment of cumulative nutrient depletions and deficits through fertilization and/or liming…
Economic Implications for Nova Scotia
Product Application TransportationCa 125 45 45
Mg 175 45 45K 455 45 45N 639 45 45
Fertilization costs ($/ton)

Critical soil acidification load model (steady state):
net acid in = net acid out,
calculable from known S, N, Ca, Mg, and K inputs and exports
Upland areas are more sensitive to soil acidification then wet areas
Exceedance (in equivalents / ha year) =S+N deposition – base cation input – N uptake and return

Base cation depletion = loss of exchangeable bases, from rooting zone
Nutrient deficits =
Exchangeable bases
Time
Depletion>0
Deficit / rotation > 0
nutrient export – site-level inputs (atm. + soil)
Deficit / rotation = 0

CLsoil acidification = BCdep + BCweathering− BCuptake
+ Nuptake + Nimmobilization + Ndenitrification − ANCleach(crit)
Exceedancesoil acidification = Ndep + Sdep – CLsoil acidification
Nimmobilization = 0
Ndenitrification = f (Ndep, texture, drainage, topography, weather)
CL acidification calculations

Atmospheric deposition H+, NH4
+, NO3-, SO4
2-, Ca2+ , Mg2+, K+, Na+, Cl-
Ecological Land Classification (DNR)
Dominant Species: optimal MAI (tons / ha year)wood density (ton of biomass /m3 of wood) nutrient concentrations (N, Ca, Mg, K, P)in: foliage, branches, stem wood, bark
Soil type (CANSIS)texture, organic matter, coarse fragments, soil depth, ratio of exchangeable bases
Bedrock type 4 weathering classes: low, intermediate, high, calcareous
Data Layers needed

$0
$1,000,000
$2,000,000
$3,000,000
$4,000,000
NS Depletion Costs (harvest + acid leach)
NS Nutrient Deficit Costs (harvest only)
Decreased atm. deposition

Develop economic implications of N, S, Ca, Mg, K deposition and depletion, in the context of local nutrient supply-demand contexts
Develop model useful for assessing nutrient sustainabilities: uplands, wetlands
Develop model assessing atmospheric deposition and upland-wetland nutrient uptake, exports and losses in relation to water quality issues
Outlook

Above calculations and maps are approximatebased on available and fairly generalized information
For operational use in forestry, need to focus on stand-level MAI expectations
Need to conduct more analyses: wood, bark, branches, foliagewood density, biomass fractions, nutrient concentrations
Develop operational performance tests
Notes

Acknowledgements
Environment Canada, Acid Rain Program (T. Clair, Y. Bourassa)
NEG-ECPENFOR (CFS)
ARNEWS (CFS)Nexfor-Bowater Forest Watershed Centre (UNB)
BowaterFraser Papers Inc.
John-Paul Arp (MCSc)Vincent Balland (MScF)
NEG-ECP Acid Rain Mapping GroupEsp. Rock Ouimet, Eric Miller