Soil chemical and nutrient uptake dynamics of maize
143
Soil chemical and nutrient uptake dynamics of maize (Zea mays L.) as affected by neutralization and re-acidification after liming by Hester Getruida Jansen van Rensburg Thesis submitted in partial fulfillment of the requirements for the degree Doctor of Philosophy in Soil Science in the Faculty of Natural and Agricultural Sciences University of Pretoria Pretoria October 2009 Supervisor: Prof A S Claassens Co-Supervisor: Dr D J Beukes © University of Pretoria
Transcript of Soil chemical and nutrient uptake dynamics of maize

Soil chemical and nutrient uptake dynamics of maize (Zea mays L.) as affected by neutralization and re-acidification after
liming
by
Hester Getruida Jansen van Rensburg
Thesis submitted in partial fulfillment of the requirements for the degree Doctor of Philosophy
in Soil Science
in the
Faculty of Natural and Agricultural Sciences
University of Pretoria
Pretoria
October 2009
Supervisor: Prof A S Claassens
Co-Supervisor: Dr D J Beukes
©© UUnniivveerrssiittyy ooff PPrreettoorriiaa

Declaration
I, the undersigned, hereby declare that the work contained in this thesis is entirely my own
original research, except where acknowledged, and that it has not at anytime, either partly or
fully, been submitted to any University for the purposes of obtaining a degree.
Signed: ______________________ Date: ________________________
i
TABLE OF CONTENT
ABSTRACT ............................................................................................................................... viii
CHAPTER 1: INTRODUCTION..................................................................................................... 1
1.1 BACKGROUND ............................................................................................................ 1
1.2 JUSTIFICATION ........................................................................................................... 1
1.3 SOUTH AFRICAN LANDCARE PROGRAMME............................................................ 2
1.3.1 Goal of the national Landcare programme ............................................................... 2
1.3.2 National Landcare principles..................................................................................... 3
1.3.3 Purpose of the South African Landcare programme................................................. 3
1.4 THE MLONDOZI LANDCARE PROJECT ..................................................................... 4
1.5 PROJECT OBJECTIVES.............................................................................................. 6
1.6 STUDY AREA ............................................................................................................... 7
1.6.1 Locality and physical features................................................................................... 7
1.6.2 Climate...................................................................................................................... 9
1.6.3 Geology and soils ..................................................................................................... 9
1.6.4 Vegetation............................................................................................................... 12
1.6.5 Land use................................................................................................................. 12
1.6.6 Demographic information........................................................................................ 12
1.7 GENERAL STRUCTURE OF THE THESIS ................................................................ 13
CHAPTER 2: AN EVALUATION OF LIME EFFECTS ON TEMPORAL CHANGES IN SOIL
ACIDITY PROPERTIES AND MAIZE GRAIN YIELDS .......................................... 14
2.1 INTRODUCTION ........................................................................................................ 14
2.2 MATERIAL AND METHODS....................................................................................... 15
2.2.1 Soils and experimental design ................................................................................ 15
2.2.2 Soils sampling and analysis.................................................................................... 16
2.2.3 Planting and yield estimates ................................................................................... 17
2.2.4 Rainfall data............................................................................................................ 17
2.2.5 Statistical analysis .................................................................................................. 18
2.3 RESULTS AND DISCUSSIONS .......................................................................................... 19
2.3.1 Soil pH, extractable acidity, Al and acid saturation ................................................. 19
2.3.2 Grain yield versus lime application ......................................................................... 21
2.3.3 Absolute grain yield versus soil acidity properties................................................... 23
2.3.4 Relative grain yield versus soil acidity properties.................................................... 24
2.4 CONCLUSIONS .............................................................................................................. 25
CHAPTER 3: THE EFFECT OF LIMING ON SOIL BUFFER CAPACITY, ACIDIFICATION
RATES AND MAINTENANCE LIMING.................................................................. 27
3.1 INTRODUCTION ........................................................................................................ 27
ii
3.2 MATERIALS AND METHODS .................................................................................... 28
3.2.1 Experimental soils................................................................................................... 28
3.2.2 Soil sampling and analysis...................................................................................... 28
3.2.3 Soil buffer capacity (soil BC)................................................................................... 28
3.2.4 Acid production loads (APL) and acidification rates................................................ 29
3.2.5 Maintenance liming................................................................................................. 30
3.2.6 Statistical analysis .................................................................................................. 30
3.3 RESULTS AND DISCUSSION.................................................................................... 31
3.3.1 Effect of lime application on soil BC........................................................................ 31
3.3.2 Acid production loads ............................................................................................. 33
3.3.3 Soil BC vs soil acidification rate .............................................................................. 34
3.3.4 Effect of lime application on soil acidification rates ................................................. 44
3.3.5 Lime loss and maintenance lime rate ..................................................................... 40
3.4 CONCLUSIONS.......................................................................................................... 44
CHAPTER 4: LIMING EFFECTS OF SOIL PROPERTIES, NUTRIENT AVAILABILITY AND
GROWTH OF MAIZE ............................................................................................ 45
4.1 INTRODUCTION ........................................................................................................ 45
4.2 MATERIAL AND METHODS....................................................................................... 46
4.2.1 Experimental layout and procedure ........................................................................ 46
4.2.2 Soil and leaf sampling and analysis........................................................................ 46
4.2.3 Statistical analysis and data interpretation.............................................................. 47
4.3 RESULTS AND DISCUSSION.................................................................................... 48
4.3.1 Effect of liming on soil and leaf nutrient availability................................................. 48
4.3.2 Critical soil nutrient concentrations and yield .......................................................... 61
4.4 CONCLUSIONS.......................................................................................................... 53
CHAPTER 5: EFFECT OF SOIL ACIDITY AMELIORATION ON MAIZE YIELD AND NUTRIENT
INTERRELATIONSHIPS IN SOIL AND PLANTS USING STEPWISE
REGRESSION AND NUTRIENT VECTOR ANALYSIS......................................... 54
5.1 INTRODUCTION ........................................................................................................ 54
5.2 MATERIAL AND METHODS....................................................................................... 55
5.2.1 Experimental procedure.......................................................................................... 55
5.2.2 Soil and maize plant sampling and analysis ........................................................... 55
5.2.3 Statistical analysis and data interpretation.............................................................. 56
5.2 RESULTS AND DISCUSSIONS ................................................................................. 57
5.3.1 Interrelationship between maize grain yield, soil and leaf nutrients ........................ 57
5.3.2 Nutrient uptake interactions .................................................................................... 61
5.3 CONCLUSIONS.......................................................................................................... 63
CHAPTER 6: RELATIONSHIPS BETWEEN SOIL BUFFER CAPACITY AND SELECTED SOIL

iii
PROPERTIES........................................................................................................ 65
6.1 INTRODUCTION ........................................................................................................ 65
6.2 MATERIAL AND METHODS....................................................................................... 66
6.2.1 Soils........................................................................................................................ 66
6.2.2 Soil analysis............................................................................................................ 66
6.2.3 Potentiometric titration curves................................................................................. 67
6.2.4 X-ray diffraction analysis......................................................................................... 67
6.2.5 Statistical analysis .................................................................................................. 67
6.3 RESULTS AND DISCUSSION.................................................................................... 68
6.3.1 Soil characteristics.................................................................................................. 68
6.3.2 Potentiometric titration curves................................................................................. 69
6.3.3 Soil buffer capacity over limited pH ranges vs soil properties ................................. 70
6.3.4 Interrelationships between soil properties contributing to soil buffer capacity......... 74
6.3.5 Relationship between dominant soil forms and selected soil properties ................. 77
6.4 CONCLUSIONS.......................................................................................................... 78
CHAPTER 7: ASSESSING THE POTENTIAL SOIL ACIDIFICATION RISK UNDER DRYLAND
AGRICULTURE ..................................................................................................... 80
7.1 INTRODUCTION ........................................................................................................ 80
7.2 MATERIAL AND METHODS....................................................................................... 81
7.2.1 Study area .............................................................................................................. 81
7.2.2 Soil sampling and analysis...................................................................................... 83
7.2.3 Soil buffer capacity (BC) ......................................................................................... 83
7.2.4 Acid production loads (APL), acidification rates and maintenance liming ............... 84
7.2.5 Spatial interpolation of soil properties and acidification risk .................................... 84
7.2.6 Statistical analysis .................................................................................................. 85
7.3 RESULTS AND DISCUSSION.................................................................................... 85
7.3.1 General and spatial soil characteristics .................................................................. 85
7.3.2 Soil buffer capacity (BC) ......................................................................................... 86
7.3.3 Critical soil acidity indices ....................................................................................... 92
7.3.4 Actual soil acidity indices and lime requirement (LR).............................................. 93
7.3.5 Acid production load (APL) ................................................................................... 101
7.3.6 Acidification risk assessment ................................................................................ 101
7.3.7 Relationship between acidification rate and selected soil properties .................... 111
7.4 CONCLUSIONS........................................................................................................ 113
CHAPTER 8: GENERAL DISCUSSION, CONCLUSIONS AND RECOMMENDATIONS........ 115
REFERENCES................................................................................................................................
............................................................................................................................. 125
ACKNOWLEDGEMENTS ......................................................................................................... 133

iv
TABLE OF TABLES Table 1.1 Climatic summary for the Athole and Oshoek weather stations, situated
respectively 10 km to the south and to the north of the Mlondozi district (Agromet
2002) ..................................................................................................................... 10
Table 2.1 Selected soil physical and chemical properties of the topsoil (0-250 mm) of the two
experimental sites prior to establishment of trials .................................................. 16
Table 2.2 Quality analysis values by calcium carbonate equivalent and resin suspension
method of the experimental lime............................................................................ 16
Table 2.3 Mean monthly rainfall data (mm) for the Athole weather station situated 10 km to
the south of the Mlondozi district (Agromet, 2008)................................................. 18
Table 2.4 ANOVA table of probabilities of treatment effects on soil pH (H2O), extractable
(H+Al), Al, acid saturation, organic C and maize grain yield for the Hutton and
Oakleaf soil forms .................................................................................................. 18
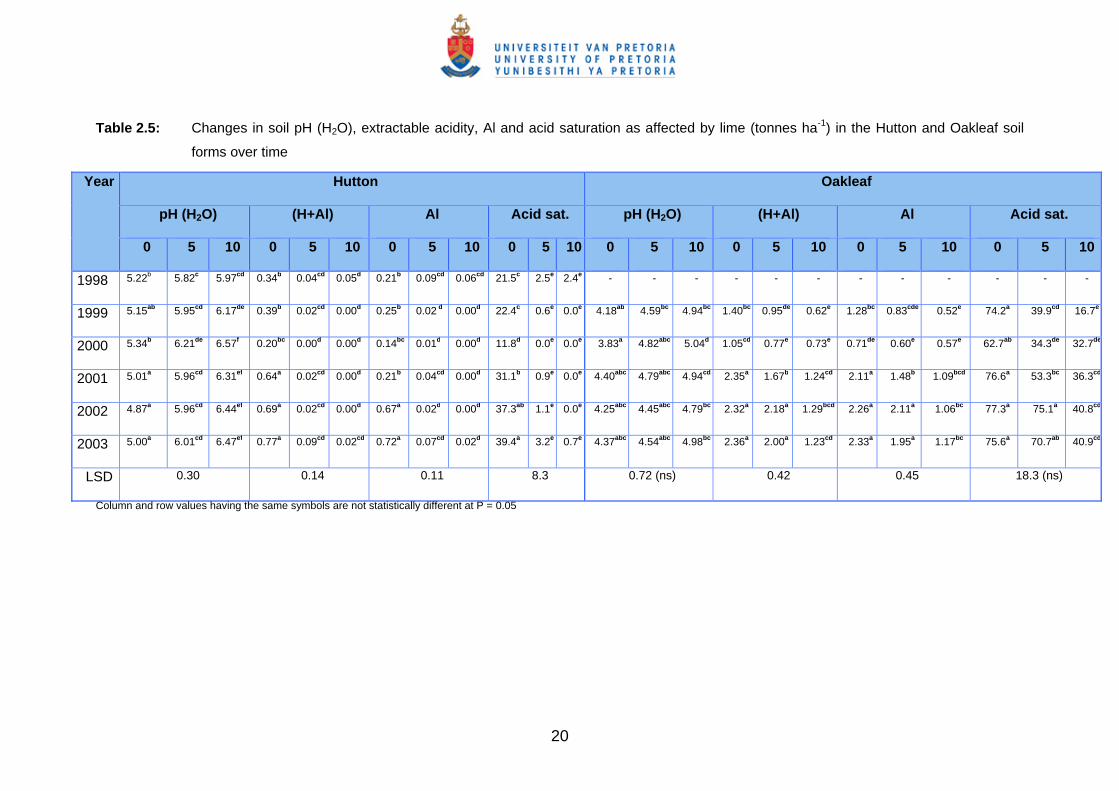
Table 2.5 Changes in soil pH (H2O), extractable acidity, Al and acid saturation as affected by
lime (tonnes ha-1) in the Hutton and Oakleaf soil forms over time ......................... 20
Table 2.6 Changes in absolute maize grain yield as affected by lime (tonnes ha-1) in the
Hutton and Oakleaf soil forms over time................................................................ 22
Table 2.7 Pearson’s coefficients of correlation (r) between different variants for the Hutton
and Oakleaf soil forms ........................................................................................... 22
Table 2.8 Non-linear regression analysis between absolute yield and soil acidity properties for
pooled data for the Hutton and Oakleaf soil forms................................................. 23
Table 2.9 Non-linear regression analysis between relative yield and soil acidity properties for
pooled data for the Hutton and Oakleaf soil forms................................................. 24
Table 3.1 ANOVA table of probabilities of treatment effects on soil BC, acid production load,
acidification rate and extractable Ca and Mg for the Hutton and Oakleaf soil forms
............................................................................................................................... 31
Table 3.2 Soil BC values (cmolc kg soil-1 pH unit-1) as influenced by time and lime application
for the Hutton and Oakleaf soil forms .................................................................... 32
Table 3.3 Pearson’s coefficient of correlation (r) between soil BC, organic C and extractable
acidity for the Hutton and Oakleaf soil soils ........................................................... 33
Table 3.4 Acid production loads and acidification rates for the topsoil (0-250 mm) of the
Hutton and Oakleaf soil forms as a function of liming ............................................ 33
Table 3.5 Extractable Ca and Mg values (cmolc kg soil-1) as influenced by time and lime
application for the Hutton and Oakleaf soil forms .................................................. 41
Table 3.6 Maintenance lime requirement rates in the topsoil (0-250 mm) of the Hutton and
Oakleaf soil forms as a function of liming .............................................................. 43
Table 4.1 Selected soil chemical topsoil (0-250 mm) properties1 of the experimental sites.......
v
............................................................................................................................... 46
Table 4.2 ANOVA table of probabilities of lime treatment effects on soil and leaf nutrients in
the Hutton and Oakleaf soil forms.......................................................................... 48
Table 4.3 The effect of lime application on selected soil fertility properties in the Hutton and
Oakleaf soil forms .................................................................................................. 49
Table 4.4 The effect of lime application on leaf nutrient uptake as reflected by the first ear leaf
at tasselling to initial silking in the Hutton and Oakleaf soil forms.......................... 49
Table 4.5 Critical thresholds for selected soil nutrient indices ............................................... 50
Table 4.6 Critical threshold values for selected plant nutrient indices ................................... 51
Table 4.7 Non-linear regression analysis between relative yield and selected soil nutrients for
pooled data in the Hutton and Oakleaf soil forms .................................................. 53
Table 5.1 Correlation matrix for the relationship between maize grain yield, soil and leaf
nutrients for the Hutton soil form............................................................................ 58
Table 5.2 Correlation matrix for relationship between maize grain yield, soil and leaf nutrients
for the Oakleaf soil form......................................................................................... 59
Table 5.3 Summary of the forward stepwise regression analysis for yield for the two
experimental soils .................................................................................................. 60
Table 6.1 The range of selected soil physical and chemical topsoil (0-250 mm) properties1 for
the experimental soils ............................................................................................ 68
Table 6.2 Mean values of selected soil physical and chemical topsoil (0-250 mm) properties1
for the dominant soil forms..................................................................................... 70
Table 6.3 Correlation matrix for the relationship between soil buffer capacity and selected soil
properties............................................................................................................... 72
Table 6.4 Summary of the forward stepwise regression analysis for buffer capacity at different
pH ranges .............................................................................................................. 73
Table 6.5 Correlation matrix obtained from principal component analyses between the
variables and some scores .................................................................................... 75
Table 6.6 Low, medium and high class values for clay, organic C and extractable Al used in
the diagrammatic representation of PCA in Figure 6.2 .......................................... 75
Table 7.1 Selected soil physical and chemical topsoil (0-250 mm) properties1 for the two
dominant land uses in the Mlondozi district ........................................................... 86
Table 7.2 Summary of the forward stepwise regression analysis for soil BC and lime
requirement (LR).................................................................................................... 90
Table 7.3 Correlation matrix between lime requirement (LR), acidification rates (∆ pH unit
year-1) and selected soil properties...................................................................... 100
Table 7.4 Non-linear regression analysis between various soil properties and acidification rate.
............................................................................................................................. 113

vi
TABLE OF FIGURES
Figure 2.1 The relationships between relative grain yields and (a) soil pH (H2O), (b)
extractable Al, (c) extractable acidity and (d) acid saturation in all treatments of
both experimental soils. ......................................................................................... 25
Figure 3.1 Titration curves for the critical pH ranges for (a) 0 (b) 5 and (c) 10 tonnes lime ha-1
treatments in the Hutton and for (d) 0 (e) 5 and (f) 10 tonnes lime ha-1 treatments in
the Oakleaf soils, respectively (*** P < 0.001, ** P < 0.01 and * P < 0.05)............. 35
Figure 3.2 Relationship between measured and predicted acidification rates for the (a) Hutton
and (b) Oakleaf soil form (*** P < 0.001, ** P < 0.01). ........................................... 37
Figure 3.3 Combined titration curves for the 0, 5 and 10 tonnes lime ha-1 treatments in the (a)
Hutton and (b) Oakleaf soils. ................................................................................. 38
Figure 3.4 Relationship between initial pH (H2O) and acidification rate (pH unit year-1) in the (a)
Hutton and (b) Oakleaf soil forms (*** P < 0.001, ** P < 0.01 and * P < 0.05). ...... 39
Figure 3.5 The relationships between extractable (Ca + Mg), and time in the (a) Hutton and (b)
Oakleaf experimental soils..................................................................................... 42
Figure 4.1 The relationship between relative yield and soil (a) K, (b) Ca, (c) Mg, and (d) Cu. 52
Figure 5.1 Nutrient vector analysis. Interpretation of directional changes in relative biomass
and nutrient status of plants contrasting in growth (Timmer & Teng, 1999). .......... 57
Figure 5.2 Relative response in nutrient concentration, content and dry mass of maize plants
grown at differential lime rates in the (a) Hutton and (b) Oakleaf soil forms. ......... 62
Figure 6.1 Combined titration curves for the dominant soil types. .......................................... 69
Figure 6.2 PCA evaluating the interrelationships between (a) clay content, (b) carbon content,
and (c) extractable Al with soil BC and other soil properties. ................................. 76
Figure 6.3 PCA evaluating the interrelationships between dominant soil forms, soil BC and
other selected soil properties ................................................................................. 78
Figure 7.1 Relationship between measured soil BC determined by potentiometric titrations and
predicted soil BC according to Equation 7.6. ......................................................... 92
Figure 7.2 Critical soil pH values by means of broken-stick analysis between (a) pH (H2O) and
extractable (Al + H), and (b) pH (KCl) and extractable (Al + H), (c) pH (H2O) and
extractable Al and (d) pH (KCl) and extractable Al. ............................................... 93
Figure 7.3 Relationship between measured lime requirement (tonnes CaCO3 ha-1) and
predicted lime requirement according to Equation 7.7......................................... 101
Figure 7.4 The relationship between acidification rate (∆ pH year-1) and (a) soil pH (H2O), (b)
pH (KCl), (c) extractable Al, (d) extractable acidity, (e) ECEC (cmolc kg-1 soil) and (f)
clay content.......................................................................................................... 112

vii
TABLE OF MAPS
Map 1.1 Map of study area location in the Mpumalanga province......................................... 8
Map 1.2 Soil map of the Mlondozi district. ........................................................................... 11
Map 7.1 Location of study area and spatial distribution of sample points ............................ 82
Map 7.2 Interpolated map (1:200 000) of organic C values of the topsoil (0-250 mm) in the
Mlondozi district ..................................................................................................... 87
Map 7.3 Interpolated map (1:200 000) of clay values of the topsoil (0-250 mm) in the
Mlondozi district ..................................................................................................... 88
Map 7.4 Interpolated map (1:200 000) of CEC values of the topsoil (0-250 mm) in the
Mlondozi district ..................................................................................................... 88
Map 7.5 Interpolated map (1:200 000) of soil BC values of the topsoil (0-250 mm) in the
Mlondozi district. .................................................................................................... 91
Map 7.6 Interpolated maps (1:200 000) of current pH (H2O) for the topsoil (0-250 mm) in the
Mlondozi district ..................................................................................................... 95
Map 7.7 Interpolated maps (1:200 000) of current extractable acidity (cmolc kg-1) values for
the topsoil (0-250 mm) in the Mlondozi district....................................................... 96
Map 7.8 Interpolated maps (1:200 000) of annual rainfall in the Mlondozi district ............... 97
Map 7.9 Interpolated maps (1:200 000) of lime requirement (tonnes CaCO3 ha-1) from
current pH (H2O) to pH (H2O) 6.0 in the Mlondozi district ...................................... 98
Map 7.10 Interpolated map (1:200 000) of pH (H2O) change per year for the topsoil (0-250
mm) in the Mlondozi district. ................................................................................ 103
Map 7.11 Interpolated map (1:200 000) of years until critical pH (H2O) is reached for the
topsoil (0-250 mm) in the Mlondozi district........................................................... 104
Map 7.12 Interpolated map (1:200 000) of risk classes for the topsoil (0-250 mm) in the
Mlondozi district ................................................................................................... 105
Map 7.13 Interpolated map (1:200 000) of simulating pH (H2O) values for current pH for the
topsoil (0-250 mm) in the Mlondozi district........................................................... 107
Map 7.14 Interpolated map (1:200 000) of simulating pH (H2O) values for 2 years for the
topsoil (0-250 mm) in the Mlondozi district........................................................... 108
Map 7.15 Interpolated map (1:200 000) of simulating pH (H2O) values for 4 years and (d) 6
years for the topsoil (0-250 mm) in the Mlondozi district...................................... 109
Map 7.16 Interpolated maps (1:200 000) of simulating pH (H2O) values for 6 years for the
topsoil (0-250 mm) in the Mlondozi district........................................................... 110
viii
ABSTRACT
An imperative of the South African government is to increase agricultural production in rural
areas. In support of this, a project was initiated in the Mlondozi district of Mpumalanga Province
under the National LandCare programme. The goal was to assess land management practices
contributing to sustainable and profitable agricultural production. Medium-term liming
experiments were sampled to a range of lime treatments in a Hutton and Oakleaf soil. Critical
thresholds where a reduction in relative grain yield was found were at a pH (H2O), extractable
acidity, Al and acid saturation of 5.49, 0.277 cmolc kg soil-1, 0.145 cmolc kg soil-1 and 13%,
respectively. Critical soil fertility threshold levels were established at 50 mg K kg-1, 228-345 mg
Ca kg-1, 78-105 mg Mg kg-1 and 1.68-2.83 mg Cu kg-1. Nutrient vector analysis showed a toxic
build-up of Fe, followed by Al and to a lesser extent Mn, which depressed the uptake of Ca, Mg
and B in the Hutton soil. In the Oakleaf soil, Al toxicity, followed by high concentrations of Mn
and Fe, markedly reduced the uptake of Ca, Mg and K by maize. Net rates of acid production in
the soil profile varied between 1.61 and 2.44 kmol H+ ha-1 year-1 for the Hutton soil and between
4.59 and 8.82 kmol H+ ha-1 year-1 in the Oakleaf soil due to liming. A decline of 0.046 pH unit
year-1 for an initial pH(H2O) value of 5.33, and 0.140 pH unit year-1 for an intial pH(H2O) of 6.47,
respectively, in the Hutton was recorded. For the Oakleaf these declines were 0.044 and 0.110
pH unit year-1, from pH(H2O) 4.54 and 5.15. Maintenance liming amounts at different pH values
for the Hutton soil were equivalent to 0.2, 0.3 and 1.4 tonnes CaCO3 ha-1 annually, while 0, 0.8
and 0.8 tonne CaCO3 ha-1 annually were recorded for the Oakleaf soil.
The study was extended to 80 random topsoil samples in the district. Relationships of soil BC
over limited pH ranges showed that at soil BC(pH<4.5) the main buffering mechanism was
extractable Al > organic C > clay. At soil BC(pH4.5-6.5) the buffering mechanism was extractable Al
> clay > CBD-Al > organic C > CBD-Fe. The main buffering mechanism between pH 6.5-8.5 was
clay > CBD-Fe, organic C > CBD-Al. Acid production for 30 crop production sites varied from a
measured 0.21 to 10.31 (mean 3.70) kmol H+ ha-1 year-1 The rate of pH decline for the top 0-250
mm depth was between 0.051 and 0.918 (mean 0.237) pH units year-1. In the absence of
remedial lime applications, pH (H2O) values in most of the area are projected to decrease to the
critical value of 5.68 or lower within 4 years. Soil with a pH (H2O) value of >5.73, extractable Al
and acidity of <0.18 and <0.25 cmolc kg-1 soil, respectively, clay content of ≤26%, and a ECEC
value of ≤3.29 cmolc kg soil-1, are at greater risk of acidification as gradual acceleration in soil
acidification takes place at the above-mentioned critical thresholds.

133
ACKNOWLEDGEMENTS
I would like to express my sincere appreciation to the following persons and institutions:
Professor Andries S Claassens and Dr Danie J Beukes, for their mentoring and guidance,
and for their assistance in the preparation of this manuscript.
In addition, special thanks to Mr Leon de Beer and other extension staff of the
Mpumalanga Department of Agriculture and Land Affairs.
Appreciation is expressed to Mr Filemon Mathunjwa and Mr Claas Zwane for donating the
experimental sites and for logistical support.
My thanks to Mrs Marie Smith for statistical analyses.
The Agricultural Research Council and the National Department of Agriculture for funding.
Mr Simon Tshabalala, Charles Maseko, Catherine Nkosi and Eric Mashabane, extension
officers in Mlondozi, for their assistance and advice.
Mr Marius van Rensburg from the Nooitgedacht Agriculture Development Centre for his
assistance and advice.
Mr Michael Kidson, Mr Martiens Mmamadisha, Mr William Mashabane, Ms Rinda van der
Merwe, Mr Roelof le Roux, Mrs Petro Ströhmenger, Mr Bates Booyens, Mr Louw Potgieter
and Mr Willem Kirsten, from the ARC–Institute for Soil, Climate and Water, for their
willingness and hard work in the execution of the project.
Mrs Esmè Lazenby and Mrs Anastasia Kgapane (ARC-ISCW) for research support with
the demonstration trials at Mlondozi.
Dr Thomas Fyfield (ARC-ISCW) for editing this report.
My husband, Stephanus, and children, Carli and Mieke, my family and friends for their
support and motivation.
Abba Father for guidance, perseverance and wisdom, to you Father the highest praise.

1
INTRODUCTION
1.1 BACKGROUND
Food security and the development of sustainable systems for the use of land and water
resources will remain key concerns for the 21st century in many regions of the world (Gill, 2001).
An enormous threat to food security for the human race is the decrease in yields from agricultural
lands that are physically, chemically and biologically degraded through the use of unsustainable
farming practices. It is, however, increasingly realized that the development of rural agriculture
can solve simultaneously several of the world’s most acute problems e.g. poverty, food insecurity
and land degradation.
One of the focus areas of the South African Government is to increase the positive impact
agriculture can have in our rural areas (Didiza, 2000). However, soil acidity is a major factor
limiting agricultural production in South Africa. Some 3 million hectares of the communal
agricultural areas of South Africa (former homelands), have rainfall and rainfall patterns that are
relatively favourable for crops, livestock and pasture production according to South African
conditions. The major portion of medium to high agricultural potential land in South Africa is
found in the former Ciskei, KwaZulu-Natal, Transkei and eastern parts of the Mpumalanga
Province. These areas include approximately 1.2 million high potential land with a mean annual
rainfall that exceeds 700 mm (Van der Merwe & Walters, unpublished). However, agricultural
production potential in these areas is seriously jeopardized due to excessive soil acidity.
1.2 JUSTIFICATION
In 1997 the Mpumalanga Department of Agriculture, Conservation and Environment (MDACE)
hosted a Workshop on Soil Acidity to promote sustainable agricultural land use. The rationale
behind this Workshop was that soil acidity impacts severely on agricultural productivity in many
areas of Mpumalanga. This resulted in unsustainable crop production, especially in the higher
rainfall areas that includes many of the resource-poor farmers in the province. This Workshop
1
2
was to form part of the launching of the National Landcare Programme (NLP) of the Department
of Agriculture (DoA). Various thematic issues on soil acidity were introduced by keynote
speakers. The aimed outcome was the development of various interventions with champions to
take these forward.
The NLP themes were grouped into two main areas, namely Focused Investment (WaterCare,
VeldCare, SoilCare, Eco-Agriculture Expanded LandCare and Junior Care) and Small
Community Grants. The SoilCare theme targeted rural communities in Mpumalanga, Eastern
Cape and KwaZulu-Natal with strategic objectives:
(i) of reducing depletion of soil fertility and reducing soil acidity,
(ii) to build innovative structures to combat soil erosion and
(iii) to introduce sustainable management of agricultural production systems (i.e. through
diversification, or management of inputs, e.g. resulting in reduced pollution and the
adoption of minimum tillage).
Up to 1997 soil acidity has mostly been neglected in the communal areas of Mpumalanga.
However, in conjunction with the 1997 Workshop, the Eastern Transvaal Small Farmers Forum
(ETSFF), situated in the Mlondozi district (former Kangwane), approached the MDACE for
assistance (Xaba, 2002). It soon became clear that resource-poor farmers in this district were
adversely affected by soil acidity, as 90% of all soils that were analyzed had pH (KCl) values
below 4.2. Furthermore, the land tenureship system does not guarantee continuous ownership
of land, rendering a problem in the Mlondozi district. Land users were not prepared to make a
long-term investment by liming their soils. The MDACE, together with the ETSFF applied for
financial assistance from the DoA for implementing a lime subsidy of 5 tonnes ha-1 cultivated
land for the Mlondozi land users. An amount of R 2.5 million was granted in 1997 to launch the
Mlondozi Landcare project that would benefit 1500 farmers cultivating 4000 ha.
1.3 SOUTH AFRICAN LANDCARE PROGRAMME
1.3.1 Goal of the national Landcare programme
The goal of the NLP in South Africa was to optimize productivity and sustainability of natural
resources resulting in greater productivity, food security, job creation and a better quality of life
for all (DoA, 2005).

3
1.3.2 National Landcare principles
Philosophically, and as a policy area, Landcare in South Africa is concerned with the application
of six indivisible Landcare principles (DoA, 2005):
(i) Integrated Sustainable Natural Resource Management embedded within a holistic
policy and strategic framework where the primary causes of natural resource decline
are recognized and addressed.
(ii) Fostering group or community based and led natural resource management within a
participatory framework that includes all land users, both rural and urban, so that they
take ownership of the process and the outcomes.
(iii) The development of sustainable livelihoods for individuals, groups and communities
utilizing empowerment strategies.
(iv) Government, community and individual capacity building through targeted training,
education, and support mechanisms.
(v) The development of active and true partnerships between government, Landcare
groups and communities, non-government organizations, and industry.
(vi) The blending together of appropriate upper level policy processes with bottom up
feedback mechanisms. Feedback mechanism should utilize effective Landcare
Programme beneficiaries and supporting participants.
1.3.3 Purpose of the South African Landcare programme
The following purposes contribute to a lesser or greater extent to the achievement of the overall
Landcare goal (DoA, 2005):
(i) Conservation of natural resources (community-based approach):
National support system recognizes local support structures or institutions.
Participatory legislation, policies, norms and standards implemented to support
the wise use of natural resources.
Community-based natural resource management.

4
(ii) Sustainable improved productivity:
Adoption of sound land management practices by all land users, resulting in
increased productivity through the improvement of the natural resource base.
(iii) Food security:
Protect natural resources.
Improve productivity of farming systems.
Access to food, land and information.
Safety and security of food.
Quality of food.
Off-farm income.
(iv) Empowerment (social, economic, employment and equity):
The purpose of empowerment in Landcare is to enhance economic capacity of land
users to achieve self-sufficiency by utilizing natural resources in order to:
Improve the quality of life.
Create entrepreneurial skills.
Diversify income sources.
Improve infrastructure.
Invest in human resources.
1.4 THE MLONDOZI LANDCARE PROJECT
In support of the NLP, the Agricultural Research Council-Institute for Soil, Climate and Water
(ARC-ISCW) initiated the Mlondozi Landcare project under the SoilCare theme of the NLP, in
collaboration with Southern Highveld Region Extension, Mlondozi farmers and farmer
associations. The goal of the Mlondozi Landcare project was to demonstrate and assess sound
land management practices, by involving local communities, who will contribute to sustainable
and profitable agricultural production in the Mlondozi district.
The ARC-ISCW was contracted to monitor and evaluate the project that was initiated in
September 1997. Reference soil samples were collected to determine the background soil
acidity and fertility status of the district. Trials were set up at two sites in 1997 to demonstrate
the benefits of liming to the farming community. Through rural appraisal, needs and diagnostic
surveys it was found that the majority of farmers were subsistence, experiencing food insecurity
with a low standard of living. Historically the area was primarily used for seasonal grazing
because of the climatic unsuitability for crop farming. At the start of the project the challenge was
to improve the maize yield in the district from a mere 0.5 tonnes ha-1 to an estimated district

5
potential of approximately 4.5 tonnes ha-1. At the time farmers were using unsustainable farming
practices such as: incorrect soil fertility and weed management practices, late planting dates,
mono-cropping, over-grazing and ploughing the land at very high cost. Ploughing furthermore
led to in-field soil erosion, soil biological degradation and declining soil fertility. These
inappropriate land management practices also caused the soil to become more compacted, the
organic matter content to be reduced and water runoff and soil erosion to increase (Steiner,
1998). These practices also led to the effects that drought spells impacted more severely on
yields and the soils became less fertile and less responsive to fertilizer. Other disadvantages of
conventional production are the high requirement of labour (weeding), time and energy (fuel cost)
(Steiner, 1998).). The effects of these factors in reducing yields and income are particularly
apparent in regions like Mlondozi with a short growing season. Historically the area was
primarily used for seasonal grazing because of the climatic unsuitability for crop farming.
Another challenge existed in that soil acidification is a natural process that is exacerbated by
modern agricultural practices. The rate at which a production system acidifies is a function of
the intrinsic soil properties (e.g. base saturation, CEC, buffering capacity), climate, and farming
practice. It is therefore important that the rate of acid production in soils by these various inputs
and outputs on different land uses be known in order to facilitate corrective actions by the
producer (Sumner & Noble, 2003). Furthermore, knowledge on intrinsic mechanisms governing
soil buffering capacity of major soil groups in the district could serve as a valuable tool in
understanding why soils respond differently to addition of dolomite. Knowledge on a soil’s
buffering capacity is also needed to understand the rates of natural soil weathering, rates of soil
acidification from acid-forming nitrogen fertilizers, acid rain, and acid mine waste (Bloom, 2000).
From a strategic perspective, quantification of acid production rates under various agronomic
production systems can assist producers, extension officers, and policy makers in making
decisions in preventing acidification and the long-term impact of a production system.
A community-driven development approach was followed in the Mlondozi Landcare project with
the core principles being the training and empowerment of land users and community members
in the benefits of liming and fertilization practices to improve soil productivity and to obtain stable
and profitable yields. The implementation and impact of the technologies on the farming
community (biophysical, economic and social indicators) were to be monitored continuously.

6
1.5 PROJECT OBJECTIVES
The following objectives were developed:
For Strategic and Developmental Activities:
(i) To facilitate the process of participation and community ownership of the project. A
participatory approach was used in order to enable people to share, plan, act, learn,
monitor and evaluate their own development. The ultimate aim of the objective was
to pass on the control and responsibilities of the project to the farming community.
This process continued over several growing seasons and therefore required long-
term commitment from both the farming community and the change agents, which in
the case of Mlondozi were the MDACE and ARC-ISCW.
(ii) To increase community awareness and understanding of the benefits and costs of
natural resource conservation and to promote their input to implement conservation
measures.
(iii) To train farmers and Extension Officers in the skills necessary to sustainably
implement and manage the Mlondozi Landcare project. The main aim was not only
the “transfer of knowledge” but involving farmers in their own development and
incorporating their indigenous knowledge into the farming system.
(iv) To monitor and evaluate the profitability and sustainability of farming systems
development in the Mlondozi Landcare project. The primary aims of monitoring were
to provide a basis for decisions on subsequent stages of the research or
development, to formulate judgments on performance, and to contribute to
accountability for the use of resources. To do this required the development of clear
sets of objectives and indicators of success, which would promote accountability and
participation and which could be monitored and evaluated by the relevant decision-
makers at all levels. For this purpose participatory and systems-based evaluation
models were used, which helped to facilitate the implementation of the monitoring
and evaluation processes.
For Research:
(v) To monitor the effects of liming on the neutralization of soil acidity and to determine

7
the re-acidification rate of soils under cultivation.
(vi) To measure the effects of liming on growth and yield of maize.
(vii) To determine the relative importance of soil properties in determining the soil buffer
capacity of the major soil groups.
(viii) To determine the mechanism that governs soil acidification, estimate soil acidification
rates of the major soil groups and make recommendations and set guidelines for
efficient lime application rates to ensure sustainable land use.
Objectives v to viii formed the basis of the present study and will be discussed in detail in
Chapters 2 to 7.
1.6 STUDY AREA
1.6.1 Locality and physical features
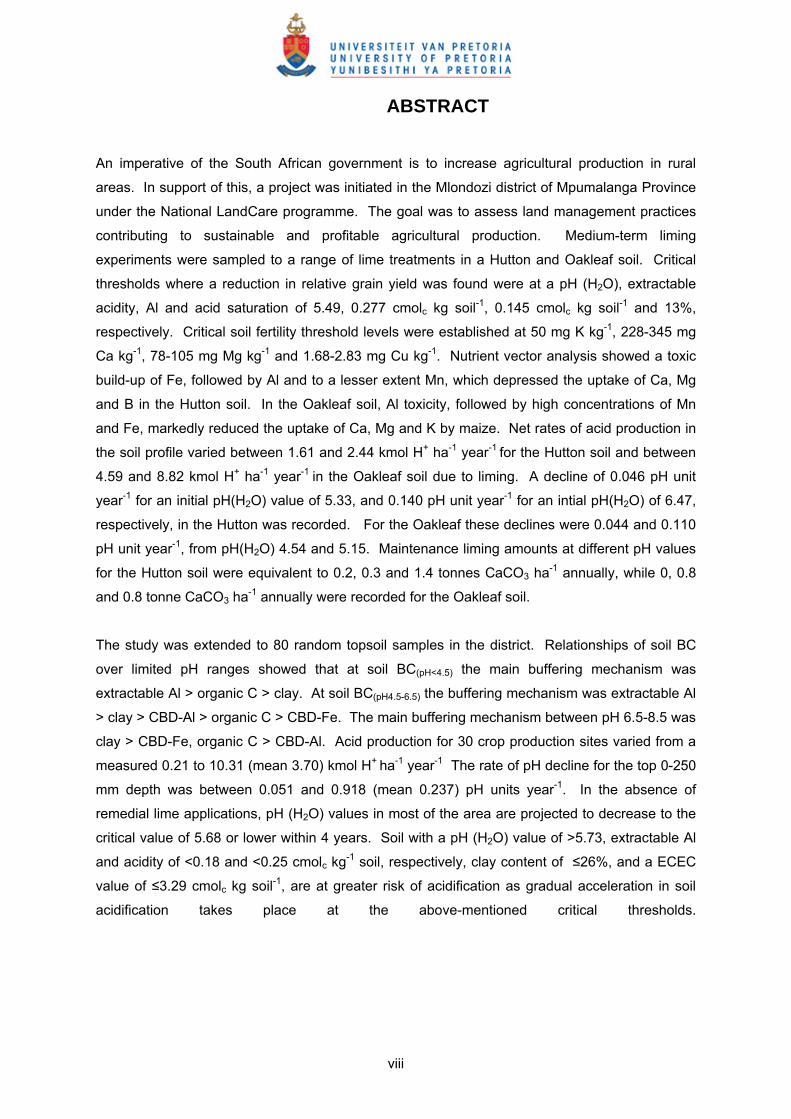
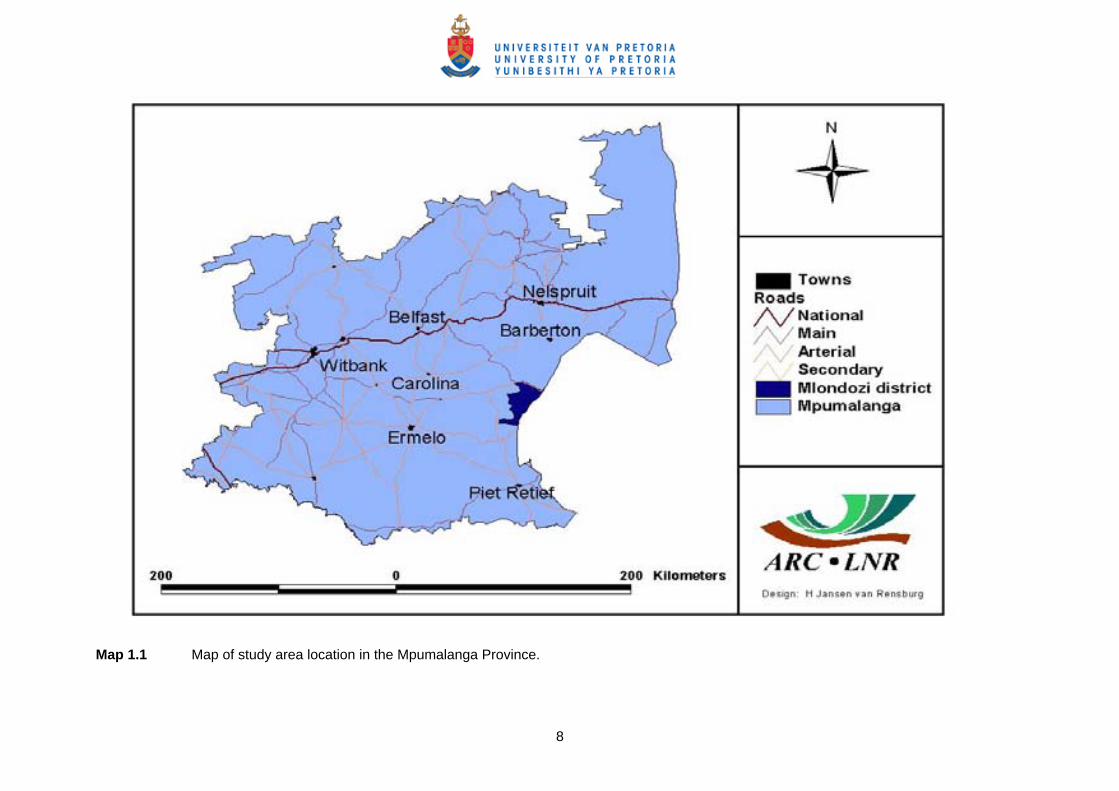
The study area (Mlondozi district) is located in the Mpumalanga Province (Map 1.1) and is
situated between 26º 05’ and 26º30’ S and 30º44’ and 31º00’ E and occupies a total area of 54
000 ha. The district is bordered by Swaziland towards the east; the Oshoek road in the North
and the municipal borders of the town Amsterdam in the south.
The district is extremely hilly with altitudes varying from 1 700 m in the north, dropping to 1 300 m
centrally and rising to 1 580 m above sea level in the south. The hydrology is characterized by a
number of smaller streams from tributaries of the Mpuluzi River, which drains from west to east,
flowing into the Usutu River in Swaziland. The larger tributaries are the Swartwater and Metula
rivers. Wetlands occur in the northern portion of the district mainly in the vicinity of Belvedere
settlement (Myburgh & Breytenbach, 2001).
8
Map 1.1 Map of study area location in the Mpumalanga Province.

9
1.6.2 Climate
The Mlondozi district forms part of the Highveld climatic region, which receives an annual
average precipitation of between 650 mm in the west to 900 mm on its eastern border (Myburgh
& Breytenbach, 2001). Long-term weather station data for Athole (26°36’ S and 30°35’ E) and
Oshoek (26°13’ S and 30°59’ E) are summarized in Table 1.1. The long-term annual rainfall
recorded at the Athole weather station varies between 893 to 992 mm from north to south in the
district. The seasonal distribution is uneven. The summer season (October to March) receives
on average 83% of the total rainfall, while the winter season (April to September) receives only
17% of the rainfall. The air temperature is subject to large seasonal and daily variation. Monthly
average daily temperature ranges from 10.2 ºC for the coldest month (June) to 18.9 ºC for the
hottest month (January/February).
In general it can be stated that maize, the main crop being produced in the area, is a warm
weather crop and is not suitable to be grown in areas where the mean daily temperature is less
than 19 ºC or where the mean of the summer months is less than 23 ºC (Du Plessis, 2003).
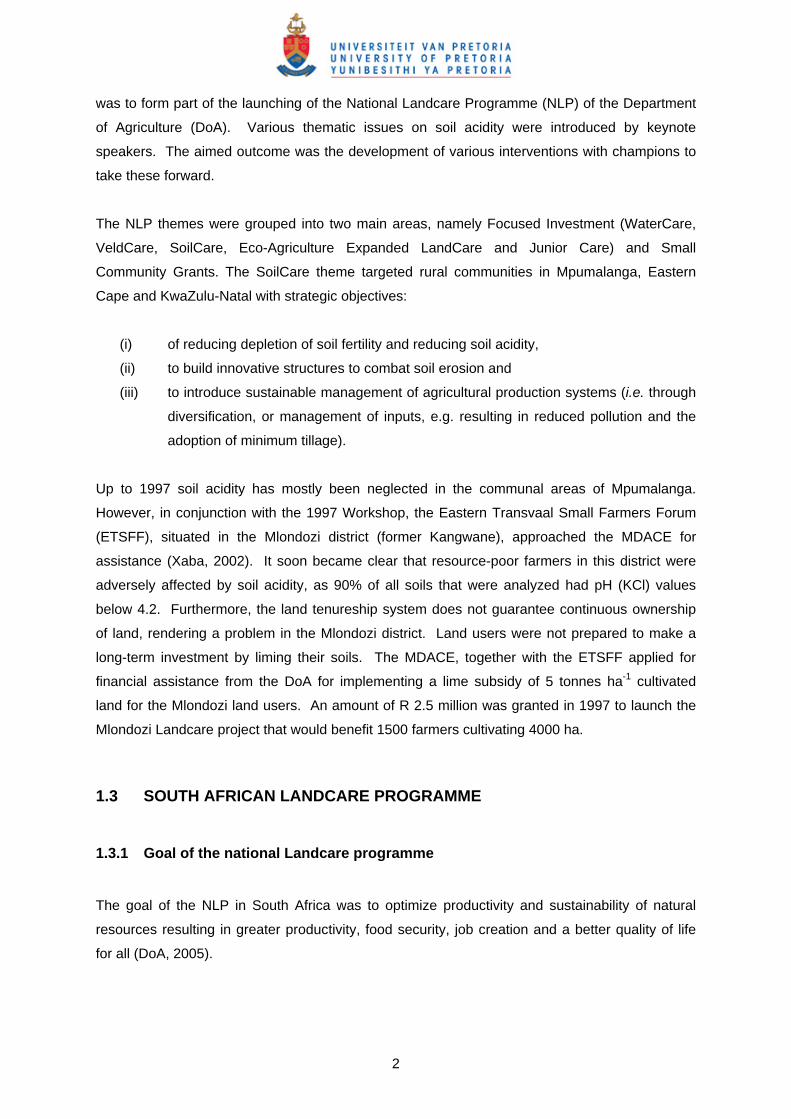
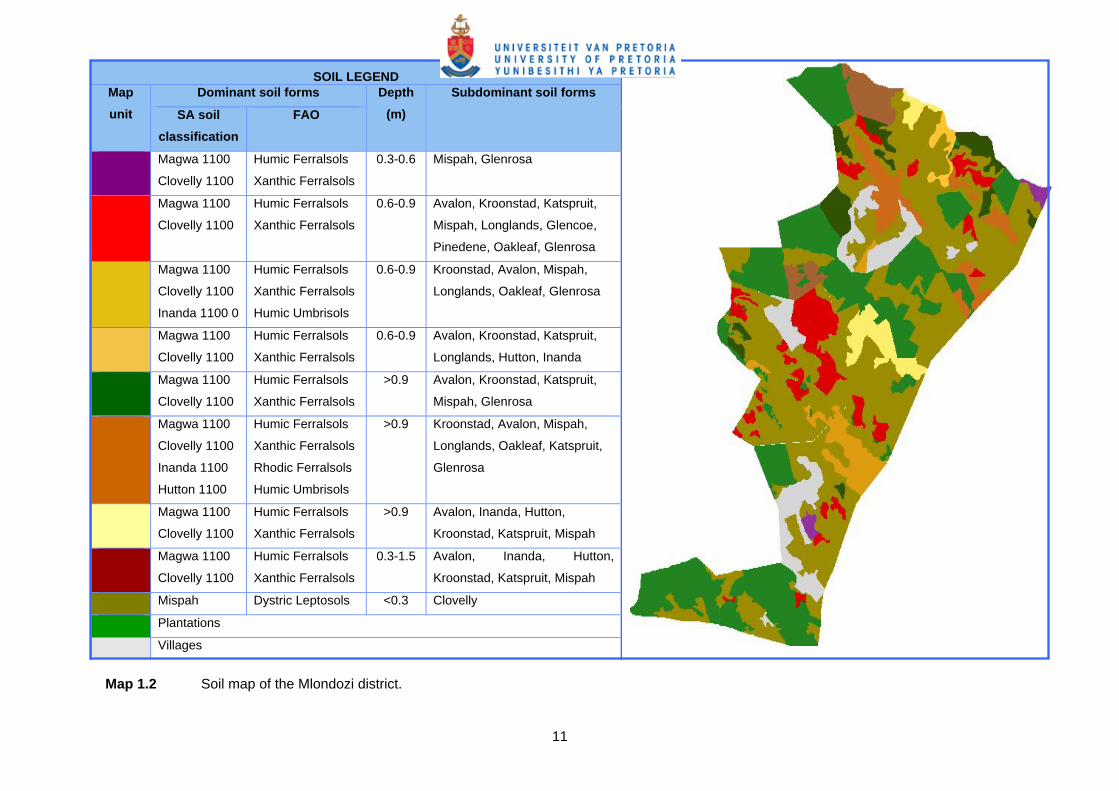
1.6.3 Geology and soils
The geology of the area is homogeneous, mostly underlain by quartz monzonite of the Mpuluzi
Granite formation (Myburgh & Breytenbach, 2001). The study area is characterized by highly
acidic soils and soils with humic characteristics are common. A soil survey done by Booyens et
al. (2000), using Soil Classification – A Taxonomic System for South Africa (Soil Classification
Working Group, 1991) found that the soil forms in the intensively cultivated areas are dominated
by distrofic yellow apedal soils belonging to the Clovelly (Xantic Ferralsols) and Magwa (Humic
Ferralsols; FAO-ISS-ISRIC, 1998) soil forms (Map 1.2). The Clovelly soil form is characterized
by an A-horizon yellowish in colour, weak in structure without water stagnation, underlain by
yellow-brown, structureless, sandy clay subsoil. Magwa soil form is characterized by a humic A-
horizon underlain by yellow-brown, structureless subsoil.
The subdominant soil forms in the district consist of dystrophic red apedal soils, Hutton (Rhodic
Ferralsols) and Inanda (Humic Umbrisols; FAO-ISS-ISRIC, 1998) as indicated in Map 1.2. The
Hutton soil form is characterized by a reddish coloured, weak structure in which water stagnation
does not take place. The rest of the district is dominated by Mispah (Dystric Leptosols; FAO-
ISS-ISRIC, 1998) soils, shallow soils underlain by a hard rock layer, and rock outcrops (Booyens
et al., 2000).

10
Table 1.1 Climatic summary for the Athole and Oshoek weather stations, situated respectively 10 km to the south and to the north of the
Mlondozi district (Agromet, 2002) Jan Feb Mar Apr May Jun Jul Aug Sep Oct Nov Dec Ave/*Total
values Years
AveT1 18.9 18.9 17.8 15.3 12.7 10.2 10.4 12.9 15.8 17.4 18.0 18.8 15.6 45
MaxT1 23.8 23.6 23.0 21.6 19.5 17.2 17.6 19.9 22.4 22.9 23.2 24.0 21.6 55
AveX1 29.5 28.9 28.2 26.6 24.3 22.3 23.0 26.5 30.0 30.7 29.5 29.6 27.4 45
MinT1 12.9 13.0 12.0 9.5 6.3 3.4 3.2 5.0 8.0 10.0 11.4 12.6 9.0 55
AveN1 8.3 8.9 7.5 3.9 1.1 -2.0 -2.3 -0.7 1.5 4.1 6.4 7.9 3.7 45
Rain1 167.0 146.8 100.5 51.8 17.5 14.1 10.3 15.8 45.4 107.2 139.5 175.6 *992 64
Rain2 145.7 119.7 105.7 49.8 36.1 10.3 9.1 15.6 37.2 100.7 134.4 128.1 *893 36
HU1 260.5 233.2 232.3 167.8 97.0 34.9 39.3 91.3 163.6 201.0 219.8 257.1 *1998 45
Suns1 7.2 7.1 7.2 7.2 7.7 7.3 7.7 8.2 7.6 7.0 6.8 7.2 7.4 22
Evap1 180.3 149.2 152.1 134.3 138.2 126.6 139.7 168.0 189.2 182.6 177.8 191.8 *1930 24
Heat units (October to March) 1 403.9 Heat units (April to September) 593.9
Earliest frost date 7 January Latest frost date 24 September
Mean first date of frost 14 June Mean last date of frost 17 August
Mean frost season length 64 days
1 Athole weather station 2 Oshoek weather station
AveT: Average temperature (degrees °C) AveN: Average of the one lowest Min T per month (degrees °C)
MaxT: Maximum temperature (degrees °C) Rain: Total rainfall (mm) Evap: Evaporation, A-pan (mm)
AveX: Average of the one highest MaxT per month (degrees °C) HU: Heat units above 10°C
MinT: Minimum temperature (degrees °C) Suns: Sunshine hours, Daily, Campbell-Stokes
11
SOIL LEGEND Map unit
Dominant soil forms Depth (m)
Subdominant soil forms
SA soil classification
FAO
Magwa 1100
Clovelly 1100
Humic Ferralsols
Xanthic Ferralsols
0.3-0.6 Mispah, Glenrosa
Magwa 1100
Clovelly 1100
Humic Ferralsols
Xanthic Ferralsols
0.6-0.9 Avalon, Kroonstad, Katspruit,
Mispah, Longlands, Glencoe,
Pinedene, Oakleaf, Glenrosa
Magwa 1100
Clovelly 1100
Inanda 1100 0
Humic Ferralsols
Xanthic Ferralsols
Humic Umbrisols
0.6-0.9 Kroonstad, Avalon, Mispah,
Longlands, Oakleaf, Glenrosa
Magwa 1100
Clovelly 1100
Humic Ferralsols
Xanthic Ferralsols
0.6-0.9 Avalon, Kroonstad, Katspruit,
Longlands, Hutton, Inanda
Magwa 1100
Clovelly 1100
Humic Ferralsols
Xanthic Ferralsols
>0.9 Avalon, Kroonstad, Katspruit,
Mispah, Glenrosa
Magwa 1100
Clovelly 1100
Inanda 1100
Hutton 1100
Humic Ferralsols
Xanthic Ferralsols
Rhodic Ferralsols
Humic Umbrisols
>0.9 Kroonstad, Avalon, Mispah,
Longlands, Oakleaf, Katspruit,
Glenrosa
Magwa 1100
Clovelly 1100
Humic Ferralsols
Xanthic Ferralsols
>0.9 Avalon, Inanda, Hutton,
Kroonstad, Katspruit, Mispah
Magwa 1100
Clovelly 1100
Humic Ferralsols
Xanthic Ferralsols
0.3-1.5 Avalon, Inanda, Hutton,
Kroonstad, Katspruit, Mispah
Mispah Dystric Leptosols <0.3 Clovelly
Plantations
Villages
Map 1.2 Soil map of the Mlondozi district.
12
1.6.4 Vegetation
The study area occurs in the Grassland Biome and more specifically in Veld type 63 or Piet
Retief Sourveld with a smaller intrusion of Veld type 57 in the north-eastern sandy Highveld
(Acocks, 1988) in the northern portion (Myburgh & Breytenbach, 2001).
According to Myburgh and Breytenbach (2001) the rangeland is generally in a satisfactory to
good condition. There is, however, a decline in the condition of the rangeland from north to
south. The central and, especially, southern regions are being utilized more intensively than the
northern regions. The declared invader Acacia dealbata is a serious problem and will inevitably
impact negatively on the livestock production potential of the district (Acocks, 1988; Myburgh &
Breytenbach, 2001).
1.6.5 Land use
The main land uses in Mlondozi are settlements, plantations, cultivated land and unimproved
grasslands. It is estimated that villages constitute an estimated 3 553 ha (7%), whilst 13 497 ha
(25%) of plantations occur in the district. The Mlondozi district has approximately 12 746 ha
(24% of district) of potentially arable land of which only 5 619 ha is of high production potential.
Currently only 4 000 ha of the arable land is being cultivated. The land tenure system is still that
of Tribal Authority, which falls under the jurisdiction of the government. Land allocation is
through the Tribal Authority. Although farmers can acquire land, it is becoming increasingly in
short supply.
1.6.6 Demographic information
The study area forms part of the Albert Luthuli (MP301) municipality area with approximately 80
000 people of which more than 99% are African. Of these, around, 36 000 are male and 44 000
are female. The age group 16 to 35 represents 33% of the population and 4% of the population
is 65 years and older. Twenty-one percent of the people 15 years and older is illiterate.
Amongst those aged 15 to 65 years, 61% are unemployed. IsiZulu is spoken by 47% of the
people followed by SiSwati (34%).
Out of the 13 012 households in the area only 42% live in a formal dwelling. Only 19% of the
households use electricity for cooking, whilst only 7.4% of households have sanitation facilities.
Water is available to only 7% of the district’s population in the form of water piped to their
dwellings. The area is characterized by subsistence-based farming and rangelands are
generally community-owned and managed (Stats SA, 1996).

13
1.7 GENERAL STRUCTURE OF THE THESIS
The thesis comprises nine chapters. Chapters 2 to 7 are to be submitted as articles. In addition
to these chapters an introduction (Chapter 1), general conclusions and recommendations
(Chapter 8), and a comprehensive list of references (Chapter 9) are included.
14
AN EVALUATION OF LIME EFFECTS ON TEMPORAL CHANGES IN SOIL ACIDITY PROPERTIES AND MAIZE GRAIN YIELDS
2.1 INTRODUCTION
Excessive soil acidity reduces crop growth and yield and the need for liming to increase crop
production is an accepted practice. However, the cost of liming makes the initial investment a
daunting proposition for many farmers, especially resource-poor farmers. Large areas of
agricultural land in South Africa that are being utilized by resource-poor farmers are situated in
the former homelands that are still owned by government. The result is that land users are
hesitant to make long-term investments and therefore seek information on the longevity of liming
responses, as well as the rate and frequency of lime application. Coventry et al. (1997) found
that wheat grain yield responded to 2.5 tonnes lime ha-1 for periods as long as 12 and 13 years
after application in Victoria, Australia. Similar results were found by Scott et al. (1999) who
reported a wheat grain yield response to limestone at 10 and 11 years after application. The
long-term beneficial effects of lime, as reported by Coventry et al. (1997) and Scott et al. (1999),
make the application of lime an economically sound investment. The residual effect of lime
application is dependent on crop requirement, soil buffer capacity, nitrogen application rate, initial
soil pH, and management philosophy (Helyar, 1976).
The present study was undertaken to evaluate the effect of liming on temporal changes in soil
acidity properties and maize grain yield in a resource-poor farming area in the Mpumalanga
province. The results obtained and lessons learned in the study were to serve as a guide to
similar projects that would be executed in various resource-poor farming areas in South Africa.
As part of the programme, dolomite was applied at a rate of 5 tonnes ha-1 to ≈ 4000 ha croplands
in the district with a total financial assistance of R 2.5 million. For lime application strategies to
be effective in resource-poor agriculture areas, reliable information on lime effects on soil acidity
properties and maize grain yield is required. In particular, information is required on the
effectiveness and frequency of lime application, as well as on critical soil acidity levels for yield
optimization.
The objectives of the study were to evaluate (i) the temporal changes in soil acidity properties
(pH, extractable acidity (Al3+ + H+), extractable Al3+, acid saturation), (ii) the residual benefit of
2

15
lime application on maize grain yield, and (iii) critical soil acidity indices in two medium-term
liming experiments in on-farm trials, in the Mlondozi district of Mpumalanga.
2.2 MATERIAL AND METHODS
2.2.1 Soils and experimental design
In 1997 and 1998, liming experiments planted to maize were initiated on two acid soils in the
Mlondozi district of Mpumalanga, South Africa. Six and five-year trials were set up on a Hutton
form, Hayfield family (Humic Ferralsol) and an Oakleaf form, Caledon family (Rhodic Cambisol;
FAO-ISS-ISRIC, 1998), respectively (Table 2.1).
Table 2.1 Selected soil physical and chemical properties1 of the topsoil (0-250 mm) of the
two experimental sites prior to establishment of trials
Experimental soil
Soil form2 Hutton Oakleaf
Soil family2 Hayfield Caledon
Clay (< 2 µm) (%) 35.4 37.0
Clay mineralogy (%)3 Kt = 59, Qz=22, Go=19 Kt=60, Qz=23, Go=17
pH (H2O) 5.44 4.57
pH (KCl) 4.50 3.95
Extractable Al (cmolc kg-1) 0.23 1.28
Extractable acidity (cmolc kg-1) 0.35 1.41
Acid saturation (%) 34 61
Ca (cmolc kg-1) 0.75 0.45
Mg (cmolc kg-1) 0.47 0.35
Organic C (%) 2.05 5.64
OM (%)4 3.53 9.70
Soil BC (cmolc kg-1 pH unit-1) 0.65 2.49
Soil BC (kmolc (ha10cm)-1 pH unit-1) 8.42 32.42 1 According to the The Non-Affiliated Soil Analysis Work Committee (1990)
2 Soil Classification Working Group (1991)
3 Clay minerals listed in order of decreasing abundance: Kt=Kaolinite, Qz=Quartz, Go=Goethite
4 Organic matter % = 1.72 x % C (Jackson, 1958)
Treatments comprised factorial combinations of lime (three treatments) and fertilizer (two
treatments), which were arranged in a randomized block design with three replicates (3 x 2 x 3 =
18 plots) separated by 5 m pathways. Fertilizer treatments consisted of a control (zero fertilizer),
and a mixture of 30 kg N ha-1, 25 kg P ha-1 and 30 kg K ha-1 at planting, plus 50 kg N ha-1 in the

16
form of limestone ammonium nitrate as a topdressing eight weeks after planting. The fertilizer
was band-placed at annual planting. The lime treatments consisted of a control (zero lime), 5
and 10 tonnes of dolomitic lime ha-1. The lime was broadcast (once-off application in September
1997 and 1998) prior to planting, and ploughed in to a depth of approximately 300 mm. Lime
application rates were selected to complement a lime subsidy of 5 tonnes ha-1 from the National
Department of Agriculture that started in 1997. A quality analysis of the lime used in the study is
given in Table 2.2.
Table 2.2 Quality analysis values by calcium carbonate equivalent and resin suspension
method of the experimental lime
%
CaCO3
MgCO3
Total (CaCO3 + MgCO3)
CCE1 neutralizing value
Resin neutralizing value (RH)2
43.65
41.03
84.68
86.90
84.08
1 CCE = Calcium carbonate equivalent
2 Resin method (Bornman et al., 1988)
The individual plots were 9.25 m x 3.6 m (33.3 m2) in size consisting of four rows each of maize.
Only the middle two rows (length = 7.2 m) were used for data collection, with sampling borders of
1 m on each side.
2.2.2 Soils sampling and analysis
Topsoil samples (0 - 250 mm) were taken annually in March. Eight soil samples were taken
within each plot between the rows and a composite sample was made up. Samples were air-
dried and ground to pass a 2 mm sieve.
Soil pH (H2O) was determined in a 1:2.5 (soil:water) suspension (Reeuwijk, 2002). The Walkley-
Black method was used for the determination of organic carbon (Walkley & Black, 1934).
Extractable acidity (H + Al) was determined by extraction 1 M KCl and titration with 0.1 M NaOH.
Extractable Al was determined in the same extract by adding 10 cm3 NaF to the titrate. These
extractions can be regarded as a measure of extractable acidity and Al (The Non-Affiliated Soil
Work Committee, 1990). Acid saturation was determined as the ratio of extractable acidity (Al +
H) to the sum of extractable Ca, Mg, K, Na and extractable acidity (Al + H), expressed as a
percentage. To determine the soil buffer capacity (soil BC) of the experimental soils,
potentiometric titrations (Ponizovskiy & Pampura, 1993) were performed on soil samples that
17
were equilibrated overnight with 1 M KCl. The soil BC was calculated as reported by Bache
(1988).
2.2.3 Planting and yield estimates
Maize seed of cultivar CRN 3631 was hand-planted annually under a dryland farming system at
the end of October, using a row spacing of 0.91 m. The plant population density at planting was
55 000 plants ha-1, which was thinned out to approximately 35 000 plants ha-1.
The trials were harvested annually in May. The seed mass and moisture content were
determined and final seed yields were adjusted to 12.5% moisture content. Trial management
was done in a collaborative research-farmer initiative. Maize yields could not be determined for
the years 2001 and 2003 in the Oakleaf soil form because the trials were harvested by the farmer
before yields could be determined in 2001 and livestock entered the trial area and grazed on the
maize grain in 2003. All trials were farmer managed with assistance from ARC personnel.
The evaluation of critical threshold values for soil acidity indices was based on relative grain yield
values. The advantages and shortcomings of the relative yield concept were discussed by Bray
(1944) and Van Biljon et al. (2008), but the conclusion was that applying the relative yield
concept to field data makes it possible to include results from different climatic zones, soil types,
maize cultivars, plant spacing and seasons. Relative grain yield per plot was obtained by
expressing absolute yield as a percentage of the mean of the highest yielding treatment.
Averages were calculated from the replicate values to represent the relative grain yield per
treatment.
2.2.4 Rainfall data
Rainfall data for the Athole (26°36’ S and 30°35’ E) weather station are summarized in Table 2.3,
at an approximate distance of 10 and 15 km from the trial sites.
The total annual rainfall varied from 595 mm for the 2002/03 season to 1250 mm for the
1999/2000 season. The long-term total for the district is characterized by an uneven rainfall
distribution. The summer season (October to March) receives on average 84% (mean of 728
mm over six years) of the total rainfall, while the winter season (April to September) receives only
16%.

18
Table 2.3 Mean monthly rainfall data (mm) for the Athole weather station situated 10 km to
the south of the Mlondozi district (Agromet, 2008)
Season Jun Jul Aug Sep Oct Nov Dec Jan Feb Mar Apr May Total
1997/1998 23 7 16 54 147 182 109 99 65 182 49 5 936
1998/1999 0 2 7 72 134 117 236 128 72 36 13 15 832
1999/2000 6 4 9 34 99 100 361 208 240 94 44 51 1250
2000/2001 30 12 15 53 71 220 174 92 114 67 131 12 991
2001/2002 6 3 0 16 90 219 89 37 74 40 53 3 667
2002/2003 16 19 40 30 69 74 104 135 59 31 12 6 595
64-year mean 14 10 16 45 107 140 176 167 147 101 52 18 992
2.2.5 Statistical analysis
Data were analyzed using the Genstat statistical program (Genstat, 2003). The values that will
be discussed are replicate means across fertilizer levels and per lime application level in order to
evaluate the main effect of lime application. The effect of liming on soil acidity properties and
maize grain yield was evaluated by analysis of variance (ANOVA). The Bonferroni multiple
comparison test for means separation was used to test all main effects at the 5% probability level
(Table 2.4).
Table 2.4 ANOVA table of probabilities of treatment effects on soil pH (H2O), extractable
(H+Al), Al, acid saturation, organic C and maize grain yield for the Hutton and
Oakleaf soil forms
Variable Hutton Oakleaf
F-ratio
Lime Year x Lime Lime Year x Lime
pH (H2O) 205.33*** 1.99* 0.32*** 0.52ns
Extractable (H+Al) 195.51*** 6.69*** 42.77*** 2.01*
Extractable Al 351.28*** 56.86*** 37.47*** 2.68*
Acid saturation 195.51*** 6.69*** 47.22*** 1.90ns
Maize grain yield 5.22** 1.29ns 33.09*** 3.58* *** P < 0.001, ** P < 0.01, * P < 0.05 and ns = not significant
Pearson’s coefficient of correlation was calculated between measured variants (Rayner, 1969).
Non-linear regression results were analyzed by using the broken-stick model, whereby two
straight line segments (a split-line or broken-stick model) are fitted to the data (Genstat, 2003).
19
The broken-stick model was used to identify critical soil acidity levels where a significant
decrease in absolute or relative yield, respectively could be expected.
2.3 Results and discussions
The values that will be discussed are replicate means across fertilizer levels and per lime
application level in order to evaluate the main effect of lime application.
2.3.1 Soil pH, extractable acidity, Al and acid saturation
Temporal changes in soil acidity parameters at different lime application rates for the
experimental soils are shown in Table 2.5.
Hutton soil form: Liming had a highly significant (P<0.001) effect on all soil acidity parameters
(Table 2.4). A significant interaction between lime and seasons after lime application was
recorded for all soil acidity parameters (Table 2.4). In the first season, lime significantly (P<0.05)
increased soil pH (H2O) by 0.60 and 0.75 pH units in the 5 and 10 tonnes lime ha-1 treatments,
respectively (Table 2.5). The reported optimal pH (H2O) for maize production, namely 5.5 to 6.5
(Buys, 1986), was attained for both the 5 and 10 tonnes lime ha-1 applications within the first
season of lime application. A continued significant (P<0.05) increase in soil pH (H2O) was
recorded until the highest values of 6.21 and 6.57 were reached within three seasons after liming
in the 5 and 10 tonnes lime ha-1 rates, respectively. This time lag of three years found between
the lime application and the attainment of maximum soil pH (H2O) can be attributed to the
relatively slow reactivity of the dolomitic lime that was used. A similar lack in equilibrium between
free limestone and the soil mass was found by Walker (1953) and Bolton (1972, 1977).
The pH (H2O) data in the highest lime treatment showed a significant (P<0.05) increase over the
5 tonnes lime ha-1 treatment for the last four years of the trial. The Hutton soil continued to show
significantly (P<0.05) higher soil pH (H2O) values due to lime after 6 years, where the 5 and 10
tonnes lime ha-1 rates resulted in 1.01 and 1.47 pH unit increases, respectively, over the unlimed
treatment. This indicates that the beneficial effect of lime persisted for at least 6 years after
application under the specific production practice that was used. Extractable acidity and Al, and
acid saturation decreased (P<0.001) with lime application (Table 2.4). In the first season after
liming, the initial extractable acidity, Al and acid saturation levels of 0.34, 0.21 cmolc kg-1 and
21.5%, respectively, were significantly decreased (P<0.001) to near zero levels, with 5 and 10
tonnes lime ha-1 application (Table 2.5). The residual effect of lime in reducing the values of the
various soil acidity properties to near zero levels was observed for at least 6 years after the once-
off lime application in 1997.
20
Table 2.5: Changes in soil pH (H2O), extractable acidity, Al and acid saturation as affected by lime (tonnes ha-1) in the Hutton and Oakleaf soil
forms over time
Year Hutton Oakleaf
pH (H2O) (H+Al) Al Acid sat. pH (H2O) (H+Al) Al Acid sat.
0 5 10 0 5 10 0 5 10 0 5 10 0 5 10 0 5 10 0 5 10 0 5 10
1998 5.22b 5.82c 5.97cd 0.34b 0.04cd 0.05d 0.21b 0.09cd 0.06cd 21.5c 2.5e 2.4e - - - - - - - - - - - -
1999 5.15ab 5.95cd 6.17de 0.39b 0.02cd 0.00d 0.25b 0.02 d 0.00d 22.4c 0.6e 0.0e 4.18ab 4.59bc 4.94bc 1.40bc 0.95de 0.62e 1.28bc 0.83cde 0.52e 74.2a 39.9cd 16.7e
2000 5.34b 6.21de 6.57f 0.20bc 0.00d 0.00d 0.14bc 0.01d 0.00d 11.8d 0.0e 0.0e 3.83a 4.82abc 5.04d 1.05cd 0.77e 0.73e 0.71de 0.60e 0.57e 62.7ab 34.3de 32.7de
2001 5.01a 5.96cd 6.31ef 0.64a 0.02cd 0.00d 0.21b 0.04cd 0.00d 31.1b 0.9e 0.0e 4.40abc 4.79abc 4.94cd 2.35a 1.67b 1.24cd 2.11a 1.48b 1.09bcd 76.6a 53.3bc 36.3cd
2002 4.87a 5.96cd 6.44ef 0.69a 0.02cd 0.00d 0.67a 0.02d 0.00d 37.3ab 1.1e 0.0e 4.25abc 4.45abc 4.79bc 2.32a 2.18a 1.29bcd 2.26a 2.11a 1.06bc 77.3a 75.1a 40.8cd
2003 5.00a 6.01cd 6.47ef 0.77a 0.09cd 0.02cd 0.72a 0.07cd 0.02d 39.4a 3.2e 0.7e 4.37abc 4.54abc 4.98bc 2.36a 2.00a 1.23cd 2.33a 1.95a 1.17bc 75.6a 70.7ab 40.9cd
LSD 0.30 0.14 0.11 8.3 0.72 (ns) 0.42 0.45 18.3 (ns)
Column and row values having the same symbols are not statistically different at P = 0.05

21
Oakleaf soil form: Lime significantly increased (P<0.001) soil pH and decreased extractable acidity
and Al, and acid saturation (Table 2.4), but a significant (P<0.05) interaction between lime and
seasons after lime application was only recorded for extractable acidity and Al. In the first season
a non-significant increase in soil pH (H2O) from an initial pH (H2O) of 4.18, to 4.59 and 4.94, in the
5 and 10 tonnes lime ha-1 treatments, respectively, was found (Tables 2.4 and 2.5). However, the
application of lime did not succeed in raising the soil pH to the optimum range (5.5 to 6.5)
recommended for maize production (Buys, 1986). Maximum pH (H2O) values were recorded in the
second season after lime application, with only the 10 tonnes lime ha-1 treatment being significantly
higher than the unlimed treatment.
Significant (P<0.05) decreases in extractable acidity and Al, and acid saturation, especially in the
10 tonnes lime ha-1 treatment, were observed in the first season after liming (Table 2.5). Although
these values were much lower than the control, only the 10 tonnes lime rate decreased acid
saturation levels to below 20%. As with soil pH (H2O), the lime application was not sufficient to
decrease extractable acidity, Al and acid saturation to threshold values recommended for maize
production.
Comparison of the experimental soils: The two soils clearly reacted differently towards lime
applications. An important contributing factor is the difference in soil buffer capacity (soil BC)
between the two soils. Although this aspect will be dealt with in a subsequent article, it is important
to mention that the soil BC for the Hutton and Oakleaf soils was 0.65 and 2.49 cmolc kg-1 pH unit-1,
respectively (Table 2.1). This implies that the Oakleaf soil form will have the greatest resistance to
change and, therefore, larger amounts of lime will need to be applied to efficiently control excess
soil acidity.
2.3.2 Grain yield versus lime application
Hutton soil form: Yield responses obtained during the first six seasons showed that the grain yield
was significantly (P<0.01) affected by lime application (Tables 2.4 and 2.6). Liming resulted in a
mean improvement in grain yield in the first season after liming of 0.68 and 0.91 tonnes ha-1,
respectively, in the 5 and 10 tonnes lime treatments (Table 2.6).
The results furthermore show that the application of 10 tonnes lime ha-1 did not result in a
statistically significant increase in maize grain yield, indicating that a lime application rate of 5
tonnes lime ha-1 is advisable in the Hutton soil form. Although a poor linear correlation was found
between absolute grain yield and lime application, a positive correlation (P<0.05) existed between
relative yield and lime application (Table 2.7).

22
Table 2.6 Changes in absolute maize grain yield (tonnes ha-1) as affected by lime (tonnes ha-1)
in the Hutton and Oakleaf soil forms over time Year Hutton Oakleaf
Lime application (tonnes ha-1)
0 5 10 0 5 10
19981 2.59cdef 3.27fg 3.50g - - -
1999 2.79def 3.69g 3.69g 0.66abc 1.48de 1.64e
2000 1.39a 1.80abc 2.42cdef 0.11a 0.78b 1.39de
2001 2.34bcde 3.06efg 3.14efg - - -
2002 2.05abcd 2.58cdef 2.59cdef 0.25ab 0.12a 0.94cd
2003 1.51ab 1.97abcd 2.14abcd - - -
Mean2 2.25a 2.73b 2.78b 0.34a 0.79b 1.32c
LSD(year x lime)3 0.890 ns 0.604
LSD(lime)3 0.363 0.349
1 Column and row values having the same symbols are not statistically different at P = 0.05
2 Row values having the same symbols are not statistically different at P = 0.05
3 LSD = Least significant differences of means (5% level), ns = not significant
Oakleaf soil form: Grain yield responded significantly to lime application (Tables 2.4 and 2.6). All
lime treatments resulted in a highly significant (P<0.001) grain yield increase due to dolomite
additions. Initially the effect of the 10 tonne lime treatment proved non significant compared to the
5 tonnes lime ha-1 rate. However, in the second season a significantly (P<0.001) higher yield (0.61
tonnes ha-1) was observed in the 10 tonnes lime treatment (Table 2.6).
A statistically significant (P<0.05) decrease in grain yield for all treatments was observed over time
(Tables 2.4 and 2.6). The detrimental effect of soil acidity is clearly illustrated by the yield results
observed in the Oakleaf soil form trial. A strong relationship was furthermore obtained between
lime rate and absolute (P<0.05) and relative (P<0.05) grain yields (Table 2.7).
Table 2.7 Pearson’s coefficients of correlation (r) between different variants for the Hutton and
Oakleaf soil forms
Variables Hutton Oakleaf
r P r P
Absolute yield vs lime rate 0.417 ns 0.718 <0.05
Relative yield vs lime rate 0.529 <0.05 0.752 <0.05 ns = not significant
P = probability level

23
2.3.3 Absolute grain yield versus soil acidity properties
The values that will be discussed are pooled data per lime application level per experimental soils
(Table 2.8).
Hutton soil form: Statistically significant relationships between absolute grain yield and pH (H2O),
extractable acidity and Al, and acid saturation, were observed, explaining 44.5, 26.5, 32.2 and 38.8
of the variation in yield, respectively (Table 2.8).
Table 2.8 Non-linear regression analysis between absolute yield and soil acidity properties for
pooled data for the Hutton and Oakleaf soil forms
Variables Hutton Oakleaf
R2 (%) F Critical value R2 (%) F Critical value
Yield vs pH (H2O) 44.52 9.63** 5.19 73.47 19.38** -
Yield vs extractable acidity 26.53 5.42* 0.045 65.37 13.21** -
Yield vs extractable Al 32.17 6.64* 0.037 40.97 10.33** -
Yield vs acid saturation 38.76 8.86** 2.50 73.47 19.38** - *** P < 0.001, ** P < 0.01, and * P < 0.05
Table 2.8 shows a significant positive correlation (P<0.01) between absolute grain yield and soil pH
(H2O) indicating an increase in yield with an increase in soil pH (H2O). Furthermore, a statistically
significant negative correlation was observed in Table 2.8 against absolute grain yield and
extractable acidity (P<0.05) and Al (P<0.05), and acid saturation levels (P<0.01). This indicates
that absolute yields significantly decrease with an increase in extractable acidity and Al, and acid
saturation values (Table 2.8).
Maximum absolute grain yield was obtained between pH (H2O) of 5.90 and 6.00, extractable acidity
and extractable Al levels of zero. This indicates that further yield increase is unlikely to occur
above a pH (H2O) value of 6.00. Non-linear regression analysis was used to identify critical values
for soil acidity indices where a reduction in absolute grain yield could be expected (Table 2.8). At a
pH (H2O) lower than 5.19 and an extractable acidity, extractable Al and acid saturation higher than
0.045, 0.037 cmolc kg-1 and 2.50%, respectively, a significant decrease in absolute yield occured
(Table 2.8).
Oakleaf soil form: Fairly strong relationships between absolute grain yield and pH (H2O),
extractable acidity, extractable Al and acid saturation, were observed, explaining 73.5, 65.4, 40.9
and 73.5% of the variation in yield, respectively (Table 2.8). A highly significant positive
relationship (P<0.01) is indicated between soil pH (H2O) and absolute grain yield. However, the

24
latter is highly significantly negatively correlated (P<0.01) with extractable acidity, extractable Al
and acid saturation levels (Table 2.8).
Critical values for soil acidity indices could not be determined in the Oakleaf soil because soil
acidity had not been successfully alleviated and therefore no plateau could be establish.
2.3.4 Relative grain yield versus soil acidity properties
The values discussed are once again pooled data per lime application level for both experimental
soils. The reason behind pooling the data was to obtain a generalize data point taking into account
seasonal and geographical variations. The relationships established between relative grain yield
and soil acidity properties are shown in Table 2.9 and Figure 2.1.
Table 2.9 Non-linear regression analysis between relative yield and soil acidity properties for
pooled data for the Hutton and Oakleaf soil forms
Variables R2 (%) F Critical value
Rel. yield vs pH (H2O) 72.4 106.53*** 5.491
Rel. yield vs extractable acidity 73.1 116.24*** 0.277
Rel. yield vs extractable Al 72.0 118.52*** 0.145
Rel. yield vs acid saturation 71.8 103.21*** 13.003 *** P < 0.001, ** P < 0.01, and * P < 0.05
Compared to absolute grain yield, a marked improvement in the relationship between relative grain
yield and soil pH (H2O), extractable acidity, extractable Al and acid saturation were found (Table
2.9). Maximum relative yield was obtained at a soil pH (H2O) of 6.25, an extractable acidity and Al
of 0 cmolc kg-1, and an acid saturation of 0% (Figure 2.1). The optimum values for extractable
acidity and Al, and acid saturation were similar to those for absolute grain yield, but the optimal soil
pH (H2O) was higher than that found for absolute yield.
Critical values where a decrease in relative grain yield could be expected were established at pH
(H2O) values lower than 5.49 and extractable acidity and Al, and acid saturation values higher than
0.277, 0.145 cmolc kg-1 and 13%, respectively (Table 2.9). These are critical thresholds where
growth stress may be expected to occur in the Mlondozi district.

25
>5.49: y = 24.77x - 53.52, R2 = 0.48
<5.49: y = 58.98x - 238.26,R2 = 0.56
0
20
40
60
80
100
120
4.0 4.5 5.0 5.5 6.0 6.5 7.0pH (H2O)
Rel
ativ
e yi
eld
(%
)
>0.145: y = -29.79x + 30.98, R2 = 0.55
<0.145: y = -2.27x + 86.35, R2 = 0.10
0
20
40
60
80
100
0.0 0.5 1.0 1.5 2.0 2.5
Extractable Al (cmolc kg-1)
Rel
ativ
e yi
eld
(%)
<0.277: y = 1.84x + 96.79, R2 = 0.11
>0.277: y = -42.14x + 35.82, R2 = 0.67
0
20
40
60
80
100
0.00 0.50 1.00 1.50 2.00 2.50
Extractable acidity (cmolc kg-1)
Rel
ativ
e yi
eld
(%
)
>13.00: y = -36.58x + 172.84, R2 = 0.48
<13.00: y = -1.995x + 100.47, R2 = 0.62
0
20
40
60
80
100
0 10 20 30 40 50 60 70 80 90Acid saturation (%)
Rel
ativ
e yi
eld
(%
)
Figure 2.1 The relationships between relative grain yields and (a) soil pH (H2O), (b) extractable Al,
(c) extractable acidity and (d) acid saturation in all treatments of both experimental
soils.
2.4 Conclusions
Temporal changes in soil acidity properties and maize grain yield were evaluated to quantify the
longevity of lime application. The recommended level of 5 tonnes lime ha-1 increased soil pH
(H2O) to above 5.5 within one year of application in the Hutton soil. The longevity of liming (5
and 10 tonnes ha-1) on surface soil pH (H2O), relative to unlimed soil, extended for at least the 6
years that the trials were running. However, neither of the two lime application levels was
sufficient to neutralize soil acidity in the Oakleaf soil. Within the first season after lime application,
most of extractable acidity was neutralized even though the soil pH (H2O) showed a lag period of
2 - 3 years before increasing. The Oakleaf soil showed the greatest resistance to change and
larger amounts of lime need to be applied to bring about a given change in soil acidity properties
in this soil compared to the Hutton soil. Measurements showed that the buffer capacity of the
Oakleaf is much higher than that of the Hutton soil.
(a) (b)
(c) (d)
26
Furthermore, the residual benefit of liming on maize grain yield and the critical soil acidity indices
at which a reduction in yield could be expected, were evaluated. Statistically significant
increases in yield were found, following lime applications, in both experimental soils. Maximum
absolute grain yield was obtained at a pH (H2O) of between 5.90 and 6.00, extractable acidity
and Al of 0 cmolc kg-1 soil and 0% acid saturation in the Hutton soil form. It is, therefore,
suggested that yield increases are unlikely to occur above a pH (H2O) value of 6.00. Critical
thresholds in absolute yield for pH (H2O), extractable acidity (Al + H) and Al, and acid saturation
of 5.19, 0.045, 0.037 cmolc kg-1 and 2.50%, respectively, were recorded for absolute grain yield.
Critical values for soil acidity indices could not be determined in the Oakleaf soil form because
soil acidity had not been successfully alleviated. The critical thresholds when a reduction in
relative yield was recorded were 5.49, 0.277, 0.145 cmolc kg soil-1, 13% for pH (H2O), extractable
acidity (Al + H), Al and acid saturation, respectively. Monitoring extractable acidity annually, or
every other year, in conjunction with soil pH is essential to assist in the management of on-farm
soil acidity.

27
THE EFFECT OF LIMING ON SOIL BUFFER CAPACITY, ACIDIFICATION RATES AND MAINTENANCE LIMING
3.1 INTRODUCTION
Although soil acidification is a natural process, modern agricultural practices have accelerated
acidification of soils relative to natural ecosystem processes in many parts of the world (Singh et
al., 2003). Soil acidification is the result of proton production that occurs because of various
natural biological and chemical processes in the soil. Most of these natural processes are
buffered around pH 5.5 (H2O) except under more severe leaching conditions, especially in more
sandy soils. Apart from the natural processes, soil acidification is enhanced by losses of bases
either by crop removal or leaching in the absence of an active root system, and the application of
ammonical fertilizers (Singh et al., 2003; Doerge & Gardner, 1985; Hart, 2002; Gasser, 1973).
Regular liming is therefore required to balance the acidifying effect of these processes, and to
ensure the efficient utilization of fertilizers by crops (Bolton, 1977). The effect of lime in raising
soil pH extends beyond the first year after application, but predicted rates at which limed soils
reacidify are often not known. The rate of these acidifying processes is slow under natural
conditions, but generally accelerates under agricultural practices (Helyar & Porter, 1989). The
rate at which any given production system acidifies is a function of the soil’s buffer capacity,
climate, and farming practice (Sumner & Noble, 2003). Magdoff et al. (1987) showed that the
dominant soil properties contributing to a soil’s pH buffering include the amount of organic matter
and the quantity and type of clay minerals present. The buffer capacity of a soil may change
over time due to a reduction in organic matter. This can lead to under or over predictions of
proton production, especially in situations where the levels of organic matter changed
dramatically over the study period.
The Australian Agriculture Assessment (2001) has shown that the soil acidification rates in
Australia vary from an alkalizing farming system under tobacco production (-260 kg lime ha-1
year-1) to strongly acidifying farming systems such as banana production (+2000 kg lime ha-1
year-1), with an annual mean requirement of between 50 to 250 kg lime ha-1 year-1. In the former
case, net alkalinization is associated with approximately 70% of the nitrogen fertilizer being in the
nitrate form. In contrast, the extremely high acidification rates recorded in banana production
systems are a consequence of fertigation with high rates of ammonium-based fertilizers (average
application rate of 508 kg N ha-1 year-1), coupled with the removal of significant amounts of bases
3
28
in both harvested product and pruning following bunch removal (Sumner & Noble, 2003). Annual
soil acidification in South Africa may vary from less than 500 kg lime ha-1 year-1 to 1500 kg lime
ha-1 year-1 and more (FSSA, 2003). This shows that soil acidification rates can vary quite
dramatically between both soils and systems. It is therefore important that both the soil acidity
status and estimates of the rate of acid production of soils are known, to facilitate corrective
action by farmers.
Against this background the present study was undertaken in order to determine (i) the changes
in soil buffer capacity, (ii) acid production loads, (iii) acidification rates, and (iv) maintenance lime
requirements of two lime-amended soils in a resource-poor farming area.
3.2 MATERIALS AND METHODS 3.2.1 Experimental soils
The study was conducted on two acid soils in the Mlondozi district of Mpumalanga, South Africa.
Two trials that were recorded for six and five years were laid out on Hutton (Humic Ferralsols)
and Oakleaf (Rhodic Cambisols: FAO-ISS-ISRIC, 1998) soil forms, respectively (see Table 2.1
for chemical and physical analysis). A detail description of the experimental design was
discussed in section 2.2.1.
3.2.2 Soil sampling and analysis
Topsoil samples (0 - 250 mm) were taken annually in March. Eight soil samples were taken
within each plot between the rows and a composite sample was made up. The composite
samples were air-dried and ground to pass through a 2 mm sieve.
Soil pH (H2O) was determined in a 1:2.5 (soil:water) suspension using a combined calomel
reference glass electrode and pH meter (Reeuwijk, 2002). Extractable acidity, (Al + H), and Al
were determined in a 1 mol dm-3 KCl extractant. The ammonium acetate (1 mol dm-3, pH 7)
method was used to extract the cations Ca and Mg (Thomas, 1982). These cations were
determined on an atomic absorption flame spectrophotometer (The Non-Affilliated Soil Analysis
Work Committee, 1990). Acid saturation was determined as the ratio between extractable acidity
and the sum of extractable Ca, Mg, K, Na and extractable acidity, expressed as a percentage.
3.2.3 Soil buffer capacity (soil BC)
Potentiometric titrations (Ponizovskiy & Pampura, 1993) were performed on samples that were

29
equilibrated overnight with 1 M KCl. A 50 g soil sample was suspended in 100 ml 1 M KCl,
stirred and left overnight. The suspension was titrated with 0.05 M NaOH whilst being stirred on
a Metrohm potentiograph to a pH of 8.5. The titration rate was 0.667 ml min-1. For each soil a
linear regression function was fitted to the relationship between 0.05 M NaOH added and the soil.
Equation 3.1, adapted from Bache (1988), was used to calculate soil buffer capacity (soil BC).
Soil BC (cmolc kg-1 soil pH unit-1) = Δ(OH-)/ Δ pH [3.1]
where ΔpH is the change in pH (pH unit) due to the addition of OH- (cmolc kg soil-1) as NaOH.
The soil BC calculated in Equation 3.1 was converted to (kmol H+ (ha250 mm)-1 (pH unit)-1) using
an average soil bulk density of 1300 kg m-3 using Equation 3.2 as suggested by Singh et
al.(2003):
Soil BC [(kmol H+ (ha250 mm)-1 (pH unit)-1)] = (BC x V x BD)/100 000 [3.2]
where V is volume of soil layer (m3 ha-1) to a depth of 250 mm; BD is bulk density (kg m-3) and
100 000 to convert cmol (H+) to kmol (H+).
3.2.4 Acid production loads (APL) and acidification rates
Predicted acidification rates: The acid production load (kmol H+ (ha250mm)-1 (year)-1) was
calculated with Equation 3.3 as described by Helyar and Porter (1989):
APL = (∆pH/∆t) x soil BC [3.3]
where ∆pH/∆t is the rate of pH decline (pH unit year-1).
The decrease in soil pH in one year (pH year-1) was calculated with Equation 3.4 as reported by
Singh et al. (2003), using the APL and soil BC:
ΔpH units year-1 = APL/soil BC [3.4]
The number of years required for a soil to reach a critical pH value where production losses are
likely to occur was calculated as expressed by Hill (2003) in Equation 3.5:
Time (years) = [(pH(current)- pH(critical)) x (soil BC)]/APL [3.5]
where pH(current) is the current pH, pH(critical) is the critical pH.
30
Measured acidification rates: Equation 3.6 as described by Doerge and Gardner (1985), was
use to determine the measured annual change in soil pH. The use of pH (H2O) as an indicator to
predict acidification rates has been debated by many researchers (Walker, 1953; Bolton, 1977;
Doerge & Gardner, 1985) because of the annual fluctuations in soil pH (Hart, 2002). According
to Doerge and Gardner (1985) the sources and sinks of Ca2+ and Mg2+ are less complicated than
those of H+ and a high degree of correlation exists between soil hydrogen activity and basic
cation saturation. Therefore the pH acidification rate (∆pH unit year-1) of a soil can be calculated
if the relationship between pH and levels of extractable basic cations, and the measured annual
change in basic cations are available (Doerge & Gardner, 1985). The annual change in soil pH
was indirectly measured as the ratio between soil pH and levels of extractable basic cations,
multiplied by the annual change in basic cations.
(∆ pH/∆ [Ca + Mg]) x (∆ Ca + Mg year-1) = ∆ pH year-1 [3.6]
where ∆(Ca + Mg) is the change in soil (Ca + Mg) in molc kg-1 soil
3.2.5 Maintenance liming
Maintenance liming requirement was determined from the annual change in Ca2+ + Mg2+ (∆ Ca +
Mg year-1) for the top 250 mm soil (Equation 3.7). This was achieved using the assumption that
1 mol of CaCO3 neutralizes 2 mol of H+ in the soil.
([∆(Ca + Mg) year-1] x BD x V ha-1 x CaCO3)/100 000 = tonnes CaCO3 ha-1 year-1 [3.7]
where ∆(Ca + Mg) is the change in soil (Ca + Mg) in molc kg-1 soil; BD is the soil bulk density (kg
m-3); V the soil volume (m-3) in the top 250 mm and CaCO3 is 1 mol pure CaCO3 (100.09 g
CaCO3 mol-1).
3.2.6 Statistical analysis
The effect of liming on soil BC, APLs and acidification rates was evaluated statistically by
analysis of variance (ANOVA) (Genstat, 2003). The Bonferroni multiple comparison test for
means separation was used to test all main effects at the 5% probability level.
Pearson's correlations were calculated between measured pH changes and calculated
acidification risk according to Equation 3.5 using Genstat (2003). Measured pH change is the
rate of pH decline measured over 6 and 5 years (pH unit year-1) in the Hutton and Oakleaf soil

31
forms, respectively. The broken-stick analysis, a non-linear regression analysis, was used to
evaluate critical pH ranges where a change in soil BC could be expected.
3.3 RESULTS AND DISCUSSION
The values that will be discussed are replicate means per lime application level in order to
evaluate the main effect of lime application.
3.3.1 Effect of lime application on soil BC
Hutton soil form: Liming had a highly significantly (P<0.001) decreasing effect on soil BC
(Table 3.1 and 3.2).
Table 3.1 ANOVA table of probabilities of treatment effects on soil BC, acid production load,
acidification rate and extractable Ca and Mg for the Hutton and Oakleaf soil forms
Variable Hutton Oakleaf
F-ratio
Lime Year x Lime Lime Year x Lime
Soil BC (cmolc kg soil-1) 44.74*** 3.33** 2.82*** 1.10ns
Acid production load (kmol (H+) ha-1 year-1) 4.65ns - 4.33* -
Acidification rate (pH unit year-1) 5.90* - 9.66** -
Extractable Ca (cmolc kg soil-1) 129.41*** 0.191ns 60.81*** 0.099ns
Extractable Mg (cmolc kg soil-1) 130.63*** 0.113ns 48.63*** 3.74***
*** P < 0.001, ** P < 0.01, * P < 0.05 and ns = not significant
A reduction in mean soil BC values of 0.232 and 0.263 cmolc kg soil-1 pH unit-1 in the 5 and 10
tonnes lime ha-1 treatments, respectively, compared to the unlimed plots was recorded over the
6-year period (Table 3.2). Furthermore, a highly significant (P<0.001) interaction between lime
application and time on soil BC was found in the Hutton soil (Table 3.1). Table 3.2 shows that
soil BC was significantly (P<0.001) reduced within the first year of lime application, although no
significant difference was found in soil BC between the 5 and 10 tonnes lime ha-1 treatments. A
significant reduction (P<0.001) of 0.045, 0.343 and 0.435 cmolc kg soil-1 pH unit-1 in the 0, 5 and
10 tonnes lime ha-1 treatments, respectively, over the 6 years of the trial period was recorded in
the Hutton soil.
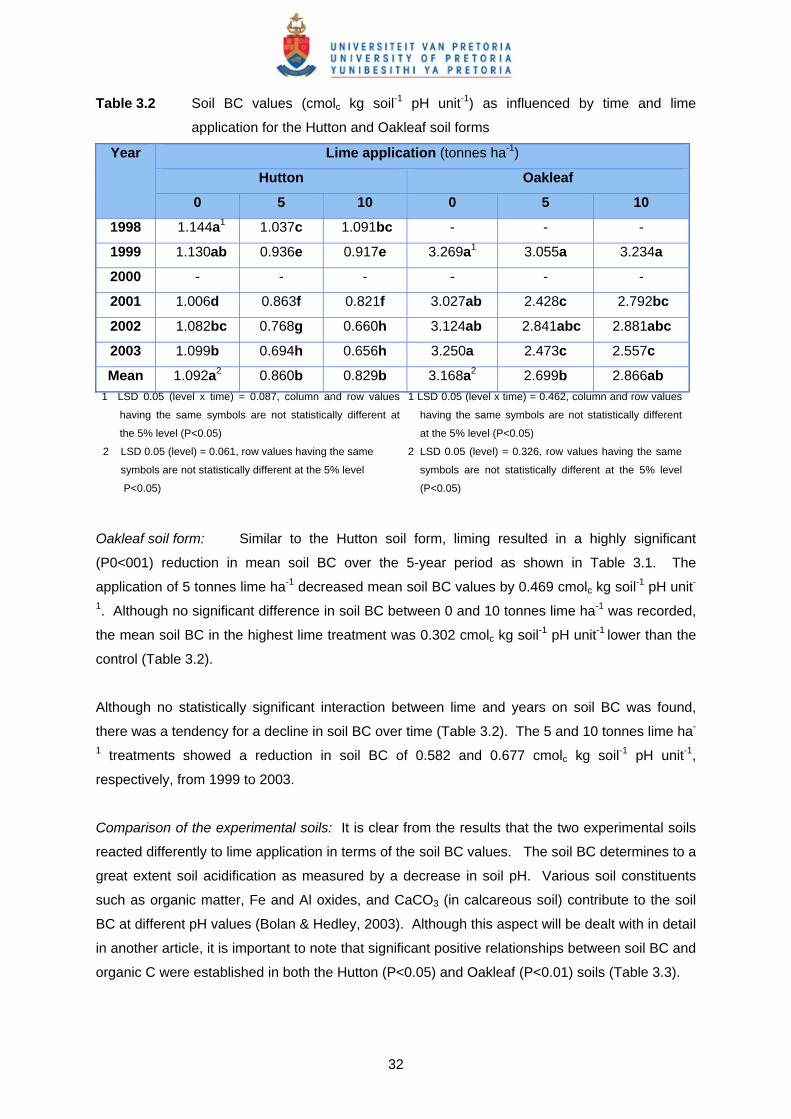
32
Table 3.2 Soil BC values (cmolc kg soil-1 pH unit-1) as influenced by time and lime
application for the Hutton and Oakleaf soil forms
Year Lime application (tonnes ha-1)
Hutton Oakleaf
0 5 10 0 5 10
1998 1.144a1 1.037c 1.091bc - - -
1999 1.130ab 0.936e 0.917e 3.269a1 3.055a 3.234a
2000 - - - - - -
2001 1.006d 0.863f 0.821f 3.027ab 2.428c 2.792bc
2002 1.082bc 0.768g 0.660h 3.124ab 2.841abc 2.881abc
2003 1.099b 0.694h 0.656h 3.250a 2.473c 2.557c
Mean 1.092a2 0.860b 0.829b 3.168a2 2.699b 2.866ab
1 LSD 0.05 (level x time) = 0.087, column and row values
having the same symbols are not statistically different at
the 5% level (P<0.05) 2 LSD 0.05 (level) = 0.061, row values having the same
symbols are not statistically different at the 5% level
P<0.05)
1 LSD 0.05 (level x time) = 0.462, column and row values
having the same symbols are not statistically different
at the 5% level (P<0.05) 2 LSD 0.05 (level) = 0.326, row values having the same
symbols are not statistically different at the 5% level
(P<0.05)
Oakleaf soil form: Similar to the Hutton soil form, liming resulted in a highly significant
(P0<001) reduction in mean soil BC over the 5-year period as shown in Table 3.1. The
application of 5 tonnes lime ha-1 decreased mean soil BC values by 0.469 cmolc kg soil-1 pH unit-
1. Although no significant difference in soil BC between 0 and 10 tonnes lime ha-1 was recorded,
the mean soil BC in the highest lime treatment was 0.302 cmolc kg soil-1 pH unit-1 lower than the
control (Table 3.2).
Although no statistically significant interaction between lime and years on soil BC was found,
there was a tendency for a decline in soil BC over time (Table 3.2). The 5 and 10 tonnes lime ha-
1 treatments showed a reduction in soil BC of 0.582 and 0.677 cmolc kg soil-1 pH unit-1,
respectively, from 1999 to 2003.
Comparison of the experimental soils: It is clear from the results that the two experimental soils
reacted differently to lime application in terms of the soil BC values. The soil BC determines to a
great extent soil acidification as measured by a decrease in soil pH. Various soil constituents
such as organic matter, Fe and Al oxides, and CaCO3 (in calcareous soil) contribute to the soil
BC at different pH values (Bolan & Hedley, 2003). Although this aspect will be dealt with in detail
in another article, it is important to note that significant positive relationships between soil BC and
organic C were established in both the Hutton (P<0.05) and Oakleaf (P<0.01) soils (Table 3.3).

33
Table 3.3 Pearson’s coefficient of correlation (r) between soil BC, organic C and extractable
acidity for the Hutton and Oakleaf soil forms
Variables Hutton Oakleaf
r P Number of observations
r P Number of observations
Soil BC vs organic C +0.464 <0.05 28 +0.666 <0.01 22
Soil BC vs extractable acidity +0.564 <0.01 28 -0.209 ns 22
Soil BC vs extractable Al +0.571 <0.01 28 -0.214 ns 22
Soil BC vs APL -0.520 ns 6 -0.825 <0.01 6
ns = not significant
Table 3.3 furthermore, shows that a strong positive relationship exists between soil BC and
extractable acidity (P<0.01) and Al (P<0.01) in the Hutton soil, while no relationships between
these parameters could be established for the Oakleaf soil. It is postulated that the significant
reduction in soil BC in the Hutton soil over time and with liming (Tables 3.2 and 3.3) is mostly the
result of a reduction in extractable acidity and Al due to lime application.
3.3.2 Acid production loads Hutton soil form: In calculating APLs using Equation 3.3, no statistically significant effect of
lime on APL was recorded (Tables 3.1 and 3.4). However, the net APL for the 5 and 10 tonnes
lime ha-1 treatments was respectively 0.83 and 0.76 kmol (H+) ha-1 year-1 higher than the 0
tonnes lime ha-1 application.
Table 3.4 Acid production loads and acidification rates for the topsoil (0-250 mm) over a six
and five year period, respectively in the Hutton and Oakleaf soil forms as a
function of liming
Lime rate (tonnes ha-1)
Initial pH (H2O) Acid production load (kmol (H+) ha-1 year-1)
Acidification rate (pH (H2O) units year-1)
Hutton Oakleaf Hutton Oakleaf Hutton Oakleaf
0 5.33 4.54 1.61a1 4.59a -0.046a1 -0.044a
5 6.31 4.86 2.44a 8.04ab -0.116b -0.078a
10 6.47 5.15 2.37a 8.82b -0.140c -0.110b
LSD(0.05) - - 0.87ns 3.48* 0.020* 0.035*
1 Column values having the same symbols are not statistically different at P<0.05* 2 ns = not significant
Oakleaf soil form: A statistically significant (P<0.05) increase in APL with lime application

34
was recorded (Table 3.1), with increased acid production values of 3.45 and 4.23 kmol (H+) ha-1
year-1 between the unlimed and the 5 and 10 tonnes lime ha-1 treatments, respectively (Table
3.4).
Comparison between experimental soils: The APLs for all treatments in the Hutton and the
Oakleaf soils control were lower than the net rates of 3 to 5 kmol (H+) ha-1 year-1 reported by
Helyar et al. (1990). However, the APLs recorded in the 5 and 10 tonnes lime ha-1 treatments in
the Oakleaf soil, were much higher although the crop production system was similar to that of the
Hutton soil.
3.3.3 Soil BC vs soil acidification rate
Hutton soil form: The soil BC is needed as a measure of soil acidification rates as calculated
from Equation 3.4. Although the soil BC for a given soil is not constant over the whole pH range
(Bache, 1988), numerous studies used a constant value for soil BC in estimating acidification
rates (Singh et al., 2003; Noble et al., 2002; Hill, 2003; Helyar et al., 1990). Non-linear
regression analysis was used to identify critical pH values where a change in soil BC could be
expected. Figure 3.1 (a, c & e) shows that minimum buffering (maximum slope of pH versus
added OH-) occurs between 5.51 to 7.44, 5.54 to 7.47 and 5.51 to 7.54 in the 0, 5 and 10 tonnes
lime ha-1 treatments, respectively.
In order to evaluate the potential of soil BC in estimating soil acidification rates, the rate of
predicted soil acidification (Equation 3.4), using soil BC at different pH ranges (<5.55, 5.55-
7.50,>7.50 and 4.20-8.50), was correlated with measured soil acidification rate as indicated in
Figure 3.2 (a). The measured acidification rate (pH units year-1) was calculated from the
measured annual change in basic cations, and the relationship between pH and extractable
basic cations as described in Equation 3.6.
All four calculated acidification rates correlated highly significantly (P<0.001) with measured soil
acidification rates (Figure 3.2 (a)). The ability of the four soil BCs to predict soil acidification rates
is arranged as follows according to correlation with measured acidification rates: BC(<5.55)>BC(4.2-
8.5)=BC(>7.50)>BC(5.55-7.50). The soil acidification rate determined with the soil BC(4.2-8.5) crossed the
1:1 line at 0.03 pH units year-1. Below this value the soil BC(4.2-8.5) slightly overestimated
acidification rates and above 0.03 acidification rates were slightly underestimated. The soil
BC(4.2-8.5) gave a regression line nearly parallel to the 1:1 line, and is therefore the most
appropriate of all the soil BCs for direct prediction of soil acidification rates.

35
Figure 3.1 Titration curves for the critical pH ranges for (a) 0 (b) 5 and (c) 10 tonnes lime ha-
1 treatments in the Hutton and for (d) 0 (e) 5 and (f) 10 tonnes lime ha-1
treatments in the Oakleaf soil forms, respectively (*** P < 0.001, ** P < 0.01 and *
P < 0.05).
<5.51: y = 0.945x + 4.344, r = 0.994***
5.51 - 7.44: y = 1.280x + 3.968, r = 0.998***
>7.44: y = 0.679x + 5.602, r = 0.986***3.54.04.55.05.56.06.57.07.58.08.5
0 1 2 3 4 5
cmol (OH-) kg soil-1
pH o
f soi
l-KC
l sus
pens
ion
>7.47: y = 0.8437x + 6.604, r = 0.984***
5.54 - 7.47: y = 2.2003x + 5.205, r = 0.997***
<5.54: y = 2.1759x + 5.140, r = 0.987***
3.54.04.55.05.56.06.57.07.58.08.5
0 1 2 3 4 5
cmol (OH-) kg soil-1
pH o
f soi
l-KC
l sus
pens
ion
5.51 - 7.54: y = 3.1008x + 5.5615, r = 0.994***
>7.54: y = 1.0555x + 6.8699, r = 0.992***3.54.0
4.55.0
5.56.0
6.57.0
7.58.0
8.5
0 1 2 3 4 5
cmol (OH-) kg soil-1
pH o
f soi
l-KC
l sus
pens
ion
<4.85: y = 0.266x + 4.05, r = 0.995***
4.85 - 7.21: y = 0.45x + 3.49, r = 0.996***
>7.21: y = 0.214x + 5.448, r = 0.996***3.54.04.55.05.56.06.57.07.58.08.5
0 5 10 15
cmol (OH-) kg soil-1
pH o
f soi
l-KC
l sus
pens
ion
<4.89: y = 0.033x + 4.162, r = 0.999***
4.89 - 7.19: y = 0.062x + 3.516, r = 0.997***
>7.19: y = 0.028x + 5.544, r = 0.988***3.54.0
4.55.0
5.56.06.5
7.07.5
8.08.5
0 5 10 15
cmol (OH-) kg soil-1
pH o
f soi
l-KC
l sus
pens
ion
<4.96: y = 0.042x + 4.278, r = 0.993***
4.96 - 7.16: y = 0.065x + 3.893, r = 0.999***
>7.16: y = 0.027x + 5.8208, r = 0.989***3.54.0
4.55.05.56.0
6.57.07.5
8.08.5
0 5 10 15
cmol (OH-) kg soil-1
pH o
f soi
l-KC
l sus
pens
ion
(a) (d)
(b) (e)
(c) (f)

36
The BC(<5.55) crossed the 1:1 line at an acidification rate of 0.07 pH unit year-1. Above this
value, soil acidification rates were overestimated. The BC(>7.5) consistently underestimated
soil acidification rate and BC(5.55-7.50) overestimated soil acidification rate (Figure 3.2 (a)).
Oakleaf soil form: The Oakleaf soil revealed good buffering to base (OH-) addition (Figure
3.1 (d, e & f). The Oakleaf soil was moderately buffered in the mid-range (≈ 4.90 to 7.19)
with increased buffering below 4.85 to 4.96, and above 7.21 to 7.16. The ability of the
different soil BCs to predict soil acidification rates is as follows: BC(4.2-8.5) >BC(5.55-
7.5)=BC(>7.5)>BC(<5.55). The soil acidification rates determined with soil BC(4.2-8.5) crossed the
1:1 line at a measured soil acidification rate of 0.12 pH unit year-1. Above ,this rate soil
acidification rates were overestimated and below this value an under-prediction of soil
acidification occurred. The BC(4.2-8.5) set of values gave a regression line in closest
agreement to the 1:1 line. The other soil BC ranges gave either a consistent over- or under-
prediction of measured soil acidification rates (Figure 3.2 (b)).
Comparison between soil forms: Figure 3.3 (a, b) shows that linear regression analysis of
the titration curves over pH range 4.2 to 8.5 shows a strong relationship (P<0.001) between
the amount of OH- added and pH in all lime treatments, while r values ranged from 0.983 to
0.996 for the Hutton and 0.993 to 0.996 for the Oakleaf soil form (Figure 3.3 (a, b)).
Even the 0 lime ha-1 treatment in the Oakleaf soil with the lowest pH of 4 gave a strong fit to
the linear equation with an r2 of 0.991. Furthermore, it has been shown that the soil BC(4.2-8.5)
appropriately predicts measured soil acidification rates in both soils. Therefore, the soil BC
over the pH range 4.2 to 8.5 was used to estimate soil acidification rates in this study.

37
BC(5.5-7.5): y = 1.5138x - 0.0063, R2 = 0.72, r = 0.85***
BC(<5.5): y = 1.4845x - 0.0327, R2 = 0.82, r = 0.91***
BC(>7.5): y = 0.5335x + 0.004, R2 = 0.79, r = 0.89***
BC(4.2-8.5): y = 0.924x + 0.0019, R2 = 0.79, r = 0.89***
BC(1:1): y = x, R2 = 1
0.00
0.05
0.10
0.15
0.20
0.25
0.30
0.35
0.40
0.45
0.50
0.00 0.05 0.10 0.15 0.20 0.25
Measured acidification rate (pH unit yr-1)
Pred
icte
d ac
idifi
catio
n ra
te
(pH
yr
-1)
<5.5 5.5-7.5 >7.5 4.2-8.5
B(5.5-7.5): y = 1.6626x - 0.0191, R2 = 0.89, r = 0.94***
BC(>7.5): y = 0.6992x - 0.0038, R2 = 0.88, r = 0.94***BC(4.2-8.5): y = 1.1042x - 0.0120, R2 = 0.93, r = 0.96***
BC(<5.5): y = 1.1406x - 0.0233, R2 = 0.86, r = 0.93***
BC(1:1): y = x, R2 = 1
0.000.020.040.060.080.100.120.140.160.180.200.220.240.26
0.00 0.05 0.10 0.15 0.20
Measured acidification rate (pH unit yr-1)
Pred
icte
d ac
idifi
catio
n ra
te (
pH
yr
-1)
<5.5 5.5-7.5 >7.5 4.2-8.5
Figure 3.2 Relationship between measured and predicted acidification rates for the (a)
Hutton and (b) Oakleaf soil forms (*** P < 0.001, ** P < 0.01).
(a)
(b)

38
0: y = 0.3733x + 3.9200, r = 0.994***
5: y = 0.5215x + 4.0457, r = 0.996***
10: y = 0.5317x + 4.2427, r = 0.993***3.54.04.55.05.56.06.57.07.58.08.5
0 5 10 15
cmol (OH-) kg soil-1
pH o
f soi
l-KC
l sus
pens
ion
0 5 10
0: y = 1.1483x + 4.2382, r = 0.996***
5: y = 2.1057x + 5.1981, r = 0.989***
10: y = 2.7784x + 5.622, r = 0.983***3.5
4.0
4.5
5.0
5.5
6.0
6.5
7.0
7.5
8.0
8.5
0 1 2 3 4 5
cmol (OH-) kg soil-1
pH o
f soi
l-KC
l sus
pens
ion
0 5 10
Figure 3.3 Combined titration curves for the 0, 5 and 10 tonnes lime ha-1 treatments in
the (a) Hutton and (b) Oakleaf soils.
3.3.4 Effect of lime application on soil acidification rate
Hutton soil form: Soil acidification rates showed significant acceleration with lime application
(Table 3.1). Lime addition significantly (P<0.01) increased the acidification rate from -0.046 to -
0.116 and -0.140 pH units year-1 starting at initial pH (H2O) values of 5.33, 6.31 and 6.47,
respectively. Table 3.4 shows that liming resulted in a significant decrease in soil BC,
consequently leading to accelerated acidification rates. Statistically significant differences in
acidification rates were furthermore observed between the 5 and 10 tonnes lime ha-1 treatments.
A significant (P<0.05) correlation existed between acidification rate and initial soil pH (H2O)
(Figure 3.4 (a)).
Figure 3.4 (a) shows that at an initial pH (H2O) of 4.40, an acidification rate of 0 is predicted, and
at a pH (H2O) of between 5.5 and 6.0 an acidification rate of between -0.10 and -0.13 pH unit
year-1 is predicted.
(a) (b)

39
AR = -0.0657pH + 0.2655, r = 0.73**
-0.30
-0.20
-0.10
0.00
0.10
3.5 4.0 4.5 5.0 5.5 6.0 6.5 7.0
Initial pH (H2O)
Aci
dific
atio
n ra
te (
pH u
nit y
r -1
)
AR = -0.1002pH + 0.396, r = 0.85***
-0.30
-0.20
-0.10
0.00
0.10
0.20
0.30
3.5 4.0 4.5 5.0 5.5 6.0 6.5 7.0
Initial pH (H2O)
Aci
dific
atio
n ra
te
(pH
uni
t yr
-1)
Figure 3.4 Relationship between initial pH (H2O) and acidification rate (pH unit year-1) in the
(a) Hutton and (b) Oakleaf soil forms (*** P < 0.001, ** P < 0.01 and * P < 0.05).
Oakleaf soil form: Liming had a highly statistically significant (P<0.01) effect on acidification
rate (Tables 3.1 and 3.4), with accelerated acidification rates with lime application recorded.
Table 3.4 shows that acidification rate indicated a 0.044, 0.078 and 0.110 reduction in pH
annually starting at an initial pH (H2O) of 4.54, 4.86 and 5.15 in the 0, 5 and 10 lime ha-1
treatments, respectively.
Figure 3.4 (b) shows the acidification rate plotted against initial soil pH (H2O). A significant
(P<0.001) regression relationship exists between acidification rate and initial soil pH (H2O), with
an acceleration in acidification with higher initial soil pH (H2O) values. From this relationship it is
shown that at a pH (H2O) of 3.95 an acidification rate of zero could be expected and at pH (H2O)
(a)
(b)
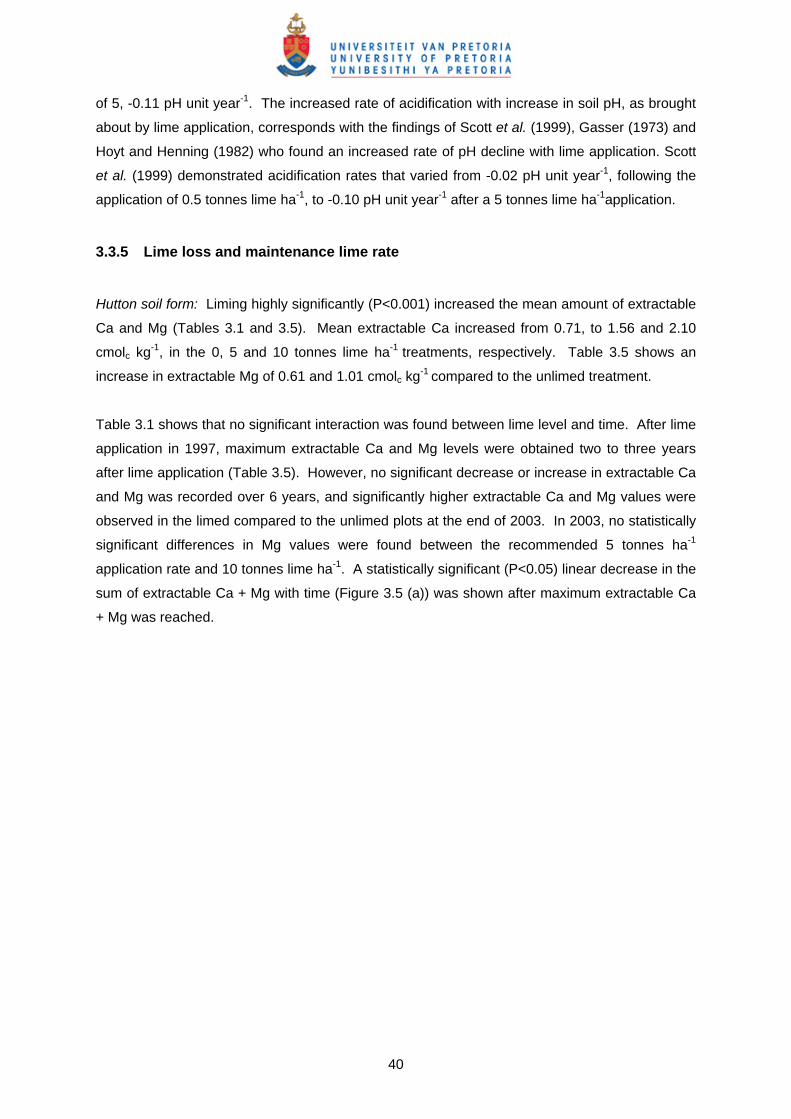
40
of 5, -0.11 pH unit year-1. The increased rate of acidification with increase in soil pH, as brought
about by lime application, corresponds with the findings of Scott et al. (1999), Gasser (1973) and
Hoyt and Henning (1982) who found an increased rate of pH decline with lime application. Scott
et al. (1999) demonstrated acidification rates that varied from -0.02 pH unit year-1, following the
application of 0.5 tonnes lime ha-1, to -0.10 pH unit year-1 after a 5 tonnes lime ha-1application.
3.3.5 Lime loss and maintenance lime rate
Hutton soil form: Liming highly significantly (P<0.001) increased the mean amount of extractable
Ca and Mg (Tables 3.1 and 3.5). Mean extractable Ca increased from 0.71, to 1.56 and 2.10
cmolc kg-1, in the 0, 5 and 10 tonnes lime ha-1 treatments, respectively. Table 3.5 shows an
increase in extractable Mg of 0.61 and 1.01 cmolc kg-1 compared to the unlimed treatment.
Table 3.1 shows that no significant interaction was found between lime level and time. After lime
application in 1997, maximum extractable Ca and Mg levels were obtained two to three years
after lime application (Table 3.5). However, no significant decrease or increase in extractable Ca
and Mg was recorded over 6 years, and significantly higher extractable Ca and Mg values were
observed in the limed compared to the unlimed plots at the end of 2003. In 2003, no statistically
significant differences in Mg values were found between the recommended 5 tonnes ha-1
application rate and 10 tonnes lime ha-1. A statistically significant (P<0.05) linear decrease in the
sum of extractable Ca + Mg with time (Figure 3.5 (a)) was shown after maximum extractable Ca
+ Mg was reached.

41
Table 3.5 Extractable Ca and Mg values (cmolc kg soil-1) as influenced by time and lime application for the Hutton and Oakleaf soil forms
Year Lime application (tonnes ha-1)
Hutton Oakleaf
Ca Mg Ca Mg
0 5 10 0 5 10 0 5 10 0 5 10
1998 0.70a 1.40b 1.67bc 0.56a 1.03b 1.32cd
1999 0.76a 1.76bc 2.07de 0.59a 1.38cd 1.60d 0.23a 0.98de 1.83f 0.10a 0.58b 1.13c
2000 0.87a 1.49b 2.54f 0.62a 1.10bc 1.90e 0.34a 0.89cde 1.23de 0.14a 0.74b 0.60b
2001 0.66a 1.57b 2.35ef 0.53a 1.25b 1.80de 0.38a 0.84b 1.29e 0.26a 0.58b 0.84b
2002 0.63a 1.56bc 1.98cde 0.44a 1.05b 1.38cd 0.20a 0.45ab 1.22de 0.22a 0.22a 0.64b
2003 0.66a 1.60b 1.97cde 0.44a 1.05b 1.26b 0.46a 0.50ab 1.18de 0.20a 0.25a 0.59b
Mean2 0.71a 1.56b 2.10c 0.53a 1.14b 1.54c 0.32a 0.73b 1.35c 0.18a 0.47b 0.77c 1 LSD 0.05 (level x time) = 0.42 (Ca) and 0.28 (Mg); column and row values having the same symbols
are not statistically different (P<0.05). 2 LSD 0.05 (level) = 0.17 (Ca) and 0.13 (Mg); row values having the same symbols are not statistically
different (P<0.05)
1 LSD 0.05 (level x time) = 0.42 (Ca) and 0.26 (Mg); column and row values having the
same symbols are not statistically different (P<0.05)
2 LSD 0.05 (level) = 0.19 (Ca) and 0.12 (Mg); row values having the same symbols are
not statistically different (P<0.05)
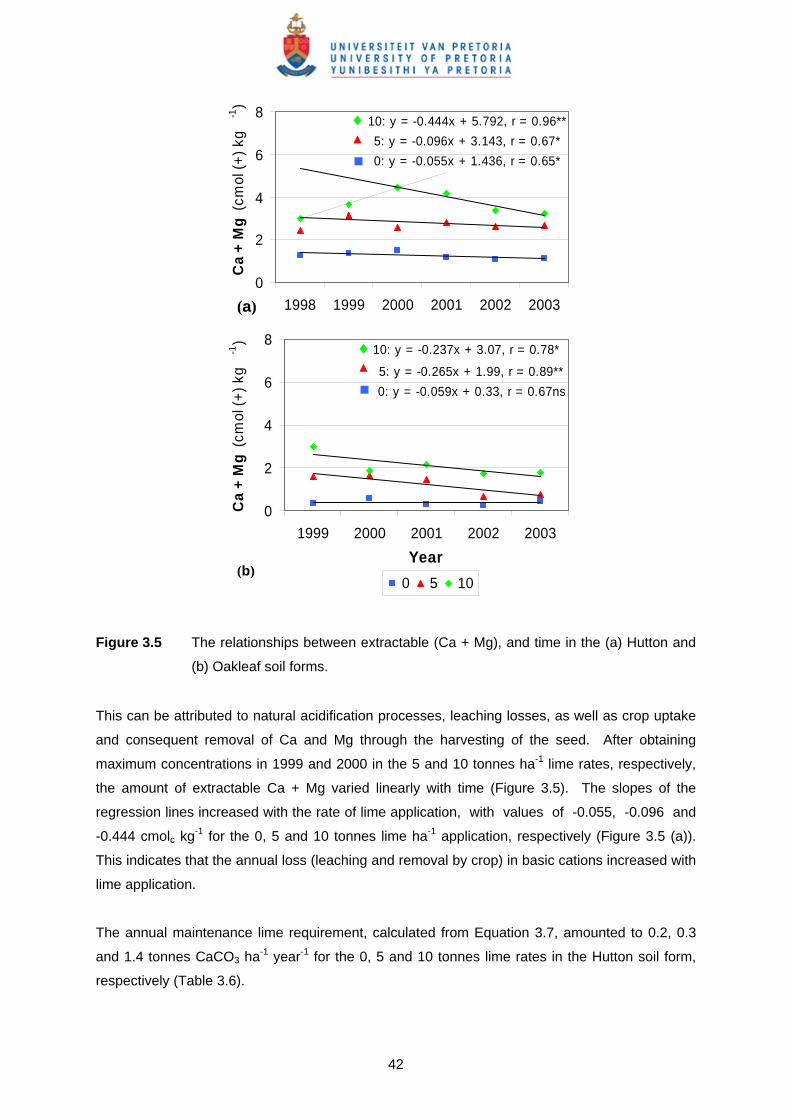
42
10: y = -0.444x + 5.792, r = 0.96**
5: y = -0.096x + 3.143, r = 0.67*
0: y = -0.055x + 1.436, r = 0.65*
0
2
4
6
8
1998 1999 2000 2001 2002 2003
Ca
+ M
g (
cmol
(+
) kg
-1
)
10: y = -0.237x + 3.07, r = 0.78*
5: y = -0.265x + 1.99, r = 0.89**
0: y = -0.059x + 0.33, r = 0.67ns
0
2
4
6
8
1999 2000 2001 2002 2003
Year
Ca
+ M
g (
cmol
(+
) kg
-1
)
0 5 10
Figure 3.5 The relationships between extractable (Ca + Mg), and time in the (a) Hutton and
(b) Oakleaf soil forms.
This can be attributed to natural acidification processes, leaching losses, as well as crop uptake
and consequent removal of Ca and Mg through the harvesting of the seed. After obtaining
maximum concentrations in 1999 and 2000 in the 5 and 10 tonnes ha-1 lime rates, respectively,
the amount of extractable Ca + Mg varied linearly with time (Figure 3.5). The slopes of the
regression lines increased with the rate of lime application, with values of -0.055, -0.096 and
-0.444 cmolc kg-1 for the 0, 5 and 10 tonnes lime ha-1 application, respectively (Figure 3.5 (a)).
This indicates that the annual loss (leaching and removal by crop) in basic cations increased with
lime application.
The annual maintenance lime requirement, calculated from Equation 3.7, amounted to 0.2, 0.3
and 1.4 tonnes CaCO3 ha-1 year-1 for the 0, 5 and 10 tonnes lime rates in the Hutton soil form,
respectively (Table 3.6).
(b)
(a)
43
Table 3.6 Maintenance lime requirement rates in the topsoil (0-250 mm) of the Hutton and
Oakleaf experimental soils as a function of liming
Lime rate (tonnes lime ha-1)
Maintenance lime requirement (tonnes CaCO3 ha-1 year-1)
Hutton Oakleaf
0 0.2 0
5 0.3 0.8
10 1.4 0.8
The fairly rapid loss of lime from the 10 tonnes lime ha-1 treatment was probably not only caused
by cultivation and increased mineralization rates of organic matter, but also by the high lime
application level. It can be postulated that free lime was present in the soil for the 10 tonnes ha-1
lime treatment and was leached, although this phenomenon was not determined. Gasser (1973)
postulated that the loss of lime doubles for each increase of one pH unit. Hoyt and Henning
(1982) speculated that if the soils they were studying would have been limed to pH 5.7 instead of
6.7, the loss of lime might have been one-half of that found in the experiment (0.49 tonnes
CaCO3 ha-1 year-1).
Oakleaf soil form: Liming significantly (P<0.05) increased the mean extractable Ca by 0.41 and
1.03 cmolc kg-1, and the Mg by 0.29 and 0.59 cmolc kg-1 in the 5 and 10 tonnes lime ha-1
treatments, respectively (Table 3.5). Although no significant interaction between lime level and
time was recorded for extractable Ca, a highly significant interaction was found for extractable
Mg (Table 3.1). The extractable Ca and Mg in the unlimed plot remained relatively unchanged
over 5 years, while a decreasing trend in extractable Ca was recorded in the limed treatments. A
highly significant (P<0.001) decrease in extractable Mg was found within 4 and 2 seasons in the
5 and 10 tonnes lime ha-1 plots, respectively (Table 3.5). Factors (e.g. leaching due to rainfall,
yield removal) responsible for reacidification caused a decrease in the extractable Ca and Mg in
the 5 tonnes lime ha-1 rate to such an extent that no significant difference could be found
compared to the control after four years.
Figure 3.5 (b) shows that extractable Ca and Mg varied linearly with time with statistically
significant (P<0.05 and P<0.01) decreases in extractable Ca and Mg over the trial period in the 5
and 10 tonnes lime ha-1 treatments, respectively. Although a slight decrease in the amount of
Ca2+ and Mg2+ was observed in the control, the relationship was not statistically significant as
shown in Figure 3.5 (b).
The maintenance lime requirement for the Oakleaf soil ranged from 0 tonnes in the control, to 0.8
tonnes CaCO3-1 ha-1 year-1 in the 5 and 10 tonnes lime ha-1 treatments (Table 3.6). Although

44
liming increased the rate of lime loss between unlimed and limed plots, no apparent difference in
maintenance lime requirement was found between the 5 and 10 tonnes ha-1 lime rates.
Comparison between experimental soils: According to the FSSA (2003), maintenance
applications of agricultural lime of 0.3 to as much as 1.5 tonnes CaCO3 ha-1 year-1 are necessary
under normal maize cultivation practices in South Africa. Although the average maintenance
lime requirement for the 10 tonnes ha-1 lime treatment of the Hutton soil and the lime treatments
of the Oakleaf soil are in accordance with lime losses generally expected, the acidification rates
were in general moderate for the two experimental soils. This can be ascribed to the
conservative (low risk) fertilizer application strategies that were evaluated for resource-poor
farmers. Another reason for the low acidification rates is the use of limestone ammonium nitrate
(LAN (28% N)) as nitrogen (N)-source. LAN is ranked as an N-source with a low acidifying effect
due to its nitrate and lime content. Nitrogen-containing fertilizers which contain large quantities
of ammonium and amine nitrogen have a greater acidifying effect on soil than nitrate-containing
fertilizers (FSSA, 1998).
3.4 CONCLUSIONS
Results from the study showed that acidification rates increased with lime application, but due to
stronger soil BC in the Oakleaf soil reacidification was found to be lower. Continuous maize
cultivation and inappropriate nitrogenous fertilization have the potential to generate sufficient
acidity that crop production (e.g. maize, legumes etc.) could be abandoned due to Al and
manganese toxicity in many agricultural lands in Mlondozi. It is furthermore important that soils
should be regularly tested and should be limed to a point where phytotoxic levels of extractable
Al are eliminated. Management strategies (e.g. split application of N) to reduce the acidifying
effect of fertilizer should also be implemented. However, the assessment of acidification rates
could be a valuable tool in determining soil acidification and serve as an indicator to adapt
management practices to reduce soil acidification. This stresses the importance of implementing
sound management strategies in conjunction with government interventions, especially for
resource-poor farmers.

45
LIMING EFFECTS OF SOIL PROPERTIES, NUTRIENT AVAILABILITY
AND GROWTH OF MAIZE
4.1 INTRODUCTION
A generation ago, prevention of starvation due to food shortage on a global scale was the
primary goal in agricultural strategies, a concern successfully addressed by the so-called “green
revolution” in various aspects. However, there has been a concomitant rise in incidence of
nutrient deficiencies in human populations worldwide (Graham & Welch, 2000). In South Africa,
resource-poor rural communities are especially vulnerable because most of the household’s food
is produced on the land on which they live. If nutrient deficiencies or toxicities occur in these
soils, their quality of life can be influenced dramatically (Steyn & Herselman, 2006). Furthermore,
many of the resource-poor rural areas are characterized by acid soils, commonly deficient in P,
Ca, Mg, Mo and Si, with Al and Mn at toxicity levels. Aluminium toxicity limits nutrient use
efficiency and crop production due to reduced root growth which greatly restricts the ability of the
plant to explore the soil volume for nutrients and water.
Liming of acid soils to alleviate soil acidity is a common practice, changing the availability and
soil solution concentrations of various nutrients. Increasing pH, HCO3- or Ca2+ concentration of
the soil solution may interact with solubility and uptake of elements, and sometimes change the
general vitality or growth rate of plants (Tyler & Olsson, 2001). Several studies have shown that
the solubility of P, Ca, Mg, Mo and Si increases with increasing pH while the solubility and
availability of Zn, Cu, B, Mn, Fe and Al in soils declines with increasing pH (Mengel & Kirkby,
1987; Reddy et al., 1995; Haynes, 2001; Thibaud & Farina, 2006). Furthermore, economic
considerations often require judicious management of applied fertilizer inputs under resource-
poor farming conditions. Ohki (1983) showed that soils with pH (H2O) of less than 5.0 often
contain toxic levels of Mn that may be detrimental to growth of maize.
The present study was undertaken to investigate the relationships between nutrient availability
and maize grain yield in a resource-poor farming area in the Mpumalanga Province of South
Africa. This area is characterized by acid soils deficient in Ca, Mg, P and K (Booyens et al.,
2000). Steyn and Herselman (2006) further reported that trace elements such as B, Co, Cu, Fe,
I, Mn, Mo, Se and Zn have a high risk of being deficient in this area. The objectives of the study
were to determine (i) the effect of lime application on soil and leaf nutrient concentrations, and (ii)
4
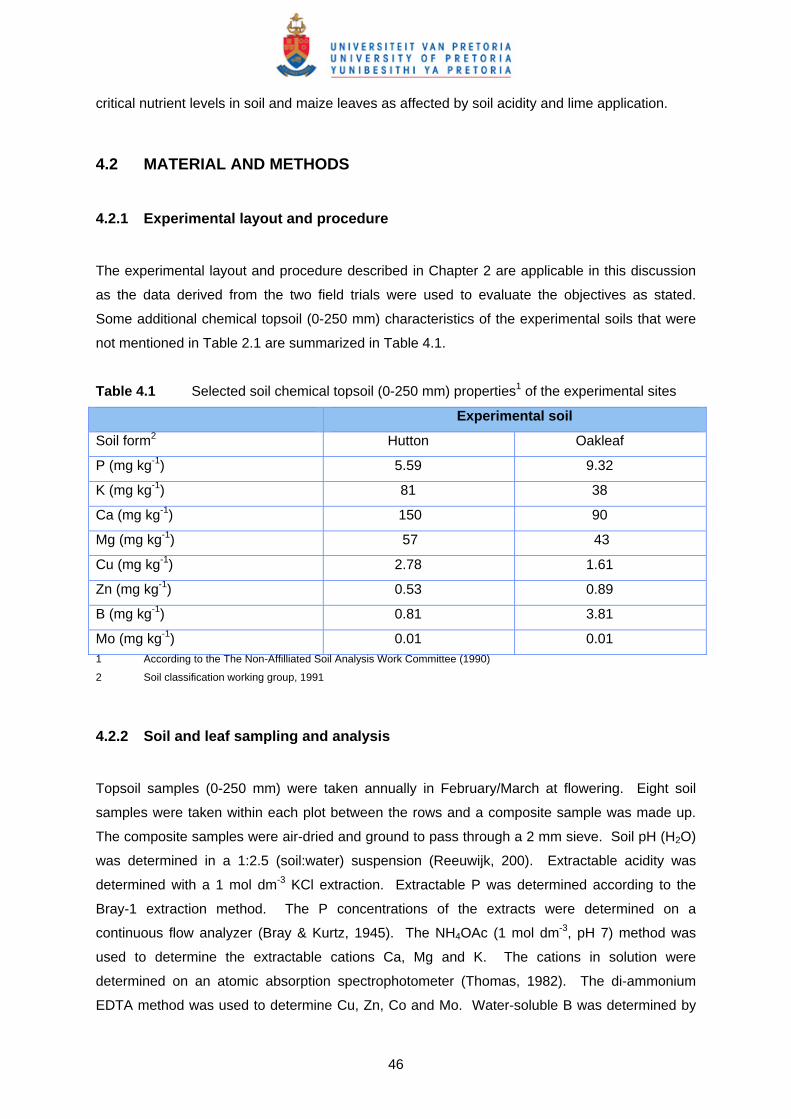
46
critical nutrient levels in soil and maize leaves as affected by soil acidity and lime application.
4.2 MATERIAL AND METHODS
4.2.1 Experimental layout and procedure
The experimental layout and procedure described in Chapter 2 are applicable in this discussion
as the data derived from the two field trials were used to evaluate the objectives as stated.
Some additional chemical topsoil (0-250 mm) characteristics of the experimental soils that were
not mentioned in Table 2.1 are summarized in Table 4.1.
Table 4.1 Selected soil chemical topsoil (0-250 mm) properties1 of the experimental sites
Experimental soil
Soil form2 Hutton Oakleaf
P (mg kg-1) 5.59 9.32
K (mg kg-1) 81 38
Ca (mg kg-1) 150 90
Mg (mg kg-1) 57 43
Cu (mg kg-1) 2.78 1.61
Zn (mg kg-1) 0.53 0.89
B (mg kg-1) 0.81 3.81
Mo (mg kg-1) 0.01 0.01 1 According to the The Non-Affilliated Soil Analysis Work Committee (1990)
2 Soil classification working group, 1991
4.2.2 Soil and leaf sampling and analysis
Topsoil samples (0-250 mm) were taken annually in February/March at flowering. Eight soil
samples were taken within each plot between the rows and a composite sample was made up.
The composite samples were air-dried and ground to pass through a 2 mm sieve. Soil pH (H2O)
was determined in a 1:2.5 (soil:water) suspension (Reeuwijk, 200). Extractable acidity was
determined with a 1 mol dm-3 KCl extraction. Extractable P was determined according to the
Bray-1 extraction method. The P concentrations of the extracts were determined on a
continuous flow analyzer (Bray & Kurtz, 1945). The NH4OAc (1 mol dm-3, pH 7) method was
used to determine the extractable cations Ca, Mg and K. The cations in solution were
determined on an atomic absorption spectrophotometer (Thomas, 1982). The di-ammonium
EDTA method was used to determine Cu, Zn, Co and Mo. Water-soluble B was determined by
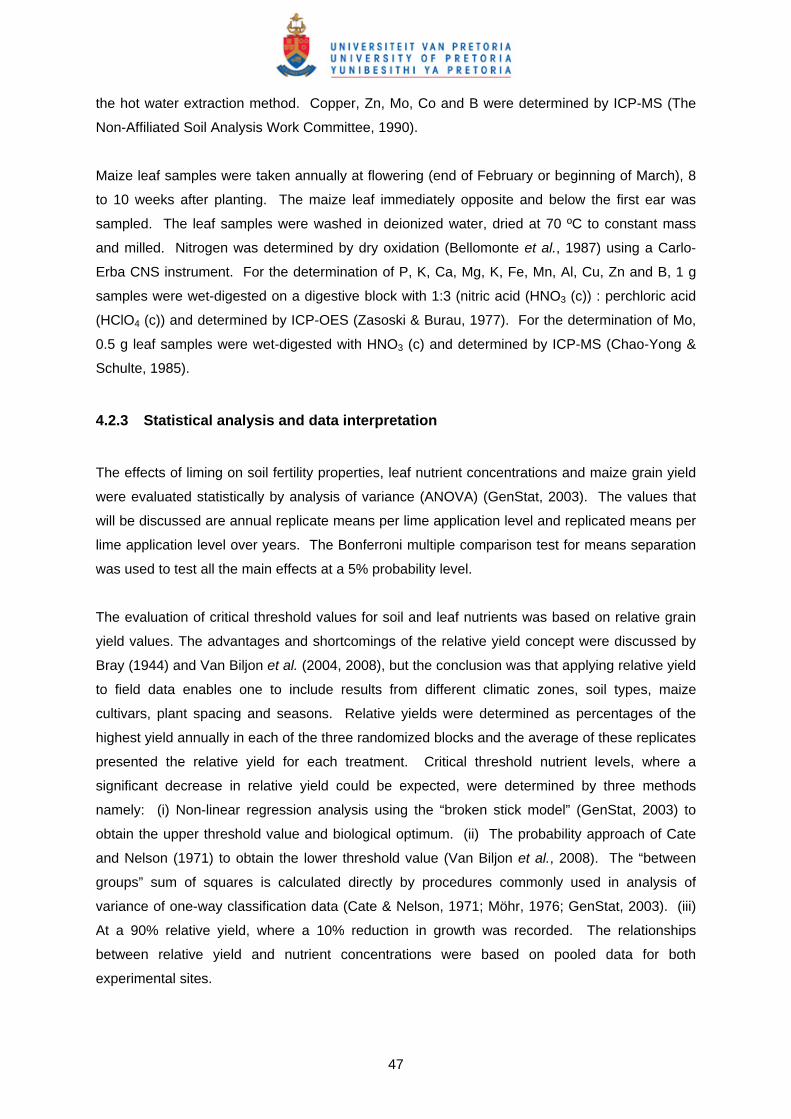
47
the hot water extraction method. Copper, Zn, Mo, Co and B were determined by ICP-MS (The
Non-Affiliated Soil Analysis Work Committee, 1990).
Maize leaf samples were taken annually at flowering (end of February or beginning of March), 8
to 10 weeks after planting. The maize leaf immediately opposite and below the first ear was
sampled. The leaf samples were washed in deionized water, dried at 70 ºC to constant mass
and milled. Nitrogen was determined by dry oxidation (Bellomonte et al., 1987) using a Carlo-
Erba CNS instrument. For the determination of P, K, Ca, Mg, K, Fe, Mn, Al, Cu, Zn and B, 1 g
samples were wet-digested on a digestive block with 1:3 (nitric acid (HNO3 (c)) : perchloric acid
(HClO4 (c)) and determined by ICP-OES (Zasoski & Burau, 1977). For the determination of Mo,
0.5 g leaf samples were wet-digested with HNO3 (c) and determined by ICP-MS (Chao-Yong &
Schulte, 1985).
4.2.3 Statistical analysis and data interpretation
The effects of liming on soil fertility properties, leaf nutrient concentrations and maize grain yield
were evaluated statistically by analysis of variance (ANOVA) (GenStat, 2003). The values that
will be discussed are annual replicate means per lime application level and replicated means per
lime application level over years. The Bonferroni multiple comparison test for means separation
was used to test all the main effects at a 5% probability level.
The evaluation of critical threshold values for soil and leaf nutrients was based on relative grain
yield values. The advantages and shortcomings of the relative yield concept were discussed by
Bray (1944) and Van Biljon et al. (2004, 2008), but the conclusion was that applying relative yield
to field data enables one to include results from different climatic zones, soil types, maize
cultivars, plant spacing and seasons. Relative yields were determined as percentages of the
highest yield annually in each of the three randomized blocks and the average of these replicates
presented the relative yield for each treatment. Critical threshold nutrient levels, where a
significant decrease in relative yield could be expected, were determined by three methods
namely: (i) Non-linear regression analysis using the “broken stick model” (GenStat, 2003) to
obtain the upper threshold value and biological optimum. (ii) The probability approach of Cate
and Nelson (1971) to obtain the lower threshold value (Van Biljon et al., 2008). The “between
groups” sum of squares is calculated directly by procedures commonly used in analysis of
variance of one-way classification data (Cate & Nelson, 1971; Möhr, 1976; GenStat, 2003). (iii)
At a 90% relative yield, where a 10% reduction in growth was recorded. The relationships
between relative yield and nutrient concentrations were based on pooled data for both
experimental sites.
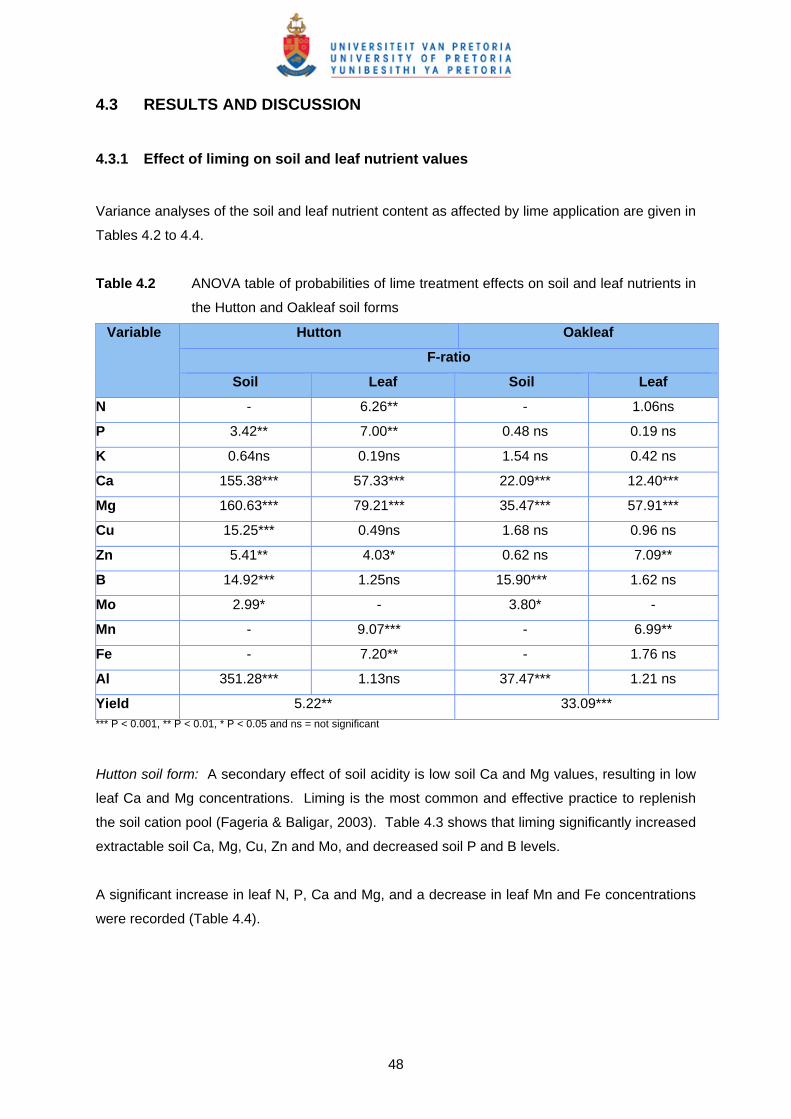
48
4.3 RESULTS AND DISCUSSION
4.3.1 Effect of liming on soil and leaf nutrient values
Variance analyses of the soil and leaf nutrient content as affected by lime application are given in
Tables 4.2 to 4.4.
Table 4.2 ANOVA table of probabilities of lime treatment effects on soil and leaf nutrients in
the Hutton and Oakleaf soil forms
Variable Hutton Oakleaf
F-ratio
Soil Leaf Soil Leaf
N - 6.26** - 1.06ns
P 3.42** 7.00** 0.48 ns 0.19 ns
K 0.64ns 0.19ns 1.54 ns 0.42 ns
Ca 155.38*** 57.33*** 22.09*** 12.40***
Mg 160.63*** 79.21*** 35.47*** 57.91***
Cu 15.25*** 0.49ns 1.68 ns 0.96 ns
Zn 5.41** 4.03* 0.62 ns 7.09**
B 14.92*** 1.25ns 15.90*** 1.62 ns
Mo 2.99* - 3.80* -
Mn - 9.07*** - 6.99**
Fe - 7.20** - 1.76 ns
Al 351.28*** 1.13ns 37.47*** 1.21 ns
Yield 5.22** 33.09*** *** P < 0.001, ** P < 0.01, * P < 0.05 and ns = not significant
Hutton soil form: A secondary effect of soil acidity is low soil Ca and Mg values, resulting in low
leaf Ca and Mg concentrations. Liming is the most common and effective practice to replenish
the soil cation pool (Fageria & Baligar, 2003). Table 4.3 shows that liming significantly increased
extractable soil Ca, Mg, Cu, Zn and Mo, and decreased soil P and B levels.
A significant increase in leaf N, P, Ca and Mg, and a decrease in leaf Mn and Fe concentrations
were recorded (Table 4.4).
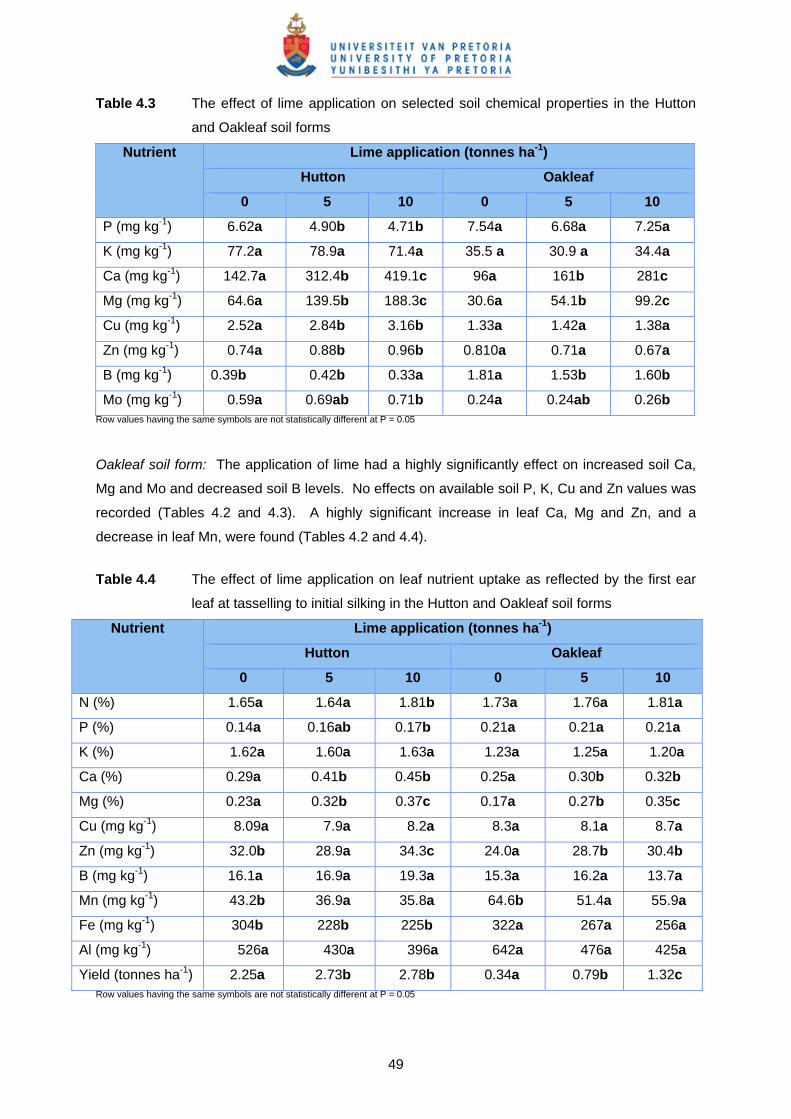
49
Table 4.3 The effect of lime application on selected soil chemical properties in the Hutton
and Oakleaf soil forms
Nutrient Lime application (tonnes ha-1)
Hutton Oakleaf
0 5 10 0 5 10
P (mg kg-1) 6.62a 4.90b 4.71b 7.54a 6.68a 7.25a
K (mg kg-1) 77.2a 78.9a 71.4a 35.5 a 30.9 a 34.4a
Ca (mg kg-1) 142.7a 312.4b 419.1c 96a 161b 281c
Mg (mg kg-1) 64.6a 139.5b 188.3c 30.6a 54.1b 99.2c
Cu (mg kg-1) 2.52a 2.84b 3.16b 1.33a 1.42a 1.38a
Zn (mg kg-1) 0.74a 0.88b 0.96b 0.810a 0.71a 0.67a
B (mg kg-1) 0.39b 0.42b 0.33a 1.81a 1.53b 1.60b
Mo (mg kg-1) 0.59a 0.69ab 0.71b 0.24a 0.24ab 0.26b Row values having the same symbols are not statistically different at P = 0.05
Oakleaf soil form: The application of lime had a highly significantly effect on increased soil Ca,
Mg and Mo and decreased soil B levels. No effects on available soil P, K, Cu and Zn values was
recorded (Tables 4.2 and 4.3). A highly significant increase in leaf Ca, Mg and Zn, and a
decrease in leaf Mn, were found (Tables 4.2 and 4.4).
Table 4.4 The effect of lime application on leaf nutrient uptake as reflected by the first ear
leaf at tasselling to initial silking in the Hutton and Oakleaf soil forms
Nutrient Lime application (tonnes ha-1)
Hutton Oakleaf
0 5 10 0 5 10
N (%) 1.65a 1.64a 1.81b 1.73a 1.76a 1.81a
P (%) 0.14a 0.16ab 0.17b 0.21a 0.21a 0.21a
K (%) 1.62a 1.60a 1.63a 1.23a 1.25a 1.20a
Ca (%) 0.29a 0.41b 0.45b 0.25a 0.30b 0.32b
Mg (%) 0.23a 0.32b 0.37c 0.17a 0.27b 0.35c
Cu (mg kg-1) 8.09a 7.9a 8.2a 8.3a 8.1a 8.7a
Zn (mg kg-1) 32.0b 28.9a 34.3c 24.0a 28.7b 30.4b
B (mg kg-1) 16.1a 16.9a 19.3a 15.3a 16.2a 13.7a
Mn (mg kg-1) 43.2b 36.9a 35.8a 64.6b 51.4a 55.9a
Fe (mg kg-1) 304b 228b 225b 322a 267a 256a
Al (mg kg-1) 526a 430a 396a 642a 476a 425a
Yield (tonnes ha-1) 2.25a 2.73b 2.78b 0.34a 0.79b 1.32c Row values having the same symbols are not statistically different at P = 0.05

50
Comparison between soils: In general, liming increased the mean extractable Ca and Mg values
over 6 years to above the optimum Ca range of 300 - 2000 mg kg-1 and Mg >50 mg kg-1,
respectively, in the Hutton soil, as suggested by Buys (1986). However, liming did not increase
extractable Ca values to within the optimum range in the Oakleaf soil form, but 5 and 10 tonnes
lime ha-1 increased extractable Mg to above the critical level of 50 mg kg-1. Soil P and K values
were deficient in both soils (Tables 4.3 and 4.5).
Table 4.5 Critical thresholds for selected soil nutrient indices
Nutrient indices
Soil nutrient content
Deficiency threshold (mg kg-1)
Critical threshold (mg kg-1)
90% relative yield (mg kg-1)
K <801 504 78-95
Ca <2001 2284, 3455 348
Mg <501 784, 1055 140
Cu <12 1.684, 2.835 2.85
Zn <32 - -
B <13 - -
1 Buys (1986)
2 Steyn & Herselman (2006)
3 Mengel & Kirkby (1987)
4 Cate & Nelson (1971) procedure
5 Broken-stick analysis
Leaf N and P concentrations below critical concentrations were recorded in the Hutton soil, and
the Oakleaf soil was deficient in leaf N and K nutrients according to values reported in Table 4.6.
Because of the relatively large amounts of N used by crop plants, N is usually the nutrient
element applied to agricultural land in the largest amounts. Once Al toxicity and P deficiency
have been managed by a combination of soil amendments, yield potential is likely to be limited
by N supply (Haynes, 2001). Due to the low leaf N concentrations recorded in the present study,
increased application of N fertilizer and/or the use of legumes in rotation, as intercrops, or green
manures, needs to be implemented.
Steyn and Herselman (2006) raised a concern that the trace elements B, Co, Cr, Cu, Fe, I, Mn,
Mo, Se and Zn have a high risk of being deficient in Mpumalanga, especially in resource-poor
farmlands. Over-liming may further cause deficiency of micronutrients such as Zn, Cu and B, if
soils are relatively poor in these elements. A decrease in soil B levels with liming was observed
(Tables 4.2 and 4.3) in both experimental soils. Although liming did not suppress B levels to
below deficient levels in the Oakleaf soil, the hot water-soluble B in the Hutton soil was far below
the deficiency (<1 mg kg) threshold suggested by Mengel and Kirkby (1987) and Steyn and

51
Herselman (2006). However, liming had no effect on leaf B uptake and both soils had leaf B
concentrations within the adequate range of 5 to 25 mg kg-1.
Table 4.6 Critical threshold values for selected plant nutrient indices in maize crops
Nutrient indices
Plant nutrient concentration
Adequate Range
Toxicity/Excessive Threshold
N (%) 2.60-4.001 >4.03
P (%) 0.17-0.321 >0.83
K (%) 1.50-3.502 >4.03
Ca (%) 0.20-0.503 >0.93
Mg (%) 0.20-1.001 >0.853
Cu (mg kg-1) 6-203 >503
Zn (mg kg-1) 18-603 >1503
B (mg kg-1) 5-251 >251
Mo (mg kg-1) 0.1-0.51 -
Fe (mg kg-1) 30-2003 >3501
Mn (mg kg-1) 20-2003 >3001
Al (mg kg-1) <2001 >4001 1 Reuter and Robinson (1997)
2 Hanway (1962)
3 Weir and Cresswell (1994)
On the basis of 3 mg kg-1 as the threshold value for Zn deficiency, all the treatments in both soils
had very low soil Zn values. Lime application did not affect Zn level in the Oakleaf soil form, but
a non-significant trend of increase in Zn by 0.14 and 0.22 mg kg-1, was observed with 5 and 10
tonnes lime ha-1, respectively, in the Hutton soil form. Parker et al. (1991) reported that Zn
deficiency of crops, especially maize, is very common. It was, however, found that liming did not
influence the uptake of leaf Zn content in the two sites studied. Although soil Zn levels were low,
both soils had leaf Zn concentrations within the adequate range of 18 to 60 mg kg-1.
Soil and leaf Cu values were in the optimum range (>1 mg kg-1 and >6 mg kg-1, respectively) in
both experimental soils. The extractable soil Mo values in the Oakleaf soil were in the deficiency
range with an observed increase in Mo with lime application. In some areas, however,
particularly on acid soils (pH (H2O) <5.5), Mo deficiency can arise because of Mo fixation in the
soil. Mo deficiency symptoms are commonly observed on soils derived from quartzic material, as
is the case in the study area (Mengel & Kirkby, 1987).
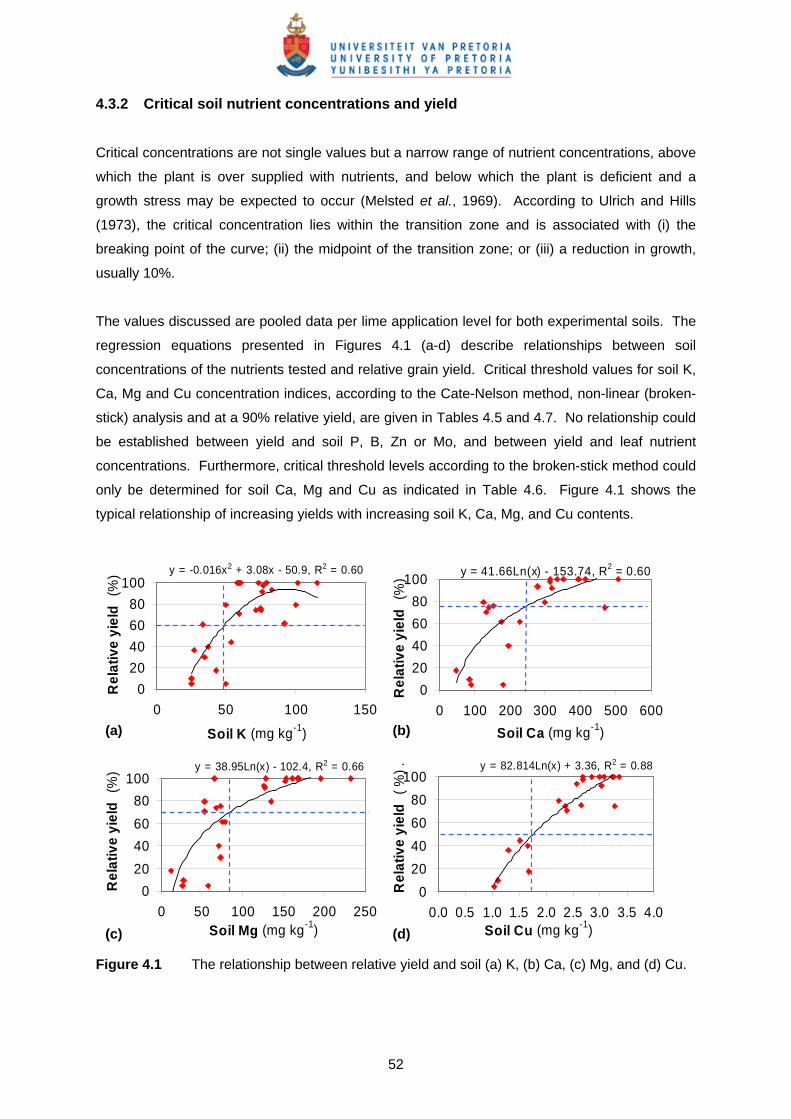
52
4.3.2 Critical soil nutrient concentrations and yield
Critical concentrations are not single values but a narrow range of nutrient concentrations, above
which the plant is over supplied with nutrients, and below which the plant is deficient and a
growth stress may be expected to occur (Melsted et al., 1969). According to Ulrich and Hills
(1973), the critical concentration lies within the transition zone and is associated with (i) the
breaking point of the curve; (ii) the midpoint of the transition zone; or (iii) a reduction in growth,
usually 10%.
The values discussed are pooled data per lime application level for both experimental soils. The
regression equations presented in Figures 4.1 (a-d) describe relationships between soil
concentrations of the nutrients tested and relative grain yield. Critical threshold values for soil K,
Ca, Mg and Cu concentration indices, according to the Cate-Nelson method, non-linear (broken-
stick) analysis and at a 90% relative yield, are given in Tables 4.5 and 4.7. No relationship could
be established between yield and soil P, B, Zn or Mo, and between yield and leaf nutrient
concentrations. Furthermore, critical threshold levels according to the broken-stick method could
only be determined for soil Ca, Mg and Cu as indicated in Table 4.6. Figure 4.1 shows the
typical relationship of increasing yields with increasing soil K, Ca, Mg, and Cu contents.
y = -0.016x2 + 3.08x - 50.9, R2 = 0.60
0
20
40
60
80
100
0 50 100 150
Soil K (mg kg-1)
Rel
ativ
e yi
eld
(%
) y = 41.66Ln(x) - 153.74, R2 = 0.60
0
20
40
60
80
100
0 100 200 300 400 500 600
Soil Ca (mg kg-1)
Rel
ativ
e yi
eld
(%
)
y = 38.95Ln(x) - 102.4, R2 = 0.66
0
20
40
60
80
100
0 50 100 150 200 250Soil Mg (mg kg-1)
Rel
ativ
e yi
eld
(%
) y = 82.814Ln(x) + 3.36, R2 = 0.88
0
20
40
60
80
100
0.0 0.5 1.0 1.5 2.0 2.5 3.0 3.5 4.0Soil Cu (mg kg-1)
Rel
ativ
e yi
eld
( %
) .
Figure 4.1 The relationship between relative yield and soil (a) K, (b) Ca, (c) Mg, and (d) Cu.
(a) (b)
(c) (d)

53
Table 4.5 and 4.6 shows that the measured critical threshold values for soil Ca, Mg and Cu were
228-345, 78-105 and 68-2.83 mg kg soil-1, respectively, which are in the range of adequate
values reported by Buys (1986) and Steyn and Herselman (2006). However, critical K levels
(Table 4.5) were lower than the adequate range reported by Buys (1986) and Mengel and Kirkby
(1987).
Table 4.7 Non-linear regression analysis between relative yield and selected soil nutrients
for pooled data in the Hutton and Oakleaf soil forms
Variables R2 (%) F Critical value (mg kg-1)
Relative yield vs soil Ca 57.6 70.73* 345
Relative yield vs soil Mg 63.4 80.94* 105
Relative yield vs soil Cu 89.4 282.42* 2.83 *** P < 0.001, ** P < 0.01, and * P < 0.05
4.4 CONCLUSIONS
The present study indicates that a risk exists for soil P, K, B and Zn to be deficient in the study
area. However, the deficiencies of Cu, Zn and B were not reflected in plant uptake with leaf
concentrations well above adequate ranges. Critical values, as reported in this study, are not
infallible but can serve as a guide in the interpretation of the problems associated with soil acidity.
If used properly they can help identify nutrition deficiencies and imbalances responsible for yield
depression which could assist in the implementation of useful and sound cultivation practices.
54
EFFECT OF SOIL ACIDITY AMELIORATION ON MAIZE YIELD AND NUTRIENT INTERRELATIONSHIPS IN SOIL AND PLANTS USING STEPWISE REGRESSION AND NUTRIENT VECTOR ANALYSIS
5.1 INTRODUCTION
Soil acidity is as a major constraint to crop production throughout the world (Sumner & Noble,
2003). Venter et al. (2001) reported that although the extent of man-made topsoil acidity in
South-Africa is difficult to quantify, it is estimated that 37% of the cropped area in the summer
rainfall region, west of the Drakensberg, is acidified to some extent. In the winter rainfall region
60% of soil analyses indicated an acidity problem (Venter et al., 2001). Furthermore, vast areas
in South Africa occupied by resource poor rural communities in the higher rainfall areas are
characterized by acid soils, and commonly deficient in Ca, Mg, Mo and P (Beukes, 1995). The
fertility of acid soils is limited by two fundamental factors; the presence of phytotoxic substances
(e.g. soluble Al and Mn) and nutrient deficiencies (e.g. P, Ca, and Mg). Aluminium toxicity limits
nutrient use efficiency and crop production through reducing root growth which greatly restricts
the ability of the plant to explore the soil volume for nutrients and water. This also leads to
restricted uptake of P, Ca, and Mg by plant roots and deficiencies of these nutrients are common
in plants suffering from Al toxicity (Foy & Fleming, 1978; Foy, 1984; Haynes, 2001).
Aluminium toxicity interferes with active ion uptake processes functioning across the root-cell
plasma membrane (Wright, 1989; Haynes, 2001). Toxic concentrations of Al have been shown
to reduce P and Ca uptake by crops. The mechanism of Al/P interactions is proposed to be an
adsorption/precipitation reaction between Al and P at the root surface or in the root free space
(McCormick & Borden, 1974; Tan & Keltjens, 1990; Haynes, 2001). Aluminium toxicity also
results in inhibition of Ca and Mg uptake by plants. Mengel and Kirkby (1987) reported that Al
(probably AlOH2+) specifically depressed Mg uptake in oats whereas the uptake of Ca and K was
little affected. Foy (1992), also, reported antagonistic effects between Ca and Al in soil. These
effects include decreased susceptibility to Al toxicity at increased Ca levels, and reduced uptake
and translocation of Ca as solution Al3+ is increased (Haynes, 2001). On acidic soils, excessive
levels of soluble Mn can induce Fe deficiency in some plants, thereby causing the development
of Mn toxicity symptoms on older leaves and Fe deficiency symptoms on younger leaves
(Grundon et al., 1997; Thibaud & Farina, 2006). Sometimes excessive Mn can induce deficiency
5
55
of Mg, and Ca as well. In the case of Mn induced Ca deficiency (“crinkle leaf”), reported in cotton
and beans, the transportation of Ca in the growing points is affected (Mengel & Kirkby, 1987).
The present study was undertaken to investigate the effect of lime application on maize yield and
nutrient interrelationships in soils and plants. The study area is characterized by acidic soils that
could lead to toxic levels of Al and Mn detrimental to maize growth. Although it is generally
accepted that liming effectively reduces elevated concentrations of Al and Mn in soil, it could
decrease the availability of B, Zn and Cu in soil (see Chapter 4). It is therefore also necessary to
study nutrient interactions as affected by soil acidity in order to understand the potential soil and
leaf nutrient imbalances that may arise from lime application. The objectives of the study were
therefore to (i) determine the interrelationships between maize grain yield, soil and leaf nutrient
contents and (ii) evaluate possible lime induced nutrient interactions by means of nutrient vector
analyses.
5.2 MATERIAL AND METHODS
5.2.1 Experimental procedure
Two field trials, which were discussed in Chapter 2, were used to evaluate interrelationships
between soil and leaf nutrients. Some physical and chemical topsoil (0-250 mm) characteristics
of the experimental soils are summarized in Tables 2.1 and 4.1.
5.2.2 Soil and maize plant sampling and analysis
Topsoil samples (0 - 250 mm) were collected annually in February/March at flowering. Eight sub
samples were taken within each plot between the rows and bulked as a composite sample, air-
dried and ground to pass through a 2 mm sieve prior to analysis.
Soil pH (H2O) was determined in a 1:2.5 (soil:water) suspension (Reeuwijk, 2002). Extractable
acidity (H + Al) and Al were determined in a 1 M potassium chloride (KCl) extraction and titration
with 0.1 M NaOH. Extractable Al was determined in the same extract by complexing it by adding
10 cm3 NaF to the titrate, and titrating again to an end point. (The Non-Affiliated Soil Analysis
Work Committee, 1990). Acid saturation was determined as the ratio of extractable acidity (Al +
H) to the sum of extractable Ca, Mg, K and extractable acidity (Al + H), expressed as a
percentage. Extractable P was determined according to the Bray-1 extraction method (Bray &
Kurtz, 1945). The P concentrations of the extracts were determined on a continuous flow
analyzer (Bray & Kurtz, 1945). The NH4OAc (1 M, pH 7) method was used to determine the
extractable cations Ca, Mg and K. The cations in solution were determined on an atomic

56
absorption spectrophotometer (Thomas, 1982). A 0.02 M di-ammonium EDTA ((NH4)2EDTA)
extract (The Non-Affiliated Soil Analysis Work Committee, 1990) was used to extract Cu, Zn, Co,
and Mo were determined by ICP-MS. Water soluble B was determined by the hot water
extraction method (The Non-Affiliated Soil Analysis Work Committee, 1990).
Maize leaf samples, immediately opposite and below the first ear were annually collected at
flowering (end of February, beginning of March), 8 to 10 weeks after planting. The leaf samples
were washed in deionized water, dried at 70ºC and milled. Nitrogen was determined by dry
oxidation (Bellomonte et al., 1987) using a Carlo-Erba CNS instrument. For the determination of
P, K, Ca, Mg, K, Fe, Mn, Al, Cu, Zn and B, 1 g samples were wet-digested on a block digester
with 1:3 (HNO3 and HClO4) and analyzed using an ICP-OES (Zasoski & Burau, 1977). For the
determination of Mo, 0.5 g leaf samples were wet-digested with HNO3 and analysed using an
ICP-MS (Chao-Yong & Schulte, 1985). Above-ground dry matter biomass was determined at
flowering by cutting the above-ground plant parts at the soil surface. The plant parts were dried
at 65˚C to constant mass at which time they were weighed.
5.2.3 Statistical analysis and data interpretation
The values that will be discussed are annual replicate means per lime application level and
replicated means per lime application level over years. Pearson's correlations were calculated
between all variates measured. Forward selection stepwise regression was used to determine
those soil properties most responsible for the variation found in maize grain yield (Genstat, 2003).
To facilitate interpretation, yield data and the chemical composition of leaf samples was
interpreted using a graphical vector nutrient diagnostic technique (Timmer & Stone, 1978;
Timmer & Teng, 1999, Ströhmenger, 2001). Nutrient vector analysis involves graphical
representation of the relative changes in biomass, leaf nutrient contents and concentrations in
leaves in response to nutrient treatments (Grundon et al., 1997). The relationship (Figure 5.1) is
examined by comparing growth and nutrient status of crops in a nomogram that plots biomass (z)
on the upper axis, leaf nutrient content (x) on the lower axis, and corresponding nutrient
concentration (y) on the vertical axis.
When relative yield is normalized to 100% at a specified reference sample (i.e. the 5 tonnes lime
ha-1 application in this study), differences are depicted as vectors because of shifts in both
direction and magnitude (Timmer & Teng, 1999). The dashed diagonals are isopleths
representing change of y on x, where z remains unchanged (Ströhmenger, 2001). Diagnosis is
based on vector direction of individual nutrients, identifying occurrence of dilution (A), sufficiency
(B), deficiency (C), luxury consumption (D), toxicity (E) and antagonism (F), as depicted in Figure

57
5.1. Vector magnitude reflects the extent or severity of specific diagnoses, and facilitates relative
ranking and prioritizing (Temmer & Teng, 1999).
Vector shift
Change in relative
Nutritional effect
Nutrient status
Possible diagnosis
z x y
A
B
C
D
E
F
+
+
+
0
-
-
+
+
+
+
-, +
-
-
0
+
+
+
-
Dilution
Accumulation
Accumulation
Accumulation
Concentration
Antagonism
Non-limiting
Non-limiting
Limiting
Non-limiting
Excess
Limiting
Growth dilution
Sufficiency, steady-state
Deficiency response
Luxury consumption
Toxic accumulation
Induced deficiency by E
Figure 5.1 Nutrient vector analysis. Interpretation of directional changes in relative biomass
and nutrient status of plants contrasting in growth (Timmer & Teng, 1999).
5.2 RESULTS AND DISCUSSIONS
5.3.1 Interrelationship between maize grain yield, soil and leaf nutrients Linear interrelationships between maize grain yield and selected soil and leaf nutrients are
presented in Tables 5.1 and 5.2.
R
F
E D
C
A
B
Nutrient content (x)
Biomass (z) N
utrie
nt c
once
ntra
tion
(y)
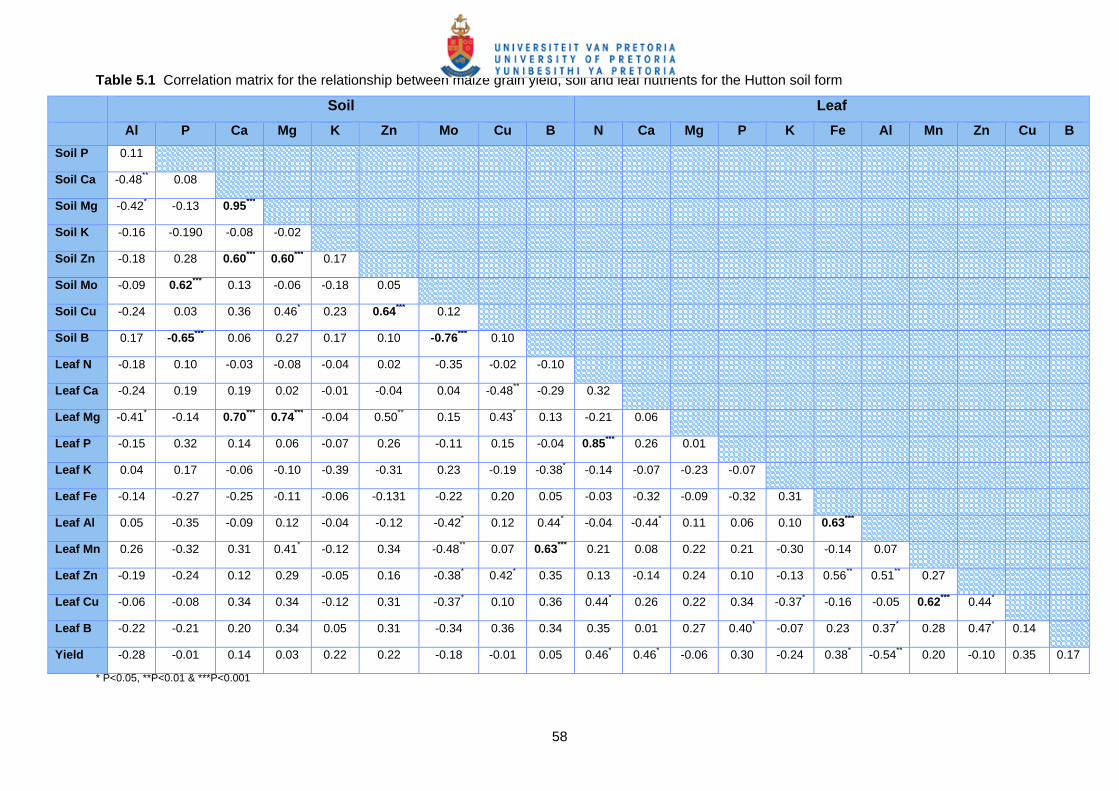
58
Table 5.1 Correlation matrix for the relationship between maize grain yield, soil and leaf nutrients for the Hutton soil form
Soil Leaf Al P Ca Mg K Zn Mo Cu B N Ca Mg P K Fe Al Mn Zn Cu B
Soil P 0.11
Soil Ca -0.48** 0.08
Soil Mg -0.42* -0.13 0.95***
Soil K -0.16 -0.190 -0.08 -0.02
Soil Zn -0.18 0.28 0.60*** 0.60*** 0.17
Soil Mo -0.09 0.62*** 0.13 -0.06 -0.18 0.05
Soil Cu -0.24 0.03 0.36 0.46* 0.23 0.64*** 0.12
Soil B 0.17 -0.65*** 0.06 0.27 0.17 0.10 -0.76*** 0.10
Leaf N -0.18 0.10 -0.03 -0.08 -0.04 0.02 -0.35 -0.02 -0.10
Leaf Ca -0.24 0.19 0.19 0.02 -0.01 -0.04 0.04 -0.48** -0.29 0.32
Leaf Mg -0.41* -0.14 0.70*** 0.74*** -0.04 0.50** 0.15 0.43* 0.13 -0.21 0.06
Leaf P -0.15 0.32 0.14 0.06 -0.07 0.26 -0.11 0.15 -0.04 0.85*** 0.26 0.01
Leaf K 0.04 0.17 -0.06 -0.10 -0.39 -0.31 0.23 -0.19 -0.38* -0.14 -0.07 -0.23 -0.07
Leaf Fe -0.14 -0.27 -0.25 -0.11 -0.06 -0.131 -0.22 0.20 0.05 -0.03 -0.32 -0.09 -0.32 0.31
Leaf Al 0.05 -0.35 -0.09 0.12 -0.04 -0.12 -0.42* 0.12 0.44* -0.04 -0.44* 0.11 0.06 0.10 0.63***
Leaf Mn 0.26 -0.32 0.31 0.41* -0.12 0.34 -0.48** 0.07 0.63*** 0.21 0.08 0.22 0.21 -0.30 -0.14 0.07
Leaf Zn -0.19 -0.24 0.12 0.29 -0.05 0.16 -0.38* 0.42* 0.35 0.13 -0.14 0.24 0.10 -0.13 0.56** 0.51** 0.27
Leaf Cu -0.06 -0.08 0.34 0.34 -0.12 0.31 -0.37* 0.10 0.36 0.44* 0.26 0.22 0.34 -0.37* -0.16 -0.05 0.62*** 0.44*
Leaf B -0.22 -0.21 0.20 0.34 0.05 0.31 -0.34 0.36 0.34 0.35 0.01 0.27 0.40* -0.07 0.23 0.37* 0.28 0.47* 0.14
Yield -0.28 -0.01 0.14 0.03 0.22 0.22 -0.18 -0.01 0.05 0.46* 0.46* -0.06 0.30 -0.24 0.38* -0.54** 0.20 -0.10 0.35 0.17
* P<0.05, **P<0.01 & ***P<0.001

59
Table 5.2 Correlation matrix for relationship between maize grain yield, soil and leaf nutrients for the Oakleaf soil form
Soil Leaf
Al P Ca Mg K Zn Mo Cu B N Ca Mg P K Fe Mn Zn Cu B
Soil P 0.14
Soil Ca -0.95*** -0.09
Soil Mg -0.94*** -0.04 0.99***
Soil K -0.24 -0.01 0.45* 0.46*
Soil Zn 0.07 0.24 0.05 0.09 0.45*
Soil Mo 0.35 0.04 -0.24 -0.26 0.15 0.43*
Soil Cu 0.57** 0.12 -0.57** -0.59*** 0.09 0.31 0.19
Soil B 0.53** 0.10 -0.41* -0.42* 0.07 0.62*** 0.70*** 0.19
Leaf N 0.16 0.34 -0.22 -0.20 -0.09 -0.32 -0.09 0.15 -0.34
Leaf Ca -0.36 0.23 0.34 0.39* 0.09 -0.27 -0.37* -0.01 -0.69*** 0.66***
Leaf Mg -0.76*** 0.15 0.79*** 0.81*** 0.20 -0.06 -0.34 -
0 48**
-0.62*** 0.04 0.54**
Leaf P 0.19 0.09 -0.29 -0.30 -0.34 -0.58*** 0.14 -0.26 -0.25 0.70*** 0.18 -0.05
Leaf K 0.15 0.12 -0.14 -0.07 -0.06 0.37 -0.12 0.16 0.17 -0.19 -0.02 -0.22 -0.27
Leaf Fe 0.21 -0.02 -0.19 -0.14 -0.02 0.28 0.23 -0.18 0.43* 0.15 0.01 -0.19 0.15 0.10
Leaf Mn 0.51** 0.25 -0.36 -0.35 0.12 0.03 0.23 -0.08 0.38* 0.36 -0.01 -0.40* 0.46** 0.16 0.49**
Leaf Zn -0.40 0.38* 0.40* 0.43* 0.01 -0.17 0.18 -0.16 -0.56** 0.62*** 0.83*** 0.69*** 0.28 -0.16 -0.12 -0.05
Leaf Cu 0.31 0.23 -0.34 -0.32 -0.09 -0.23 0.11 0.08 -0.10 0.88*** 0.48** -0.15 0.66*** -0.22 0.47** 0.56** 0.40*
Leaf B 0.01 0.21 -0.10 -0.10 -0.25 -0.11 0.13 0.27 -0.26 0.08 0.23 0.22 -0.13 -0.42* -0.02 -0.44* 0.15 0.10
Yield -0.54** 0.24 0.49** 0.53** 0.15 -0.06 0.37* -0.01 -0.66*** 0.51** 0.92*** 0.67*** 0.04 -0.10 0.02 -0.20 0.79*** 0.34 0.36
*P<0.05, **P<0.01 & ***P<0.001
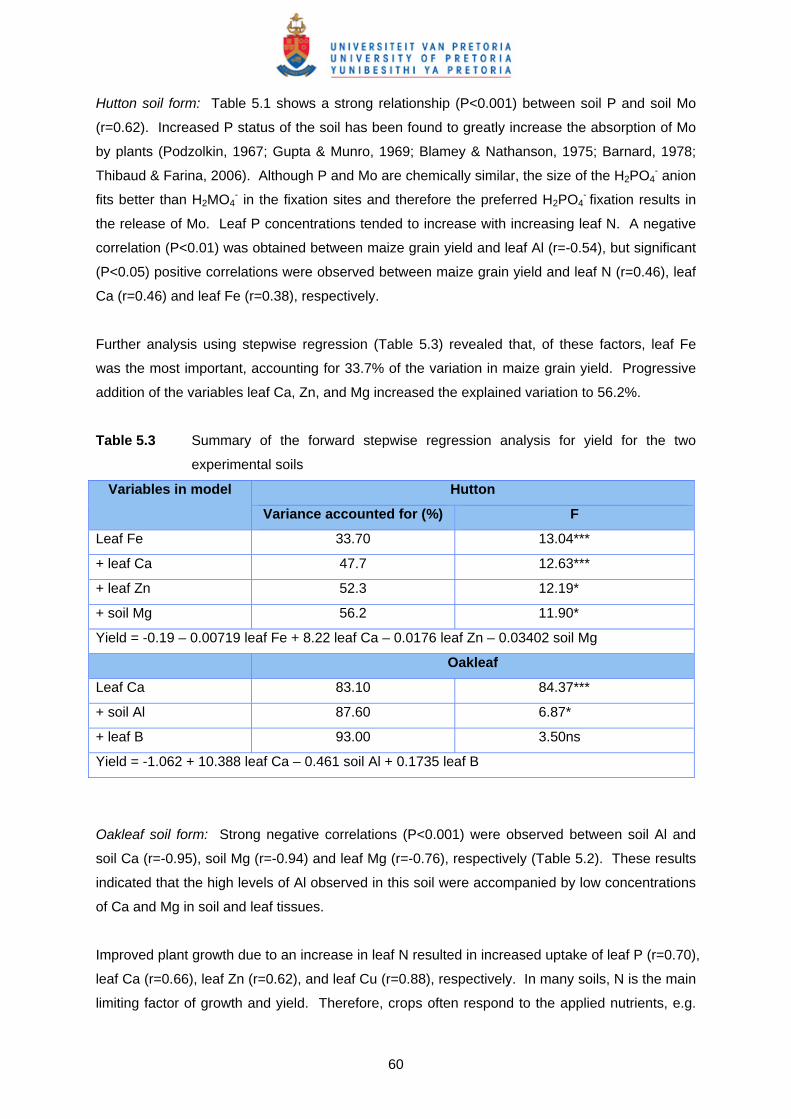
60
Hutton soil form: Table 5.1 shows a strong relationship (P<0.001) between soil P and soil Mo
(r=0.62). Increased P status of the soil has been found to greatly increase the absorption of Mo
by plants (Podzolkin, 1967; Gupta & Munro, 1969; Blamey & Nathanson, 1975; Barnard, 1978;
Thibaud & Farina, 2006). Although P and Mo are chemically similar, the size of the H2PO4- anion
fits better than H2MO4- in the fixation sites and therefore the preferred H2PO4
- fixation results in
the release of Mo. Leaf P concentrations tended to increase with increasing leaf N. A negative
correlation (P<0.01) was obtained between maize grain yield and leaf Al (r=-0.54), but significant
(P<0.05) positive correlations were observed between maize grain yield and leaf N (r=0.46), leaf
Ca (r=0.46) and leaf Fe (r=0.38), respectively.
Further analysis using stepwise regression (Table 5.3) revealed that, of these factors, leaf Fe
was the most important, accounting for 33.7% of the variation in maize grain yield. Progressive
addition of the variables leaf Ca, Zn, and Mg increased the explained variation to 56.2%.
Table 5.3 Summary of the forward stepwise regression analysis for yield for the two
experimental soils
Variables in model Hutton
Variance accounted for (%) F
Leaf Fe 33.70 13.04***
+ leaf Ca 47.7 12.63***
+ leaf Zn 52.3 12.19*
+ soil Mg 56.2 11.90*
Yield = -0.19 – 0.00719 leaf Fe + 8.22 leaf Ca – 0.0176 leaf Zn – 0.03402 soil Mg
Oakleaf
Leaf Ca 83.10 84.37***
+ soil Al 87.60 6.87*
+ leaf B 93.00 3.50ns
Yield = -1.062 + 10.388 leaf Ca – 0.461 soil Al + 0.1735 leaf B
Oakleaf soil form: Strong negative correlations (P<0.001) were observed between soil Al and
soil Ca (r=-0.95), soil Mg (r=-0.94) and leaf Mg (r=-0.76), respectively (Table 5.2). These results
indicated that the high levels of Al observed in this soil were accompanied by low concentrations
of Ca and Mg in soil and leaf tissues.
Improved plant growth due to an increase in leaf N resulted in increased uptake of leaf P (r=0.70),
leaf Ca (r=0.66), leaf Zn (r=0.62), and leaf Cu (r=0.88), respectively. In many soils, N is the main
limiting factor of growth and yield. Therefore, crops often respond to the applied nutrients, e.g.
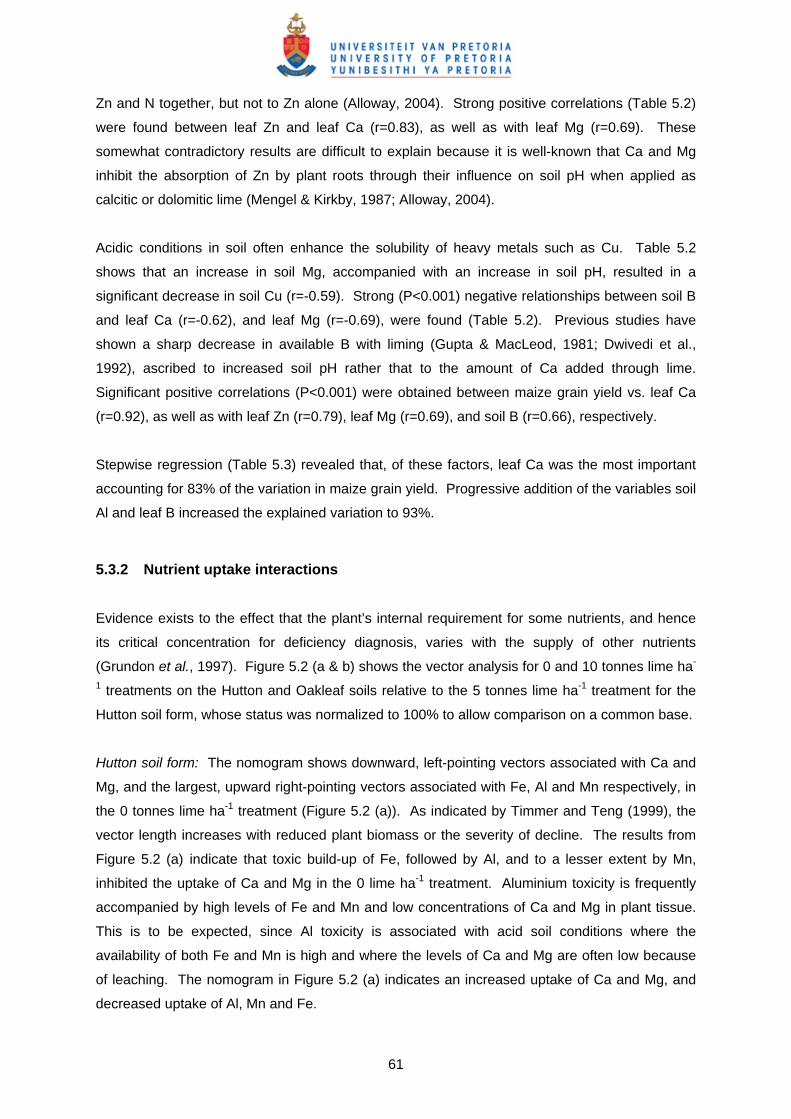
61
Zn and N together, but not to Zn alone (Alloway, 2004). Strong positive correlations (Table 5.2)
were found between leaf Zn and leaf Ca (r=0.83), as well as with leaf Mg (r=0.69). These
somewhat contradictory results are difficult to explain because it is well-known that Ca and Mg
inhibit the absorption of Zn by plant roots through their influence on soil pH when applied as
calcitic or dolomitic lime (Mengel & Kirkby, 1987; Alloway, 2004).
Acidic conditions in soil often enhance the solubility of heavy metals such as Cu. Table 5.2
shows that an increase in soil Mg, accompanied with an increase in soil pH, resulted in a
significant decrease in soil Cu (r=-0.59). Strong (P<0.001) negative relationships between soil B
and leaf Ca (r=-0.62), and leaf Mg (r=-0.69), were found (Table 5.2). Previous studies have
shown a sharp decrease in available B with liming (Gupta & MacLeod, 1981; Dwivedi et al.,
1992), ascribed to increased soil pH rather that to the amount of Ca added through lime.
Significant positive correlations (P<0.001) were obtained between maize grain yield vs. leaf Ca
(r=0.92), as well as with leaf Zn (r=0.79), leaf Mg (r=0.69), and soil B (r=0.66), respectively.
Stepwise regression (Table 5.3) revealed that, of these factors, leaf Ca was the most important
accounting for 83% of the variation in maize grain yield. Progressive addition of the variables soil
Al and leaf B increased the explained variation to 93%.
5.3.2 Nutrient uptake interactions
Evidence exists to the effect that the plant’s internal requirement for some nutrients, and hence
its critical concentration for deficiency diagnosis, varies with the supply of other nutrients
(Grundon et al., 1997). Figure 5.2 (a & b) shows the vector analysis for 0 and 10 tonnes lime ha-
1 treatments on the Hutton and Oakleaf soils relative to the 5 tonnes lime ha-1 treatment for the
Hutton soil form, whose status was normalized to 100% to allow comparison on a common base.
Hutton soil form: The nomogram shows downward, left-pointing vectors associated with Ca and
Mg, and the largest, upward right-pointing vectors associated with Fe, Al and Mn respectively, in
the 0 tonnes lime ha-1 treatment (Figure 5.2 (a)). As indicated by Timmer and Teng (1999), the
vector length increases with reduced plant biomass or the severity of decline. The results from
Figure 5.2 (a) indicate that toxic build-up of Fe, followed by Al, and to a lesser extent by Mn,
inhibited the uptake of Ca and Mg in the 0 lime ha-1 treatment. Aluminium toxicity is frequently
accompanied by high levels of Fe and Mn and low concentrations of Ca and Mg in plant tissue.
This is to be expected, since Al toxicity is associated with acid soil conditions where the
availability of both Fe and Mn is high and where the levels of Ca and Mg are often low because
of leaching. The nomogram in Figure 5.2 (a) indicates an increased uptake of Ca and Mg, and
decreased uptake of Al, Mn and Fe.
62
Figure 5.2 Relative response in nutrient concentration, content and dry mass of maize plants
grown at differential lime rates in the (a) Hutton and (b) Oakleaf soil forms.
Calcium and Mg deficiency was corrected by the application of dolomitic lime application, which
antagonistically reduced Al, Mn and Fe uptake and availability. The uptake of B was also
markedly lower in the 0 lime ha-1 treatment (Figure 5.2 (a)) presumably due to elevated Fe, Al
and Mn leaf concentrations associated with acid soils. One of the consequences of soil acidity
0
50
100
150
200
250
300
0 50 100 150
Relative nutrient content (%)
Rel
ativ
e nu
trien
t con
cent
ratio
n (%
)
N P K Ca Mg Mn Fe Zn Cu B Al
Relative plant biomass (%) 36 50
55
0
50
100
150
0 50 100 150
Relative nutrient content (%)
Rel
ativ
e nu
trien
t con
cent
ratio
n (%
)
N P K Ca Mg Mn Al Fe Zn Cu B Mo
Relative plant biomass (%) 85100101
(a)
(b)

63
may be the leaching of soil B. Boron in soil occurs mainly as H2BO3, a weak acid whose the
dissociation is reduced under low pH conditions, resulting in the leaching of H2BO3 (Fölscher,
1978). An increased accumulation of leaf Zn, Mg, P, Ca, N, and to a lesser extent B, Mo, Cu and
K, without any gain in maize biomass, was observed in the 10 tonnes lime ha-1 treatment (Figure
5.2 (a)). This indicated a non-limiting luxury consumption of Zn, Mg, P, Ca, N, B, Mo, Cu and K
by the maize plants treated with 10 tonnes lime ha-1.
Oakleaf soil form: The nomogram shows downward, left-pointing vectors associated with Ca and
Mg, and the largest, upward left-pointing vectors associated with Fe, Al and Mn, respectively, in
the 0 and 10 tonnes lime ha-1 treatments (Figure 5.2 (b)). Results in Figure 5.2 (b) show that soil
Al, followed by Mn and Fe, markedly reduced the uptake of Ca and Mg. Effective liming, i.e. 10
tonnes lime ha-1 treatment, alleviated the problem of Fe, Al and Mn toxicity as shown in Figure
5.2 (b). According to Haynes (2001) several mechanisms explain the antagonistic effect of Al on
Ca and Mg uptake. Firstly, Ca2+ and Mg2+ in the root apoplasm are thought to be replaced by
Al3+ and this reduces the amount of Ca2+ and Mg2+ in the vicinity of the plasma membrane,
reducing their rate of uptake. It has also been reported that Al3+ blocks Ca2+ channels in the
plasma membrane and that Al3+ blocks binding sites for Mg2+ on transport proteins at the plasma
membrane (Rengel & Robinson, 1989; Haynes, 2001). Antagonistic reduction of B uptake due to
Al, Mn, and to a lesser extent Fe, toxicity was not observed in the Oakleaf soil.
Figure 5.2 (b) shows a right-pointing vector that was associated with high Al, and to a lesser
extent Mn and a downward, left-pointing vector associated with K in all treatments (0, 5 and 10
tonnes lime ha-1). This indicated that the problems associated with soil acidity were not
alleviated with 5 and 10 tonnes lime applications. The predominant constraints resulting from
increasing soil acidity is a severe chemical imbalance caused by toxic levels of Al, and Mn ions
coupled with a parallel critical deficiency in available N, P, K, Ca, Mg, Mo, and sometimes, Zn
(Fageria & Baligar, 2003). Furthermore, at low pH levels cell membranes are impaired and
become more permeable. This results in a leakage of plant nutrients and particularly of K, which
diffuses out of the root cells into the soil solution. This detrimental effect of high H+
concentrations on biological membranes can be counterbalanced by Ca applied as lime (Mengel
& Kirkby, 1987).
5.3 CONCLUSIONS
Nutrient vector analyses showed a toxic build-up of Fe, followed by Al, and to a lesser extent by
Mn. The toxic elements depressed the uptake of and Mg in the Hutton soil. In the Oakleaf soil,
Al-toxicity, followed by high levels of Mn and Fe markedly reduced the uptake of Ca and Mg.
Antagonistically reduced B uptake due to Fe, Mn, and Al toxicity was observed in the Hutton soil.

64
Toxic levels of Al, Mn and Fe antagonistically depressed the uptake of K in the Oakleaf soil.
Generally the results indicated that soil acidity had a confounding influence on soil fertility, leaf
nutrient uptake and maize growth. Aluminium-, Mn- and Fe-toxicity, respectively, and deficient
levels of Ca and Mg were the factors that most adversely affected nutrient uptake and maize
grain yields in the study area. The highest yields were associated with low leaf Al, Fe and Mn
levels. It was also found that the uptake of leaf K and leaf B levels was decreased extensively
under severe leaf Al, Mn and Fe toxicity.

65
RELATIONSHIPS BETWEEN SOIL BUFFER CAPACITY AND SELECTED SOIL PROPERTIES
6.1 INTRODUCTION
One of the main problems with soil acidity is the relationship between the total acidity of the
system (i.e. the nature and amounts of proton donors in the solid phase) and the intensity of
acidity (i.e. the activity of hydrogen ions in the soil solution). This relationship is defined as the
soil buffer capacity (Bache, 1988). The determination of soil buffer capacity (soil BC) has long
been of interest to soil chemists and crop scientists. The reason is that many crops respond
positively to the addition of lime to acid soils, but because of the differences in soil BC, soils of
similar pH may require vastly different quantities of lime to yield the same increase in pH. A
soil’s BC is furthermore also needed to understand the rate of natural soil weathering as well as
the rate of soil acidification from acid-forming nitrogen fertilizers, acid rain, and acid mine waste
(Bloom, 2000).
Laboratory measurement of soil BC by titration techniques is used to directly determine lime
requirement (McLean et al., 1966; Follett & Follett, 1983), to calibrate rapid lime requirement
tests and to ascertain soil BC in acidification studies enabling calculation of acidification rates
(Helyar & Porter, 1989; van Breemen, 1991; Aitken & Moody, 1994). The general factors
responsible for soil BC and pH buffering in soils, include the amount of organic matter (OM) and
the type of clay minerals present (Magdoff et al., 1987). Soil buffering caused by the protonation
and deprotonation of minerals and organic materials reduces the change in soil pH when acids or
bases are added to the soil. In most soils, the general pH range of buffering by soil components
is from 4.0 to 8.0. Acid buffering mechanisms include aluminosilicate dissolution at low pH and
CaCO3 dissolution in the upper pH range. Buffering at intermediate pH (5.0 to 7.5), which is of
more interest in agriculture, is mainly by cation exchange reactions in which functional groups
associated primarily with variable-charge minerals and soil organic matter act as sinks for H+ and
OH- ions. The buffering that occurs because of organic matter is from the weakly acidic
carboxylic and phenolic functional groups (Neilsen et al., 1995; Curtin et al., 1996; Curtin &
Ukrainetz, 1997, Weaver et al., 2004).
Currently limited information is available on the soil properties that govern the soil BC of South
African soils. Steinke et al. (2004) found in a study of 35 surface soils of rural and community
farmers in the Eastern Cape Province of South Africa, that the soil BC was related primarily to
6

66
soil organic carbon, extractable acidity (Al + H) and goethite. In the United Kingdom, soil texture
and organic matter content have been used to derive buffer capacity (Bache, 1988; Aitken et al.,
1990), with soil BC increasing as clay and organic matter increase. Although the effect of liming
on soil BC on two lime-amended soils in the study area was evaluated in Chapter 3, the relative
importance of soil properties in determining the soil BC of soils in the Mpumalanga Province of
South Africa has yet to be ascertained. Therefore, in order to assist in the prediction of
management strategies (e.g. maintenance lime requirements, acidification rates) the project was
extended to other soils outside the experimental plots. In this study the relationships between
soil properties and soil BCs for 80 acidic soils from the Mlondozi district of Mpumalanga were
investigated. The objectives of the study were to (i) determine soil BC, and (ii) examine the
relationships between soil BC and selected soil properties.
6.2 MATERIAL AND METHODS
6.2.1 Soils
The data used in this study were collected from a total of 80 topsoil (0-250 mm) samples in the
Mlondozi district. The soils represented the most dominant soil forms, namely Clovelly (Xantic
Ferralsols) and Magwa (Humic Ferralsols), with the Hutton (Rhodic Ferralsols) and Inanda
(Humic Umbrisols; FAO-ISS-ISRIC, 1998) soil forms subdominant (Booyens et al., 2000).
6.2.2 Soil analysis
Topsoil samples were air-dried and ground to pass through a 2 mm sieve. A particle size
analysis was performed on the <2 mm soil fraction using the pipette method (Gee & Bauder,
1986). The cation exchange capacity (CEC) was determined with 1 mol dm-3 ammonium acetate
(NH4OAc) extraction at pH 7. The Walkley-Black method was used for the determination of
organic carbon (Walkley & Black, 1934). Extractable acidity (H + Al) and Al were determined in a
1 mol dm-3 potassium chloride (KCl) extraction and titration with 0.1 M NaOH. Extractable Al was
determined in the same extract by complexing it by adding 10 cm3 NaF to the titrate, and titrating
again to an end point. Soil pH (H2O) and pH (KCl) were determined in 2:5 (soil:water) and (KCl)
suspension, respectively, using a combined calomel reference glass electrode and pH meter
(Reeuwijk, 2002). Free oxides of iron, aluminium and manganese in soils were determined by
heating 4 g of soil in a water-bath at 77 ˚C in a Na-citrate/Na-bicarbonate/Na-dithionite solution
(CBD-method) and the amount of Fe, Al and Mn recorded by atomic absorption (The Non-
Affiliated Soil Analysis Work Committee, 1990).

67
6.2.3 Potentiometric titration curves
Potentiometric titrations (Ponizovskiy & Pampura, 1993) were performed on samples that were
equilibrated overnight with 1 M KCl. Each soil sample was suspended in 100 ml 1 M KCl, stirred
and left overnight. The suspension was titrated with 0.05 M NaOH whilst being stirred on a
Metrohm potentiograph to a pH of 8.5. The titration rate was 0.667 ml minute-1. For each soil a
linear regression function was fitted to the relationship between 0.05 M NaOH added and soil pH.
Equation 6.1, revised from Bache (1988), was used to determine soil buffer capacity (soil BC).
Soil BC (cmolc kg-1 soil pH unit-1) = Δ (OH-)/ΔpH [6.1]
where ΔpH is the change in pH (pH unit) due to the addition of Δ (OH-) (cmolc kg soil-1) of base
(NaOH).
Bache (1988) showed that the soil BC of any given soil is not constant over the whole pH range.
Therefore in order to evaluate the effect, the soil BC was determined over limited pH ranges,
namely <4.5, 4.5-6.5, 6.5-8.5 and 4.5-8.5.
6.2.4 X-ray diffraction analysis
Because soil BC is strongly affected by the content and type of clay minerals, the x-ray diffraction
analyses were performed on soil samples. The samples were prepared according to the method
described by Jackson (1956). X-ray diffraction (XRD) analyses were carried out on a PANalytical
X’pert Pro system unit with a MPPC generator (PW 3050/609theta/theta) goniometer. Standard
experimental conditions were 40 kV, 35 mA, a scanning speed of 10 min/45˚ 2θ and a sample
spinning speed 8 sec revolution-1. Relative intensities or peak heights and the width at half
height of X-ray diffraction peaks were used to produce estimates of the approximate amounts of
minerals present in the sample and are expressed as percentages of the total clay-size fraction.
6.2.5 Statistical analysis
Soil BC was determined over limited pH ranges, namely <4.5, 4.5-6.5, 6.5-8.5 and 4.5-8.5, and
correlated with selected soil properties using Pearson’s coefficient of correlation. The latter also
known as the product moment correlation coefficient, is a measure of the linear relationship
between two random variates (-1<r<1) (Draper & Smith, 1981). Forward Selection Stepwise
Regression was used to find those soil properties most responsible for describing the variation
found in soil BC. Principal Component Analysis (PCA) was applied to the soil data in order to
identify the interrelationship between the main variates that explained the soil BC, and therefore

68
to simplify the interpretation of the soil characteristic data. All statistical analyses were done
using GenStat (2003).
6.3 RESULTS AND DISCUSSION
6.3.1 Soil characteristics
Some of the physical and chemical properties of the experimental soils are reported in Table 6.1.
The soils used in this study represent a wide range of properties. The mean pH (KCl) was 1.20
times lower than the mean soil pH (H2O), indicating that the soils used in the study contained a
considerable amount of reserve acidity.
Table 6.1 The range of selected soil physical and chemical topsoil (0-250 mm) properties1
for the experimental soils
Soil property Range Classes per soil property
1 2 3 4
pH (H2O) 4.60-7.54 <5.0 (13)2 5.0-5.5 (34) 5.5-6.0 (23) >6.0 (10)
pH (KCl) 3.72-6.42 <4.0 (31) 4.0-4.5 (32) 4.5-5.0 (9) >5.0 (8)
Extractable Al (cmolc kg-1) 0-1.87 <0.5 (48) 0.5-1.0 (23) 1.0-1.5 (7) >1.5 (2)
Extractable acidity (cmolc kg-1) 0-2.61 <0.5 (39) 0.5-1.5 (35) 1.5-2.5 (5) >2.5 (1)
Acid saturation (%) 0-93.50 <20 (38) 20-40 (11) 40-60 (22) >60 (9)
Organic C (%) 1.13-9.14 <1.5 (9) 1.5-2.0 (24) 2.0-3.0 (35) >3.0 (12)
Clay (%) 8.30-53.10 <20 (6) 20-30 (21) 30-40 (37) >35 (16)
BC4.5-8.5 (cmolc kg-1 pH unit-1) 0.12-2.23 <0.25 (9) 0.25-0.5 (16) 0.5-1.0 (35) >1.00 (20)
CEC (cmolc kg-1) 3.34-15.5 <5.0 (14) 5.0-7.5 (39) 7.5-10.0 (13) >10.0 (14)
CBD-Al (%) 0.06-2.43 <0.5 (26) 0.5-1.0 (38) 1.0-1.5 (11) >1.5 (5)
CBD-Fe (%) 0.38-7.11 <1.5 (25) 1.5-3.0 (35) 3.0-4.5 (12) >4.5 (8)
Kaolinite (%) 32-91 <40 (2) 40-60 (39) 60-80 (36) >80 (5)
Quartz (%) 0-52 <15 (35) 15-30 (36) 30-45 (7) >45 (2)
Gibbsite (%) 0-44 <5 (51) 5-15 (16) 15-25 (8) >25 (5)
Goethite (%) 0-30 <5 (26) 5-10 (18) 10-15 (23) >15 (13)
Mica (%) 0-9 <3 (49) 3-6 (22) 6-9 (9) >9 (0) 1 According to the The Non-Affilliated Soil Analysis Work Committee (1990)
2 Number of soils per class
The relatively high level of organic C indicated in Table 6.1 is the result of moderate annual
temperature and high rainfall which reduces the decomposition and mineralization rates. The
CEC of the soils varied from to medium (3.34 to 15.5 cmolc kg-1) with a mean of 6.5 cmolc kg-1.

69
The dominant clay mineral was kaolinite. Kaolinite is a low activity clay which has little or no
permanent charge and therefore little capacity to buffer soil pH (Bloom, 2000). Soil BC data
shown in Table 6.1 are comparable with the normal range found in the literature (0.38-1.34; De
Sá Mendonça et al., 2005).
6.3.2 Potentiometric titration curves
Figure 6.1 illustrates combined data titration curves for the main soil forms found in the study
area. Titration curves followed the same general pattern as reported for surface soil horizons
(Magdoff et al., 1987; Steinke et al., 2004).
3.5
4.0
4.5
5.0
5.5
6.0
6.5
7.0
7.5
8.0
8.5
0 1 2 3 4 5 6
cmol (OH-) kg soil-1
pH in
sol
utio
n
Clovelly Hutton Magwa Inanda
Figure 6.1 Combined titration curves for the dominant soil types.
The Hutton, Magwa and Inanda soils tended to be relatively moderately buffered in the midrange
(pH 5.25-7.50) with no clear lower asymptotes and an upper asymptote up to pH 8.5. The
Clovelly soil forms tended to be very poorly buffered by comparison. Similar results were found
by Magdoff et al. (1987) for B and E horizons which tended to be moderately buffered to
unbuffered in the midrange, compared to O horizons which tended to be strongly buffered in the
midrange. The Inanda soils showed a tendency to be well buffered (Figure 6.1). Steinke et al.
(2004) ascribed the differences in soil BC to the organic C content of the soils, where sites with
poor buffering had a mean organic C content of 3.3% compared to 10.9% for well-buffered soils.
However, in this study the organic C content varied over a relatively small range (Table 6.2). The
differences in the titration curves and resultant soil BC can probably be ascribed to a combination

70
of different factors, of which the differences in extractable acidity (0.34 vs 1.07 cmolc kg-1) and Al
(0.25 vs 0.77 cmolc kg-1) that were observed between the soil forms, could make substantial
contributions.
Table 6.2 Mean values of selected soil physical and chemical topsoil (0-250 mm)
properties1 for the dominant soil forms
Soil property Soil form
Clovelly Hutton Magwa Inanda
pH (H2O) 5.68 5.55 5.19 5.13
pH (KCl) 4.41 4.40 3.99 4.03
Extractable Al (cmolc kg-1) 0.25 0.39 0.62 0.77
Extractable acidity (cmolc kg-1) 0.34 0.42 0.94 1.07
Acid saturation (%) 18.45 20.14 46.98 43.90
Organic C (%) 1.90 1.81 2.38 2.60
Clay (%) 29.41 30.36 33.97 40.56
BC4.5-8.5 (cmolc kg-1 pH unit-1) 0.53 0.68 0.86 1.13
CEC (cmolc kg-1) 6.32 5.86 7.86 9.19
CBD-Al (%) 0.58 0.62 0.77 0.89
CBD-Fe (%) 1.77 3.15 3.81 2.12
CBD-Mn (%) 0.005 0.009 0.004 0.012
Kaolinite (%)2 64.18 54.00 61.95 61.30
Quartz (%)2 19.50 16.43 16.57 12.00
Gibbsite (%)2 2.86 0.00 8.90 10.20
Goethite (%)2 10.11 14.71 6.43 10.40
Mica (%)2 2.32 2.57 2.33 2.00 1 According to the The Non-Affilliated Soil Analysis Work Committee (1990)
2 % of total clay
6.3.3 Soil buffer capacity over limited pH ranges vs soil properties
The relationships between soil BC for different soil pH ranges and selected soil properties are
presented in Table 6.3. It was found that all soil BCs were highly significantly (P<0.001)
correlated with clay content, log organic C content, extractable Al and acidity, log CBD-Al and Fe,
and CEC, and to a lesser extent with pH (H2O & KCl), CBD-Mn and gibbsite.
However, the soil BC of any given soil is not constant over the whole pH range (Bache, 1988;
see Chapter 3). The buffer capacity reactions in soils include proton desorption and adsorption
reactions by mineral and organic minerals, as well as ion exchange, dissolution and precipitation
71
reactions. Some of the soil components are effective in buffering over a wide range of pH values,
while others are effective over a limited pH range (Bloom, 2000). Therefore, the relationship of
soil BC, over limited pH ranges, with selected soil properties needed to be further evaluated.
Soil BC (pH<4.5): The correlation matrix (Table 6.3) reveals that extractable acidity and Al was
the best correlated with soil BC(pH<4.5), followed by organic C and clay content (all P < 0.001).
Previous studies showed that the soil BC increases as pH drops below 4.5. This is mainly due to
Al buffering, proton adsorption by clays and hydrous oxides (Bache, 1988; Bloom, 2000; Kauppi
et al., 1986). The significant correlation of organic C and clay content with soil BC(pH<4.5) is
consistent with previous studies which showed that both of these parameters buffer pH over a
wide range of pH values (Bloom, 2000; Magdoff et al., 1987; Weaver et al., 2004). In acid
mineral soils, many of the –COOH sites in soil organic matter are taken up by Al3+ and this
strongly bound Al has a large effect on buffering.
Soil BC (pH4.5-6.5): Soil properties found to correlate highly significantly (P<0.001) with soil
BC(pH4.5-6.5), were extractable acidity and Al, which can be regarded as the primary buffering
mechanism, followed by clay, CBD-Al, organic C and CBD-Fe. This is somewhat contradictory
to the statement of Bache (1988) who reported that for most surface soils, pH-dependent charge
associated with organic matter is the main buffering mechanism over the pH range 4.5-6.5.
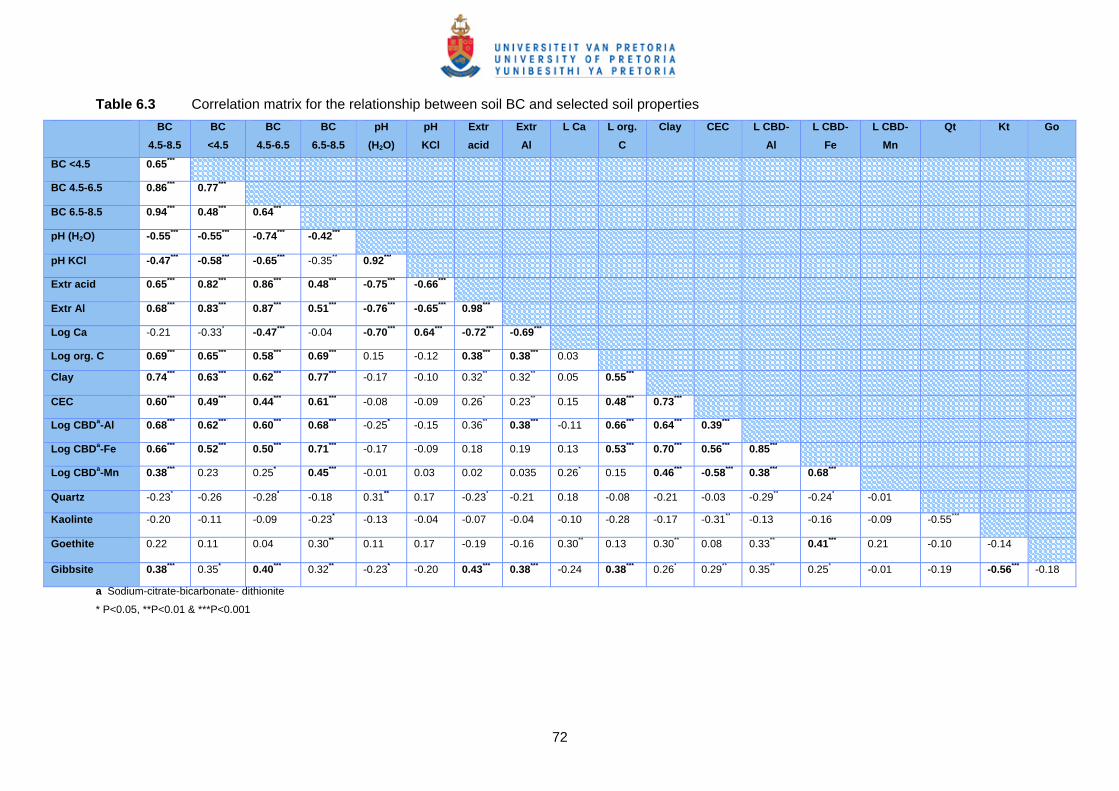
72
Table 6.3 Correlation matrix for the relationship between soil BC and selected soil properties
BC4.5-8.5
BC<4.5
BC 4.5-6.5
BC6.5-8.5
pH(H2O)
pH KCl
Extr acid
Extr Al
L Ca L org. C
Clay CEC L CBD-Al
L CBD-Fe
L CBD-Mn
Qt Kt Go
BC <4.5 0.65***
BC 4.5-6.5 0.86*** 0.77***
BC 6.5-8.5 0.94*** 0.48*** 0.64***
pH (H2O) -0.55*** -0.55*** -0.74*** -0.42***
pH KCl -0.47*** -0.58*** -0.65*** -0.35** 0.92***
Extr acid 0.65*** 0.82*** 0.86*** 0.48*** -0.75*** -0.66***
Extr Al 0.68*** 0.83*** 0.87*** 0.51*** -0.76*** -0.65*** 0.98***
Log Ca -0.21 -0.33* -0.47*** -0.04 -0.70*** 0.64*** -0.72*** -0.69***
Log org. C 0.69*** 0.65*** 0.58*** 0.69*** 0.15 -0.12 0.38*** 0.38*** 0.03
Clay 0.74*** 0.63*** 0.62*** 0.77*** -0.17 -0.10 0.32** 0.32** 0.05 0.55***
CEC 0.60*** 0.49*** 0.44*** 0.61*** -0.08 -0.09 0.26* 0.23** 0.15 0.48*** 0.73***
Log CBDa-Al 0.68*** 0.62***` 0.60*** 0.68*** -0.25* -0.15 0.36** 0.38*** -0.11 0.66*** 0.64*** 0.39***
Log CBDa-Fe 0.66*** 0.52*** 0.50*** 0.71*** -0.17 -0.09 0.18 0.19 0.13 0.53*** 0.70*** 0.56*** 0.85***
Log CBDa-Mn 0.38*** 0.23 0.25* 0.45*** -0.01 0.03 0.02 0.035 0.26* 0.15 0.46*** -0.58*** 0.38*** 0.68***
Quartz -0.23* -0.26 -0.28* -0.18 0.31** 0.17 -0.23* -0.21 0.18 -0.08 -0.21 -0.03 -0.29** -0.24* -0.01
Kaolinte -0.20 -0.11 -0.09 -0.23* -0.13 -0.04 -0.07 -0.04 -0.10 -0.28 -0.17 -0.31** -0.13 -0.16 -0.09 -0.55***
Goethite 0.22 0.11 0.04 0.30** 0.11 0.17 -0.19 -0.16 0.30** 0.13 0.30** 0.08 0.33** 0.41*** 0.21 -0.10 -0.14
Gibbsite 0.38*** 0.35* 0.40*** 0.32** -0.23* -0.20 0.43*** 0.38*** -0.24 0.38*** 0.26* 0.29** 0.35** 0.25* -0.01 -0.19 -0.56*** -0.18
a Sodium-citrate-bicarbonate- dithionite
* P<0.05, **P<0.01 & ***P<0.001
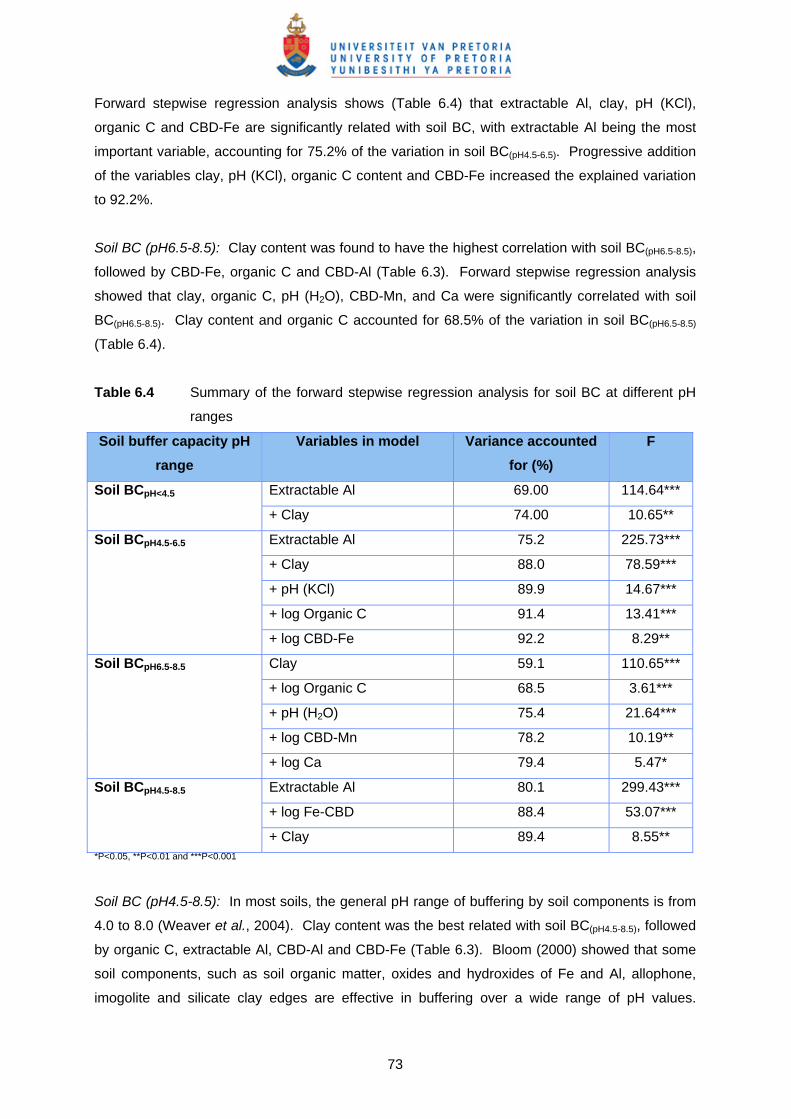
73
Forward stepwise regression analysis shows (Table 6.4) that extractable Al, clay, pH (KCl),
organic C and CBD-Fe are significantly related with soil BC, with extractable Al being the most
important variable, accounting for 75.2% of the variation in soil BC(pH4.5-6.5). Progressive addition
of the variables clay, pH (KCl), organic C content and CBD-Fe increased the explained variation
to 92.2%.
Soil BC (pH6.5-8.5): Clay content was found to have the highest correlation with soil BC(pH6.5-8.5),
followed by CBD-Fe, organic C and CBD-Al (Table 6.3). Forward stepwise regression analysis
showed that clay, organic C, pH (H2O), CBD-Mn, and Ca were significantly correlated with soil
BC(pH6.5-8.5). Clay content and organic C accounted for 68.5% of the variation in soil BC(pH6.5-8.5)
(Table 6.4).
Table 6.4 Summary of the forward stepwise regression analysis for soil BC at different pH
ranges
Soil buffer capacity pH range
Variables in model Variance accounted for (%)
F
Soil BCpH<4.5 Extractable Al 69.00 114.64***
+ Clay 74.00 10.65**
Soil BCpH4.5-6.5 Extractable Al 75.2 225.73***
+ Clay 88.0 78.59***
+ pH (KCl) 89.9 14.67***
+ log Organic C 91.4 13.41***
+ log CBD-Fe 92.2 8.29**
Soil BCpH6.5-8.5 Clay 59.1 110.65***
+ log Organic C 68.5 3.61***
+ pH (H2O) 75.4 21.64***
+ log CBD-Mn 78.2 10.19**
+ log Ca 79.4 5.47*
Soil BCpH4.5-8.5 Extractable Al 80.1 299.43***
+ log Fe-CBD 88.4 53.07***
+ Clay 89.4 8.55** *P<0.05, **P<0.01 and ***P<0.001
Soil BC (pH4.5-8.5): In most soils, the general pH range of buffering by soil components is from
4.0 to 8.0 (Weaver et al., 2004). Clay content was the best related with soil BC(pH4.5-8.5), followed
by organic C, extractable Al, CBD-Al and CBD-Fe (Table 6.3). Bloom (2000) showed that some
soil components, such as soil organic matter, oxides and hydroxides of Fe and Al, allophone,
imogolite and silicate clay edges are effective in buffering over a wide range of pH values.

74
Organic matter is a very important component of pH buffering in surface soils, even in typical
upland soils that contain very little soil organic matter (Bloom, 2000). Carboxylic acids found in
soils appear to have a range of pKa values, and so contribute to buffering over the pH range from
2.0 to 7.0. The similar relationship between soil BC(pH4.5-8.5) and clay content (r = 0.74) and
between soil BC(4.5-8.5) and organic C (r = 0.69) was surprising. Previous studies showed that
organic matter may have a buffer capacity >300 times that of kaolinite clays (Bache, 1988; Aitken
et al., 1990).
Gibbsite, although not one of the primary soil properties related to soil BC(pH4.5-8.5), correlated
significantly with soil BC(pH4.5-8.5) (Table 6.3). Oxides and hydroxides that accumulate in soils
upon weathering are important mechanisms in the pH buffering of soils, particularly in highly
weathered soils (Uehara & Gillman, 1982). The most common Al hydroxide mineral in highly
weathered soils is gibbsite, [Al(OH)3] (Bloom, 2000).
Multiple regression shows (Table 6.4) that extractable Al accounted for 80.1% of the variation in
soil BC(pH4.5-8.5). Progressive addition of the variables Fe-CBD and clay content increased the
explained variation to 89.4%.
6.3.4 Interrelationships between soil properties contributing to soil BC
Principal component analysis (PCA) was used to examine the interrelationships between the
major soil properties contributing to soil BC(pH4.5-8.5). The first axis, score [1] (SC [1]), explained
50.35% of the variation in the entire dataset, and the second axis, score [2] (SC [2]), explained
29.54% of the remaining variation. Axis 3, score [3] (SC [3]), only explained 9.68%. Table 6.5
shows which soil properties contribute to which axis. Soil BC, pH (H2O), pH (KCl), extractable
acidity and Al, acid saturation, log Ca and Mg were the strongest correlated with SC [1] and to a
lesser extent correlated to SC [2] and SC [3], and will therefore contribute to SC [1] as indicated
in Figure 6.2 (a-c). Similarly clay, CEC, log CBD-Fe and CBD-Mn were the strongest correlated
with SC [2] and therefore will contribute to SC [2] (Figure 6.2 (a-c)).
The first axis (SC [1], x) was found to be positively related to buffer capacity, extractable acidity
and Al, and acid saturation, and negatively related to pH (H2O), pH (KCl), log Ca and Mg (Table
6.5). Axis 2 (SC [2], y), on the other hand, is positively related to mostly log C, clay, CEC, log
CBD-Al, log CBD-Fe, and log CBD-Mn. The third axis (SC [3], y) is positively related to quartz
and negatively related to kaolinite.
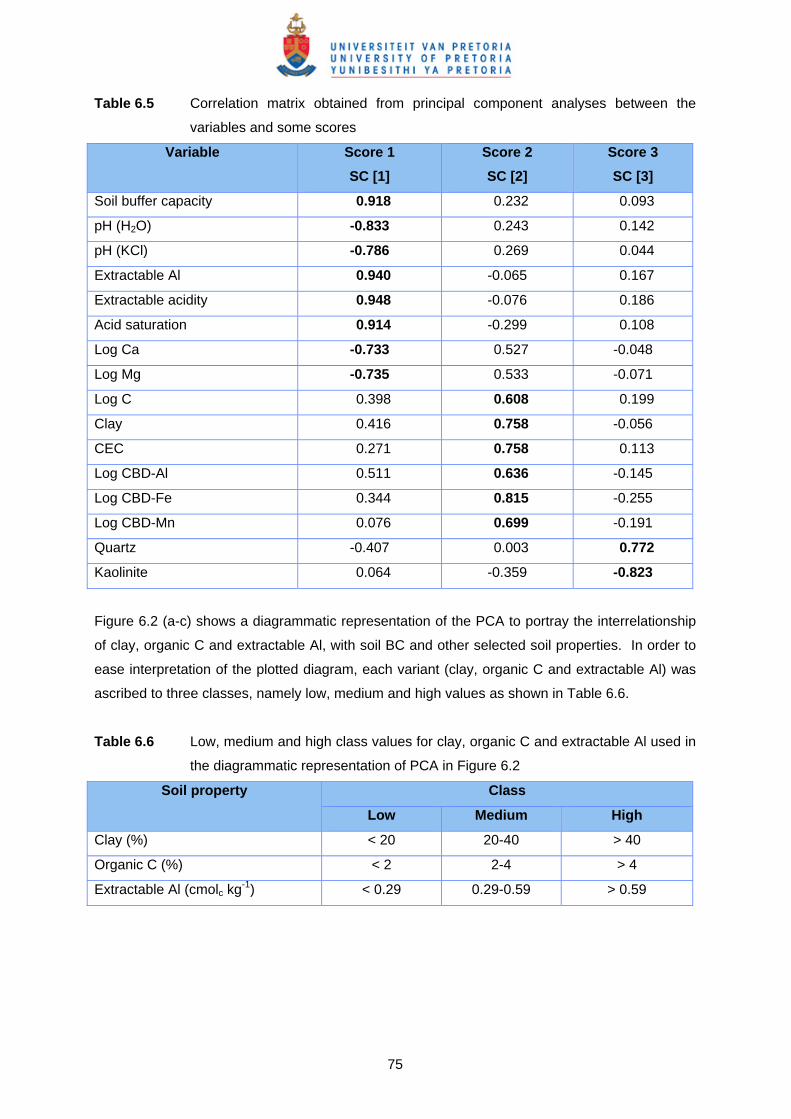
75
Table 6.5 Correlation matrix obtained from principal component analyses between the
variables and some scores
Variable Score 1 SC [1]
Score 2 SC [2]
Score 3 SC [3]
Soil buffer capacity 0.918 0.232 0.093
pH (H2O) -0.833 0.243 0.142
pH (KCl) -0.786 0.269 0.044
Extractable Al 0.940 -0.065 0.167
Extractable acidity 0.948 -0.076 0.186
Acid saturation 0.914 -0.299 0.108
Log Ca -0.733 0.527 -0.048
Log Mg -0.735 0.533 -0.071
Log C 0.398 0.608 0.199
Clay 0.416 0.758 -0.056
CEC 0.271 0.758 0.113
Log CBD-Al 0.511 0.636 -0.145
Log CBD-Fe 0.344 0.815 -0.255
Log CBD-Mn 0.076 0.699 -0.191
Quartz -0.407 0.003 0.772
Kaolinite 0.064 -0.359 -0.823
Figure 6.2 (a-c) shows a diagrammatic representation of the PCA to portray the interrelationship
of clay, organic C and extractable Al, with soil BC and other selected soil properties. In order to
ease interpretation of the plotted diagram, each variant (clay, organic C and extractable Al) was
ascribed to three classes, namely low, medium and high values as shown in Table 6.6.
Table 6.6 Low, medium and high class values for clay, organic C and extractable Al used in
the diagrammatic representation of PCA in Figure 6.2
Soil property Class
Low Medium High
Clay (%) < 20 20-40 > 40
Organic C (%) < 2 2-4 > 4
Extractable Al (cmolc kg-1) < 0.29 0.29-0.59 > 0.59

76
Figure 6.2 PCA evaluating the interrelationships between (a) clay content, (b) carbon
content, and (c) extractable Al with soil BC and other soil properties.
-6
-4
-2
0
2
4
6
-6 -4 -2 0 2 4 6
First PC scores (SC [1])
Seco
nd P
C s
core
s (S
C[2
])
Low Medium High
High Soil buffer capacity LowAcid saturation
Extractable acidityExtractable Al
Low Soil pH (H2O & KCl) HighMgCa
Low
C
lay
H
igh
CE
C
CB
D-F
e C
BD
-Mn
-6
-4
-2
0
2
4
6
-6 -4 -2 0 2 4 6First PC scores (SC [1])
Sec
ond
PC s
core
s (C
S [2
])
Low Medium High
High Soil buffer capacity LowAcid saturation Extractable Al
Extractable acidity
Low Soil pH (H2O & KCl) HighMgCa
Low
Cla
y
Hig
hC
EC
CB
D-F
e C
BD
-Mn
-6
-4
-2
0
2
4
6
-6 -4 -2 0 2 4 6First PC scores (SC [1])
Seco
nd P
C s
core
s (S
C [2
])
Low Medium High
Low
Cla
y
H
igh
CE
CC
BD
-Fe
CB
D-M
n
High Soil buffer capacity LowAcid saturation Extractable Al
Extractable acidity
Low Soil pH (H2O & KCl) HighMgCa
(c)
(b)
(a)

77
Clay content: Figure 6.2 (a) shows no clear patterns with clay classes and SC [1] components.
Clay content classes (low, medium and high) ranged from one extreme to the other (e.g. low soil
BC to high BC) on the first score axis (SC [1]). This shows that no clear distinction could be
made between clay content and first score components (e.g. soil BC, extractable acidity and Al),
indicating that high clay contents could be associated with either low or high soil BC. However, a
trend between clay classes and SC [2] components (e.g. log C, clay, CEC, log CBD-Al) was
found (Figure 6.2 (a)) showing that soils with a low clay content (<20%) were associated with low
CEC, CBD-Fe and CBD-Mn contents and soils with a high clay content (>40%) had high CEC,
CBD-Fe and CBD-Mn values.
Organic C: No clear patterns between low, medium and high organic C content and both of the
SC [1] and SC [2] components were observed in the studied soils (Figure 6.2 (b)).
Extractable Al: Figure 6.2 (c) shows that the low extractable Al class (<0.29 cmolc kg-1) is
associated with low soil BC, extractable acidity and acid saturation values, and high pH (H2O &
KCl), Ca and Mg values. As the extractable Al increased, shown by the class high in extractable
Al (>0.59 cmolc kg-1), the soil BC increased and the soil pH, Ca and Mg contents decreased.
This shows that no clear distinction could be made between extractable Al and SC [2]
components (Figure 6.2 (c)).
6.3.5 Relationship between dominant soil forms and selected soil properties
Figure 6.3 shows the interrelationship of dominant soil forms in the study area and selected soil
properties. Although no clear clusters were observed, trends with soil type and soil properties
were observed. It was found that Clovelly and Hutton soils tended to have lower soil BC,
extractable Al (or acidity) and acid saturation values, and higher pH (H2O & KCl), Ca and Mg
values. Magwa and Inanda soil forms had higher soil BC, higher extractable Al (or acidity) and
acid saturation values, and lower pH (H2O & KCl), Ca and Mg values.
Figure 6.3 further shows that Clovelly soils tended to have lower clay, CBD-Fe and CBD-Mn
contents, while Hutton soils tended to be higher in clay, CBD-Fe and CBD-Mn. No clear clusters
were evident from the SC [2] components in Figure 6.3 for Magwa and Inanda soils, with clay,
CBD-Fe and CBD-Mn contents extending from low to high values in the Magwa and Inanda soils.
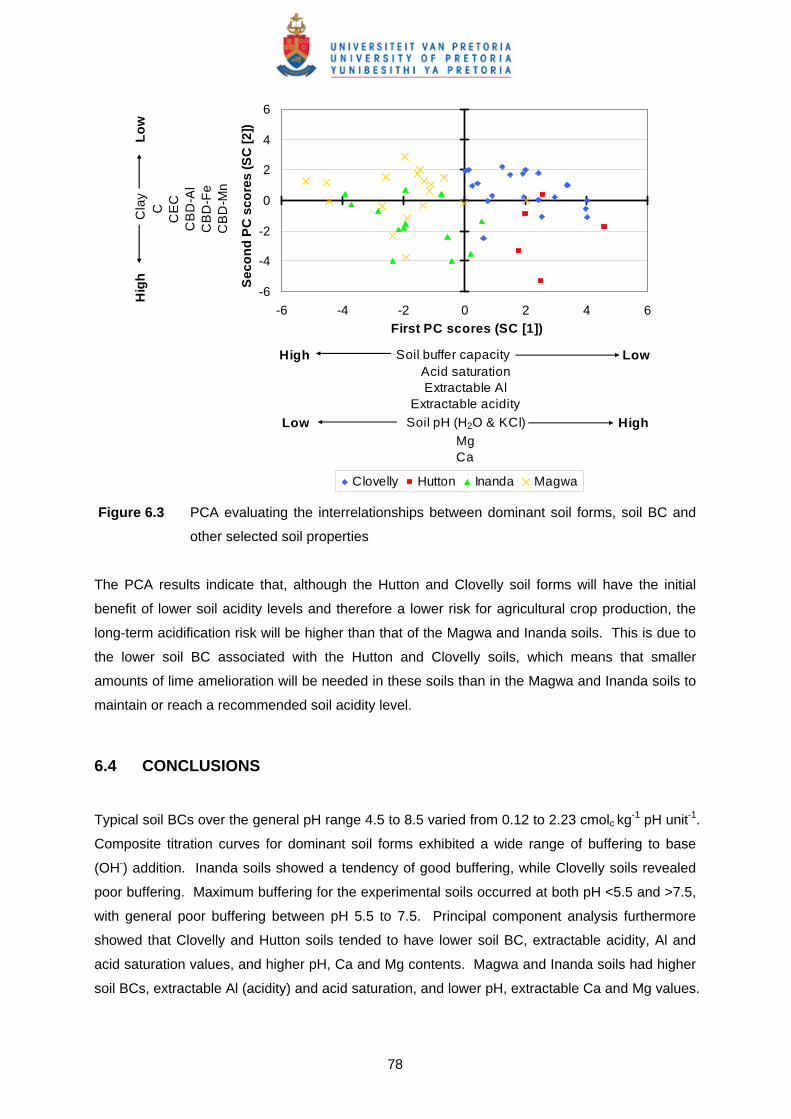
78
-6
-4
-2
0
2
4
6
-6 -4 -2 0 2 4 6
First PC scores (SC [1])
Seco
nd P
C s
core
s (S
C [2
])
Clovelly Hutton Inanda Magwa
High Soil buffer capacity LowAcid saturation Extractable Al
Extractable acidity
Low Soil pH (H2O & KCl) HighMgCa
Hig
h
Cla
y
Low
CC
EC
CB
D-A
lC
BD
-Fe
CB
D-M
n
Figure 6.3 PCA evaluating the interrelationships between dominant soil forms, soil BC and
other selected soil properties
The PCA results indicate that, although the Hutton and Clovelly soil forms will have the initial
benefit of lower soil acidity levels and therefore a lower risk for agricultural crop production, the
long-term acidification risk will be higher than that of the Magwa and Inanda soils. This is due to
the lower soil BC associated with the Hutton and Clovelly soils, which means that smaller
amounts of lime amelioration will be needed in these soils than in the Magwa and Inanda soils to
maintain or reach a recommended soil acidity level.
6.4 CONCLUSIONS Typical soil BCs over the general pH range 4.5 to 8.5 varied from 0.12 to 2.23 cmolc kg-1 pH unit-1.
Composite titration curves for dominant soil forms exhibited a wide range of buffering to base
(OH-) addition. Inanda soils showed a tendency of good buffering, while Clovelly soils revealed
poor buffering. Maximum buffering for the experimental soils occurred at both pH <5.5 and >7.5,
with general poor buffering between pH 5.5 to 7.5. Principal component analysis furthermore
showed that Clovelly and Hutton soils tended to have lower soil BC, extractable acidity, Al and
acid saturation values, and higher pH, Ca and Mg contents. Magwa and Inanda soils had higher
soil BCs, extractable Al (acidity) and acid saturation, and lower pH, extractable Ca and Mg values.

79
It can be concluded that the more strongly buffered Magwa and Inanda soils would require more
lime to neutralize soil acidity as compared to the Clovelly and Hutton soils with lower soil BC.
The current knowledge of the soils in the study area indicates that there is considerable diversity
in the dominant soils. Poor crop growth on Magwa and Inanda soils could be expected due to
low pH and Al toxicity. It is a well-known fact that liming and adequate rates of fertilizer
application are the most effective management strategies to overcome acidity and soil fertility
constraints to crop production. Unfortunately, due to the high soil BC values of these soils, huge
amounts of lime would be necessary to alleviate soil acidity. However, the Hutton and Clovelly
soils will be more prone to soil acidification than the Magwa and Inanda soils due to the lower soil
BCs of the former.

80
ASSESSING THE POTENTIAL SOIL ACIDIFICATION RISK UNDER
DRYLAND AGRICULTURE
7.1 INTRODUCTION
High soil acidity and Al saturation are two of the major factors responsible for sub-optimum and
growth of many crops in the Mlondozi district of Mpumalanga Province, South Africa. Highly
weathered acid soils have been formed under the natural processes of weathering and
acidification under high rainfall conditions. However, further acidification due to bases removed
by product removal or movement of cations associated with nitrate production may intensify the
soil acidity problem. Although the rate of these acidifying processes is slow under natural
conditions, agricultural production systems undergo accelerated soil acidification as a result of
anthropogenic inputs and outputs (Helyar, 1976; Helyar & Porter, 1989; Sumner & Noble, 2003).
The rate at which a production system acidifies is a function of the intrinsic soil properties (e.g.
base saturation, CEC, buffering capacity), climate, and farming practice. It is therefore important
that the rate of acid production in soils by these various inputs and outputs on different land uses
be known in order to facilitate corrective actions by the producer (Sumner & Noble, 2003). The
factors that contribute to soil acidification include the initial soil pH, soil BC, and the acidification
rate (Hill, 2003). In soil acidification risk assessment, as with most agricultural risk assessments,
a “problem” occurs when productivity, or the sustainability of productivity, is affected. This
happens when soil pH drops below a critical pH level. Identifying areas that are at high risk of
soil acidification is achieved through determining the number of years until the critical pH is
reached, given the value of each of the contributing risk factors at a geographical location within
the study area (Hill, 2003). It is therefore important that both the current soil pH and estimates of
the rate of acid addition to soils are known, to facilitate corrective action by land users. From a
strategic perspective, quantification of acid production rates under various agronomic production
systems can assist producers, extension officers, and policy makers in making decisions towards
preventing acidification and the long-term impact of a production system.
The current study was undertaken to determine the risk of soil acidification under crop production
in the Mlondozi district and to model soil acidification rates based on the measurement and
assumed acid inputs. The Mlondozi district formed part of a liming initiative that was started by
7
81
the MDACE. Soil acidity indices, soil BC and soil acidification rates were determined for soils
under crop production and natural rangeland used for cattle grazing. Furthermore, risk maps and
management tools were developed for land users and extension personnel to manage soil
acidification in a resource-poor farming area at Mlondozi.
7.2 MATERIAL AND METHODS 7.2.1 Study area
The Mlondozi district is situated between 26º 05’ S - 26º30’ S, and 30º44’ E - 31º00’ E and
occupies a total area of 54 000 ha (Map 7.1). This district is extremely hilly with altitudes varying
from 1 700 m in the north, dropping to 1 300 m centrally and rising to 1 580 m above sea level in
the south.
The long-term mean annual rainfall ranges between 893 to 992 mm from north to south.
Monthly average daily temperature ranges from 10.2ºC for the coldest month to 18.9ºC for the
hottest month. The acid soils developed on quartz monzonite of the Mpuluzi Granite formation
and the predominant clay mineral in the study area is kaolinite. Because kaolinitic clays have a
relatively low CEC and consequently a low buffer capacity (Coleman & Thomas, 1964), most of
the district is at high risk of soil acidification. The soils are inherently low in bases and high in
kaolin and aluminium hydroxide.

82
Map 7.1 Location of study area and spatial distribution of sample points.
83
7.2.2 Soil sampling and analysis
Representative soil samples were collected from two land uses, namely natural rangeland
(natural grazing; 24 samples, ≈ 50 000 ha)) and dryland crop production (66 samples, ≈ 4 000
ha). Map 7.1 indicates the spatial distribution of sample points. The sampled soils represented
the most dominant soil forms, namely Magwa (Humic Ferralsols) and Clovelly (Xantic Ferralsols),
with Inanda (Humic Umbrisols) and Hutton (Rhodic Ferralsols; FAO-ISS-ISRIC, 1998) soil forms
subdominant.
Topsoil samples (0-250 mm) were air-dried at 23˚C and ground to pass through a 2 mm sieve. A
particle size analysis was performed on the <2 mm soil fraction using the pipette method. Cation
exchange capacity, soil organic carbon, extractable acidity and aluminium (Al), pH (H2O) and
(KCl), and free oxides of iron (Fe), Al and manganese (Mn) were determined according the
procedures of The Non-Affiliated Soil Analysis Work Committee (1990). The double buffer SMP
method of McLean et al. (1978) was used to determine the lime requirement of the soils.
7.2.3 Soil buffer capacity
Potentiometric titrations (Ponizovskiy & Pampura, 1993) were performed on samples that were
equilibrated overnight with 1 M KCl. A 50 g soil sample was suspended in 100 ml 1 M KCl,
stirred and left overnight. The suspension was titrated with 0.05 M NaOH whilst being stirred on
a Metrohm potentiograph to a pH of 8.5. The titration rate was 0.667 ml min-1. For each soil a
linear regression function was fitted to the relationship between 0.05 M NaOH added and the soil.
Equation 7.1, adapted from Bache (1988), was used to calculate soil buffer capacity (soil BC).
Soil BC (cmolc kg-1 soil pH unit-1) = Δ(OH-)/ Δ pH [7.1]
where ΔpH is the change in pH (pH unit) due to the addition of OH- (cmolc kg soil-1) as NaOH.
The soil BC calculated in Equation 7.1 was converted to (kmol H+ (ha250 mm)-1 (pH unit)-1) using
an average soil bulk density of 1300 kg m-3 using Equation 7.2 as suggested by Singh et al.
(2003):
Soil BC [(kmol H+ (ha250 mm)-1 (pH unit)-1)] = (BC x V x BD)/100 000 [7.2]
where V is volume of soil layer (m3 ha-1) to a depth of 250 mm; BD is bulk density (kg m-3) and
100 000 to convert cmol (H+) to kmol (H+).
84
7.2.4 Acid production loads (APL), acidification rates and maintenance liming
The acid production load (kmol H+ (ha250mm)-1 (year)-1) was calculated with Equation 7.3 as
described by Helyar and Porter (1989):
APL = (∆pH/∆t) x soil BC [7.3]
where ∆pH/∆t is the rate of pH decline (pH unit year-1).
The decrease in soil pH in one year (pH year-1) was calculated with Equation 7.4 as reported by
Singh et al. (2003), using the APL and soil BC:
ΔpH units year-1 = APL/soil BC [7.4]
The number of years required for a soil to reach a critical pH value where production losses are
likely to occur was calculated as expressed by Hill (2003) in Equation 7.5:
Time (years) = [(pH(current)- pH(critical)) x (soil BC)]/APL [7.5]
where pH(current) is the current pH, pH(critical) is the critical pH.
Maintenance liming was determined from the annual APL for the top 250 mm soil. This was
achieved using the assumption that 1 mole of CaCO3 neutralizes 2 moles of H+ in the soil (Ridley
et al., 1990; Dolling et al., 1994).
7.2.5 Spatial interpolation of soil properties and acidification risk
According to Hill (2003) the representation of spatial continuity of soil properties is possible by
depicting the surface continuously to show gradual variations in soil properties. ArcGIS 9 (ESRI,
2006) was used to interpolate map surfaces for selected soil properties such as pH (H2O), clay
content, organic C, CEC and soil BC from 100 field sample points using the Inverse Distance
Weighting interpolation method. Temporal simulation of pH changes was done using Equation
7.4 for soil pH in 2, 4, and 6 years from present pH (H2O) values, using an average APL of 3.70
kmol (H+) ha-1 year-1 for cultivated land. Since acidification risk is strongly dependent on land
use, cultivated fields were separated from natural veld by digitizing cultivated land from Spot5
imagery with a 10 m pixel size. Sample points that fell in cultivated fields were separated from
points falling on natural vegetation. The cultivated fields were then interpolated using inverse
distance weighting in ArcGIS 9.2 (ESRI, 2006).
85
In addition, the risk of pH decreasing below the critical pH value was evaluated by using Equation
7.5. Three risk classes were identified: class 1 indicates high-risk areas with pH values lower
than critical pH values; class 2 indicates moderate-risk areas expected to acidify to the critical pH
in less than 5 years; and class 3 is a low-risk area not expected to acidify to the critical pH within
5 years. The risk evaluation was carried out using inverse distance weighting in ArcGIS 9.2
(ESRI, 2006).
7.2.6 Statistical analysis
Data was analyzed using GenStat (2003). Pearson's correlations were calculated between all
variates measured. Forward Selection Stepwise Regression was used to find those soil
parameters most responsible for describing the variation found in soil BC measurements and
lime requirement. In order to statistically determine critical values of properties, two procedures
were followed:
(i) The broken-stick analysis procedure (GenStat, 2003) was used to statistically fit two straight
line segments through datasets that exhibited two distinct populations with linear
relationships per population.
(ii) Where the datasets exhibited a non-linear continuum, the Cate-Nelson procedure (Cate &
Nelson, 1971) was used to determine the critical level of the x variable.
7.3 RESULTS AND DISCUSSION
7.3.1 General and spatial soil characteristics
Table 7.1 indicates selected soil chemical and physical properties of the main land uses in
the area, namely crop production (mainly maize (Zea mays L.)) and natural rangeland (for
cattle and goat production).
In general, soils from both land uses were acidic, with mean pH (H2O) values of 5.53 and
5.37 for crop and rangeland soils, respectively. Natural rangeland soils were characterized
by low effective cation exchange capacities (ECEC), but exhibited appreciable variable
charge indicated by the difference [cation exchange capacity (CEC) – ECEC] (Table 7.1). In
this context, CEC refers to the value obtained with 1 M NH4OAC (pH 7) extraction, and
ECEC is the sum of extractable cations (Al3+ + H+ + Ca2+ + Mg2+ + K+ + Na+) (Sumner &
Noble, 2003).

86
Soils were medium to heavy textured, with medium to high organic C content (mean C
values of 2.44 and 2.10% for crop and rangeland soils, respectively; Table 7.1). Map 7.2 to
7.4 shows maps (1:200 000 scale) of interpolated organic C, clay and CEC values. In
general, the organic C, clay and CEC values were highest in the north towards Hartbeeskop
and in the south towards Diepdal and Fernie.
Table 7.1 Selected soil physical and chemical topsoil (0-250 mm) properties1 for the two
dominant land uses in the Mlondozi district
Soil property Land use Crop production Natural rangeland
Range Mean Median Range Mean Median pH (H2O) 4.60-7.54 5.53 5.46 4.69-6.18 5.37 5.30
pH (KCl) 3.72-6.42 4.31 4.16 3.87-5.24 4.11 4.07
Organic C (%) 1.14-9.14 2.44 2.30 1.13-3.18 2.10 2.03
Clay (%) 19-52 34 34 8-48 31 30
CEC (cmolc kg-1) 3.34-14.09 7.18 6.83 3.59-11.73 7.79 6.79
ECEC (cmolc kg-1) 0.78-12.72 4.99 4.58 2.62-10.31 6.00 5.31
Extractable acidity (cmolc kg-1) 0-2.61 0.60 0.42 0.05-1.50 0.68 0.56
Extractable Al (cmolc kg-1) 0-1.87 0.45 0.31 1-1.11 0.44 0.39
Acid saturation (%) 0-94 28 17 1-70 34 37
Soil BC (cmolc kg-1 pH unit-1) 0.22-1.91 0.75 0.71 0.21-1.54 0.68 0.59
CBD-Al (%) 0.23-2.43 0.82 0.73 0.24-1.24 0.57 0.45
CBD-Fe (%) 0.73-7.11 2.59 2.39 0.70-4.38 2.21 1.51
CBD-Mn (%) 0.00-0.02 0.006 0.005 0.00-0.04 0.007 0.003
Clay mineralogy (%)
- quartz
- kaolinite
- mica
- goethite
- gibbsite
0-52
32-91
0-9
0-30
0-44
18
62
2
10
6
17
63
0
11
0
7-33
42-79
0-8
0-22
0-16
17
62
3
8
6
16
60
3
9
5 1 According to the The Non-Affilliated Soil Analysis Work Committee (1990)
7.3.2 Soil buffer capacity
The soils in the study area were poor to well buffered (Steinke et al., 2004) with soil BC values
ranging from 0.124 to 2.217 cmolc kg-1 pH unit-1, and means of 0.68 (rangeland) to 0.75 (crop
production) cmolc kg-1 pH unit-1 (Table 7.1).
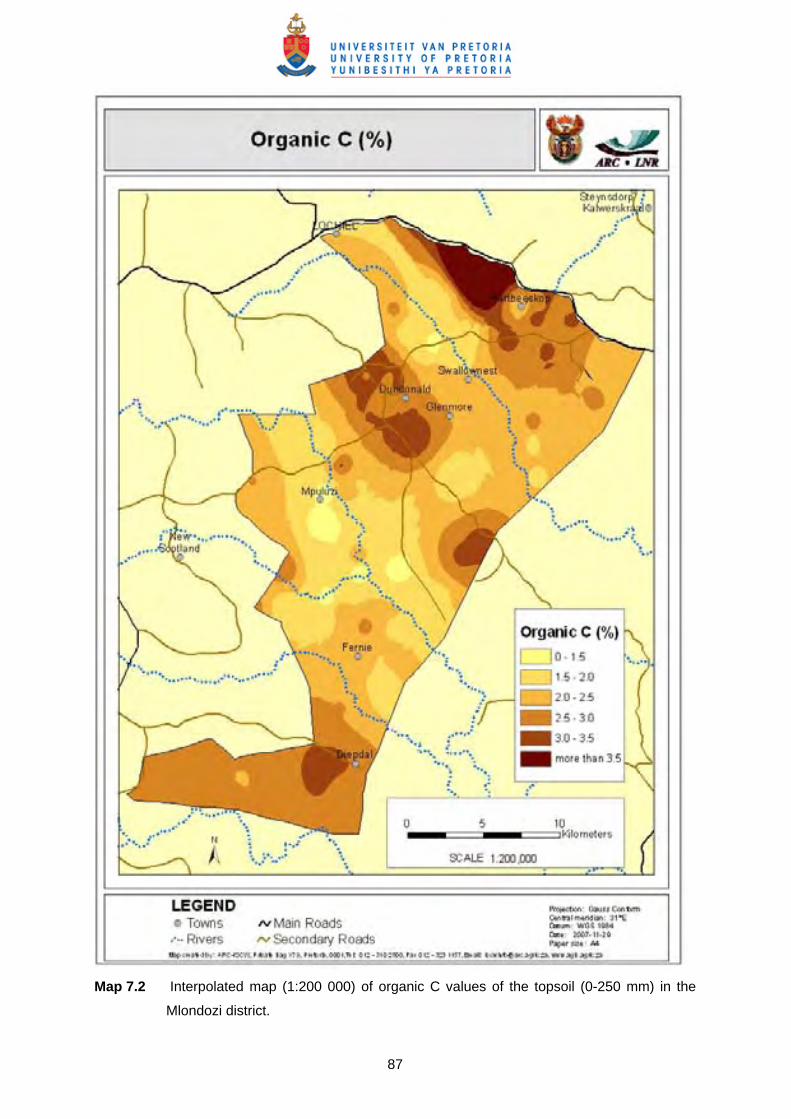
87
Map 7.2 Interpolated map (1:200 000) of organic C values of the topsoil (0-250 mm) in the
Mlondozi district.
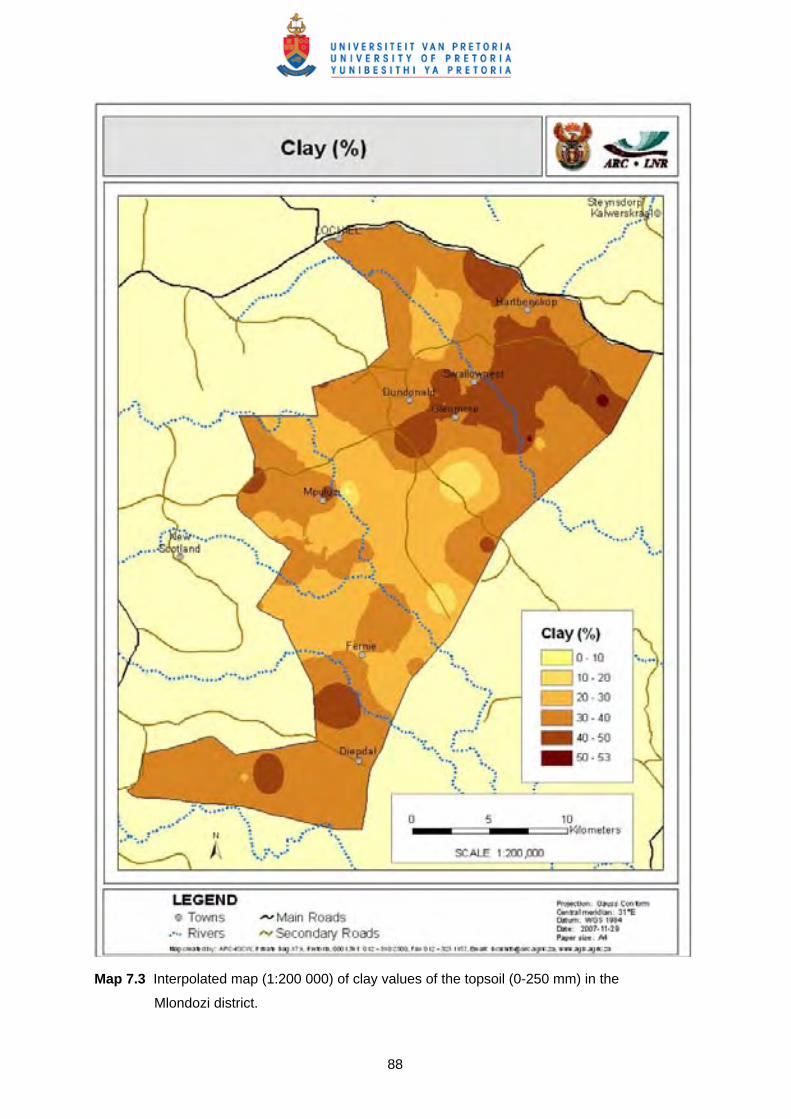
88
Map 7.3 Interpolated map (1:200 000) of clay values of the topsoil (0-250 mm) in the
Mlondozi district.
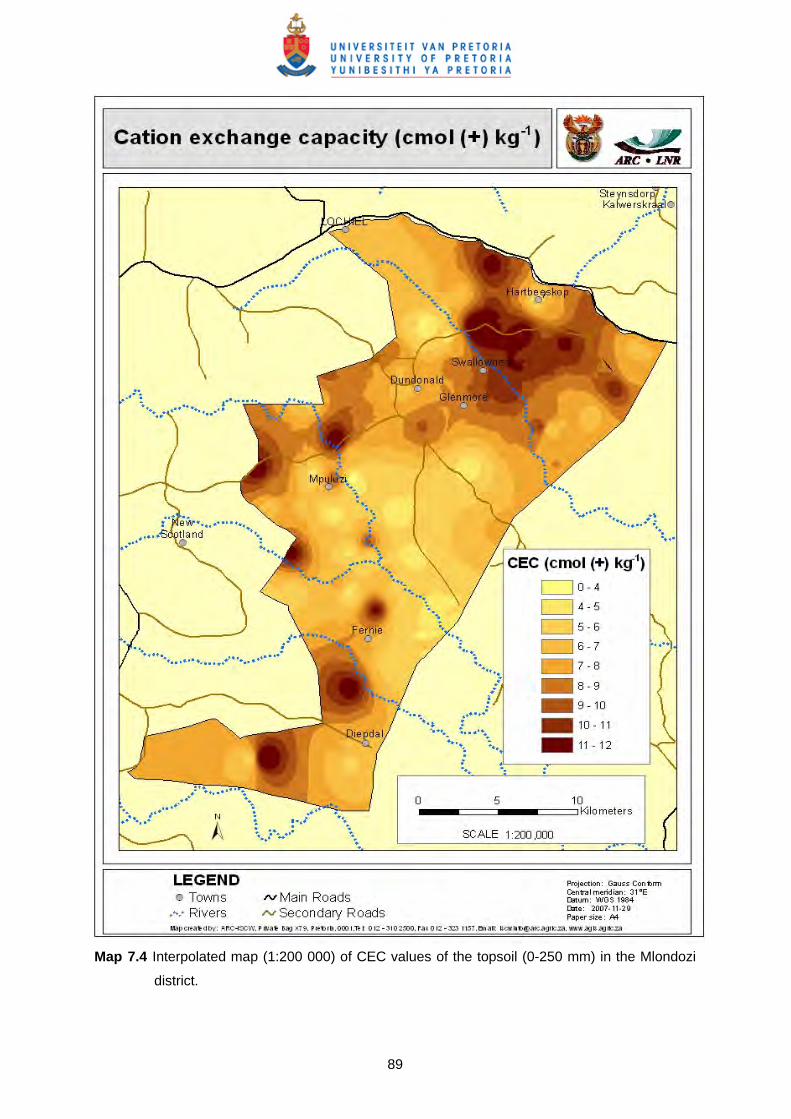
89
Map 7.4 Interpolated map (1:200 000) of CEC values of the topsoil (0-250 mm) in the Mlondozi
district.
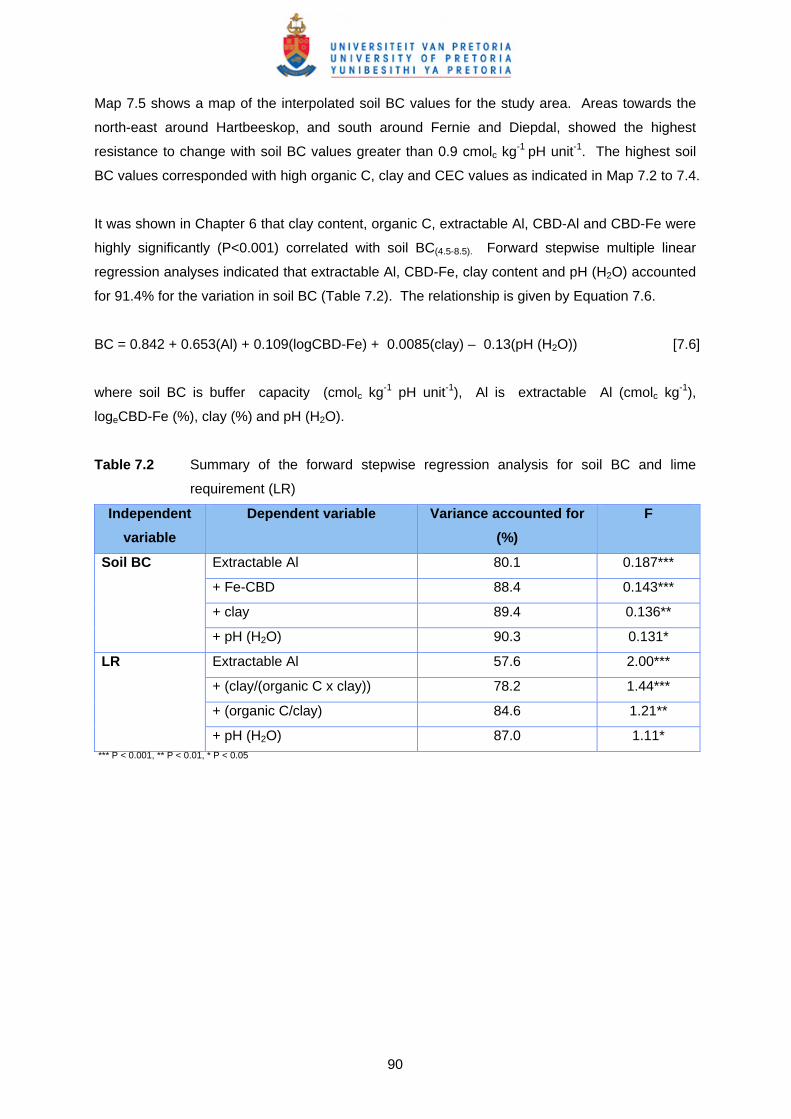
90
Map 7.5 shows a map of the interpolated soil BC values for the study area. Areas towards the
north-east around Hartbeeskop, and south around Fernie and Diepdal, showed the highest
resistance to change with soil BC values greater than 0.9 cmolc kg-1 pH unit-1. The highest soil
BC values corresponded with high organic C, clay and CEC values as indicated in Map 7.2 to 7.4.
It was shown in Chapter 6 that clay content, organic C, extractable Al, CBD-Al and CBD-Fe were
highly significantly (P<0.001) correlated with soil BC(4.5-8.5). Forward stepwise multiple linear
regression analyses indicated that extractable Al, CBD-Fe, clay content and pH (H2O) accounted
for 91.4% for the variation in soil BC (Table 7.2). The relationship is given by Equation 7.6.
BC = 0.842 + 0.653(Al) + 0.109(logCBD-Fe) + 0.0085(clay) – 0.13(pH (H2O)) [7.6]
where soil BC is buffer capacity (cmolc kg-1 pH unit-1), Al is extractable Al (cmolc kg-1),
logeCBD-Fe (%), clay (%) and pH (H2O).
Table 7.2 Summary of the forward stepwise regression analysis for soil BC and lime
requirement (LR)
Independent variable
Dependent variable Variance accounted for (%)
F
Soil BC Extractable Al 80.1 0.187***
+ Fe-CBD 88.4 0.143***
+ clay 89.4 0.136**
+ pH (H2O) 90.3 0.131*
LR Extractable Al 57.6 2.00***
+ (clay/(organic C x clay)) 78.2 1.44***
+ (organic C/clay) 84.6 1.21**
+ pH (H2O) 87.0 1.11* *** P < 0.001, ** P < 0.01, * P < 0.05

91
Map 7.5 Interpolated map (1:200 000) of soil BC values of the topsoil (0-250 mm) in the
Mlondozi district.
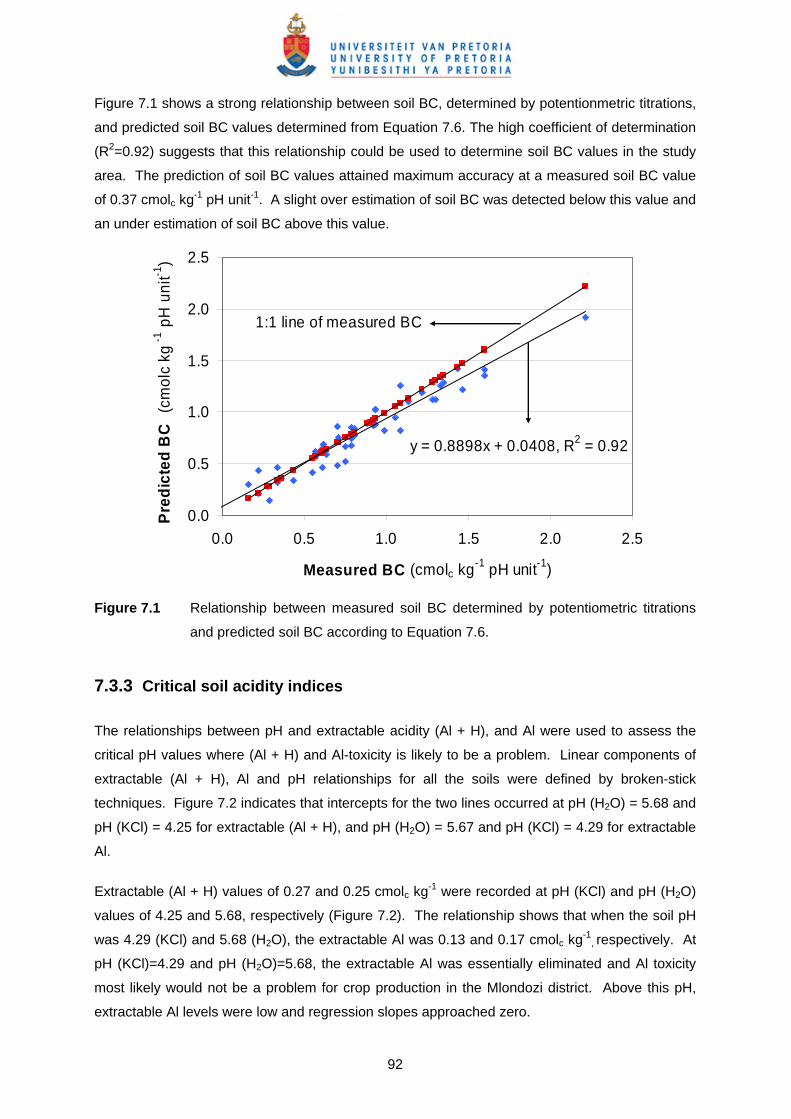
92
Figure 7.1 shows a strong relationship between soil BC, determined by potentionmetric titrations,
and predicted soil BC values determined from Equation 7.6. The high coefficient of determination
(R2=0.92) suggests that this relationship could be used to determine soil BC values in the study
area. The prediction of soil BC values attained maximum accuracy at a measured soil BC value
of 0.37 cmolc kg-1 pH unit-1. A slight over estimation of soil BC was detected below this value and
an under estimation of soil BC above this value.
y = 0.8898x + 0.0408, R2 = 0.92
0.0
0.5
1.0
1.5
2.0
2.5
0.0 0.5 1.0 1.5 2.0 2.5
Measured BC (cmolc kg-1 pH unit-1)
Pred
icte
d B
C (
cmo
lc k
g-1
pH
un
it-1)
1:1 line of measured BC
Figure 7.1 Relationship between measured soil BC determined by potentiometric titrations
and predicted soil BC according to Equation 7.6.
7.3.3 Critical soil acidity indices The relationships between pH and extractable acidity (Al + H), and Al were used to assess the
critical pH values where (Al + H) and Al-toxicity is likely to be a problem. Linear components of
extractable (Al + H), Al and pH relationships for all the soils were defined by broken-stick
techniques. Figure 7.2 indicates that intercepts for the two lines occurred at pH (H2O) = 5.68 and
pH (KCl) = 4.25 for extractable (Al + H), and pH (H2O) = 5.67 and pH (KCl) = 4.29 for extractable
Al.
Extractable (Al + H) values of 0.27 and 0.25 cmolc kg-1 were recorded at pH (KCl) and pH (H2O)
values of 4.25 and 5.68, respectively (Figure 7.2). The relationship shows that when the soil pH
was 4.29 (KCl) and 5.68 (H2O), the extractable Al was 0.13 and 0.17 cmolc kg-1, respectively. At
pH (KCl)=4.29 and pH (H2O)=5.68, the extractable Al was essentially eliminated and Al toxicity
most likely would not be a problem for crop production in the Mlondozi district. Above this pH,
extractable Al levels were low and regression slopes approached zero.

93
Figure 7.2 Critical soil pH values by means of broken-stick analysis between (a) pH (H2O)
and extractable (Al + H), and (b) pH (KCl) and extractable (Al + H), (c) pH (H2O)
and extractable Al and (d) pH (KCl) and extractable Al.
This observation is consistent with previous observations that extractable Al was essentially
eliminated above pH (H2O) 5.5 (Coleman & Thomas, 1967; Sanchez, 1976; Juo, 1977; Farina et
al., 1980).
7.3.4 Actual soil acidity indices and lime requirement (LR)
Actual pH (H2O) and extractable acidity (cmolc kg-1) interpolated maps (1:200 000 scale) are
shown in Maps 7.6 and 7.7. In general, lower soil pH and higher extractable acidity values for
natural veld were recorded in the north-east near Hartbeeskop and to the south of the district
For pH (KCl)>4.29: y = -1.86x + 8.106; R2= 0.72
For pH (KCl)<4.29: y = -0.10x + 0.558; R2 = 0.22
0.0
0.5
1.0
1.5
2.0
2.5
3.0
3.5 4.0 4.5 5.0 5.5 6.0 6.5 7.0
pH (KCl)
Extra
ctab
le A
l (c
mo
l(+
) kg
-1)
For pH (H2O)>5.67: y = -0.94x + 5.51, R2 = 0.69
For pH (H2O)<5.67: y = -0.21x + 1.36, R2 = 0.37
0.0
0.5
1.0
1.5
2.0
2.5
3.0
4.0 4.5 5.0 5.5 6.0 6.5 7.0 7.5 8.0
pH (H2O)
Extra
ctab
le A
l (c
mo
l (+
) kg
-1)
For pH (KCl)>4.25: y = -2.54x + 11.07, R2= 0.72
For pH (KCl) <4.25: y = -0.23x + 1.256, R2=0.32
0.0
0.5
1.0
1.5
2.0
2.5
3.0
3.5 4.0 4.5 5.0 5.5 6.0 6.5 7.0
pH (KCl)
Extra
cata
ble
Al+
H (
cmo
l(+
) kg
-1)
For pH (H2O)>5.68: y =-1.271x + 7.47, R2= 0.77
For pH (H2O) <5.68: y =-0.268x + 1.88, R2=0.32
0.0
0.5
1.0
1.5
2.0
2.5
3.0
3.5 4.0 4.5 5.0 5.5 6.0 6.5 7.0 7.5 8.0
pH (H2O)
Extra
cata
ble
Al+
H (
cmo
l(+
) kg
-1)
(d) (c)
(a) (b)

94
around Fernie and Diepdal. There was no clear trend in soil pH and extractable acidity values for
cultivated fields with values that varied from lower, similar and higher than surrounding baseline
values of natural veld.
Soil acidity in natural veld, as indicated by pH and extractable acidity, shows a positive
relationship with soil BC values (compare Maps 7.5, 7.6 and 7.7). Soils with higher soil BC are
characterized by higher organic C and clay contents. When comparing Maps 7.6 and 7.7, with
7.8, actual soil pH and extractable acidity values show to negatively correspond with rainfall
patterns in the district. Areas with low soil pH and higher extractable acidity values in the north
correspond with higher rainfall, due to the leaching of appreciable amounts of extractable bases
from the soil. The important correlation between soil acidification and rainfall has been
highlighted by Helyar et al. (1990). They further showed that a soil layer may acidify by net acid
production from acids produced in the inorganic and organic carbon cycles, or in the N, Fe, S, Al
and Mn cycles. Other nutrient cycles are usually responsible for only minor amounts of acid
production. Leaching of nitrate produced from the nitrification of organic N compounds will have
a net acidifying effect because: (i) the nitrification process produces H+ and NO3-, and (ii) if the
NO3- is leached, usually with Ca2+ as balancing cation, the net effect is acidification. Increased
leaching also leads to increased net losses of HCO3-, OH-, H+, Al3+ and Mn2+ from a soil layer.
Therefore, the correlation between soil acidity indexes and rainfall partly reflects the role of
leaching in the transport of organic anions and nitrate from the upper soil layers downward in the
soil profile.

95
Map 7.6 Interpolated maps (1:200 000) of current pH (H2O) for the topsoil (0-250 mm) in the
Mlondozi district.

96
Map 7.7 Interpolated maps (1:200 000) of current extractable acidity (cmolc kg-1) values for
the topsoil (0-250 mm) in the Mlondozi district.

97
Map 7.8 Interpolated maps (1:200 000) of annual rainfall in the Mlondozi district.

98
Map 7.9 Interpolated maps (1:200 000) of lime requirement (tonnes CaCO3 ha-1) from current pH
(H2O) to pH (H2O) 6.0 in the Mlondozi district.
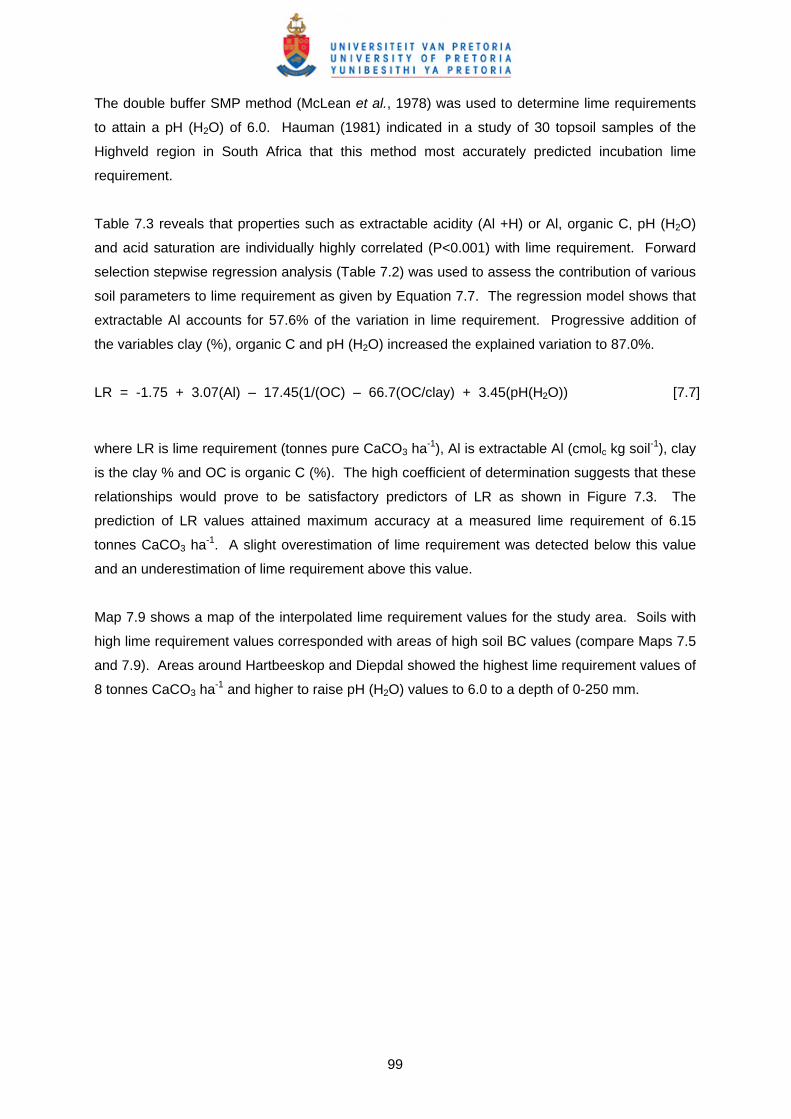
99
The double buffer SMP method (McLean et al., 1978) was used to determine lime requirements
to attain a pH (H2O) of 6.0. Hauman (1981) indicated in a study of 30 topsoil samples of the
Highveld region in South Africa that this method most accurately predicted incubation lime
requirement.
Table 7.3 reveals that properties such as extractable acidity (Al +H) or Al, organic C, pH (H2O)
and acid saturation are individually highly correlated (P<0.001) with lime requirement. Forward
selection stepwise regression analysis (Table 7.2) was used to assess the contribution of various
soil parameters to lime requirement as given by Equation 7.7. The regression model shows that
extractable Al accounts for 57.6% of the variation in lime requirement. Progressive addition of
the variables clay (%), organic C and pH (H2O) increased the explained variation to 87.0%.
LR = -1.75 + 3.07(Al) – 17.45(1/(OC) – 66.7(OC/clay) + 3.45(pH(H2O)) [7.7]
where LR is lime requirement (tonnes pure CaCO3 ha-1), Al is extractable Al (cmolc kg soil-1), clay
is the clay % and OC is organic C (%). The high coefficient of determination suggests that these
relationships would prove to be satisfactory predictors of LR as shown in Figure 7.3. The
prediction of LR values attained maximum accuracy at a measured lime requirement of 6.15
tonnes CaCO3 ha-1. A slight overestimation of lime requirement was detected below this value
and an underestimation of lime requirement above this value.
Map 7.9 shows a map of the interpolated lime requirement values for the study area. Soils with
high lime requirement values corresponded with areas of high soil BC values (compare Maps 7.5
and 7.9). Areas around Hartbeeskop and Diepdal showed the highest lime requirement values of
8 tonnes CaCO3 ha-1 and higher to raise pH (H2O) values to 6.0 to a depth of 0-250 mm.

100
Table 7.3 Correlation matrix between lime requirement (LR), acidification rates (∆ pH unit year-1) and selected soil properties
LR Acid rate pH (H2O) pH (KCl) Extr. Ac. Al Acid Sat. Ca Mg Org. C Clay CEC ECEC CBD-Al CBD-Fe CBD-Mn
Acid. rate -0.154
pH (H2O) -0.627*** 0.724***
pH(KCl) -0.120 0.628*** 0.881***
Extr. Ac. 0.686*** -0.595*** -0.847*** -0.813***
Al 0.717*** -0.607*** -0.855*** -0.806*** 0.978***
Acid sat. 0.105 -0.531*** -0.862*** -0.832*** 0.940*** 0.905***
Ca -0.037 0.087 0.456*** 0.492*** -0.523*** -0.493*** -0.599***
Mg 0.005 0.093 0.520*** 0.526*** -0.503*** -0.487*** -0.597*** 0.939***
Org. C 0.682*** -0.428*** -0.288* -0.224 0.411*** 0.431*** 0.198 -0.026 0.002
Clay 0.605*** -0.562*** -0.297* -0.127 0.298* 0.300** 0.117 0.158 0.202 0.716***
CEC 0.297 -0.408*** -0.104 -0.030 0.221 0.197 0.044 0.383** 0.480*** 0.550*** 0.744***
ECEC -0.178 -0.495*** -0.339** -0.282* 0.492*** 0.432*** 0.358** -0.075 0.036 0.581*** 0.708*** 0.879***
CBD-Al 0.385* -0.466*** -0.361** -0.248* 0.393*** 0.404*** 0.276* -0.057 -0.047 0.722*** 0.678*** 0.458*** 0.511***
CBD-Fe 0.285 -0.417*** -0.105 0.062 0.056 0.072 -0.093 0.452*** 0.463*** 0.551*** 0.799*** 0.801*** 0.635*** 0.637***
CBD-Mn -0.336 -0.317** -0.002 0.072 -0.001 0.017 -0.143 0.466*** 0.523*** 0.331* 0.564*** 0.810*** 0.635*** 0.286* 0.750***
Kt 0.397* 0.016 -0.181 -0.101 0.016 0.039 0.067 -0.056 -0.083 -0.300* -0.116 -0.224 -0.251 -0.177 -0.245 -0.144 *** P < 0.001, ** P < 0.01, * P < 0.05

101
Figure 7.3 Relationship between measured lime requirement (tonnes CaCO3 ha-1) and
predicted lime requirement according to Equation 7.7.
7.3.5 Acid production load (APL) In order to simulate future soil acidification, it is necessary to determine the APL and acidification
rates. The acidification rate is a factor of net acid production, and loss of alkalinity from the soil
system (Hill, 2003). Medium-term changes in soil pH (H2O) values for 35 dryland crop
production sites (mainly maize) were used in the study area to determine APL, (using Equation
7.3), to a 250 mm depth. Acid production loads varied from 0.21 to 10.31 (mean of 3.70) kmol
(H+) ha-1 year-1, depending on the production system and fertilizer inputs. Therefore, an APL
value of 3.70 (mean of measured APLs) for cultivated land was used in the study to simulate
acidification rates for the Mlondozi district. The lime required to balance the APL to 250 mm
depth varied between 97 and 527 kg CaCO3 ha-1 year-1, with a mean of 190 kg CaCO3 ha-1 year-1
in the crop production sites. The APLs recorded in the study (mean of 1.39 kmol (H+) ha-1 year-1
to a depth of 100 mm) were similar to APLs recorded by Helyar et al. (1990) under continuous
wheat/fallow rotation to a depth of 100 mm. Helyar et al. (1990) showed that the lowest acid
production of -0.5 to 5.1 kmol (H+) ha-1 year-1 was measured under a continuous wheat/fallow
rotation where little or no acidification occurred. The highest rates of APL measured were
associated with ammonium sulphate fertilizer use on rice (7.9 to 10.4 kmol (H+) ha-1 year-1) and
kikuyu pastures (21.3 kmol (H+) ha-1 year-1).
7.3.6 Acidification risk assessment
In order to spatially simulate the decline in soil pH (H2O) of the topsoil (0-250 mm) over time, acid
y = 0.9102x + 0.5526, R2 = 0.91
0
2
4
6
8
10
12
14
16
0 2 4 6 8 10 12 14 16
Measured LR (ton CaCO3 ha-1)
Pred
icte
d LR
(to
n C
aC
O3 h
a-1
)1:1 line of measured LR

102
production loads were combined with geostatistics. Interpolated acidification risk maps were
created at a 1:200 000 scale using pH (H2O) change per annum (∆ pH unit year-1), years until the
critical pH (H2O) of 5.68 is reached and a spatial risk classification of the district (Maps 7.10 to
7.12).
Map 7.10 indicates that the rate of pH decline for the top 250 mm soil depth was between 0.051
and 0.918 (mean 0.237) units year-1, with the fastest rates on the crop production sites in the
Mpuluzi and Fernie areas characterized by lower soil BC values. The acid generated from crop
production practices (3.70 kmol (H+) ha-1 year-1) was sufficient to acidify the relatively weakly-
buffered soil. Special care should be taken in the management of soils in this area because of
the potential threat to sustainable agriculture due to the relatively high acidification rates. Cregan
and Helyar (1990) suggested that the rate of acidification can be reduced by the adoption of
more efficient and less acidifying agricultural practices. This includes the substitution of
ammonium by nitrate fertilizers, improving the efficiency of nitrogen (e.g. apply NH4+ fertilizer
when root system has developed) and water use (N-cycle), and minimizing waste product
removal and excessive levels of organic matter (C-cycle).
The expected number of years until a given critical pH is reached (Map 7.11) enables
acidification risk predictions (Map 7.12) to be made by identifying the bracket within which the
number of years falls (Hill, 2003). In the current study, class 1 indicates high-risk areas with pH
values lower than critical pH values, class 2 indicates moderate-risk areas expected to acidify to
critical pH in less than 5 years, and class 3 a low-risk area is not expected to acidify to critical pH
within 5 years (Map 7.12).

103
Map 7.10 Interpolated map (1:200 000) of pH (H2O) change per year for the topsoil (0-250 mm)
in the Mlondozi district.

104
Map 7.11 Interpolated map (1:200 000) of years until critical pH (H2O) is reached for the topsoil
(0-250 mm) in the Mlondozi district.
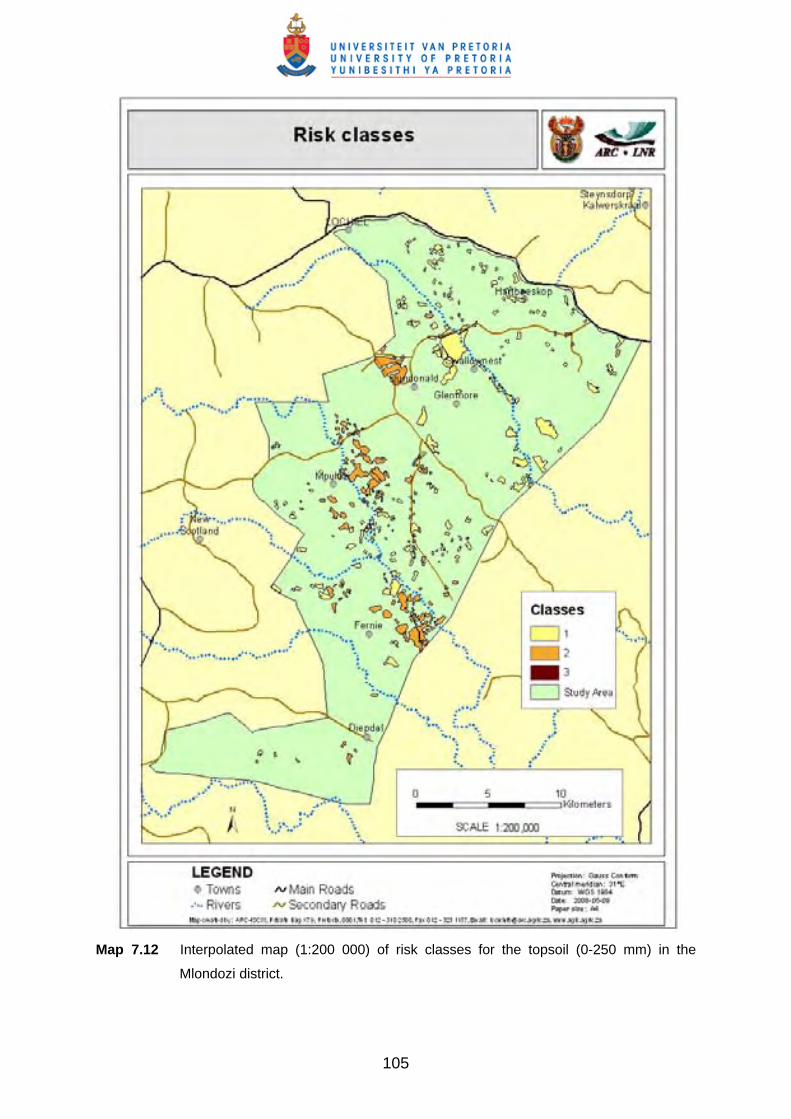
105
Map 7.12 Interpolated map (1:200 000) of risk classes for the topsoil (0-250 mm) in the
Mlondozi district.
106
Maps 7.11 and 7.12 show that within two years the pH (H2O) of most of the Mlondozi district
would decrease to below the critical pH of 5.68. Results indicate that interventions should focus
on cultivated areas in the central parts around Swallownest and Glenmore, the northern parts
around Hartbeeskop, the eastern parts, and to the west and north of Fernie (risk class 1) where
pH (H2O) was already lower than the critical pH. Croplands in the areas around Dundonald,
Mpuluzi, and north and east of Fernie fall within risk class 2, which indicates that the pH will
decrease to below critical values within 5 years. The class 3 areas, with the lowest risk,
constituted only very small areas around Mpuluzi and towards the north of Dundonald.
Maps 7.13 to 7.16 shows interpolated maps (1:200 000 scale) simulating pH (H2O) values for a
sequence of current, 2, 4 and 6 years. Compared with the current situation, a dramatic reduction
in pH (H2O) values could be expected within the relatively short period of 6 years. Generally the
high risk areas as previously indicated are near the north-eastern border of the district, as well as
the area around Fernie where pH (H2O) values are predicted to decrease to less than 5.0 within
6 years. Results indicate that currently 50% of all cultivated lands have pH (H2O) higher than
critical values, but within 4 years this would decrease to 3% at an assumed APL of 3.70 kmol (H+)
ha-1 year-1.
The above results highlight the risk of potential decrease in soil pH in the study area, which
emphasize the need to re-examine present agricultural and intervention strategies in order to
reduce the current soil acidification rates or consider subsidies for reliming.
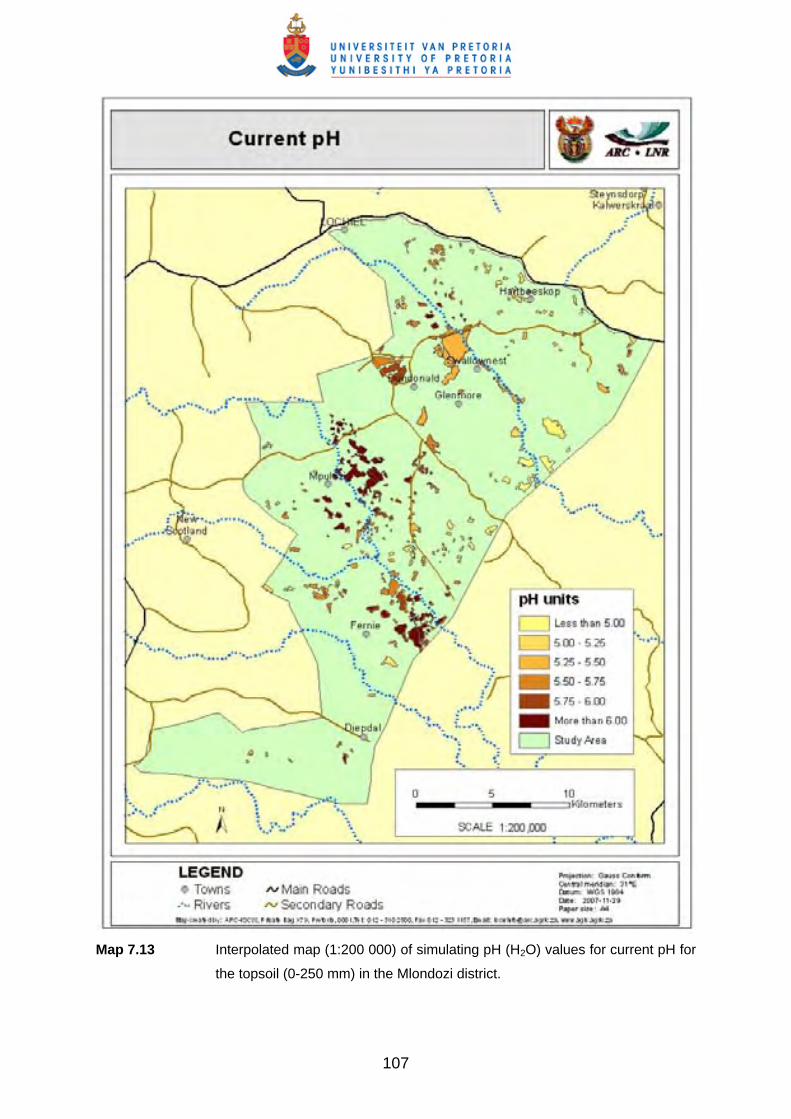
107
Map 7.13 Interpolated map (1:200 000) of simulating pH (H2O) values for current pH for
the topsoil (0-250 mm) in the Mlondozi district.

108
Map 7.14 Interpolated map (1:200 000) of simulating pH (H2O) values for 2 years for
the topsoil (0-250 mm) in the Mlondozi district.
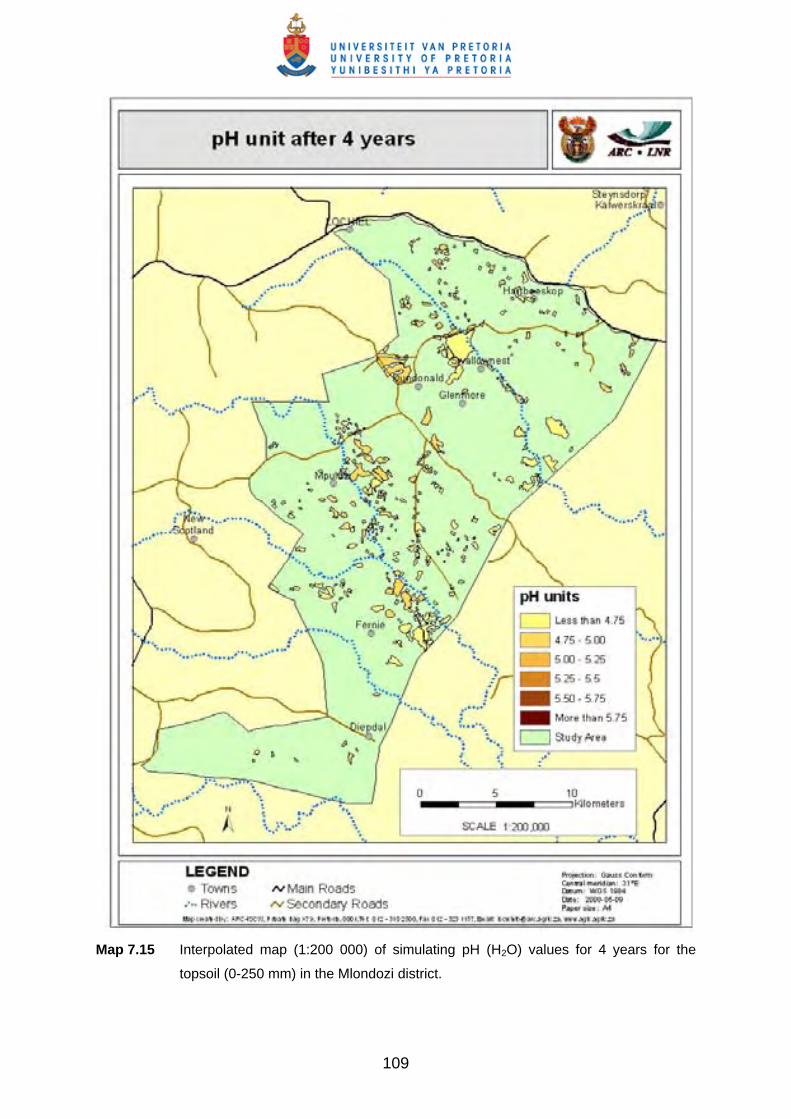
109
Map 7.15 Interpolated map (1:200 000) of simulating pH (H2O) values for 4 years for the
topsoil (0-250 mm) in the Mlondozi district.

110
Map 7.16 Interpolated maps (1:200 000) of simulating pH (H2O) values for 6 years for the
topsoil (0-250 mm) in the Mlondozi district.

111
7.3.7 Relationship between acidification rate and selected soil properties
Table 7.3 shows that several soil properties were highly significantly (P<0.001) correlated with
acidification rate. Soil pH (H2O) and (KCl) are individually the best correlated (r = 0.724, 0.628)
with acidification rate, followed by extractable Al and acidity (Al + H), clay content, acid saturation
and ECEC. Table 7.3 and Figure 7.4 show that acidification rate (∆ pH unit year-1) was high if
the initial soil pH (H2O or KCl) was high or extractable (Al + H), (Al) or acid saturation were low.
Doerge and Gardner (1985) stated that increased pH values which are the result of lime
application, stimulate soil acidification processes and net soil acidification occurs at an
accelerated rate. The reasons for the increase in acidification risk with increasing pH values are:
(i) The decomposition of organic matter is accelerated with an increase in pH. This leads to an
increased release of reduced forms of N and S. The oxidation of these compounds would
result in greater production of H+ ions in limed soils. Marked increases in mineralized N were
measured when liming raised the pH above 5.0 and 5.9, respectively. Increases in
mineralization of organic S would also be expected (Doerge & Gardner, 1985).
(ii) It has been shown that extractable Al is a significant contributor to the pH buffer mechanism.
At high pH values, extractable Al is essentially eliminated and other soil properties such as
clay, organic C and CBD-Al, Fe are the primary buffering mechanisms (see Chapter 6).
(iii) Another reason for the greater net acid production load for soils with higher initial pH values
shown by Gasser (1973), Hoyt and Henning (1982) and Matzner and Meiwes (1994) is that
the rate of nitrification is influenced by the soil pH value. Nitrification, the process of
enzymatic oxidation of ammonia to nitrates brought about by autotrophic microorganisms in
the soil, proceeds most rapidly in soils with a higher pH value. This accounts in part for the
weak nitrification in acid soils and the apparent sensitivity of the organism to a low pH (Brady,
1984). Therefore, acid production load in a soil with an initial low soil pH would be lower
compared to the same soil with a higher pH value.

112
y = 0.2771e-1.1049x, R2 = 0.668
0.0
0.1
0.2
0.3
0.4
0.5
0.6
0.7
0.8
0.9
1.0
0.00 0.25 0.50 0.75 1.00 1.25 1.50 1.75 2.00Extractable Al (cmolc kg-1)
pH y
ear-1
y = 0.5048e-0.0368x, R2 = 0.433
0.0
0.1
0.2
0.3
0.4
0.5
0.6
0.7
0.8
0.9
1.0
0 5 10 15 20 25 30 35 40 45 50 55 60Clay (% )
pH y
ear-1
y = 0.2839e-0.8272x, R2 = 0.656
0.0
0.1
0.2
0.3
0.4
0.5
0.6
0.7
0.8
0.9
1.0
0.00 0.25 0.50 0.75 1.00 1.25 1.50 1.75 2.00 2.25 2.50 2.75
Extractable acidity (cmolc kg-1 soil)
pH y
ear-1
y = 0.0031e0.9284x, R2 = 0.6440.0
0.1
0.2
0.3
0.4
0.5
0.6
0.7
0.8
0.9
1.0
3.5 4.0 4.5 5.0 5.5 6.0 6.5 7.0
pH (KCl)
pH y
ear-1
y = 0.3208e-0.1377x, R2 = 0.363
0.0
0.1
0.2
0.3
0.4
0.5
0.6
0.7
0.8
0.9
1.0
0 1 2 3 4 5 6 7 8 9 10 11 12 13 14 15ECEC (cmolc kg-1 soil)
pH y
ear-1
y = 0.0013e0.8889x, R2 = 0.7010.0
0.1
0.2
0.3
0.4
0.5
0.6
0.7
0.8
0.9
1.0
4.5 5.0 5.5 6.0 6.5 7.0 7.5 8.0
pH (H2O)
pH y
ear-1
Figure 7.4 The relationship between acidification rate (∆ pH year-1) and (a) soil pH (H2O), (b)
pH (KCl), (c) extractable Al, (d) extractable acidity, (e) ECEC (cmolc kg-1 soil) and
(f) clay content.
Table 7.4 and Figure 7.4 show critical soil properties where acceleration in acidification could be
expected.
(a)
(d) (c)
(f) (e)
(b)

113
Table 7.4 Non-linear regression analysis between various soil properties and acidification
rate. Variables R2 (%) F Critical value
Soil pH (H2O) 57.72 102.39*** 5.73
Soil pH (KCl) 40.86 53.21*** 4.45
Extractable Al 47.48 69.60*** 0.180 cmolc kg soil-1
Extractable acidity 47.92 70.84*** 0.253 cmolc kg soil-1
ECEC 43.63 38.06*** 3.29 cmolc kg soil-1
Clay 29.20 28.45*** 26.1% *** P < 0.001, ** P < 0.01, and * P < 0.05
Figure 7.4 (a) and Table 7.4 shows that above a critical pH (H2O) value of 5.735, a gradual
increase in acidification rates is accelerated. The pH (KCl) values show gradual accelerated
acidification above 4.45 (Figure 7.4 (b)). This indicates that soils in the study area should, for
economic reasons, not be limed to pH (H2O) and (KCl) values higher than ≈ 5.75 and 4.45,
respectively, due to accelerated acidification that would take place above these values. Critical
threshold values for extractable Al and acidity were recorded as <0.180 and 0.253 cmolc kg-1 soil.
Below these critical values acceleration in acidification could be expected (Figure 7.4 (c, d)).
Figure 7.4 (e) shows that the acidification rate as affected by ECEC, the sum of extractable
cations (Al3+ + H+ + Ca2+ + Mg2+ + K+ + Na+), is the highest when the ECEC value drops below
3.29 cmolc kg-1 soil. Figure 7.4 (f) furthermore shows that, not surprisingly, the acidification risk
decreased with an increase in clay content. The smallest change in pH value over time was
recorded at a clay content higher than 26.1%. Therefore, soils with clay contents of <26.1% are
at a greatest risk of accelerated acidification.
7.4 CONCLUSIONS The farming community in the Mlondozi district has to make a living on soils where pH (H2O)
levels show that 40% of the topsoil has a pH below a critical value of 5.68, indicating that a
decline in crop growth and yield may be expected. Average net acid production loads due to
crop production (mainly maize) were calculated to be 3.70 H+ ha-1 year-1. The lime required to
balance the net acid production load to 250 mm depth was between 97 and 527 kg CaCO3 ha-1
year-1, with a mean of 190 kg CaCO3 ha-1 year-1 in the crop production sites. The regular
application of the small quantities of lime would be sufficient to maintain favourable pH levels.
Other possibilities include non-acidifying fertilizers such as limestone ammonium nitrate, which
may prevent further soil acidification.
The soil acidification risk techniques used in the study proved to be a valuable tool to assist land
users, extension officers, and policy makers in making decisions on the long-term impact of

114
production systems on the resource base. The results furthermore show the need to re-examine
current agricultural and intervention strategies in order to reduce the impact of soil acidity and
reduce current soil acidification rates. It has been shown in the study that the Mlondozi area (4
000 ha cropland) would require an amount of 760 tonnes CaCO3 year-1 (based on the mean net
acid production .load) to maintain current soil acidification rates in the Mlondozi district. From a
strategic perspective, the quantification of acid production rates and the maintenance liming rate
in the study area should assist producers, extension officers, and policy makers in making
decisions towards preventing acidification and the long-term impact of a production system.

115
GENERAL DISCUSSION, CONCLUSIONS AND RECOMMENDATIONS
The data and findings contained in this thesis reveal the benefits that can accrue by value-adding
scientifically to empirical, multi-year field trials dealing with acid-soil infertility. They also demonstrate
how findings can be extrapolated to adjacent croplands via soil chemical tests and spatial mapping of
relevant soil fertility attributes. The two targeted 5-6 year maize (Zea mays L.) “extension” trials from
a NLP liming initiative were located in resource-poor farming areas of Mpumalanga Province, South
Africa, and each involved applications of from zero to 10 tonnes ha-1 of dolomite. Around 1500
resource poor farmers across ≈4000 ha of the Mlondozi District were covered by the subsequent
extrapolation. A downside was the absence, in the field trials, of alternatives to dolomite as the
“liming” source, despite knowledge that the MgCO3 component of dolomite is measurably less
reactive than its CaCO3 component (Martin and Reeve 1955; McKeague and Sheldrick 1976). The
consequence is that the CaCO3 component of dolomite will have been responsible for the initial
alleviation of soil acidification in the multiple-year field trials, followed subsequently by the MgCO3
component. The 80 representative soil samples from the Mlondozi District equated to one sample for
every 50 ha of cropping land, which is relatively low intensity but sufficient to demonstrate the value
for technology-transfer purposes of spatial-mapping of targeted soil properties.
Collectively, the research program undertaken was sufficient to gain insight into the mechanisms that
govern soil BC and the alleviation of soil acidification in the major cropping soils (Hutton and Oakleaf)
of Mpumalanga Province, Herein, the implications of the results and their limitations are discussed,
conclusions documented, and suggestions for future research outlined.
8.1 To monitor the effects of liming on the neutralization of soil acidity and to determine the re-
acidification rate of soils under cultivation.
The typically recommended liming rate of 5 tonnes dolomite ha-1 successfully neutralized excessive
soil acidity on the Hutton soil but not on the Oakleaf soil, which required a higher application rate (???
10 tonnes dolomite ha-1), attributable to its BC, which at around 2.49 cmolc kg-1 pH unit-1 was four-
fold that measured in the surface horizon of the Hutton soil. Comparatively, Aitken et al. (1990)
8

116
reported soil pH BCs of Queensland (Australia) soils range from 02 to 5.4 g CaCO3 kg-1 soil unit-1 pH
increase.
An explanation as to why the soil BCs should differ four-fold is open to speculation but a possible
contributing factor may be that the A horizons of Oakleaf soils are closer to the zero point of charge
than corresponding horizons of Hutton soils, noting that both soil types are dominated by 1:1 layer
clays (see Table 2.1). Such clays are synonymous with strong weathering, low CECs and variably
charged exchange sites (Theng 1980; Uehara and Gillman 1981). Other contributing factors could be
differences in soil texture class (Murphy, undated) and the significantly higher levels of organic C in
Oakleaf soils. Specifically, soil organic matter has a strongly pH-dependent charge that originates
from, for example, the deprotonation of OH- of active carboxyl (-COOH) and phenolic (C6H4OH)
groups. These account for 85% of the negative charge of soil organic matter. Phenolic groups are
weaker acids than carboxyl groups and contribute charge at higher pH, as compared to carboxyl. In
the pH range of most soils (pH 4.5 - 8.0) carboxyl groups contribute negatively-charged surfaces that
are strongly pH dependent.
Critical threshold values derived from pooled data were identified where reductions in relative grain
yield occurred For pH (H2O), extractable acidity, Al and acid saturation, these critical threshold
values were 5.49, 0.277 cmolc kg soil-1, 0.145 cmolc kg soil-1 and 13%, respectively. Of these, acid
saturation percentage is likely to be a useful indicator of the need for liming additions, since it aims at
eliminating a major cause of poor growth within acid soils, i.e. toxic Al. As established by Bruce et al.
(1999), however, soil ionic strength, which can be affected by inputs of chemical fertilizers, will affect
the concentrations of active Al3+ in the soil solution and hence the level of Al saturation associated
with Al toxicity. Clearly, further local research on the extent to which varying soil solution
concentrations influence the expression of Al toxicity (or Ca2+ deficiency) would further improve the
diagnosis of cause/s of acid-soil infertility.
8.2 To measure the effects of liming on growth and yield of maize:
The results of this study indicate that soil acidity has a confounding influence on soil fertility, leaf
nutrient uptake and maize growth. The cause of poor crop growth is due to the associated chemistry
that occurs at low pH, i.e. toxic levels of soluble Al plus lessened plant availability of P and Mo.
Aluminium toxicity, excess Mn and possibly excess Fe, respectively, and deficient levels of Ca2+ (and
possibly Mg2+) were the factors that most adversely affected nutrient uptake and maize grain yields
in the study area. The highest yields were associated with low leaf Al, Fe and Mn levels. It was also
found that concentrations of total K and total B in maize leaves were lower in plants diagnosed as Al,
Mn and Fe toxic. A previous study (Steyn and Herselman 2006) reported that trace elements such as
B, Co, Cu, Fe, I, Mn, Mo, Se and Zn have a high risk of being deficient in this area. However, the

117
current study showed that Zn, B and Mo fertilizer additions had little beneficial effect on maize growth.
Farmers and extension personnel should be educated in the positive effects that these trace
elements have on production and when positive responses might be expected.
8.3 To determine the relative importance of soil properties in determining the soil buffer capacity of
the major soil groups:
With respect to the importance of soil properties in determining soil BC of 80 soil samples from the
Mlondozi District, extractable acidity, organic C and clay content significantly contributed to pH
buffering. However, limitations existed in interpreting the corresponding soil BC values because only
limited information is available on this soil attribute for South African soils. The relative contributions
soil properties to soil BC were derived via multiple regression analyses, where the significant
independent variables were clay, organic C, extractable acidity, CBD-Fe & Mn, and pH and the
dependent variables, soil BC at pH <4.5, 4.5-6.5, 6.5-8.5 & 4.5-8.5. The regression equations
indicated that the mean relative contribution of extractable Al to soil BC in this group of soils varied
from 69% at pH <4.5 to 80% at pH 4.5-8.5.
The current study clearly found considerable chemical and physical diversity in the dominant soils.
Moreover, low pH, Al toxicity and relative high soil BC are likely contributors to poor maize growth on
Magwa and Inanda soils. Fortunately, these constraints can be minimized by liming and by adequate
rates of necessary fertilizer applications. The down-side is that due to the high soil BC values of
these soils, applications of many tonnes ha-1 of liming material will be necessary to alleviate soil
acidity. Although the Hutton and Clovelly soils currently have higher pH values, they will be more
prone to soil acidification in the longer term than will the Magwa and Inanda soils due to the lower
soil BCs of the former two soil types.
8.4 To determine the mechanism that governs soil acidification, estimate soil acidification rates of the
major soil groups and make recommendations and set guidelines for efficient lime application
rates to ensure sustainable land use:
The results of this research provide insights into the current maize production systems, soil
acidification rates and management strategies. Topsoils affected by acidity span the entire study
area. Previous studies by others found that rates of acidification can vary from 0.7 kmol H+ ha-1
year-1 in pristine systems to as high as 40 kmol H+ ha-1 year-1 in production systems receiving high
rates of ammoniacal N fertilizers (Sumner & Noble, 2003).
A limitation existed in the current study in that general acid production estimates were used only to
118
predict the effect of maize cultivation on acidification rates. Corresponding estimates could not be
made for natural veld and forestry (Pinus patula), due to a lack of long term data for those locations.
Furthermore, there is little South African data on the rate at which production systems acidify, as is
available for locations and cropping systems in Australia (eg. Slattery et al. 1999). Investigation on
the prediction of soil BC and lime requirement showed that these characteristics could successfully
be predicted if soil properties such as extractable Al, organic C, clay content and pH (H2O) were
available. While the study showed the strong predictive value of these parameters, the validity in
extrapolating the derived predictions beyond the study area is questionable.
The representation of spatial continuity of soil properties was done by depicting the surface
continuously to show gradual variations in soil properties. Several approaches were investigated (e.g.
kringing, spline function, etc.) before producing map surfaces by inverse distance weighting, as
presented in this thesis. The limited number of data-points influenced the methodology employed. It
is contended that the spatial “risk maps” are sufficiently accurate and informative to be use by
regional extension officers and by farmers to identify areas that are already or are likely in the
foreseeable future to become acidic, thus facilitating timely corrective measures by farmers seeking
to ensure sustainable and profitable maize production systems. The average net acid production
loads due to crop production (mainly maize) were calculated to be 3.70 H+ ha-1 year-1. The lime
required to balance the net acid production load to 250 mm depth was between 97 and 527 kg
CaCO3 ha-1 year-1, with a mean of 190 kg CaCO3 ha-1 year-1 in the crop production sites. This
amounts to 760 tonnes CaCO3 year-1 for ≈ 4000 ha to maintain current soil acidification rates in the
Mlondozi district. Caution should be taken in the interpretation of this data in that the amount of 190
kg CaCO3 ha-1 year-1 is only the maintenance liming requirement and not the lime requirement to
bring soils to optimal pH (H2O) values.
Future Research and Policy
While good progress has been made, all matters associated with acid soil infertility and soil
acidification rates have not been resolved by the study. In future studies, the evaluation of the
acid production load of different production systems in resource poor farming communities may
be useful. Moody and Aitken (1997), and Dolling & Porter (1994) aimed to calculate acidification
rates if several agricultural systems in tropical subtropical Queensland. A similar approach is
warranted for South African crop, pasture and forestry production systems.
Currently, only limited information is available on soil BCs across South Africa despite the highly
weathered nature of most soils and the widespread occurrence of acidic soils. It follows that
nation-wide studies to reliably assess lime requirements is warranted, preferably based on soil
testing methods already available from soil testing services in the country. This would enable
land users to make more informed decisions on lime requirement at paddock scale.

119
The results obtained and lessons learned in the study serve as a guide to similar projects in
resource-poor farming areas in South Africa. There is a need to re-examine current agricultural
and intervention strategies in order to reduce the impact of soil acidity and reduce current soil
acidification rates. Also, to ensure the sustainability of similar projects, policy makers should
ensure service infrastructures are in place so as land users have reliable access to lime, fertilizer,
seed and necessary agricultural machinery. In addition, policy makers should have access to
detailed knowledge or descriptions of local soils (e.g. soil maps), in addition to good advice on
lime and nutrient requirements on a locality and soil-type basis. Risk areas should be delineated
to ensure priority is given to areas and farmers most in need of these inputs. Long-term action
plans should be developed for liming and fertilization operations, for annual extension
programmes and for off-load sites for lime or dolomite. Planning at this level of detail and scale
will help to enable the resource poor farming sector to produce to its full potential, which
represents a relatively untapped source of agricultural production potential.
Conclusions Conclusions from this study are documented in accord with five main objectives.
Objective 1: Monitoring the effects of liming on the neutralization of soil acidity and determining
the re-acidification rate of soils under cultivation.
The recommended level of 5 tonnes lime (as dolomite) ha-1 increased soil pH (H2O) to above
5.5 within one year of application and thereafter on Hutton soil.
The longevity of liming (5 and 10 tonnes dolomite ha-1) on surface soil pH (H2O), relative to
unlimed soil, extended for at least the 6 years at the trial sites studied.
Within the first season after lime application, the majority of extractable acidity was displaced
even though the soil pH (H2O) showed a lag period of 2 to 3 years after liming.
The Oakleaf soil, with its relatively high soil BC, showed the greatest resistance to change
and larger amounts of lime needed to be applied to bring about a desirable change in soil
acidity in this soil compared to the Hutton soil.
The critical thresholds when a reduction in relative yield was recorded were pH (H2O) = 5.49,
extractable acidity (Al + H) = 0.28, extractable acidity Al = 0.15 cmolc kg soil-1 and acid
saturation =13%.
Soil BC decreased over time in the Hutton soil, while no significant reduction in soil BC was
measured in the Oakleaf soil.
Organic C, extractable acidity and Al were strongly positively correlated with soil BC in the
Hutton soil. A significant reduction in extractable acidity with dolomite applications was
recorded in the Hutton soil and it is therefore postulated that the neutralization of extractable
acidity due to liming resulted in a reduction in soil BC.

120
Acid production loads varied quite dramatically in both experimental soils with values ranging
from 1.61 to 8.82 kmol H+ ha-1 year-1 with the highest values observed in the dolomite
treatments on the Oakleaf soil.
The soil BC determined from the pH (H2O) range 4.2 to 8.5 (BC(4.2-8.5)), was the most
appropriate in the prediction of measured acidification rates in both experimental soils.
The pH (H2O) acidification rate for the unlimed treatment at initial pH (H2O) of 5.33 acidified
by -0.046, while the 10 tonnes lime treatment at a maximum pH (H2O) of 6.47 acidified by -
0.140 pH (H2O) unit year-1 for the Hutton soil. The pH (H2O) acidification rates for the Oakleaf
soil varied from -0.044 for the unlimed plot at an initial pH (H2O) of 4.54 to -0.110 pH (H2O)
unit year-1 for the 10 tonnes lime rate at an initial pH (H2O) of 5.15.
At a pH (H2O) of 4.10 and 3.95 an acidification rate of zero could be expected in the Hutton
and Oakleaf soils, respectively.
The maintenance liming rate (as dolomite) of the topsoil (0-250 mm) of the Hutton soil form
ranged from 1.4 tonnes CaCO3 ha-1 year-1 for a pH (H2O) of about 6.5 (10 tonnes dolomite
ha-1 level), to 0.2 tonnes CaCO3 ha-1 year-1 for an attained pH (H2O) of about 5. The
maintenance lime requirement for the Oakleaf soil ranged from zero at an average pH (H2O)
of 4.3 that was attained over 5 years, to 0.8 tonnes CaCO3-1 ha-1 year-1 in the 5 and 10
tonnes dolomite ha-1 levels.
Objective 2: Effects of liming on growth and yield of maize.
The accumulated results over five and six seasons show a significant improvement in soil
fertility status with liming in terms of increases in extractable soil Ca, Mg, Cu, Zn and Mo
levels in the Hutton soil. This resulted in improved uptake of N, P, Ca and Mg by maize as
was manifested in maize leaf nutrient concentrations. Dolomite application, furthermore,
improved the availability of soil Ca, Mg and Mo, and plant uptake of Ca and Mg in the
Oakleaf soil.
Critical soil nutrient concentrations were determined from fitted relationships between soil
nutrient concentrations and relative yield. Under the experimental conditions, soil nutrient
levels of 50 mg kg-1 K, 228-345 mg kg-1 Ca, 78-105 mg kg-1 Mg and 1.68-2.85 mg kg-1 Cu
were calculated. The critical levels for soil Ca, Mg and Cu were higher than critical values
reported elsewhere in South Africa, while soil extractable K was below the adequate range
reported in local literature.
Interrelationships between maize yield, soil and plant nutrients showed a strong relationship
between soil P and Mo in the Hutton soil, with improved absorption of Mo with increasing
concentrations of total plant P.
Improved N uptake, through dolomite and fertilizer application, stimulated leaf P uptake in
both experimental soils.

121
High soil Al levels were accompanied by relatively low soil Ca, Mg and leaf Mg
concentrations in the Oakleaf soil.
Maize yield in the Hutton soil was adversely affected by Al-toxicity. Multiple regressions
showed that leaf Fe, Ca, Zn and Mg accounted for 56.2% of the variation in maize grain yield
in the Hutton soil. Leaf Ca was found to be the most important factor determining maize
grain yield, followed by toxic soil Al and a depressed leaf B uptake in the Oakleaf soil. From
this it is possible that soil Ca deficiency may be at least as important as Al toxicity, an
observation already identified by Bruce et al (1989).
Nutrient vector analyses showed a toxic build-up of Fe, followed by Al, and to a lesser extent
by Mn. The toxic elements depressed the uptake of Ca and Mg in the Hutton soil. In the
Oakleaf soil, Al toxicity, followed by high levels of Mn and Fe markedly reduced the uptake of
Ca and Mg. Antagonistically reduced B uptake due to Fe, Mn and Al toxicity was observed in
the Hutton soil. Toxic levels of Al, Mn and Fe antagonistically depressed the uptake of K in
the Oakleaf soil.
Aluminium, Mn and Fe toxicity, and deficient levels of Ca and Mg were the factors most
adversely affecting nutrient uptake and maize grain yields in the study areas. Highest yields
were associated with low leaf Al, Fe and Mn levels. It was also found that the uptake of leaf
K and B decreased measurably under severe Al, Mn and Fe toxicity.
Objective 3: Relative importance of soil properties in determining the soil buffer capacity (BC) of
the major soil groups.
Typical soil BCs over the general pH range 4.5 to 8.5 varied from 0.12 to 2.23 cmolc kg-1 pH
unit-1 for 80 acidic topsoils in the Mlondozi District study area. Composite titration curves for
dominant soil forms exhibited a wide range of buffering to base (OH-) addition. Inanda soils
showed a tendency of good buffering, while Clovelly soils revealed poor buffering. Maximum
buffering for the experimental soils occurred at both pH <5.5 and >7.5, with general poor
buffering between pH 5.25 to 7.5.
Linear regression analysis showed that the study area’s soil BC values are determined
primarily by three soil properties, viz. organic C content, content of clay minerals, and the
type of clay minerals. Since the primary clay mineral in Mlondozi District is kaolinite with low
soil BC, the clay content rather that the type of clay was the primary local determinant of soil
BC.
Multiple regression showed that extractable Al significantly contributed to soil BC in the pH
ranges <4.5 and 4.5-6.5, accounting for 69 and 75%, respectively, of the variation in soil
BC<4.5 and soil BC(4.5-6.5). Statistical analyses of the data from this study indicated that clay
content, organic C, pH (H2O), CBD-Mn, and Ca contributed most to the prediction of the soil
BC(6.5-8.5).

122
Principal component analysis showed that high clay content soils were associated with
relatively high CEC, CBD-Fe and CBD-Mn values in the study area. Low extractable Al was
associated with low soil BC, acid saturation and high pH, Ca and Mg values.
Principal component analysis, furthermore, showed that Clovelly and Hutton soils tended to
have lower soil BC, extractable acidity, Al and acid saturation values, and higher pH, Ca and
Mg contents. Magwa and Inanda soils had higher soil BC, extractable Al (acidity) and acid
saturation, and lower pH, Ca and Mg values. Therefore, more dolomite would be required to
neutralize soil acidity in the more strongly buffered Magwa and Inanda soils as compared to
the Clovelly and Hutton soils with lower soil BC.
The current knowledge of the soils in the study area indicates that there is considerable
diversity across the dominant soils. Poor crop growth on Magwa and Inanda soils could be
expected due to low pH and Al toxicity (or Ca2+ deficiency). Unfortunately, due to the high
soil BC values of these soils, lime (or dolomite) rates upwards of 10 tonnes ha-1 would be
necessary to alleviate soil acidity. However, the Hutton and Clovelly soils will be more prone
to soil acidification than the Magwa and Inanda soils due to the lower soil BC’s of the former.
Objective 4: Mechanism that governs soil acidification, estimating soil acidification rates of the
major soil groups, making recommendations and setting guidelines for efficient lime
application rates to ensure sustainable land use
.
Average net acid production loads due to crop production (mainly maize) were calculated to
be 3.70 kmol H+ ha-1 year-1. The lime requirement to balance the net acid production load to
250 mm depth was between 97 and 527 kg CaCO3 ha-1 year-1, with a mean of 190 kg CaCO3
ha-1 year-1 for the cultivated sites.
Interpolated acidification risk maps showed that a decline in pH (H2O) of between 0.051 and
0.918 (mean 0.237) units year-1 was recorded, with the fastest rates on the cultivated sites in
the Mpuluzi and Fernie areas. Timely corrective measures should be taken by farmers in
these areas in view of the potential threat to sustainable agriculture due to high acidification
rates.
Temporal simulation of time until the critical pH is reached showed that within two years the
pH (H2O) of most of the district would decrease to below 5.7. Cultivated areas in the central
parts around Swallowsnest and Glenmore, the northern parts around Hartbeeskop, the
eastern parts, and to the west and north of Fernie fall within risk class 1, indicating that pH
(H2O) was already below the derived critical value. Croplands in the areas around
Dundonald, Mpuluzi, and north and east of Fernie fall within the risk class 2, which indicates
that the pH (H2O) will decrease to below the derived critical value within 5 years. The class 3
areas around Mpuluzi and towards the north of Dundonald had the lowest risk, and are not
expected to acidify to the critical soil pH within 5 years.
123
Interpolated maps simulating pH (H2O) values for a sequence of 2, 4 and 6 years showed a
dramatic reduction in pH (H2O) values within 6 years. Currently 50% of all cultivated lands
have a pH (H2O) higher than critical values, but within 4 years this would likely decrease to
3% at an assumed APL of 3.70 kmol (H+) ha-1 year-1.
Higher soil acidification risks exist if the initial soil pH value was high or the extractable acidity
(Al + H) or Al was low. It is recommended that the soils in Mlondozi be limed to a pH (H2O)
value of around 5.7, because below 5.7 a loss in crop production can be expected, and
above pH (H2O) 5.7 gradual acceleration in soil acidification takes place.
From a management perspective, soils with high initial pH values, low extractable Al and
acidity values of below 0.18 and 0.25, respectively, clay contents below 26%, and a ECEC
value below 3.29 cmolc kg-1, are more prone to acidification than soils with a lower initial pH,
higher extractable Al and acidity values, clay content above 26% and an ECEC value of 3.29
cmolc kg-1 and higher.
Specific Recommendations The following recommendations are intended to assist in the process of implementing liming
intervention strategies based on results from this study:
A risk exists in estimating when lime will again be needed based on a single soil sampling event.
It is therefore recommended that extractable acidity is monitored annually, or every other year, in
conjunction with soil pH to assist in the management of on-farm soil acidity in the Mlondozi
district. Moreover, when making average or median soil pH calculations, the measured pH values
should first be converted into –log [H+] before applying the relevant mathematics. The resultants
must then be transformed back to pH units (antilog).
The present study has furthermore shown the importance of implementing conservative
agricultural practices to maintain organic C levels in order to avoid the immense release of H+
and Al3+ acidity. From the results it is recommended that a conservation agriculture approach,
including inter alia reduced or no-tillage and crop rotations, be further investigated and
subsequently strongly recommended under resource-poor farming conditions.
Continuous maize cultivation and inappropriate nitrogenous fertilization have the potential to
generate sufficient acidity that crop production (e.g. maize, legumes etc.) might have to be
abandoned due to Al and Mn toxicity in many agricultural lands in the Mlondozi district. It is
therefore recommended that land management practices designed to stall or reduce soil
acidification be adopted as soon as possible.
Critical values, as reported in this study, are not infallible but can serve as a guide in the
interpretation of the problems associated with soil acidity. It is recommended that the critical
levels reported be used to assist in identifying nutrition deficiencies and imbalances responsible
for yield depression, which could assist in the implementation of useful and sound cultivation and

124
cropping practices.
The current knowledge of the soils in the study area indicates that there is considerable diversity
in the dominant soils. It is estimated that the more strongly buffered Magwa and Inanda soils
would require more lime to neutralize soil acidity as compared to the Clovelly and Hutton soils
with lower soil BC. Poor crop growth on Magwa and Inanda soils could be expected due to low
pH and Al toxicity. It is a well-known fact that liming and adequate rates of fertilizer application
are the most effective management strategies to overcome acidity and soil fertility constraints to
crop production. Unfortunately, due to the high soil BC values of these soils, liming rates
upwards of 10 tonnes ha-1 will often be necessary to alleviate soil acidity. However, the Hutton
and Clovelly soils will be more prone to soil acidification than the Magwa and Inanda soils due to
the lower soil BCs of the former. This stresses the importance of implementing sound
management strategies on especially Hutton and Clovelly soils due to their vulnerability to soil
acidification. Regular maintenance applications of lime or dolomite will be required, while
applications of non-acidifying fertilizers such as limestone ammonium nitrate, will help lessen
further soil acidification, if their high cost can be justified.
The soil acidification risk techniques and spatial maps as a component of technology transfer
used in the study, is a valuable tool to assist land users, extension officers, and policy makers in
making decisions on the long-term impact of production systems on the resource base. It is
therefore recommended that similar studies should be performed whenever government
intervention strategies are implemented in resource-poor farming areas in order to identify risk
areas.
A greater emphasis needs to be placed on current agricultural and intervention strategies in
order to reduce the impact of soil acidity and reduce current soil acidification rates.
Leading farmers (local leadership) can play a very important role in the long-term sustainability of
intervention strategies and should receive continuous training, capacity building and support (e.g.
follow-up refresher courses).
A greater emphasis needs to be placed on positively changing the behaviour and practices of
primary intended users. Strategies such as farmer-to-farmer extension, together with other
strategies such as look-and-learn visits, farmer group dynamics and farmer co-operatives, could
result in a much wider impact (out-scaling) and must be promoted. This should lead to
accelerated adoption of conservation agriculture practices.
Finally, the efficacy of different forms of local liming materials needs to be assessed, noting that
dolomite has limitations due to the variable release of its Ca and Mg components. Liming
materials containing soluble silicates should be included in such studies, as highly weathered
soils are often acidic and low in soluble silicates.
125
REFERENCES
ACOCKS, J.P.H, 1988. Veld types of Southern Africa, 3rd edition. Memoirs of the Botanical Society
of Southern Africa, 57:1-146.
AGROMET, 2002. Agromet database, ARC-Institute for Soil, Climate and Water, Pretoria.
AGROMET, 2008. Agromet database, ARC-Institute for Soil, Climate and Water, Pretoria.
AITKEN, R.L. & MOODY, P.W., 1994. The effect of valence and ionic strength on the Measurement
of pH Buffer Capacity. Aust. J. Soil Res., 32, 975-984.
AITKEN, R.L., MOODY, P.W. & McKINLEY, P.G., 1990. Lime requirement of acidic Queensland
soils. I. Relationships between soil properties and buffer capacity. Aust. J. Soil Res. 28, 695-
701.
ALLOWAY, B.J., 2004. Zinc in soils and crop nutrition. International Zn Association, Brussels.
AUSTRALIAN AGRICULTURE ASSESSMENT, 2001. National Land and Water Resource Audit.
Commonwealth of Australia. ISBN 0 642 37121 0.
BACHE, B.W., 1988. Measurements and mechanisms in acid soils. Comm. in Soil Sci.Plant Anal.
19, 775-792.
BARNARD, R.O, 1978. Molibdeen in die grond-plant sisteem. Fert. Soc. S. Afr.J. 1, 69-72.
BELLOMONTE, G., COSTANTINI, A. & GIAMMARIOLI, S., 1987. Comparison of modified
automatic Dumas method and the traditional Kjeldahl method for nitrogen determination in
infant food. J. Assoc. of Anal. Chem. 70, 227-229.
BEUKES, D. J., 1995. Benefits from identifying and correcting soil acidity in agriculture. ARC-
Institute for Soil, Climate and Water, Pretoria. ISBN: 1-86849-021.
BLAMEY, F.P.C. & NATHANSON, K., 1975. Molybdenum nutrition of maize (Zea mays L.) on an
Avalon medium sandy loam as affected by molybdenum, lime and phosphate applications.
Agrochemophysica 7, 33-38.
BLOOM, P.R., 2000. Soil pH and pH buffering, p. 333-352. In M.E. SUMNER (ed.). Handbook of
Soil Science. CRC Press. USA.
BOLAN, V.S. & HEDLEY, M.J., 2003. Role of carbon, nitrogen and sulfur cycles in soil acidification.
In: Z. Rengel (ed.). Handbook of soil acidity. Marcel Dekker, New York.
BOLTON, J., 1972. Changes in magnesium and calcium in soils of the Broadbalk wheat experiment
at Rothamsted from 1865 to 1966. J. Agric. Sci. 79, 217-223.
BOLTON, J., 1977. Changes in soil pH and exchangeable calcium in two liming experiments on
contrasting soils over 12 years. J. Agric. Sci. 89, 81-86.
BOOYENS, H.B., POTGIETER, L.J.C. & MATLAWA, S.M., 2000. Characterization of soils in the
Mlondozi district of Mpumalanga. ARC-ISCW Report number: GW/A/2000/71.
BORNMAN, J.J., COETZEE, J.E.K. & VAN VUUREN, J.A.J., 1988. Inter-laboratory study with
regard to the variability of three aglime analysis methods, including a resin suspension method.
Comm. in Soil Sci. Plant Anal. 19, 299-310.
126
BRADY, N.C., 1984. The nature and properties of soils. Macmillan Publishing Company, New York.
BRAY, R.G., 1944. Soil-plant relationships: I. The quantative relation of exchangeable potassium to
crop yields and to crop response to potash additions. Soil Sci. 58, 305-324.
BRAY, R.H. & KURTZ, L.T., 1945. Determination of total, organic and available forms of phosphorus
in soils. Soil Sci. Soc. 59, 39-45.
Bruce, R.C., Bell, L.C., Edwards, D.G. & Warrell, L.A., 1989. Chemical attributes of some
Queensland acid soils. II. Relationships between soil and soil solution phase compositions.
Aust. J. of Soil Res.27, 353–364.
BUYS, A.J., 1986. Bemestingshandleiding. Mistofvereniging van Suid-Afrika, Pretoria. pp 169-171.
CATE, R.B. & NELSON, L.A., 1971. A simple statistical procedure for partitioning soil test correlation
data into two classes. Soil Sci. Soc. Am. Proc. 35, 658-659.
CHAO-YONG, L.H. & SCHULTE, E.E., 1985. Digestion of plant tissue for analysis by ICP Emission
Spectroscopy. Comm. Soil Sci. Plant Anal.16, 9.
COLEMAN, N.T. & THOMAS, G.W., 1964. Buffer curves of acid clays as affected by the presence of
ferric iron and aluminium. Soil Sci. Soc. Proc. 28:187–190.
COLEMAN, N.T. & THOMAS, G.W., 1967. The basic chemistry of soil acidity, p. 1-42. In: Soil
Acidity and Liming (eds.). Pearson , R.W. & Adams, F. Am. Soc. Agron., Madison, Wisc.
COVENTRY, M.K., SLATTERY, W.J., BURNETT, V.F. & GANNING, G.W., 1997. Longevity of
wheat yield response to lime in south-eastern Australia. Austr. J. Exp. Agric., 37,571-575.
CREGAN, P.D. & HELYAR, K.R., 1990. Non-acidifying farming systems. http://www.regional.org.au.
CURTIN, D., CAMPBELL, C.A. & MESSER, D., 1996. Prediction of titratable acidity and soil
sensitivity to pH change. J. Environ. Qual. 25, 1280-1284.
CURTIN, D. & UKRAINETZ, H., 1997. Acidification rate of limed soil in a semiarid environment. Can.
J. Soil Sci. 77, 415-420.
DE SÁ MENDONÇA, E., ROWELL, D.L., MARTINS, A.G., DA SILVA, A.P., 2005. Effect of pH on
the development of acidic sites in clayey and sandy loam Oxisols from the Cerrado Region,
Brazil. Geoderma 132, 131-142.
DIDIZA, T., 2000. Minister’s Overview. In Landcare Report, 1998-2000. Department of Agriculture,
Pretoria.
DoA, 2005. CASP and LandCare Business Plan for the Department of Agriculture. LandCare,South
Africa.
DOERGE, T.A. & GARDNER, E.H., 1985. Reacidification of two lime amended soils in Eastern
Oregon. Soil Sci. Soc. Amer. J. 49, 680-685.
DOLLING, P.J., PORTER, W.M. & ROWLAND, I.C., 1994. Acidification rates in the central
wheatbelt of Western Australia. II. On a sandy duplex soil. Austr. J. Experm. Agri. 34, 1165-
1172.
DRAPER, N. & SMITH, H., 1981. Applied regression analysis, 2nd edition. John Wiley & Sons, New
York.
127
DU PLESSIS, J., 2003. Maize Production. ARC-Grains Crops Institute, Potchefstroom.
DWIVEDI, B.S., RAM, M., SINGH, B.P., DAS, M. & PRASAD, R.N., 1992. Effect of liming on boron
nutrition of pea (Pisum sativum L.) and corn (Zea mays L.) grown in sequence in an acid Alfisol.
Fertilizer Res. 31, 257-262.
ESRI, 2006. ArcGIS 9.2. Environmental Systems Research Institute, Inc. Redlands, CA.
FAGERIA, N.K. & BALIGAR, V.C., 2003. Fertility management of tropical acid soil for sustainable
crop production p. 359-386. In: Z. Rengel (ed.). Handbook of soil acidity. Marcel Dekker, New
York.
FAO-ISS-ISRIC, 1998. World Reference Base for Soil Resources. World Soil Resource Report 84.
FAO, Rome.
FARINA, M.P.W., SUMNER, M.E., PLANK, C.O. & LETZCH, W.S., 1980. Exchangeable Aluminium
and pH as Indicators of Lime Requirement for Corn. Soil Sci. Soc. Am. J. 44, 1036-1041.
FOLLETT, R.H. & FOLLETT, R.F., 1983. Soil and lime requirements tests for the 50 states and
Puerto Rico. J. Agron. Educ. 12, 9-17.
FÖLSCHER, W.J., 1978. Mikro-elemente in grond en plante. Fert. Soc. S. Afr. J., 25-27.
FOY, C.D., 1984. Physiological effects of hydrogen, aluminium, and manganese toxicities in acid
soil p. 57-97. In: F.Adams. Soil Acidity and Liming. American Society of Agronomy. Madison,
Wisconsin.
FOY, C.D, 1992. Soil chemical factors limiting plant root growth. Adv. Soil Sci. 19, 97-149.
FOY, C.D. & FLEMMING, A.L., 1978. The physiology of plant tolerance to excess available
aluminium and manageses in acid soils p. 301-328. In G.A. Jung. Crop Tolerance to
Suboptimal land conditions. American Society of Agronomy Madison, Wisconsin.
FSSA, 1998. Fertilization: Nitrogen. Fertilizer Society of South Africa, Lynwood Ridge, Pretoria.
FSSA, 2003. Fertilizer handbook, 5th edition. Fertilizer Society of South Africa, Lynwood Ridge,
Pretoria.
GASSER, J.K.R., 1973. An assessment of the importance of some factors causing losses of lime
from agriculture soils. Exp. Husb. 25, 86-95.
GEE, G.W. & BAUDER, J.W., 1986. Particle-size analysis, p. 383-411. In: A. Klute (ed.). Methods
of soil analysis. Part 1, 2nd ed. Agron. Monogr. A. ASA and SSA. Madison, Wisconsin.
GENSTAT., 2003. GENSTAT 4.23, Reference Manual Laws Agricultural Trust, Rothamsted
Experimental Station. Claredon Press, Oxford Science Publications, UK.
GILL, M., 2001. Need for establishment of South Asian conservation agriculture network. In L.
Garcia-Torres, J. Benites & A. Martinez-Vilela, 2001. Conservation Agriculture, A world
Challenge. Proceedings of 1st World Congress on Conservation Agriculture, Madrid.
GRAHAM, R.D. & WELCH, R.M. 2000. Plant food micronutrient composition and human nutrition.
Commun. Soil Sci. Plant Anal. 31, 1627-1640.
GRUNDON, N.J., ROBSON, A.D., LAMBERT, M.J. & SNOWBALL, K., 1997. Nutrient deficiency and
toxicity symptoms, p. 37-50. In: D.J. Reuter & J. B. Robinson. Plant analysis: An interpretation

128
manual, 2nd edition. CSIRO Publishing, Australia.
GUPTA, U.C. & MUNRO, D.C., 1969. Influence of phosphorus on molybdenum content of Brussels
sprouts under field and greenhouse conditions and on recovery of added molybdenum in the
soil. Can. J. Soil Sci. 48, 117-123.
GUPTA, U.C. & MACLEOD, J.A., 1981. Plant and soil boron as influenced by soil pH and calcium
sources on Podzol soils. Soil Sci. 131, 20-25.
HANWAY, J.J., 1962. Corn growth and composition in relation to soil fertility: III. Percentages of N,
P, and K in different plant parts in relation to stage of growth. Agron J. 55, 487-492.
HART, J., 2002. Soils. Crop and soils news/notes. Oregon State University.
HAUMAN, P.E., 1981. A comparison of buffer methods for determining lime requirement of acid
soils of the Highveld region. Agrochemophysica 13,37-41.
HAYNES, R.J., 2001. Improving nutrient use efficiency as a tool for the management of acid soil
p.72-95. In: M. Farina, M. de Villiers, R. Barnard & M. Walters (eds.). Proceedings of the 5th
International Plant-Soil Interactions at low pH. Alpine Heath, KwaZulu-Natal, 2001.
HELYAR, K.R., 1976. Nitrogen cycling and soil acidification. J. of Aust. Inst. of Agric. Sci., 42, 217-
221.
HELYAR, K.R. & PORTER, W.M., 1989. Soil acidification, its measurement and the process
involved, p. 61-101. In: A.D. Robson (ed). Soil acidity and plant growth. Marrickville,
Academic Press, Australia.
HELYAR, K.R., CREGAN, P.D. & GODYN, D.L., 1990. Soil acidity in New South Wales - Current pH
values and estimates of acidification rates. Aust. J. Soil Res. 28, 523-537.
HILL, P.A., 2003. Using geographic information systems (GISs) in soil acidification risk assessments.
In: Rengel, Z. (ed). Handbook of soil acidity. Marcel Dekker Inc., New York.
HOYT, P.B. & HENNING, A.M.F., 1982. Soil acidification by fertilizer and longevity of lime
applications in the Peace river region. Can. J. Soil Sci. 62, 155-163.
JACKSON, M. L., 1956. Soil chemical analysis, 5th edition. Madison, Wisconsin.
JACKSON, M.L., 1958. Organic Matter Determinations for Soils, p. 205-226. In: M.L. Jackson (ed.).
Soil Chemical Analysis. Prentice-Hall inc., USA.
JUO, A.S.R., 1977. Soluble and exchangeable aluminium in Utisols and Alfisols in West Africa.
Commun. Soil Sci. Plant Anal. 8, 17-35.
KAUPPI, P., KŰMŰRI, J., POSCH, M. KAUPPI, L. & MATZNER, E., 1986. Acidification of forest
soils: model development and application for analyzing impacts of acidic deposition in Europe.
Ecol. Modelling 33, 231-253.
MAGDOFF, F.R., BARTLETT, R.J. & ROSS, D.S., 1987. Acidification and pH buffering of forest
soils. Soil Sci. Soc. Am. J. 51, 1384-1386.
MARTIN, A.E. & REEVE, R., 1955. A rapid manometric method for determining soil carbonate. Soil
Science 79, 187–197.
129
MATZNER, E. & MEIWES, K.J., 1994. Long-term development of element fluxes with bulk
precipitation and through fall in two German forests. J. Environ. Qual. 23, 162-166.
MENGEL, K. & KIRKBY, E.A., 1987. Principles of plant nutrition. 4th Revised edition. International
Potash Institute, Bern, Switzerland.
MELSTED, S.W., MOTTO, H.L. & PECK, T.R., 1969. Critical plant nutrient composition values
useful in interpreting plant analysis data. Agron. J. 61, 17-20.
McKEAGUE, J.A. & SHELDRICK, B.H., 1976. A comparison of some methods for determining
carbonates in soils. Canadian Journal of Soil Science 56, 125–127.
McLEAN, E.O., DUMFORD, S.W. & CORONEL, F., 1966. A comparison of several methods of
determining lime requirements of soils. Soil Sc. Am. Proc. 30, 26-30.
McLEAN, E.O., ECKERT, D.J., REDDY, G.Y. & TRIER-WEILER, J.F., 1978. An improved SMP soil
requirement method incorporating double-buffer and quick test features. J. Soil Sci. Soc. Am.
42, 311-316.
McCORMICK, L.H. & BORDEN, F.Y., 1974. The occurrence of aluminium-phosphate precipitate in
plant roots. Soil Sci. Soc. Am. Proc. 38, 931-934.
MÖHR, P.J., 1976. Navorsingsverslag nr. VII: Samevatting en verwerking van resultate van
besmesting- en ander proewe met mielies, sonneblom en bloubuffergras. MVSA-publikasie nr
50. MVSA, Pretoria.
MURPHY, S. (undated). Soil pH and lime requirement for home grounds plantings. Rutgers Soil
Testing Laboratory, Cook College, New Brunswick, NJ.
(http://njaes.rutgers.edu/soiltestinglab/pdfs/ph-Lime-req.pdf).
MYBURGH, W.J. & BREYTENBACH, P.J.J., 2001. Rangeland description and evaluation of the
Mlondozi Landcare Site for livestock production. ARC-Range and Forage Institute, Pretoria.
NEILSEN, D., HOYT, P.B., PARCHOMCHUK, P., NEILSEN, G. & HOGUE, E.J., 1995.
Measurement of the sensitivity of orchard soils to acidification. Can. J. Soil Sci. 75, 391-395.
NOBLE, A.D., MIDDLETON, C., NELSON, P.N. & ROGERS, L.G., 2002. Risk mapping of soil
acidification under Stylosanthes in northern Australian rangelands. Aust. J. Soil Res. 40, 257-
268.
OHKI, K., 1983. Manganese deficiency and toxicity effects on growth, development, and nutrient
composition in wheat. Agron. J. 76, 213-218.
PARKER, M.B., GAINES, T.P., WALKER, M.E., PLANK, C.O. & DAVIS-CARTER, J.G., 1991. Soil
Zinc and pH effects on leaf zinc and the interaction of leaf calcium and zinc on zinc toxicity of
peanuts. Commun. Soil Sci. Plant Anal. 21, 2319-2332.
PODZOLKIN, A.K., 1967. Effect of phosphorus fertilizers on molybdenum uptake plants.
Agrokhimiya 11, 91-94.
PONIZOVSKIY, A.A. & PAMPURA, T.V., 1993. Use of potentiometric titration to describe the buffer
capacity of soils. Eurasian Soil Sci. 25, 106-115.
130
RAYNER, A.A. 1969. A first course in Biometry for agriculture students. University of Natal Press,
Pietermaritzburg.
REDDY, K.J., WANG, L. & GLOSS, S.P., 1995. Solubility and mobility of copper, zinc and lead in
acidic environments. Plant and Soil 171, 53-58.
REEUWIJK, L.D., 2002. Procedures for soil analysis, 6th ed. Tech. pap. 9, ISRIC, Wageningen,
RENGEL, Z. & ROBINSON, D.L., 1989. Competitive Al3+ inhibition of net Mg2+ uptake by intact
Lolium multiflorum roots. Plant physiol. 91, 1407-1413.
REUTER, D.J. & ROBINSON, J. B., 1997. Plant analysis: An interpretation manual, 2nd edition.
CSIRO publishing, Australia.
RIDLEY, A.M., HELYAR, K.R. & SLATTERY, W.J., 1990. Soil acidification under subterranean
clover (Trifolium subterraneum L.) pasture in northern-eastern Victoria. Austr. J. Experim.
Agric. 30, 195-201.
SANCHEZ, P.A., 1976. Properties and management of soils in the tropics. Wiley & Sons, New York.
SCOTT, B.J., CONYERS, M.K., POILE, G.J. & CULLIS, B.R., 1999. Reacidification and reliming
effects on soil properties and wheat yield. Aust. J. of Exp.Agric. 39, 849-856.
SINGH, B., ODEH, I.O.A. & McBRATNEY, A.B, 2003. Acid buffering capacity and potential
acidification of cotton soils in northern New South Wales. Aust. J. Soil.Res. 41, 875-888.
SLATTERY, W.J., CONVYERS, M.K. & AITKEN, R.L., 1999. Soil pH, aluminium, manganese and
lime requirement. In: K.I. Peverill, L.A. Sparrow * D.J. Reuter (eds.). Soil Analysis: An
Interpretation Manual, pp. 103-128. CSIRO PUBLISHING, Melbourne.
SMYTH, T.J. & CRAVO, M.S., 1990. Critical phosphorus levels for corn and cowpea in a Brazilian
Amazon oxisol. Agron. J. 82, 309-312.
SOIL CLASSIFICATION WORKING GROUP, 1991. Soil classification – A Taxonomic System for
South Africa. Soil and Irrigation Research Institute, Department of Agricultural Development,
Pretoria.
STATS SA, 1996. Selected 1996 Census Data by Electoral Ward.
http://www.statssa.gov.za/default3.asp.
STEINER, K.G., 1998. Conserving Natural Resources and Enhancing Food Security by Adopting
No-tillage. TZ-veragsgesellschaft mbH.
STEINKE, M.F., BEUKES, D.J. & BUHMANN, C., 2004. The relationship between acid buffer
capacity and properties of selected soils in a high rainfall area of South Africa, p. 134-136. In:
H. Matsumoto, M. Nanzyo, K. Inubushi, Y. Yamamoto, H. Koyama, M. Saigusa, M. Osaki, & K.
Sakurai (eds.). Proceedings of the 6th International Symposium on Plant–Soil Interaction
under Low pH, 1–5 August, Sendai, Japan.
STEYN, C.E. & HERSELMAN, J.E., 2006. Trace element concentrations in soils under different land
uses in Mpumalanga Province, South Africa. S. Afr. J. Plant Soil, 23, 230- 236.
STRŐHMENGER, P.H.E., 2001. Interactive effects of a calcium and magnesium sulphate enriched
waste water on crop growth and nutrition. M.Sc. Dissertation, University of Pretoria, Pretoria,

131
South Africa.
SUMNER, M.E. & NOBLE, A.D., 2003. Soil acidification: The world story, p.1-28. In: Rengel, Z.
(ed.). Handbook of soil acidity. Marcel Dekker Inc., New York.
TAN, K. & KELTJENS, W.G., 1990. Interaction between aluminium and phosphorus in sorghum
plants. II. Studies with the aluminium tolerant sorghum genotype SC0283. Plant Soil 124, 25-
32.
Theng, B.K.G., 1980. Soils with Variable Charge. New Zealand Society of Soil Science, Soil Bureau,
Department of Scientific and Industrial Research, Lower Hutt, NZ.
THE NON-AFFILIATED SOIL ANALYSIS WORK COMMITTEE, 1990. Handbook of Standard Soil
Testing Methods for Advisory Purposes. Soil Sci. Soc. of South Africa, Pretoria.
THIBAUD, G.R. & FARINA, M.P.W., 2006. Soil properties affecting micronutrient availability with
special emphasis on molybdenum, p. 9-46. In: S Lambrecht (ed.) Proceedings Micronutrients
and Soil Borne Plant Diseases. 16th Annual Interdisciplinary Symposium, ARC-PPRI.
Vredenburg Research Centre, Stellenbosch.
THOMAS, G.W., 1982. Exchangeable cations. In: A.L. Page, R.H. Muller & D.R. Keeney (eds.).
Methods of soil analysis, Part 2. Chemical & microbiological properties. Am. Soc. of Agron.,
Madison, Wisconsin.
TIMMER, V.R. & STONE, E.L., 1978. Comparative foliar analysis of young balsam fir fertilized with
nitrogen, phosphorus, potassium and lime. Soil Sci. Am. J. 42, 125-130.
TIMMER, V.R. & TENG, Y., 1999. Foliar nutrient analysis of sugar maple decline: retrospective
vector diagnosis p.1-10. In: S.B. Horsley & R.P. Long (eds.). Sugar maple ecology and health:
Proceedings of an international symposium. June 2-4, 1998; Warren, PA. Gen. Tech. Rep.
NE-26. Radnor, PA: U.S. Dept. of Agriculture, Forest Service, Northeastern research station.
P. 69-73.
TYLER, G. & OLSSON, T., 2001. Plant uptake of major and minor mineral elements as influenced
by soil acidity and liming. Plant and Soil 230, 307-321.
UEHARA, G. & GILLMAN, G.P., 1981. The mineralogy, chemistry and physics of tropical soils with
variable charge clays. Westview Press, Boulder, CO.
Uehara, G. and Gillman, G.P., 1981. The Mineralogy, Chemistry and Physics of Tropical Soils with
Variable Charge Clays. In: D.L. Plucknett (ed.). Westview Tropical Agriculture Series, No. 4.
Westview Press, Colorado, USA..
ULRICH, A. & HILLS, F.J. 1973. Plant analysis as an aid in fertilizing sugar crops: Part I. Sugar
beets, p. 271-288. In: L.M. Walsh & J.D. Beaton (ed.) Soil testing and plant analysis. Soil
Science Society of America, Madison, WI.
VAN BILJON, J.J., FOUCHE, D.S. & BOTHA, A.D.P., 2004. Threshold values for sulphur in the
main maize producing soils of South Afirca. S. Afr. J. Plant Soil 21, 152-156.
VAN BILJON, J.J., FOUCHE, D.S. & BOTHA, A.D.P., 2008. The lower and upper threshold values,
biological optimum and mineralization of nitrogen in the main maize producing soils of South
132
Africa. S. Afr. J. Plant Soil 25, 8-13.
VAN BREEMEN, N., 1991. Soil acidification and alkalinization. In: B. Ulrich and M.E. Sumner (ed.).
Soil Acidity. Springer: Berlin.
VAN DER MERWE, A. J. & WALTERS, M. M., unpublished. Realization of soil potential: A recipe
for rural development in the former homelands. ARC-ISCW, Pretoria.
VENTER, A., BEUKES, D.J., TWYMAN, L. & STEYN, C.E., 2001. Developing natural soil acidity
maps for South Africa using various techniques p.66. In: M. Farina, M. de Villiers, R. Barnard
& M. Walters (eds.). Proceedings of the 5th International Plant-Soil Interactions at low pH.
Alpine Heath, KwaZulu-Natal, 2001.
WALKER, T.W., 1953. The estimation of the lime requirements of soils. Soil and crop yield data
from the Harper Adams and other liming experiments. J. Soil Sci. 3, 261-276.
WALKLEY, A.S. & BLACK, I.A., 1934. An examination of the segt-java method for determining soil
organic matter & proposed modification of the cromic acid titiration method. Soil Sci. 37, 29-38.
WEAVER, A.R., KISSEL, D.E., CHEN, F., WEST, L.T., ADKINS, W., RICKMAN, D. & LUVAL, J.C.,
2004. Mapping soil pH buffering capacity of selected fields in the coastal plain. Soil Sci. Soc.
Am. J. 68, 662-668.
WEIR, R.G. & CRESSWELL, G.C., 1994. Plant nutrient disorders. 4. Pastures and field crops.
Inkata, Melbourne.
WRIGHT, R.J., 1989. Soil aluminium toxicity and plant growth. Commun. Siol Sci. Plant Anal. 20,
1479-1497.
XABA, G., 2002. An investigation on how an information campaign on liming and conservation
tillage was managed and received in the Mlondozi Landcare project. MA, Mini-dissertation.
University of Pretoria, Department of Information Science, Pretoria.
ZASOSKI, R.J. & BURAU, R.G., 1977. A rapid nitric-perchloric acid digestion method for multi-
element tissue analysis. Comm. Soil Sci. Plant Anal. 8, 425-436.