Methods for Soil Characterization - Agricultural Research Service

SoilCharacterizationReport
Sylvan Complex
University ofMassachusetts
Amherst, MA
Project No. 227638
UMass Amherst
October 2014
woodardcurran.comCOMMITMENT & INTEGRITY DRIVE RESULTS
40 Shattuck Road Suite 110Andover, Massachusetts, 01810

UMass Amherst – Sylvan Complex (227638) i Woodard & CurranSoil Characterization Report October 2014
TABLE OF CONTENTS
SECTION PAGE NO.
1. INTRODUCTION ................................................................................................................................ 1-1
1.1 Background ....................................................................................................................................1-11.2 Conceptual Site Model ...................................................................................................................1-1
2. SOIL CHARACTERIZATION ............................................................................................................. 2-1
2.1 Characterization Sample Collection ...............................................................................................2-12.1.1 Sample Collection Methods............................................................................................................2-12.1.2 Laboratory Analysis ........................................................................................................................2-12.2 Characterization Sample Results Summary...................................................................................2-12.2.1 Building Recess Areas ...................................................................................................................2-22.2.2 Areas Away from the Building ........................................................................................................2-42.2.3 Asphalt ...........................................................................................................................................2-62.2.4 Brick 2-62.3 Data Usability Assessment.............................................................................................................2-6
3. REGULATORY REQUIREMENTS AND NEXT STEPS..................................................................... 3-1
3.1 Communication/Notification Process..............................................................................................3-13.2 State Requirements – Massachusetts Contingency Plan...............................................................3-13.2.1 Notification......................................................................................................................................3-13.2.2 Subsequent MCP Submittals..........................................................................................................3-23.3 Federal Requirements – 40 CFR 761.............................................................................................3-23.4 Project Planning .............................................................................................................................3-2
LIST OF TABLES
TABLE
Table 2-1: Summary of Soil Characterization Sampling Results – Building Recess Areas
Table 2-2: Summary of Soil Characterization Sampling Results – Areas Away from the Building
Table 2-3: Summary of Asphalt and Brick Characterization Sampling Results
LIST OF FIGURES
FIGURE
Figure 1-1: Site Location Map
Figure 2-1: Characterization Sampling Results and Preliminary Extent of PCB Impacted Soils

UMass Amherst – Sylvan Complex (227638) ii Woodard & CurranSoil Characterization Report October 2014
LIST OF APPENDICES
APPENDIX
Appendix A: Analytical Laboratory Reports and Data Validation Summary

UMass Amherst – Sylvan Complex (227638) 1-1 Woodard & CurranSoil Characterization Report October 2014
1. INTRODUCTION
1.1 BACKGROUND
This soil characterization sampling report has been prepared by Woodard & Curran on behalf of the University ofMassachusetts (UMass) document the soil sampling activities and analytical results associated with the assessmentof shallow soils adjacent to three dormitories referred to as the Sylvan Residential Complex on the UMass Amherstcampus.
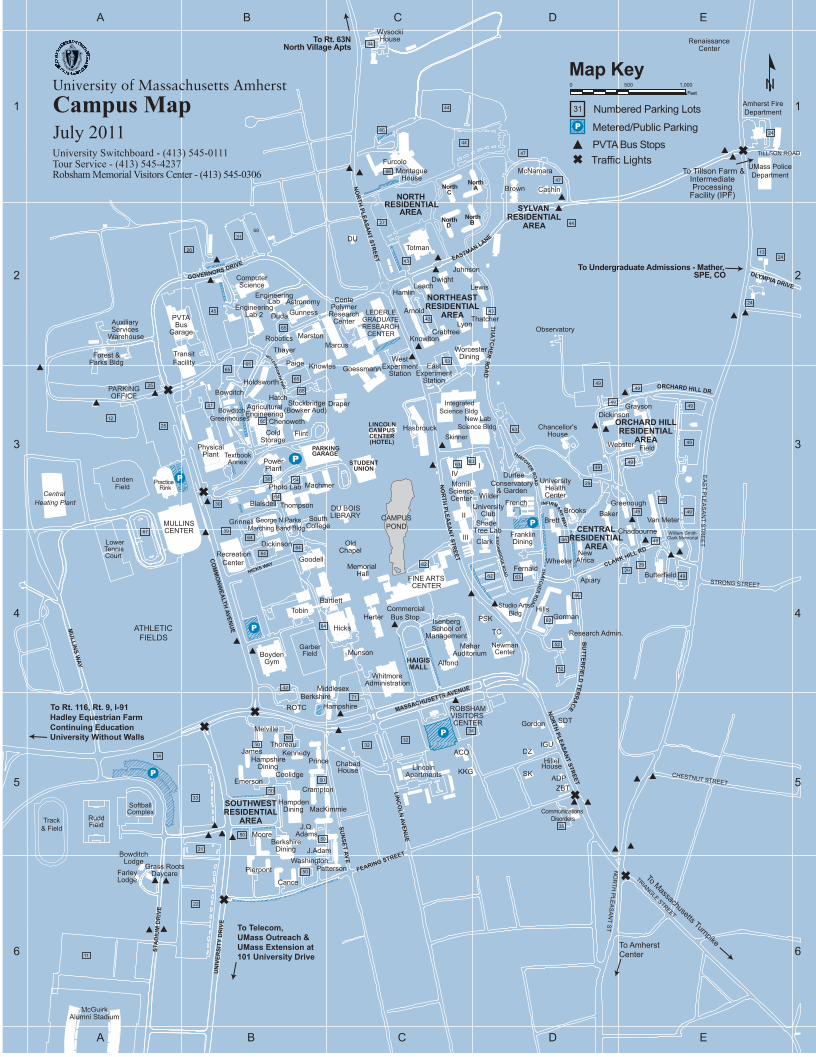
The three dormitories are all of similar construction and built consecutively. These buildings are referred to as theBrown, McNamara, and Cashin Residences (see Figure 1-1). Between 2011 and 2013, UMass conducted buildingenvelope repairs at each of these buildings, including the removal of exterior masonry joints identified as containingpolychlorinated biphenyls (PCBs) at concentrations ≥ 50 parts per million (ppm). These activities were conducted consistent with Remediation Plans submitted to the United States Environmental Protection Agency (EPA) under 40CFR 761. Consistent with the plans and once the repair projects were complete on the three buildings, groundsurfaces surrounding each of the three buildings are being assessed and remediated, as necessary. Uponcompletion of the assessment a Remediation Plan will be prepared and submitted to the EPA for review andapproval.
As part of this assessment, soil results were detected in excess of the Massachusetts Contingency Plan (MCP)reporting requirements and a Release Notification was submitted to the Massachusetts Department of EnvironmentalProtection (MassDEP) on September 25, 2014. Following the notification, the MassDEP issues a Notice ofResponsibility (NOR) on October 2, 2014, which included the submittal of a report summarizing the environmentalassessment activities completed to date as they related to PCBs in soils.
1.2 CONCEPTUAL SITE MODEL
Certain joint caulking used as part of standard construction practices for masonry buildings and concrete structureserected between the 1950’s and late 1970’s is known to have been manufactured with PCBs. PCBs were added tocaulking for durability, resistance to degradation, and as a softener/plasticizer for application. Production andapproved usage of PCBs was halted in the United States in the late 1970s. The Sylvan Residential Area buildingswere constructed during this time period.
In preparation for the building envelope repair projects, material surveys were conducted to check for the presence ofPCBs in caulking. Results from analytical testing indicated that PCBs were present in horizontal and vertical controljoints at concentrations up to 218,700 ppm. Note: some of the vertical controls joints terminated at the groundsurface. PCBs in caulking may leach and/or weather, and/or may be disturbed during renovations or other buildingwork. As such, PCB-containing caulking may come to be located in ground surfaces adjacent to the buildings,including shallow soils.
This report describes the soil assessment activities conducted to date; the regulatory requirements for managing thePCB impacted soils; and a summary description of next steps.

UMass Amherst – Sylvan Complex (227638) 2-1 Woodard & CurranSoil Characterization Report October 2014
2. SOIL CHARACTERIZATION
Samples of soils surrounding each of the three buildings were collected to determine whether or not PCBs werepresent in soils surrounding the three buildings with follow up sampling conducted to delineate the concentrationsand lateral and vertical extent of impact over 1 part per million (ppm).
2.1 CHARACTERIZATION SAMPLE COLLECTION
Characterization sampling of ground surfaces (soil, asphalt, and brick) surrounding the three buildings wasconducted in a phased approach. During the initial phase, characterization samples were collected from soil profileswithin transect locations distributed around each of the three buildings. Within each transect, characterizationsamples were collected from a combination of three distinct profiles selected to provide preliminary characterizationdata for specific building configurations which could have influenced the horizontal and vertical migration of PCBsaway from the control joints over time. At each transect location, two of the three profiles originated at the base ofvertical control joints to evaluate the presence/absence of PCBs at assumed worse-case locations and the verticaland lateral distribution of PCBs at the base of vertical joints. The third profile within each transect originated at theface of the building away from vertical joints to evaluate locations that were not directly adjacent to known sourcelocations.
Results from the initial phase were used to develop the sampling approach for the remaining two phases. Thesecond and third phases focused (in a step-wise manner) on collecting additional data for the purposes of thefollowing:
Determining the presence/absence of ≥ 50 ppm PCB impacts in soils;
Evaluating whether or not there was a difference in the vertical profiles of PCBs impacts within the recessedareas with an increase in distance away from the vertical joints; and
Delineating the lateral extent of PCB impacts > 1 ppm at locations away from the buildings.
2.1.1 Sample Collection Methods
Soil samples were collected over three inch sample intervals to depths of up to 24-27 inches below ground surface(in bgs) using standard environmental sampling techniques. For shallow samples (up to 12 in bgs) samples werecollected primarily with hand tools including trowels and shovels. Deeper soil samples were collected by advancing aGeoprobe LB sampler using a slide hammer to the required depth.
Asphalt and brick samples were collected from a depth of 0-0.5 inches in accordance with USEPA Region 1Standard Operating Procedure for Sampling Porous Surfaces for PCBs (May 2011) using a rotary impact hammerdrill.
2.1.2 Laboratory Analysis
Samples were logged on standard chain of custody (COC) forms and stored on ice for delivery to the analyticallaboratory. Samples were couriered to Con-Test Analytical Laboratory of East Longmeadow, Massachusetts.Samples were extracted using USEPA Method 3540C (Soxhlet Extraction) and analyzed for PCBs using USEPAMethod 8082.
The complete laboratory analytical reports are provided in Appendix A.
2.2 CHARACTERIZATION SAMPLE RESULTS SUMMARY
For the purposes of evaluating ground surface impacts, sample results were divided by media (soil, asphalt, andbrick). Soil samples were further divided into two groups based on proximity to the former vertical joints as follows:
Building Recess Areas (i.e., where the joints terminated at the ground surface); and
Areas Away from the Recesses (where vertical joints terminating at the ground surface were not present).

UMass Amherst – Sylvan Complex (227638) 2-2 Woodard & CurranSoil Characterization Report October 2014
A summary of the characterization sampling results for each of the groups is provided in the sections below. Thelocations of the samples are presented on Figure 2-1 and a summary of analytical results are presented on Tables 2-1 and 2-2, as well as on Figure 2-1.
2.2.1 Building Recess Areas
There are a total of 27 recessed areas within theSylvan Complex (nine per building) that contain 84vertical joints terminating at the ground surfaces (soils,brick, etc.). Of these 84 vertical joints, 69 joints in 24recesses terminate on soil within the recessed areas.Samples were collected at the base of the verticalcontrol joints and at increasing depths and distancesfrom the joints to evaluate the distribution of PCBimpacts in soils within the recessed areas. At leastone characterization soil sample was collected fromsoils in each recess. The locations of the samplescollected and the results from each sample arepresented on Figure 2-1. A summary of analyticalresults is presented on Table 2-1 and the completeanalytical laboratory reports are provided in AppendixA.
Base of the Joint
A total of 35 samples were collected from surficial soils (0-3 in bgs) at the base of the vertical joints(approximately 50% of the locations) to evaluate the presence/absence of PCBs ≥ 50 ppm at these worse-case locations. Analytical results indicated the following:
o Total PCBs were reported at concentrations ≥ 50 ppm in 16 of the 35 samples collected with a median reported concentration of 100 ppm and a maximum reported concentration of 1,900ppm;
o Total PCBs were reported at concentrations > 10 and < 50 ppm in 14 of the samples; and
o Total PCBs were reported at concentrations > 1 ppm and ≤ 10 ppm in 5 of the samples (minimum reported concentration of 6.6 ppm).
A total of 12 samples were taken at the base of the joints at a depth of 12-15 in bgs. Analytical resultsindicated that PCBs were present at concentrations >1 ppm at 8 of these locations with an averageconcentration of 3.4 ppm and a maximum concentration of 7.4 ppm. Analytical results from the other 4locations indicated that PCBs were non-detect (< 0.11 ppm) or present at concentrations of 0.18, 0.98,and 0.37 ppm.
A total of 12 samples were taken at the base of the joints at a depth of 24-27 in bgs. Analytical resultsindicated that PCBs were present at concentrations > 1 ppm at one location (2.4 ppm). The remainingresults indicated that PCBs were either non-detect (7 samples at < 0.11 or < 0.12 ppm) or present atconcentrations ≤ 1 ppm with total PCBs reported at concentrations of 0.71, 0.35, 0.22, and 0.56 ppm.
Seven soil samples were collected at a distance of five lateral feet from the base of the joint at a depthof 12-15 in bgs to determine if there was a difference in the vertical profile of PCB impacts withincreasing distance away from the vertical joints. Analytical results from three of these locationsindicated that PCBs were present at concentrations > 1 mg/kg with a maximum concentration of 2.7ppm. The remaining four samples indicated that PCBs were present at concentrations ranging from0.11 to 0.78 ppm.
Typical Building Recess
Vertical Joints
UMass Amherst – Sylvan Complex (227638) 2-3 Woodard & CurranSoil Characterization Report October 2014
Based on these results, PCBs ≥ 50 ppm are present in soils at the base of approximately 50% of the vertical joints. As such, additional characterization sampling may be conducted prior to excavation to determine the concentration ofPCBs at the base of the remaining 34 vertical joints for waste segregation purposes (soils at the base of the joints areto be removed for disposal as either ≥ 50 ppm PCB remediation waste or < 50 ppm PCB remediation waste).
Vertically, PCB impacts at the base of the joints are assumed to extend to a distance of 18 in bgs based on theresults from soil samples collected from 12-15 in bgs (8 of 12 samples containing PCBs > 1 ppm) and from 24-27 inbgs (PCBs non-detect or ≤ 1 ppm in 11 of 12 samples).
Results from the samples collected five lateral feet from the joints were consistent with the results from samplescollected at the same depth interval at the base of the vertical joints (i.e., PCBs > 1 ppm in approximately 50% of thesamples collected). As such, the data does not indicate that the vertical profile of PCB impacts changes from thebase of the joints to a distance of five feet away.
Ten Feet from Joint
Ten surficial soil samples (0-3 in bgs) were collected at a distance of ten feet from the joints within therecessed areas. Analytical results indicated that PCBs were present at concentrations ranging from1.55 to 23.6 ppm with two samples reported to contain PCBs at concentrations > 10 ppm (12.3 and23.6 ppm).
Ten soil samples were collected at a depth of 12-15 in bgs. Analytical results indicated PCBs wereeither non-detect (2 samples at < 0.11 ppm) or present at concentrations ≤ 1 ppm (8 samples with an average concentration of approximately 0.59 ppm and a maximum concentration of 1.04 ppm).
Based on the maximum reported concentration of 23.6 ppm in surficial soils at a distance of ten feet from the joints,surficial soil impacts ≥ 50 ppm appear to be limited to within ten feet of the vertical joints. In addition, the vertical profile of PCB impacts changes at a distance of ten feet from the vertical joints with PCB impacts limited to the upper12 inches of soils.
Twenty Feet from Joint
Three surficial soil samples (0-3 in bgs) were collected at a distance of 20 feet from vertical joints withinthe recessed areas. Analytical results indicated PCBs were present at concentrations of 0.97, 1.03,and 1.4 ppm.
These results provide further support for the decreasing concentration of PCBs in surficial soils with distance from thevertical joints.
Data Summary
A summary of the analytical results from soils within the recessed areas, in reference to distance from the verticaljoints and depth below ground surface, is presented on the table below. As shown on the table, highest PCBconcentrations were detected in shallow soils adjacent to vertical joints and decrease with lateral and verticaldistance from the joints. Additional characterization sampling will be conducted prior to remedy implementation toconfirm the vertical extent of PCB impacts within the recessed areas and for waste segregation purposes (soils to bemanaged as either ≥ 50 ppm PCB Remediation Waste or < 50 ppm PCB Remediation Waste).

UMass Amherst – Sylvan Complex (227638) 2-4 Woodard & CurranSoil Characterization Report October 2014
Depth ofSample(in bgs)
Lateral Distance from Vertical Joint and PCB Detection/Concentration Summary
0 5 10 20
0-3
35 samples collected (50% ofjoints); 16 samples ≥ 50 ppm
(max. of 1,900 ppm); 14 samples> 10 and < 50 ppm; 5 samples > 1
and ≤ 10 ppm
No samples collected
10 samples collected; 2 samples> 10 ppm (12.3 and 23.6 ppm); 8samples > 1 and ≤ 10 ppm (max. of 9.6 ppm and avg. of 4.8 ppm)
3 samples collected; 1sample > 1 ppm (1.4ppm); 2 samples ≤ 1 ppm (0.97 and 1.03
ppm)
12-15 12 samples collected; 6 > 1 ppm(max. of 7.4 ppm and avg. of 3.4ppm); 6 samples ND or ≤ 1 ppm
7 samples collected; 3 samples> 1 ppm (max. of 2.7 ppm andavg. of 1.9 ppm); 4 samples ≤ 1 ppm (max. of 0.78 and avg.
of 0.48 ppm)
10 samples collected; 8 samples≤ 1 ppm (max. of 1.04 ppm and
avg. of 0.59 ppm); 2 samples ND(< 0.11 ppm)
24-27 12 samples collected; 1 sample >1 ppm (2.4 ppm); 11 samples ND
or < 1 ppm (max. of 0.71 ppm)
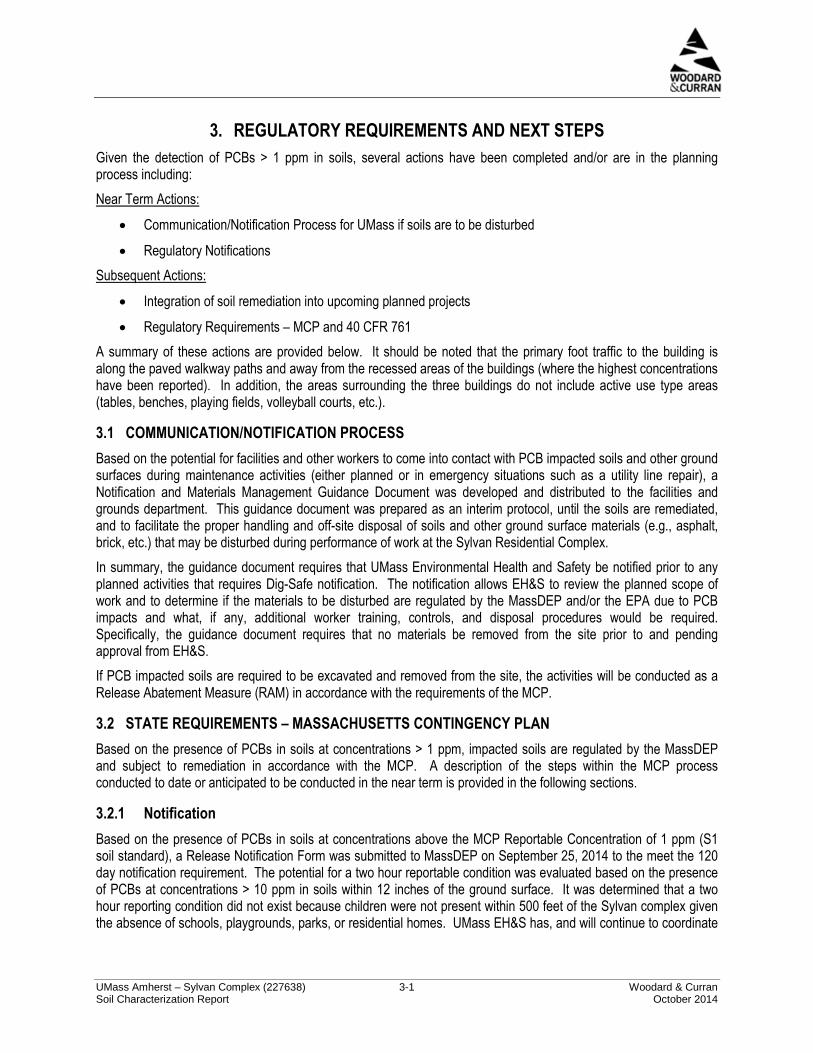
2.2.2 Areas Away from the Building
Soils beyond the recessed areas were sampled to assess the extent of impacts in soils without a direct PCB sourceterminating at the ground surfaces (i.e., the former vertical joints). Samples were collected at lateral distances up to25 feet away from the buildings and at depths of up to 24-27 in bgs (at the base of the building only). The locationsof the samples collected and the results from each sample are presented on Figure 2-1. A summary of analyticalresults is presented on Table 2-2 and the complete analytical laboratory reports are provided in Appendix A.
Immediately adjacent to building
Six samples of surficial soils (0-3 in bgs) were collected from locations at the base of the building butaway from the vertical control joints to evaluate the extent of PCB impacts in areas without a directtransfer path to the soils. Analytical results indicated that PCBs ranged from 1.58 to 10.7 ppm.
Six samples were collected at a depth of 12-15 in bgs. Analytical results from two of these samplesindicated PCBs were present at concentrations > 1 ppm with reported concentrations of 1.4 and 1.6ppm (both samples collected from Cashin). Analytical results from the remaining four samplesindicated that PCBs were either non-detect (1 sample at < 0.10 ppm) or present at concentrations of0.35, 0.55, and 0.71 ppm.
Six samples were collected at a depth of 24-27 in bgs. Analytical results indicated that PCBs wereeither non-detect (5 samples at < 0.11 ppm) or present at a concentration of 0.11 ppm.
Based on the analytical results described above, PCB impacts to soils at the base of the building but away from thevertical joints are consistent with impacts to other shallow soils collected at distances from the vertical joints. Assuch, this data supports the conceptual site model that PCBs in soils appear to have originated primarily from theformer vertical caulked joints.
Area Away from the Building
Characterization sampling of soils away from the building were collected during each of the three rounds of samplingto delineate the lateral and vertical extent of PCB impacts in soils away from the building. Samples were collected atdistances of up to 25 feet away from the building and at depths of up to 12-15 in bgs. A summary of the results of thesampling for each building is presented below.
UMass Amherst – Sylvan Complex (227638) 2-5 Woodard & CurranSoil Characterization Report October 2014
Cashin – A total of 33 characterization samples were collected from soils away from the Cashin building. Asummary of the analytical results for surficial and deeper soils is as follows:
o Surficial Soils – Analytical results indicated that PCBs were present in surficial soils (0-3 in bgs) todistances of between ten and twenty feet from the building in most areas surrounding the Cashinbuilding. The exception to this is along a portion of the north side of the building where analyticalresults indicate that impacts are limited to soils within five feet of the building. As shown on Figure2-1, the extent of PCB impacts in some areas (primarily off of the west side and southeast cornersof the building) have been inferred and will require additional characterization sampling to confirmthe extent.
o Deeper Soils – Analytical results from the nine samples collected from depths of 6-9 in bgs (1sample due to obstruction at depth) and 12-15 in bgs indicated that PCBs were either non-detect (1sample at < 0.11 ppm) or present at concentrations ≤ 1 ppm (total PCBs reported at concentrations up to 0.29 ppm).
Brown – A total of 32 characterization samples were collected from soils away from the Brown building. Asummary of the analytical results for surficial and deeper soils is as follows:
o Surficial Soils – Analytical results indicated that PCBs were present in surficial soils (0-3 in bgs) toa distance of five feet along the north, west, and southwest corner of the building. Along the eastside of the building, PCB impacts extend to a distance of ten feet from the building. As shown onFigure 2-1, the extent of PCB impacts away from the southeast corner of the Brown building havebeen inferred and will require additional characterization sampling to confirm the extent.
o Deeper Soils – Analytical results from six of the seven samples collected from depths of 12-15 inbgs indicated that PCBs were either non-detect (3 sample at < 0.11 and < 0.12 ppm) or present atconcentrations ≤ 1 ppm (3 samples at 0.11, 0.15, and 0.35 ppm). Analytical results from the seventh sample (collected on the east side of the building) indicated that PCBs were present at aconcentration of 5.2 ppm.
McNamara – A total of 32 characterization samples were collected from soils away from the Brown building.A summary of the analytical results for surficial and deeper soils is as follows:
o Surficial Soils – As shown on Figure 2-1, analytical results indicated that PCBs were present insurficial soils (0-3 in bgs) to distances of up to 25 feet from the McNamara building with impactstypically present at distances of between ten and twenty feet. As depicted on Figure 2-1, theextent of impacts away from the building along the southwest and southeast corners as well asalong the majority of the north elevation, have been inferred and will require additionalcharacterization sampling to confirm the extent.
o Deeper Soils – Analytical results from the eleven samples collected from depths of 12 to 15 in bgsindicated that PCBs were either non-detect (5 sample at < 0.11 ppm) or present at concentrations≤ 1 ppm (total PCBs reported at concentrations up to 0.85 ppm and an average concentration of 0.42 ppm).
Based on the analytical results described above, PCB impacts are typically present in soils at distances of up tobetween ten and twenty feet from the buildings with some areas of lesser or greater lateral extent identified aspresented above. Vertically, PCB impacts are limited to the upper 12 inches of soils in areas away from thebuildings. Additional characterization sampling may be conducted prior to remedy implementation to confirm thevertical and lateral extent of PCB impacts in those areas where the extent has been inferred.

UMass Amherst – Sylvan Complex (227638) 2-6 Woodard & CurranSoil Characterization Report October 2014
2.2.3 Asphalt
Asphalt samples were collected from each of the six walkways located on the ends of the buildings. During the firstround of sampling, one sample per walkway was collected at the base of the building to evaluate potential worse-case conditions (i.e., directly below the vertical caulked joints located above the entrance doors). Analytical resultsindicated that PCBs were present at concentrations > 1 ppm in four of the six samples with concentrations up to 8.5ppm. Analytical results from the other two samples indicated that PCBs were present at concentrations of 0.89 and0.91 ppm.
Based on these results, one additional sample was collected at each building during the second round of sampling todelineate the horizontal extent of PCB impacts > 1 ppm. Results from the second round of sampling indicated that ata distance of ten feet from the building PCBs were present at concentrations > 1 ppm with reported concentrations of1.6, 2.6, and 2.9 ppm. At each of the three locations, the concentrations of PCBs were observed to decrease fromthat reported at the base of the building.
Sample locations are depicted on Figure 2-1. A summary of the analytical results is presented on Table 2-3 and thecomplete analytical laboratory reports are provided in Appendix A.
2.2.4 Brick
Two brick pads are present on each of the three buildings. Based on the presence of a vertical caulked joint aboveeach pad, one brick sample was collected at each building to evaluate potential worse-case conditions. Analyticalresults indicated that PCBs were non-detect in one sample (< 0.099 ppm) and present at concentrations of 0.45 and2.7 ppm. Based on these results, PCB impacts may be present on the three brick pads that have not been sampled.Prior to finalization of the remediation plan, additional samples of the three pads will be collected. Brick materials willbe managed based on the results of the characterization sampling and in accordance with the overall projectrequirements. Sample locations are depicted on Figure 2-1. A summary of the analytical results is presented onTable 2-3 and the complete analytical laboratory reports are provided in Appendix A.
2.3 DATA USABILITY ASSESSMENT
This data quality and data usability assessment has been conducted to review the samples collected in support of theremediation and verification activities. Data validation and review was conducted by Woodard & Curran and a third-party validator, Data Check, Inc. of New Durham, New Hampshire. This review included a check of fielddocumentation including sample collection and preservation methods, a check of the laboratory data anddocumentation, a review of the internal laboratory QA/QC procedures and results including surrogate recoveries,blank results, matrix spike (MS) and matrix spike duplicate (MSD) results, laboratory control standard (LCS) andlaboratory control standard duplicate (LCSD) results, an evaluation of sample holding times, and field duplicateresults. Data Check’s data validation summaries are provided in Appendix A.
A summary of the data usability assessment for the data is presented below:
All samples were extracted by USEPA Method 3540C (Soxhlet Extraction) and analyzed for PCBs byUSEPA Method 8082.
Consistent procedures and laboratory analysis of the data were achieved. Sample containers were packedon ice and delivered to the laboratory under standard chain of custody procedures. All samples wereextracted and analyzed within allowable holding times for the method with the exception of the six sampleswithin sample delivery groups (SDG) 14F0363, 14F0365, and 14F0366 which were extracted beyond the 14day technical holding limit due to being placed on hold pending the results of other samples collected at thesame time (actual hold times for these samples were between 19 and 21 days from sample collection toextraction). Given that the holding time allowed by the analytical method (USEPA method 8082) is one yearfor non-aqueous samples and that the samples were preserved properly, the data was considered usableand the data was qualified as estimated (J, UJ).

UMass Amherst – Sylvan Complex (227638) 2-7 Woodard & CurranSoil Characterization Report October 2014
Samples were received at the laboratory within the acceptable temperature range (4º Celsius +/-2º). Noqualifications have been applied.
The data packages were reviewed to ensure that all sample and associated quality assurance results wereavailable. Results of the completeness review indicated that all collected samples were analyzed and allquality control results were available to complete the data validation process.
Some samples were analyzed at dilutions due to the high concentration of PCBs present in the samplesand/or due to sample matrix. Elevated quantitation limits are reported in these samples as a result of thedilutions.
A total of 13 field duplicate samples were collected during the sampling events to evaluate the precision ofthe sample results. Relative percent difference (RPD) between the primary and associated duplicatesamples met the acceptance criteria with the exception of results between four primary and duplicate pairs.Analytical results from these samples were qualified as estimated (J).
The RPD between sample column results for individual samples were evaluated to evaluate the precision ofthe results. The RPD between sample column results were evaluated and determined to be outside theacceptance criteria (≤ 25 %) in several samples. Analytical results for the affected samples were qualified as estimated (J).
Accuracy of the analytical data was assessed by reviewing the recoveries for MS, MSD, LCS, and LCSD.The Aroclor 1260 MS/MSD results from some samples did not meet the acceptance criteria; however, noqualifications were applied due to Aroclor 1254 interferences. LCS/LCSD recoveries met the acceptancecriteria. No qualifications were applied.
Accuracy of the analytical data was assessed by reviewing the surrogate recoveries. All PCB surrogaterecoveries met the acceptance criteria or were diluted out. No qualifications were applied.
The PCB method blank and field blank samples were non-detect for all target analytes. No qualificationswere applied.
According to the case narratives, for Aroclor 1232, 1254, and/or 1260 results in several samples “Samplefingerprint does not match standard exactly. Aroclor with the closest matching pattern is reported.” Noqualifications were applied to the data based on the case narratives.
According to the case narrative for Aroclor 1254 or 1260 in several samples, “Sample contains twoincompletely resolved Aroclors. Aroclor with the closest matching pattern is reported.” No qualificationswere applied to the data based on the case narrative.
Based on this review, the data adequately represents the materials tested, and the samples are considered usablefor the purposes of characterizing PCB-affected media.
UMass Amherst – Sylvan Complex (227638) 3-1 Woodard & CurranSoil Characterization Report October 2014
3. REGULATORY REQUIREMENTS AND NEXT STEPS
Given the detection of PCBs > 1 ppm in soils, several actions have been completed and/or are in the planningprocess including:
Near Term Actions:
Communication/Notification Process for UMass if soils are to be disturbed
Regulatory Notifications
Subsequent Actions:
Integration of soil remediation into upcoming planned projects
Regulatory Requirements – MCP and 40 CFR 761
A summary of these actions are provided below. It should be noted that the primary foot traffic to the building isalong the paved walkway paths and away from the recessed areas of the buildings (where the highest concentrationshave been reported). In addition, the areas surrounding the three buildings do not include active use type areas(tables, benches, playing fields, volleyball courts, etc.).
3.1 COMMUNICATION/NOTIFICATION PROCESS
Based on the potential for facilities and other workers to come into contact with PCB impacted soils and other groundsurfaces during maintenance activities (either planned or in emergency situations such as a utility line repair), aNotification and Materials Management Guidance Document was developed and distributed to the facilities andgrounds department. This guidance document was prepared as an interim protocol, until the soils are remediated,and to facilitate the proper handling and off-site disposal of soils and other ground surface materials (e.g., asphalt,brick, etc.) that may be disturbed during performance of work at the Sylvan Residential Complex.
In summary, the guidance document requires that UMass Environmental Health and Safety be notified prior to anyplanned activities that requires Dig-Safe notification. The notification allows EH&S to review the planned scope ofwork and to determine if the materials to be disturbed are regulated by the MassDEP and/or the EPA due to PCBimpacts and what, if any, additional worker training, controls, and disposal procedures would be required.Specifically, the guidance document requires that no materials be removed from the site prior to and pendingapproval from EH&S.
If PCB impacted soils are required to be excavated and removed from the site, the activities will be conducted as aRelease Abatement Measure (RAM) in accordance with the requirements of the MCP.
3.2 STATE REQUIREMENTS – MASSACHUSETTS CONTINGENCY PLAN
Based on the presence of PCBs in soils at concentrations > 1 ppm, impacted soils are regulated by the MassDEPand subject to remediation in accordance with the MCP. A description of the steps within the MCP processconducted to date or anticipated to be conducted in the near term is provided in the following sections.
3.2.1 Notification
Based on the presence of PCBs in soils at concentrations above the MCP Reportable Concentration of 1 ppm (S1soil standard), a Release Notification Form was submitted to MassDEP on September 25, 2014 to the meet the 120day notification requirement. The potential for a two hour reportable condition was evaluated based on the presenceof PCBs at concentrations > 10 ppm in soils within 12 inches of the ground surface. It was determined that a twohour reporting condition did not exist because children were not present within 500 feet of the Sylvan complex giventhe absence of schools, playgrounds, parks, or residential homes. UMass EH&S has, and will continue to coordinate

UMass Amherst – Sylvan Complex (227638) 3-2 Woodard & CurranSoil Characterization Report October 2014
with the Residential Life department to understand/communicate the housing of advisors with children in Sylvan orthe abutting residential areas without implementing different measures.
3.2.2 Subsequent MCP Submittals
If a permanent solution is not achieved within one year of the date of notification (e.g., soil removal and off-sitedisposal) a Tier Classification Phase I will be prepared/submitted on or before September 25, 2015 to meet therequirements of the MCP. It is anticipated that any soil removal activities will be conducted as a RAM. AdditionalMCP required submittals (Phase II/III) will also be prepared and submitted, as needed.
3.3 FEDERAL REQUIREMENTS – 40 CFR 761
As part of the remediation planning for the exterior rehabilitation project, PCB Remediation Plans were submitted tothe EPA for the remediation of PCB containing building materials at each of the three buildings. As part of the plansubmittals, UMass presented the plan to evaluate and remediate soils surrounding the three buildings as a singleproject following completion of the exterior projects.
Based on the analytical data collected to date and the former PCB source materials (exterior expansion jointcaulking), soils surrounding the three Sylvan buildings that have been impacted by PCBs meet the definition of aPCB Remediation Waste under 40 CFR 761.3. As such, the remediation of these soils will be conducted inaccordance with 40 CFR 761.61 and a remediation plan will be submitted to EPA for review and approval prior toremediation.
3.4 PROJECT PLANNING
Remediation of PCB impacted soils will be conducted as part of a larger utility and ground surface upgrade projectwithin the Sylvan complex to be conducted over the next several years. The project will involve personnel frommultiple departments within UMass and is currently in the initial planning stages. The remediation of PCB impactedground surfaces will be integrated into the overall project with particular consideration given to utility work, grading,mapping of new hardscape surfaces, and tree protection/removal. At this time, the overall project schedule has notbeen established; however, it is anticipated that excavation may commence in 2016.

Table 2-1
Summary of Soil Characterization Sampling Results
Building Recess Areas
Sylvan Complex
UMass Amherst
LocationDepth
(in bgs)Building Sample ID Sample Date
SR-CBS-111(0-3) 5/20/2014 8.9
SR-CBS-121(0-3) 5/20/2014 10.1
SR-CBS-211(0-3) 5/20/2014 30.9 J
SR-CBS-221(0-3) 5/20/2014 10.2
CR-CBS-161(0-3) 9/2/2014 1900
CR-CBS-231 10/3/2014 92
CR-CBS-232 10/3/2014 42
CR-CBS-233 10/3/2014 48
CR-CBS-234 10/3/2014 110
CR-CBS-236 10/3/2014 23
CR-CBS-238 10/3/2014 59
SR-CBS-511(0-3) 5/21/2014 16.1
SR-CBS-521(0-3) 5/21/2014 14.1 J
SR-CBS-611(0-3) 5/21/2014 12.9
SR-CBS-621(0-3) 5/21/2014 2.62
BR-CBS-120(0-3) 9/2/2014 1800
BR-CBS-114(0-3) 9/2/2014 34
BR-CBS-201 10/3/2014 76
BR-CBS-204 10/3/2014 100
BR-CBS-207 10/3/2014 220
BR-CBS-210 10/3/2014 190
BR-CBS-211 10/3/2014 26
BR-CBS-212 10/3/2014 57
SR-CBS-311(0-3) 5/21/2014 21.2
SR-CBS-321(0-3) 5/21/2014 6.6
SR-CBS-411(0-3) 5/22/2014 18.1 J
SR-CBS-421(0-3) 5/22/2014 6.9 J
MR-CBS-171(0-3) 9/2/2014 7.7
MR-CBS-138(0-3) 9/2/2014 50
MR-CBS-213 10/3/2014 120
MR-CBS-214 10/3/2014 13
MR-CBS-219 10/3/2014 55
MR-CBS-220 10/3/2014 540
MR-CBS-223 10/3/2014 88
MR-CBS-224 10/3/2014 110
Brown
Total PCBs
(mg/kg)
Cashin
McNamara
0-3Base of Joint
UMass Amherst Sylvan Complex (227638)
Table 2-1 1 of 3Woodard Curran
October 2014

Table 2-1
Summary of Soil Characterization Sampling Results
Building Recess Areas
Sylvan Complex
UMass Amherst
LocationDepth
(in bgs)Building Sample ID Sample Date
Total PCBs
(mg/kg)
SR-CBS-111(12-15) 5/20/2014 7.4
SR-CBS-121(12-15) 5/20/2014 1.4
SR-CBS-211(12-15) 5/20/2014 1.8
SR-CBS-221(12-15) 5/20/2014 0.18
SR-CBS-511(12-15) 5/21/2014 3.9 J
SR-CBS-521(12-15) 5/21/2014 3.8 J
SR-CBS-611(12-15) 5/21/2014 0.98
SR-CBS-621(12-15) 5/21/2014 < 0.11
SR-CBS-311(12-15) 5/21/2014 1.03
SR-CBS-321(12-15) 5/21/2014 1.06
SR-CBS-411(12-15) 5/22/2014 2.07
SR-CBS-421(12-15) 5/22/2014 0.34
SR-CBS-111(24-27) 5/20/2014 0.71
SR-CBS-121(24-27) 5/20/2014 < 0.11
SR-CBS-211(24-27) 5/20/2014 2.4
SR-CBS-221(24-27) 5/20/2014 0.35
SR-CBS-511(24-27) 5/20/2014 0.22
SR-CBS-521(24-27) 5/20/2014 < 0.11
SR-CBS-611(24-27) 5/20/2014 0.56
SR-CBS-621(24-27) 5/20/2014 < 0.11
SR-CBS-311(24-27) 5/21/2014 < 0.11
SR-CBS-321(24-27) 5/21/2014 < 0.11
SR-CBS-411(24-27) 5/22/2014 < 0.12
SR-CBS-421(24-27) 5/22/2014 < 0.11
Cashin CR-CBS-162(12-15) 9/2/2014 2
BR-CBS-121(12-15) 9/2/2014 0.66
BR-CBS-115(12-15) 9/2/2014 0.78
BR-CBS-111(12-15) 9/2/2014 1.1
MR-CBS-170(12-15) 9/2/2014 0.11
MR-CBS-131(12-15) 9/2/2014 2.7
MR-CBS-139(12-15) 9/2/2014 0.35
SR-CBS-112(0-3) 5/20/2014 4.9
SR-CBS-122(0-3) 5/20/2014 2.7
SR-CBS-212(0-3) 5/20/2014 9.6
SR-CBS-512(0-3) 5/21/2014 12.3 J
SR-CBS-522(0-3) 5/21/2014 6 J
SR-CBS-612(0-3) 5/21/2014 1.55 J
SR-CBS-312(0-3) 5/21/2014 6.4
SR-CBS-322(0-3) 5/21/2014 23.6
SR-CBS-412(0-3) 5/22/2014 5.4
SR-CBS-422(0-3) 5/22/2014 2.04
McNamara
Brown
Cashin
Cashin
Brown
0-3
McNamara
Brown
Cashin
McNamara
12-15
McNamara
Brown
24-27
12-15
Base of Joint
10 Feet from
Joint
5 Feet from
Joint
UMass Amherst Sylvan Complex (227638)
Table 2-1 2 of 3Woodard Curran
October 2014

Table 2-1
Summary of Soil Characterization Sampling Results
Building Recess Areas
Sylvan Complex
UMass Amherst
LocationDepth
(in bgs)Building Sample ID Sample Date
Total PCBs
(mg/kg)
SR-CBS-112(12-15) 5/20/2014 0.96
SR-CBS-122(12-15) 5/20/2014 0.47
SR-CBS-212(12-15) 5/20/2014 1.04 J
SR-CBS-512(12-15) 5/20/2014 0.5
SR-CBS-522(12-15) 5/20/2014 0.15
SR-CBS-612(12-15) 5/20/2014 0.37
SR-CBS-312(12-15) 5/21/2014 0.39
SR-CBS-322(12-15) 5/21/2014 0.8
SR-CBS-412(12-15) 5/22/2014 < 0.11
SR-CBS-422(12-15) 5/22/2014 < 0.11
Cashin SR-CBS-113(0-3) 5/20/2014 1.03 J
Brown SR-CBS-513(0-3) 5/21/2014 0.97
McNamara SR-CBS-313(0-3) 5/21/2014 1.4
0-3
McNamara
12-15
Cashin
Brown10 Feet from
Joint
20 Feet from
Joint
Notes:Soil samples submitted for extraction via USEPA method 3540C and analyzed for PCBs via USEPAmethod 8082.in. bgs. = inches below ground surfaceJ = Analytical resutls qualified as estimated based on data validation. See Appendix A for
UMass Amherst Sylvan Complex (227638)
Table 2-1 3 of 3Woodard Curran
October 2014
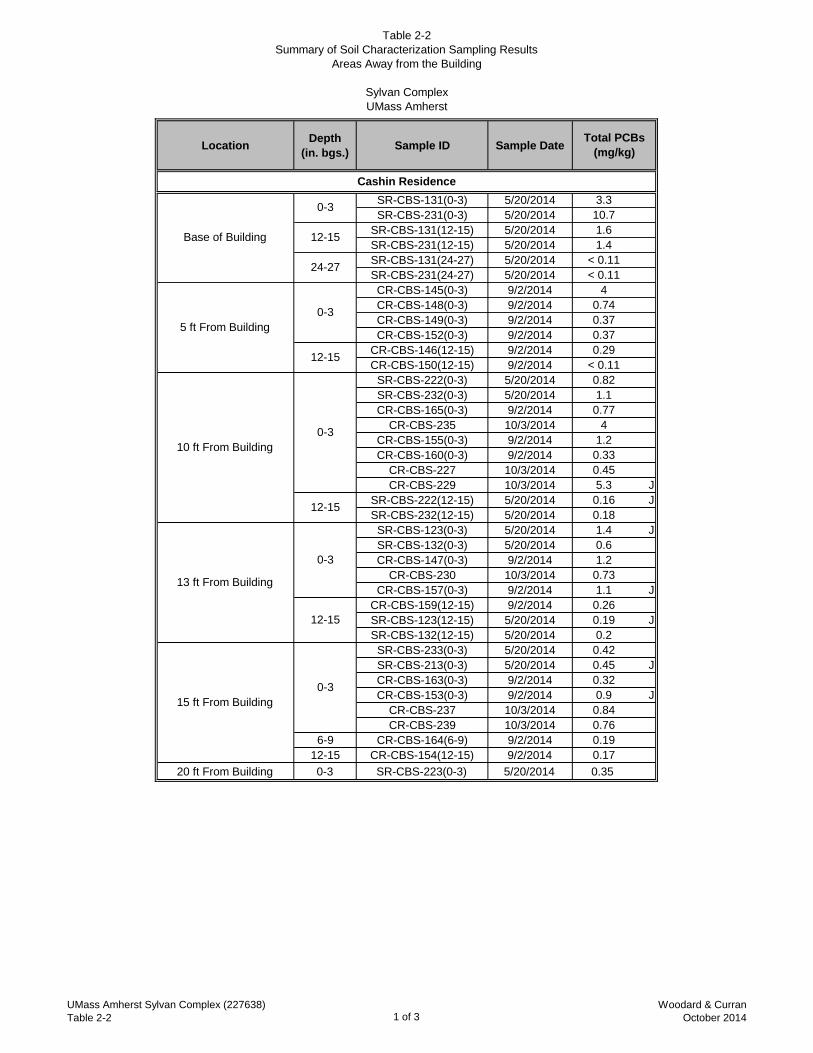
Table 2-2Summary of Soil Characterization Sampling Results
Areas Away from the Building
Sylvan ComplexUMass Amherst
LocationDepth
(in. bgs.)Sample ID Sample Date
SR-CBS-131(0-3) 5/20/2014 3.3
SR-CBS-231(0-3) 5/20/2014 10.7
SR-CBS-131(12-15) 5/20/2014 1.6
SR-CBS-231(12-15) 5/20/2014 1.4
SR-CBS-131(24-27) 5/20/2014 < 0.11
SR-CBS-231(24-27) 5/20/2014 < 0.11
CR-CBS-145(0-3) 9/2/2014 4
CR-CBS-148(0-3) 9/2/2014 0.74
CR-CBS-149(0-3) 9/2/2014 0.37
CR-CBS-152(0-3) 9/2/2014 0.37
CR-CBS-146(12-15) 9/2/2014 0.29
CR-CBS-150(12-15) 9/2/2014 < 0.11
SR-CBS-222(0-3) 5/20/2014 0.82
SR-CBS-232(0-3) 5/20/2014 1.1
CR-CBS-165(0-3) 9/2/2014 0.77
CR-CBS-235 10/3/2014 4
CR-CBS-155(0-3) 9/2/2014 1.2
CR-CBS-160(0-3) 9/2/2014 0.33
CR-CBS-227 10/3/2014 0.45
CR-CBS-229 10/3/2014 5.3 J
SR-CBS-222(12-15) 5/20/2014 0.16 J
SR-CBS-232(12-15) 5/20/2014 0.18
SR-CBS-123(0-3) 5/20/2014 1.4 J
SR-CBS-132(0-3) 5/20/2014 0.6
CR-CBS-147(0-3) 9/2/2014 1.2
CR-CBS-230 10/3/2014 0.73
CR-CBS-157(0-3) 9/2/2014 1.1 J
CR-CBS-159(12-15) 9/2/2014 0.26
SR-CBS-123(12-15) 5/20/2014 0.19 J
SR-CBS-132(12-15) 5/20/2014 0.2
SR-CBS-233(0-3) 5/20/2014 0.42
SR-CBS-213(0-3) 5/20/2014 0.45 J
CR-CBS-163(0-3) 9/2/2014 0.32
CR-CBS-153(0-3) 9/2/2014 0.9 J
CR-CBS-237 10/3/2014 0.84
CR-CBS-239 10/3/2014 0.76
6-9 CR-CBS-164(6-9) 9/2/2014 0.19
12-15 CR-CBS-154(12-15) 9/2/2014 0.17
20 ft From Building 0-3 SR-CBS-223(0-3) 5/20/2014 0.35
12-15
Cashin Residence
0-3
0-3
12-15
15 ft From Building
24-27
0-3
0-3
12-15
13 ft From Building
12-15
Total PCBs
(mg/kg)
5 ft From Building
0-3
10 ft From Building
Base of Building
UMass Amherst Sylvan Complex (227638)Table 2-2 1 of 3
Woodard & CurranOctober 2014

Table 2-2Summary of Soil Characterization Sampling Results
Areas Away from the Building
Sylvan ComplexUMass Amherst
LocationDepth
(in. bgs.)Sample ID Sample Date
Total PCBs
(mg/kg)
SR-CBS-531(0-3) 5/21/2014 1.58
SR-CBS-631(0-3) 5/21/2014 2.23
SR-CBS-531(12-15) 5/21/2014 0.35
SR-CBS-631(12-15) 5/21/2014 < 0.10
SR-CBS-531(24-27) 5/21/2014 < 0.10
SR-CBS-631(24-27) 5/21/2014 < 0.11
BR-CBS-200 10/3/2014 2.4
BR-CBS-202 10/3/2014 3.2
BR-CBS-122(0-3) 9/2/2014 0.53 J
BR-CBS-118(0-3) 9/2/2014 22
BR-CBS-116(0-3) 9/2/2014 1.6
BR-CBS-112(0-3) 9/2/2014 5.6
BR-CBS-209 10/3/2014 0.45 J
BR-CBS-110(0-3) 9/2/2014 0.85
BR-CBS-107(0-3) 9/2/2014 0.16
BR-CBS-106(0-3) 9/2/2014 1.2
BR-CBS-105(0-3) 9/2/2014 0.62
BR-CBS-103(0-3) 9/2/2014 0.18
BR-CBS-102(0-3) 9/2/2014 0.96
SR-CBS-613(0-3) 5/21/2014 0.53
SR-CBS-622(0-3) 5/21/2014 < 0.12
BR-CBS-119(12-15) 9/2/2014 5.2
BR-CBS-113(12-15) 9/2/2014 0.35
BR-CBS-104(12-15) 9/2/2014 0.15
SR-CBS-622(12-15) 5/21/2014 < 0.12
BR-CBS-205 10/3/2014 0.46
BR-CBS-208 10/3/2014 0.27
SR-CBS-523(0-3) 5/21/2014 0.3 J
SR-CBS-532(0-3) 5/21/2014 0.74 J
SR-CBS-632(0-3) 5/21/2014 0.18
SR-CBS-532(12-15) 5/21/2014 0.11
SR-CBS-632(12-15) 5/21/2014 < 0.12
BR-CBS-109(0-3) 9/2/2014 0.83
BR-CBS-100 9/2/2014 0.18
12-15 CR-CBS-101 9/2/2014 < 0.11
SR-CBS-533(0-3) 5/21/2014 0.45
SR-CBS-633(0-3) 5/21/2014 0.5
SR-CBS-623(0-3) 5/21/2014 0.37 J
20 ft From Building 0-3
12-15
0-3
Brown Residence
5 ft From Building
24-27
12-15
Base of Building
0-3
12-15
0-315 ft From Building
10 ft From Building
0-3
UMass Amherst Sylvan Complex (227638)Table 2-2 2 of 3
Woodard & CurranOctober 2014

Table 2-2Summary of Soil Characterization Sampling Results
Areas Away from the Building
Sylvan ComplexUMass Amherst
LocationDepth
(in. bgs.)Sample ID Sample Date
Total PCBs
(mg/kg)
SR-CBS-331(0-3) 5/21/2014 6.6
SR-CBS-431(0-3) 5/22/2014 4.2 J
SR-CBS-331(12-15) 5/21/2014 0.71
SR-CBS-431(12-15) 5/22/2014 0.55
SR-CBS-331(24-27) 5/21/2014 0.11
SR-CBS-431(24-27) 5/22/2014 < 0.11
0-3 SR-CBS-432(0-3) 5/22/2014 0.58 J
12-15 SR-CBS-432(12-15) 5/22/2014 < 0.11
MR-CBS-166(0-3) 9/2/2014 1.8
MR-CBS-169(0-3) 9/2/2014 29
MR-CBS-221 10/3/2014 0.43
MR-CBS-222 10/3/2014 5.3 J
MR-CBS-124(0-3) 9/2/2014 4.3
MR-CBS-125(0-3) 9/2/2014 < 0.10
MR-CBS-127(0-3) 9/2/2014 1.4
SR-CBS-323(0-3) 5/21/2014 2.7
SR-CBS-332(0-3) 5/22/2014 < 0.12
SR-CBS-413(0-3) 5/22/2014 3.7
MR-CBS-132(0-3) 9/2/2014 2.2
MR-CBS-136(0-3) 9/2/2014 3.1
MR-CBS-140(0-3) 9/2/2014 0.44
MR-CBS-143(0-3) 9/2/2014 0.71
SR-CBS-323(12-15) 5/21/2014 0.61 J
SR-CBS-332(12-15) 5/22/2014 0.42
SR-CBS-413(12-15) 5/22/2014 < 0.11 UJ
MR-CBS-126(12-15) 9/2/2014 < 0.11
MR-CBS-133(12-15) 9/2/2014 0.85
MR-CBS-142(12-15) 9/2/2014 < 0.11
SR-CBS-423(0-3) 5/22/2014 1.8
MR-CBS-137(0-3) 9/12/2014 4.8
SR-CBS-423(12-15) 5/22/2014 0.27 J
MR-CBS-217 10/3/2014 0.24
MR-CBS-167(0-3) 9/2/2014 0.12 J
MR-CBS-225 10/3/2014 < 0.12
MR-CBS-226 10/3/2014 0.66
CR-CBS-433(0-3) 5/22/2014 2.6
MR-CBS-130(0-3) 9/2/2014 0.51
MR-CBS-134(0-3) 9/2/2014 0.59
MR-CBS-218 10/3/2014 0.85
MR-CBS-168(12-15) 9/2/2014 0.1
CR-CBS-433(12-15) 5/22/2014 < 0.11 UJ
MR-CBS-128(0-3) 9/2/2014 0.81
SR-CBS-333(0-3) 5/22/2014 0.15
MR-CBS-215 10/3/2014 0.41
MR-CBS-129(0-3) 9/2/2014 3.9
25 Feet from Building 0-3 MR-CBS-216 10/3/2014 2.4
10 ft From Building
12-15
13 ft From Building
0-3
Base of Building 12-15
24-27
20 ft From Building
15 ft From Building
5 ft From Building
0-3
12-15
0-3
McNamara Residence
0-3
0-3
12-15
Notes:Soil samples submitted for extraction via USEPA method 3540C and analyzed for PCBsvia USEPA method 8082.in. bgs. = inches below ground surfaceJ/UJ = Analytical results qualified as estimated based on data validation. See Appendix Afor additional information.
UMass Amherst Sylvan Complex (227638)Table 2-2 3 of 3
Woodard & CurranOctober 2014
Table 2-3
Summary of Asphalt and Brick Characterization Sampling Results
Sylvan Complex
UMass Amherst
Building Sample ID Sample DateTotal PCBs
(mg/kg)Sample ID Sample Date
Total PCBs
(mg/kg)
Location
SR-CBA-001 5/20/2014 8.5 CR-CBA-175 9/2/2014 2.9
SR-CBA-007 5/20/2014 2.57 - - - - - -
SR-CBA-002 5/20/2014 3.62 MR-CBA-178 9/2/2014 2.6
SR-CBA-003 5/20/2014 0.91 J - - - - - -
SR-CBA-005 5/20/2014 6.1 BR-CBA-173 9/2/2014 1.6
SR-CBA-006 5/20/2014 0.89 - - - - - -
Cashin CR-CBB-177 9/2/2014 < 0.099 - - - - - -
McNamara MR-CBB-172 9/2/2014 2.7 - - - - - -
Brown MR-CBB-174 9/2/2014 0.45 - - - - - -
Ten Feet from Building
Brick Pads
Asphalt Walkways
Cashin
McNamara
Brown
Base of Building
Notes:Asphalt and brick samples collected in accordance with USEPA Region 1 Standard OperatingProcedure for Sampling Porous Media for PCBs (May 2011).Samples submitted for extraction via USEPA method 3540C and analyzed for PCBs via USEPA method8082.Total PCBs reported as Aroclor 1254 and/or Aroclor 1260. No other Aroclors reported above theminimum laboratory reporting limits.J = Analytical results qualified as estimated based on data validation. See Appendix A for additionalinformation.
UMass Amherst Sylvan Complex (227638)
Table 2-3 1 of 1Woodard & Curran
October 2014
P
P
P
P
P
P
P
PPARKINGGARAGE
LINCOLNCAMPUSCENTER(HOTEL)
STUDENTUNION
2929
49
49
49
49
49
49
4949
49
49
49
49
24
46
62
34
3232
42
50
50
50
22
21
11
33
67
71
64
65
41
2512
5050
50
50
29
46
52
62
52
63
24
65
65
65
6565
45
26
3168
44
44
44
66
27
43
4343
63
30
62
14
44
47
47
66
63 63
63
35
64
64
25
13
24
30
3964
64
64
GarberField
SoftballComplex
RuddField
T
sttes
uhca
ssaMo
T
ekipnr
u
Gordon
To AmherstCenter
RO
NT
NASA
ELP
HTTS
CENTRALRESIDENTIAL
AREA
To Tillson Farm &IntermediateProcessing
Facility (IPF)
RenaissanceCenter
Butterfield
ROBSHAMVISITORSCENTER
AgriculturalEngineering
OLYMPIA DRIVE
CentralHeating Plant
To Rt. 116, Rt. 9, I-91Hadley Equestrian FarmContinuing EducationUniversity Without Walls
William SmithClark Memorial
HillelHouse
TC
PSK
DU
YTISREVI
NU
VIR
DE
STTESUHCASSAM
AEUNEV
LLIHKRALC
DR
TS
AE
TN
AS
AEL
PE
ERT
ST
TEERTSGNIRAEF
LAE
WNO
MM
OC
HTA
EUNE
V
WSN
ILLU
MAY
GOVERNORS DRIVE
ORCHARD HILL DR.
Track& Field
ACO
SDT
KKG SK ADP
IGU
ZBT
BU
TTERFIELD
TERRACE
DZ
SOUTHWESTRESIDENTIAL
AREA
LordenField
ATHLETICFIELDS
To Telecom,UMass Outreach &UMass Extension at101 University Drive
NORTHEASTRESIDENTIAL
AREA
ORCHARD HILLRESIDENTIAL
AREA
ChabadHouse
HAIGISMALL
NewmanCenter
TextbookAnnex
NO
RTH
PLEASA
NT
STREET
EASTMAN LANE
MULLINSCENTER
FINE ARTSCENTER
BoydenGym
Hills
Totman
Bartlett
PVTABus
Garage
WhitmoreAdministration
Herter
Marcus
TobinIsenbergSchool of
Management
LEDERLEGRADUATERESEARCH
CENTER
IV
II
Prince
Thompson
Cance
Moore
Marston
Baker
J.Adam
I
Hicks
FranklinDining
PhysicalPlant
Brett
ContePolymer
ResearchCenter
Machmer
Field
EngineeringLab
Gunness
HampdenDining
EngineeringLab 2
McGuirkAlumni Stadium
BerkshireDining
Patterson
ComputerScience
Pierpont
Flint
III
WorcesterDining
MacKimmie
DU BOISLIBRARY
Brown
HampshireDining
Arnold
Lyon
Stockbridge(Bowker Aud)
Hasbrouck
Gorman
Van Meter
Cashin
GoodellFernald
UniversityHealthCenter
James
J.Q.Adams
Lewis
Draper
Holdsworth
Webster
PaigeGoessmann
Grayson
Melville
Emerson
Knowles
Leach
Forest &Parks Bldg
Dwight
Clark
Thoreau
MaharAuditorium
Chenoweth
Crampton
Hamlin
Dickinson
French
McNamara
Dickinson
Johnson
Wheeler
Brooks
Thatcher
Crabtree
SouthCollege
Knowlton
Grass RootsDaycare
MemorialHall
Furcolo
PowerPlant
NewAfrica
Coolidge
Kennedy
DurfeeConservatory
& GardenWilder
Greenough
ColdStorage
Chadbourne
Hatch
Berkshire
MorrillScienceCenter
Grinnell
Middlesex
HouseWysocki
Thayer
ROTC Hampshire
Astronomy
Washington
Bowditch
Munson
WestExperiment
Station
AuxiliaryServices
Warehouse
OldChapel
Chancellor'sHouse
ShadeTree Lab
Photo Lab
Duda
FarleyLodge
MontagueHouse
Research Admin.
LincolnApartments
UniversityClub
Blaisdell
BowditchLodge
PARKINGOFFICE
Apiary
EastExperiment
Station
Observatory
Alfond
NORTH
PLEASANTSTREET
NLO
CNI
LA
EU
NEV
TSEVI
RD
MUI
DA
TES
NUS
AVE
EERT
STN
ASAE
LPHT
RON
T
EERTSEL
GNAIRT
T
TEERTSGNORTS
TUNTSEHCEERTS T
SYLVANRESIDENTIAL
AREA
THA
TCH
ER RO
AD
PONDCAMPUS
TILLSON ROAD
Robotics
Commercial Bus Stop
To Undergraduate Admissions - Mather, SPE, CO
NORTHRESIDENTIAL
AREA NorthB
NorthC
NorthA
NorthD
PracticeRink
Communications Disorders
To Rt. 63N North Village Apts
0 500 1,000Feet
Map Key
31 Numbered Parking Lots
PVTA Bus StopsMetered/Public Parking
Studio Arts Bldg
Campus MapJuly 2011 University Switchboard - (413) 545-0111Tour Service - (413) 545-4237 Robsham Memorial Visitors Center - (413) 545-0306
University of Massachusetts Amherst
LowerTennisCourt
Skinner
Integrated Science Bldg
Recreation Center
THATCHER ROA
D
INFIRMARY WAY
THATCHER RO
AD
HICKS WAY
HOLDSWO
RTH WAY
STOC
KBRID
GE RO
AD
Transit Facility
Amherst Fire Department
UMass Police Department
New Lab Science Bldg
BowditchGreenhouses
George N.ParksMarching Band Bldg
Traffic Lights

!(
!(
!(
!(
!(
!(
!(
!(
!(
!(
!(
!(!(
!(!( !(
!(
!(
!(
!(
!(
!(
!(!(
!(
!(
!(
!(
!(
!(!(
!(
!(
!(
!(
!(
!(
!(
!(
!(
!(
!(
!(
!(
!(
!(
!(!(
!(
!( !(
!(!(
!(
!(
!(
!(
!(
!(
!(
!(
!(
!(
!(
!(
!(
!(
!(
!(
!(
!(
!(
!(
!(
!(
!(
!(!(
!(
!(
!(!(
!(
!(!(
!(
!( !(!(
!(
!(!(
!(
!(!(
!(
!(!(
!(!(
!(
!(
!(
!(
!(!(!(
!(!(
!(!(
!(
!(
!(
!(
!(
!(!(
!(
!(
!(
!(
!(
!(
!(
!(
!(
!(
!(
!(
!(
!(
!(!( !(
!(
!(!(
!(!(
!(
!(
!(!(
!(
!(!(
!(
!(
!(
!(
!P
!P
!P
!P
!P
!P
!P
!P
!P
!P !P
!P !P
!P !P
!P
!P
!P
!P
!P
!P
!P
!P
!P
!P
!P
!P!P!P
!P!P!P
!P!P!P
!P
!P
!P
!P
!P
!P
!P
!P
!P
!P!P !P
!P !P!P
!P!P!P
!(
!(!(
!(
!(
!(
!P!P
!P
!P
!P
!P !P
!P
#*
!P
!P
!P
!P
!P
!P
!P
!P
!P !(
!P
!P
!P !P !P !P
!P
!P
!P
!(
!P
!P#*
!P!P
!(
!P
!P
!P
!P
!P!P!P
!P
!P
!P
!P
!P
!P
!P
!P!P
!P
!P
!P
!P
#*
!P
!P
!P
!P
!P
!P
!P
!P
!P
!P
!P
!P
!P
!P!P
!P
!P!P
!P
!P
!P
!P
!P
!P
!P
!P
!P
!P
!P
!P!P!P
!P
!P !P
!P !P
!P
McNameraResidence Hall
CashinResidence Hall
BrownResidence Hall
EASTMAN LANE
L oading Dock
L oading Dock
L oading Dock
2.62<0.11<0.11 2.32
<0.10<0.11
2.70.47--
0.60.2--
8.97.40.71
4.90.96--
1.03J----
10.11.4
<0.11
3.31.6
<0.11
1.40J0.19--
0.42----
0.82J0.16J--
0.35----
9.61.04J--
0.45J----
10.71.4
<0.11
1.10.18--
10.20.180.35
30.9J1.82.4
0.37J----
<0.12<0.12--
12.90.980.56
1.55J0.37--
0.53----
0.18<0.12--
0.5----
1.580.35<0.10
0.74J0.11--
0.45----
14.1J3.80J<0.116.00J
0.15--
0.30J----
16.13.90J0.22
12.3J0.5--
0.97----
0.15----
<0.120.42--
6.60.710.11
21.21.03<0.11
5.40.39--
1.4----
6.61.06<0.11
23.60.8--
2.70.61--
2.6<0.11--
0.58J<0.11--
4.20J0.55<0.11
2.04<0.11--
6.9J0.34<0.11
1.80.27--
18.1J2.07<0.12
5.4<0.11--
3.7<0.11--
8.5
3.62
0.91J
6.1
0.89
2.57
5.60.35--
34----
--0.78--
1.6----
225.2--
1800----
--0.66--
0.53J----
0.45
0.96----
0.18<0.11--
0.180.15--
0.62----
1.2----
--1.1--
0.16----
0.83----
0.85----
1.6
1.2----
0.9J0.17--
0.37----
0.37<0.11--
0.74----
40.29--
1.2---- 0.77
----
0.320.19--
2.9
1900---- --
2--
<0.099
0.33----
1.1J0.26--
2.6
1.8----
7.7----
--0.11--
0.12J0.1--
29----
4.3----
<0.10<0.11--
0.81----
1.4----
3.9----
--2.7--
0.51----
2.20.85--
0.59----
3.1---- 4.8
----
0.44<0.11--
50------
0.35--
0.71----
2.7
2----
2.4----
76----
100----
3.2----
0.46----
220----
0.27----
0.45J----
190----
26----
57----
120----
13----
0.41----
2.4----
0.29---- 0.85
----
55----
540----
0.43----
5.3J----
88----
110----
<0.12----
0.66----
0.45----
5.3J----
0.73----
92----
42----
110----
48----
4----
23----
0.84----
0.76----
59----
S Y L VAN R ES IDENT IAL HOUS ING COMPLEXUNIVER S IT Y OF MAS S ACHUS ET T S AMHER S TAm herst, MassachusettsExtent of PCB ImpactedSoils
FIGURE 2-1S CALE: 1" = 20'DAT E: OCT OBER 2014
DOC: S Y LVANR ES UL T S .MX D
S OUR CE: UMAS SJOB NO: 227638
DR AW N BY : JMP
.
0 20 4010Feet
PCB Sample Results!P S oil S am ple L ocation!( Asphalt S am ple L ocation#* Brick S am ple L ocation
Approxim ate extent of PCB im pacts > 1ppm and <50ppm to a depth of 18 inches bgs.Approxim ate extent of PCB im pacts ≥50 ppm to a depthof 18 inches bgs.Approxim ate extent of PCB im pacts to a depth of 18inches bgs. PCB concentrations to be determ inedApproxim ate extent of PCB im pacts >1ppm and<50ppm to a depth of 12 inches bgs (lim its dashedwhere inferred).Brick Ground S urfaceR etaining W allR oadAsphalt PathS oils Previously Excavated for Installation of Em ergencyGeneratorsTopography (2-ft)
!( Approxim ate T ree L ocationApproxim ate T ree Canopy
UtilitiesT T elecom m unicationsD S torm DrainS S ewerE ElectricW W aterS T S teamS T Abandoned S team L ineNOT ES1. R esults greater than 1 ppm are highlighted inblue.2. Posted results are from the following depthintervals
3. L ocation of site features and utilities based on site planprovided by UMAS S Am herst.4. L ocation of trees and size of canopies from S ylvan treeinventory provided by UMass Am herst and m odifiedbased on field observations and m easurem ents byW oodard & Curran.5. T opography based on site features m ap provided byUMass Am herst and m odified along southwest cornerof McNam era R esidence and along northwest cornerof Cashin R esidence based on field observations andm easurem ents by W oodard & Curran.
-- = Not Analyzed< = Not DetectedJ = Laboratory Estim ationin. bgs = Inches Below Ground S urface
0-3 in. bgs: 9.6012-15 in. bgs: 1.04J24-27 in. bgs: --
Legend(T otal PCBs presented in ppmnext to sam ple location)

APPENDIX A: ANALYTICAL LABORATORY REPORTS AND DATAVALIDATION SUMMARY