SOIL-CEMENT FOR HIGH-VELOCITY ... - RJH … · 5 Literature Review and Definitions RJH performed a...
40
1 SOIL-CEMENT FOR HIGH-VELOCITY SPILLWAY FLOW APPLICATIONS By: Robert J. Huzjak, P.E., President, RJH Consultants, Inc., 9800 Mt. Pyramid Court, Suite 330, Englewood, CO, [email protected] , 303-225-4611 and Korey J. Kadrmas, P.E., Project Manager, RJH Consultants, Inc., 9800 Mt. Pyramid Court, Suite 330, Englewood, CO, [email protected] , 303- 225-4611 Introduction The use of soil-cement for slope protection on dams first began in the United States with an experimental test section constructed in 1951 by the United States Bureau of Reclamation (USBR) at Bonny Dam located in eastern Colorado (NTIS, 1984) at a site that experienced “maximum destructive exposure.” The facing was inspected frequently and after 10 years of evaluation, soil-cement was added to the USBR specifications as an alternative to riprap for upstream slope protection (Holtz and Walker, 1962). The first three dams to use soil-cement for upstream slope protection were Ute Dam in New Mexico (built in 1962), Merritt Dam in Nebraska (built in 1963), and Cheney Dam in Kansas (built in 1964). The first documented use of soil-cement in spillways in the United States was at Broad Canyon Dam in Radium Springs, NM in 1969 (1) . Significant data is available related to the performance of soil-cement for upstream slope protection; however, there is limited research and documented performance data available regarding the performance of soil-cement lining subject to high velocity flows in spillway channels. Four publications that investigated soil-cement for channel lining applications are described in this paper. The soil-cement type presented in this study is categorized as “cement-treated base” as defined by the Portland Cement Association (PCA). Based on a review of these publications, it is the authors’ opinion that the current literature verifies that soil-cement for channel lining applications will perform effectively for maximum flow velocities on the order of 25 feet per second (fps) and that the performance of soil-cement for channel lining applications for these high velocity flows is a function of strength and aggregate size. The purpose of this paper is to supplement the existing base of research regarding the suitability of soil-cement for channel lining applications for high velocity flow based on a special application to an emergency spillway for a large, High Hazard dam located in Colorado. (1) Information provided by Kenneth Hansen, P.E. Background Many existing and new dams have both a service spillway to convey routine flows and an emergency or auxiliary spillway to convey inflows from extreme storm events. This type of spillway configuration is becoming more
-
Upload
truongquynh -
Category
Documents
-
view
217 -
download
0
Transcript of SOIL-CEMENT FOR HIGH-VELOCITY ... - RJH … · 5 Literature Review and Definitions RJH performed a...

1
SOIL-CEMENT FOR HIGH-VELOCITY SPILLWAY FLOW APPLICATIONS
By: Robert J. Huzjak, P.E., President, RJH Consultants, Inc., 9800 Mt. Pyramid Court,
Suite 330, Englewood, CO, [email protected], 303-225-4611 and Korey J. Kadrmas, P.E., Project Manager, RJH Consultants, Inc., 9800 Mt. Pyramid Court, Suite 330, Englewood, CO, [email protected], 303-225-4611
Introduction
The use of soil-cement for slope protection on dams first began in the United States with an experimental test section constructed in 1951 by the United States Bureau of Reclamation (USBR) at Bonny Dam located in eastern Colorado (NTIS, 1984) at a site that experienced “maximum destructive exposure.” The facing was inspected frequently and after 10 years of evaluation, soil-cement was added to the USBR specifications as an alternative to riprap for upstream slope protection (Holtz and Walker, 1962). The first three dams to use soil-cement for upstream slope protection were Ute Dam in New Mexico (built in 1962), Merritt Dam in Nebraska (built in 1963), and Cheney Dam in Kansas (built in 1964). The first documented use of soil-cement in spillways in the United States was at Broad Canyon Dam in Radium Springs, NM in 1969(1). Significant data is available related to the performance of soil-cement for upstream slope protection; however, there is limited research and documented performance data available regarding the performance of soil-cement lining subject to high velocity flows in spillway channels.
Four publications that investigated soil-cement for channel lining applications are described in this paper. The soil-cement type presented in this study is categorized as “cement-treated base” as defined by the Portland Cement Association (PCA). Based on a review of these publications, it is the authors’ opinion that the current literature verifies that soil-cement for channel lining applications will perform effectively for maximum flow velocities on the order of 25 feet per second (fps) and that the performance of soil-cement for channel lining applications for these high velocity flows is a function of strength and aggregate size.
The purpose of this paper is to supplement the existing base of research regarding the suitability of soil-cement for channel lining applications for high velocity flow based on a special application to an emergency spillway for a large, High Hazard dam located in Colorado. (1) Information provided by Kenneth Hansen, P.E.
Background
Many existing and new dams have both a service spillway to convey
routine flows and an emergency or auxiliary spillway to convey inflows from extreme storm events. This type of spillway configuration is becoming more

2
common with dams built in the last few decades because many have been built on small drainages and tributaries and are routinely referred to as “off-channel” dams. They are referred to as “off-channel” dams because the drainage that they are constructed across either flows intermittently or has a very low flow rate. Typically for dams with multiple spillways, flow through the emergency spillway is infrequent, but when operating is associated with a large, extreme type of flood event. This creates a considerable challenge for the engineer, owner, and regulators. The engineer needs to design the emergency spillway to be robust and to include adequate provisions so that it can safely pass the extreme and infrequent design inflows. The goal of the owner is to meet dam safety requirements but to keep construction and operation and maintenance costs as low as possible flow in the emergency spillway would only occur in extreme circumstances. In the past, these contradictory goals have led engineers to select new, innovative design concepts for emergency spillways including soil-cement channel lining applications. However, regulators, who are responsible for public safety, are typically concerned with approval of a newer design concept and appropriately require significant supporting data.
These challenges were faced and resolved by RJH Consultants, Inc, (RJH) during the design of the emergency spillway channel for a new High Hazard dam, called Frank Jaeger Dam, that is currently under construction in Colorado. Frank Jaeger Dam is a zoned earth embankment about 200 feet high with soil-cement upstream slope protection, a combined outlet works/service spillway near the center of the dam, and an emergency spillway in the left abutment. The service spillway is designed to convey flows from events up to the 100-year storm through the outlet works and the emergency spillway would be engaged during storm events greater than the 100-year event.
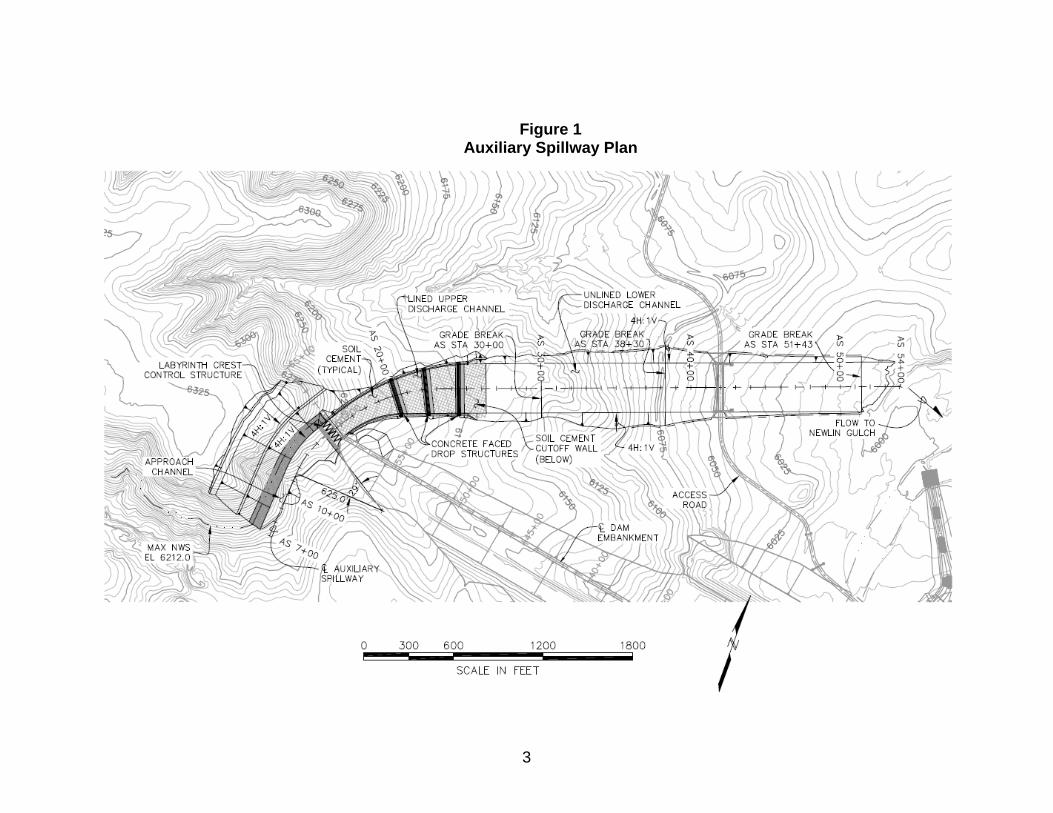
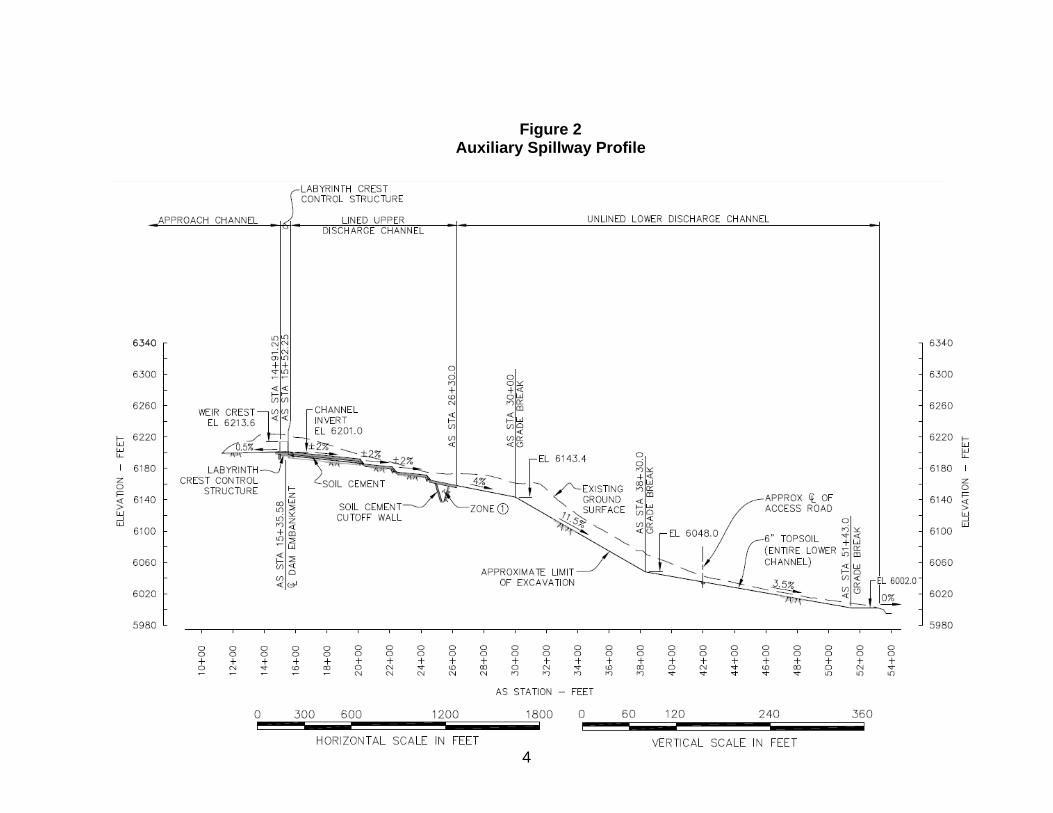
Multiple spillway and channel configurations were considered during design and based on technical issues and economics, the emergency spillway configuration described below and as shown on Figures 1 and 2 was selected:
An 800-foot-long earth approach channel in the left abutment. A 150-foot-wide, 5-cycle labyrinth weir structure with a crest at Elevation
(El.) 6213.6, which is slightly above the routed 100-year storm event. A 150-foot-wide, 15-foot-long reinforced concrete apron directly
downstream of the labyrinth weir. A 1,080-foot-long, curved, soil-cement lined upper discharge channel with
three drop structures that transitions from 150 feet wide at the upstream end, adjacent to the concrete apron, to 330 feet wide at the downstream end.
A 26-foot-deep soil-cement cutoff wall about 130 feet upstream of the downstream end of the soil-cement lined discharge channel.
A 2,670-foot-long earthen lower discharge channel. The focus of this paper is to describe the performance of the soil-cement
lined upper discharge channel.
3
Figure 1 Auxiliary Spillway Plan
4
Figure 2 Auxiliary Spillway Profile
5
Literature Review and Definitions
RJH performed a literature review to identify previous research regarding
soil-cement subject to high velocity flows. This search identified four publications that are discussed herein. To facilitate an understanding of this research, definitions for key terminology are as follows:
SOIL-CEMENT - Soil-cement is a highly compacted mixture of soil, Portland cement, and water. Soil-cement referenced in the research publications is generally in the “cement-treated base” category of soil-cement, as defined by the PCA. Cement-treated base types of soil-cement consist of mixtures of soil and aggregate with measured amounts of Portland Cement and water.
COARSE GRAINED SOILS - more than 50 percent retained in a 0.075 mm (No. 200) sieve.
SAND - Material passing a 4.75 mm (no. 4) sieve and retained on a 0.075 mm (No. 200) sieve.
CEMENT - Portland Type I/II. Previous research regarding soil-cement subject to high velocity flows is
provided by PCA (PCA and Hansen, 2002); L.L. Litton and R.A. Lohnes (Litton and Lohnes, 1982); R.P. Bass (Bass 1999); and Simons, Li & Associates (Simons Li, 1988). The cement content of tested soil-cement samples ranged from 5 to 13 percent. The soil-cement mix design in the literature in certain cases varied from the mix design for this project; however, the following information has similarities to the work performed by RJH. Important findings from the literature review are as follows:
L.L. Litton, and R.A. Lohnes (Litton and Lohnes, 1982) present results for a range of soil-cement samples that were tested with varying soil compositions (alluvium, sand, and sand-alluvium mixtures) with the cement contents ranging from 5 to 13 percent by weight. Test results showed that velocities could exceed 25 fps without causing substantial erosion for certain mix designs and that there is a decrease in weight loss (i.e., erosion) with increases of sand content and cement content. Based on the PCA limiting criterion of 7 percent weight loss, the following relationship in Table 1 between cement content, percent sand, and maximum allowable velocities were proposed by Litton and Lohnes (1982):

6
TABLE 1 MAXIMUM ALLOWABLE VELOCITY (fps)
Cement Content
Soil Mixture 5% 7% 9% Alluvium – 25% Sand 9.8 17.0 >25.0 Alluvium – 40% Sand 13.5 >25.0 >25.0 Alluvium – 55% Sand 21.3 >25.0 >25.0
Simons, Li & Associates (Simons Li, 1988) discusses the hydraulic
performance testing of soil-cement on a downstream embankment slope exposed to overtopping flows. The slopes were at 3 horizontal to 1 vertical (3H:1V) and 2H:1V and subject to 1 foot to 4 feet of overtopping flow, and the soil-cement was placed in horizontal lifts. The cement content was 8 percent by weight. Results from the study showed that properly designed soil-cement can withstand the flow of clean water up to a velocity of 20 fps with little erosional damage. The qualitative description of damage was described as “rounding off” of the edge of each stairstep. Also noted for this test program was that cold joints between the lifts did not affect stability.
Bass (Bass, 1999) discusses the development of soil-cement used for bank protection and drop structures and presents examples to demonstrate recent projects with channel velocities exceeding 25 fps.
PCA (PCA and Hansen, 2002) references earlier PCA research (PCA, 1943). This paper presents results from a series of hydraulic performance tests investigating the use of soil-cement as a lining option for open flumes. Results from the study showed that after 6 days, no appreciable erosion was observed for a flow velocity of 28 fps on a 4 ½-inch-thick soil-cement lining consisting of 60 percent sand and 40 percent silt/clay stabilized with 8 percent cement. The document states that properly designed soil-cement can withstand the flow of clean water up to a velocity of 20 fps with little erosional damage. For higher flow velocities or abrasion erosion conditions, the compressive strength of soil-cement needs to be increased by either: o Modification to the mixture proportions. o Increased degree of compaction. o Extending the curing period.
Design Criteria
In accordance with State of Colorado dam safety regulations, the emergency spillway at Frank Jaeger Dam will convey all anticipated inflow floods greater than the 100-year event, up to and including the inflow design flood (IDF), while providing a minimum of 1 foot of residual freeboard with the following requirements:

7
The emergency spillway should safely convey all discharges without breaching the emergency spillway labyrinth crest control structure or causing failure of other emergency spillway components that would result in an uncontrolled release from the reservoir. However, damage to the emergency spillway facilities, principally in the unlined portion of the discharge channel is acceptable during flows associated with relatively infrequent major flood events.
The emergency spillway crest should be set nominally at the maximum reservoir water surface elevation generated by routing the 100-year flood through the service spillway. This was determined by setting the reservoir water surface at the maximum normal water surface prior to the start of the 100-year flood event to maximize the emergency spillway crest elevation.
The emergency spillway should be capable of passing the full IDF, which is the probable maximum flood (PMF), without consideration of the hydraulic capacity of the service spillway.
The emergency spillway should operate over the full range of inflow events without operator intervention.
Hydrologic and Hydraulic Modeling
RJH performed hydrologic analyses to evaluate reservoir routing
characteristics of the spillway and reservoir and identify peak flow rates through the emergency spillway. Reservoir characteristics are shown in Table 2.
TABLE 2
RESERVOIR CHARACTERISTICS
Maximum Normal Pool Elevation 6212.0 Capacity at Maximum Normal Pool (ac-ft) 72,200 Surface Area at Maximum Normal Pool (ac) 1,140 Watershed Area (sq. mi) 10.6
Reservoir routing analyses were performed for the 25, 50, and 100
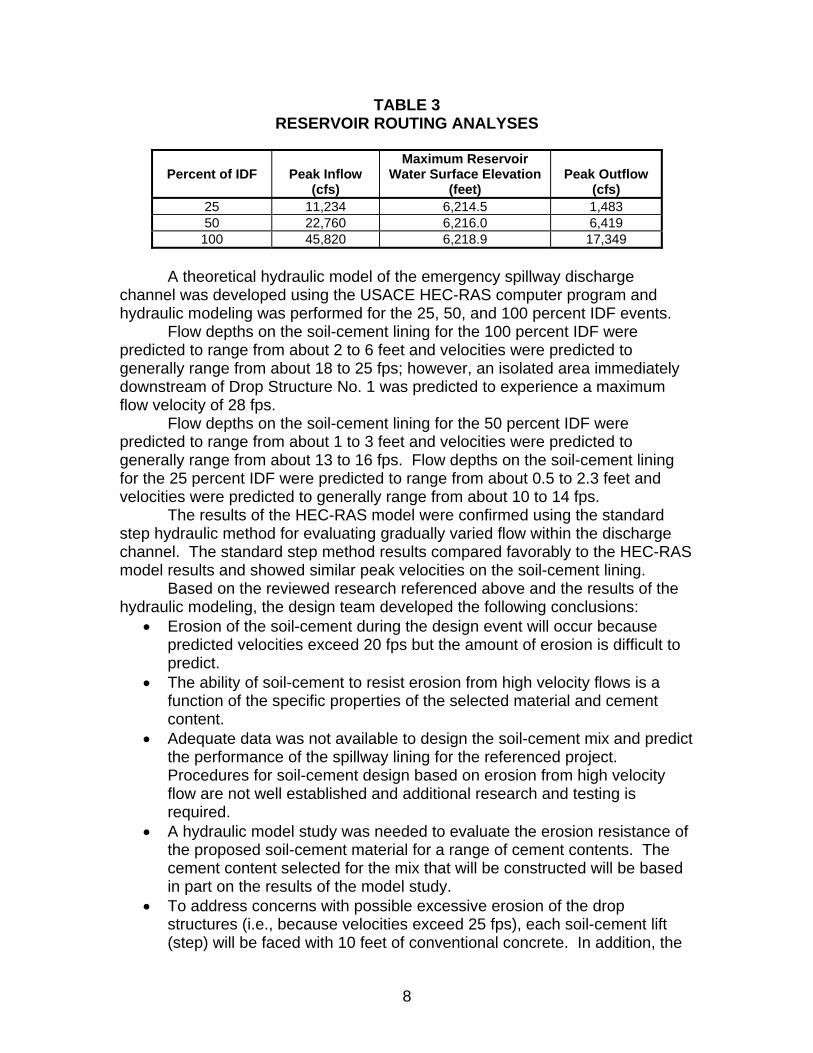
percent IDF events using the U.S. Army Corps of Engineers (USACE) HEC-1 computer program and assuming that the initial reservoir water surface is at the normal maximum pool level (El. 6212.0) and that all discharge is routed through the emergency spillway. Evaluation of the 25 and 50 percent IDF events was performed to allow evaluation of the emergency spillway channel for multiple flood events. The results of these analyses are summarized in Table 3.
8
TABLE 3 RESERVOIR ROUTING ANALYSES
Percent of IDF
Peak Inflow (cfs)
Maximum Reservoir Water Surface Elevation
(feet) Peak Outflow
(cfs) 25 11,234 6,214.5 1,483 50 22,760 6,216.0 6,419 100 45,820 6,218.9 17,349
A theoretical hydraulic model of the emergency spillway discharge
channel was developed using the USACE HEC-RAS computer program and hydraulic modeling was performed for the 25, 50, and 100 percent IDF events.
Flow depths on the soil-cement lining for the 100 percent IDF were predicted to range from about 2 to 6 feet and velocities were predicted to generally range from about 18 to 25 fps; however, an isolated area immediately downstream of Drop Structure No. 1 was predicted to experience a maximum flow velocity of 28 fps.
Flow depths on the soil-cement lining for the 50 percent IDF were predicted to range from about 1 to 3 feet and velocities were predicted to generally range from about 13 to 16 fps. Flow depths on the soil-cement lining for the 25 percent IDF were predicted to range from about 0.5 to 2.3 feet and velocities were predicted to generally range from about 10 to 14 fps.
The results of the HEC-RAS model were confirmed using the standard step hydraulic method for evaluating gradually varied flow within the discharge channel. The standard step method results compared favorably to the HEC-RAS model results and showed similar peak velocities on the soil-cement lining.
Based on the reviewed research referenced above and the results of the hydraulic modeling, the design team developed the following conclusions:
Erosion of the soil-cement during the design event will occur because predicted velocities exceed 20 fps but the amount of erosion is difficult to predict.
The ability of soil-cement to resist erosion from high velocity flows is a function of the specific properties of the selected material and cement content.
Adequate data was not available to design the soil-cement mix and predict the performance of the spillway lining for the referenced project. Procedures for soil-cement design based on erosion from high velocity flow are not well established and additional research and testing is required.
A hydraulic model study was needed to evaluate the erosion resistance of the proposed soil-cement material for a range of cement contents. The cement content selected for the mix that will be constructed will be based in part on the results of the model study.
To address concerns with possible excessive erosion of the drop structures (i.e., because velocities exceed 25 fps), each soil-cement lift (step) will be faced with 10 feet of conventional concrete. In addition, the

9
initial 25 feet at the base of each drop structure will be conventional concrete (total depth of 3 feet).
Test Program Development
RJH developed hydraulic performance test (i.e. model study) procedures
and methodology to evaluate the performance of soil-cement lining subject to high velocity flows for a range of cement contents. The testing program generally consisted of the following:
Developing soil-cement mix designs and specifications. Constructing the soil-cement test specimens. Performing materials testing of the soil-cement. Performing the hydraulic performance tests in a controlled environment.
The hydraulic performance tests were performed at the Hydraulics Laboratory at the Engineering Research Center at Colorado State University in Fort Collins, CO (CSU Hydraulics Laboratory). Mix Designs and Specifications
The source material for the soil-cement consists of excavated materials
from the dam site and is geologically classified as the Upper Dawson Formation, which is generally a poorly cemented fine to coarse grained sandstone. The base material was processed by mining the sandstone and passing the material through a 2-inch screen to remove oversized particles. The base soil for the project was required to meet the following criteria:
Free from organic material with no lumps of clay larger than 1 inch. Sulfate content less than 0.2 percent. Plasticity index of 6 or less. Meet the gradation band shown on Figure 3.
The soil-cement was to be placed in the testing apparatus “specimens” as follows:
In compacted finished lifts of not more than 4 inches. Compact each lift to a minimum of 96 percent of maximum dry density as
determined by ASTM D 558. The average of all tests shall not be less than 98 percent of the maximum dry density.
Compaction moisture content between optimum moisture content and 1.5 percent above optimum moisture content. The hydraulic performance tests were developed based on the above
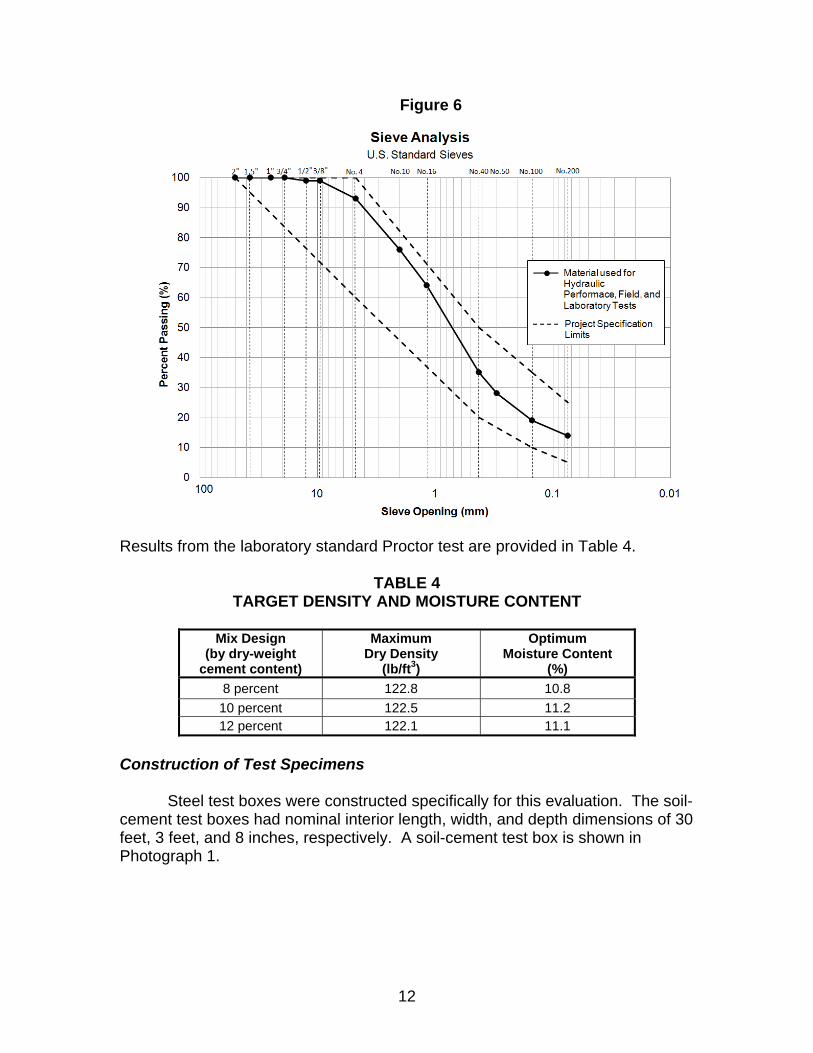
specification and mix designs that were developed by RJH for the upstream slope protection at Frank Jaeger Dam. The design criteria was developed based on recommendations from PCA and USBR and required a freeze-thaw maximum loss of 8 percent and a wet-dry maximum loss of 6 percent. The laboratory mix design test results for soil-cement mixed at 6, 7, 9, 10, 11, 12, 13, and 14 percent (“dry weight”) cement contents are as follows.
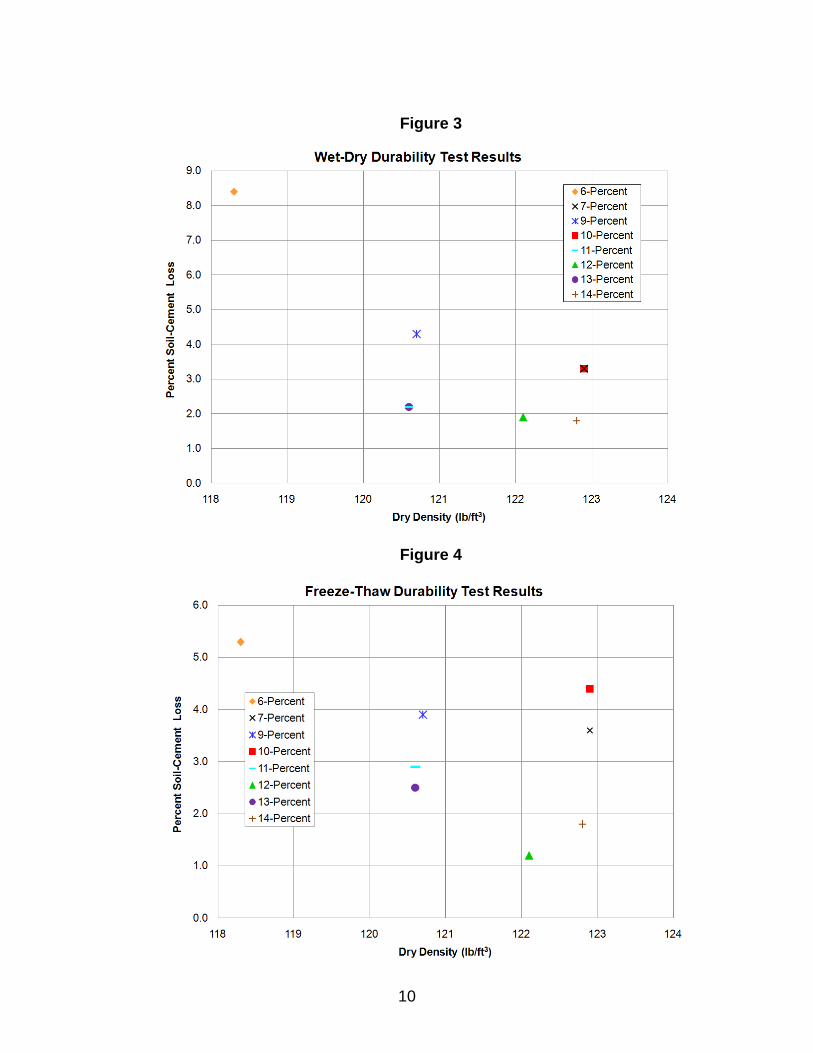
10
Figure 3
Figure 4

11
Figure 5
The above test results demonstrate that all the mix designs meet the
compressive strength and freeze-thaw durability requirements. However, based on the above test results, a minimum cement content of about 7 percent was required to meet the wet-dry losses durability design criteria. In addition to meeting the above strength and durability requirements, the soil-cement intended for use on the spillway needed to resist significant erosion from high velocity flows. Based on this criteria, the soil-cement used for the hydraulic performance test had cement contents of 8, 10, and 12 percent.
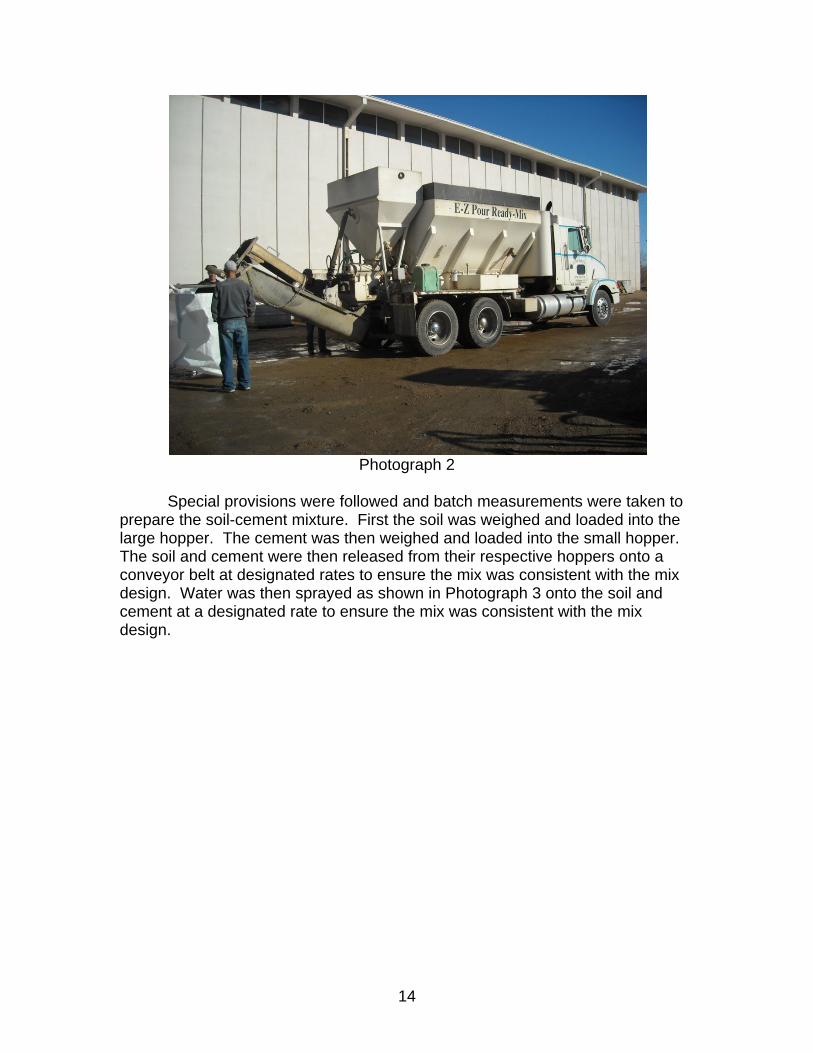
Soil-cement samples were prepared in the laboratory to establish the target density for preparation of the field test specimens. The gradation of the base material used for these laboratory density tests is shown as the solid line on Figure 6.
12
Figure 6
Results from the laboratory standard Proctor test are provided in Table 4.
TABLE 4 TARGET DENSITY AND MOISTURE CONTENT
Mix Design
(by dry-weight cement content)
Maximum Dry Density
(lb/ft3)
Optimum Moisture Content
(%)
8 percent 122.8 10.8
10 percent 122.5 11.2 12 percent 122.1 11.1
Construction of Test Specimens
Steel test boxes were constructed specifically for this evaluation. The soil-cement test boxes had nominal interior length, width, and depth dimensions of 30 feet, 3 feet, and 8 inches, respectively. A soil-cement test box is shown in Photograph 1.

13
Photograph 1
The soil-cement test specimens were constructed at the CSU Hydraulics
Laboratory under the direction of RJH on November 17 and 18, 2009. Dr. Christopher Thornton lead the work that was performed by CSU. Steel I-beams were placed transverse along the bottom of the test boxes to provide rigidity and support. The test boxes were placed on the ground to be filled with the soil-cement mixture. Wooden 4- by 4-inch boards were placed uniformly underneath the test boxes, between the steel I-beams, to add support and reduce vibration and movement during compaction of the soil-cement mixture.
Three soil-cement test specimens were constructed with cement contents of 8, 10, and 12 percent cement content by weight. Prior to placement in the test boxes, the Portland cement, soil, and water mixture were mixed using ready-mix truck as a volumetric cement mixer. The mixer contained a system of hoppers (two), sprayers, conveyor belt, chute, and auger, as shown in Photograph 2.
14
Photograph 2
Special provisions were followed and batch measurements were taken to
prepare the soil-cement mixture. First the soil was weighed and loaded into the large hopper. The cement was then weighed and loaded into the small hopper. The soil and cement were then released from their respective hoppers onto a conveyor belt at designated rates to ensure the mix was consistent with the mix design. Water was then sprayed as shown in Photograph 3 onto the soil and cement at a designated rate to ensure the mix was consistent with the mix design.

15
Photograph 3
The combined materials were then conveyed into a half-pipe chute where
a rotating auger mixed the materials. Soil-cement was placed in two lifts and compacted using a vibratory plate compactor to achieve a compacted thickness of 4 inches per lift. The first lift of the soil-cement mixture was then placed uniformly into the soil-cement test boxes as shown in Photograph 4.
Spray Nozzle

16
Photograph 4
After compaction of the first soil-cement lift, the surface was scarified with
a rake prior to placement of the second lift as shown in Photograph 5.

17
Photograph 5
Compaction of the final second lift for one of the test boxes is shown in
Photograph 6. In the corners of the test boxes, the soil-cement was compacted using hand tampers to create a uniform and consistent top appearance to the soil-cement in the test boxes. Field density tests were completed at random following each 4-inch lift placement and were performed in general accordance with ASTM D 2992 to record the density of the placed materials.
18
Photograph 6
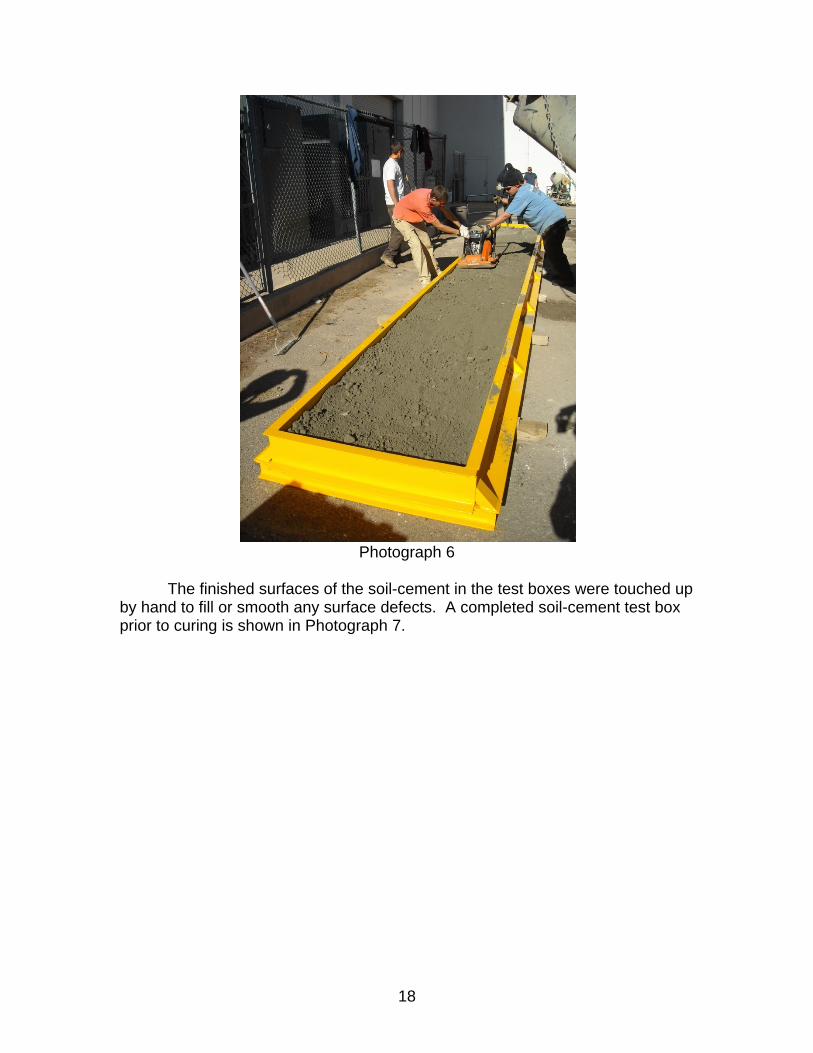
The finished surfaces of the soil-cement in the test boxes were touched up
by hand to fill or smooth any surface defects. A completed soil-cement test box prior to curing is shown in Photograph 7.

19
Photograph 7
Field testing density and moisture results for each of the test mix designs
are summarized in Table 5.
TABLE 5 FIELD TESTING DENSITY AND MOISTURE RESULTS ON SOIL-CEMENT IN
THE TEST BOXES Mix Design (by cement
content)
Summary of Field Testing Results
Density Moisture
8 percent
All eight tests had a compaction above 96 percent of the maximum dry density.
The average compaction was 96.9 percent of the maximum dry density.
Five tests were below the optimum moisture content, ranging from 2.3 percent to 0.4 percent below
Three tests were within the specified range.
10 percent
All six tests had a compaction above 96 percent of the maximum dry density.
The average compaction was 96.7 percent of the maximum dry density.
One test was 4.4 percent below the optimum moisture content.
Five tests were within the specified range.

20
Mix Design (by cement
content)
Summary of Field Testing Results
Density Moisture
12 percent
All six tests had a compaction above 96 percent of the maximum dry density.
The average compaction was 97.2 percent of the maximum dry density.
Four tests were below the optimum moisture content, ranging from 4.7 percent to 1.2 percent below.
One test was within the specified range. One test was above the specified range at
1.9 percent above optimum moisture content.
Based on the density test results of the soil-cement in the test boxes, the
compaction was above 96 percent of the maximum dry density; however, the average in-situ compaction was less than 98 percent of the maximum dry density for all three test specimens. Also, the moisture content of ten out of the 20 tests was below optimum moisture content and one test was more than 1.5 percent above optimum moisture content. The soil-cement material placed in the test boxes did not meet the requirements of the project specifications because:
The average density was 96.9 percent of Proctor maximum (specifications require an average of 98 percent).
The moisture content of half of the tests was below optimum moisture content. However, the use of these test specimens was deemed appropriate for
hydraulic performance testing because a) it was RJH’s opinion that the overall objective of the hydraulic performance testing could be achieved with the test specimens as constructed because the test specimens would likely be representative of the field placed soil-cement, b) concerns with the reliability of using a nuclear density gauge to test a thin layer of material in a steel box, and c) the hydraulic performance tests would provide conservative estimates of the scour potential of the soil-cement lining for the Project.
Pucks (“samples”) were prepared from the materials used for each test specimen for subsequent laboratory testing. The pucks were developed according to ASTM D 558 using 4-inch-diameter steel molds about 4.6 inches deep and in three lifts. The materials were compacted using a 5.5 lb. hammer, falling 12 inches, with 25 blows per each of the three lifts as shown in Photograph 8.
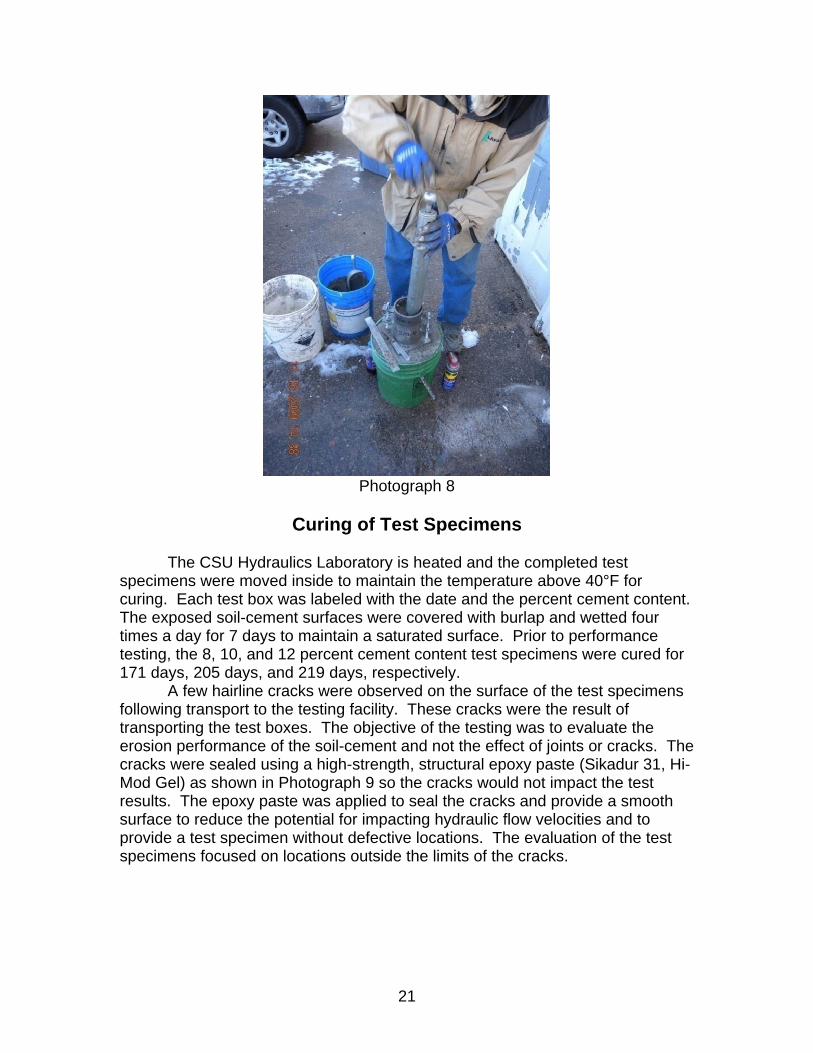
21
Photograph 8
Curing of Test Specimens
The CSU Hydraulics Laboratory is heated and the completed test
specimens were moved inside to maintain the temperature above 40°F for curing. Each test box was labeled with the date and the percent cement content. The exposed soil-cement surfaces were covered with burlap and wetted four times a day for 7 days to maintain a saturated surface. Prior to performance testing, the 8, 10, and 12 percent cement content test specimens were cured for 171 days, 205 days, and 219 days, respectively.
A few hairline cracks were observed on the surface of the test specimens following transport to the testing facility. These cracks were the result of transporting the test boxes. The objective of the testing was to evaluate the erosion performance of the soil-cement and not the effect of joints or cracks. The cracks were sealed using a high-strength, structural epoxy paste (Sikadur 31, Hi-Mod Gel) as shown in Photograph 9 so the cracks would not impact the test results. The epoxy paste was applied to seal the cracks and provide a smooth surface to reduce the potential for impacting hydraulic flow velocities and to provide a test specimen without defective locations. The evaluation of the test specimens focused on locations outside the limits of the cracks.
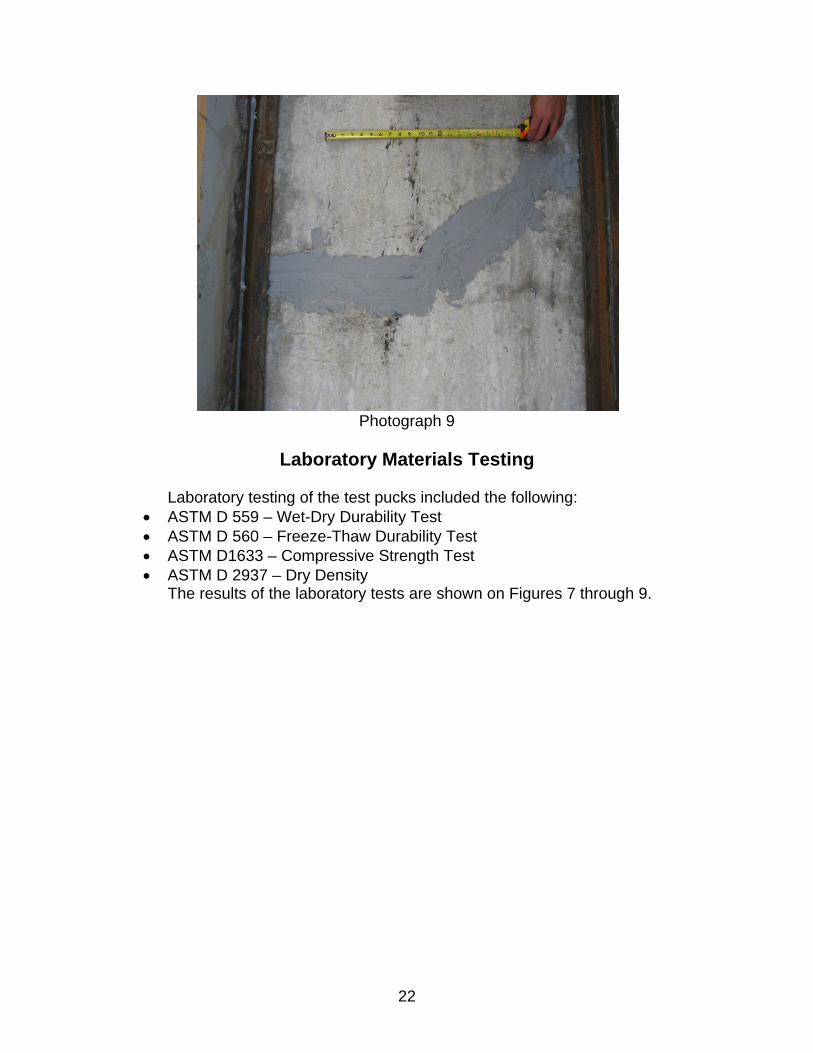
22
Photograph 9
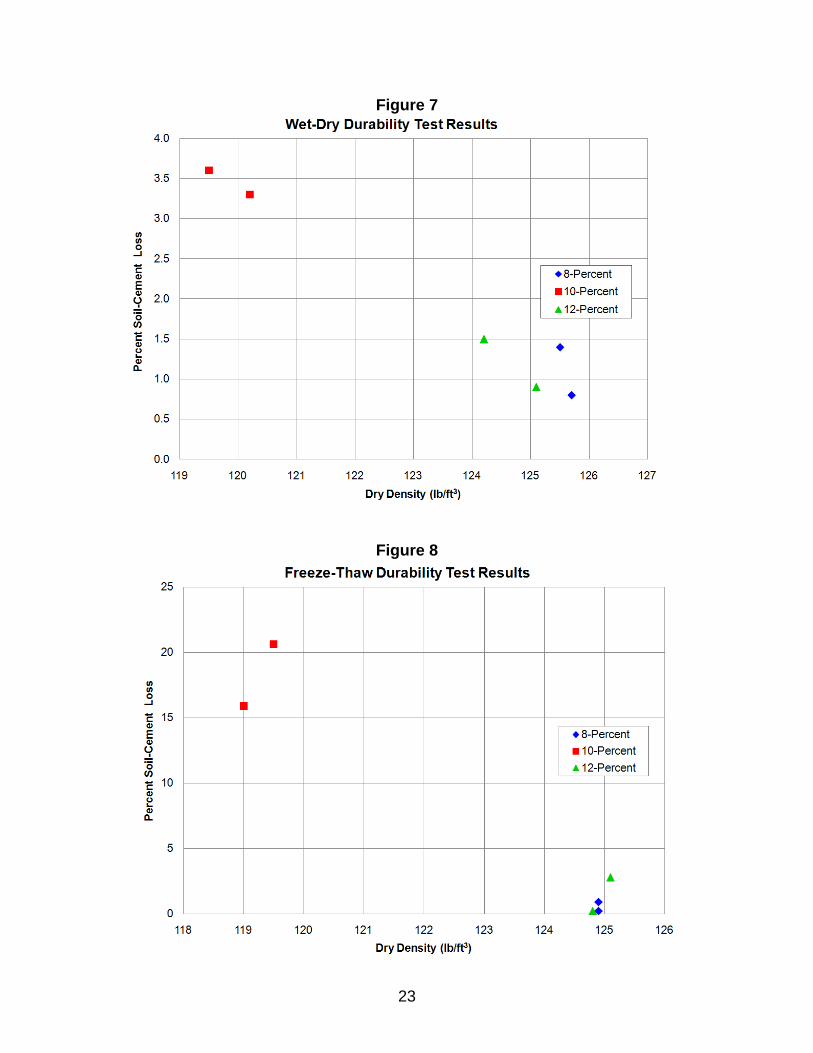
Laboratory Materials Testing
Laboratory testing of the test pucks included the following:
ASTM D 559 – Wet-Dry Durability Test ASTM D 560 – Freeze-Thaw Durability Test ASTM D1633 – Compressive Strength Test ASTM D 2937 – Dry Density
The results of the laboratory tests are shown on Figures 7 through 9.
23
Figure 7
Figure 8

24
Figure 9
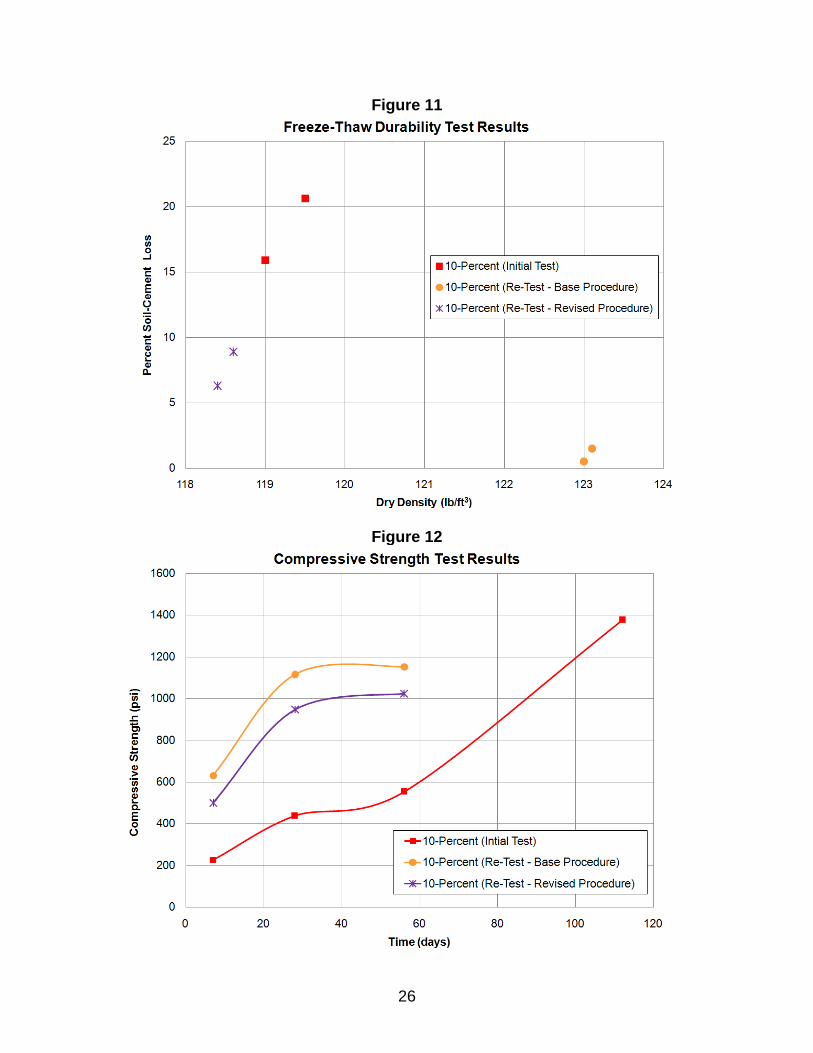
It was unclear why the 10 percent cement content mix design test results
were anomalous and had higher losses for the freeze/thaw durability tests and the compressive strength did not significantly increase after about 48 days. The anomalous results could be the result of sample preparation or laboratory errors; however, the definitive reasons were not identified. In general, the soil-cement test sample pucks had about a 1 to 4 percent higher density than the soil-cement samples in the test boxes. This is likely because the compaction equipment used to compact the soil-cement in the test boxes does not replicate the energy dissipated with the molding procedures, which was used to construct the soil-cement test samples.
Based on the anomalous results from the laboratory testing program regarding the sample pucks prepared using 10 percent cement, RJH decided that additional samples and associated laboratory testing was needed to further evaluate the 10 percent cement content mix design.
Additional samples at the 10 percent complete mix design were developed using procedures as previously described (ASTM D 558). The compaction process involved the following two procedures:
BASE PROCEDURE - Twelve samples were compacted to greater than 97 percent of the maximum dry density near the optimum moisture content. This procedure was intended to replicate the samples developed for the original laboratory testing program.
REVISED PROCEDURE - Twelve samples were compacted to about 96 percent of the maximum dry density at slightly higher moisture contents.
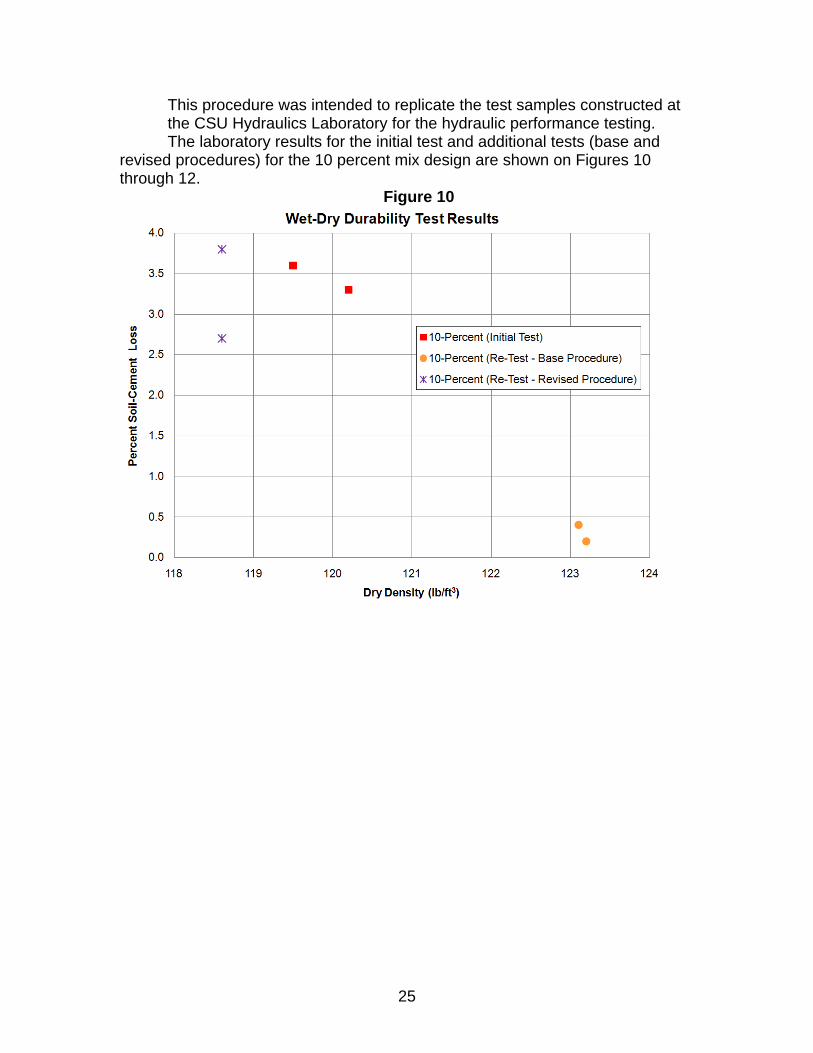
25
This procedure was intended to replicate the test samples constructed at the CSU Hydraulics Laboratory for the hydraulic performance testing. The laboratory results for the initial test and additional tests (base and
revised procedures) for the 10 percent mix design are shown on Figures 10 through 12.
Figure 10
26
Figure 11
Figure 12

27
Results from the laboratory 10 percent mix re-testing program are
summarized as follows: The test samples were generally within the acceptable ranges of results
and standard deviation tolerances for density and moisture content. The average results for test samples developed for both compaction
procedures met specifications for wet-dry and freeze-thaw durability. The compressive strengths were 41 and 26 percent higher at 56 days for
the base and revised compaction procedures, respectively, than the soil-cement with 12 percent. Based on laboratory data from the 10 percent mix re-testing, we
concluded that the initial laboratory test data for 10 percent mix is anomalous and should not be relied upon. The laboratory data using the base procedure for the 10 percent mix should be used to compare against the data from 8 and 12 percent mix designs.
Hydraulic Performance Testing
Test Facility
The hydraulic flume at the CSU Hydraulics Laboratory was used for the hydraulic performance testing of the soil-cement test specimens. A schematic profile of the hydraulic flume is illustrated on Figure 13. The testing apparatus consisted of a flume that is 5 feet wide and 100 feet long with a 2H:1V slope. The upper portion of the flume was modified to seamlessly accommodate the 3-foot-wide by 30-foot-long test boxes. The test boxes were placed within the modified flume section using a crane and attached with steel angle irons and bolts. Transition sections were added to ensure uniform velocity profiles across the upstream and downstream ends of the test boxes. A seamless transition was accomplished on the upstream end with steel flushing and the surface of the sheet metal was modified by using a spray-on texturing to give a surface roughness similar to the soil-cement. A perforated toe plate as added to the downstream end to ensure exit discharge conditions that would not provide a premature scour location that would propagate upstream and influence the hydraulic test results.
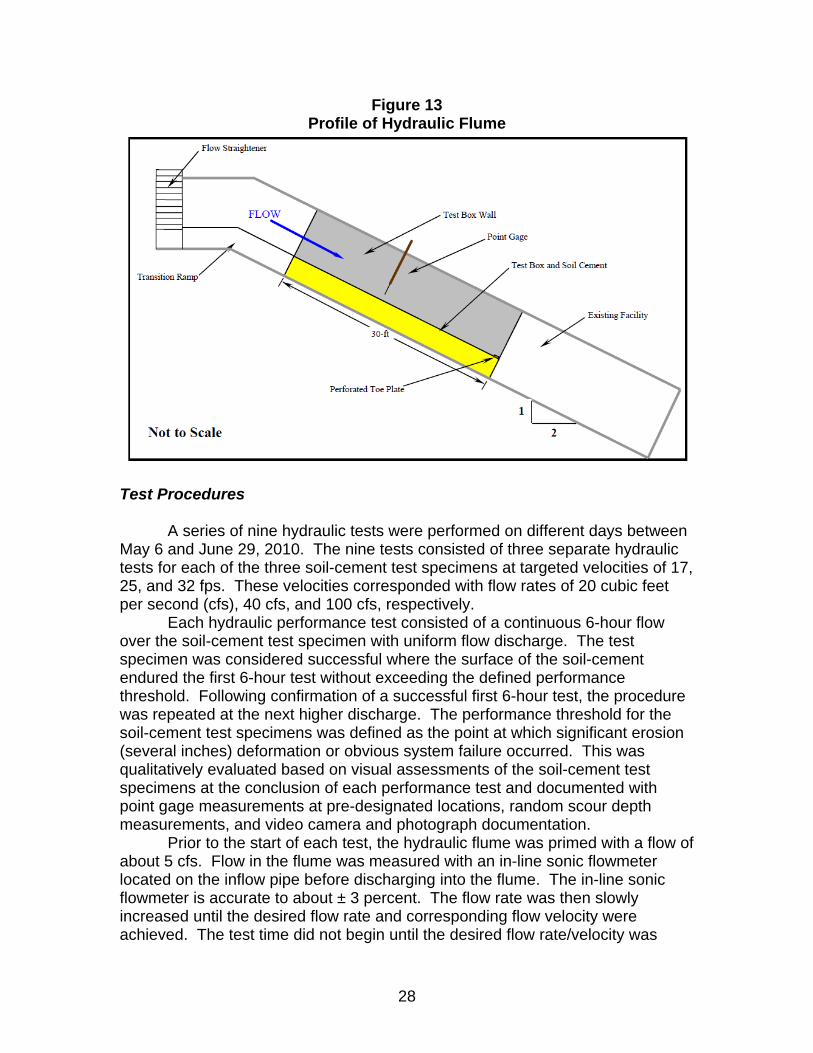
28
Figure 13 Profile of Hydraulic Flume
Test Procedures
A series of nine hydraulic tests were performed on different days between May 6 and June 29, 2010. The nine tests consisted of three separate hydraulic tests for each of the three soil-cement test specimens at targeted velocities of 17, 25, and 32 fps. These velocities corresponded with flow rates of 20 cubic feet per second (cfs), 40 cfs, and 100 cfs, respectively.
Each hydraulic performance test consisted of a continuous 6-hour flow over the soil-cement test specimen with uniform flow discharge. The test specimen was considered successful where the surface of the soil-cement endured the first 6-hour test without exceeding the defined performance threshold. Following confirmation of a successful first 6-hour test, the procedure was repeated at the next higher discharge. The performance threshold for the soil-cement test specimens was defined as the point at which significant erosion (several inches) deformation or obvious system failure occurred. This was qualitatively evaluated based on visual assessments of the soil-cement test specimens at the conclusion of each performance test and documented with point gage measurements at pre-designated locations, random scour depth measurements, and video camera and photograph documentation.
Prior to the start of each test, the hydraulic flume was primed with a flow of about 5 cfs. Flow in the flume was measured with an in-line sonic flowmeter located on the inflow pipe before discharging into the flume. The in-line sonic flowmeter is accurate to about ± 3 percent. The flow rate was then slowly increased until the desired flow rate and corresponding flow velocity were achieved. The test time did not begin until the desired flow rate/velocity was
29
achieved. Hourly measurements of water surface elevations were made using the point gage at 1-foot intervals (stations) along the centerline, and 1-foot to the left and right of the centerline.
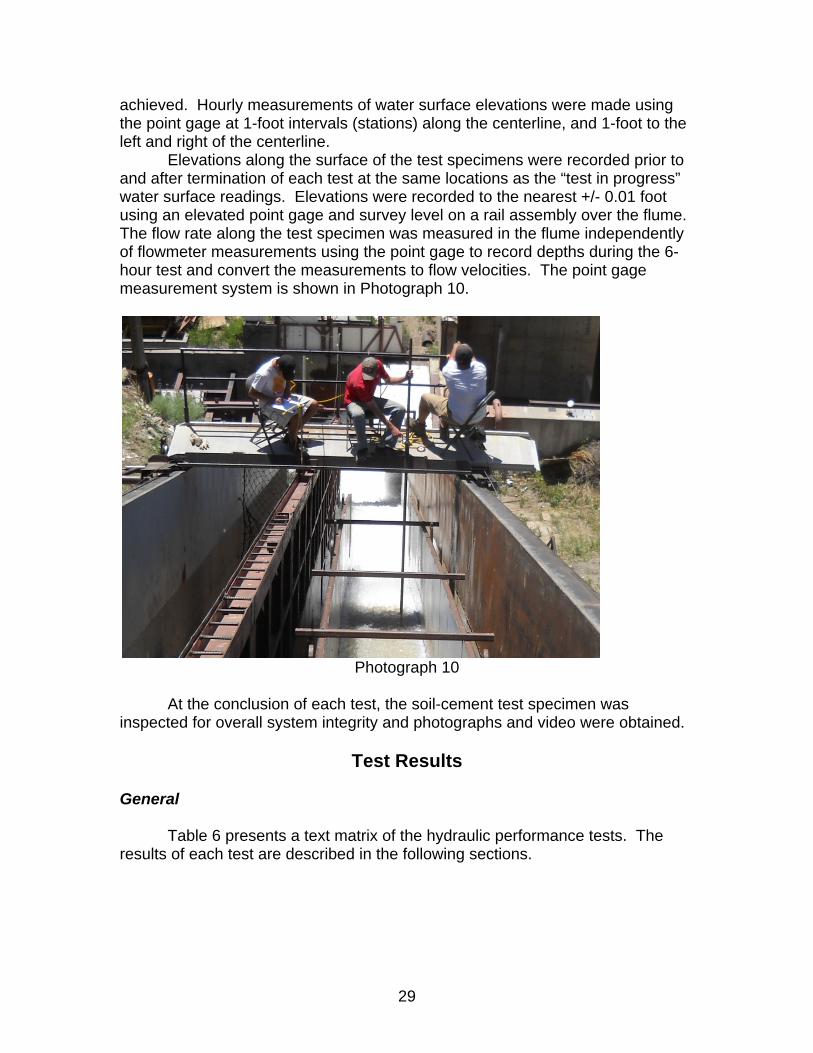
Elevations along the surface of the test specimens were recorded prior to and after termination of each test at the same locations as the “test in progress” water surface readings. Elevations were recorded to the nearest +/- 0.01 foot using an elevated point gage and survey level on a rail assembly over the flume. The flow rate along the test specimen was measured in the flume independently of flowmeter measurements using the point gage to record depths during the 6-hour test and convert the measurements to flow velocities. The point gage measurement system is shown in Photograph 10.
Photograph 10
At the conclusion of each test, the soil-cement test specimen was
inspected for overall system integrity and photographs and video were obtained.
Test Results General
Table 6 presents a text matrix of the hydraulic performance tests. The
results of each test are described in the following sections.

30
TABLE 6 HYDRAULIC PERFORMANCE TEST SPECIMEN MATRIX
Test ID
Target Flow Rate
(cfs)
Target Velocity
(ft/s)
Test Duration
(hrs) 8 Percent Cement
1 20 17 6 2 40 25 6 3 100 32 6
10 Percent Cement 1 20 17 6 2 40 25 6 3 100 32 6
12 Percent Cement 1 20 17 6 2 40 25 6 3 100 32 6
Following the hydraulic performance testing, water surface profiles
developed from the data collected during testing were evaluated using a standard step theoretical hydraulic model. The theoretical hydraulic models were developed with varying Manning’s n values to identify the best-fit Manning’s roughness. Based on the best-fit profiles, the Manning’s n coefficient was determined to be 0.016, and velocity and shear stress values were computed at generally 1-foot increments along the test specimens. For comparison purposes, the manning’s n coefficient developed by RJH for the hydraulic design of the emergency spillway channel was 0.022; which compares favorably to the hydraulic flume test roughness. Table 7 provides a summary of the actual computed velocities and shear stress along the test specimen for each hydraulic performance test.
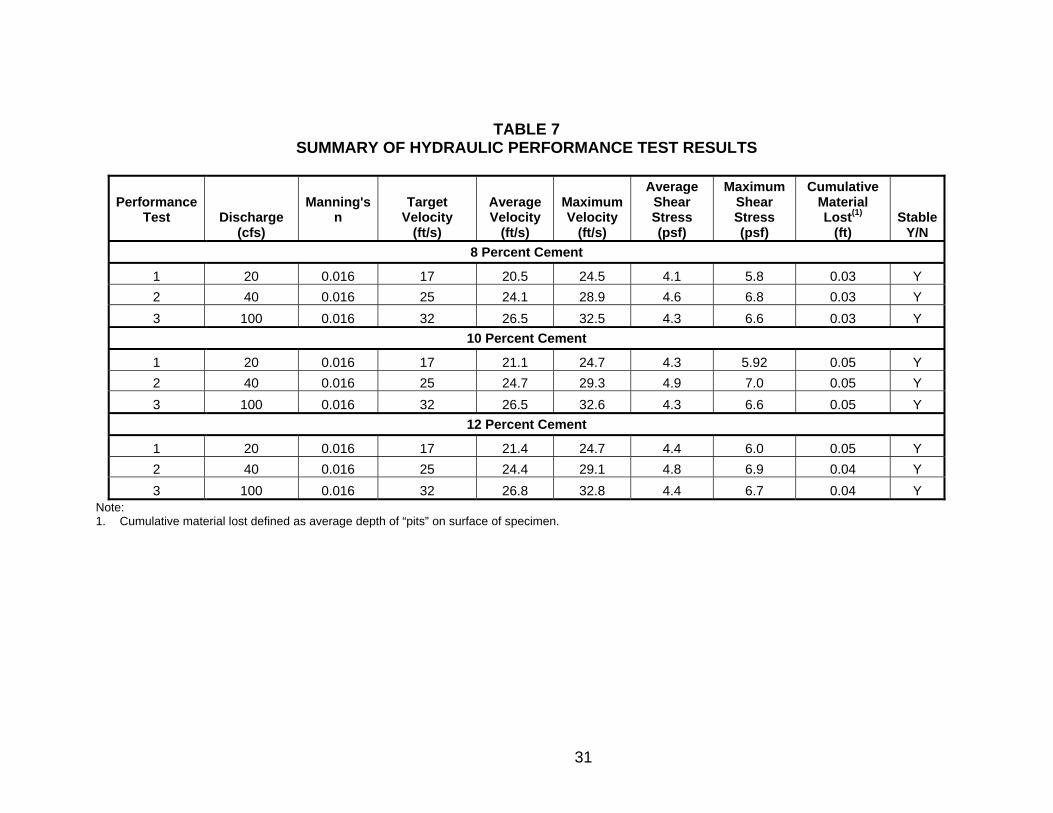
31
TABLE 7 SUMMARY OF HYDRAULIC PERFORMANCE TEST RESULTS
Performance Test
Discharge
(cfs)
Manning's n
Target Velocity
(ft/s)
Average Velocity
(ft/s)
Maximum Velocity
(ft/s)
Average Shear Stress (psf)
Maximum Shear Stress (psf)
Cumulative Material Lost(1)
(ft) Stable
Y/N
8 Percent Cement
1 20 0.016 17 20.5 24.5 4.1 5.8 0.03 Y
2 40 0.016 25 24.1 28.9 4.6 6.8 0.03 Y
3 100 0.016 32 26.5 32.5 4.3 6.6 0.03 Y
10 Percent Cement
1 20 0.016 17 21.1 24.7 4.3 5.92 0.05 Y
2 40 0.016 25 24.7 29.3 4.9 7.0 0.05 Y
3 100 0.016 32 26.5 32.6 4.3 6.6 0.05 Y
12 Percent Cement
1 20 0.016 17 21.4 24.7 4.4 6.0 0.05 Y
2 40 0.016 25 24.4 29.1 4.8 6.9 0.04 Y
3 100 0.016 32 26.8 32.8 4.4 6.7 0.04 Y Note: 1. Cumulative material lost defined as average depth of “pits” on surface of specimen.

32
8 Percent Cement Content Test
After the initial test (Test 1) with an average velocity of about 20.5 fps and a maximum velocity of 24.5 fps, multiple “pits” (i.e., small areas of localized loss of material) were observed at randomly spaced locations along the test specimen. The largest pit was about 2 inches in diameter, and less than 1/4 inch deep. The remaining pits were generally less than 1 inch in diameter, and about 1/8 inch to 1/4 inch deep. No qualifying surface erosion of the soil-cement was observed.
Test 2 had an average velocity of about 24.1 fps and a maximum velocity of 28.9 fps. The existing pits developed during Test 1 did not appear to increase in diameter during Test 2. There was a very slight increase in depth, generally less than about 1/8 inch at the documented location of the Test 1 pits. Also, an increase in the number of small pits that were less than 1 inch in diameter and less than 1/4 inch in depth were observed. No qualifying surface erosion of the soil-cement was observed.
Test 3 had an average velocity of about 26.5 fps and a maximum velocity of 32.5 fps. The existing pits from Tests 1 and 2 did not appear to increase significantly during Test 3 in diameter or depth; depth increase was less than a 1/4 inch. Examples of the observed surface of the soil-cement at generally the same documented location following each test are shown in Photographs 11 through 13.
Photograph 11: Test 1 – 8 percent at 20 cfs
Upstream
Sealed Crack Typical Pit

33
Photograph 12: Test 2 – 8 percent at 40 cfs
Photograph 13: Test 3 – 8 percent at 100 cfs
Upstream
Sealed Crack Typical Pit
Upstream
Downstream
34
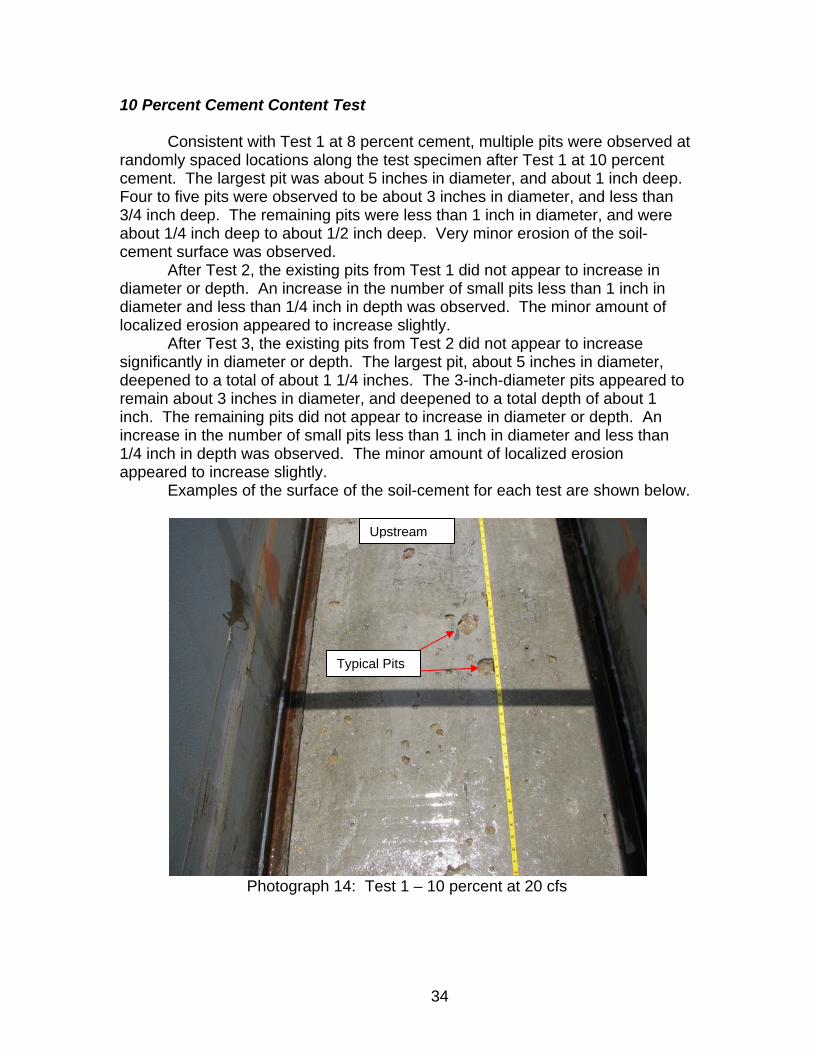
10 Percent Cement Content Test
Consistent with Test 1 at 8 percent cement, multiple pits were observed at randomly spaced locations along the test specimen after Test 1 at 10 percent cement. The largest pit was about 5 inches in diameter, and about 1 inch deep. Four to five pits were observed to be about 3 inches in diameter, and less than 3/4 inch deep. The remaining pits were less than 1 inch in diameter, and were about 1/4 inch deep to about 1/2 inch deep. Very minor erosion of the soil-cement surface was observed.
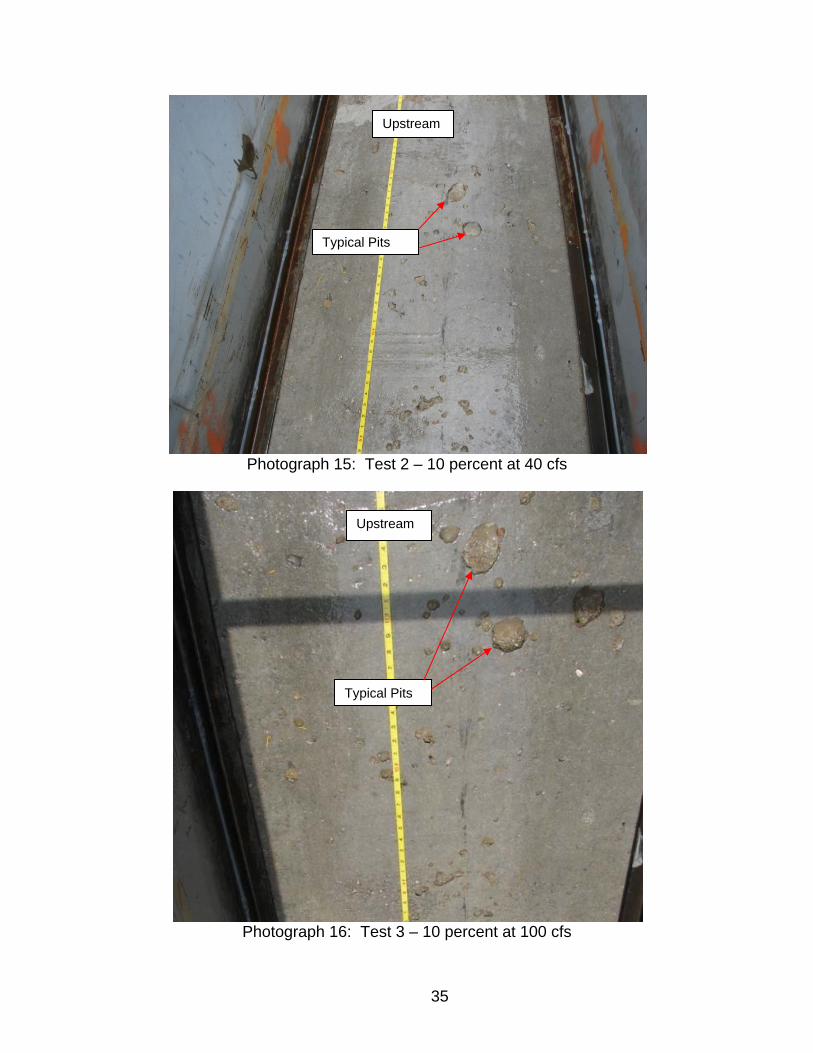
After Test 2, the existing pits from Test 1 did not appear to increase in diameter or depth. An increase in the number of small pits less than 1 inch in diameter and less than 1/4 inch in depth was observed. The minor amount of localized erosion appeared to increase slightly.
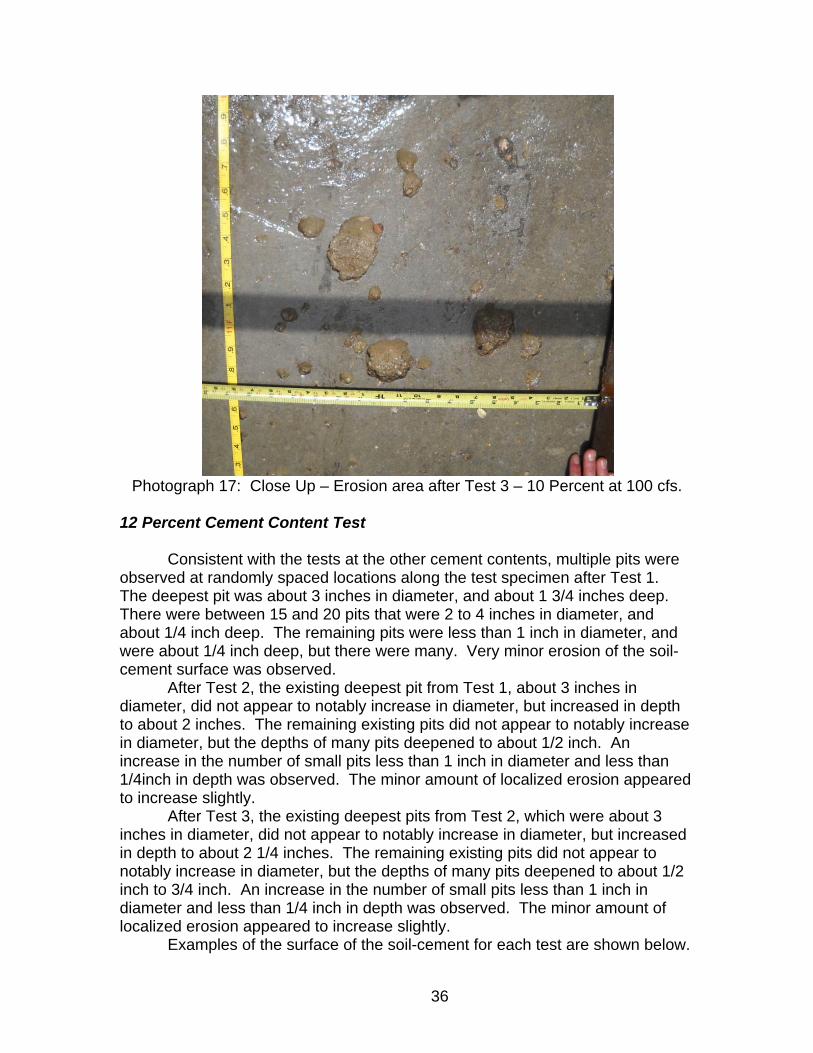
After Test 3, the existing pits from Test 2 did not appear to increase significantly in diameter or depth. The largest pit, about 5 inches in diameter, deepened to a total of about 1 1/4 inches. The 3-inch-diameter pits appeared to remain about 3 inches in diameter, and deepened to a total depth of about 1 inch. The remaining pits did not appear to increase in diameter or depth. An increase in the number of small pits less than 1 inch in diameter and less than 1/4 inch in depth was observed. The minor amount of localized erosion appeared to increase slightly.
Examples of the surface of the soil-cement for each test are shown below.
Photograph 14: Test 1 – 10 percent at 20 cfs
Upstream
Typical Pits
35
Photograph 15: Test 2 – 10 percent at 40 cfs
Photograph 16: Test 3 – 10 percent at 100 cfs
Upstream
Typical Pits
Upstream
Typical Pits
36
Photograph 17: Close Up – Erosion area after Test 3 – 10 Percent at 100 cfs.
12 Percent Cement Content Test
Consistent with the tests at the other cement contents, multiple pits were
observed at randomly spaced locations along the test specimen after Test 1. The deepest pit was about 3 inches in diameter, and about 1 3/4 inches deep. There were between 15 and 20 pits that were 2 to 4 inches in diameter, and about 1/4 inch deep. The remaining pits were less than 1 inch in diameter, and were about 1/4 inch deep, but there were many. Very minor erosion of the soil-cement surface was observed.
After Test 2, the existing deepest pit from Test 1, about 3 inches in diameter, did not appear to notably increase in diameter, but increased in depth to about 2 inches. The remaining existing pits did not appear to notably increase in diameter, but the depths of many pits deepened to about 1/2 inch. An increase in the number of small pits less than 1 inch in diameter and less than 1/4inch in depth was observed. The minor amount of localized erosion appeared to increase slightly.
After Test 3, the existing deepest pits from Test 2, which were about 3 inches in diameter, did not appear to notably increase in diameter, but increased in depth to about 2 1/4 inches. The remaining existing pits did not appear to notably increase in diameter, but the depths of many pits deepened to about 1/2 inch to 3/4 inch. An increase in the number of small pits less than 1 inch in diameter and less than 1/4 inch in depth was observed. The minor amount of localized erosion appeared to increase slightly.
Examples of the surface of the soil-cement for each test are shown below.

37
Photograph 18: Test 1 – 12 percent at 20 cfs
Photograph 19: Test 2 – 12 percent at 40 cfs
Upstream
Typical Pit

38
Photograph 20: Test 3 – 12 percent at 100 cfs
Photograph 21: Close Up – Erosion area after Test 3 – 12 Percent at 100 cfs.
Upstream
Typical Pit
39
Findings from Hydraulic Performance Testing
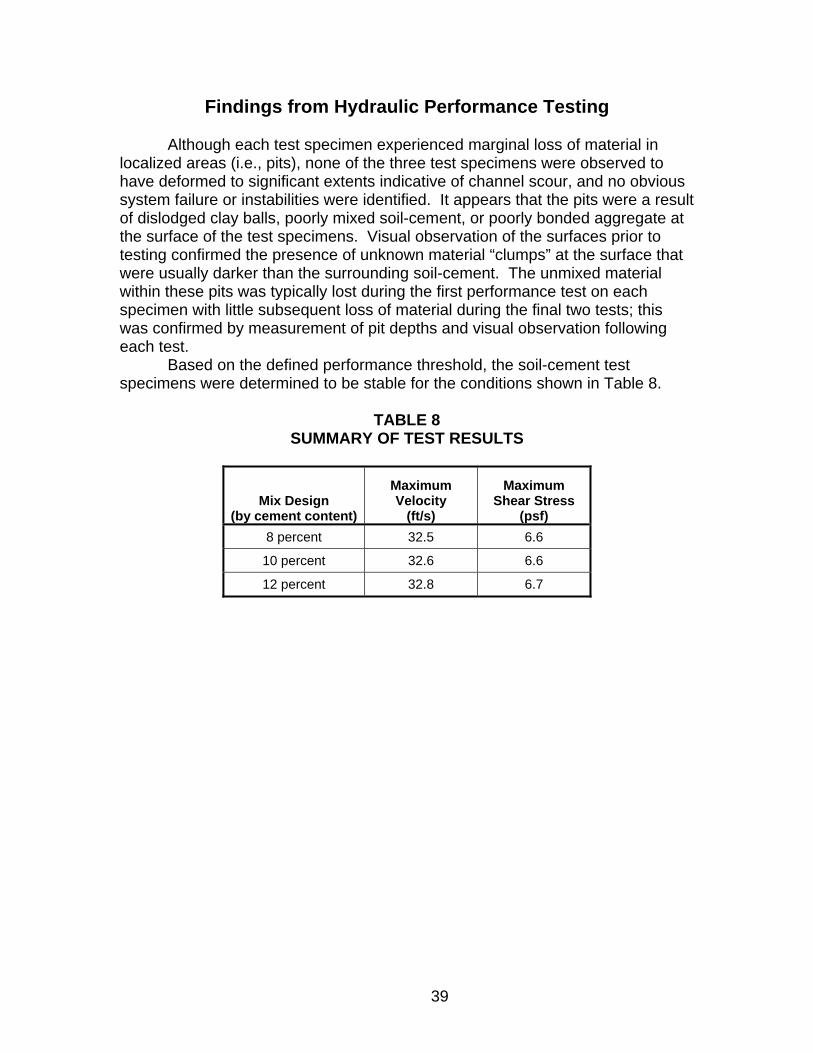
Although each test specimen experienced marginal loss of material in localized areas (i.e., pits), none of the three test specimens were observed to have deformed to significant extents indicative of channel scour, and no obvious system failure or instabilities were identified. It appears that the pits were a result of dislodged clay balls, poorly mixed soil-cement, or poorly bonded aggregate at the surface of the test specimens. Visual observation of the surfaces prior to testing confirmed the presence of unknown material “clumps” at the surface that were usually darker than the surrounding soil-cement. The unmixed material within these pits was typically lost during the first performance test on each specimen with little subsequent loss of material during the final two tests; this was confirmed by measurement of pit depths and visual observation following each test.
Based on the defined performance threshold, the soil-cement test specimens were determined to be stable for the conditions shown in Table 8.
TABLE 8
SUMMARY OF TEST RESULTS
Mix Design (by cement content)
Maximum Velocity
(ft/s)
Maximum Shear Stress
(psf)
8 percent 32.5 6.6
10 percent 32.6 6.6
12 percent 32.8 6.7
40
Conclusions
Based on the results of this evaluation, we offer the following conclusions and opinions:
Soil-cement lining as defined in the “Test Program” can be effectively and economically designed to withstand velocities for durations of at least 32 fps for at least 6 hours without significant erosion of the surface for the base soils and cement contents used in this evaluation. The base soil is a well graded, fine to coarse sand with about 8 percent fine gravel and 15 percent fines. The cement content ranges from 8 to 12 percent by dry weight.
It is probable that soil-cement can be used for channel lining applications where the applied velocity exceeds 32 fps for durations greater than 6 hours; however, the performance will depend on the base soil and site specific properties of the soil-cement mix.
The cement content required to produce a product that met the design criteria for wet/dry durability (maximum 6 percent loss) and freeze-thaw durability (maximum 8 percent loss) also met the criteria for high velocity flows.
The erosion and surface deterioration from high velocity flows was not significantly impacted in the test specimen by additional cement contents greater than 8 percent.
The effect of base soil gradation on the behavior of soil-cement subject to high velocity flows was not evaluated. The results and conclusions from this evaluation may not be appropriate for soil-cement materials with a significantly different grain size distribution and cement contents.
The long-term performance of soil-cement used for high velocity flow will vary and it is probable that the effects of freeze-thaw cycles at the locations of the pits will be more severe than at other locations.
The testing represents the performance of freshly installed soil-cement lining and the long-term performance could be impacted by environmental factors.