Soil and plant responses to pyrogenic organic matter ... · carbon stability and symbiotic...
140
Edvaldo Sagrilo Soil and plant responses to pyrogenic organic matter: carbon stability and symbiotic patterns
-
Upload
truongdang -
Category
Documents
-
view
214 -
download
0
Transcript of Soil and plant responses to pyrogenic organic matter ... · carbon stability and symbiotic...

Edvaldo Sagrilo
Soil and plant responses to pyrogenic organic matter: carbon stability and symbiotic patterns

Soil and plant responses to pyrogenic
organic matter: carbon stability and
symbiotic patterns
Edvaldo Sagrilo

Thesis committee
Promotors
Prof. Dr T.W. Kuyper
Personal chair at the Department of Soil Quality
Wageningen University
Prof. Dr E. Hoffland
Personal chair at the Department of Soil Quality
Wageningen University
Other members
Prof. Dr P.C. Struik, Wageningen University
Prof. Dr B. Glaser, University of Bayreuth, Germany
Dr L. Mommer, Wageningen University
Prof. Dr W. de Vries, Wageningen University
This research was conducted under the auspices of the C.T. de Wit Graduate School for
Production Ecology and Resource Conservation

Soil and plant responses to pyrogenic
organic matter: carbon stability and
symbiotic patterns
Edvaldo Sagrilo
Thesis
submitted in fulfilment of the requirements for the degree of doctor
at Wageningen University
by the authority of the Rector Magnificus
Prof. Dr M.J. Kropff,
in the presence of the
Thesis Committee appointed by the Academic Board
to be defended in public
on Tuesday 9 December 2014
at 1:30 p.m. in the Aula.

E. Sagrilo
Soil and plant responses to pyrogenic organic matter: carbon stability and symbiotic
patterns
128 pages.
PhD thesis, Wageningen University, Wageningen, NL (2014)
With references, with summaries in English, Dutch and Portuguese
ISBN: 978-94-6257-167-9

To Monica

Abstract
Soil amendment with pyrogenic organic matter (PyOM) can sequester carbon, increase
mutualistic root symbioses with arbuscular mycorrhizal fungi and nitrogen-fixing rhizobia, and
hence improve crop yield. However, there is still a gap in our knowledge about the effects of
PyOM over longer temporal scales, especially in field experiments that last longer than one
cropping cycle. This thesis aims to study interactions between PyOM and soil organic carbon
(SOC) and symbiotic patterns in soybean (Glycine max) under tropical field conditions in a
sandy ferralsol in northeast Brazil.
Data from a meta-analysis indicated that PyOM additions significantly increase CO2 emissions
at PyOM-C (PyC):SOC ratios >2, suggesting that such increases are derived from the labile
fractions of PyOM rather than from SOC. They also indicated that positive priming is not a
main driver of increased CO2 emissions in PyOM-amended soils. Results from a field
experiment using 13C isotopic data confirmed the lack of positive priming of SOC over four
cropping cycles. Data demonstrated that decomposition of traditionally produced PyOM was
faster than stated in the literature, and depended on the PyOM application rate. We found a
significant PyOM × cropping cycle interaction for mycorrhizal root colonization, with a linear
decrease in the first cropping cycle with increasing PyOM rates, in contrast to a linear increase
in colonization in the fourth cropping cycle. Grain yield was highest at high PyOM rates in
phosphorus-fertilized treatments in the fourth cropping cycle. Path analysis indicated a lack of
pH and phosphorus-mediated effects on root colonization by arbuscular mycorrhizal fungi,
suggesting interference in signaling processes as the likely mechanism for PyOM effects on the
mycorrhizal symbiosis over time. Cropping cycle had a major effect on biological nitrogen
fixation, but no effects of PyOM were observed. Alleviation of micronutrient deficiency at the
fourth cycle enhanced positive effects of phosphorus fertilizer and increased biological nitrogen
fixation, suggesting that under adequate management, PyOM does not increase nitrogen
fixation in soybean.
In this thesis I demonstrated that stability of PyOM can be influenced by the soil environment
and provide indications that mycorrhizal activity may play a role in this stability in the long-
term. I also showed that the main beneficial effects of PyOM on AMF and crop yield develop
with time, but in well-managed soils, increased crop yield is not a direct consequence of PyOM
addition.


x
Contents
Chapter 1 General introduction ............................................................................. 1
Chapter 2 Emission of CO2 from biochar-amended soils and implications for soil
organic carbon .................................................................................... 15
Chapter 3 Biochar decomposition under field conditions depends on its
application rate ................................................................................... 37
Chapter 4 Mechanisms affecting mycorrhizal dynamics in soils amended with
pyrogenic organic matter .................................................................... 49
Chapter 5 Does pyrogenic organic matter enhance biological nitrogen fixation in
well-managed soybean cropping systems? ......................................... 69
Chapter 6 General discussion ............................................................................... 83
References ........................................................................................... 97
Summary ............................................................................................ 109
Samenvatting ...……………………………………………………..113
Sumário ...…………………………………………………………..119
Acknowledgements .......……………………………………………123
Current affiliation of authors ............................................................. 113
PE&RC Training and Educational Statement ………………………127

ix
Abbreviations
ADE Amazonian Dark Earth
AMF Arbuscular Mycorrhizal Fungi
ANOVA Analysis of variance
BC Black carbon
BNF Biological nitrogen fixation
CC Cropping cycle
CEC Cation exchange capacity
CI Confidence interval
CO2 Carbon dioxide
CS Cropping season
d.f. Degrees of freedom
DHG Dehydrogenase
FDA Fluescein diacetate
IRGA Infrared gas analyser
Ndfa Nitrogen derived from air
PE Priming effect
PET Potential evapotranspiration
PyC Pyrogenic carbon
PyOM Pyrogenic organic matter
RR Response ratio
SD Standard deviation
SE Standard error
SOC Soil organic carbon
SOM Soil organic matter
TTF Triphenyltetrazoliumformazan


Chapter 1
General introduction
Edvaldo Sagrilo


General introduction
3
1.1 Introduction
The use of pyrogenic organic matter (PyOM), also named biochar, as a soil amendment was
inspired by the dyscovery of anthropogenic soils in the Amazon basin, called “Amazonian Dark
Earths” (ADE - Terra Preta de Índio). These soils are more fertile and contain larger amounts
of PyOM than the surrounding soils (Glaser et al., 2001). The high amount of PyOM is
considered one of the main reasons for the high fertility of ADE (Glaser et al., 2002).
Soil additions of PyOM have been shown to improve soil fertility and crop yields (Jeffery et
al., 2011), while also providing other environmental services. These environmental services
include PyOM’s capacity to increase the recalcitrant soil organic carbon (SOC) pool (Lehmann
et al., 2006; Knicker et al., 2013), contributing to offset CO2 emissions. The combination of
increased nutrient availability and crop yields, with a larger SOC pool suggests that the “carbon
dilemma” (Janzen, 2006) could be solved by adding PyOM to the soil. Solving this dilemma
would imply that crops could benefit from SOC decomposition and nutrient release,
concomitantly with increases in SOC stocks. However, Jeffery et al. (2013) demonstrated that
in many instances, it is not possible for all benefits to be simultaneously maximized in PyOM-
amended soils, due to trade-offs between two or more “wins”, for instance, between soil fertility
and C sequestration.
Currently there is growing interest in research on PyOM (Fig. 1.1) and several areas have been
emphasized in particular, for instance SOC and PyOM stability in PyOM-amended soils
(Verheijen et al., 2014). Effects of PyOM on soil fertility and crop yield have also received
attention of researchers, especially in tropical countries such as Brazil (Maia et al., 2011). In
such environments, high temperature and soil moisture favour SOC decomposition (Tiessen et
al, 1994). Therefore, soil amendment with PyOM is of particular interest in tropical agro-
ecosystems, where the management of SOC represents one of the main challenges for
sustainable use of soil.
Soil organic matter (SOM) is essential as a source of important nutrients such as P and N, which
become available when SOM is decomposed (Tiessen et al., 1994). It is also essential for
microbial activity as SOM provides the fuel for the “engine” that drives soil quality (Balota et
al., 2004; Causarano et al., 2008). Changes in soil microbiota following PyOM addition may
have direct or indirect effects on plant growth through changes in nutrient cycles or soil
structure (Lehmann et al., 2011). Modification of soil microbial assemblages following PyOM
addition with special emphasis on microbial functionality (e.g. mutualistic root symbioses) is
also a major topic for research (for instance, Warnock et al., 2007; Rondon et al., 2007; Mia et
al., 2014). The use of PyOM can enhance plant associations with symbiotic microorganisms as
arbuscular mycorrhizal fungi (AMF) and nitrogen-fixing bacteria (rhizobia). However, the role
of PyOM on modifying root symbioses has received much less attention compared to PyOM
effects on SOC (Fig. 1.1).

Chapter 1
4
Most studies on PyOM effects are from short-term experiments, often conducted in greenhouses
or laboratories. Such studies provided insights into potential factors driving changes in SOC
and symbiotic relationships in PyOM-amended soils. However, there are still gaps in our
understanding regarding the duration and magnitude of effects over time under field conditions
and the possible mechanisms involved. This thesis aims to address these gaps.
1.2 Pyrogenic organic matter and soil organic carbon
A considerable proportion of the C contained in the total SOC pool in different soils (e.g. ADE,
chernozems) is present as PyOM (Atkinson et al., 2010). In such soils this PyOM has been
found to be older than other non-pyrogenic C forms protected in soil aggregates and organo-
mineral complexes (Pessenda et al., 2001). This may be not only a result of PyOM recalcitrance,
but also a result of interaction of this PyOM with other soil ecosystem properties. The role of
ecosystem properties has been proposed for native soil organic carbon of non-pyrogenic origin,
but such effects are not extended to PyOM (Schmidt et al., 2011).
Next to the high amounts of PyOM in ADEs, these soils also show higher quantities of non-
pyrogenic C forms compared to surrounding soils. Changes in the physicochemical and
biological properties of the soil environment control the decomposition rate and persistence of
SOC (Schmidt et al., 2011). However, little is known about the role of PyOM affecting soil
properties and its direct and indirect consequences for SOC stabilization. Pyrogenic organic
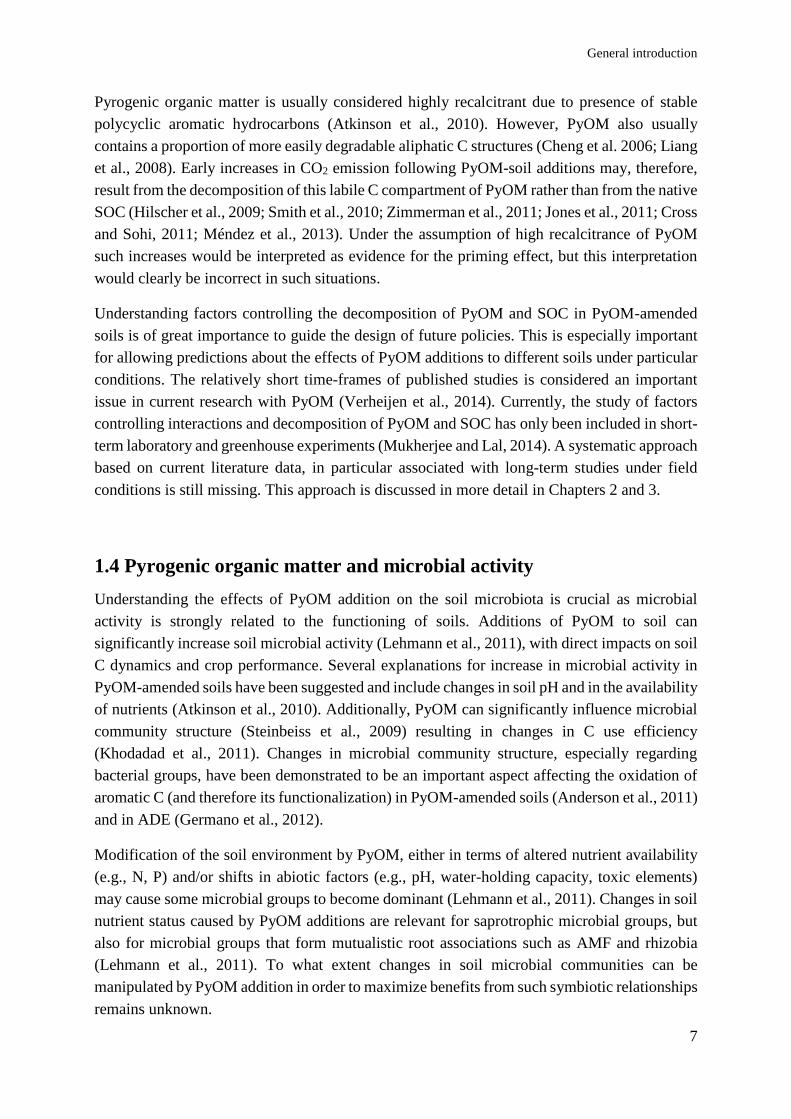
Figure 1.1. Number of publications in scientific journals (Web of ScienceTM) between 2005 and
2014. Blue bars represent total number of publications using only biochar as keyword. Green and
red bars represent number of publications using biochar + soil organic carbon (SOC) and biochar +
symbiosis as keywords, respectively. The cut-off date was 01 of August, 2014. Total annual number
of publications for 2014 (NP2014) was estimated using the following equation: NP2014= (NP / 7)
x 12, where NP is the number of publications in the initial seven months of the year.
0
100
200
300
400
500
600
2005 2006 2007 2008 2009 2010 2011 2012 2013 2014
Nu
mb
er o
f p
ub
lica
tio
ns
yea
r-1
Year
Biochar
Biochar + SOC
Biochar + symbiosis

General introduction
5
matter increases soil pH and can be a source of basic cations that can be retained in the soil by
increased CEC (Liang et al., 2006). Increases in cation exchange capacity (CEC) and soil pH
can lead to improved soil fertility and crop yield (Jeffery et al., 2011), which in turn contribute
to converting these soils into a significant C sink (Glaser et al., 2002).
1.3 Pyrogenic organic matter and interactions with native SOC
In spite of relatively high recalcitrance of PyOM (Lehmann, 2007), it has been proposed that
PyOM may modify the turnover rate of native SOC, either accelerating or decelerating its
decomposition. Such interactions are supposed to occur through a mechanism known as
priming. The original definition of priming refers to a greater loss of soil organic matter in a
soil receiving an organic amendment, than the loss of organic matter in an untreated soil
(Bingeman et al., 1953). However, currently a more narrow and restrictive definition is used
(Kuzyakov et al., 2000), where priming is considered as a short-term change in the turnover of
soil organic matter caused by small additions of more easily decomposable C to the soil
(Kuzyakov et al., 2000). Priming effects can be positive when there is an acceleration of SOC
decomposition, or negative when there is a deceleration of SOC decomposition (Fig. 1.2).
Glaser et al. (2000) estimated that C from PyOM consists of up to 35% of total SOC content in
ADE. The high proportions of C from PyOM associated with higher amounts of non-pyrogenic
C compared to surrounding soils suggest that PyOM may be responsible for the stability of non-
pyrogenic C in these soils (negative priming). On the other hand, PyOM can also accelerate
SOC decomposition (positive priming). This hypothesis was first supported by data from
Wardle et al. (2008), who observed that mass loss from mixtures of PyOM and forest humus
was significantly greater (24.6%) than mass loss predicted by an additive model without
interaction between both components (14.3%). Even though their data did not allow analysis of
the causes of this increase (they did not separate both C fluxes through isotopic methods), the
authors speculated that humus decomposition was stimulated by PyOM rather than the reverse
(enhanced degradation of PyOM). This is an important issue considering that the PyOM
decomposition rate can also be modified depending on soil and PyOM characteristics
(Steinbeiss et al., 2009). Apart from the potential decomposition of PyOM, the findings of
Wardle et al. (2008) raised the question as to whether PyOM addition to soils could accelerate
the loss of native SOC, thus reducing the C sequestration potential of PyOM (Cross and Sohi,
2011).

Chapter 1
6
It is worth mentioning that a variety of mechanisms, other than priming effects, can result in
non-additive interactive effects between PyOM and native SOC, thereby resulting in changes
in SOC and/or PyOM turnover rate. For instance, PyOM can adsorb toxic compounds that
would otherwise decrease microbial activity (Verheijen et al., 2010). The adsorption (and
inactivation) of compounds that are toxic for microbes can thus enhance microbial activity and
result in accelerated SOC decomposition. On the other hand, PyOM can also interact with SOC
through sorption of organic compounds onto PyOM surface and within pores, thereby
protecting SOC from degradation (Zimmerman et al., 2011).
The debate whether and how PyOM can affect turnover rates of native SOC and the direction,
duration and magnitude of such changes has not yet been resolved. One complicating issue for
disentangling priming from other non-additive interactions is the uncertainty regarding the
origin of the respired CO2 from PyOM-amended soils (whether from SOC or PyOM). This issue
can only be solved with the use of isotopes. Studies using stable isotopes have suggested
acceleration of SOC decomposition in PyOM-amended soils (Luo et al., 2011; Farrell et al.
2013), whereas others have shown deceleration of SOC decomposition (Hilscher et al., 2009;
Laird et al., 2010; Cross and Sohi, 2011; Jones et al., 2011; Keith et al. 2011). The mechanisms
behind PyOM and native SOC degradation in soil are still far from been resolved.
Figure 1.2. Conceptual scheme of priming - non-additive interactions between decomposition of
the added substrate and of soil organic matter (SOC): (a) acceleration of SOC decomposition -
positive priming effect; (b) retardation of SOC decomposition - negative priming effect. Adapted
from Kuzyakov et al. (2000).
CO2 produced
from soil
CO2 coming
from added
PyOM
CO2 coming
from added
PyOM
a
b
Soil without
PyOM
Soil + PyOM
Positive (a) priming
effect induced by
PyOM addition
Soil + PyOM
Negative (b) priming
effect induced by
PyOM addition
General introduction
7
Pyrogenic organic matter is usually considered highly recalcitrant due to presence of stable
polycyclic aromatic hydrocarbons (Atkinson et al., 2010). However, PyOM also usually
contains a proportion of more easily degradable aliphatic C structures (Cheng et al. 2006; Liang
et al., 2008). Early increases in CO2 emission following PyOM-soil additions may, therefore,
result from the decomposition of this labile C compartment of PyOM rather than from the native
SOC (Hilscher et al., 2009; Smith et al., 2010; Zimmerman et al., 2011; Jones et al., 2011; Cross
and Sohi, 2011; Méndez et al., 2013). Under the assumption of high recalcitrance of PyOM
such increases would be interpreted as evidence for the priming effect, but this interpretation
would clearly be incorrect in such situations.
Understanding factors controlling the decomposition of PyOM and SOC in PyOM-amended
soils is of great importance to guide the design of future policies. This is especially important
for allowing predictions about the effects of PyOM additions to different soils under particular
conditions. The relatively short time-frames of published studies is considered an important
issue in current research with PyOM (Verheijen et al., 2014). Currently, the study of factors
controlling interactions and decomposition of PyOM and SOC has only been included in short-
term laboratory and greenhouse experiments (Mukherjee and Lal, 2014). A systematic approach
based on current literature data, in particular associated with long-term studies under field
conditions is still missing. This approach is discussed in more detail in Chapters 2 and 3.
1.4 Pyrogenic organic matter and microbial activity
Understanding the effects of PyOM addition on the soil microbiota is crucial as microbial
activity is strongly related to the functioning of soils. Additions of PyOM to soil can
significantly increase soil microbial activity (Lehmann et al., 2011), with direct impacts on soil
C dynamics and crop performance. Several explanations for increase in microbial activity in
PyOM-amended soils have been suggested and include changes in soil pH and in the availability
of nutrients (Atkinson et al., 2010). Additionally, PyOM can significantly influence microbial
community structure (Steinbeiss et al., 2009) resulting in changes in C use efficiency
(Khodadad et al., 2011). Changes in microbial community structure, especially regarding
bacterial groups, have been demonstrated to be an important aspect affecting the oxidation of
aromatic C (and therefore its functionalization) in PyOM-amended soils (Anderson et al., 2011)
and in ADE (Germano et al., 2012).
Modification of the soil environment by PyOM, either in terms of altered nutrient availability
(e.g., N, P) and/or shifts in abiotic factors (e.g., pH, water-holding capacity, toxic elements)
may cause some microbial groups to become dominant (Lehmann et al., 2011). Changes in soil
nutrient status caused by PyOM additions are relevant for saprotrophic microbial groups, but
also for microbial groups that form mutualistic root associations such as AMF and rhizobia
(Lehmann et al., 2011). To what extent changes in soil microbial communities can be
manipulated by PyOM addition in order to maximize benefits from such symbiotic relationships
remains unknown.

Chapter 1
8
Mycorrhizal activity
Soil additions of PyOM may increase soil P availability. Increases can occur either through the
direct addition of soluble phosphate salts and exchangeable phosphorus in PyOM (DeLuca et
al., 2009) or as a consequence of increased soil pH and therefore P solubility, or the stimulation
of phosphatase production by plants and microorganisms (Steiner et al., 2008). Such effects
allow plants to acquire P from less soluble (organic) forms in the soil (Richardson et al., 2009).
Another explanation for increased plant P uptake in PyOM-amended soils (even without
changes in P availability) is through stimulation of arbuscular mycorrhizal fungal (AMF)
associations (Nishio and Okano, 1991; Ohsowski et al., 2012). Soil amendments with PyOM
can have positive impact on AMF (Rillig et al., 2010; Ohsowski et al., 2012; Salem et al., 2013),
although negative effects have also been reported (Warnock et al., 2010 and George et al.,
2012).
The causes for changes in mycorrhizal activity after PyOM applications are not completely
understood and several mechanisms have been proposed (Warnock et al., 2007). One of these
mechanisms refers to changes in soil nutrient availability (e.g. P and N) and in soil pH following
PyOM additions. Besides, PyOM alkalinisation effects on soil promote root health and
beneficial microbes (e.g. mycorrhiza helper bacteria) which in turn increase AMF root
colonization (Elmer and Pignatello, 2011). These mycorrhiza-associated organisms are known
to influence each other mutually and are capable of secreting metabolites that facilitate the
colonization of plant roots (Warnock et al., 2007). Pyrogenic organic matter has also been
reported to interfere in the signalling dynamics between plants and AMF and in the
detoxification of allelochemicals in the soil rhizosphere (Warnock et al., 2007). These effects
are particularly relevant because the establishment of the AMF in plant roots is the result of a
complex exchange of signals between the host plant and AMF (Vierheilig et al., 2008). Another
mechanism mentioned by Warnock et al. (2007) that potentially affects AMF-plant associations
in PyOM-amended soils is the physical protection of AMF from fungal grazers provided by
porous structure of PyOM (Saito, 1989; Ezawa et al., 2002; Yamato et al., 2006; Hammer et
al., 2014). This may allow PyOM-amended soils to support a larger AMF biomass than
comparable non PyOM-amended soils.
Despite evidence of PyOM affecting colonization of plant roots by AMF, a clear understanding
of the mechanisms through which PyOM controls such associations still represents a challenge
for research. Understanding the potential factors either associated with PyOM properties, or the
properties acquired by soils when amended with PyOM, which affects the abundance of
mycorrhizal fungi and the effectiveness of the mycorrhizal symbiosis could be useful for
designing strategies to increase the benefits in terms of plant production from such associations.
Currently, studies have reported both positive and negative effects of PyOM on AMF-plant
associations but most studies spanned short growing periods. Therefore, there is a need for
investigation over multiple successive cropping cycles. Such an approach will provide a better
understanding of modifications induced by addition of PyOM that lead to changes in AMF
activity and plant performance. In Chapter 4 I address the effects of soil amendments with

General introduction
9
PyOM on plant-AMF associations, on phosphatase activity and on P speciation over four
soybean cropping cycles under field conditions in Brazil.
Biological nitrogen fixation (BNF)
Additions of PyOM can improve N bioavailability in agricultural soils (Nelissen et al., 2012;
Zheng et al., 2013). PyOM can also stimulate biological nitrogen fixation (BNF) (Rondon et
al., 2007). The potential of soil amendment with pyrolized materials for improving nodulation
by rhizobia was early reported in literature (Turner, 1955). However, the quantification of this
potentially beneficial effect was limited by the lack of appropriate tools (e.g. isotopic analyses).
Increases in N2 fixation by bean (Phaseolus vulgaris L.) grown in PyOM-amended soils were
demonstrated by the isotope dilution method (Rondon et al., 2007). These authors reported that
the positive effects of PyOM, including increased N2 fixation, led to increases in bean yield,
compared to the control. These results are supported by Anderson et al. (2011), who found
increased abundance of DNA from the family Bradyrhizobiaceae in soil amended with PyOM.
More recently, Mia et al. (2014) found increased BNF and higher total biomass production of
red clover at moderate PyOM applications rates (10 Mg ha-1), compared to the control without
PyOM and higher applications rates (120 Mg ha-1). These latter authors proposed that
availability of potassium (K) provided by PyOM may have been responsible for increased BNF.
Although mechanistic explanations for changes in BNF in PyOM-amended soils have been
proposed (Lehmann and Rondon, 2006; Atkinson et al., 2010), these suggestions are mostly
speculative as they are not (yet) backed up by experimental data. There is a need for additional
experiments to further elucidate the mechanisms involved in BNF changes in PyOM-amended
soils. For instance, possible effects of PyOM on P availability and consequently, on BNF have
not been considered. Biological N fixation has a high P requirement since P is an important
element in nodule metabolism (Vance, 2001). Phosphorus has shown to be important for initiate
nodule formation, to increase the number of nodule primordia and is essential for the
development and function of formed nodules (Waluyo et al., 2004). However, how BNF is
affected by P fertilization in PyOM-amended soils is still unknown.
1.5 Objectives
Given the research gaps mentioned above, the main objective of this thesis is to provide a better
understanding about the possible interactions between PyOM and SOC and the factors
controlling symbiotic relationships in tropical soil amended with PyOM. The specific
objectives are:

Chapter 1
10
1. To quantitatively integrate and analyse studies on the effects of soil amendments with PyOM
on CO2 emissions and identify the potential factors affecting these emissions (Chapter 2).
2. To quantify changes in the PyOM and SOC stocks and decomposition rates over several
soybean cropping cycles under field conditions, in a tropical soil amended with PyOM (Chapter
3).
3. To explore the effects of PyOM on root colonization by AMF and on soybean performance
over several cropping cycles and disentangle the most important mechanisms controlling such
effects (Chapter 4).
4. To test the effects of PyOM on BNF over several soybean cropping cycles under tropical
field conditions (Chapter 5).
1.6 Experimental approach
To address the above-mentioned research objectives I used a combination of meta-analytic data,
field experiments and a pot experiment in greenhouse.
Meta-analysis
Studies investigating the influence of PyOM on CO2 emissions often report variable results.
These studies include efforts to provide mechanistic explanations for changes in CO2 emissions
from PyOM-amended soils. However, results from individual studies are derived from specific
conditions and from a limited number of soils and PyOM types. By quantitatively combining
results from many studies, we can identify patterns and draw robust conclusions regarding the
nature of changes in CO2 emission for a wide range of PyOM and soil types outside of the
experimental conditions used.
Meta-analysis is a powerful technique that enables the quantitative combination of results from
the whole body of studies available. I considered categories of controlling factors associated to
soil and PyOM properties and experimental conditions affecting CO2 emission rates. Such an
approach allowed a better understanding of the factors involved in changes in CO2 emission
from PyOM-amended soils (Objective 1).
Field experiment
Two major characteristics of most experiments using PyOM, either studying CO2 emissions or
symbiotic relationships, are their duration (usually short-term) and the conditions under which
the experiment was carried out (usually in the laboratory or greenhouse). Consequently, these
studies often also use unrealistically high amounts of PyOM compared to amounts of SOC –
both in order to increase the probability of significant effects in the short time and because
PyOM availability is not a limiting factor at such a small scale. A disadvantage of such studies
is that they may not reproduce realistic field conditions and therefore results of such studies

General introduction
11
cannot be extrapolated or scaled up with confidence. Although such experiments are relevant
for understanding mechanisms involved, they may overestimate some effects of PyOM, and not
consider important changes that may occur over longer periods of time.
In my field study I evaluated the effects of different rates of PyOM and P fertilization on the
stocks and decomposition rates of PyOM and native SOC (Objective 2) over four cropping
cycles of soybean, which is a major grain crop in Brazil. I also collected data associated with
symbiotic associations between soybean plants with AMF (Objective 3) and BNF by N-fixing
bacteria (Objective 4). These experiments were conducted for a period of 17 months (Fig. 1.3A,
1.3B and 1.3C).
Auxiliary experiments
A pot experiment under greenhouse conditions was designed using a similar structure to the
field experiment (PyOM rates and P treatments), utilizing soil collected from the field
treatments. From this experiment additional data regarding symbiotic associations were
collected and used in the General Discussion.
An additional litterbag experiment was performed under field conditions in order to test
possible differential interactions of fresh and aged PyOM with non-pyrogenic organic matter.
This experiment was an attempt to evaluate long-term dynamics of PyOM decomposition in a
two-year experiment.
1.7 Outline of the thesis
This thesis consists of six chapters, including this General Introduction (Chapter 1). The
previously mentioned four objectives correspond to Chapters 2 to 5, which are described below.
Chapter 2 addresses the first objective, focusing on the role of soil amendments with PyOM on
changes in CO2 emission from soil and the potential causes of such changes. Based on a meta-
analysis , I summarize the effect of PyOM on CO2 emission across 46 individual studies (276
data points) and identify the most likely causes involved. I also provide insights about the
usefulness of the results for predicting CO2 emissions in PyOM-amended soils.
Chapter 3 deals with the second objective and extends the findings of Chapter 2 by confirming
the low ability of PyOM to prime decomposition of native soil organic matter under field
conditions. It further explores the potential recalcitrance/lability of PyOM, which has been
addressed only in laboratory studies to date. For this purpose, I use soil samples from a 17-
month-old field experiment in which PyOM was applied at different rates and discriminate the
origin of the remaining C (whether from PyOM or native SOC) by 13C stable isotope analysis.

Chapter 1
12
In Chapter 4, I address Objective 3 by investigating the direct and indirect effects of PyOM on
root colonization by AMF and on soybean grain yield. Data from a field experiment conducted
over four cropping cycles were analysed through path analysis. The AMF behaviour over time
allowed evaluation of the likely mechanisms responsible for changes in mycorrhizal activity in
PyOM-amended soils.
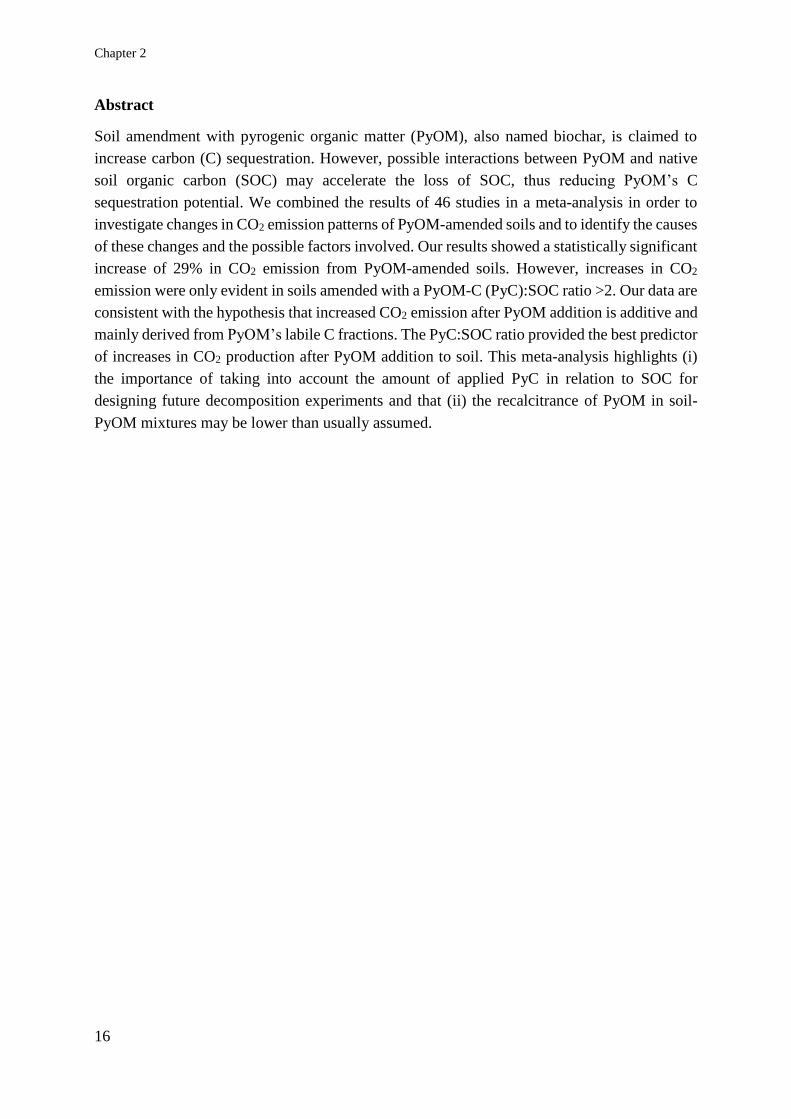
A B
C
Figure 1.3. Field experiment in Parnaiba, Brazil, showing (A) PyOM application, (B) soil layer
mixed with PyOM, and (C) general view of the experiment.

General introduction
13
Chapter 5 addresses Objective 4, by testing the potential effects of soil amendment with PyOM
on BNF. I use data from the same field experiment conducted over four cropping cycles, and
assess BNF through 15N stable isotope analysis. Changes in the BNF pattern over time allowed
reflecting on potential mechanisms controlling this symbiosis in PyOM-amended soils and its
relevance over time.
This thesis concludes with a General Discussion in Chapter 6. In this final chapter I summarize
the main findings in my thesis through an integrated approach, and reflect on their relevance to
current knowledge and future research. I also place my findings in a societal relevance context.


Chapter 2
Emission of CO2 from biochar-amended soils and implications for soil
organic carbon
Edvaldo Sagrilo, Simon Jeffery, Ellis Hoffland, Thomas W. Kuyper
Accepted for publication with modifications in Global Change Biology & Bioenergy
Chapter 2
16
Abstract
Soil amendment with pyrogenic organic matter (PyOM), also named biochar, is claimed to
increase carbon (C) sequestration. However, possible interactions between PyOM and native
soil organic carbon (SOC) may accelerate the loss of SOC, thus reducing PyOM’s C
sequestration potential. We combined the results of 46 studies in a meta-analysis in order to
investigate changes in CO2 emission patterns of PyOM-amended soils and to identify the causes
of these changes and the possible factors involved. Our results showed a statistically significant
increase of 29% in CO2 emission from PyOM-amended soils. However, increases in CO2
emission were only evident in soils amended with a PyOM-C (PyC):SOC ratio >2. Our data are
consistent with the hypothesis that increased CO2 emission after PyOM addition is additive and
mainly derived from PyOM’s labile C fractions. The PyC:SOC ratio provided the best predictor
of increases in CO2 production after PyOM addition to soil. This meta-analysis highlights (i)
the importance of taking into account the amount of applied PyC in relation to SOC for
designing future decomposition experiments and that (ii) the recalcitrance of PyOM in soil-
PyOM mixtures may be lower than usually assumed.

Biochar effects on CO2 emissions: a meta-analysis
17
2.1 Introduction
Soil organic carbon (SOC) plays vital roles in important soil ecosystem services such as soil
fertility, carbon (C) sequestration and mitigation of greenhouse gas emission (Paustian et al.,
1997). Application of pyrogenic organic matter (PyOM; also named biochar) to agricultural
soils has the potential to sequester C in the long-term because PyOM is assumed to be highly
recalcitrant in soil (Lehmann, 2007). Pyrogenic organic matter is composed of a range of
different forms of C, with predominance of fused aromatic ring structures (Novotny et al.,
2009). When formed under natural conditions, such as in forest fires, this material is known as
“black carbon” (BC). Black carbon has been found to be the oldest fraction of C in soils, even
compared to the most protected C in soil aggregates and organo-mineral complexes (Pessenda
et al., 2001); it can persist in the soil for millennia (Kuzyakov et al., 2009). The production of
PyOM and its application to soil is, therefore, a potential strategy to sequester C in soils
(Lehmann, 2007).
Although PyOM is considered to be highly recalcitrant, it is not completely biologically inert
(Jones et al., 2012; Farrell et al., 2013). Application of PyOM to soil can increase CO2 emission
as PyOM contains a proportion of relatively labile aliphatic C structures (Cheng et al., 2006;
Liang et al., 2008). Such increases may be additive if the fluxes from SOC and PyOM behave
independently. However, it has been proposed that PyOM can also non-additively affect CO2
emission through changes in native SOC turnover, either accelerating its decomposition (Farrell
et al., 2013) or decelerating it (Keith et al., 2011). These non-additive interactions are
summarized under the term “priming effect” (PE). Positive priming is defined as strong short-
term changes in the turnover of soil organic matter caused by comparatively moderate
treatments of the soil (Kuzyakov et al., 2000).
Wardle et al. (2008) suggested that PyOM can accelerate decomposition of non-pyrogenic
carbon as they found greater CO2 production from mixtures of PyOM and forest humus than
predicted from the sum of these components considered separately. However, the origin of the
(additionally) respired CO2 (i.e. whether from SOC or PyOM) was not identified. In a recent
meta-analysis investigating priming effects of PyOM addition, Maestrini et al. (2014) showed
that labile C fractions of applied PyOM induce a short-term positive priming effect on native
SOC, especially when PyOM with low C content is used. They also showed that priming can
become negative over time (after 200 days), possibly as a result of sorption of dissolved organic
carbon on PyOM surface.
Irrespective of the mechanisms involved, these results suggest that PyOM addition to soil could
undermine its C sequestration potential (Cross and Sohi, 2011). Several studies have
investigated this topic using isotope analysis. Findings suggested acceleration of SOC
decomposition (Luo et al., 2011; Farrell et al., 2013), deceleration (Keith et al., 2011; Knicker
et al., 2013), both effects (Zimmerman et al., 2011; Bamminger et al., 2013) or no effects on
SOC decomposition (Jones et al., 2012; Santos et al., 2012; Díaz-Rojas et al., 2014), without
indicating the probable cause(s) of this variation in effects (Maestrini et al., 2014).

Chapter 2
18
When soils are amended with PyOM, changes in CO2 emission rates can occur as a consequence
of several factors, either associated with environmental conditions such as temperature
(Hilscher and Knicker, 2011) or soil (type or disturbance intensity), or with PyOM (type,
application rate) (Singh et al., 2010). Pyrolysis process parameters (e.g. pyrolysis temperature,
residence time) also play a role (Bamminger et al., 2013; Farrell et al., 2013) as they affect the
characteristics of the resulting PyOM, including the amount of labile C remaining after
production. While there are now a number of studies in the primary literature reporting changes
in CO2 emission following PyOM application to soil, individual studies necessarily utilise a
limited number of soils and PyOM types. As such, they do not allow the drawing of robust
conclusions regarding the nature of changes in CO2 emission for the wide range of PyOM and
soil types outside of the experimental conditions used. Therefore, a joint analysis, utilising the
entire body of studies currently available, is required in order to better formulate hypotheses
regarding the observed effects.
Meta-analysis is a powerful technique that provides a quantitative statistical means of
integrating the results of independent studies, allowing for general conclusions to be drawn
(Gurevitch and Hedges, 2001; Borenstein et al., 2009). Currently, a few meta-analyses on
PyOM research have been published in the fields of crop yield (Jeffery et al., 2011; Liu et al.,
2013; Biederman and Harpole, 2013 – but see Jeffery et al., 2014), N2O emission (Cayuela et
al., 2013) and priming (Maestrini et al., 2014), with relevant contributions for enhancing our
understanding of PyOM effects on soil processes and functions.
Here we build and expand on work reported by Maestrini et al. (2014) and integrate results
from 46 independent studies, including those which did not use stable isotopes, in order to gain
a better understanding of the effects of soil amendments with PyOM on CO2 emissions. Such
analysis will allow the identification of factors associated with soil, PyOM properties and
experimental conditions that can affect CO2 emission from PyOM-amended soils. These data
are vital to allow the effective guidance of policy, for example, to determine whether PyOM is
to be eligible for future C-trading schemes (Lehmann et al., 2006).
2.2 Material and Methods
Data sources and compilation
We performed a systematic literature search of peer-reviewed publications on the effects of
PyOM addition to soils on soil CO2 fluxes using Scopus, Web of Science and Science Direct
databases. Different combinations of keywords were used (“biochar” OR “PyOM” OR
“charcoal” OR “black carbon” AND “priming” OR “CO2”), selecting also “Abstract, Title,
Keywords” for search field with data range “2000 to present”. The cut-off date was 23rd April
2014.
Studies performed under laboratory, greenhouse and field conditions were included.
Experiments were grouped according to the provenance of the soils used, whether from (sub-)

Biochar effects on CO2 emissions: a meta-analysis
19
tropical or temperate regions. Data are reported as rates of CO2 emission on the basis of soil
mass or area. If CO2 emission had been measured several times in the same study, only the last
sampling date was used. Our approach intended to avoid introducing bias into the analysis
because some studies included considerably more data points than others. Cumulative CO2
emissions were far more commonly reported in studies than daily fluxes. Therefore, cumulative
values were preferred over daily or individual measurements when both types were available.
In both cases, only studies that reported CO2 emission from bulk soil samples after a clearly
defined experimental period were included.
A minimum of three replicates per treatment was required for the study to be included in the
meta-analysis. When PyOM was produced from the same feedstock and pyrolysis type, but
under a range of temperatures, data from the highest and lowest temperatures were recorded.
This reduced the potential bias of introducing many non-independent data points from a single
study. When pyrolysis temperature was given as a range (e.g. 400–500°C), the highest value
was chosen (i.e. 500°C). Only studies that used PyOM in combination with soil were included
in the meta-analysis; we excluded studies where washed sand or humus was used instead of
soil. Studies of CO2 emission from anthropogenic Amazonian Dark Earths (ADE) were also
excluded as information is not available on the original amounts of PyOM applied to or present
in the soil, its age, production conditions, nor the environmental factors to which PyOM has
been subjected (Pereira et al., 2014).
We collected data comparing CO2 emission between a control and a PyOM treatment. One
major assumption of meta-analysis is that studies and data points are independent (Gurevitch
and Hedges, 2001; Borenstein et al., 2009). When particular publications reported data from
more than one study system (e.g. different PyOM feedstock, pyrolysis type, pH and
experimental type; lab or field), those systems were considered independent and were treated
as such. The control was chosen to be identical to the treatment for all variables but without the
addition of PyOM. For each observation within every study we collected the means of the
control treatment (soil without PyOM) and the experimental treatment (PyOM-amended soil),
as well as their standard deviation (SD) and replicate numbers (n). We acknowledge that in
some instances this procedure means that more than one experimental treatment may be
compared to the same control. In these instances, this approach artificially increases the number
of replicates that the statistic is based on and as such may bias the results towards over-
confidence (i.e. confidence intervals may be too narrow). However, utilising the more
conservative approach of using only a single average measurement for all potentially dependent
measures (e.g. Borenstein et al., 2009) sacrifices too much information, as discussed in Guo
and Gifford (2002).
For studies that did not report SD or a measure of variance that could be used to calculate SD,
such as standard error (SE), efforts were made to obtain these from the corresponding authors.
In some cases this was successful (see Acknowledgements). If not, those studies were excluded
from the analysis. When data were only provided in graphs, Plot Digitizer 2.6.2 was used to

Chapter 2
20
extract data points. Unidentified error bars were present in two studies and were conservatively
assumed to denote SE rather than SD.
The search resulted in 45 papers that were suitable for being included in the meta-analysis. The
database covered 276 side by side comparisons, from 45 studies published from 2009 to 2013.
To reduce the potential effects of publication bias, efforts were also made to search the grey
literature for data. This lead to one additional unpublished study (Rittl et al. in preparation)
being included as it satisfied all the criteria of data quality and amount of information provided.
Therefore, in total, 46 studies were used (see appendix in Supporting Information).
Data grouping and treatment
Besides the data on measured response variables, details of experimental conditions also needed
to be specified as categories for inclusion in the analysis. Studies were categorized by soil
properties and environmental conditions (C content, pH, C:N ratio, fertilization background,
texture and provenance), PyOM properties (C content, C:N ratio, pH, ash content, surface area,
volatile matter, pyrolysis type and residence time, pyrolysis temperature, and feedstock) and
experimental conditions (duration, temperature of incubation, moisture content, and type). The
proportion of applied PyOM-C (PyC) in relation to original SOC content (PyC:SOC ratio) was
also calculated and included. Because initial analyses demonstrated a highly significant
difference between studies with higher and lower PyC:SOC ratios (i.e. >2 and <2, respectively),
the data were split into two sub-groups for ratios >2 and <2 within each category in order to
assess the impact of this factor on other potentially relevant factors (categories).
Data from the different categories were subjected to a standardization process to allow for
comparisons. For instance, soil or PyOM pH values measured with CaCl2 were found in six
studies and were made comparable with pH measured with distilled water using the formula
pH(H2O) = 1.65 + 0.86 * pH(CaCl2) (Augusto et al., 2008). When no information on pH
measurement method was provided, data were assumed to denote pH measured in distilled
water. Data reported on a continuous scale (such as pH) were placed into categories which
covered a range of scales, such as 1 pH unit (i.e. pH 6-7), resulting in an adequate number of
data points in each sub-group. When soil texture was not explicitly provided by the authors it
was defined based on soil contents of sand, clay and silt, according to FAO/UNESCO (2003).
Statistics
A quantitative index of the effect size in each comparison was calculated as the natural log of
the response ratio by using the following formula (Rosenberg et al., 2000):
𝑙𝑛 𝑅𝑅 = 𝑙𝑛 (𝑋𝐸
𝑋𝐶)

Biochar effects on CO2 emissions: a meta-analysis
21
where RR= response ratio, XE = mean of experimental group and XC = mean of control group.
The effect size of each grouping was calculated using a categorical random effects model,
where the effect size was weighted in inverse proportion to its variance (Adams et al., 1997).
Publication bias (Rothstein et al., 2005) is unlikely in our meta-analysis. Not only increases and
decreases, but also lack of significant effects in CO2 emission in PyOM-amended soils is
equally publishable. Nevertheless, we tested the effects of publication bias using the Fail-safe
N technique (Orwin, 1983; Rosenthal and Rosnow, 1991). This technique involved computing
the combined P value for all of the studies included, and calculating the number of additional
studies showing no effect (i.e. average Z value of 0) that would be needed in order to change
the P value from significant to non-significant at P= 0.05.
The mean of a response variable was considered significant if the lower limit of the 95% CI
was >1 or the upper limit of the 95% CI <1. The latter case can be considered evidence for
negative priming; however, significantly positive values could be the result of additive effects
and/or priming. The means of different subcategories were tested for significant differences
based on the model heterogeneity test (Q -test), which is tested against a χ2 distribution with 1
degree of freedom (d.f.) (Rosenberg et al., 2000). Calculations were performed using Metawin
Version 2 Statistical software (Rosenberg et al., 2000) and in Microsoft Excel worksheets. The
response ratio (RR) and CI of treatments presented in Tables and Figures were back-
transformed from lnRR.
2.3 Results
Main effect
On average, CO2 emission increased significantly by 29% (RR = 1.29; CI = 1.15-1.43)
following the addition of PyOM to soil. Rosenthal’s Fail safe N was 1739, indicating that the
statistical significance of the reported increase of CO2 emission after PyOM addition is unlikely
due to publication bias. Studies with high PyOM additions relative to SOC (PyC:SOC ratio >2)
had a significantly higher CO2 flux than studies with a PyC:SOC ratio <2 (RR = 1.99 and 1.03
respectively; P <0.01; Fail safe N= 1591 for the relatively high application; Fig. 2.1). For the
relatively low application the effect on CO2 emission was not significant. For this reason we
analysed all further factors for both categories separately.
Influence of soil characteristics
There were significant differences in CO2 emission (P<0.05) between sub-groups of different
soil-associated categories for PyC:SOC ratios >2, for soil fertilization background and soil
provenance (Table 2.1). For PyC:SOC ratios <2, there were significant differences between
sub-groups for soil C content and soil texture.

Chapter 2
22
Soils with C content <30 g kg-1 showed a significantly increased CO2 emission (Tab. 2.1) at
both PyC:SOC ratios. Soils with C content >30.0 g kg-1 were not affected by PyOM additions
in terms of CO2 emissions, regardless of the PyC:SOC ratios. Soils with C:N ratios <10.0
showed increased CO2 emission only at PyC:SOC ratios >2. Soils with C:N ratio >10.0 had
emissions of CO2 significantly increased independently of the PyC:SOC ratios. Additions of
PyOM to soils with pH values >6.0 resulted in increased CO2 emission only when PyC:SOC
ratio was >2. Additions of PyOM to soils with pH values <6.0 resulted in significant increases
in CO2 emission regardless of the PyC:SOC ratio. Soils with a history of N fertilization and
those without any fertilizer input increased CO2 emission only at PyC:SOC ratios >2.
Contrarily, the CO2 emission from soils with a history of NPK fertilization was unaffected by
PyOM addition.
Emission of CO2 increased in medium-textured soils after addition of PyOM, regardless of the
PyC:SOC ratio. Coarse-textured soils increased CO2 emissions only at high PyC:SOC ratios
(>2) and fine-textured soils only when PyC:SOC ratio was <2. Soils originating from temperate
regions increased their CO2 emission following PyOM addition only at PyC:SOC ratios >2.
However, experiments using soils from (sub-)tropical regions did not show significant effects
in terms of CO2 emission irrespective of the PyC:SOC ratio.
Figure 2.1. Influence of different PyC:SOC ratios on CO2 emission from PyOM-amended soils. Symbols
show response ratio (RR) and bars show 95% confidence intervals. The numbers shown in parentheses
correspond to the number of observations upon which the statistical analysis is based.
0 1 2 3 4 5
Response ratio
PyC:SOC ratios
>2 (n= 89)
Grand mean (n= 256)
<2 (n= 167)

Biochar effects on CO2 emissions: a meta-analysis
23
Influence of PyOM characteristics
For sub-groups of PyOM-associated characteristics, there were significant (P<0.05) differences
in CO2 emission at PyC:SOC ratios >2, for PyOM surface area, PyOM volatile matter, pyrolysis
residence time and PyOM feedstock (Tab. 2.2). At PyC:SOC ratios <2 there were significant
differences in CO2 emission among sub-groups of different categories for PyOM C content,
PyOM C:N ratio and PyOM pH.
We observed a significant increase in CO2 emission at both PyC:SOC ratios when PyOM with
C content varying from 50.1-80.0 % was used. However, the response ratio was significantly
larger (P<0.01) at PyC:SOC ratios >2 (RR= 1.88) than <2 (RR= 1.18). When PyOM with C
content <50.0 % and >80.0% was applied to the soil, only PyC:SOC ratios >2 resulted in
Table 2.1. Meta-analysis of the effects of PyC:SOC ratios on CO2 emission, within soil-associated
characteristics. PyC:SOC ratios are divided as >2 and <2.
Categories
PyC:SOC
ratio
RR
95% CI
n
P*
P**
Soil C content (g kg-1)
<10.0 >2 2.55 1.56-4.32 23 <0.01 0.22
<2 1.19 1.04-1.33 26 <0.01
10.1-30.0 >2 1.93 1.46-2.63 61 <0.01
<2 1.13 1.02-1.27 79
>30.0 >2 1.05 0.13-3.20 3 0.63
<2 0.89 0.72-1.09 62
Soil C:N ratio
<10.0 >2 2.85 1.73-5.31 22 <0.01 0.85
<2 1.21 0.97-1.51 22 0.07
>10.0 >2 1.38 1.03-1.93 6 0.14
<2 1.16 1.06-1.27 74
Soil pH
>6.0 >2 2.64 1.80-3.80 46 <0.01 0.12
<2 0.99 0.85-1.14 106 0.06
<6.0 >2 1.48 1.03-2.17 35 0.22
<2 1.15 1.03-1.26 49
Fertilization background
N >2 12.01 6.70-20.87 8 <0.01 <0.01
<2 1.04 0.88-1.24 12 0.87
None >2 1.92 1.40-2.64 65 <0.01
<2 1.00 0.86-1.17 100
NPK >2 1.07 0.85-1.37 14 0.36
<2 0.97 0.88-1.06 32
Soil texture
Medium >2 3.01 1.96-4.80 32 <0.01 0.11
<2 1.17 1.01-1.38 42 <0.01
Coarse >2 3.02 1.70-5.32 24 <0.01
<2 0.85 0.65-1.09 53
Fine >2 1.20 0.78-2.20 5 0.46
<2 1.33 1.19-1.49 25
Soil provenance
Temperate >2 2.16 1.63-2.87 79 <0.01 0.03
<2 1.06 0.94-1.19 125 0.41
(Sub-)tropical >2 1.04 0.80-1.59 10 0.72
<2 0.98 0.89-1.08 40
RR= response ratio; CI= 95% confidence interval for RR; n= number of observations within each category; P*=
probability of the model heterogeneity test between the two relative application ratios (PyC:SOC ratio >2 and <2
respectively) within the various groupings; P**= probability of the model heterogeneity test between the various
groupings within the categories of relative application ratios.

Chapter 2
24
increased CO2 emission. Similarly, only PyC:SOC ratios >2 resulted in increased CO2 emission
both at PyOM C:N ratios <50 and >50 (RR= 2.40 and 2.54, respectively). Pyrogenic organic
matter with pH values <8.0 resulted in increased CO2 emission from the soil independently of
PyC:SOC ratios. When PyOM with pH values >8.0 were used, only PyC:SOC ratios >2
significantly increased CO2 emission.
Table 2.2. Meta-analysis of the effects of PyC:SOC ratios on CO2 emission, within PyOM-associated
characteristics. PyC:SOC ratios are divided as >2 and <2.
Categories
PyC:SOC
ratio
RR
95% CI
n
P*
P**
PyOM C content (%)
50.1-80.0 >2 1.88 1.42-2.54 64 <0.01 0.70
<2 1.18 1.03-1.34 98 <0.01
>80.0 >2 2.27 1.16-4.56 19 0.04
<2 0.98 0.85-1.13 28
<50.0 >2 2.92 1.34-5.00 6 <0.01
<2 0.77 0.62-0.96 37
PyOM C:N ratio
>50.0 >2 2.40 1.68-3.40 48 <0.01 0.87
<2 1.04 0.88-1.26 62 <0.01
<50.0 >2 2.54 1.51-4.31 21 <0.01
<2 1.00 0.85-1.16 68
PyOM pH
<8.0 >2 3.23 1.45-7.50 10 <0.01 0.56
<2 1.36 1.20-1.58 44 <0.01
>8.0 >2 1.67 1.15-2.57 24 0.14
<2 1.02 0.95-1.11 60
PyOM ash content (%)
<10.0 >2 1.98 1.22-3.37 28 <0.01 0.74
<2 1.00 0.85-1.15 45 0.57
>10.0 >2 1.79 1.19-2.70 31 <0.01
<2 0.94 0.77-1.15 67
PyOM surface area (m2 g-1)
<50.0 >2 4.01 2.60-6.68 26 <0.01 <0.01
<2 0.82 0.63-1.09 47 0.11
>50.0 >2 1.15 0.79-1.59 29 0.26
<2 1.01 0.88-1.14 32
PyOM volatile matter (%)
<10.0 >2 3.89 1.84-8.98 9 0.11 0.01
<2 1.19 1.04-1.28 3 0.58
>10.0 >2 1.31 0.92-1.81 24 0.06
<2 1.05 0.93-1.20 32
Pyrolysis residence time (h)
<0.5 >2 12.01 6.87-20.85 8 <0.01 <0.01
<2 1.08 0.96-1.23 24 0.61
>0.5 >2 1.09 0.84-1.42 34 0.62
<2 1.04 0.95-1.13 68
PyOM feedstock
Lignocellulosic waste >2 3.29 1.25-8.98 10 0.01 <0.01
<2 0.93 0.74-1.12 17 0.61
Herbaceous >2 2.97 1.73-5.07 27 <0.01
<2 1.07 0.90-1.30 59
Wood >2 1.52 1.18-2.05 52 <0.01
<2 1.05 0.90-1.23 62
RR= response ratio; CI= 95% confidence interval for RR; n= number of observations within each category; P*=
probability of the model heterogeneity test between the two relative application ratios (PyC:SOC ratio >2 and <2
respectively) within the various groupings; P**= probability of the model heterogeneity test between the various
groupings within the categories of relative application ratios.

Biochar effects on CO2 emissions: a meta-analysis
25
Only PyC:SOC ratios >2 resulted in significant increases of CO2 emission either using PyOM
with ash contents <10.0 and >10.0 % (RR= 1.98 and 1.79, respectively). When PyOM with
surface area <50.0 m2 g-1 was applied to the soil, there was increased CO2 emission at PyC:SOC
ratios >2. However, when PyOM with surface area >50.0 were used there were no changes in
CO2 emission at both PyC:SOC ratios. Additions of PyOM with volatile matter contents
<10.0% resulted in increased CO2 emission independently of the PyC:SOC ratios. Pyrogenic
organic matter with volatile matter contents >10.0% did not significantly affect CO2.
Emissions of CO2 from soils amended with pyrogenic organic matter produced under pyrolysis
residence times <0.5 hours were significantly increased at PyC:SOC ratios >2 (RR= 12.01), but
not at PyC:SOC ratios <2. No significant increases in CO2 emission were observed when PyOM
produced under pyrolysis residence times >0.5 hours was applied. At PyC:SOC ratios >2 there
was a significant increase CO2 emission independently of feedstock used for PyOM production.
Emission of CO2 from soils amended with PyOM produced from lignocellulosic waste and
herbaceous materials was greater (RR= 3.29 and 2.97 respectively) than from wood materials
(RR= 1.52) at PyC:SOC ratios >2.
Pyrogenic organic matter produced at temperatures <350°C increased CO2 emission
independently of the PyC:SOC ratio (RR= 2.22 and RR= 1.50 for PyC:SOC ratio >2 and <2,
respectively) (Fig. 2.2). When PyOM was produced at temperatures ranging from 351-550°C,
there was increased CO2 emission only at PyC:SOC ratio >2 (RR= 1.96). For PyOM produced
at temperatures >550°C, no significant changes in CO2 emission was observed at PyC:SOC
ratio >2, but a significant decrease in CO2 emission at PyC:SOC ratio <2 (RR= 0.86; CI= 0.72-
0.98).
Influence of experimental conditions
Significant differences among sub-groups at PyC:SOC ratios >2 were observed in most
instances, except for experiment type. At PyC:SOC ratios <2, these differences were significant
only for incubation temperature and soil moisture (Tab. 2.3).
Experiments performed for periods shorter than 200 days showed increased CO2 emission only
when the PyC:SOC ratio was >2 (RR= 2.48). For experiments performed for periods longer
than 200 days, no significant effects on CO2 emission were observed (Tab. 2.3). Soils incubated
at temperatures of <30.0°C had their CO2 emissions significantly increased independently of
the PyC:SOC ratio. However, CO2 emission from soils incubated at temperatures >30.0°C or
under variable temperatures were not influenced by PyOM additions.

Chapter 2
26
There was a significant increase in CO2 emission from soils incubated at moistures <40% and
>80% of water holding capacity (WHC) at PyC:SOC ratios >2 (RR= 3.03 and 3.32,
respectively). Conversely, for soils incubated under moisture ranging from 40.1-80.0 % WHC,
there was a significant increase in CO2 emission when the PyC:SOC ratio was <2 (RR= 1.17).
Soils amended with PyOM in laboratory and field experiments had their CO2 increased only at
PyC:SOC ratios >2 (RR= 2.14 and 1.17, respectively). Emissions of CO2 from greenhouse
experiments were not influenced by PyOM additions.
2.4 Discussion
Our meta-analysis showed an overall statistically significant increase of 29% in CO2 emission
from PyOM-amended soils compared to soils without PyOM. We have also shown that
significant increases in CO2 emission were only evident at PyC:SOC ratios >2. These findings
are consistent with the hypothesis that the main source of increased CO2 emission from PyOM-
Figure 2.2. Influence of different PyC:SOC ratios, within different PyOM pyrolysis temperatures on
CO2 emission from PyOM-amended soils. Symbols show response ratio (RR) and bars show 95%
confidence intervals. The numbers shown in parentheses correspond to the number of observations
upon which the statistical analysis is based.
0 1 2 3 4 5
Response ratio
PyC:SOC ratios
>2 (n= 16)
Grand mean (n= 51)
<2 (n= 35)
>2 (n= 36)
Grand mean (n= 111)
<2 (n= 75)
>2 (n= 30)
Grand mean (n= 79)
<2 (n= 49)
Pyrolysis
temperature
<350°C
351-550°C
>550°C

Biochar effects on CO2 emissions: a meta-analysis
27
amended soils is the labile C fraction of PyOM. For the first time, we demonstrate that the
PyC:SOC ratio is the best predictor for increases in CO2 production in PyOM-amended soils.
Soils with low C contents and low C:N ratios emitted more CO2 at PyC:SOC ratios >2 than
soils with high C contents and high C:N ratios (Tab. 2.1). Soils with low C contents have been
reported as being more responsive to PyOM additions in terms of CO2 emission (Stewart et al.,
2013; Yu et al., 2013). In these relatively low-SOC soils, labile fractions of PyOM may provide
an important source of C that is used as selective substrate for microbial activity (Cross and
Sohi, 2011). Coarse-textured (i.e. sandy) soils normally have lower amounts of SOC as they
offer less protection against decomposition than fine-textured (i.e. clayey) soils (Roscoe et al.,
2001). This lower protective effect may also enhance PyOM exposure and hence its
decomposition (Brodowski et al., 2005), resulting in increased CO2 emission. Such a hypothesis
is supported by our findings of higher CO2 emissions from soils with medium and coarse texture
at PyC:SOC ratios >2, compared to fine-textured soils (Tab. 2.1). It further suggests that
persistence of PyOM is influenced by the soil environment, in contrast to suggestions by
Schmidt et al. (2011).
Table 2.3. Meta-analysis of the effects of PyC:SOC ratios on CO2 emission, within experimental-
associated characteristics. PyC:SOC ratios are divided as >2 and <2.
Categories
PyC:SOC ratio
RR
95% CI
n
P*
P**
Experiment duration
<200 days >2 2.48 1.87-3.33 72 <0.01 <0.01
<2 1.04 0.91-1.17 120 0.82
>200 days >2 0.85 0.55-1.21 17 <0.01
<2 1.07 0.98-1.16 47
Incubation temperature (T°C)
20.1-30.0 >2 2.22 1.51-3.54 30 <0.01 0.03
<2 1.21 1.10-1.32 64 0.01
<20.0 >2 1.66 1.03-2.64 2 0.21
<2 1.25 1.06-1.50 28
>30.0 >2 1.08 0.72-1.55 20 0.77
<2 1.04 0.89-1.20 20
Variable >2 1.02 0.72-1.66 7 0.60
<2 0.95 0.86-1.03 31
Soil moisture (%)
<40.0 >2 3.03 1.67-5.88 20 <0.01 <0.01
<2 0.91 0.65-1.21 8 <0.01
>80.0 >2 3.32 2.02-5.34 30 <0.01
<2 0.76 0.57-1.01 44
40.1-80.0 >2 1.20 0.88-1.58 28 0.74
<2 1.17 1.08-1.28 72
Experiment type
Laboratory >2 2.14 1.64-2.85 80 <0.01 0.11
<2 1.07 0.94-1.20 132 0.50
Greenhouse >2 1.02 0.74-1.68 7 0.54
<2 0.92 0.75-1.12 10
Field >2 1.17 1.16-1.17 2 0.45
<2 1.00 0.62-1.10 25
RR= response ratio; CI= 95% confidence interval for RR; n= number of observations within each category; P*=
probability of the model heterogeneity test between the two relative application ratios (PyC:SOC ratio >2 and <2
respectively) within the various groupings; P**= probability of the model heterogeneity test between the various
groupings within the categories of relative application ratios.

Chapter 2
28
Results from PyOM pyrolysis temperature sub-groups (Fig. 2.2) further support the hypothesis
that increases in CO2 emission following soil-PyOM additions may derive mainly from PyOM
labile fractions. Pyrogenic organic matter produced at <350°C, which usually have a higher
labile fraction of C (Sun et al., 2014), significantly increased CO2 emission irrespective of
PyC:SOC ratio, but PyOM produced at >550°C (i.e. with a lower labile fraction) did not, even
at high application rates. For the studies included in our meta-analysis, high pyrolysis
temperatures were generally associated to PyOM with higher C contents than those produced
at low pyrolysis temperatures, as confirmed by Sun et al. (2014). However, PyOM C content
was not a significant factor controlling CO2 emission, as relevant increases occurred only at
PyC:SOC ratios >2, irrespective of PyOM C content (Tab. 2.2).
Our results are consistent with the assumption that positive priming is not the main driver of
increased CO2 emission. While the original definition of priming (Bingeman et al., 1953)
referred to increased decomposition of SOC after addition of organic sources, later definitions
are more restrictive. For instance, the definition of Kuzyakov et al. (2000) refers to priming as
strong short-term changes in SOC turnover after additions of small amounts of labile fresh
organic materials. The studies covered in this meta-analysis do not fit with this narrow
definition in two respects. Amounts added were usually large (and significant increases in
respiration only occurred at PyC:SOC ratios >2). Furthermore, the material added was
supposedly recalcitrant rather than labile. However, labile-C fractions can also be present on
the surface of PyOM following pyrolysis, from example in the form of sugars and aldehydes
(Painter, 2001). The total amount of these labile-C fractions increases with increasing PyOM
application rates. Therefore, the fact that CO2 emission increased significantly only at PyC:SOC
rates >2 (Fig. 2.1) suggests that this CO2 originated to a large extent from the decomposition of
labile C fractions of the PyOM (cf. Smith et al., 2010; Cross and Sohi, 2011; Hilsher and
Knicker, 2011; Luo et al., 2011; Méndez et al., 2013).
One major implication of our study is that some PyOM (or fractions thereof) decompose more
quickly, and hence are less recalcitrant than usually thought (Lehmann et al., 2006). If the
assumption of very high recalcitrance of all chars is relaxed, our data also imply that increases
in CO2 emission following PyOM additions may have been often mistakenly referred to as
positive priming. This risk is highest in those studies where isotope analysis was not performed,
as the main source of emitted CO2 could not be determined and so may be the PyOM rather
than the SOC.
Maestrini et al. (2014) recently analysed priming effects by biochar on SOC decomposition,
based on studies with stable C isotope-labelled substrates. They concluded that positive priming
occurs shortly after soil-PyOM incubations (especially within periods <20 days) and negative
priming in incubations lasting for >200 days. While their data are not directly comparable with
ours (their priming effect was not expressed as a response ratio and they did not separate studies
with high and low relative biochar addition rates), they noted that a major cause for positive
priming was the occurrence of a labile fraction in PyOM. In cases where negative priming was
observed, they proposed sorption of SOC onto the PyOM surface as a major mechanism.

Biochar effects on CO2 emissions: a meta-analysis
29
The surface area of PyOM is likely to increase over time as particles weather and break up.
Furthermore, evidence suggests that the surface of PyOM may become more reactive over time,
increasing in properties such as cation exchange capacity (Cheng et al., 2006). As such, it is
also possible that the CO2 adsorption capacity of PyOM in soil may increase over time. Indeed,
our meta-analysis shows that CO2 emission significantly decreased after periods >200 days
compared to the first 200 days, especially at PyC:SOC ratios >2 (Tab. 2.3). However, while
time-dependent changes in PyOM surface area properties should not be excluded as a
mechanism, it is also possible that exhaustion of labile C contributed for decreased CO2
emission after periods >200 days. This is likely to be the case especially because no time-
dependent negative priming was detected (Tab. 2.3).
We noted significant reductions in CO2 emission when PyOM with low-C content (<50%; Tab.
2) and when PyOM produced at high temperatures (>550°C; Fig. 2) was applied, both at
relatively low addition ratios. Data from our meta-analysis partially agree with those from
Maestrini et al. (2014), who showed that negative priming was strongest with more stable
PyOM. However, the authors suggested a strong decrease in CO2 emission with PyOM
containing high C content, which is not supported by our data. Further research is needed
regarding the importance of pyrolysis processes (especially temperature) and PyOM C content,
as well as sorption processes as mechanisms for negative priming. There is also a need for
standardization in determining data on PyOM C content, as it has not likely always been
consistently reported with potential corrections (e.g. for ash content).
An increase in CO2 emission (RR= 1.99, i.e., almost a doubling; Fig. 2.1) at high PyC:SOC
ratios (> 2) and the lack of responses at low PyC:SOC rations (<2) indicates that only a small
part of the char is relatively labile, otherwise significant increases in CO2 emission would also
be evident at low PyC:SOC ratios. Support for a major recalcitrant fraction of the biochar comes
from an alternative calculation where we expressed our CO2 flux data per unit of C, from both
SOC and PyOM. Conversion of the data to respired CO2 per unit of C results in a significant
relative decrease in the response ratios, irrespective of PyC:SOC ratios (Tables S2.1, S2.2 and
S2.3 at Supporting information). This decrease is due to the higher recalcitrance, and therefore,
lower decomposition rate of PyOM compared to that of SOC, as also observed by Cross and
Sohi (2011). However, such information must be interpreted with caution as it could easily lead
to the wrong suggestion that PyOM additions result in strong negative priming.

Chapter 2
30
The way-forward in research on PyOM and SOC decomposition
The studies used in our meta-analysis were predominantly from laboratory experiments (82%),
compared to field (10%) and greenhouse experiments (8%). Moreover, laboratory experiments
accounted for 90% of data points with PyC:SOC ratio >2. In fact, there was a significant
difference in relative PyC addition rates between laboratory and field studies (Fisher’s exact
test, two-sided; P = 0.001). Laboratory experiments with high PyC:SOC ratios are useful for
identifying potential mechanisms driving changes in CO2 emission. However, such ratios likely
result in overestimation of the effect size. Furthermore, they are unrealistic representations of
expected results under field conditions. It is necessary, therefore, that future research utilises
experimental designs with realistic PyOM treatments rather than the large amounts often used
in laboratory experiments. Such experiments should include multiple controls. This implies that
not only treatments without addition of PyOM should be used, but also additional treatments
that are designed to test non-PyOM mechanisms (effects of ash, pH increases, nutrient additions
if charred manure is used, etc.) that are due to co-variation of these factors with PyOM (Jeffery
et al., 2013). This approach would allow for unequivocal conclusions to be drawn regarding the
effects exclusively inherent to PyOM.
Experimental details were often incompletely reported, for example, regarding soil disturbance
across PyOM treatments and control. Soil disturbance due to mixing PyOM into soil, especially
in laboratory experiments, can destroy soil aggregates, thus stimulating decomposition of
organic matter (Salinas-Garcia et al., 1997) and thereby enhancing CO2 emission. Therefore,
adequately reporting experimental details is a necessary aspect for: (i) a standardization process
for future research aimed at quantifying (interactive) effects of PyOM on SOC dynamics; (ii) a
straightforward way of avoiding confounding results and (iii) the repeatability of results under
similar experimental conditions.
Research on PyOM has recently emphasized areas that deserve particular attention. Effects of
PyOM additions on the decomposition rate of SOC are among these research priorities
(Verheijen et al., 2014). Most data in our meta-analysis are from short-term studies. But some
mechanisms responsible for physical and chemical protection of PyOM and SOC take place
only in the long-term, for example as PyOM ages in the soil and its surface gains charge. This
process of oxidation and charging of PyOM surface may occur over long periods of time
(Brodowski et al., 2005). Therefore, there is a need for long-term experiments, especially under
field conditions. Such experiments, associated with stable isotope techniques would permit an
effective testing of the potential mechanisms controlling the decomposition and potential
interactions between PyOM and native SOC.

Biochar effects on CO2 emissions: a meta-analysis
31
2.5 Supporting information
Appendix S2.1. List of references used in the meta-analysis.
Aguilar-Chávez A. et al. (2012) Soil Biology and Biochemistry, 52, 90-95.
Ameloot N. et al. (2013) Soil Biology and Biochemistry, 57, 401-410.
Awad YM. et al. (2012) European Journal of Soil Biology, 48, 1-10.
Bamminger C. et al. (2013) European Journal of Soil Science, 65, 72–82.
Bruun EW. et al. (2011) Biomass and Bioenergy, 35, 1182-1189.
Bruun EW. et al. (2012) Soil Biology and Biochemistry, 46, 73-79.
Case SDC. et al. (2012) Soil Biology and Biochemistry, 51, 125-134.
Dempster DN. et al. (2012) Plant and Soil, 354, 311–324.
Díaz-Rojas M. et al. (2014) Applied Soil Ecology, 73, 19-25.
Fernández JM. et al. (2014) Science of the Total Environment, 482–483, 1–7.
Galvez A. et al. (2012) Agriculture, Ecosystems and Environment, 160, 3–14.
Jones DL. et al. (2011) Soil Biology and Biochemistry, 43, 1723-1731.
Jones DL. et al. (2012) Soil Biology and Biochemistry, 45, 113-124.
Junna S. et al. (2014) Ecological Engineering, 62, 43–47.
Kharu K. et al. (2011) Agriculture, Ecosystems and Environment, 140, 309–313.
Knicker H. et al. (2013) Soil Biology and Biochemistry, 56, 31-39.
Knoblauch C. et al. (2011) Soil Biology and Biochemistry, 43, 1768-1778.
Kuzyakov Y. et al. (2009) Soil Biology and Biochemistry, 41, 210–219.
Lai WY. et al. (2013) Journal of the Taiwan Institute of Chemical Engineers, 44, 1039–1044.
Luo Y. et al. (2011) Soil Biology and Biochemistry, 43, 2304-2314.
Maestrini, B. et al. (2014) Soil Biology and Biochemistry, 69, 291-301.
Major J. et al. (2010) Global Change Biology, 16, 1366–1379.
Malghani S. et al. (2013) Soil Biology and Biochemistry, 62, 137-146.
Mukherjee A. & Zimmerman AR. (2014) Science of the Total Environment, 487, 26–36.
Mukome FND. et al. (2013) Geoderma, 200-201, 90–98.

Chapter 2
32
Novak JM. et al. (2010) Geoderma, 154, 281–288.
Quilliam RS. et al. (2012) Agriculture, Ecosystems and Environment, 158, 192– 199.
Rittl TF. et al. (in preparation).
Saarnio S. et al. (2013) Soil Biology and Biochemistry, 58, 99-106.
Santos F. et al. (2012) Soil Biology and Biochemistry, 51, 115-124.
Schimmelpfennig S. et al. (2014) Agriculture, Ecosystems and Environment.
doi:10.1016/j.agee.2014.03.027
Sigua GC. et al. (2014) Chemosphere, 103, 313–321.
Singh BP. et al. (2012) Environmental Science and Technology, 46, 11770−11778.
Smith JL. et al. (2010) Soil Biology and Biochemistry, 42, 2345–2347.
Spokas KA. et al. (2009) Annals of Environmental Science, 3, 179-193.
Spokas KA. et al. (2009) Chemosphere, 77, 574–581.
Steinbeiss S. et al. (2009) Soil Biology and Biochemistry, 41, 1301–1310.
Stewart CE. et al. (2013) Global Change Biology and Bioenergy, 5, 153–164.
Troy SM. et al. (2013) Soil Biology and Biochemistry, 60, 173-181.
van Zwieten L. et al. (2013) Science of the Total Environment, 465, 279–287.
Whitman T. et al. (2014) Soil Biology and Biochemistry, 73, 33-41.
Yu L. et al. (2013) Biology and Fertility of Soils, 49, 119–128.
Zavalloni C. et al. (2011) Applied Soil Ecology, 50, 45–51.
Zhang A. et al. (2012) Field Crops Research, 127, 153–160.
Zhang A. et al. (2013) Agriculture, Ecosystems and Environment, 173, 37–45.
Zimmerman AZ. et al. (2011) Soil Biology and Biochemistry, 43, 1169-1179.

Biochar effects on CO2 emissions: a meta-analysis
33
Table S2.1. Meta-analysis of the effects of PyOM on soil CO2 emissions relative to SOC units, grouped
by soil and environment characteristics.
Categories RR 95% CI n P Fail safe N
Soil C content (g kg-1) 0.32 7859
10.1-30.0 0.57 0.45-0.72 90
<10.0 0.49 0.35-0.68 61
>30.0 0.45 0.34-0.60 0.58
Soil C:N ratio 0.27 315
>10.0 0.76 0.60-0.94 52
<10.0 0.60 0.33-1.00 35
Soil pH <0.01 6825
5.1-6.0 0.66 0.35-1.09 32
>7.0 0.61 0.50-0.74 60
6.1-7.0 0.49 0.38-0.65 78
<5.0 0.30 0.18-0.50 26
Soil fertilization background <0.01 7304
N 1.86 1.03-3.28 8
NPK 0.57 0.31-0.85 13
Nutrient solution 0.46 0.38-0.57 4
None 0.43 0.35-0.52 151
Soil texture 0.01 2420
Medium 0.71 0.55-0.92 61
Fine 0.68 0.48-0.93 28
Coarse 0.44 0.29-0.66 58
Soil provenance <0.01 7811
Temperate 0.56 0.47-0.66 178
Subtropical 0.30 0.17-0.48 29
For each category we calculated: weighted mean of the response ratio (RR) back transformed from lnRR, the 95%
confidence interval (CI) for RR, and the number (n) of observations. P indicates the probability of the model
heterogeneity test and the Fail safe N indicates the minimum number of studies necessary to shift the P value from
significant to non-significant. Data refer to CO2 emission converted to a soil C basis. Differences in the division of
sub-groups within categories compared to the Tables in the main body text are due to limitations for conversion of
data.

Chapter 2
34
Table S2.2. Meta-analysis of the effects of PyOM on soil CO2 emissions relative to SOC units, grouped
by PyOM characteristics.
Categories RR 95% CI n P Fail safe N
PyOM C content (%) 0.74 5356
>80.0 0.54 0.34-0.91 25
50.1-80.0 0.52 0.44-0.64 151
<50.0 0.45 0.32-0.61 29
PyOM C:N ratio 0.51 1845
<50.0 0.63 0.44-0.89 56
>50.0 0.56 0.44-0.71 96
PyOM pH <0.01 0
<6.0 1.63 1.31-2.07 17
6.1-8.0 1.28 0.91-1.76 17
>8.0 0.66 0.52-0.82 54
PyOM ash content (%) 0.07 5074
>10.0 0.55 0.42-0.71 75
<10.0 0.43 0.32-0.57 59
PyOM surface area (m2 g-1) <0.01 8817
<50.0 0.50 0.36-0.69 59
>50.0 0.33 0.26-0.40 63
PyOM volatile matter (%) 0.13 1129
<10.0 0.58 0.31-1.14 12
>10.0 0.34 0.27-0.42 52
PyOM pyrolysis temperature (ToC) <0.01 6109
<350 0.98 0.73-1.26 43
>550 0.41 0.31-0.54 53
351-550 0.37 0.29-0.47 98
Pyrolysis type and residence time <0.01 3591
Hydrochar 1.44 0.98-2.08 13
<0.5 1.20 0.82-1.86 14
>0.5 0.33 0.26-0.42 92
PyOM feedstock <0.01 7886
Manure 0.78 0.52-1.10 21
Herbaceous 0.64 0.50-0.82 71
Lignocellulosic waste 0.58 0.29-1.13 15
Wood 0.44 0.35-0.54 95
Biowaste 0.09 0.01-0.43 7
PyOM application rate (Mg ha-1) <0.01 5344
<20.0 0.85 0.70-1.01 65
>100.0 0.46 0.33-0.64 63
20.1-60.0 0.45 0.24-0.74 28
60.1-100.0 0.31 0.23-0.43 47
For each category we calculated: weighted mean of the response ratio (RR) back transformed from lnRR, the 95%
confidence interval (CI) for RR, and the number (n) of observations. P indicates the probability of the model
heterogeneity test and the Fail safe N indicates the minimum number of studies necessary to shift the P value
from significant to non-significant. Data refer to CO2 emission converted to a soil C basis. Differences in the
division of sub-groups within categories compared to the Tables in the main body text are due to limitations for
conversion of data.

Biochar effects on CO2 emissions: a meta-analysis
35
Table S2.3. Meta-analysis of the effects of PyOM on soil CO2 emissions relative to SOC units,
grouped by experimental conditions.
Categories RR 95% CI n P Fail safe N
PyC:SOC ratio 0.09 7877
<1 0.63 0.47-0.80 78
>5 0.47 0.32-0.72 39
1-2 0.47 0.35-0.61 50
2-5 0.42 0.28-0.63 42
Experiment duration <0.01 7878
31-200 days 0.67 0.56-0.81 141
>200 days 0.34 0.26-0.42 56
<30 days 0.16 0.05-0.50 12
Incubation temperature (ToC) <0.01 3805
Variable 0.72 0.60-0.91 8
<20.0 0.71 0.48-1.02 28
20.1-30.0 0.64 0.47-0.83 81
>30.0 0.29 0.22-0.38 40
Soil moisture (% WHC) 0.69 8663
<40.0 0.53 0.23-1.11 23
>80.0 0.47 0.34-0.64 56
40.1-80.0 0.44 0.37-0.52 108
Experiment type 0.45 7890
Field 0.65 0.55-0.74 9
Laboratory 0.51 0.42-0.60 199
For each category we calculated: weighted mean of the response ratio (RR) back transformed from lnRR, the
95% confidence interval (CI) for RR, and the number (n) of observations. P indicates the probability of the
model heterogeneity test and the Fail safe N indicates the minimum number of studies necessary to shift the P
value from significant to non-significant. Data refer to CO2 emission converted to a soil C basis. Differences
in the division of sub-groups within categories compared to the Tables in the main body text are due to
limitations for conversion of data.


Chapter 3
Biochar decomposition under field conditions depends on its
application rate
Edvaldo Sagrilo, Tatiana Francischinelli Rittl, Ellis Hoffland, Bruno J. R. Alves, Herony
U. Mehl, Thomas W. Kuyper

Chapter 3
38
Abstract
Soil amendment with pyrogenic organic matter (PyOM) has been claimed as an option for
carbon (C) sequestration in agricultural soils. Most studies presented so far rely on PyOM in
the lab. Here we tested the effects of PyOM locally produced in traditional kilns on native SOC
and PyOM stability under field conditions. Soybean was cultivated over four cropping seasons
(CS) in a sandy Ferralsol amended with 0, 5, 10, 20 and 40 Mg ha-1 of PyOM in a randomized
complete block design with four replications. Soil samples from the 0-10 cm top layer were
taken at the end of first and fourth CS and analysed for CO2 emissions, isotopic C abundance
(13C/12C ratio) and enzymatic activity (FDA and DGH). We showed that decomposition of
locally produced PyOM is faster (25-60% within first year) than normally assumed (10-20%
within 5-10 years), which was higher than that of native SOC (5-14%). Our data evidence that
there is a preferential decomposition of PyOM compared to native SOC and that the intensity
of such effect depends on the rate of PyOM applied to the soil. Only on the longer term (>1 yr)
addition of PyOM stabilizes soil C. Based on our findings we propose that new models should
be re-shaped in order to incorporate potential variability in PyOM decomposition.

Biochar decomposition under field conditions
39
3.1 Introduction
Pyrogenic organic matter (PyOM), also named biochar, is the solid product of biomass
combustion at low oxygen concentration. Soil amendment with PyOM has been advocated as
a carbon (C) negative technology, reducing atmospheric concentrations of carbon dioxide
(Woolf et al., 2010), thereby attracting the interest of the global carbon market (Lehmann,
2007). When incorporated into the soil, PyOM is expected to contribute to the recalcitrant soil
organic carbon (SOC) pool (Lehmann et al., 2006; Knicker et al., 2013) and to decelerate the
decomposition of SOC (Glaser et al., 2000). The decomposition rate of PyOM depends on the
soil environment to which PyOM is applied and on its chemical characteristics. The
decomposition rate of PyOM has shown to be faster in incubation experiments than under field
conditions (Kuzyakov et al., 2009). In well-aerated tropical soils PyOM can be degraded in
decades to centuries (Bird et al., 1999). Moreover, PyOM produced at higher temperatures
(>500°C) under controlled conditions is more recalcitrant than PyOM produced at lower
temperatures (Sun et al., 2014). To apply and scale up PyOM production in the field, local and
traditional kilns will have to be used. There are, however, no field data on decomposition rates
of PyOM produced in traditional kilns and its effect on SOC.
Soil additions of PyOM can affect the decomposition rate of native SOC through a priming
effect. Priming refers to changes in SOC decomposition rate after additions of organic
amendments (Bingeman et al., 1953). It can result from various types of interaction. Changes
in availability of C and nutrients (e.g. nitrogen) due to organic amendments may affect the
microbial activity, altering the rate of SOC decomposition (Knicker et al., 2013). Recent studies
(Luo et al., 2011; Ameloot et al., 2013; Farrell et al., 2013; Maestrini et al., 2014) evidenced
enhanced SOC loss from PyOM-amended soils (positive priming). Increases in CO2 emission
following PyOM additions may also result from the decomposition of PyOM labile fractions,
rather than from increased SOC decomposition (Hilscher et al., 2009; Smith et al., 2010; Cross
and Sohi, 2011; Jones et al., 2011; Zimmerman et al., 2011; Méndez et al., 2013), suggesting
that some PyOM may be less recalcitrant than expected (Knicker et al., 2013). However, SOC
stabilization in PyOM-amended soils (negative priming) was also shown (Keith et al., 2011;
Knicker et al., 2013). Sorption of enzymes (Singh and Cowie, 2014) and labile SOC
(Zimmerman et al., 2011) to PyOM could also decelerate decomposition of SOC.
In most studies it is not possible to distinguish whether PyOM-induced efflux of CO2 originated
from PyOM and SOC. Isotope analysis is an effective way to discriminate the origin of C in
PyOM-amended soils or the origin of its evolved CO2. Differences in 13C/12C ratios can be
estimated from individual 13C/12C ratios relating to photosynthetic pathways of the plants
generating the PyOM feedstock, and the pathways of plants historically associated with the soil
amended with PyOM. Despite the usefulness of this technique, few studies (Smith et al., 2010;
Cross and Sohi, 2011; Hilscher and Knicker, 2011; Luo et al., 2011; Zimmerman et al., 2011;
Méndez et al., 2013) used it to distinguish the origin of evolved CO2 from PyOM-amended soils
or the origin of remaining C in the soil. Moreover, most research aiming at studying priming

Chapter 3
40
effects in PyOM-amended soils is performed under laboratory conditions and in a short-term
period.
There is a lack of data originating from longer-term decomposition field experiments especially
in soil amended with different rates of locally produced PyOM. Such experiments could
produce more reliable results and comprehensive insights regarding the mechanisms leading to
changes in SOC turnover after PyOM additions. In this field study, we aimed to quantify
changes in the PyOM and SOC stocks over four soybean cropping seasons (CS) in a C4 sandy
Ferralsol amended with different rates of PyOM. The PyOM was produced from C3 woody
species using traditional pyrolysis methods employed in the region. We used 13C isotopic
analysis to discriminate the origin of the C in the soil and quantify the decomposition rates of
native SOC and PyOM, as well as to better understand the mechanisms controlling the changes
in native SOC (potential priming effects) under field conditions.
3.2 Materials and methods
Study site
An experiment was carried out at the field station of the Embrapa Mid-North in Parnaiba (UEP-
Parnaiba), Brazil (3o05’18’’S; 41o47’00’’W; 52 m altitude). Regional climate is ‘Aw’ type
(tropical with a dry season), according to Köppen classification. Local annual mean temperature
is 27 oC, mean precipitation is 1,079 mm and relative humidity is 76.5% (Andrade Junior et al.,
2005). Potential evapotranspiration (PET) was calculated using the software LocClim 1.10 (Fig.
3.1). Crops are generally planted in February-March and harvested in June or July. The soil was
a Ferralsol (Oxisol in the USDA Soil Taxonomy), overlaid by around 40 cm of sand, where
most plant roots grow. The textural distribution of the topsoil revealed 886 g kg-1 of sand and
86 g kg-1 of clay dominated by kaolinite (1:1). The native vegetation was a Caatinga-coastal
phase (Melo et al., 2004). From 1995 to 2007 an experiment with tropical grass species was set
up in the area. From 2007 to the beginning of this experiment (September of 2011), the area
remained under fallow, with grass-dominated spontaneous vegetation, which was cut once per
year and the residues maintained on soil surface.
In early September 2011, the soil was harrowed twice with a heavy harrow. Four blocks were
distinguished in which experimental plots of 2.0 x 3.0 m were established allowing sprinklers
lines between blocks 1-2 and 3-4. Additional sprinklers lines were maintained at each side of
the experimental area. Excess of grass residues on the plots was removed from the top 10 cm
with hoes and rake in order to facilitate the PyOM mixing with soil and opening of furrows for
planting. Seeds of soybean cultivar BRS-Tracajá, inoculated with a commercial
Bradyrhizobium japonica product were planted at a density of 14 plants m-1, in five rows spaced
0.40 m from each other. Plots were 2.0 m apart. Soybean sowing took place at each 4-month
interval (120 days), for four successive cropping seasons (CS1 - CS4), which was made possible
due to irrigation. Potassium (KCl) was applied each CS, and micronutrients were applied only

Biochar decomposition under field conditions
41
in CS3 and CS4. The year of 2012 was unusually dry, with total rainfall of 624.6 mm - much
lower than the average of 1,079 mm for the region - and for this reason, even at the rainy season,
irrigation took place regularly, except at February and March (Fig. 3.1). Plant traits and
management were done according to Sfredo (2008).
Pyrogenic C production
The PyOM was produced from native woody savannah C3 plants using a slow pyrolysis process
(~48h) in regionally used traditional kilns at a temperature of 500°C (Tab. 3.1). These kilns
(approximately 2.8m high, 4-6m diameter) are made from mud bricks and have a loading
capacity ranging between 18 to 25 m3 of feedstock.
Experimental design and characteristics of treatments
Five rates of PyOM (0, 5, 10, 20 and 40 Mg ha-1) were applied once (in September 2011) to the
respective plots sorted out in a randomized complete blocks design with four replications. Prior
to its application, PyOM was crushed into small pieces and forced to pass in a 2 mm sieve.
During its field application, plastic canvases were used as wind barriers to prevent dispersion.
PyOM was immediately incorporated to the top 10 cm of soil with hoes prior to soybean
sowing. Also the control plots (0 Mg ha-1 PyOM) were hoed.
Figure 3.1. Monthly temperatures (minimum, maximum and average) and total monthly precipitation
from rainfall and irrigation during the experimental period. ∆ indicates the sowing events; ▲ indicates
the harvest events. * indicates the sowing of CC1; ** indicates the sowing of CC4.
∆* ▲∆ ▲∆ ▲∆** ▲
2011 2012 2013

Chapter 3
42
Soil sampling
After soybean harvest at CS1 and CS4, soil samples were collected from the 0-10 cm layer with
an auger. From the three central planting lines within each plot, 12 soil cores were collected
and pooled to form a composite sample for each treatment plot. These samples were sieved
through a 2-mm screen to remove soybean roots, air-dried and stored at room temperature prior
to chemical analyses. Undisturbed soil samples were also taken from the 0-10 cm layer in order
to determine the soil bulk density as described by Sisti et al. (2004) for the calculation of SOC
stocks.
Enzymatic activity
Fluorescein diacetate (FDA) hydrolysis was determined according to the method of Swisher
and Carroll (1980). Dehydrogenase (DHA) activity was determined using the method described
in Casida et al. (1964), which is based on the spectrophotometric determination of
triphenyltetrazoliumformazan (TTF) released by 5 g of soil during 24 h at 37°C.
Field CO2 emission measurements using IRGA
To quantify the soil CO2 flux in the field, 10.3 cm diameter and 6 cm height PVC collars were
inserted 2 cm into the soil at each field plot. Collars were inserted monthly from October-2012
to January-2013 (CS4) on the eve of each measurement event to ensure that no overestimation
of CO2 emissions would occur due to recent soil disturbance. Irrigation of the plots ceased
always on the afternoon at same day of collars insertion, in order to ensure similar water content
at every measurement. CO2 flux measurements were performed always from 6:00 to 9:00
o’clock in the morning, to avoid excessive variations in soil temperature. A portable infrared
gas analyser (IRGA) LI-6400/LI-6400XT Version 6 (LI-COR, Lincoln, NE, USA) coupled to
a Soil CO2 Flux Chamber was used to quantify soil CO2 emissions (Norman and Kucharik,
1997) at 15, 43, 71 and 106 days after plant emergence throughout CS4. At each measurement,
values were corrected for ambient CO2 concentration. The relative decomposition rate of
PyOM-soil mixtures in the CS4 were calculated using the average of the four soil CO2 emission
measurements.
Table 3.1. Chemical properties of the pyrogenic organic matter applied to the experimental site.
...... pH ...... Ca Mg Al H+Al P(Melich 1) Exchangeable K Cu
H2O KCl(1M) ......................... g kg-1 ......................... ........................ mg kg-1 .......................
7.2 6.15 1.86 0.37 0 0 126.5 1547 0.39
Zn Fe Mn Ctot Ntot NH4+ NO3
- EC*
................ mg kg-1 ................ ..............% ............... ........... mg kg-1 ........... µs cm-1
2.94 25.20 4.50 74.3 1.18 17.4 0 3573 * EC= Electrical conductivity (micro siemens cm-1)

Biochar decomposition under field conditions
43
Carbon isotopic analysis
After removing soybean plant fragments coarser than 2mm by sieving, bulk soil samples were
oven dried at 65ºC, ground in ball mill, and analysed for C content and 13C abundance. The 13C
abundance of the soil samples was determined on aliquots containing between 200 and 400 µg
total C using an elemental analyser coupled to a mass spectrometer Finnigan Mat Model delta-
E. Results of natural abundance of 13C were expressed in delta units, calculated as δ13C
[(Rsample/Rstandard)-1] X 1000 (‰), where Rsample and Rstandard are the ratios of 13C/12C of the study
sample and the reference standard, respectively. The current δ13C value of the atmosphere was
considered as −8‰.
The relative contribution (%) of C derived from native SOC (CSOC) and pyrogenic C (PyC)
derived from PyOM was estimated from the 13C abundance of the soil samples from the
following formula (Balesdent and Mariotti, 1996):
CSOC= (δ13CM -δ13PyC)/(δ13CSOC-δ13PyC)
where CSOC is the proportion of C derived from the native SOC, δ13CM is the 13C abundance of
the PyOM-amended soil, δ13PyC is the 13C abundance of PyC and δ13CSOC is the 13C abundance
of the soil with soybean crop in CS1 (January 2012) or CS4 (January 2013).
We also calculated the stock of native SOC – presumed as being mainly C4-derived (SC4) - by
the following formula:
SC4 = ST ×CSOC
where SC4 is the stock of C4-derived carbon (Mg ha-1), ST the total C stock (Mg ha-1).
Statistical analyses and calculations
Statistical analyses were performed using SAS 9.2 (SAS Institute, 2009). For the individual
stocks of native SOC and PyC (Mg ha-1), the effects of PyOM application rates and CS were
analysed using a two-way ANOVA with the PROC GLM (α = 0.05). The relative
decomposition rate of both fractions was estimated using the formula -k = (ln SCS4 - ln SCS1)/(t4-
t1), where SCS4 is the C stock after CS4, SCS1 is the C stock after CS1 and t4-t1 is the time passed
between the two sampling moments (yr). For the CO2 emissions, an average value was
calculated across the measurements and divided by the SOC content of each treatment. The
values are expressed as µg C s-1 g soil C-1.

Chapter 3
44
3.3 Results
Native SOC and PyC stocks
The soil collected at the end of CS1 and CS4 showed an average isotopic signature,
respectively, of -18.51‰ and -20.31‰ (+0.2‰) in the controls without PyOM addition. The
PyOM showed an isotopic signature of -28.66‰. The soybean production was not affected by
biochar treatments (unpublished results), and therefore, we assumed that soybean did not affect 13C abundance differently among treatments.
Native SOC stocks were not significantly (P<0.138) affected by PyOM addition rates over the
experimental period (Fig. 3.2). Stocks of native SOC did not change significantly (P= 0.6)
across the cropping seasons. Stocks of PyC significantly increased (P<0.01) with PyOM
additions rates in both cropping seasons (Fig. 3.2). They decreased significantly from CS1 to
CS4 at all PyOM application rates.
Native SOC and PyOM decomposition rates
The relative rates of SOC decomposition were not affected by PyOM additions (Fig. 3.3). On
the other hand, the relative rate of PyOM decomposition in the soil showed a consistent decrease
with increasing rates of PyOM addition to the soil, up to 20 Mg ha-1. The relative rates of
decomposition were higher for PyOM, compared to the native SOC, especially at lower PyOM
addition rates.
CO2 emissions from PyOM-amended soils
There was a significant decrease in the average CO2 emission per unit of soil C with increasing
rates of PyOM added to the soil measured in CS4 (Fig. 3.4). This indicates a proportional
reduction in C decomposition driven by increases in soil PyOM addition rates.
Enzymatic activity
There was no significant effect of PyOM rates, CS or their interaction for dehydrogenase (Fig.
3.5A). For FDA, there was a significant (P<0.01) effect of the CS only (Fig. 3.5B). The FDA
activity was higher at the end of the 1st CS, compared to the 4th CS. No significant effects of
PyOM or the PyOM x CS interaction were observed.

Biochar decomposition under field conditions
45
Figure 3.2. Soil organic carbon (SOC) and pyrogenic carbon (PyC) stocks at 1st and 4th cropping
seasons in soil amended with different rates of pyrogenic organic matter (PyOM). Vertical bars are
standard error of the mean (n=4).
Figure 3.3. Relative decomposition rate (-k) between the 1st and 4th cropping cycle of soil organic
carbon (SOC) and pyrogenic carbon (PyC) in soils amended with different rates of pyrogenic organic
matter (PyOM). Vertical bars are standard error of the mean (n=4).

Chapter 3
46
3.4 Discussion
Pyrogenic C decomposition
We have shown that locally produced PyOM decomposes faster than native SOC under field
conditions in the first one and a half year after application (Fig. 3.2). So locally produced PyOM
may be less recalcitrant than usually proposed (Lehmann et al., 2006). Pyrogenic organic matter
produced in traditional kilns are commonly assumed to be as stable as those produced under
optimal conditions in laboratory (Lehmann et al., 2006). When PyOM-soil mixtures were
incubated under laboratory conditions, PyOM has shown to lose between 0.25 (Farrell et al.,
2013) to 2.8% (Zavalloni et al., 2011) of its total C within weeks or months. However, locally
produced PyOM evaluated under field conditions in our study lost between 25 to 60% of the
total PyOM within one and a half year, depending on the amount of PyOM applied (Fig. 3.3),
a loss much higher than 10 to 20% within 5-10 years as proposed by Lehmann et al., (2006).
Faster PyOM decomposition rates compared to native SOC is consistent with the claim that
labile fractions of newly applied PyOM are preferentially decomposed, rather than native SOC
(Cross and Sohi, 2011). After one and a half year, soils with higher application rates of PyOM
decompose slower (Fig. 3.4), indicating that labile compounds are responsible for high initial
loss of PyC.
Figure 3.4. Relative CO2 flux from soils amended with different rates of pyrogenic organic matter
(PyOM) one year after application. Vertical bars represent the standard error of the mean (n= 4).
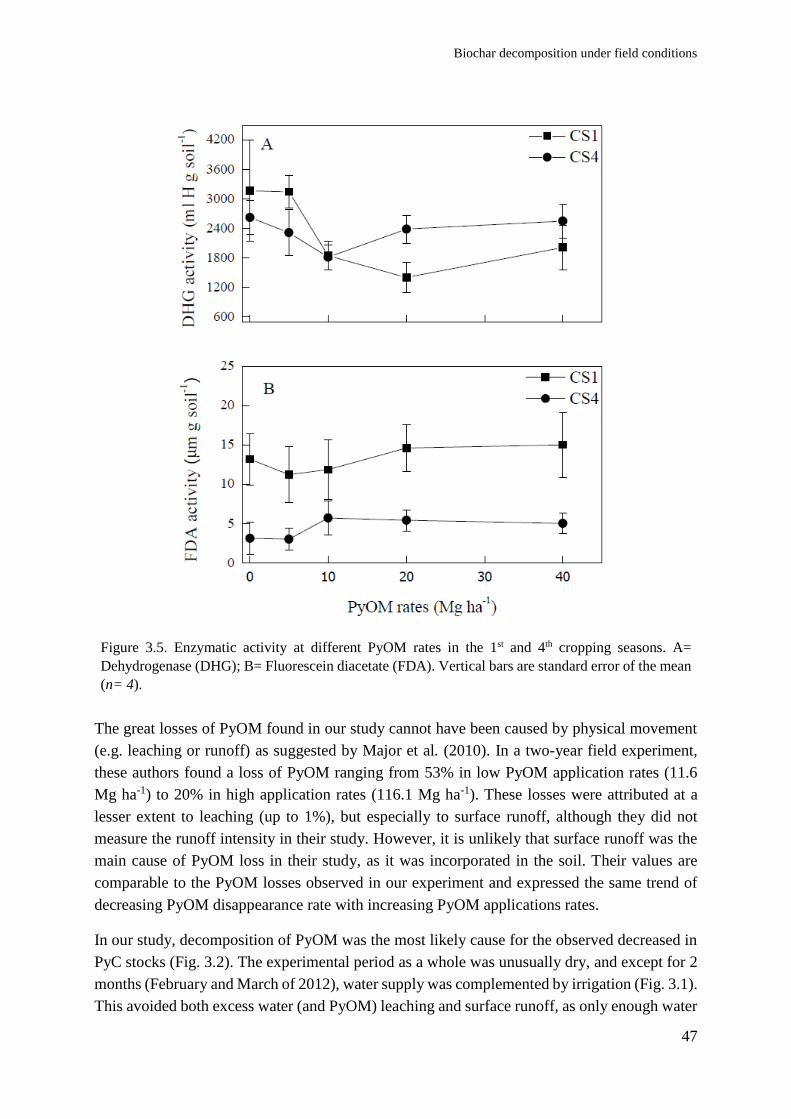
Biochar decomposition under field conditions
47
The great losses of PyOM found in our study cannot have been caused by physical movement
(e.g. leaching or runoff) as suggested by Major et al. (2010). In a two-year field experiment,
these authors found a loss of PyOM ranging from 53% in low PyOM application rates (11.6
Mg ha-1) to 20% in high application rates (116.1 Mg ha-1). These losses were attributed at a
lesser extent to leaching (up to 1%), but especially to surface runoff, although they did not
measure the runoff intensity in their study. However, it is unlikely that surface runoff was the
main cause of PyOM loss in their study, as it was incorporated in the soil. Their values are
comparable to the PyOM losses observed in our experiment and expressed the same trend of
decreasing PyOM disappearance rate with increasing PyOM applications rates.
In our study, decomposition of PyOM was the most likely cause for the observed decreased in
PyC stocks (Fig. 3.2). The experimental period as a whole was unusually dry, and except for 2
months (February and March of 2012), water supply was complemented by irrigation (Fig. 3.1).
This avoided both excess water (and PyOM) leaching and surface runoff, as only enough water
Figure 3.5. Enzymatic activity at different PyOM rates in the 1st and 4th cropping seasons. A=
Dehydrogenase (DHG); B= Fluorescein diacetate (FDA). Vertical bars are standard error of the mean
(n= 4).
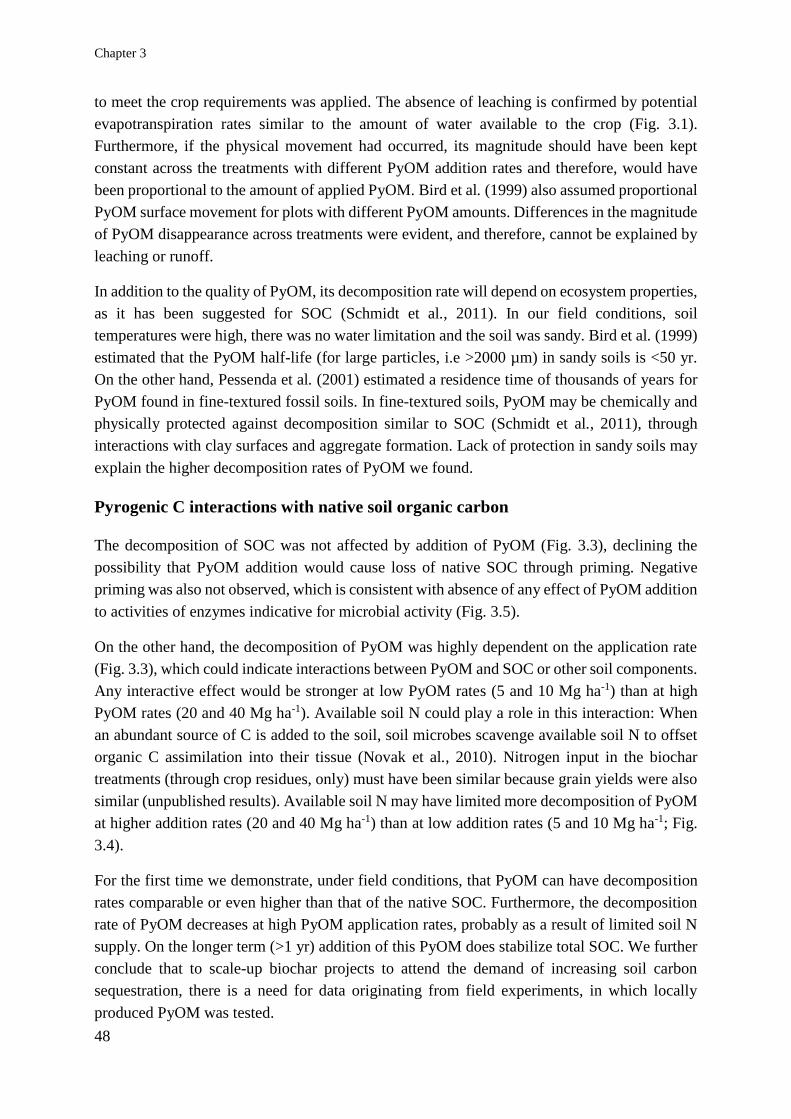
Chapter 3
48
to meet the crop requirements was applied. The absence of leaching is confirmed by potential
evapotranspiration rates similar to the amount of water available to the crop (Fig. 3.1).
Furthermore, if the physical movement had occurred, its magnitude should have been kept
constant across the treatments with different PyOM addition rates and therefore, would have
been proportional to the amount of applied PyOM. Bird et al. (1999) also assumed proportional
PyOM surface movement for plots with different PyOM amounts. Differences in the magnitude
of PyOM disappearance across treatments were evident, and therefore, cannot be explained by
leaching or runoff.
In addition to the quality of PyOM, its decomposition rate will depend on ecosystem properties,
as it has been suggested for SOC (Schmidt et al., 2011). In our field conditions, soil
temperatures were high, there was no water limitation and the soil was sandy. Bird et al. (1999)
estimated that the PyOM half-life (for large particles, i.e >2000 µm) in sandy soils is <50 yr.
On the other hand, Pessenda et al. (2001) estimated a residence time of thousands of years for
PyOM found in fine-textured fossil soils. In fine-textured soils, PyOM may be chemically and
physically protected against decomposition similar to SOC (Schmidt et al., 2011), through
interactions with clay surfaces and aggregate formation. Lack of protection in sandy soils may
explain the higher decomposition rates of PyOM we found.
Pyrogenic C interactions with native soil organic carbon
The decomposition of SOC was not affected by addition of PyOM (Fig. 3.3), declining the
possibility that PyOM addition would cause loss of native SOC through priming. Negative
priming was also not observed, which is consistent with absence of any effect of PyOM addition
to activities of enzymes indicative for microbial activity (Fig. 3.5).
On the other hand, the decomposition of PyOM was highly dependent on the application rate
(Fig. 3.3), which could indicate interactions between PyOM and SOC or other soil components.
Any interactive effect would be stronger at low PyOM rates (5 and 10 Mg ha-1) than at high
PyOM rates (20 and 40 Mg ha-1). Available soil N could play a role in this interaction: When
an abundant source of C is added to the soil, soil microbes scavenge available soil N to offset
organic C assimilation into their tissue (Novak et al., 2010). Nitrogen input in the biochar
treatments (through crop residues, only) must have been similar because grain yields were also
similar (unpublished results). Available soil N may have limited more decomposition of PyOM
at higher addition rates (20 and 40 Mg ha-1) than at low addition rates (5 and 10 Mg ha-1; Fig.
3.4).
For the first time we demonstrate, under field conditions, that PyOM can have decomposition
rates comparable or even higher than that of the native SOC. Furthermore, the decomposition
rate of PyOM decreases at high PyOM application rates, probably as a result of limited soil N
supply. On the longer term (>1 yr) addition of this PyOM does stabilize total SOC. We further
conclude that to scale-up biochar projects to attend the demand of increasing soil carbon
sequestration, there is a need for data originating from field experiments, in which locally
produced PyOM was tested.

Chapter 4
Mechanisms affecting mycorrhizal dynamics in soils amended with
pyrogenic organic matter
Edvaldo Sagrilo, Ellis Hoffland, Thomas W. Kuyper

Chapter 4
50
Abstract
Amending soils with pyrogenic organic matter (PyOM), also named biochar, can stimulate
arbuscular mycorrhizal fungal (AMF) activity and increase soil nutrient availability, especially
P. However, most studies do not consider temporal changes in AMF associations and nutrient
status of PyOM-amended soils. We tested the effects of PyOM rates and P fertilization on
soybean root colonization by AMF, soil P and plant performance over four cropping cycles
(CC) under field conditions. Soybean was cultivated in a sandy Ferralsol amended with 0, 5,
10, 20 and 40 Mg ha-1 of PyOM, with and without mineral P fertilization. Soybean plant
material and rhizosphere soil were sampled at initial flowering at 1st and 4th CC (CC1 and CC4).
Analysis of variance showed a major effect of cropping cycle and P on mycorrhizal
colonization. The interaction PyOM x cropping cycle was also a significant source of variation.
We observed a linear decrease in root colonization by AMF in CC1 with increasing PyOM rates
in contrast to a consistent linear increase in CC4. Plant performance was mainly affected by
CC, and significant interactions P x CC were observed for shoot biomass and PyOM × P for
grain yield. Grain yield was highest at high PyOM rates (20 and 40 Mg ha-1), in the P-fertilized
treatments in CC4. Soil pH increased in CC1 with increasing PyOM rates, but no effects were
observed in CC4. Path analysis indicated that PyOM effects on root colonization by AMF were
not mediated by changes in soil pH or P content. Our data are consistent with the hypothesis
that interference of PyOM in signalling processes is an important driver of change in AMF
activity and that positive effects of PyOM on AMF and crop yield develop with time.

PyOM & mycorrhizal dynamics
51
4.1 Introduction
Pyrogenic organic matter (PyOM), also known as biochar, is the product of thermal
transformation of organic materials under limited oxygen supply (Lehmann and Joseph, 2009).
It is characterized by a high C content (often more than 65%) with aromatic compounds that
are relatively stable in soil (Glaser et al., 2000; Novotny et al., 2009). Soil amendment with
PyOM in agricultural systems can ameliorate soil fertility, increase plant production (Jeffery et
al., 2011), stimulate microbial populations in bulk and rhizosphere soil, including mutualistic
root symbionts such as rhizobia (Rondon et al., 2007; Mia et al., 2014; See also Chapter 5) and
arbuscular mycorrhizal fungi (AMF) (Ohsowski et al., 2012).
The interest in PyOM as a means to improve symbiotic relationships between plants and AMF
was first reported in Japanese studies (Saito, 1989, Ishii and Kadoya, 1994). More recently,
several studies have confirmed the positive effects of PyOM on root colonization by AMF,
although mixed and negative effects have also been reported (Tab. 4.1). Changes in root
colonization by AMF in PyOM-amended soils do not necessarily result in a similar pattern in
terms of plant performance (Tab. 4.1). Mechanistic explanations for PyOM effects on
mycorrhizal functioning have remained elusive. Warnock et al. (2007) listed four possible
mechanisms for changes in mycorrhizal functioning in PyOM-amended soils: 1) alteration of
soil physicochemical properties which can lead to modifications in nutrient availability.
Nutrient availability can be improved directly by PyOM additions or through changes in soil
properties as pH or cation exchange capacity, thus indirectly affecting AMF; 2) alteration of
the activity of other micro-organisms that have effects on AMF activity. Such micro-organisms
(e.g. mycorrhization helper bacteria) can facilitate growth of fungal hyphae and root
colonization by AM fungi; 3) alteration of the signalling dynamics between plants and
mycorrhizal fungi or detoxification of allelochemicals on PyOM surface. PyOM can serve as
signal reservoir or as a sink, both for signalling compounds and for inhibitory compounds, and;
4) PyOM can serve as refuge for colonizing fungi providing physical protection of AMF against
fungal grazers. Tab. 4.1 summarizes studies with PyOM, its effects on root colonization by
AMF and on plant performance and mechanisms proposed to explain such changes.
In spite of the efforts to find a mechanistic explanation, the direct or indirect pathways through
which PyOM affects AMF and plant performance were not analysed in these studies. In this
regard, path analysis (Mitchell, 1993) can represent a suitable tool to test hypotheses associated
to specific mechanisms. Path analysis is a statistical method that involves multiple regression
analysis for modelling the correlation structure among exogenous and endogenous variables,
from an a priori established conceptual model (path diagrams). For each connecting path
between variables, a path coefficient can be calculated allowing quantification of direct and
indirect effects of one variable on another (Mitchell, 1993). Therefore, such approach can be
useful for excluding or confirming mechanisms associated to direct and/or mediated effects of
PyOM on AMF and plant performance.

Chapter 4
52
Changes in soil pH following PyOM applications putatively play an important role in the extent
of AMF root colonization. Soil pH controls the availability of several nutrients in the soil (e.g.
phosphorus), which may affect the development of AMF (Warnock et al., 2007). A positive
correlation between soil pH (original soil pH of 6.4) and concentrations of a PLFA specific for
AMF in a PyOM-amended soil found by Ameloot et al. (2013) suggests that the increase in
AMF biomass would be a consequence of liming potential of the PyOM. Decreases in
mycorrhizal abundance (external hyphal length and root colonization) have been observed with
higher P availability in soil (Gryndler et al., 2006). In its turn, P availability could be increased
by PyOM through soil pH change (Warnock et al., 2007; Lehmann et al., 2011) or by direct
additions of P together with PyOM (Lehmann et al., 2003).
Changes in soil pH following PyOM additions seem to be transient (Jones et al., 2012),
especially because the major driver of soil pH increases is ash (Stewart et al., 2013; Jeffery et
al., 2013) that is added to soil together with the PyOM and leaches easily. On the other hand,
effects of PyOM on soil P availability that lasted more than one or a few cropping cycles
indicate that other mechanisms could be involved. Pyrogenic organic matter from different
feedstock varies in P content (Warnock et al., 2010), which can affect soil P availability and
AMF performance.
Table 4.1. Summary of PyOM and hydrochar* effects on root colonization by AMF and plant
performance.
Author Experiment
duration
(weeks)
AMF
colonization
P
uptake
Plant
shoot
Plant
root
Grain
yield
Mechanisms
proposed**
Ishii and Kadoya (1994) 24 I I I I NA 1, 3
Ezawa et al. (2002) 6 I NA I NA NA 1
Matsubara et al. (2002) 22 I NA NA I NA 1
Yamato et al. (2006) 12 I NA NA I I 1
Rondon et al., 2007 11 NE I I/D D I NA
Blackwell et al. (2010) 20 I/D NA NA NA I/D NA
Solaiman et al. (2010) 10 I NE NA I I NA
Habte and Antal (2010) 11-15 D/NE NE NE NA NA 1, 3
Warnock et al. (2010) 4 D/NE NA NE NA NA 1, 3
Elmer and Pignatello
(2011)
12 I NA NA I NA 1, 2
Rillig et al., 2010† 5-8 I/D NA D D NA 1, 3, 4
George et al., 2012† 12 D NA NE NE NA 1
Salem et al., 2013† 16 I NA I/D I/D NA 1, 4
LeCroy et al., 2013 4 I NA D D NA 3
Quilliam et al., 2013†† 156 NE NE NE NA NA NA
* Produced by hydrothermal carbonization (in this method biomass is suspended in water and heated under slightly
acidic conditions in a pressure reactor at temperatures of around 200◦C; George et al., 2012); ** According to
Warnock et al. (2007); alteration of 1) soil physicochemical properties; 2) activities of other microorganisms;
3)signalling or detoxification or 4) providing physical protection.
† Studies with hydrochar; †† Study with re-application of PyOM after three years.
I – Increase; D – Decrease; NE – No effect; NA – Non-assessed.

PyOM & mycorrhizal dynamics
53
In spite of PyOM effects on root colonization by AMF and plant performance, the ways PyOM
affects mycorrhizal associations still represent a scientific challenge (Lehmann et al., 2011). In
this study we aimed to address the effects of PyOM on root colonization by AMF and on
soybean performance over four cropping cycles (CC). Our goal was to explore the major
mechanisms controlling AMF activity and crop yield in PyOM-amended soils under
realistic/practical management conditions, through use of path analysis.
4.2 Material and methods
Study site
An experiment was carried out at the field station of Embrapa Mid-North in Parnaiba (UEP-
Parnaiba), Brazil (3o05’18’’S; 41o47’00’’W; 52 m altitude). According to Köppen classification
regional climate is Aw’ type (tropical with a dry season). Local annual mean temperature is 27 oC, mean precipitation is 1,079 mm and air moisture is 76.5% (Andrade Junior et al., 2005).
Crops are generally planted in February-March and are harvested in June or July. The soil is a
Ferralsol (Oxisol in the USDA Soil Taxonomy), overlaid by around 40 cm of sand, where most
plant roots grow. Soil chemical characteristics at 0-20 cm layer were determined according to
Embrapa (1997): organic carbon= 6.6 g kg-1; pH (H2O1:2.5)= 5.9; K= 0.07 cmolc kg-1; Ca= 2.0
cmolc kg-1; Mg= 0.94 cmolc kg-1; Na= 0.01 cmolc kg-1; Al= 0.03 cmolc kg-1; H+Al= 2.08 cmolc
kg-1; sum of bases= 3.01; CEC= 5.09 cmolc dm-3; base saturation= 59.1%; Al saturation= 0.99
%. Micronutrients have not been assessed. Soil phosphorus content (Mehlich 1) was high at the
beginning of the experiment (33.4 mg kg-1). The textural distribution of the topsoil revealed
886 g kg-1 of sand and 86 g kg-1 of clay dominated by kaolinite (1:1). The native vegetation was
a Caatinga-coastal phase (Melo et al., 2004). From 1995 to 2007 an experiment with tropical
grass species was executed on the same field. From 2007 to the beginning of this experiment
(September of 2011), the field remained under fallow, with grass-dominated spontaneous
vegetation, which was cut once per year and the residues maintained on soil surface.
In early September of 2011, the soil was harrowed twice with a heavy harrow. Experimental
plots 2.0 m width and 3.0 m long were established allowing sprinklers lines between blocks 1-
2 and 3-4. Additional sprinklers lines were maintained at each side of the experimental area.
Excess of grass residues at the plots were removed from the top 10 cm with hoes and rake in
order to facilitate the PyOM mixing with soil and opening of furrows for planting.
Experimental design and characteristics of treatments
Plots with five rates of PyOM (0, 5, 10, 20 and 40 Mg ha-1), with and without P fertilization
were evaluated in a randomized complete blocks design, in a factorial scheme of 5 x 2 with four
replications. The PyOM was derived from nearby-growing woody vegetation and produced
under slow pyrolysis in traditional kilns at a temperature of 500oC (Tab. 4.2). Chemical
characteristics of the PyOM (pH, Ca, Mg, Al, H+Al, P, K, Cu, Zn, Fe, Mn and oxidizable C)

Chapter 4
54
were measured according to the same methods applied to soil chemical analysis (Embrapa,
1997). NO3- and NH4
+ were extracted with 1 M KCl followed by flow injection analysis (Tyson,
1985), using the colorimetric methods reaction of Berthelot for NH4+ and Griess reaction for
NO3-. Total C and N were analyzed by dry combustion with an elemental analyzer (PerkinElmer
CHNS/O 2400 Series II configured with the CHN mode), using helium as carrier gas (Nelson
and Sommers, 1996).
Prior to its application, PyOM was crushed into small pieces, in order to pass through a 2 mm
sieve. Pyrogenic organic matter was applied to the soil in early September. During its
application, plastic canvases were used as barriers to prevent wind dispersion. Pyrogenic
organic matter was immediately incorporated in the top 10 cm of soil with hoes prior to soybean
sowing.
Seeds of soybean (Glycine max (L.) Merr.) cultivar BRS-Tracajá, which is recommended for
soils with a high fertility status, were planted at a density of 14 plants m-1, in five rows spaced
0.40 m from each other. Plots were 2.0 m spaced from each other. Soybean sowing took place
at each 4-month interval, in four successive CC, which was made possible by irrigation. The
year of 2012 was unusually dry, with total rainfall of 625 mm - much lower than the average of
1,079 mm for the region - and for this reason irrigation took place regularly, even during the
rainy season, except in February and March (Fig. 4.1).
Fertilization and seed inoculation
Phosphorus fertilization rate was defined based on soil chemical status and following
recommendations for soybean cropping at Brazilian low latitudes (Sfredo, 2008). Treatments
subjected to P fertilization received 20 kg ha-1 of P for each expected 1000 kg of grains yielded.
We expected a 3000 kg ha-1 of grain yield and therefore, 60 kg ha-1 of P was applied as single
superphosphate before each cropping cycle (CC).
Potassium chloride (KCl) was applied to all plots at a rate of 20 kg ha-1 of K during sowing.
Additionally, a basal fertilization with 40 kg ha-1 of K was performed 30 days after plant
emergence. In CC3 and CC4, 50 kg ha-1 of a mixture of macro- and micronutrients (Ca= 7.1%;
S= 5.7%; Bo= 1.8%; Cu= 0.8%; Mn= 2.0%; Mo= 0.1%; Zn= 9.0%) was applied to all plots at
sowing, in accordance with current common management for intensive soybean production in
Brazil (Sfredo, 2008). Fertilizers were applied in the sowing furrows and covered with a thin
Table 4.2. Chemical properties of the PyOM applied to the experimental site.
...... pH ...... Ca Mg Al H+Al P(Melich 1) Exchangeable K Cu
H2O KCl(1M) ......................... g kg-1 ......................... ........................ mg kg-1 .......................
7.2 6.15 1.86 0.37 0 0 126.5 1547 0.39
Zn Fe Mn Ctot Ntot NH4+ NO3
- EC*
................ mg kg-1 ................ ..............% ............... ........... mg kg-1 ........... µs cm-1
2.94 25.20 4.50 74.3 1.18 17.4 0 3573 * EC= Electrical conductivity

PyOM & mycorrhizal dynamics
55
layer of soil prior to sowing. Basal fertilization with K was applied on the soil surface close to
the planting rows. Seeds of soybean were inoculated with the Bradyrhizobium japonicum
strains SEMIA-5079 and SEMIA-5080 (RELARE, 1995) at a rate of 150 ml[6x10⁹ cells ml-1]
50 kg-1 of seed, using the commercial inoculant Rizoliq-Top™ (Rizobacter do Brasil).
Plant and soil sampling
At stage R1 (initial flowering) of each CC, three soybean plants from the centre of each field
plot were removed from the soil with intact roots. For this purpose, 20 x 20 x 20 cm3 monoliths
were removed with a shovel. Plants were clipped at soil surface level and stored in plastic bags.
Soil was carefully removed from the roots. Roots were cleaned and cut into 2.0 cm pieces with
a scissor and stored in 100 ml plastic pots containing a solution of ethanol 50% for subsequent
analysis of AMF colonization. Shoot samples were brought to the laboratory and oven-dried in
paper bags at 65oC for 48 h and weighed. Shoots were ground to pass through a 1.0 mm screen
and stored in plastic pots for further chemical analyses.
At plant maturity, soybean pods were harvested from two 2.0-m-long rows (1.6 m2) from the
centre of each plot. The pods were oven-dried at 65oC for 48 h, threshed manually and weighed.
Total grain yield per hectare was calculated for each treatment on a 13% moisture basis. After
harvest of plants in CC1 and CC4, soil samples were collected from the 0-10 cm layer with an
auger. From the three central planting lines within each plot, 12 soil sub-samples were collected
and mixed to form a composite sample for each treatment plot. These samples were transported
to the laboratory in thermic boxes with ice, sieved through a 2.0 mm screen and separated into
Figure 4.1. Monthly temperatures (minimum, maximum and average) and total monthly precipitation
from rainfall and irrigation during the experimental period. ∆ indicates the sowing events; ▲ indicates
the harvest events. * indicates the sowing of CC1; ** indicates the sowing of CC4.
∆* ▲∆ ▲∆ ▲∆** ▲
2011 2012 2013

Chapter 4
56
two 300 g-aliquots. One aliquot of each sample was placed in plastic bags and immediately
stored at 4 oC for analysis of phosphatase. The other was air-dried and stored at room
temperature prior to chemical analyses.
AMF colonization
Soybean roots were washed in cold tap water and cleared using 2.5% KOH in an autoclave at
90oC for 30 min (Koske and Gemma, 1989). Roots were stained with methyl blue (Grace and
Stribley, 1991). The percentage of root length colonized was evaluated by the slide intersect
method (Giovannetti and Mosse, 1980). For this purpose, 99 fields of view were observed for
each sample (33 root segments) in a microscope at 200x magnification, and the number of views
in which hyphae, vesicles or arbuscules were present was recorded and converted into
percentage.
Plant and soil chemical analyses
Soybean shoot P content of samples was determined by spectrophotometry with molybdenum-
blue technique (Murphy and Riley, 1962).
Air-dried soil samples were ground and passed through a 0.21-mm sieve. Soil pH was estimated
in water (1:2.5 v:v) and measured by potentiometry (Tedesco et al., 1995). Phosphorus
fractionation was carried out according to a procedure modified by Kelly et al. (1983). Briefly,
the soil was initially treated with a 1 M NH4Cl solution for 30 min and shaken, for the extraction
of easily-available, soluble inorganic P. Thereafter, the soil material was centrifuged and the
supernatant was separated. A neutral 0.5 M NH4F solution (pH 7.0 adjusted with NH4OH) was
added to the soil. The mixture was shaken for 1 h, centrifuged and P-Al in the supernatant
determined. After double washing with a NaCl saturated solution to eliminate excess NH4F, a
0.1 M NaOH solution was added, and the washed sample shaken for 17 h. The solution was
acidified with a few drops of concentrated H2SO4 until the humic and fulvic acids flocculated,
and then centrifuged. An aliquot was collected to determine P-Fe. After washing with saturated
NaCl and adding a 0.25 M H2SO4 solution, P-Ca was determined.
Acid phosphatase activity
The procedure of Tabatabai and Bremner (1969) was followed for the assay of acid
phosphatases (phosphate mono-esterase; EC 3.1.3), using modified universal buffer (MUB; pH
6.5) and 0.25 ml of toluene, respectively, with p-nitrophenol phosphate (p-NPP) as the
substrate, after reaction for 30 min at 37°C in closed 50 mL erlenmeyers. Phosphatase activity
is expressed as the amount of enzyme required to hydrolyse 1.0 mg of p-NPP h-1 at 37°C.

PyOM & mycorrhizal dynamics
57
Statistical analyses
Statistical analyses were conducted using SAS 9.2 (SAS Institute, 2009). After the requirements
for normality and variance homogeneity were met, the effects of PyOM rates, P fertilization,
CC and their interactions were analysed using a triple factorial approach (three-way ANOVA;
P<0.05). When significant effects for PyOM rates were found, regression models were fitted
to the data where appropriate, otherwise data were explained by the post hoc LSD test.
Differences between treatments with P fertilization and CC were discriminated by F test.
Additionally, structural equation models (path analysis) were applied to a priori established
conceptual models (path diagrams) of hypothesized relationships linking the exogenous
variables (PyOM and P fertilization) and endogenous measured variables within each CC (soil
P, soil pH and AMF root colonization) (Mitchell, 1993). The aim was to explore the direct and
indirect effects of the variables on AMF root colonization. The same procedure was repeated
but (i) with AMF root colonization being replaced by crop yield and (ii) including both AMF
and crop yield in the same diagram within each CC. However, for that model pH had to be
excluded from the diagram because a complete diagram would not comply with the need to
have a minimum of 10 times as many observations as variables (Harris, 2001; Stevens, 1996).
The significance level of the P values for the path coefficients in each diagram was adjusted
through a Sequential Bonferroni Procedure, allowing for multiple tests (Holm, 1979). We tested
absolute fit of our models using the maximum likelihood 2 goodness-of-fit test and Jöreskog’s
goodness-of-fit index (GFI) (Hayduk, 1987), using PROC CALIS in SAS. In these 2 tests,
contrary to most statistical tests, high P-values (i.e. P-values >0.05) are considered a desirable
fit.
4.3 Results
Root colonization by AMF
Root colonization by AMF was not significantly affected by CC and PyOM. However, there
was a significant effect of P fertilization (P= 0.04) and for the PyOM x CC interaction
(P<0.001) (Tab. 4.3). On average (for CC1 and CC4), P fertilization reduced root colonization
from 41% (control without P) to 37% (Tab. 4.4).
In CC1, fractional root colonization by AMF linearly declined with increasing PyOM amounts
from 48% in the control to 29% in the treatment of 40 Mg PyOM ha-1 (Fig. 4.2A). In contrast,
PyOM application caused a significant linear increase in AMF root colonization in CC4, with
values ranging, on average, from 32% in the treatments without PyOM, to 50% in the treatment
with 40 Mg ha-1 of PyOM (Fig. 4.2B).

Chapter 4
58
Shoot P content
Cropping cycle and P fertilization were significant sources of variation in shoot P content. In
CC1, average shoot P content was 3.3 mg g-1. In CC4, average shoot P content decreased to 2.2
mg g-1 (Tab. 4.5). Phosphorus fertilization significantly increased soybean shoot P content to
3.2 mg kg-1, compared to treatments without P fertilization (2.3 mg kg-1) (Tab. 4.4).
Plant performance
Shoot dry mass and grain yield were significantly affected by CC and were higher in CC4 than
in CC1. There was a significant P x CC interaction for shoot dry mass (Tab. 4.3). Fertilization
with P decreased plant dry mass in CC1, but no effects were evident in CC4 (Fig. 4.3; see also
Chapter 5). A significant PyOM x P interaction was observed for soybean grain yield (Tab.
4.3).
Table 4.3. ANOVA outputs (P-values) for the main and interactive effects of PyOM, P fertilization and
cropping cycle for measured variables.
Measured
Variables
Source of variation
Cropping
cycle (CC)
PyOM P fertilizer
(P)
PyOM x
CC
PyOM x
P
P x
CC
PyOM x P
x CC
Root colonization (%) 0.71 0.76 0.04* <0.001* 0.88 0.75 0.11
Shoot P (%) <0.001* 0.09 <0.001* 0.25 0.57 0.49 0.13
Shoot dry mass (kg ha-1) † <0.001* 0.76 0.21 0.41 0.22 0.02 0.37
Grain yield (kg ha-1) <0.001* 0.22 0.06 0.34 0.01* 0.58 0.13
Soil pH <0.001* <0.001* 0.02* <0.001* 0.34 0.17 0.96
Soil P content (mg kg-1) 0.01* 0.85 <0.001* 0.05* 0.78 0.42 0.03*
Soil P-Al (mg kg-1) 0.12 0.79 <0.001* 0.67 0.72 0.27 0.36
Soil P-Fe (mg kg-1) <0.001* 0.24 0.35 0.51 0.51 0.93 0.47
Soil P-Ca (mg kg-1) <0.001* 0.41 0.31 0.19 0.21 0.01* 0.24
Acid phosphatase (mg p-NPP
kg soil-1 h-1) ††
0.10
0.15
0.51
* Significant at P<0.05; †= Discussed in detail in Chapter 5; †† Analyses performed only in CC4.
Table 4.4. Mean values and standard errors (n= 40) of plant and soil variables as affected by P
fertilization. Values refer to averages across treatments with different PyOM addition rates in the first
and fourth cropping cycle.
P fertilization Root colonization
(%)
Shoot P
(mg g-1)
Soil pH Soil P-Al
(mg kg-1)
No-P 40.5 +1.8 a 2.3 +0.1 b 6.46 +0.1 a 10.7 +0.1 b
P 36.5 +1.8 b 3.2 +0.1 a 6.34 +0.1 b 16.6 +0.1 a
Means followed by the same letters in columns do not differ significantly (P<0.05).

PyOM & mycorrhizal dynamics
59
No significant effect of PyOM or P fertilization on grain yield was recorded in CC1 (Fig. 4.4).
In CC4, however there was a significant increase in grain yield at P-fertilized treatments, with
increasing PyOM addition rates. Crop grain yield varied from 2.0 Mg ha-1 at the non-PyOM
treatment, to 3.0 Mg ha-1 at 20 Mg ha-1 of PyOM. No further significant increase was observed
at 40 Mg ha-1 (2.5 Mg ha-1. A significantly higher crop yield in the P-fertilized treatments
compared to the non P-fertilized was evident only at 20 and 40 Mg ha-1 of PyOM.
Figure 4.2. Root colonization by arbuscular mycorrhizal fungi in the first (A) and fourth (B) cropping
cycle. Error bars indicate standard errors (n = 8).
y = -0.47x + 45.18
r² = 0.86; P<0.001
25
30
35
40
45
50
55
60
0 10 20 30 40
Ro
ot
colo
niz
ati
on
by
AM
F (
%) A
y = 0.48x + 31.64
r² = 0.85; P<0.001
25
30
35
40
45
50
55
60
0 10 20 30 40
Ro
ot
colo
niz
ati
on
by
AM
F (
%)
PyOM rates (Mg ha-1)
B
Table 4.5. Mean values and standard errors (n= 40) of plant and soil variables as affected by the cropping
cycle. Values refer to averages across treatments with different PyOM addition rates and P fertilization.
Cropping
cycle
Shoot P
(mg g-1)
Grain yield
(kg ha-1)
Soil P content (Melich-1)
(mg kg-1)
Soil P-Fe
(mg kg-1)
CC1 3.3 +0.2 a 1.5 +0.08 b 24.8 +2.2 a 17.2 +1.1 a
CC4 2.2 +0.1 b 2.2 +0.09 a 20.5 +2.3 b 11.7 +0.4 b
Means followed by the same letter in columns do not differ significantly (F-test; P<0.05).

Chapter 4
60
Figure 4.4. Pyrogenic organic matter effects on soybean grain yield after the first cropping cycle (A)
and PyOM x P interaction for soybean grain yield after the fourth cropping cycle (B). Different letters
on the top of grey bars indicate significant differences among PyOM addition rates within P-fertilized
treatments in the first cropping cycle. * indicates significant differences between P fertilized and non P-
fertilized treatments within PyOM rates. Error bars indicate standard errors (n= 4).
Figure 4.3. Means of shoot dry mass as affected by the interaction Cropping cycle x P fertilization.
Different lowercase letters on the top of opened bars and uppercase letters on the top of grey bars
indicate significant differences between CC at P-fertilized and non P-fertilized treatments,
respectively. * indicates significant differences between treatments with P fertilizer, within each CC.
Error bars indicate standard errors (n = 20).
0.0
0.5
1.0
1.5
2.0
2.5
CC1 CC4
Sh
oot
dry
mass
(M
g h
a-1
)
Cropping cycle
No-P
P
B
aA*
b

PyOM & mycorrhizal dynamics
61
Soil pH
Soil pH was significantly affected by CC, PyOM, P fertilizer and by the PyOM x CC interaction
(Tab. 4.3). In general, soil pH increased with CC, but decreased with P fertilization. In CC1,
there was a consistent linear increase in soil pH with increasing rates of PyOM addition (Fig.
4.5). The averages ranged from 5.9 to 6.6. The effect was transient and after CC4 soil pH no
longer varied among PyOM addition rates. Fertilization with P reduced soil pH slightly but
significantly. Average soil pH ranged from 6.5 at non P-fertilized treatments, to 6.3 in P-
fertilized treatments (Tab. 4.4).
Soil P pools
Soil P content was significantly affected by CC, P fertilization, PyOM x CC and by the PyOM
x P x CC interaction (Tab. 4.3). Average P content decreased from CC1 to CC4, but increased
with P fertilization. In CC1, no effects of PyOM were observed for soil P content in the
treatments without P fertilization (Fig. 4.6). A significant increase in soil P availability was
observed at the P-fertilized plots, compared to those non-fertilized, within different PyOM
addition rates. No significant effects of PyOM were recorded in CC4.
Irrespective of CC or PyOM additions rates, P fertilization significantly increased the amount
of P adsorbed to aluminium (P-Al). There was a significant effect of CC on P-Fe and P-Ca
fractions and a significant P x CC interaction for P-Ca (Tab. 4.3). In general, P-Fe values
decreased from CC1 to CC4. In the treatments without P fertilization, P-Ca did not change over
the cropping cycles. However, at P-fertilized treatments P-Ca was higher in CC4, compared to
CC1 (Fig. 4.7). The amount of P-Ca in CC4 was also higher at P-fertilized treatments, compared
to the non P-fertilized treatments.
Figure 4.5. Pyrogenic organic matter effects on soil pH at the first cropping cycle. Error bars indicate
standard errors (n = 8).
y = 0.02x + 5.92
r² = 0.99; P<0.001
5,6
5,8
6,0
6,2
6,4
6,6
6,8
0 10 20 30 40
So
il p
H
PyOM rates (Mg ha-1)
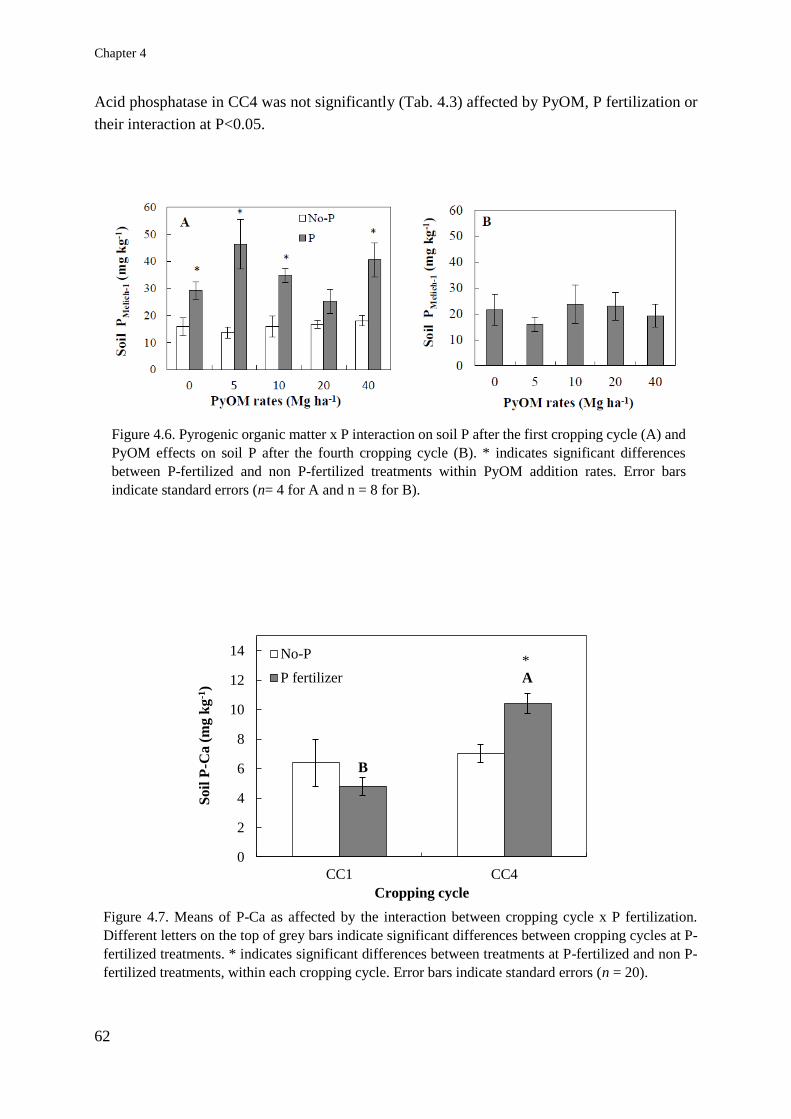
Chapter 4
62
Acid phosphatase in CC4 was not significantly (Tab. 4.3) affected by PyOM, P fertilization or
their interaction at P<0.05.
Figure 4.6. Pyrogenic organic matter x P interaction on soil P after the first cropping cycle (A) and
PyOM effects on soil P after the fourth cropping cycle (B). * indicates significant differences
between P-fertilized and non P-fertilized treatments within PyOM addition rates. Error bars
indicate standard errors (n= 4 for A and n = 8 for B).
Figure 4.7. Means of P-Ca as affected by the interaction between cropping cycle x P fertilization.
Different letters on the top of grey bars indicate significant differences between cropping cycles at P-
fertilized treatments. * indicates significant differences between treatments at P-fertilized and non P-
fertilized treatments, within each cropping cycle. Error bars indicate standard errors (n = 20).
0
2
4
6
8
10
12
14
CC1 CC4
Soil
P-C
a (
mg k
g-1
)
Cropping cycle
No-P
P fertilizer
B
*
A

PyOM & mycorrhizal dynamics
63
Path analysis
All path models satisfactorily fitted the data of CC1, regarding AMF root colonization (Fig.
4.8A; 2= 0.02; DF 2= 1.0; P> 2= 0.89; GFI= 0.99), soybean grain yield (Fig. 4.8C; 2= 0.07;
DF 2= 1.0; P> 2= 0.79; GFI= 0.99) and both variables integrated in the same diagram (Fig.
4.8E; DF 2= 2.0; 2= 1.44; P2= 0.49; GFI= 0.98). The models also showed a satisfactory fit
to the data of CC4, regarding AMF root colonization (Fig. 4.8B; 2= 0.04; DF 2= 1.0; P> 2=
0.84; GFI= 0.99), soybean grain yield (Fig. 4.8D; 2= 0.04; DF 2= 1.0; P>2= 0.84; GFI=
0.99) and both variables integrated in the same diagram (Fig. 4.8F; DF 2= 2.0; 2= 62; P2=
0.73; GFI= 0.99).
In CC1 changes in AMF colonization were significantly and negatively driven directly by
PyOM applications. Soil P content was positively affected by P fertilization. In CC4 the direct
pathway from PyOM to AMF colonization became significantly positive, while the non-
significant pathway from soil P content to AMF was maintained (Fig. 4.8A and 4.8B).
Soybean grain yield was not significantly affected by PyOM or P fertilization both in CC1 and
CC4 (Fig. 4.8C and 4.8D). In the diagrams combining AMF and crop yield, the significance of
pathways correlating PyOM and AMF, P fertilization and soil P content and, in CC4, soil P and
AMF remained constant. No significant pathway correlations were observed between AMF and
crop yield (Fig. 4.8E and 4.8F).
4.4 Discussion
Our data demonstrated a significant effect of CC in most plant/AMF and soil characteristics.
Most previous studies reporting PyOM effects on root colonization by AMF are performed for
periods no longer than one cropping cycle (Tab. 4.1). This limits our ability to identify and
understand potential factors that affect interactions between plant, AMF and soil properties over
time. As PyOM is supposedly recalcitrant one would have expected small PyOM x CC
interaction effects on the studied variables. However, there was a significant effect of CC for
most variables. Furthermore, the significant PyOM x CC interaction effect on root colonization
by AMF shows that there is a temporal dynamic for this variable, which is dependent of PyOM
additions rates.
High overall crop yield in CC4 compared to CC1 can be ascribed to a differential management
over time, such as fertilization with micronutrients in CC4. Such hypothesis is reinforced by
the relatively high yield observed in CC3 (3.0 Mg ha-1; data not shown), when the same
micronutrients mixture was also applied. However, the significant PyOM x P interaction for
crop yield also indicates that PyOM exerts an effect on crop yield which depends on the P-
fertilizer management (Fig. 4.4B). These PyOM effects occur irrespective of micronutrients
addition.

Chapter 4
64
First cropping cycle Fourth cropping cycle
A
B
C
D
E
F
Figure 4.8. Path diagrams of relationships among treatment and response variables. Each arrow
indicates direct relationships. Indirect effects occur when one variable is linked to another via an
intermediate variable. Numbers above each arrow represents standardized path coefficients (partial
regression). Numbers in bold above or below dependent variables (boxes) are standardized errors. A
and B represents the effects on AMF in the first and fourth cropping cycle, respectively. C and D
represent the effects on crop yield in the first and fourth cropping cycle, respectively. E and F integrate
the effects of AMF and crop yield in the first and fourth cropping cycle, respectively. * indicates
significant pathway correlations (P<0.017 after Bonferroni correction).
Pfert
PyOM
pH
Soil P
AMF 0.06
Pfert
PyOM
pH
Soil P
AMF -0.12
Pfert
PyOM
pH
Soil P
yield -0.02
Pfert
PyOM
pH
Soil P
yield -0.12
Pfert
PyOM
AMF
Soil P
yield -0.22
Pfert
PyOM
AMF
Soil P
yield -0.26

PyOM & mycorrhizal dynamics
65
Effects on plant performance
Increased root colonization by AMF due to PyOM additions was not responsible for increases
in crop yield in CC4. The lack of significant path coefficients linking AMF to crop yield
supports this statement (Fig. 4.8E and 4.8F). Soybean grain yield was positively affected by
PyOM additions in CC4, especially in the P-fertilized plots and at high PyOM rates (20 and 40
Mg ha-1). Our data suggest that the mechanisms through which PyOM improves plant
performance may have become more relevant with time. Arbuscular mycorrhizal fungi
effectively absorbs and transfers macro and key micronutrients as zinc to plants (Lehmann et
al., 2014). The negative effect of PyOM on root colonization by AMF in CC1 may have
hampered the acquisition of micronutrients by plants. Micronutrients deficiency may have
constrained plant performance despite the adequate levels of other nutrients like P, K and N.
Adequate supply of micronutrients to the plants in CC4 was ensured by fertilization to all
treatments. High root colonization by AMF with increasing PyOM additions rates may have
further improved availability of these nutrients to the plants. Unfortunately, an eventual role of
AMF on crop yield through increased absorption of micronutrients is an indirect effect that
cannot be tested in our pathway models. Such indirect effect would explain the lack of
significant direct path coefficients linking AMF and crop yield. Other indirect effects not
considered in our study, such as improved water availability by PyOM additions also remain as
potential explanation for increased crop yield at high PyOM rates (Liu et al., 2013; Cornelissen
et al., 2013). Further research in this field of study is still necessary to confirm such hypotheses,
especially over periods of time longer than that comprised in our study.
Effects on soil P
In our study PyOM had no effects on the dynamics of P fractions associated to Al and Fe oxides
or Ca, or on acid phosphatase activity (Tab. 4.3). It is noteworthy that the soil was highly sandy
and with a low clay fraction dominated by kaolinite - in which Al oxides predominate (Melo et
al., 2002). This very low clay content (86 g kg-1) may have hampered a clear distinction of
significant PyOM effects on P fractions.
Increased shoot P content driven by P fertilization (Tab. 4.4) was not translated into higher crop
shoot dry mass and grain yield in CC1, but did on CC4. Fertilization with P also reduced shoot
dry mass in CC1. This luxury P uptake indicates that P was not a limiting factor for plant
performance at the beginning of the experiment in contrast to CC4. After micronutrients were
added in CC4, micronutrient limitation was alleviated, allowing plants to translate additional P
uptake into larger plant biomass and larger grain yield. Crop yield was enhanced in CC4 at the
highest PyOM treatments when P fertilization was included. It is possible that successive
cropping cycles led to a partial depletion of original soil P pool (measured with Melich-1) in
CC4 (9.6 mg kg-1 in the non P-fertilized treatments), and that P fertilization efficiently replaced
original soil P pool (31.8 mg kg-1 in the P-fertilized treatments).

Chapter 4
66
Effects on root colonization by arbuscular mycorrhizal fungi
Effects of PyOM on AMF across the cropping cycles were not driven by changes in pH resulting
from PyOM additions, as demonstrated by the lack of significant correlation between soil pH
and root colonization by AMF in both CCs (Fig. 4.8A and 4.8B). Pyrogenic organic matter
increased soil pH only at the CC1 (Fig. 4.5), concomitant with decreases in AMF root
colonization. However, no significant effects of PyOM on soil pH remained after four cropping
cycles (Tab. 4.3), but were evident for AMF root colonization (Fig. 4.2B). The only effect on
soil pH in CC4 was a reduction caused by P fertilization (Tab. 4.4). This decrease in soil pH at
P-fertilized treatments may have been cause by a (cumulative) residual effect of the acid
reaction to produce single superphosphate from phosphate rocks. It may also be a consequence
of the positive effect of P fertilization on BNF (see Chapter 5). N-fixing plants absorb more
cations than anions and protons are released to balance the plant’s internal pH, thus leading to
soil acidification especially in the rhizosphere (Köpke and Nemecek, 2010). The transient
nature of increased soil pH in PyOM-amended soils has been reported elsewhere (Jones et al.,
2012), and is likely a result of additions of basic cations present in the ash fraction of PyOM
(Stewart et al., 2013). In CC4 soil pH values were higher than in CC1 in the no-PyOM
treatment. Although we could not find a clear explanation for this increase, it is possible that
fertilization with (micro) nutrients before CC3 and CC4 had some impact on raising soil pH.
Pyrogenic organic matter also did not affect root colonization by AMF through changes in soil
P content, despite the considerably high concentrations of P in the PyOM (Tab. 4.2). As
commonly reported (Gryndler et al., 2006) soil P fertilization exerted a negative effect on AMF
at both cropping cycles (Tab. 4.4). However, the path coefficients shown in Fig. 4.8A and 8B
indicated that although P fertilization increased soil P availability in CC1 (P<0.001) and CC4
(P<0.001) there were no significant effects of soil P content on root colonization by AMF after
correction of P-values by conservative Bonferroni’s procedure. Moreover, path coefficients
associated with soil P content were not significantly correlated with PyOM.
The PyOM used in our study added micronutrients (Tab. 4.2) which may somehow have
contributed to decrease root colonization by AMF (Liao et al., 2003) in CC1. Fertilization with
micronutrients in CC4 may have been responsible for lower fractional colonization in the non-
PyOM treatment in CC4, compared to the non-PyOM treatment in CC1. However, adequate
supply of micronutrients in CC4 through fertilization may have neutralized any potential effect
of PyOM on supplying these nutrients. Therefore, it is likely that positive effects of PyOM on
root colonization by AMF in CC4 and the contrasting effects between CC1 and CC4 cannot be
ascribed to the supply of micronutrients by PyOM. Our data suggest, therefore, that changes in
soil chemical aspects driven by PyOM additions had a minor effect on root colonization by
AMF.
The highly significant path coefficients linking PyOM and AMF, although negative in CC1 and
positive in CC4 (Fig. 4.8A and 4.8B, respectively), suggest that a mechanism intrinsically
related to PyOM characteristics exerts a stronger role on AMF root colonization than through

PyOM & mycorrhizal dynamics
67
indirect physicochemical changes in soil properties. We propose that changes in the patterns of
adsorption and/or release of signals and chemical compounds by PyOM (Warnock et al., 2007)
provide the best explanation for these results found in our experiment. Although we did not
measure the presence of potential signalling compounds, our data provide support for the
relevance of such mechanism. Pyrogenic organic matter may, during CC1, have reduced
signalling capacity by adsorbing molecules from the soil that play a critical role in the
host/fungus signalling events that precede the establishment of symbiosis, as observed for
activated charcoal (Rutto and Mizutani, 2006). Over four cropping cycles, adsorption of
signalling molecules was reduced or completely eliminated. The most likely reasons may have
been either saturation of PyOM particles with these molecules, surface blocking with other
organic molecules (Zackrisson et al., 1996) or continuous adsorption/deactivation of other
chemical molecules that can have detrimental effects on AMF activity (Ishii and Kadoya, 1994).
Our data do not allow for testing the other major mechanisms proposed by Warnock et al.
(2007) (viz. interaction between AMF and other microorganisms and protection against fungal
grazers). However, protection against fungal grazers may also be useful to explain changes
driven by PyOM on AMF activity under certain circumstances, as AMF hyphae can grow on
PyOM surface and can access microsites within PyOM pores (Hammer et al., 2014). Pyrogenic
organic matter could, therefore, become relevant as a carrier of AMF inoculum (Lehmann et
al., 2011), as AMF progressively colonizes PyOM pores with time.
The lack of field studies over periods longer than one CC is a likely explanation for the lack of
evidence of mechanisms affecting AMF activity (Verheijen et al., 2010; Rillig et al., 2010;
Warnock et al., 2010). Our study fills in this gap and indicates that major mechanisms
controlling root colonization by AMF result in distinct effects even in relatively short time
periods (a few years).


Chapter 5
Does pyrogenic organic matter enhance biological nitrogen fixation in
well-managed soybean cropping systems?
Edvaldo Sagrilo, Ellis Hoffland, Thomas W. Kuyper
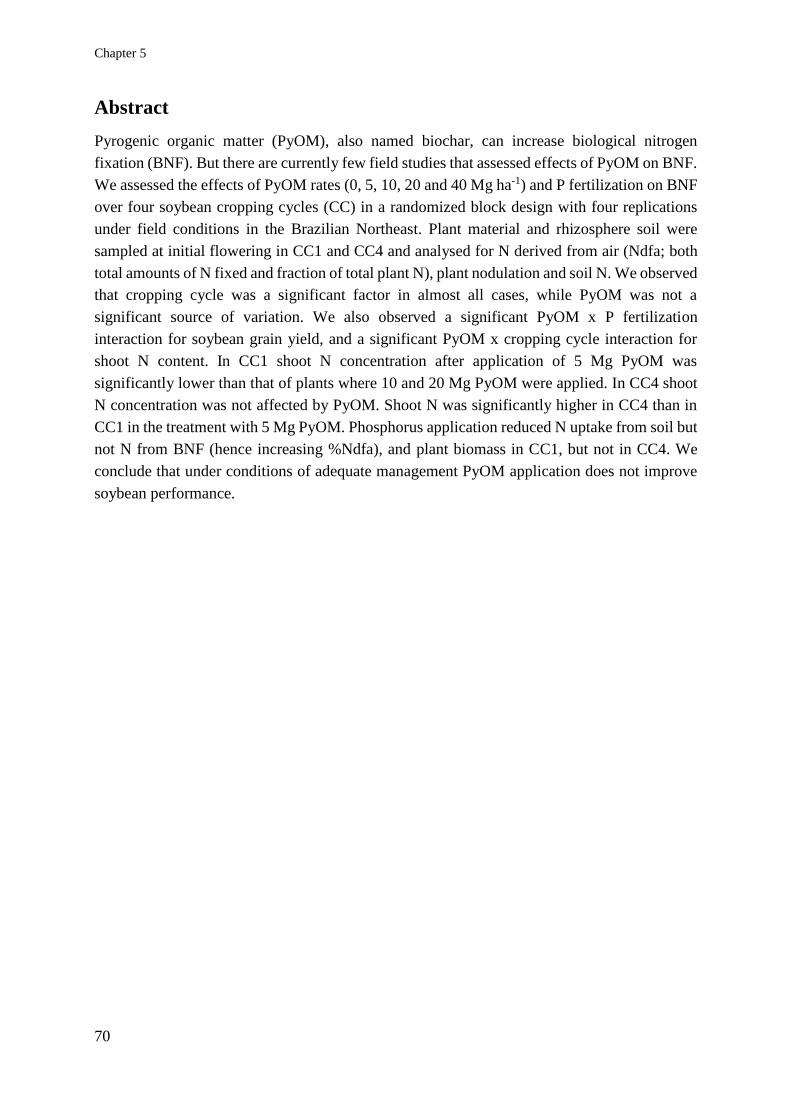
Chapter 5
70
Abstract
Pyrogenic organic matter (PyOM), also named biochar, can increase biological nitrogen
fixation (BNF). But there are currently few field studies that assessed effects of PyOM on BNF.
We assessed the effects of PyOM rates (0, 5, 10, 20 and 40 Mg ha-1) and P fertilization on BNF
over four soybean cropping cycles (CC) in a randomized block design with four replications
under field conditions in the Brazilian Northeast. Plant material and rhizosphere soil were
sampled at initial flowering in CC1 and CC4 and analysed for N derived from air (Ndfa; both
total amounts of N fixed and fraction of total plant N), plant nodulation and soil N. We observed
that cropping cycle was a significant factor in almost all cases, while PyOM was not a
significant source of variation. We also observed a significant PyOM x P fertilization
interaction for soybean grain yield, and a significant PyOM x cropping cycle interaction for
shoot N content. In CC1 shoot N concentration after application of 5 Mg PyOM was
significantly lower than that of plants where 10 and 20 Mg PyOM were applied. In CC4 shoot
N concentration was not affected by PyOM. Shoot N was significantly higher in CC4 than in
CC1 in the treatment with 5 Mg PyOM. Phosphorus application reduced N uptake from soil but
not N from BNF (hence increasing %Ndfa), and plant biomass in CC1, but not in CC4. We
conclude that under conditions of adequate management PyOM application does not improve
soybean performance.

PyOM & biological nitrogen fixation
71
5.1 Introduction
Soil amendment with pyrogenic organic matter (PyOM), also named biochar, has been
suggested as a promising option for soil carbon sequestration (Lehmann, 2007), while
simultaneously improving soil fertility (Powlson et al., 2011) and crop yield (Jeffery et al.,
2011). Pyrogenic organic matter as a soil amendment may increase crop production by
stimulating root symbioses: it positively affects root colonization by arbuscular mycorrhizal
fungi (AMF) (Yamato et al., 2006; Solaiman et al., 2010; See also Chapter 4 in this Thesis) and
biological nitrogen fixation (BNF) (Rondon et al., 2007; Mia et al., 2014).
Pyrogenic organic matter may increase plant dry mass due to quicker nodulation (Turner, 1955).
Early studies attributed higher plant production in PyOM-amended soils to increased BNF
resulting from higher nodule number and size. However, high nodule number and size may not
necessarily indicate a high effectiveness in BNF (Howieson and Ballard, 2004; Salvagiotti et
al., 2008). Increased BNF in Phaseolus vulgaris due to PyOM additions has been demonstrated
in a short-term experiment in a clay-loam soil, with the 15N isotope dilution method (Rondon
et al., 2007). The authors found that the total N derived from the atmosphere (Ndfa) through
BNF increased with PyOM additions, up to the rate of 60 g kg-1 of soil, and decreased with
higher PyOM application rates.
Adsorption of compounds toxic to N2-fixing bacteria by PyOM is suggested as one of the main
mechanisms for increased BNF in PyOM-amended soils (Vantsis and Bond, 1950; Turner,
1955; Hely et al., 1956). The adsorption by PyOM of molecules responsible for signal exchange
between plant roots and rhizobia has also been proposed in recent studies (DeLuca et al., 2009;
Verheijen et al., 2010; Atkinson et al., 2010). However, no attempts to test these hypotheses
have been made especially over longer-term periods. This would be relevant because PyOM
particles can get saturated with phenols, or can have its surface blocked with other organic
molecules (Zackrisson et al., 1996), potentially influencing PyOM effects on BNF. Changes in
nutrient availability (alleviation of nutrient limitation or reduction of excess amounts) have
been proposed as an alternative explanation. Rondon et al. (2007) suggested, without providing
data, that the higher Mo and B availability in PyOM-amended soils and, to a lesser extent,
decreased soil N availability (immobilization of N in high C:N PyOM) stimulates BNF.
Another explanation for positive effects of PyOM on BNF refers to increased P availability
after PyOM addition. Biological nitrogen fixation has a high P requirement since P is an
important element in nodule metabolism (Vance, 2001). High P content in PyOM produced
from carbonized chicken manure compared to the non-carbonized feedstock was pointed out as
the main cause of high grain yield and nodule growth of soybean (Glycine max) (Tagoe et al.,
2008). Increases in K availability through soil PyOM additions have also been suggested as
causing increases in BNF (Mia et al., 2014).
Except for one paper, studies of PyOM effects on BNF reported data from one cropping cycle
only. In the only longer-term study so far (more than two years), no evidence of PyOM effects
on clover nodule number and shoot production after three cropping cycles (CC) was found

Chapter 5
72
(Quilliam et al., 2013). However, the authors observed increased nitrogenase activity of
individual nodules in the PyOM treatments. Unfortunately, N2 fixation by BNF was not
measured. Therefore, there is a need for additional studies that include legume performance
under realistic field conditions (including regular management of soil and rhizobial inoculum)
over several cropping cycles where the amount of N fixed (through 15N stable isotope data) is
quantified. We aimed with this field study to test the effects of PyOM application rates and P
fertilization on BNF in soybean inoculated with Bradyrhizobium japonicum strains over four
cropping cycles under realistic field conditions.
5.2 Material and methods
Study site
The experimental design and site characteristics have been described before (see Chapter 3 and
4 in this thesis). The experiment was carried out at the field station of Embrapa Mid-North in
Parnaiba (UEP-Parnaiba), Brazil (3o05’18’’S; 41o47’00’’W; 52 m altitude). According to
Köppen local climate is Aw’ (tropical with a dry season). Local annual mean temperature is
27oC, mean precipitation is 1,079 mm and air moisture is 76.5% (Andrade Junior et al., 2005).
Crops are generally planted in February-March and harvested in June or July. The soil is a
Ferralsol, overlaid by a layer of around 40 cm of sand, where most plant roots grow. Soil
chemical characteristics at 0-20 cm layer were determined according to Embrapa (1997):
organic carbon= 6.6 g kg-1; pH(H2O1:2.5)= 5.9; K= 0.07 cmolc kg-1; Ca= 2.0 cmolc kg-1; Mg=
0.94 cmolc kg-1; Na= 0.01 cmolc kg-1; Al= 0.03 cmolc kg-1; H+Al= 2.08 cmolc kg-1; sum of
bases= 3.0 cmolc kg-1; CEC= 5.1 cmolc dm-3; base saturation= 59%; Al saturation= 0.99 %. Soil
phosphorus content (Mehlich 1) was high at the beginning of the experiment (33.4 mg kg-1).
The textural distribution of the topsoil revealed 886 g kg-1 of sand and 86 g kg-1 of clay
dominated by kaolinite (1:1). The native vegetation was a Caatinga-coastal phase (Melo et al.,
2004). From 1995 to 2007 an experiment with tropical C4-grass species was set up in the area.
From 2007 till the beginning of this experiment (September 2011), the area remained under
fallow, with C4-grass-dominated spontaneous vegetation, which was cut once per year and the
residues maintained on the soil surface.
In early September 2011, the soil was harrowed twice with a heavy harrow. Experimental plots
of 2.0 m width and 3.0 m long were established. The distance between blocks was 2.0 metres,
which allowed sprinkler lines between blocks 1-2 and 3-4. Additional sprinkler lines were
maintained at each side of the experimental area. Excess grass residues at the plots were
removed from the top 10 cm with hoes and rake in order to facilitate PyOM mixing with soil
and opening of furrows for planting. At first week of September, seeds of soybean cultivar
BRS-Tracajá were planted at a density of 14 plants m-1, in five rows spaced 0.40 m from each
other. Soybean sowing took place at each 4-month interval, in four successive CC made
possible by irrigation. The year of 2012 was unusually dry, with total rainfall of 625 mm (much

PyOM & biological nitrogen fixation
73
lower than the average of 1,079 mm for the region) and for this reason, even at the rainy season,
irrigation took place regularly (Fig. 5.1).
Experimental design and characteristics of treatments
Five rates of PyOM (0, 5, 10, 20 and 40 Mg ha-1) with and without P fertilization were applied
in a randomized complete block design, in a factorial 5 x 2 scheme with four replications. The
PyOM was derived from nearby-growing woody vegetation and produced under slow pyrolysis
in traditional kilns at 500oC (Tab. 5.1). Chemical characteristics of the PyOM (pH, Ca, Mg, Al,
H+Al, P, K, Cu, Zn, Fe, Mn and oxidizable C) were measured according to the same methods
applied to soil chemical analysis (Embrapa, 1997). Nitrate and NH4+ were extracted with 1 M
KCl followed by flow injection analysis (Tyson, 1985), using the colorimetric methods reaction
of Berthelot for NH4+ and Griess for NO3
-. Total C and N were analysed by the Dumas method
(Nelson and Sommers, 1996). Prior to its application, PyOM was crushed into small pieces, in
order to pass through a 2 mm sieve. During its application to the soil, plastic canvases were
used as barriers to prevent against wind dispersion. Pyrogenic organic matter was immediately
incorporated in the top 10 cm of soil with hoes prior to soybean sowing.
Fertilization and seed inoculation
Phosphorus fertilization rate was defined based on soil chemical status and following
recommendations for soybean cropping at Brazilian low latitudes (Sfredo, 2008). Treatments
subjected to P fertilization received 20 kg ha-1 of P for each expected 1000 kg of grains yielded.
We expected a 3000 kg ha-1 of grain yield and therefore, 60 kg ha-1 of P was applied as single
superphosphate at each CC immediately before sowing.
Figure 5.1. Monthly temperatures (minimum, maximum and average) and total monthly precipitation
from rainfall and irrigation during the experimental period. ∆ indicates the sowing events; ▲ indicates
the harvest events. * indicates the sowing of CC1; ** indicates the sowing of CC4.
∆* ▲∆ ▲∆ ▲∆** ▲
2011 2012 2013

Chapter 5
74
At each CC, additional K fertilization was provided to all plots as KCl at a rate of 20 kg ha-1 of
K2O at sowing and 40 kg ha-1 of K2O, 30 days after plant emergence. As part of common
practice, 50 kg ha-1 of a mixture containing macro and micronutrients (Ca= 7.1%; S= 5.7%; B=
1.8%; Cu= 0.8%; Mn= 2.0%; Mo= 0.1%; Zn= 9.0%) was applied to all plots at sowing of CC3
and CC4 to avoid possible micronutrient deficiencies commonly observed in Brazilian sandy
ferralsols, fertilizers were applied in the sowing furrows (except for basal fertilization with K)
and covered with a thin layer of soil prior to sowing.
Seeds of soybean were inoculated at each CC with the Bradyrhizobium japonicun strains
SEMIA-5079 and SEMIA-5080. These strains are recommended for the manufacture of
commercial inoculants in Brazil (Guimarães et al., 2008) and were applied at a rate of 150 ml
(6x10⁹ cells ml-1) / 50 kg of seed, using the commercial inoculant Rizoliq-Top™ (Rizobacter
do Brasil).
Plant sampling and analysis
During CC1 and CC4, three soybean plants from the centre of each field plot were removed
from the soil with intact roots at initial flowering stage (R1 stage; Ritchie et al., 1982). For this
purpose, 20 x 20 x 20cm3 monoliths were removed with a shovel. Plants were clipped at soil
surface level and stored in plastic bags. Soil was carefully removed from the roots and the
nodules were collected. Great care was taken to recover all nodules from the root system and
eventually from the soil, by slowly sieving the complete soil volume from the monoliths
through a 2 mm sieve and searching for detached nodules. Plant shoot and nodule samples were
brought to the laboratory and oven-dried separately in paper bags at 65oC for >72 h and
weighed.
We choose non-N2-fixing reference plants within the experimental area to serve as control
plants of the 15N natural abundance of plant-available soil N. We collected three plant species
during CC1 (Turnera ulmifolia [Passifloraceae], Hyptis umbrosa [Lamiaceae] and Amaranthus
viridis [Amaranthaceae]) and two plant species during CC4 (T. ulmifolia and H. umbrosa).
Amaranthus viridis was not found during CC4. These plant species were chosen duo to their
similarity in shoot growth and root system pattern and growth, compared to soybean. This
ensured that a similar soil layer was explored either by soybean or reference plant roots, with a
similar timing (Giller, 2001).
Table 5.1. Chemical properties of the PyOM applied to the experimental site.
...... pH ...... Ca Mg Al H+Al P K Cu
H2O KCl(1M) ..................... g kg-1 ..................... ................ mg kg-1 ...............
7.2 6.15 1.86 0.37 0 0 126.5 1547 0.39
Zn Fe Mn Ctot Ntot NH4+ NO3
- EC*
................ mg kg-1 ................ ..........% ........... ..... mg kg-1 ..... µs cm-1
2.94 25.20 4.50 74.3 1.18 17.4 0 3573 * EC= Electrical conductivity.

PyOM & biological nitrogen fixation
75
Shoot samples from soybean and reference plants were ground to a fine powder in a roller mill
similar to that described by Arnold and Schepers (2004). All plant samples were analysed for
total N content using the semi-micro Kjeldahl procedure as described by Urquiaga et al. (1992).
Analyses were performed at the Embrapa Mid-North facilities in Teresina, Brazil.
Soil sampling and analysis
After harvest of plants from CC1 and CC4, soil samples were collected from the 0-10 cm layer
with an auger. From the three central planting lines within each plot, TWELVE soil sub-samples
were collected and pooled to form one composite sample from each plot. These samples were
air-dried and sieved through a 2.0 mm screen and stored at room temperature prior to chemical
analysis.
Soil samples were ground to pass a 0.21 mm sieve to determine total nitrogen (TN). This was
achieved using sulphuric acid digestion and the N was measured by the Kjeldahl distillation
method (Bremmer, 1996).
Isotopic 15N analysis
The 15N abundance in aliquots of plant sub-samples containing approximately 35 mg N was
determined using an automated continuous-flow isotope-ratio mass spectrometer consisting of
a Finnigan DeltaPlus mass spectrometer coupled to the output of a Carlo Erba EA 1108 total C
and N analyser (Finnigan MAT, Bremen, Germany) in the “John Day Stable Isotope
Laboratory” at Embrapa Agrobiology facilities in Rio de Janeiro, Brazil. The proportion of N
in the soybean plants derived from the air (%Ndfa) was calculated using the equation of Shearer
and Kohl (1986):
%𝑁𝑑𝑓𝑎 = 100(𝛿15𝑁 𝑟𝑒𝑓𝑒𝑟𝑒𝑛𝑐𝑒 𝑝𝑙𝑎𝑛𝑡 − 𝛿15𝑁 𝑙𝑒𝑔𝑢𝑚𝑒)
(𝛿15𝑁 𝑟𝑒𝑓𝑒𝑟𝑒𝑛𝑐𝑒 𝑝𝑙𝑎𝑛𝑡 − 𝐵)
where B is the natural abundance of 15N derived from air in soybean (BNF). The B value (-
1.85‰) was obtained from Guimarães et al. (2008) for soybean shoot tissue (Bs) inoculated
with the same B. japonicum strains used as in our research. We calculated independent %Ndfa
values for each reference plant species and averaged the values to obtain final values based on
reference plants collected in each CC.
Statistical analyses
Statistical analyses were conducted using SAS 9.2 (SAS Institute, 2009). The effects of PyOM
rates, P fertilizer and CC were analysed using a three-way ANOVA (α = 0.05) in a randomized
block design. We also split the statistical analysis within each CC and performed a two-way
ANOVA taking PyOM and P fertilization as factors. When significant effects of PyOM rates
were found, data were explained by the post hoc LSD test. Differences between P fertilization
treatments or between CC were discriminated by F test. We performed Pearson correlation test
to investigate the correlation of variables associated to nodulation and Ndfa.
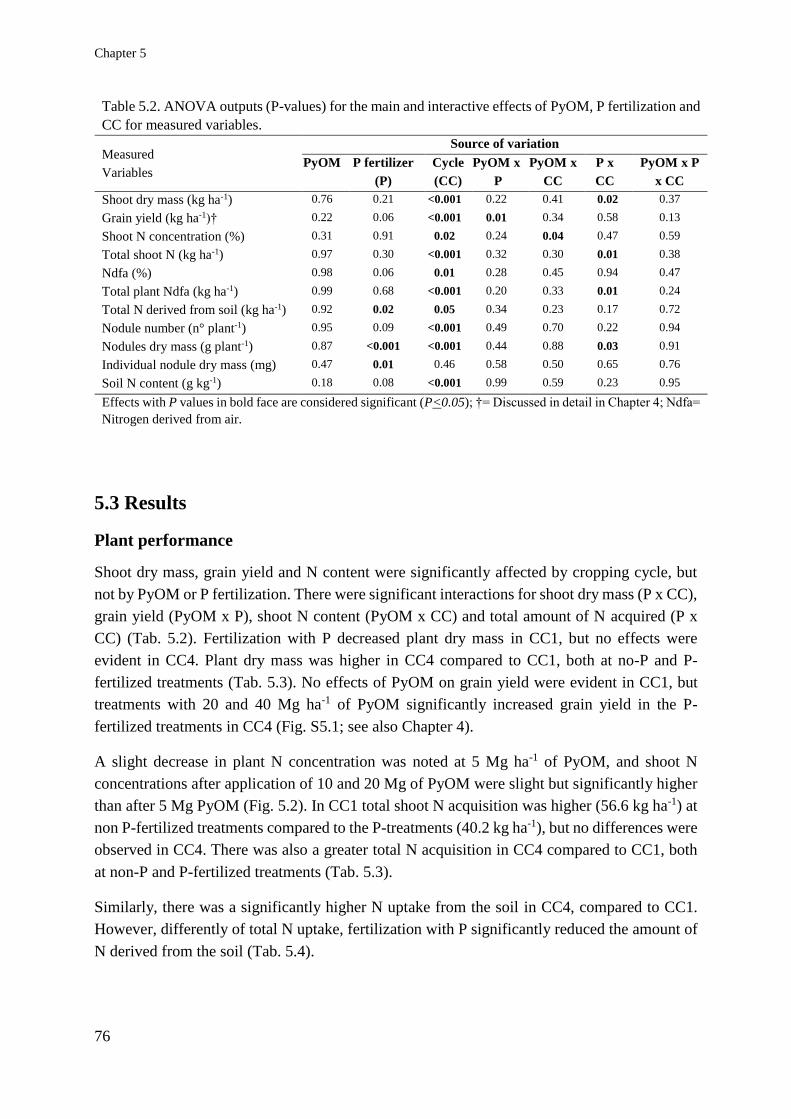
Chapter 5
76
5.3 Results
Plant performance
Shoot dry mass, grain yield and N content were significantly affected by cropping cycle, but
not by PyOM or P fertilization. There were significant interactions for shoot dry mass (P x CC),
grain yield (PyOM x P), shoot N content (PyOM x CC) and total amount of N acquired (P x
CC) (Tab. 5.2). Fertilization with P decreased plant dry mass in CC1, but no effects were
evident in CC4. Plant dry mass was higher in CC4 compared to CC1, both at no-P and P-
fertilized treatments (Tab. 5.3). No effects of PyOM on grain yield were evident in CC1, but
treatments with 20 and 40 Mg ha-1 of PyOM significantly increased grain yield in the P-
fertilized treatments in CC4 (Fig. S5.1; see also Chapter 4).
A slight decrease in plant N concentration was noted at 5 Mg ha-1 of PyOM, and shoot N
concentrations after application of 10 and 20 Mg of PyOM were slight but significantly higher
than after 5 Mg PyOM (Fig. 5.2). In CC1 total shoot N acquisition was higher (56.6 kg ha-1) at
non P-fertilized treatments compared to the P-treatments (40.2 kg ha-1), but no differences were
observed in CC4. There was also a greater total N acquisition in CC4 compared to CC1, both
at non-P and P-fertilized treatments (Tab. 5.3).
Similarly, there was a significantly higher N uptake from the soil in CC4, compared to CC1.
However, differently of total N uptake, fertilization with P significantly reduced the amount of
N derived from the soil (Tab. 5.4).
Table 5.2. ANOVA outputs (P-values) for the main and interactive effects of PyOM, P fertilization and
CC for measured variables.
Measured
Variables
Source of variation
PyOM P fertilizer
(P)
Cycle
(CC)
PyOM x
P
PyOM x
CC
P x
CC
PyOM x P
x CC
Shoot dry mass (kg ha-1) 0.76 0.21 <0.001 0.22 0.41 0.02 0.37
Grain yield (kg ha-1)† 0.22 0.06 <0.001 0.01 0.34 0.58 0.13
Shoot N concentration (%) 0.31 0.91 0.02 0.24 0.04 0.47 0.59
Total shoot N (kg ha-1) 0.97 0.30 <0.001 0.32 0.30 0.01 0.38
Ndfa (%) 0.98 0.06 0.01 0.28 0.45 0.94 0.47
Total plant Ndfa (kg ha-1) 0.99 0.68 <0.001 0.20 0.33 0.01 0.24
Total N derived from soil (kg ha-1) 0.92 0.02 0.05 0.34 0.23 0.17 0.72
Nodule number (n° plant-1) 0.95 0.09 <0.001 0.49 0.70 0.22 0.94
Nodules dry mass (g plant-1) 0.87 <0.001 <0.001 0.44 0.88 0.03 0.91
Individual nodule dry mass (mg) 0.47 0.01 0.46 0.58 0.50 0.65 0.76
Soil N content (g kg-1) 0.18 0.08 <0.001 0.99 0.59 0.23 0.95
Effects with P values in bold face are considered significant (P<0.05); †= Discussed in detail in Chapter 4; Ndfa=
Nitrogen derived from air.

PyOM & biological nitrogen fixation
77
Biological nitrogen fixation
The average 𝛿15N abundance in the reference plants collected both during CC1 and CC4 was
5.5‰.
In the three-way ANOVA CC was a significant source of variation, whereas PyOM, P
fertilization and the PyOM x P interaction were not significant, both for the total amount of N
fixed and the fractional contribution of N fixation (%Ndfa). There was a significant P x CC
interaction effect on the total amount of N fixed (Fig. 5.3), but not on %Ndfa (Tab. 5.2). The
total amount of N fixed was higher in CC4 (48.9 kg ha-1) than in CC1 (29.2 kg ha-1); fractional
Figure 5.2. Shoot nitrogen concentration in plants harvested after CC1 and CC4 per pyrogenic organic
matter application rate. Different letters on the top of open bars indicate significant differences among
PyOM addition rates in CC1. Error bars indicate standard errors (n = 8). * indicates significant
differences between CC1 and CC4 within PyOM rates.
0.0
1.0
2.0
3.0
4.0
5.0
6.0
0 5 10 20 40
Sh
oo
t N
co
ncen
tra
tio
n (
%)
PyOM rates (Mg ha-1)
CC1 CC4
abb
a aab
*
Table 5.3. Mean values and standard errors (n= 40) of variables affected by the CC.
Cropping
cycles
Ndfa
(%)
Total N derived from
soil (kg ha-1)
Nodule number
(n° plant-1)
Soil N content
(g kg-1)
CC1 60.2 + 1.7 b 19.2 + 1.9 b 25.3 + 2.5 b 0.12 + 0.002 a
CC4 67.3 + 2.1 a 24.2 + 1.7 a 57.8 + 3.8 a 0.08 + 0.001 b
Means followed by the same letter in columns do not differ significantly (F-test; P<0.05).
Table 5.4. Mean values and standard errors (n= 40) of variables affected by P fertilization.
P fertilization Total N from soil
(kg ha-1)
Individual nodule
dry mass (mg)
No-P 24.8 + 0.2 a 4.28 + 0.004 b
P 18.6 + 0.3 b 5.36 + 0.003 a
Means followed by the same letter in columns do not differ significantly by F-test (P<0.05).

Chapter 5
78
contribution of N fixation (%Ndfa) also increased from 60.2% in CC1 to 67.3% in CC4 (Tab.
5.5). Phosphorus somewhat reduced the amount of N fixed in CC1 but increased that amount
in CC4. A two-way ANOVA carried out within each CC showed that during CC1 there was a
significant PyOM x P fertilization interaction for %Ndfa (P=0.04; Tab. S5.1) but not for total
amount of N fixed. In the P-fertilized treatments, %Ndfa was 63% in the absence of PyOM,
and increased to 73% in the treatment with 20 Mg ha-1 of PyOM. No further increase in %Ndfa
was observed at 40 Mg ha-1 PyOM. In the absence of P fertilizer, %Ndfa increased from 47%
in the no-PyOM treatment, to 65% in the treatment with 10 Mg ha-1 of PyOM. Application rates
higher than 10 Mg ha-1 of PyOM did not increase the %Ndfa any further in the absence of P
fertilizer (Fig. 5.4). Treatments with P fertilization resulted in significantly greater %Ndfa at
the no-PyOM treatment and at 20 Mg ha-1 of PyOM, compared to treatments without P-
fertilizer.
Nodule number and nodule dry mass were significantly affected by CC. Nodule dry mass and
individual nodule dry mass were significantly affected by P; for total dry mass of nodules the
interaction P × CC was also significant (Tab. 5.2). Nodule number was higher in CC4 than in
CC1 (Tab. 5.3). Nodule dry mass was higher in CC4 compared to CC1, both at P-fertilized and
no P-fertilized treatments (Tab. 5.5). Fertilization with P also resulted in higher nodule dry mass
than no-P treatments in CC4. Dry mass of individual nodules increased from 4.28 mg at non P-
fertilized treatments, to 5.36 mg at P-fertilized treatments (Tab. 5.4).
We observed significant Pearson correlations between total plant Ndfa (kg ha-1) and nodules
number in both CC (r= 0.34; P= 0.03 and r= 0.47; P= 0.002 for CC1 and CC4, respectively).
No significant correlation was observed between total plant Ndfa and total nodule dry mass in
CC1 (r= -0.08; P= 0.61), but a significant correlation in CC4 (r= 0.53 P= 0.0004).
Figure 5.3. Total nitrogen in the soybean shoot (kg ha-1) and its origin during CC1 (A) and CC4 (B),
at different PyOM addition rates. Error bars indicate standard errors (n = 8).

PyOM & biological nitrogen fixation
79
Soil N
Soil N content was not affected by PyOM additions or P fertilization, but there was a significant
effect of CC (Tab. 5.2). Soil N content declined from 0.12 g kg-1 in CC1, to 0.08 g kg-1 in CC4
(Tab. 5.3).
5.4 Discussion
Cropping cycle was the main source of variation in the ANOVA. We consider micronutrient
addition as the most likely cause for the effects on crop performance and root symbiosis. Weed
management and irrigation were the same in all cropping cycles. Seed and inoculum quality
were also unlikely to vary over the CC. In support for our explanation we noted that similarly
for CC4, the overall crop yield in CC3 (data not shown) was higher than those obtained in CC1
and CC2. Consistent with that explanation are observations of luxury P-uptake after P
fertilization in CC1 (see Chapter 4), a negative effect of P on total shoot N in CC1 and a lack
of effect of P on Ndfa in CC1 (but a positive P effect in CC4) (Tab. 5.5). In our experiment we
Figure 5.4. %Ndfa in plants harvested during CC1 at (A) non-P fertilized and P fertilized treatments and
(B) average %Ndfa in plants during CC1 and CC4. Error bars indicate standard errors (n = 4). * indicates
significance differences between CC (P<0.05) within PyOM rates.
Table 5.5. Mean values and standard errors (n= 20) of variables affected by the interaction between CC
x P fertilization.
Cropping
cycles
Shoot dry mass
(Mg ha-1)
Total shoot N
(kg ha-1)
Total plant Ndfa
(kg ha-1)
Nodules dry mass
(g plant-1)
No-P P No-P P No-P P No-P P
CC1 1.5 b A
(+ 1.6)
1.2 b B
(+ 0.8)
56.6 b A
(+ 6.8)
40.2 b B
(+ 3.2)
32.6 b A
(+ 4.4)
25.8 b A
(+ 2.5)
0.1 b A
(+ 0.01)
0.1 b A
(+ 0.01)
CC4 1.8 a A
(+ 0.8)
2.0 a A
(+ 0.7)
69.8 a A
(+ 4.2)
76.5 a A
(+ 3.5)
44.2 a B
(+ 3.0)
53.6 a A
(+ 2.8)
0.2 a B
(+ 0.02)
0.3 a A
(+ 0.03)
Means followed by the same lower case letter in columns and upper case letter in rows within each variable do not
differ significantly (F-test; P<0.05).

Chapter 5
80
tried to mimic conditions in which plants would be grown as part of high-intensive soybean
cropping systems, testing at the same time whether PyOM could contribute in enhancing crop
productivity through improved performance of root symbioses. In such systems soybean is re-
inoculated at every CC with highly efficient Bradyrhizobium; and micronutrients are added as
well (as happened in CC3 and CC4). It is, therefore, plausible that the effects of CC are to a
large extent caused by the specific (micro-)nutrient and rhizobia management rather than by
temporal changes in the PyOM properties. The design of our experiment had the disadvantage
that testing of PyOM effects over time became problematical. On the other hand, it provided a
more realistic assessment of the effects of PyOM on BNF under conditions of soil and soybean
management that are currently practiced and close to optimal. The results of our experiment
suggest that under such conditions the effects of PyOM on BNF are not relevant, as there were
no significant PyOM effects on BNF in CC4. However, is it possible that under conditions of
management that are not optimal (for instance by more resource-constrained farmers) PyOM
can make an important contribution? While we cannot directly address that question, data from
CC1 (where micronutrients had not been added) could be helpful.
In the absence of adequate management PyOM could impact soybean performance through two
mechanisms: (i) PyOM (or the ash that goes together with PyOM application) adds (micro-
)nutrients or, through pH effects, increases (micro-)nutrient availability; (ii) PyOM provides a
habitat that enhances survival of rhizobia thereby reducing the need for re-inoculation at each
CC.
It is unlikely that P addition through biochar enhanced soybean performance in CC1. Original
soil P content was high at the beginning of the experiment (33.4 mg P_Mehlich-1 kg-1), but
decreased over the cropping seasons (9.8 mg P_Mehlich-1 kg-1 in the non P-fertilized
treatments). It is likely that there was P sufficiency at the start of the experiment, and further P
application in CC1 reduced N uptake from the soil. High P availability could also have
constrained acquisition of essential micronutrients – especially after additional P fertilizer
application due to negative P effects on the mycorrhizal symbiosis (Chapter 4). But there is no
evidence that in this experiment PyOM application in CC1 contributed to alleviation of
micronutrient deficiency. A separate ANOVA on the data of CC1 (S1) indicated only a PyOM
effect on shoot N concentration in CC1 (Fig. 5.2; see also Tab. 5.2 where this is shown as a
significant interaction CC × PyOM). However, no consistent pattern with rates of PyOM is
visible. Our data did not show significant effects of PyOM on shoot dry mass, total Ndfa or on
nodulation.
The second potential mechanism for increased N fixation due to PyOM additions refers to its
possible effects at improving the survival of the inoculated rhizobia. Although the way this
mechanism works is not clear, PyOM could act as a carrier that increases the short-term
performance of inoculated strains (Hely et al., 1956; see also Chapter 4 for a comparable
mechanism for AMF), by adding signalling compounds with PyOM that trigger BNF (Quilliam
et al., 2013) or by removing toxic molecules harmful for BNF through adsorption on PyOM
surface (Masiello et al., 2013). Hely et al. (1956) found highest rhizobia population and clover

PyOM & biological nitrogen fixation
81
establishment in areas affected by fire and hypothesized that this was caused because charcoal
acted as an adsorbent that removed toxic factors and reduced the clover antagonists. Soybean
seeds were re-inoculated every new CC with the same rhizobia strains which increased
inoculum potential in CC4 compared to CC1. Despite seed inoculation, initial legume
establishment under unfavourable conditions (i.e. under competition between inoculum strains
and autochthonous strains) may limit BNF efficiency (Howieson and Ballard, 2004). The
potentially increased abundance of the applied rhizobia may contribute to higher amounts of
BNF, irrespective of PyOM additions (Rajput et al., 1983). Further research in this field seems
necessary.
In conclusion, our data indicated a dominant role of plant (inoculation by elite inocula) and
(micro-)nutrient management practices on BNF over four soybean cropping cycles. Effects of
PyOM on BNF were small at best and PyOM additions did not increase BNF. There is a need
for further research seeking to understand conditions under which PyOM amendment could
enhance BNF. Understanding those conditions is crucial for optimizing effects of PyOM on
BNF, especially when there are limitations for the use of appropriate agronomical practices.

Chapter 5
82
5.5 Supporting information
Figure S5.1. Pyrogenic organic matter effects on soybean grain yield after CC1 (A) and PyOM x P
interaction for soybean grain yield after CC4 (B). Different letters on the top of grey bars indicate
significant differences among PyOM addition rates within P-fertilized treatments in CC1. * indicates
significant differences between P fertilized and non P-fertilized treatments within PyOM rates. Error
bars indicate standard errors (n= 8 for A and n= 4 for B).
Table S5.1. Two-way ANOVA outputs (P-values) for the main and interactive effects of biochar and
P fertilization for measured variables.
Measured
Variables
Source of variation
Biochar P fertilization (P) Biochar x P
CC1
Shoot dry matter (g plant-1) 0.49 0.04* 0.20
Shoot N content (%) 0.06 0.68 0.50
Total shoot N (kg ha-1) 0.49 0.04* 0.20
Ndfa (%) 0.35 0.11 0.04*
Total plant Ndfa (kg ha-1) 0.75 0.21 0.23
Total N from soil (kg ha-1) 0.29 0.009* 0.29
Nodule number 0.58 0.69 0.54
Nodule dry mass (g plant-1) 0.68 0.08 0.83
Individual nodule dry mass (g) 0.42 0.08 0.76
Soil N content (g kg-1) 0.31 0.11 0.99
CC4
Shoot dry matter (g plant-1) 0.88 0.18 0.93
Shoot N content (%) 0.30 0.52 0.26
Total shoot N (kg ha-1) 0.88 0.18 0.93
Ndfa (%) 0.94 0.26 0.89
Total plant Ndfa (kg ha-1) 0.37 0.008* 0.18
Total N from soil (kg ha-1) 0.81 0.49 0.99
Nodules number 0.99 0.19 0.39
Nodule dry mass (g plant-1) 0.73 0.002* 0.44
Individual nodule dry mass (g) 0.95 0.006* 0.31
Soil N content (g kg-1) 0.66 0.52 0.87
* Significant at P<0.05.
0,0
1,0
2,0
3,0
4,0
0 5 10 20 40
Gra
in y
ield
(M
g h
a-1
)
PyOM rates (Mg ha-1)
A
0,0
1,0
2,0
3,0
4,0
0 5 10 20 40
Gra
in y
ield
(M
g h
a-1
)
PyOM rates (Mg ha-1)
No-P
P
*
a*
aB
b
abb

Chapter 6
General discussion
Edvaldo Sagrilo


General discussion
85
6.1 Introduction
In this final chapter I summarize the main findings from the previous chapters, which address
the research objectives listed in the General Introduction. I also discuss these findings in a more
general context and try to establish a link among them based on the data presented in Chapters
2 to 5 and on further data from an additional decomposition experiment with litter bags. The
main topics covered in this final chapter consist of (i) the impact of PyOM additions on native
SOC decomposition and on PyOM decomposition and on (ii) the role of soil-PyOM
amendments in the establishment of symbiotic relationships in soybean and the implications for
crop yields. This chapter ends with a proposal for a mechanistic explanation and suggestions
for future research. Finally, I make an effort to position our findings in a context of societal
relevance contributing to the “biochar” debate and reflecting on the practical applicability of
the results.
6.2 Main findings
PyOM effects on soil C decomposition
In Chapter 2 I demonstrated highly significant differences in CO2 emission between soils
amended with PyOM at PyC:SOC ratios >2 (increase of 99%) and <2 (no significant increase).
Such observation guided me towards the possibility of splitting these ratios within individual
categories associated with PyOM, soil and experimental conditions. By using this approach I
was able to explore relevant aspects of changes in CO2 emission patterns, which allowed me to
make inferences about the origin of (additional) CO2 emitted even in the absence of isotope
data. An insufficiently critical analysis of the overall increases of 29% in CO2 emission could
lead to erroneous conclusions about the occurrence of positive priming caused by PyOM
additions.
Based on the patterns found in the meta-analysis I demonstrated that the increases in CO2
emission are likely a consequence of the preferential decomposition of labile PyOM fractions
rather than accelerated SOC decomposition (Chapter 2 and 3). Further analysis showed that
even at PyC:SOC ratios >2, significant increases were only evident when PyOM produced at
temperatures <550°C was used, suggesting that high pyrolysis temperatures (>550°C) remove
labile C forms, as experimentally demonstrated by Sun et al. (2014). When PyOM produced at
temperatures >550°C was applied at PyC:SOC ratios <2, there was even a significant reduction
in CO2 emission (Chapter 2). These data provide strong support for the claim that only when
relatively high amounts of labile PyC are applied, increases in CO2 emission become
significant, but such increases are not related to priming of SOC.
Data from our field experiment over four cropping seasons (Chapter 3) - where the sources of
CO2 could be separated through isotope analysis - agreed with the results of Chapter 2 and
demonstrated that PyOM does not cause positive priming of SOC, as suggested by Maestrini et

Chapter 6
86
al. (2014). It further demonstrated that PyOM decomposition under field conditions can be
much higher than usually assumed (e.g. Lehmann et al., 2006), especially when PyOM is
produced under traditional conditions such as those that still predominate in Brazil (Duboc et
al., 2007). PyOM is assumed to be highly recalcitrant due to presence of stable polycyclic
aromatic hydrocarbons (Atkinson et al., 2010). Production of PyOM under conditions that
involve the control of aspects such as pyrolysis method and temperature can result in highly
stable PyOM. In our experiment, the decomposition rate of PyOM decreased as more PyOM
was applied. The PyOM loss during the experimental period indicated preferential
decomposition of PyOM labile fractions and results suggested that the decomposition rates
depended on specific local ecosystem properties including high soil temperature and permanent
water availability. I rejected the hypothesis of physical movement of PyOM (e.g. leaching)
being responsible for observed losses as only enough water to meet the crop requirements was
applied in the experiment (Fig. 3.1). Taking into account the data from Chapter 2 and 3 together,
we can state that SOC decomposition is not stimulated by PyOM. Moreover, SOC can be further
stabilized by applying PyOM produced under pyrolysis conditions that result in high PyOM
recalcitrance, e.g. high temperature (Chapter 2).
PyOM effects on symbiotic aspects
Under field conditions, we observed a short-term negative effect of PyOM on root colonization
by arbuscular mycorrhizal fungi (AMF), a pattern shown in other studies (e.g. Warnock et al.,
2010). However, a summary of such experiments (after one crop has been grown) indicates a
variety of outcomes, although positive effects tend to be overrepresented (Tab. 4.1). I
demonstrated that a short-term negative effect can turn into positive effects over time (Chapter
4). The use of path analysis allowed me to indicate the most likely cause of this shift from
negative to positive effects and to link that to the various mechanisms proposed by Warnock et
al. (2007). Path analysis indicated that changes in root colonization by AMF are not caused by
PyOM effects on soil chemical properties (e.g. soil pH and P content), but that PyOM
interference with the chemical signalling by which plant roots and AMF communicate may be
the likely cause, and therefore, should be further explored in future research. A further
explanation is that PyOM acts as a source (reservoir) of inoculum that allows higher inoculum
potential over time (Hammer et al., 2014).
Our data showed that soil amendments with PyOM did not affect BNF (expressed as total Ndfa
or %Ndfa) in both cropping cycles (Chapter 5). Supply of P through fertilization was relevant
for BNF in cropping cycle 4 (CC4), which is compatible with the high P demand for N fixation.
In CC1 P fertilization did not impact BNF, but reduced N uptake from the soil. Plants also
showed luxury P uptake. The contrasting effects were likely due to severe micronutrient
deficiency in CC1, alleviated through addition of these elements in CC3 and CC4. A positive
effect of P after alleviation of micronutrient deficiency also suggests a positive role of AMF on
the amounts of Ndfa due to the role of AMF in supplying P to the plant (Chalk et al., 2006).
However, such a relationship was not confirmed by our data.

General discussion
87
6.3 PyOM as a tool to mitigate global CO2 emission/climate change
From the results in Chapter 2 and 3, a general finding that arises is that soil additions with
PyOM do not lead to significant acceleration of native SOC decomposition. Although we do
not exclude that some positive priming of SOC may occur, increases in CO2 emission after
PyOM additions seem to be largely dominated by the decomposition of PyOM labile fractions.
There is now a growing body of studies that share similar findings (e.g. Cross and Sohi, 2011;
Keith et al., 2011; Knicker et al., 2013; Lu et al., 2014). Conversely, a recent meta-analysis
(Maestrini et al., 2014) showed that PyOM accelerates native SOC decomposition through a
positive priming effect. Data from both meta-analyses (Maestrini et al., 2014 and ours) are not
comparable. The approach used by Maestrini et al. (2014) seems to fit in a broader definition
of a quantitative literature review, rather than a meta-analytical approach, which is based on
calculation of the relative response ratios with confidence intervals calculated on the basis of a
measure of variance, such as standard error or standard deviation (Gurevitch and Hedges, 2001).
One major issue in both studies is that short-time studies may be especially affected by what
has been called demonic intrusion (Hurlbert, 1984), which refers to changes in other factors
unrelated to the factor under study. For instance, if the control treatment is not as well mixed
as the PyOM treatment where char is incorporated, the data may incorrectly suggest priming
(Chapter 2; see also Jeffery et al., 2014). Nevertheless, the study of Maestrini et al. (2014)
indicated that positive priming occurred only over the first 20 days, and the cumulative effect
of priming lasted less than one year. It is therefore likely that positive priming makes only a
small contribution to the additional CO2 flux.
In our meta-analysis, data from studies where the origin of CO2 was not determined by isotopic
tools were also included unlike in the analysis of Maestrini et al. (2014). This prevented us from
drawing conclusions about the origin of increased CO2 emitted (whether from PyOM or soil).
However, our data collection allowed us to use a larger number of studies, ensuring a wide
range of data regarding soil and PyOM characteristics (for instance SOC content, PyOM
pyrolysis temperature and PyC:SOC ratio). The pattern that emerged from our analysis
highlighted the usefulness of the PyC:SOC ratio as the best predictor for changes in CO2
emissions after PyOM additions. By managing the PyC:SOC ratios through the addition of
PyOM produced under specific temperatures, it is possible to avoid or potentially decrease CO2
emissions (Fig. 2.2). Under such conditions, PyOM could result in a net sequestration of carbon,
thereby helping to mitigate global climate change (Woolf et al., 2010).
I demonstrated in Chapter 2 that emissions of CO2 from PyOM-amended soils tend to stabilize
after periods longer than 200 days (Tab. 2.3). A shift from short-term positive priming effect,
into a negative priming effect 200 days after PyOM additions was also suggested by Maestrini
et al. (2014). One major issue in determining interactions between PyOM and native SOC is
the short-term and laboratory nature of most available studies. Data from our field experiment
partially fill in this gap by showing that native SOC decomposition was not positively primed
by PyOM over four successive cropping cycles (Chapter 3). However, our data do not allow
for any prediction of the impacts either on PyOM decomposition or on non-pyrogenic organic

Chapter 6
88
matter dynamics over several years. Modelling could be applied, but a lack of knowledge of the
rate of change of PyOM under a range of environmental and edaphic conditions makes such
models premature. Three different approaches are possible. Criscuoli et al. (2014) proposed to
directly estimate amounts of PyOM in soils historically affected by PyOM additions. While this
approach enabled the authors to estimate the rate of PyOM decomposition over a 150-year
period, many assumptions had to be made (e.g. original amount of wood and conversion to
PyOM, differences in 𝛿13C atmospheric CO2 concentrations due to fossil fuel burning, presence
of organic debris or micro-organisms in PyOM pores, etc.). Such assumptions impose limits to
generalization of this method (Criscuoli et al., 2014). Alternatively, Cross and Sohi (2013)
proposed an experimental approach where different chars are subjected to oxidative treatments
by heating to 80°C in the presence of hydrogen peroxide, attempting to mimick the natural
ageing or development of functional groups over time. They claimed that their method could
be used as a proxy for natural PyOM ageing of approximately one century. However, the
relation between their parameter of C stability and char decomposability needs further study.
Finally, another approach would derive its inspiration from the method proposed by Janssen
(1984) and Freschet et al. (2012), which consists of a combination of direct short-term
measurements of materials of different ages whose dynamics can be described and fitted into
one general decay function. This method has not yet been applied for studying long-term PyOM
dynamics.
I used a similar approach as Freschet et al. (2012) in a litterbag decomposition experiment
performed under field conditions in Brazil, with the aim of testing possible differential
interactions of fresh and aged PyOM with non-pyrogenic organic matter. The treatments
included: 1) pure fresh PyOM (produced from wood); 2) pure fresh organic material (Crotalaria
retusa dry mass) and; 3) their mixture (each at equal amounts). Treatments 1 and 3 were
repeated using aged PyOM, collected in 2011, from an area where a charcoal-producing plant
had been deactivated in 1996, in Northeast Brazil (3°40’S; 42°48’W; 106 m; average rainfall
around 2000 mm year-1). PyOM and C. retusa material were dried and milled to produce
particles <2 mm. Litterbags with a mesh size of 100 µm - allowing entrance of microorganisms
only - were filled with 20 g of either the pure materials or their mixture (10 g of PyOM + 10 g
of C. retusa dry mass) and placed on the soil surface. The amount remaining in each litterbag
was recorded over two years (at 3, 6, 12, 18 and 24 months). I found that the loss of mass in the
mixtures was similar to what could be expected from the mass loss of their individual
components (Fig. 6.1). There was no evidence for any strong interaction as observed by Wardle
et al. (2008) in their study on decomposition of charcoal and forest humus. My data support the
lack of significant positive priming. Data further showed a lack of significant differences in
mass loss between fresh and aged PyOM. The aged PyOM was much richer in oxidizable
carbon (147 g kg-1) compared to fresh PyOM (33 g kg-1), which was quantified through a
modified Walkley-Black method (Embrapa, 1997). The amount of oxidizable C may indicate a
more advanced oxidation stage. It is also possible that with ageing humic substances could
adsorb to this material. Disturbance of aged PyOM particles during collection and its
preparation may have exposed both PyOM and its associated humic components, leading to
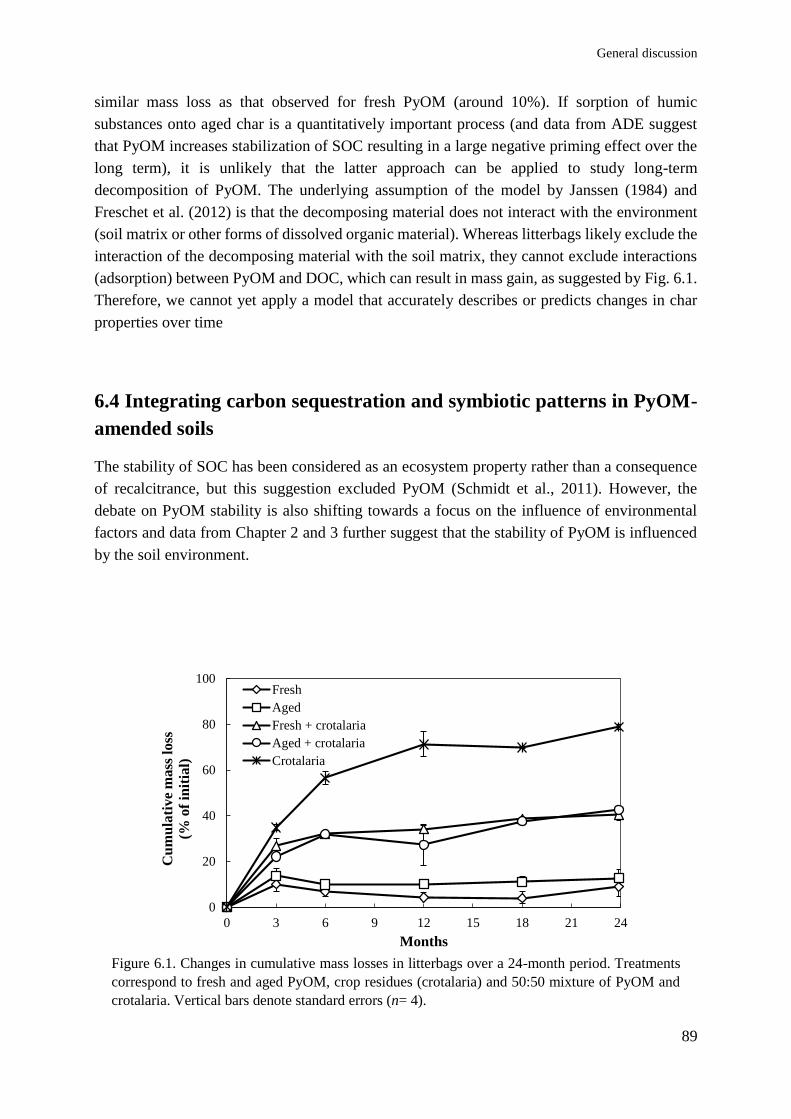
General discussion
89
similar mass loss as that observed for fresh PyOM (around 10%). If sorption of humic
substances onto aged char is a quantitatively important process (and data from ADE suggest
that PyOM increases stabilization of SOC resulting in a large negative priming effect over the
long term), it is unlikely that the latter approach can be applied to study long-term
decomposition of PyOM. The underlying assumption of the model by Janssen (1984) and
Freschet et al. (2012) is that the decomposing material does not interact with the environment
(soil matrix or other forms of dissolved organic material). Whereas litterbags likely exclude the
interaction of the decomposing material with the soil matrix, they cannot exclude interactions
(adsorption) between PyOM and DOC, which can result in mass gain, as suggested by Fig. 6.1.
Therefore, we cannot yet apply a model that accurately describes or predicts changes in char
properties over time
6.4 Integrating carbon sequestration and symbiotic patterns in PyOM-
amended soils
The stability of SOC has been considered as an ecosystem property rather than a consequence
of recalcitrance, but this suggestion excluded PyOM (Schmidt et al., 2011). However, the
debate on PyOM stability is also shifting towards a focus on the influence of environmental
factors and data from Chapter 2 and 3 further suggest that the stability of PyOM is influenced
by the soil environment.
Figure 6.1. Changes in cumulative mass losses in litterbags over a 24-month period. Treatments
correspond to fresh and aged PyOM, crop residues (crotalaria) and 50:50 mixture of PyOM and
crotalaria. Vertical bars denote standard errors (n= 4).
0
20
40
60
80
100
0 3 6 9 12 15 18 21 24
Cu
mu
lati
ve
mass
loss
(% o
f in
itia
l)
Months
Fresh
Aged
Fresh + crotalaria
Aged + crotalaria
Crotalaria
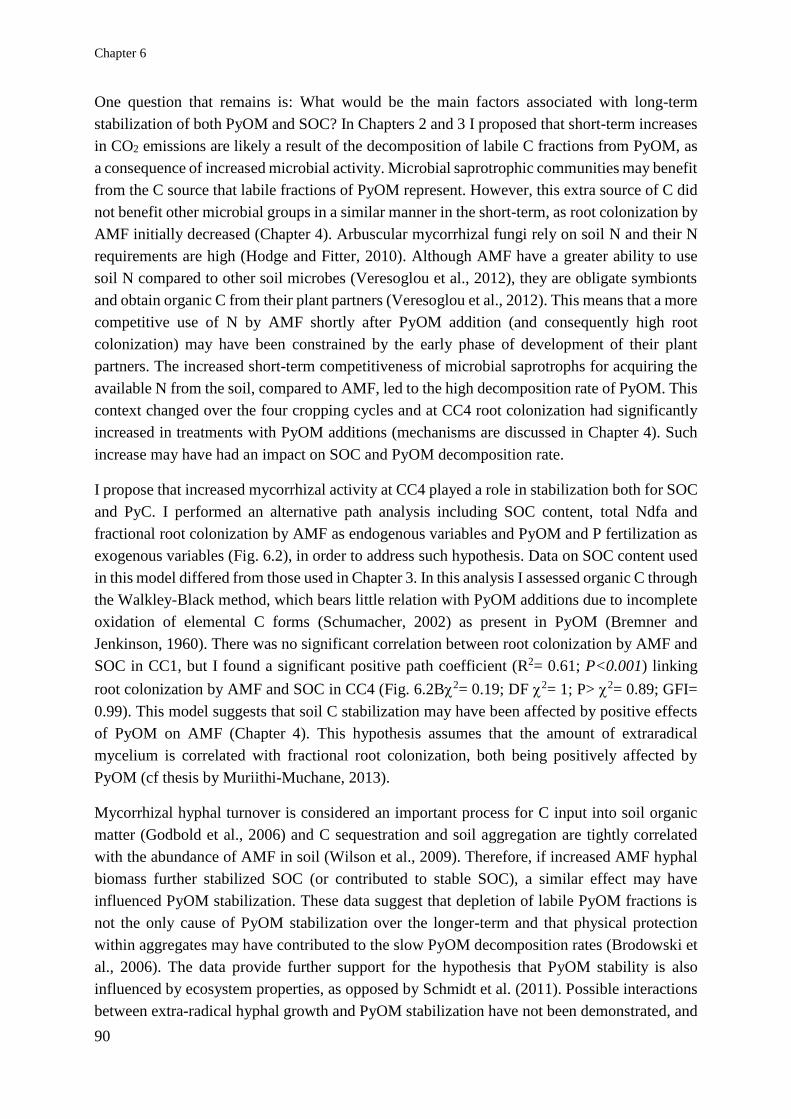
Chapter 6
90
One question that remains is: What would be the main factors associated with long-term
stabilization of both PyOM and SOC? In Chapters 2 and 3 I proposed that short-term increases
in CO2 emissions are likely a result of the decomposition of labile C fractions from PyOM, as
a consequence of increased microbial activity. Microbial saprotrophic communities may benefit
from the C source that labile fractions of PyOM represent. However, this extra source of C did
not benefit other microbial groups in a similar manner in the short-term, as root colonization by
AMF initially decreased (Chapter 4). Arbuscular mycorrhizal fungi rely on soil N and their N
requirements are high (Hodge and Fitter, 2010). Although AMF have a greater ability to use
soil N compared to other soil microbes (Veresoglou et al., 2012), they are obligate symbionts
and obtain organic C from their plant partners (Veresoglou et al., 2012). This means that a more
competitive use of N by AMF shortly after PyOM addition (and consequently high root
colonization) may have been constrained by the early phase of development of their plant
partners. The increased short-term competitiveness of microbial saprotrophs for acquiring the
available N from the soil, compared to AMF, led to the high decomposition rate of PyOM. This
context changed over the four cropping cycles and at CC4 root colonization had significantly
increased in treatments with PyOM additions (mechanisms are discussed in Chapter 4). Such
increase may have had an impact on SOC and PyOM decomposition rate.
I propose that increased mycorrhizal activity at CC4 played a role in stabilization both for SOC
and PyC. I performed an alternative path analysis including SOC content, total Ndfa and
fractional root colonization by AMF as endogenous variables and PyOM and P fertilization as
exogenous variables (Fig. 6.2), in order to address such hypothesis. Data on SOC content used
in this model differed from those used in Chapter 3. In this analysis I assessed organic C through
the Walkley-Black method, which bears little relation with PyOM additions due to incomplete
oxidation of elemental C forms (Schumacher, 2002) as present in PyOM (Bremner and
Jenkinson, 1960). There was no significant correlation between root colonization by AMF and
SOC in CC1, but I found a significant positive path coefficient (R2= 0.61; P<0.001) linking
root colonization by AMF and SOC in CC4 (Fig. 6.2B2= 0.19; DF 2= 1; P> 2= 0.89; GFI=
0.99). This model suggests that soil C stabilization may have been affected by positive effects
of PyOM on AMF (Chapter 4). This hypothesis assumes that the amount of extraradical
mycelium is correlated with fractional root colonization, both being positively affected by
PyOM (cf thesis by Muriithi-Muchane, 2013).
Mycorrhizal hyphal turnover is considered an important process for C input into soil organic
matter (Godbold et al., 2006) and C sequestration and soil aggregation are tightly correlated
with the abundance of AMF in soil (Wilson et al., 2009). Therefore, if increased AMF hyphal
biomass further stabilized SOC (or contributed to stable SOC), a similar effect may have
influenced PyOM stabilization. These data suggest that depletion of labile PyOM fractions is
not the only cause of PyOM stabilization over the longer-term and that physical protection
within aggregates may have contributed to the slow PyOM decomposition rates (Brodowski et
al., 2006). The data provide further support for the hypothesis that PyOM stability is also
influenced by ecosystem properties, as opposed by Schmidt et al. (2011). Possible interactions
between extra-radical hyphal growth and PyOM stabilization have not been demonstrated, and

General discussion
91
therefore, should be included in future studies aimed at understanding the mechanisms involved
in long-term PyOM and SOC stability in PyOM-amended soils.
I speculated in Chapter 5 about possible effects of PyOM on BNF that could occur in the
absence of micronutrient addition as part of regular management. I mentioned that under such
conditions PyOM might supply these micronutrients. PyOM could also remove toxic
compounds, or add signalling compounds that trigger BNF. However, if changes in signalling
aspects would represent a major mechanism responsible for increases in BNF, the way PyOM
additions act upon BNF may differ from its effect on mycorrhizal activity (Chapter 4), although
from the evolutionary point of view they share similar pathways (Provorov et al., 2002).
Within each CC responses of BNF and AMF to PyOM additions were different from each other.
This pattern is not consistent with potentially synergistic relationships between AMF and
rhizobia. Arbuscular mycorrhizal fungi can improve BNF in legumes under conditions where
N-fixation is P-limited, due to their ability to improve P acquisition by plants (Chalk et al.,
2006). However, P availability was sufficient in CC1 (and even in excess after P fertilization)
and this may have ensured nodulation and BNF irrespective of mycorrhizal activity. The
synergistic relationships between AMF and N-fixing bacteria are not always straightforward
and the effects are not necessarily positive for host plant growth and production (Kaschuk et
al., 2010, Larimer et al., 2010; Veresoglou et al., 2012). In a meta-analysis, Kaschuk et al.
(2010) noted an absence of further plant responses when plants were simultaneously colonized
with both AM fungi and rhizobia N2-fixing bacteria, despite positive responses to individual
inoculation with either AMF or rhizobia. This lack of correlation between root colonization by
AMF and BNF was also noted in a path analysis, both in CC1 and CC4 (Fig. 6.2).
Figure 6.2. Path diagrams of relationships among treatment and response variables. Each arrow indicates
direct relationships. Indirect effects occur when one variable in linked to another via an intermediate
variable. Numbers on each arrow represents standardized path coefficients (partial regression; P<0.05).
Numbers in bold above or below dependent variables (boxes) are standardized errors. A and B represent the
effects on CC1 and CC4, respectively. * indicates significant pathway correlations. For the contrasting
effects of P on BNF see Chapter 5.
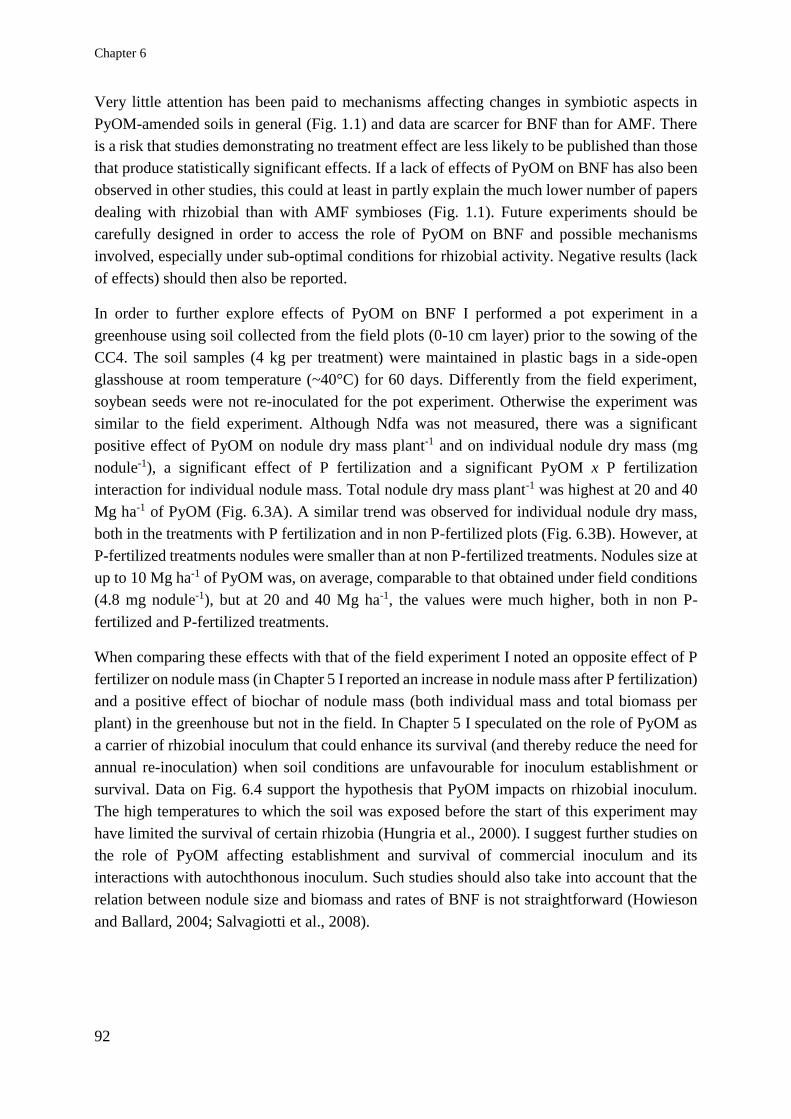
Chapter 6
92
Very little attention has been paid to mechanisms affecting changes in symbiotic aspects in
PyOM-amended soils in general (Fig. 1.1) and data are scarcer for BNF than for AMF. There
is a risk that studies demonstrating no treatment effect are less likely to be published than those
that produce statistically significant effects. If a lack of effects of PyOM on BNF has also been
observed in other studies, this could at least in partly explain the much lower number of papers
dealing with rhizobial than with AMF symbioses (Fig. 1.1). Future experiments should be
carefully designed in order to access the role of PyOM on BNF and possible mechanisms
involved, especially under sub-optimal conditions for rhizobial activity. Negative results (lack
of effects) should then also be reported.
In order to further explore effects of PyOM on BNF I performed a pot experiment in a
greenhouse using soil collected from the field plots (0-10 cm layer) prior to the sowing of the
CC4. The soil samples (4 kg per treatment) were maintained in plastic bags in a side-open
glasshouse at room temperature (~40°C) for 60 days. Differently from the field experiment,
soybean seeds were not re-inoculated for the pot experiment. Otherwise the experiment was
similar to the field experiment. Although Ndfa was not measured, there was a significant
positive effect of PyOM on nodule dry mass plant-1 and on individual nodule dry mass (mg
nodule-1), a significant effect of P fertilization and a significant PyOM x P fertilization
interaction for individual nodule mass. Total nodule dry mass plant-1 was highest at 20 and 40
Mg ha-1 of PyOM (Fig. 6.3A). A similar trend was observed for individual nodule dry mass,
both in the treatments with P fertilization and in non P-fertilized plots (Fig. 6.3B). However, at
P-fertilized treatments nodules were smaller than at non P-fertilized treatments. Nodules size at
up to 10 Mg ha-1 of PyOM was, on average, comparable to that obtained under field conditions
(4.8 mg nodule-1), but at 20 and 40 Mg ha-1, the values were much higher, both in non P-
fertilized and P-fertilized treatments.
When comparing these effects with that of the field experiment I noted an opposite effect of P
fertilizer on nodule mass (in Chapter 5 I reported an increase in nodule mass after P fertilization)
and a positive effect of biochar of nodule mass (both individual mass and total biomass per
plant) in the greenhouse but not in the field. In Chapter 5 I speculated on the role of PyOM as
a carrier of rhizobial inoculum that could enhance its survival (and thereby reduce the need for
annual re-inoculation) when soil conditions are unfavourable for inoculum establishment or
survival. Data on Fig. 6.4 support the hypothesis that PyOM impacts on rhizobial inoculum.
The high temperatures to which the soil was exposed before the start of this experiment may
have limited the survival of certain rhizobia (Hungria et al., 2000). I suggest further studies on
the role of PyOM affecting establishment and survival of commercial inoculum and its
interactions with autochthonous inoculum. Such studies should also take into account that the
relation between nodule size and biomass and rates of BNF is not straightforward (Howieson
and Ballard, 2004; Salvagiotti et al., 2008).
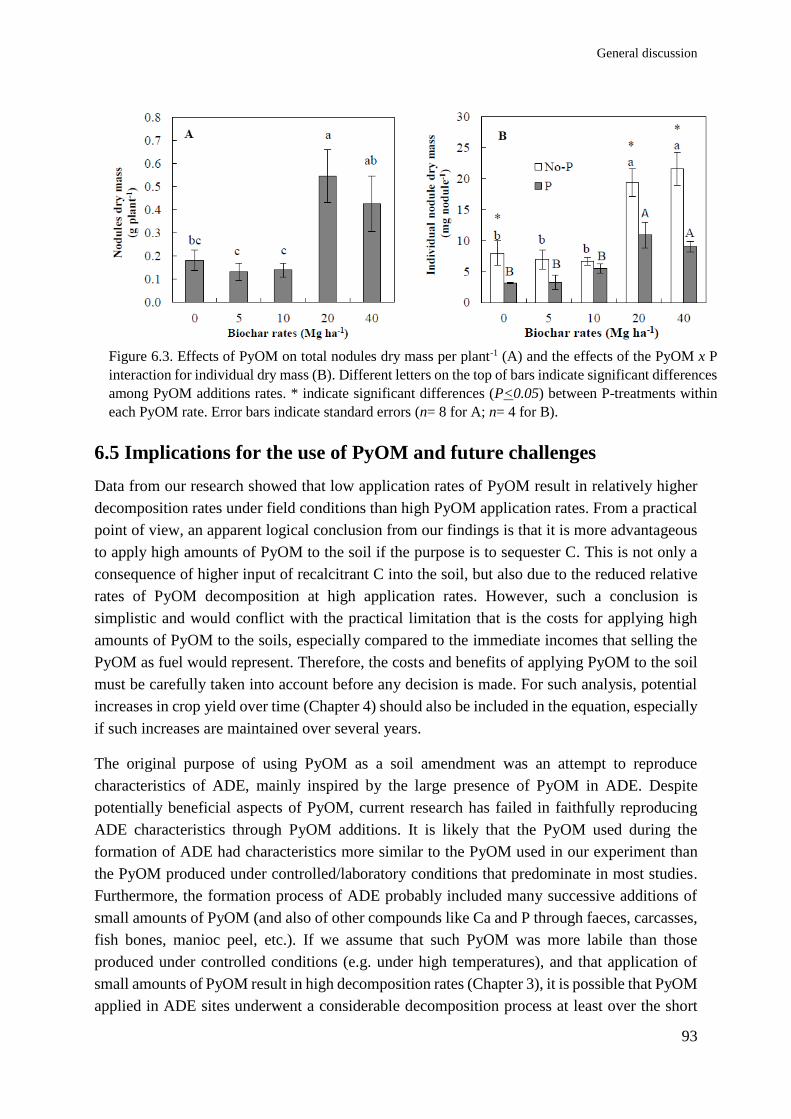
General discussion
93
6.5 Implications for the use of PyOM and future challenges
Data from our research showed that low application rates of PyOM result in relatively higher
decomposition rates under field conditions than high PyOM application rates. From a practical
point of view, an apparent logical conclusion from our findings is that it is more advantageous
to apply high amounts of PyOM to the soil if the purpose is to sequester C. This is not only a
consequence of higher input of recalcitrant C into the soil, but also due to the reduced relative
rates of PyOM decomposition at high application rates. However, such a conclusion is
simplistic and would conflict with the practical limitation that is the costs for applying high
amounts of PyOM to the soils, especially compared to the immediate incomes that selling the
PyOM as fuel would represent. Therefore, the costs and benefits of applying PyOM to the soil
must be carefully taken into account before any decision is made. For such analysis, potential
increases in crop yield over time (Chapter 4) should also be included in the equation, especially
if such increases are maintained over several years.
The original purpose of using PyOM as a soil amendment was an attempt to reproduce
characteristics of ADE, mainly inspired by the large presence of PyOM in ADE. Despite
potentially beneficial aspects of PyOM, current research has failed in faithfully reproducing
ADE characteristics through PyOM additions. It is likely that the PyOM used during the
formation of ADE had characteristics more similar to the PyOM used in our experiment than
the PyOM produced under controlled/laboratory conditions that predominate in most studies.
Furthermore, the formation process of ADE probably included many successive additions of
small amounts of PyOM (and also of other compounds like Ca and P through faeces, carcasses,
fish bones, manioc peel, etc.). If we assume that such PyOM was more labile than those
produced under controlled conditions (e.g. under high temperatures), and that application of
small amounts of PyOM result in high decomposition rates (Chapter 3), it is possible that PyOM
applied in ADE sites underwent a considerable decomposition process at least over the short
Figure 6.3. Effects of PyOM on total nodules dry mass per plant-1 (A) and the effects of the PyOM x P
interaction for individual dry mass (B). Different letters on the top of bars indicate significant differences
among PyOM additions rates. * indicate significant differences (P<0.05) between P-treatments within
each PyOM rate. Error bars indicate standard errors (n= 8 for A; n= 4 for B).

Chapter 6
94
term following application to soil. This approach implies that partial decomposition of PyOM
(together with development of charges on PyOM surface and increased nutrient retention) was
part of the process for ADE formation and should be taken into account when defining the goals
of using PyOM as soil amendment (whether focused solely on C sequestration or on soil
improvement and crop yield).
The current worldwide dominant discourse for using PyOM has been focused on its potential
for C sequestration, whereas the Brazilian discourse is more geared towards crop residue
management, improvement of soil fertility and agronomic benefits (Tatiana Rittl, personal
communication). Data from my thesis suggest that both goals may be attained with PyOM
additions, as improved crop yields are likely to occur simultaneously with increases in C stocks.
However, my data also demonstrate that increased crop yield is not an immediate consequence
of PyOM additions itself, but arises and is established in a more consistent pattern over time.
This time-dependent pattern is consistent with the claim that long-term oxidation of PyOM
surface plays a relevant role in the build-up of soil fertility (Glaser et al., 2002). These data
taken together suggest that the “carbon dilemma” (Janzen, 2006) can be partially solved by
adding PyOM to the soil. Although some benefits can be “simultaneously obtained” (C
sequestration and increased crop yield), they cannot be “simultaneously maximized” (Jeffery
et al., 2013). Improved crop performance over time will be a consequence of partial
decomposition of PyOM, but concomitant oxidation/functionalization of remaining PyOM will
likely promote favourable conditions for nutrient retention and survival of beneficial organisms
as AMF (Hammer et al., 2014) and possibly rhizobia. Whereas biological nitrogen fixation can
also be favoured by PyOM additions, my results (Chapter 5) imply that potential benefits of
PyOM can be overcome by appropriate agronomic practices, such as soil fertilization with
mixtures of micronutrients and re-inoculation. Such practices predominate in large-scale
soybean production areas in Brazil, and therefore, PyOM additions would not represent an
advantage for BNF under such conditions.
Although research on PyOM has now accumulated an appreciable volume of data regarding
SOC and PyOM decomposition, much less has been done for symbiotic relationships (Fig. 1.1).
As most research on these topics is dominated by short-term laboratory experiments, the results
cannot be scaled up for practical purposes. Our data partially fill in these gaps and provide
insights about the establishment of a pattern for these three aspects over time. However, if
PyOM as soil amendment is to be eligible as a formal component of public policies for future
C-trading schemes, the design and implementation of other long-term field experiments under
realistic conditions (e.g. realistic PyOM rates) are urgently required. I demonstrated that PyOM
rates of 20 and 40 Mg ha-1 were responsible for the lowest PyOM decomposition rates (Chapter
3) and the highest crop yields (Chapter 4), as well as high root colonization by AMF. Such
PyOM amounts can, therefore, be considered realistic for a multitude of benefits and should be
considered in future field research.
General discussion
95
Finally, a noteworthy aspect is that all plant residues produced in the field experiment were
systematically removed from the area after every CC. Under deprivation of fresh organic
materials, SOC was not positively primed by PyOM. However, the impact of permanent
additions of new fresh organic materials in PyOM-amended soils is expected to increase the
SOC pool, as this form of organic matter can be stabilized by PyOM (Maestrini et al., 2014).
To what extent PyOM could stabilize newly added fresh organic materials and increase SOC
stocks is still a topic for future research but some preliminary calculations suggest that three
units of C can be further stabilized by one unit of PyOM (Van Hofwegen et al., 2009). Such
aspect would represent an additional benefit of amending soils with PyOM and ensure the
delivery of relevant environmental services, such as the mitigation of CO2 emission. Only if,
next to other benefits of PyOM, its addition to soil leads to long-term sustainable increase in
SOC pools, together with increases in cation exchange capacity, then the “carbon dilemma”
(Janzen, 2006) would be solved.


References
97
References
Adams DC; Gurevitch J; Rosenberg MS. 1997. Resampling tests for meta-analysis of
ecological data. Ecology, 78, 1277–1283.
Ameloot N; De Neve S; Jegajeevagan K; Yildiz G; Buchan D; Funkuin YN; Prins W; Bouckaert
L; Sleutel S. 2013. Short-term CO2 and N2O emissions and microbial properties of biochar
amended sandy loam soils. Soil Biology & Biochemistry, 57, 401-410.
Anderson CR; Condron LM; Clough TJ; Fiers M; Stewart A; Hill RA; Sherlock RR. 2011.
Biochar induced soil microbial community change: Implications for biogeochemical
cycling of carbon, nitrogen and phosphorus. Pedobiologia, 54, 309-320.
Andrade DS; Murphy PJ; Giller KE. 2002. Effects of liming and legume/cereal cropping on
populations of indigenous rhizobia in an acid Brazilian Oxisol. Soil Biology &
Biochemistry, 34, 477-485.
Andrade Júnior AS; Bastos EA; Barros AHC; Silva CO; Gomes AAN. 2005. Classificação
climática e regionalização do semi-árido do Estado do Piauí sob cenários pluviométricos
distintos. Revista Ciência Agronômica, 36, 143-151.
Arnold SL; Schepers JS. 2004. A simple roller-mill grinding procedure for plant and soil
samples. Communications in Soil Science and Plant Analysis, 35, 537-545.
Atkinson CJ; Fitzgerald JD; Hipps NA. 2010. Potential mechanisms for achieving agricultural
benefits from biochar application to temperate soils: a review. Plant and Soil, 337, 1–18.
Augusto L; Bakker MR; Meredieu C. 2008. Wood ash applications to temperate forest
ecosystems – potential benefits and drawbacks. Plant and Soil, 306, 181–198.
Balesdent J; Mariotti A. 1996. Measurement of soil organic matter turnover using 13C natural
abundance. In: Mass spectrometry of soils (eds Boutton TW, Yamasaki SI), pp. 83–111.
Marcel Dekker, New York.
Balota EL; Colozzi Filho A; Andrade DS; Dick RP. 2004. Long-term tillage and crop rotation
effects on microbial biomass and C and N mineralization in a Brazilian Oxisol. Soil &
Tillage Research, 77, 137–145.
Bamminger C; Marschner B; Jüschke E. 2013. An incubation study on the stability and
biological effects of pyrogenic and hydrothermal biochar in two soils. European Journal
of Soil Science, 65, 72-82.
Biederman LA; Harpole WS. 2013. Biochar and its effects on plant productivity and nutrient
cycling: a meta-analysis. Global Change Biology and Bioenergy, 5, 202–214.
Bingeman CW; Varner JE; Martin WP. 1953. Effect of the Addition of Organic Materials on
the on the Decomposition of an Organic Soil. Soil Science Society of America Proceedings,
17, 34–38.
Bird MI; Moyo C; Veenendaal EM; Lloyd J; Frost P. 1999. Stability of elemental carbon in a
savanna soil. Global Biogeochemical Cycles, 13, 923–932.
Blackwell P; Krull E; Butler G; Herbert A; Solaiman Z. 2010. Effect of banded biochar on
dryland wheat production and fertiliser use in south-western Australia: an agronomic and
economic perspective. Australian Journal of Soil Research, 48, 531–545.
Borenstein M; Hedges LV; Higgins JPT; Rothstein HR. 2009. Introduction to meta-analysis.
John Wiley & Sons, Ltd, Chichester.
Bremmer JM. 1996. Nitrogen total. In: Sparks, D.L. (Ed.). Methods of soil analysis. 3rd ed.
Madison: Soil Science Society of America. p. 1085‑1121.
Bremner JM; Jenkinson DS. 1960. Determination of organic carbon in soil: II. Effect of
carbonized materials. Journal of Soil Science, 11, 403–408.

References
98
Brodowski S; Amelung W; Haumaier L; Abetz C; Zech W. 2005. Morphological and chemical
properties of black carbon in physical soil fractions as revealed by scanning electron
microscopy and energy-dispersive X-ray spectroscopy. Geoderma, 128, 116–129.
Brodowski S; John B; Flessa H; Amelung W. 2006. Aggregate-occluded black carbon in soil.
European Journal of Soil Science, 57, 539–546.
Casida LE; Klein DA; Santoro T. 1964. Soil dehydrigenase activity. Soil Science, 98, 371–378.
Causarano HJ; Franzluebbers AJ; Shaw JN; Reeves DW; Raper RL; Wood CW. 2008. Soil
organic carbon fractions and aggregation in the southern Piedmont and Coastal Plain. Soil
Science Society of America Journal, 72, 221–230.
Cayuela ML; van Zwieten L; Singh BP; Jeffery S; Roig A; Sánchez-Monedero MA. 2013.
Biochar’s role in mitigating soil nitrous oxide emissions: A review and meta-analysis.
Agriculture, Ecosystems and Environment. doi:10.1016/j.agee.2013.10.009.
Chalk PM; Souza RF; Urquiaga S; Alves BJR; Boddey RM. 2006. The role of arbuscular
mycorrhiza in legume symbiotic performance. Soil Biology & Biochemistry, 38, 2944-
2951.
Cheng CH; Lehmann J; Thies JE; Burton SD; Engelhard MH. 2006. Oxidation of black carbon
by biotic and abiotic processes. Organic Geochemistry, 37, 1477-1488.
Cornelissen G; Martinsen V; Shitumbanuma V; Alling V; Breedveld GD; Rutherford DW;
Sparrevik M; Hale SE; Obia A; Mulder J. 2013. Biochar Effect on Maize Yield and Soil
Characteristics in Five Conservation Farming Sites in Zambia. Agronomy, 3, 256-274.
Creamer AE; Gao B; Zhang M. 2014. Carbon dioxide capture using biochar produced from
sugarcane bagasse and hickory wood. Chemical Engineering Journal, 249, 174–179.
Criscuoli I; Alberti G; Baronti S; Favilli F; Martinez C; Calzolari C; Pusceddu E; Rumpel C;
Viola R; Miglietta F. 2014. Carbon sequestration and fertility after centennial time scale
incorporation of charcoal into soil. Plos One, 9, e91114.
Cross A; Sohi SP. 2011. The priming potential of biochar products in relation to labile carbon
contents of soil organic matter status. Soil Biology & Biochemistry, 43, 2127–34.
Cross A; Sohi SP. 2013. A method for screening the relative long-term stability of biochar.
Global Change Biology and Bioenergy, 5, 215-220.
DeLuca TH; MacKenzie MD; Gundale MJ. 2009. Bio-char effects on soil nutrient
transformation. In: Lehmann J; Joseph S. (eds). Biochar for environmental management:
science and technology. Earthscan Publications Ltd, London. p 251–270.
Díaz-Rojas M; Aguilar-Chávez A; Cárdenas-Aquino MR; Ruíz-Valdiviezo VM; Hernández-
Valdez E; Luna-Guido M; Olalde-Portugal V; Dendooven L. 2014. Effects of wastewater
sludge, urea and charcoal on greenhouse gas emissions in pots planted with wheat. Applied
Soil Ecology, 73, 19–25.
Duboc E; Costa CJ; Veloso RF; Oliveira LS; Paludo A. 2007. Panorama atual da produção de
carvão no Brasil e no Cerrado. Planaltina, Embrapa Cerrados. 37p. (Documentos 197).
Elmer WH; Pignatello JJ. 2011. Effect of Biochar Amendments on Mycorrhizal Associations
and Fusarium Crown and Root Rot of Asparagus in Replant Soils. Plant Disease, 95, 960-
966.
Embrapa - Empresa Brasileira de Pesquisa Agropecuária. 1997. Centro Nacional de Pesquisa
de Solos. Manual de métodos de análises de solo. Rio de Janeiro, Embrapa. 21p.
Ezawa T; Yamamoto K; Yoshida S. 2002. Enhancement of the Effectiveness of Indigenous
Arbuscular Mycorrhizal Fungi by Inorganic Soil Amendments. Soil Science and Plant
Nutrition, 48, 897-900.
FAO. 2006. World Reference Base for Soil Resources 2006: A Framework for International
Classification, Correlation and Communication. World Soil Resources Reports, Rome.
FAO/UNESCO. 2003. Digital Soil Map of the World and Derived Soil Properties, Version 3.6.
CD-ROM, Information Division, FAO, Rome, http://www.fao.org/ag/agl/agll/ dsmw.stm.

References
99
Farrell M; Kuhn TK; Macdonald LM; Maddern TM; Murphy DV; Hall PA; Singh BP;
Baumann K; Krull ES; Baldock JA. 2013. Microbial utilisation of biochar-derived carbon.
Science of the Total Environment, 465, 288-297.
Freschet GT; Weedon JT; Aerts R; van Hal JR; Cornelissen JHC. 2012. Interspecific
differences in wood decay rates: insights from a new short-term method to study long-term
wood decomposition. Journal of Ecology, 100, 161–170.
George C; Wagner M; Kücke M; Rillig MC. 2012. Divergent consequences of hydrochar in the
plant–soil system: Arbuscular mycorrhiza, nodulation, plant growth and soil aggregation
effects. Applied Soil Ecology, 59, 68– 72.
Germano MG; Cannavan FS; Mendes LW; Lima AB; Teixeira WG; Pellizari VH; Tsai SM.
2012. Functional diversity of bacterial genes associated with aromatic hydrocarbon
degradation in anthropogenic dark earth of Amazonia. Pesquisa Agropecuária Brasileira,
47, 654-664.
Giller KE. 2001. Nitrogen fixation in tropical cropping systems, 2nd edn. CAB International,
Wallingford. 423p.
Giovannetti M; Mosse B. 1980. An evaluation of techniques for measuring vesicular-arbuscular
mycorrhizal infection in roots. New Phytologist, 84, 489-500.
Glaser B; Balashov E; Haumaier L; Guggenberger G; Zech, W. 2000. Black carbon in density
fractions of anthropogenic soils of the Brazilian Amazon region. Organic Geochemistry,
31, 669–678.
Glaser B; Guggenberger LHG; Zech W. 2001. The ‘Terra Preta’ phenomenon: a model for
sustainable agriculture in the humid tropics. Naturwissenschaften, 88, 37–41.
Glaser B; Lehmann J; Zech W. 2002. Ameliorating physical and chemical properties of highly
weathered soils in the tropics with charcoal – a review. Biology and Fertility of Soils, 35,
219–230.
Godbold DL; Hoosbeek MR; Lukac M; Cotrufo MF; Janssens IA; Ceulemans R; Polle A;
Velthorst EJ; Scarascia-Mugnozza G; Angelis P; Miglietta F; Peressotti A. 2006.
Mycorrhizal hyphal turnover as a dominant process for carbon input into soil organic
matter. Plant and Soil, 281, 15-24.
Grace C; Stribley DP. 1991. A safer procedure for routine staining of vesicular-arbuscular
mycorrhizal fungi. Mycological Research, 95, 1160-1162.
Gryndler M; Larsen J; Hršelová H; Řezáčová V; Gryndlerová H; Kubát J. 2006. Organic and
mineral fertilization, respectively, increase and decrease the development of external
mycelium of arbuscular mycorrhizal fungi in a long-term field experiment. Mycorrhiza,
16, 159-166.
Guimarães AP; de Morais RF; Urquiaga S; Boddey RM; Alves BJR. 2008. Bradyrhizobium
strain and the 15N natural abundance quantification of biological N2 fixation in soybean.
Scientia Agricola, 65, 516-524.
Guo LB; Gifford RM. 2002. Soil carbon stocks and land use change: a meta-analysis. Global
Change Biology, 8, 345-360.
Gurevitch J; Hedges LV. 2001. Meta-analysis: combining the results of independent
experiments. In: Scheiner SM; Gurevitch J. (eds). Design and analysis of ecological
experiments, Oxford University Press, Oxford, UK. p. 378-398.
Habte M; Antal MJ. 2010. Reaction of mycorrhizal and nonmycorrhizal Leucaena leucocephala
to charcoal amendment of mansand and soil. Communications in Soil Science and Plant
Analysis, 41, 540-552.
Hammer EC; Balogh-Brunstad Z; Jakobsen I; Olsson PA; Stipp SLS; Rillig MC. 2014. A
mycorrhizal fungus grows on biochar and captures phosphorus from its surfaces. Soil
Biology & Biochemistry, 77, 252-260.

References
100
Harris RJ. 2001. A primer of multivariate statistics. 3rd ed. Lawrence Erlbawn, Hillsdale, NJ.
609 pp.
Hayduk LA. 1987. Structural equation modeling with LISREL. Essentials and Advances. John
Hopkins University Press, Baltimore. 405 pp.
Hely FW; Bergersen FJ; Brockwell J. 1956. Microbial antagonisms in the rhizosphere as a
factor in the failure of inoculation of subterranian clover. Australian Journal of
Agricultural Research, 8, 24-44.
Hilscher A; Heister K; Siewert C; Knicker H. 2009. Mineralisation and structural changes
during the initial phase of microbial degradation of pyrogenic plant residues in soil.
Organic Geochemistry, 40, 332–342.
Hilscher A; Knicker H. 2011. Carbon and nitrogen degradation on molecular scale of grass-
derived pyrogenic organic material during 28 months of incubation in soil. Soil Biology &
Biochemistry, 43, 261–270.
Hilscher A; Knicker H. 2011. Degradation of grass-derived pyrogenic organic material,
transport of the residues within a soil column and distribution in soil organic matter
fractions during a 28 month microcosm experiment. Organic Geochemistry, 42, 42–54.
Hodge A; Fitter AH. 2010. Substantial nitrogen acquisition by arbuscularmycorrhizal fungi
from organic material has implications for N cycling. PNAS, 107, 13754-59.
Holm S. 1979. A simple sequentially rejective multiple test procedure. Scandinavian Journal
of Statistics, 6, 65–70.
Howieson J; Ballard R. 2004. Optimising the legume symbiosis in stressful and competitive
environments within southern Australia-some contemporary thoughts. Soil Biology &
Biochemistry, 36, 1261–1273.
Hungria M; Vargas MAT. 2000. Environmental factors affecting N2 fixation in grain legumes
in the tropics, with an emphasis on Brazil. Field Crops Research, 65, 151-164.
Hurlbert SH. 1984. Pseudoreplication and the design of ecological field experiments.
Ecological Monographs, 54, 187-211.
Ishii T; Kadoya K. 1994. Effects of charcoal as a soil conditioner on citrus growth and
vesicular–arbuscular mycorrhizal development. Journal of Japanese Society of
Horticultural Science, 63, 529–535.
Janssen BH. 1984. A simple method for calculating decomposition and accumulation of 'young'
soil organic matter. Plant and Soil, 76, 297-304.
Janzen MM. 2006. The soil carbon dilemma: Shall we hoard it or use it? Soil Biology and
Biochemistry, 38, 419–424.
Jeffery S; Bezemer TM; Cornelissen G; Kuyper TW; Lehmann J; Mommer L; Sohi SP; Van de
Voorde TFJ; Wardle DA; Van Groenigen JW. 2013. The way forward in biochar research:
targeting trade-offs between the potential wins. Global Change Biology and Bioenergy.
doi: 10.1111/gcbb.12132.
Jeffery S; Verheijen FGA; Bastos AC; van der Velde M. 2014. A comment on ‘Biochar and its
effects on plant productivity and nutrient cycling: a meta-analysis’: on the importance of
accurate reporting in supporting a fast-moving research field with policy implications.
Global Change Biology and Bioenergy, 6, 176–179.
Jeffery S; Verheijen FGA; van der Velde M; Bastos AC. 2011. A quantitative review of the
effects of biochar application to soils on crop productivity using meta-analysis.
Agriculture, Ecosystems & Environment, 144, 175–187.
Jones DL; Murphy DV; Khalid M; Ahmad W; Edwards-Jones G; DeLuca TH. 2011. Short-
term biochar-induced increase in soil CO2 release is both biotically and abiotically
mediated. Soil Biology & Biochemistry, 43, 1723-1731.

References
101
Jones DL; Rousk J; Edwards-Jones G; DeLuca TH; Murphy DV. 2012. Biochar-mediated
changes in soil quality and plant growth in a three year field trial. Soil Biology &
Biochemistry, 45, 113-124.
Kaschuk G; Leffelaar PA; Giller KE; Alberton O; Hungria M; Kuyper TW. 2010. Responses
of legumes to rhizobia and arbuscular mycorrhizal fungi: A meta-analysis of potential
photosynthate limitation of symbioses. Soil Biology & Biochemistry, 42, 125-127.
Keith A; Singh B; Singh BP. 2011. Interactive priming of biochar and labile organic matter
mineralization in a smectite-rich soil. Environmental science & technology, 45, 9611–8.
Kelly J; Lambert MJ; Turner J. 1983. Available phosphorus forms in forest soils and their
possible ecological significance. Communications in Soil Science and Plant Analysis, 14,
1217-1234.
Khodadad CLM; Zimmerman AR; Green SJ; Uthandi S; Foster JS. 2011. Taxa-specific changes
in soil microbial community composition induced by pyrogenic carbon amendments. Soil
Biology & Biochemistry, 43, 385-392.
Knicker K; González-Vila FJ; González-Vázquez R. 2013. Biodegradability of organic matter
in fire-affected mineral soils of Southern Spain. Soil Biology & Biochemistry, 56, 31-39.
Köpke U; Nemecek T. 2010. Ecological services of faba bean. Field Crops Research, 115, 217–233.
Koske RE; Gemma JN. 1989. A modified procedure for staining roots to detect VA
mycorrhizas. Mycological Research, 92, 486-488.
Kuzyakov Y; Friedel JK; Stahr K. 2000. Review of mechanisms and quantification of priming
effects. Soil Biology and Biochemistry, 32, 1485-1498.
Kuzyakov Y; Subbotina I; Chen H; Bogomolova I; Xu X. 2009.Black carbon decomposition
and incorporation into soil microbial biomass estimated by 14C labelling. Soil Biology and
Biochemistry, 41, 210–219.
Laird DA; Fleming P; Wang B; Horton R; Karlen D. 2010. Biochar impact on nutrient leaching
from a Midwestern agricultural soil. Geoderma, 158, 436–442.
Larimer AL; Bever JD; Clay K. 2010. The interactive effects of plant microbial symbionts:
review and meta-analysis. Symbiosis, 51, 139-148.
LeCroy C; Masiello CA; Rudgers JA; Hockaday WC; Silberg JJ. 2013. Nitrogen, biochar, and
mycorrhizae: Alteration of the symbiosis and oxidation of the char surface. Soil Biology &
Biochemistry, 58, 248-254.
Lehmann A; Veresoglou SD; Leifheit EF; Rillig MC. 2014. Arbuscular mycorrhizal influence
on zinc nutrition in crop plants - A meta-analysis. Soil Biology & Biochemistry, 69, 123-
131.
Lehmann J. 2007. A handfull of carbon. Nature, 447, 143-144.
Lehmann J. 2007. Bioenergy in the black. Front Ecol Environ, 5, 381–387.
Lehmann J; Gaunt J; Rondon M. 2006. Bio-char sequestration in terrestrial ecosystems – a
review. Mitigation and Adaptation Strategies for Global Change, 11, 403–427.
Lehmann J; Joseph S. 2009. Biochar for Environmental Management: An Introduction. In:
Lehmann J; Joseph S. (Eds.). Biochar for Environmental Management: Science and
technology. Earthscan, Dunstan House, London, UK. p. 1-12.
Lehmann J; Rillig MC; Thies J; Masiello CA; Hockaday WC; Crowley D. 2011. Biochar effects
on soil biota - A review. Soil Biology & Biochemistry, 43, 1812-1836.
Lehmann J; Rondon M. 2006. Biochar soil management on highly weathered soils in the humid
tropics. In: Uphoff N et al. (Eds.). Biological approaches to sustainable soil systems. Boca
Raton, USA: CRC Press, Taylor & Francis Group, p. 517–530.

References
102
Lehmann J; Silva Júnior JP; Steiner C; Nehls T; Zech W; Glaser B. 2003. Nutrient availability
and leaching in an archaeological Anthrosol and a Ferralsol of the Central Amazon basin:
fertilizer, manure and charcoal Amendments. Plant and Soil, 249, 343–357.
Liang B; Lehmann J; Solomon D; Kinyangi J; Grossman J; O’Neill B; Skjemstad JO; Thies J;
Luizão FJ; Petersen J; Neves EG. 2006. Black Carbon Increases Cation Exchange Capacity
in Soils. Soil Science Society of America Journal, 70, 1719–1730.
Liang B; Lehmann J; Solomon D; Sohi S; Thies JE; Skjemstad JO; Luizão F.J; Engelhard MH;
Neves EG; Wirick S. 2008. Stability of biomass-derived black carbon in soils. Geochimica
et Cosmochimica Acta, 72, 6069–6078.
Liao JP; Lin XG; Cao ZH; Shi YQ; Wong MH. 2003. Interaction between arbuscular
mycorrhiza and heavy metals under sand culture experiment. Chemosphere, 50, 847-853.
Liu X; Zhang A; Ji C; Joseph S; Bian R; Li L; Pan G; Paz-Ferreiro J. 2013. Biochar’s effect on
crop productivity and the dependence on experimental conditions-a meta-analysis of
literature data. Plant and Soil, 373, 583-594.
Lu W; Ding W; Zhang J; Li Y; Luo J; Bolan N; Xie Z. 2014. Biochar suppressed the
decomposition of organic carbon in a cultivated sandy loam soil: A negative priming effect.
Soil Biology & Biochemistry, 76, 12-21.
Luo Y; Durenkamp M; Nobili M; Lin Q; Brookes PC. 2011. Short term soil priming effects
and the mineralisation of biochar following its incorporation to soils of different pH. Soil
Biology and Biochemistry, 43, 2304-2314.
Maestrini B; Nannipieri P; Abiven S. 2014. A meta-analysis on pyrogenic organic matter
induced priming effect. Global Change Biology and Bioenergy. doi: 10.1111/gcbb.12194.
Maia C; Madari B; Novotny E. 2011. Advances in biochar research in Brazil. Dynamic Soil
Dynamic Plant, 5, 52-58.
Major J; Lehmann J; Rondon M; Goodale C. 2010. Fate of soil-applied black carbon: downward
migration, leaching and soil respiration. Global Change Biology, 16, 1366–1379.
Masiello CA; Chen Y; Gao X; Liu S; Cheng HY; Bennett MR; Rudgers JA; Wagner DS;
Zygourakis K; Silberg JJ. 2013. Biochar and Microbial Signaling: Production Conditions
Determine Effects on Microbial Communication. Environmental Science and Technology,
47, 11496−11503.
Matsubara Y-I; Hasegawa N; Fukui H. 2002. Incidence of Fusarium root rot in asparagus
seedlings infected with arbuscular mycorrhizal fungus as affected by several soil
amendments. Journal of the Japanese Society for Horticultural Science, 71, 370–374.
Melo FB; Cavalcante AC; Andrade Júnior AS; Bastos EA. 2004. Levantamento detalhado dos
solos da area da Embrapa Meio-Norte/UEP-Parnaíba. Embrapa Meio-Norte, Teresina. 25p.
(Embrapa Meio-Norte. Documentos, 89).
Melo VF; Schaefer CEGR; Singh B; Novais RF; Fontes MPF. 2002. Propriedades químicas e
cristalográficas da caulinita e dos óxidos de ferro em sedimentos do grupo Barreiras no
município de Aracruz, estado do Espírito Santo. Revista Brasileira de Ciência do Solo, 26,
53-64.
Méndez A; Tarquis AM; Saa-Requejo A; Guerrero F; Gasco G. 2013. Influence of pyrolysis
temperature on composted sewage sludge biochar priming effect in a loamy soil.
Chemosphere, 93, 668–676.
Mia S; van Groenigen JW; van de Voorde TFJ; Oram NJ; Bezemer TM; Mommer L; Jeffery,
S. 2014. Biochar application rate affects biological nitrogen fixation in redclover
conditional on potassium availability. Agriculture, Ecosystems and Environment, 191, 83-
91.
Mitchell RJ. 1993. Path analysis: Pollination. In: Scheiner SM; Gurevitch J. (Eds.). Design and
analysis of ecological experiments. Chapman &Hall, New York. p. 211-231.
Mukherjee A; Lal R. 2014. The biochar dilemma. Soil Research, 52, 217–230.
References
103
Muriithi-Muchane MN. 2013. Influences of agricultural management practices on Arbuscular
Mycorrhizal Fungal symbioses in Kenyan agro-ecosystems. PhD Thesis, Wageningen
University, The Netherlands.
Murphy J; Riley JP. 1962. A modified single solution method for the determination of
phosphate in natural waters. Analytica Chimica Acta, 27, 31–36.
Nelissen V; Rütting T; Huygens D; Staelens J; Ruysschaert G; Boeckx P. 2012. Maize biochars
accelerate short-term soil nitrogen dynamics in a loamy sand soil. Soil Biology &
Biochemistry, 55, 20-27.
Nelson DW; Sommers LE. 1996. Total carbon, organic carbon, and organic matter. In: Black
CA. (ed.). Methods of soil analysis. Part 3. Chemical methods. Madison, Soil Science of
America and American Society of Agronomy. p. 961-2010.
Nishio M; Okano S. 1991. Stimulation of the growth of alfalfa and infection of mycorrhizal
fungi by the application of charcoal. Bulletin of the National Grassland Research Institute,
45, 61–71.
Norman J; Kucharik C. 1997. A comparison of six methods for measuring soil‐surface carbon
dioxide fluxes. Journal of Geophysical Research, 102, 771–777.
Novak JM; Busscher WJ; Watts DW; Laird DA; Ahmedna MA; Niandou MAS. 2010. Short-
term CO2 mineralization after additions of biochar and switchgrass to a Typic Kandiudult.
Geoderma, 154, 281–288.
Novotny EH; Hayes MHB; Madari BE; Bonagamba TJ; de Azevedo ER; de Souza AA; Song
GX; Nogueira CM; Mangrich AS. 2009. Lessons from the Terra Preta de Indios of the
Amazon region for the utilisation of charcoal for soil amendment. Journal of the Brazilian
Chemical Society, 20, 1003–1010.
Ohsowski; BM; Klironomos JN; Dunfield KE; Hart MM. 2012. The potential of soil
amendments for restoring severely disturbed grasslands. Applied Soil Ecology, 60, 77–83.
Orwin RG. 1983. A Fail-Safe N for Effect Size in MA. Journal of Educational and Behavioural
Statistics, 8, 157–159.
Painter TJ. 2001. Carbohydrate polymers in food preservation: An integrated view of the
Maillard reaction with special reference to the discoveries of preserved foods in Sphagnum
dominated peat bogs. Carbohydrate Polymers, 36, 335-347.
Paustian K; Andren O; Janzen HH; La1 R; Smith P; Tian G; Tiessen H; Van Noordwijk M;
Woorner PL. 1997. Agricultural soils as a sink to mitigate CO2 emissions. Soil Use and
Management, 13, 230-244.
Pereira RC; Arbestain MC; Kaal J; Sueiro MV; Sevilla M; Hindmarsh J. 2014. Detailed carbon
chemistry in charcoals from pre-European Māori gardens of New Zealand as a tool for
understanding biochar stability in soils. European Journal of Soil Science, 65, 83–95.
Pessenda LCR; Gouveia SEM; Aravena R. 2001. Radiocarbon dating of total soil organic
matter and humin fraction and its comparison with 14C ages of fossil charcoal.
Radiocarbon, 43, 595–601.
Powlson DS; Whitmore AP; Goulding KWT. 2011. Soil carbon sequestration to mitigate
climate change: a critical reexamination to identify the true and the false. European Journal
of Soil Science, 62, 42–55.
Provorov NA; Borisov AY; Tikhonovich IA. 2002. Developmental Genetics and Evolution of
Symbiotic Structures in Nitrogen-fixing Nodules and Arbuscular Mycorrhiza. Journal of
Theoretical Biology, 214, 215-232.
Quilliam RS; DeLuca TH; Jones DL. 2013. Biochar application reduces nodulation but
increases nitrogenase activity in clover. Plant and Soil, 366, 83–92.
Quilliam RS; Glanville HC; Wade SC; Jones DL. 2013. Life in the ‘charosphere’ - Does biochar
in agricultural soil provide a significant habitat for microorganisms? Soil Biology &
Biochemistry, 65, 287-293.

References
104
Rajput RP; Tilak KVBR; Sastry PSN. 1983. Effect of Soil Amendments on improvement of
nodulation in soybean (Glycine max) in problem soil. Zentralblatt Fur Mikrobiologie, 138,
217-221.
RELARE. 1995. Reunião de laboratórios para recomendação de estirpes de Rhizobium e
Bradyrhizobium, 6. In: Simpósio brasileiro sobre microbiologia do solo, 3., Londrina.
Anals... Londrina, IAPAR/Embrapa CNPSo. p. 475-489.
Richardson AE; Barea JM; McNeill AM; Prigent-Combaret C. 2009. Acquisition of phosphorus
and nitrogen in the rhizosphere and plant growth promotion by microorganisms. Plant and
Soil, 321, 305–339.
Rillig MC; Wagner M; Salem, M.; Antunes, P.M.; George, C. Ramke, H.G.; Titirici, M.M.;
Antonietti, M. 2010. Material derived from hydrothermal carbonization: Effects on plant
growth and arbuscular mycorrhiza. Applied Soil Ecology, 45, 238–242.
Ritchie S; Hanway JJ; Thompson HE. 1982. How a Soybean Plant Develops. Ames, Iowa State
University of Science and Technology, Coop. Ext. Serv.. 20 p.
Rondon MA; Lehmann J; Ramírez J; Hurtado M. 2007. Biological nitrogen fixation by common
beans (Phaseolus vulgaris L.) increases with bio-char additions. Biology and Fertility of
Soils, 43, 699–708.
Roscoe R; Buurman P; Velthorst EJ; Vasconcellos CA. 2001. Soil organic matter dynamics in
density and particle size fractions as revealed by the 13C/12C isotopic ratio in a Cerrado’s
oxisol. Geoderma, 104, 185–202.
Rosenberg MS; Adams DC; Gurevitch J. 2000. MetaWin Statistical Software for Meta-
Analysis, Version 2. Department of Ecology and Evolution, State University of New York
at Stony Brook. Sinauer Associates, Inc., Sunderland, Massachusetts.
Rosenthal R; Rosnow R. 1991. Essentials of Behavioural Research: Methods and Data
Analysis. McGraw Hill.
Rothstein H; Sutton A; Borenstein M. 2005. Publication Bias in MA: Prevention, Assessment
and Adjustments. Wiley, Hoboken, NJ.
Rutto KL; Mizutani F. 2006. Effect of Mycorrhizal Inoculation and Activated Charcoal on
Growth and Nutrition in Peach (Prunus persica Batsch) Seedlings Treated with Peach
Root-Bark Extracts. Journal of the Japanese Society for Horticultural Science, 75, 463–
468.
Saito N. 1989. Charcoal as a micro-habitat for VA mycorrhizal fungi, and its practical
implication. Agriculture, Ecosystems and Environment, 29, 341-344.
Salem M; Kohler J; Wurst S; Rillig MC. 2013. Earthworms can modify effects of hydrochar on
growth of Plantago lanceolata and performance of arbuscular mycorrhizal fungi.
Pedobiologia, 56, 219-224.
Salinas-Garcia JR; Hons FM; Matocha JE. 1997. Long-term effects of tillage and fertilization
on soil organic matter dynamics. Soil Science Society of America Journal, 61, 152–159.
Salvagiotti F; Cassman KG; Specht JE; Walters DT; Weiss A; Dobermann A. 2008. Nitrogen
uptake, fixation and response to fertilizer N in soybeans: A review. Field Crops Research,
108, 1–13.
Santos F; Torn MS; Bird JA. 2012. Biological degradation of pyrogenic organic matter in
temperate forest soils. Soil Biology and Biochemistry, 51, 115-124.
SAS Institute Inc. 2009. SAS.STAT™ 9.2 User’s Guide, Second Edition. Cary, NC: SAS
Institute Inc. 7869p.
Schmidt MWI; Torn MS; Abiven S; Dittmar T; Guggenberger G; Janssens IA; Kleber M;
Kögel-Knabner I; Lehmann J; Manning DAC; Nannipieri P; Rasse DP; Weiner S;
Trumbore SE. 2011. Persistence of soil organic matter as an ecosystem property. Nature,
478, 49-56.

References
105
Schumacher BA. 2002. Methods for the determination of total organic carbon (TOC) in soils
and sediments. United States Environmental Protection Agency. Ecological Risk
Assessment Support Center-ERASC. 23p.
Sfredo GJ. 2008. Soja no brasil: calagem, adubação e nutrição mineral. Embrapa Soja,
Londrina: 148p. (Embrapa Soja. Documentos, 305).
Shearer GB; Kohl DH. 1986. N2-fixation in field settings: estimations based on natural 15N
abundance. Australian Journal of Plant Physiology, 13, 699-756.
Singh BP; Cowie AL. 2014. Long-term influence of biochar on native organic carbon
mineralisation in a low-carbon clayey soil. Scientific reports, 4, 3687.
Singh BP; Hatton BJ; Singh B; Cowie AL; Kathuria A. 2010. Influence of biochars on nitrous
oxide emission and nitrogen leaching from two contrasting soils. Journal of Environmental
Quality, 37, 1432–1438.
Sisti CPJ; Santos HP; Kohhann R; Alves BJR; Urquiaga S; Boddey RM. 2004.Change in carbon
and nitrogen stocks in soil under 13 years of conventional or zero tillage in southern Brazil.
Soil and Tillage Research, 76, 39–58.
Smith JL; Collins HP; Bailey VL. 2010. The effect of young biochar on soil respiration. Soil
Biology & Biochemistry, 42, 2345–2347.
Solaiman ZM; Blackwell P; Abbott LK; Storer P. 2010. Direct and residual effect of biochar
application on mycorrhizal root colonisation, growth and nutrition of wheat. Australian
Journal of Soil Research, 48, 546–554.
Steinbeiss S; Gleixner G; Antonietti M. 2009. Effect of biochar amendment on soil carbon
balance and soil microbial activity. Soil Biology & Biochemistry, 41, 1301–1310.
Steiner C; Das KC; Garcia M; Förster B; Zech W. 2008. Charcoal and smoke extract stimulate
the soil microbial community in a highly weathered Xanthic Ferralsol. Pedobiologia, 51,
359-366.
Stevens J. 1996. Applied multivariate statistics for the social sciences. 3rd ed. Lawrence
Erlbawn, Hillsdale, NJ. 734 pp.
Stewart CE; Zheng J; Botte J; Cotrufo MF. 2013. Co-generated fast pyrolysis biochar mitigates
greenhouse gas emissions and increases carbon sequestration in temperate soils. Global
Change Biology & Bioenergy, 5, 153–164.
Sun Y; Gao B; Yao Y; Fang J; Zhang M; Zhou Y; Chen H; Yang L. 2014. Effects of feedstock
type, production method, and pyrolysis temperature on biochar and hydrochar properties.
Chemical Engineering Journal, 240, 574–578.
Swisher R; Carroll G. 1980. Fluorescein diacetate hydrolysis as an estimator of microbial
biomass on coniferous needle surfaces. Microbial ecology, 226, 217–226.
Tabatabai MA; Bremner JM. 1969. Use of p-nitrophenyl phosphate for assay of soil
phosphatase activity. Soil Biology and Biochemistry, 1, 301-307.
Tagoe SO; Horiuchi T; Matsui T. 2008. Effects of carbonized and dried chicken manures on
the growth, yield, and N content of soybean. Plant and Soil, 306, 211–220.
Tedesco MJ; Gianello C; Bissani CA; Bohnen H; Volkweiss SJ 1995. Análises de solo, plantas
e outros materiais. 2.ed. Universidade Federal do Rio Grande do Sul, Porto Alegre. 147p.
(Boletim Técnico, 5).
Tiessen H; Cuevas E; Chacon P. 1994. The role of soil organic matter in sustaining soil fertility.
Nature, 371, 783-785.
Turner ER. 1955. The effect of certain adsorbents on the nodulation of clover plants. Annals of
Botany, 19, 149-160.
Tyson JF. 1985. Flow Injection analysis techniques for atomic-absorption spectrometry. A
review. Analyst, 110, 419-429.

References
106
Urquiaga S; Cruz KHS; Boddey RM. 1992. Contribution of nitrogen fixation to sugar cane:
nitrogen-15 and nitrogen-balance estimates. Soil Science Society of America Journal, 56,
105-114.
Van Hofwegen G; Kuyper TW; Hoffland E; Van den Broek JA; Becx GA. 2009. Opening the
Black Box: Deciphering Carbon and Nutrient Flows in Terra Preta. In: Woods WI; Teixeira
WG; Lehmann J; Steiner C; Winkler-Prins AMGA; Rebellato L (Eds). Amazonian Dark
Earths: Wim Sombroek's Vision. Dordrecht: Springer. p. 393-409.
Vance CP. 2001. Symbiotic nitrogen fixation and phosphorus acquisition. Plant nutrition in a
world of declining renewable resources. Plant Physiology, 127, 390–397.
Vantsis JT; Bond G. 1950. The effect of charcoal on the growth of leguminous plants in sand
culture. Annals of Applied Biology, 37, 159-168.
Veresoglou SD; Chen B; Rillig MC. 2012 Arbuscular mycorrhiza and soil nitrogen cycling.
Soil Biology & Biochemistry, 46, 53-62.
Verheijen FGA; Graber ER; Ameloot N; Bastos AC; Sohi SP; Knicker H. 2014. Biochar in
soils: new insights and emerging research. European Journal of Soil Science, 65, 22-27.
Verheijen FGA; Jeffery S; Bastos AC; van der Velde M; Diafas I. 2010. Biochar application to
soils - a critical scientific review of effects on soil properties, processes and functions. EUR
24099 EN, Luxembourg: Office for the Official Publications of the European
Communities.
Vierheilig H; Steinkellner S; Khaosaad T; Garcia-Garrido J.M. 2008. The biocontrol effect of
mycorrhization on soilborne fungal pathogens and the autoregulation of the AM symbiosis:
one mechanism, two effects? In: Varma A. (ed.). Mycorrhiza: genetics and molecular
biology, eco-funtion, biotehcnology, eco-physiology, structure and systematics. 3rd Ed.
Springer-Verlag Berlin Heidelberg. p. 307-320.
Waluyo SH; Lie TA; Mannetje L. 2004. Effect of phosphate on nodule primordial of soybean
(Glycine max) in acid soils in rhizotron experiments. Indonesian Journal of Agricultural
Science, 5, 27–44.
Wardle DA; Nilsson MC; Zackrisson O. 2008. Fire-derived charcoal causes loss of forest
humus. Science, 320, 629.
Warnock DD; Lehmann J; Kuyper TW; Rillig MC. 2007. Mycorrhizal responses to biochar in
soil – concepts and mechanisms. Plant and Soil, 300, 9–20.
Warnock DD; Mummey DL; McBride B; Major J; Lehmann J; Rillig MC. 2010. Influences of
non-herbaceous biochar on arbuscular mycorrhizal fungal abundances in roots and soils:
Results from growth-chamber and field experiments. Applied Soil Ecology, 46, 450–456.
Wilson GWT; Rice CW; Rillig MC; Springer A; Hartnett DC. 2009. Soil aggregation and
carbon sequestration are tightly correlated with the abundance of arbuscular mycorrhizal
fungi: results from long-term field experiments. Ecology Letters, 12, 452–461.
Woolf D; Amonette JE; Street-Perrott FA; Lehmann J; Joseph S. 2010. Sustainable biochar to
mitigate global climate change. Nature Communications, 1, 1–9.
Yamato M; Okimori Y; Wibowo IF; Anshori S; Ogawa M. 2006. Effects of the application of
charred bark of Acacia mangium on the yield of maize, cowpea and peanut, and soil
chemical properties in South Sumatra, Indonesia. Soil Science and Plant Nutrition, 52,
489–495.
Yu L; Tang J; Zhang R; Wu Q; Gong M. 2013. Effects of biochar application on soil methane
emission at different soil moisture levels. Biology and Fertility of Soils, 49, 119–128.
Zackrisson O; Nilsson MC; Wardle DA. 1996. Key ecological function of charcoal from
wildfire in the Boreal forest. Oikos, 77, 10-19.
Zheng H; Wang Z; Deng X; Herbert S; Xing B. 2013. Impacts of adding biochar on nitrogen
retention and bioavailability in agricultural soil. Geoderma, 206, 32–39.

References
107
Zimmerman AZ; Gao B; Ahn MY. 2011. Positive and negative carbon mineralization priming
effects among a variety of biochar-amended soils. Soil Biology & Biochemistry, 43, 1169-
1179.


Summary
109
Summary
Pyrogenic organic matter (PyOM), also known as biochar, is the product of biomass combustion
under low oxygen concentration. There is currently a growing interest in research on the use of
PyOM as a soil amendment, inspired by the existence of highly fertile, PyOM-rich
anthropogenic soils in the Amazon basin. The presence of PyOM in these so-called Amazonian
Dark Earths (ADE) in quantities larger than in the non-anthropogenic surrounding soils is
considered one of the main reasons for their high fertility.
Soil additions of PyOM have been suggested to increase soil fertility and crop yields,
simultaneously providing additional important environmental services. The offset of CO2
emissions through sequestration of a larger pool of recalcitrant soil organic carbon (SOC) is
one of these services. This would at the same time sustain soil microbial activity, which is
directly associated to soil quality, for instance, nutrient cycles and plant growth. This multiple
win scenario suggests that the addition of PyOM to the soil would be the solution for the
“carbon dilemma”. The dilemma states that the main biological benefits from soil organic
matter are a consequence of its decay. Therefore, it is unlikely that increased C sequestration
and the benefits from its decay can be simultaneously maximized. Rather than win-win, PyOM
would then also be subjected to inevitable trade-offs.
Additions of PyOM can modify the turnover rate of native SOC by either accelerating or
decelerating its decomposition through a mechanism known as priming. Although positive
priming by PyOM has been reported, negative priming has also been found. The higher amount
of non-pyrogenic C in ADE, compared to non-anthropogenic surrounding soils has been
considered evidence that PyOM can stabilize SOC in the long-term. A complicating issue in
studies is that short-term increases in CO2 emission can be due to decomposition of labile
PyOM fractions, erroneously suggesting positive priming of SOC. Addition of PyOM can also
lead to modifications in the microbial activity and assemblages. Changes in microbial
populations can have impacts on their functionality, favouring mutualistic root symbioses such
as the arbuscular mycorrhizal fungal (AMF) symbiosis and the rhizobial symbiosis with
legumes that is responsible for biological nitrogen fixation (BNF). Although soil amendments
with PyOM can stimulate AMF and BNF, results are contrasting and mechanisms are not clear.
Most studies of PyOM effects on SOC and on mutualistic root symbioses are from short-term
experiments, often conducted in greenhouse or laboratory. Although such studies provide
insights in potential factors driving changes in SOC and symbiotic relationships in PyOM-
amended soils, they do not assess changes under realistic conditions over periods of time longer
that one or a few cropping cycles. Therefore, there is still a gap in our understanding regarding
the duration and magnitude of effects over time under field conditions and possible mechanisms
involved. This thesis addresses these gaps.
The aim of this research was to provide a better understanding of interactions between PyOM
and SOC and the factors controlling symbiotic patterns in a tropical soil amended with PyOM.

Summary
110
To reach this aim, I combined greenhouse and field studies. I also used meta-analytic methods
in order to quantitatively synthesize data in literature.
In Chapter 2, I combined the results of 46 studies in a meta-analysis. I investigated changes in
CO2 emission patterns from an array of PyOM-amended soils and identified the causes of these
changes and the possible factors involved. I showed an overall increase of 29% in CO2 emission
from PyOM-amended soils. Such increases were only evident in soils amended with a PyOM-
C (PyC):SOC ratio >2. These data are consistent with the hypothesis that increased CO2
emission after PyOM addition is additive and mainly derived from PyOM’s labile C fractions
rather than from SOC. Therefore, positive priming is not a main driver of increases in CO2
emission in PyOM-amended soils. This PyC:SOC ratio provided the best predictor of increases
in CO2 production after PyOM addition to soil. This meta-analysis indicates (i) the importance
of taking into account the amount of applied PyC in relation to SOC for designing future
decomposition experiments and that (ii) the recalcitrance of PyOM in soil-PyOM mixtures may
be less than usually assumed.
A technical problem of separating PyOM-induced priming on SOC from other non-additive
interactions is the uncertainty regarding the origin of the respired CO2 (whether from SOC or
PyOM). This issue can only be solved with the use of isotopes. In a field study (Chapter 3), I
quantified changes in the PyOM and SOC stocks over four soybean cropping cycles (CC) in a
sandy Ferralsol, previously supporting a vegetation with C4 plants, amended with different
rates of PyOM (0, 5, 10, 20 and 40 Mg ha-1). The PyOM was produced from C3 woody species
using traditional pyrolysis methods employed in Northeast Brazil. I used 13C isotopic analysis
to discriminate the origin of the C in the soil and quantify the decomposition rates of native
SOC and PyOM. I showed that decomposition of traditionally produced PyOM is faster (25-
60% within first year) than normally assumed (10-20% within 5-10 years), which was higher
than that of native SOC (5-14%). The data indicate preferential decomposition of PyOM
compared to native SOC. The intensity of that effect depends on the rate of PyOM applied to
the soil. Only on the longer term (>1 yr) addition of PyOM seems to stabilize SOC.
In Chapter 4 I explored mechanisms controlling AMF activity and crop yield in PyOM-
amended soils through the use of path analysis. I tested the effects of PyOM rates and P
fertilization on soybean root colonization by AMF, soil P and plant performance over four
cropping cycles (CCs). Data showed a major effect of CC and P, as well an interaction effect
of PyOM x CC on mycorrhizal colonization. There was a linear decrease in root colonization
by AMF in CC1 with increasing PyOM rates in contrast to a consistent linear increase in CC4.
Plant performance was mainly affected by CC, but a significant interactive effect of PyOM x P
was also observed on grain yield. Grain yield was highest at high PyOM rates (20 and 40 Mg
ha-1) in the P-fertilized treatments in CC4. Soil pH increased in CC1 with increasing PyOM
rates, but no effects were observed in CC4. Path analysis indicated that PyOM effects on root
colonization by AMF were not mediated by changes in soil pH or P content. My data are
consistent with the hypothesis that interference of PyOM in signalling processes is an important

Summary
111
driver of change in AMF activity and that positive effects of PyOM on AMF and crop yield
develop with time.
In Chapter 5, I assessed the effects of PyOM application rates and P fertilization on BNF in
soybean inoculated with Bradyrhizobium japonicum over four cropping cycles. Again I
observed that CC had a significant main effect on most dependent variables, while PyOM was
not a significant source of variation. There was a significant PyOM × CC interaction effect on
shoot N concentration. In CC1 shoot N concentration after application of 5 Mg PyOM was
significantly lower than that of plants grown on plots to which 10 or 20 Mg PyOM was applied.
In CC4 shoot N concentration was not affected by PyOM. The major effect of CC was explained
through changes in nutrient management, more specifically the addition of micronutrients in
CC3 and CC4. Alleviation of micronutrient deficiency increased BNF and also resulted in a
positive effect of P on BNF. I conclude that under conditions of adequate management, PyOM
application does not improve BNF in soybean.
In Chapter 6 (General Discussion) I synthesize the findings of the previous chapters and use
data from additional greenhouse and litterbag field experiments to integrate the results. Data
from Chapters 2 and 3 show that if any positive priming occurs due to PyOM addition, it is a
small short-term event and does not lead to significant losses of native SOC in the long-term.
This was confirmed by data from a 2 yr litterbag experiment, which showed no interaction
between decomposition of PyOM and fresh organic matter.
Stability of SOC has been considered an ecosystem property rather than a consequence of
recalcitrance, but this definition has not yet been extended to PyOM. In this thesis I
demonstrated that stability of PyOM can also be influenced by the soil environment. In order
to link PyOM effects to SOC and on root symbioses, I performed path analysis integrating root
colonization by AMF, SOC content and Ndfa in one model. We found no significant path
coefficients linking AMF and BNF. The model indicated a significant positive path coefficient
linking AMF root colonization and SOC in CC4, but not in CC1. The data suggest that PyOM
may increase SOC stability through increased AMF activity. Soil aggregation and C
sequestration are tightly correlated with abundance of AMF in the soil. I propose that the same
mechanism through which AMF stabilizes native SOC may also positively influence PyOM
stabilization in the long-term.
In conclusion, I have shown that main beneficial effects of PyOM on AMF and crop yield
develop with time, but in well-managed soils increased crop yield is not a direct consequence
of increased AMF due to PyOM addition. Finally, although PyOM additions represent an
effective form of sequestering C, positive effects of PyOM on crop yield are likely to occur
after partial decomposition of PyOM. Therefore, although some benefits of adding PyOM can
be simultaneously obtained (C sequestration and increased crop yield), they cannot be
simultaneously maximized. This means that the carbon dilemma can only be partially solved
by adding PyOM to the soil.

Samenvatting
113
Samenvatting
Verkoolde organische stof1 is het product dat ontstaat wanneer biomassa verbrand wordt bij
lage zuurstofbeschikbaarheid. In het vervolg van deze samenvatting wordt de term biochar
gebruikt. Er is thans sprake van een grote belangstelling voor onderzoek naar de gebruiks-
mogelijkheden van biochar ten behoeve van bodemverbetering. Dit onderzoek vindt zijn
inspiratie in het bestaan van zeer vruchtbare bodems die onder menselijke invloed ontstaan zijn
in het Amazonegebied. De aanwezigheid van biochar in deze Zwarte Aarde van de Amazone
(ook bekend als Terra Preta de Indio) in hoeveelheden die veel groter zijn dan in niet door de
mensen beïnvloede tropische bodems elders wordt verondersteld een belangrijke verklaring te
vormen voor de hoge bodemvruchtbaarheid.
Toevoeging van biochar aan de bodem zou leiden tot verhoogde bodemvruchtbaarheid en
hogere gewasopbrengsten, terwijl tegelijkertijd aanvullende belangrijke ecosysteemdiensten
geleverd worden. Het verminderen van uitstoot van CO2 door het vastleggen van koolstof in
een grote voorraad van zeer slecht afbreekbaar materiaal in bodemorganische koolstof vormt
een van deze ecosysteemdiensten. Tegelijkertijd wordt door deze toepassing de activiteit van
micro-organismen in de bodem bevorderd en dit is rechtstreeks gekoppeld aan belangrijke
bodemeigenschappen zoals bodemvruchtbaarheidskringlopen. Deze omstandigheid, vaak
beschreven als een win-win situatie, suggereert dat toevoegen van biochar aan de bodem dé
oplossing vormt voor wat omschreven wordt als het koolstofdilemma. Dit dilemma geeft aan
dat het voornaamste voordeel van bodemorganische stof een rechtstreeks gevolg is van zijn
afbraak. Om die reden gaat men er vaak van uit dat toegenomen koolstofvastlegging in de
bodem en de voordelen van afbraak van diezelfde koolstof niet tegelijkertijd gemaximaliseerd
kunnen worden. In plaats van dat biochar een win-win situatie creëert, is ook biochar onder-
hevig aan onvermijdelijke trade-offs tussen maximaliseren van de voorraad en maximaliseren
van de omzettingssnelheid.
Toevoegen van biochar aan de bodem kan de afbraaksnelheid van de oorspronkelijke bodem-
organische stof zowel versnellen als vertragen. Dit verschijnsel wordt priming genoemd. In de
literatuur zijn zowel voorbeelden van positieve priming (versnelde afbraak) als negatieve
priming (vertraagde afbraak) gerapporteerd. De grotere hoeveelheid (niet-verkoolde) koolstof
(die dus niet van biochar afkomstig is) in deze door de mens beïnvloede zwarte aarde ten op-
zichte van de omringende bodems wordt als sterke aanwijzing beschouwd dat biochar op
langere termijn bodemorganische stof kan stabiliseren. Maar men dient te bedenken dat bewijs
niet gemakkelijk is. In korte-termijnproeven wordt soms een verhoogde productie van CO2
gevonden na toevoegen van biochar. Deze toename kan het gevolg zijn van een relatief
gemakkelijk afbreekbare fractie in de biochar. Deze verhoogde productie kan, zonder nader
1 Organische stof die ontstaan is na verbranden of verkolen van organisch materiaal; ook wel bekend
als houtskool als algemeen begrip, of specifiek bekend als biochar wanneer dat gebruikt wordt voor
bodemtoepassingen

Samenvatting
114
onderzoek, echter gemakkelijk geïnterpreteerd worden als positieve priming (versnelde afbraak
van de oorspronkelijke bodemorganische stof). Toevoegen van biochar aan de grond kan ook
leiden tot verandering in de microbiële activiteit of in de samenstelling van de microbiële
gemeenschappen. Veranderingen in populaties van micro-organismen kunnen het functioneren
van bodemecosystemen beïnvloeden; een bekend voorbeeld is een effect op micro-organismen
die in plantenwortels voorkomen en die de plantengroei bevorderen. Voorbeelden hiervan zijn
rhizobia (stikstofbindende bacteriën bij vlinderbloemigen) en arbusculaire-
mycorrhizaschimmels (die bij vrijwel alle planten voorkomen). Hoewel beschreven is dat toe-
voegen van biochar aan de bodem positieve effecten heeft op biologische stikstofbinding en op
arbusculaire mycorrhiza, is het totaalbeeld nog onduidelijk, doordat ook tegengestelde
resultaten zijn gerapporteerd. De mechanismen van de reactie van deze micro-organismen op
biochar zijn nog niet of nauwelijks bekend. Het merendeel van het onderzoek naar de effecten
van biochar op bodemorganische stof en op zulke voordelige wortelsymbioses betreft onder-
zoek met kortdurende proeven, dikwijls uitgevoerd in het lab en in de kas en maar zelden in het
veld. Hoewel zulk onderzoek zeker inzicht geeft in mogelijke factoren die veranderingen in
bodemorganische stof en in deze wortelsymbioses veroorzaken, geeft het onvoldoende inzicht
in veranderingen over de langere termijn (meer dan een of enkele oogsten) onder meer
realistische omstandigheden. Er is daarom sprake van een gebrek aan kennis met betrekking tot
de duur en de grootte van het effect van biochar in de tijd onder veldomstandigheden, in het
bijzonder waar het mogelijke mechanismen betreft. Mijn proefschrift levert een bijdrage aan
het onderzoek naar deze kennisleemte.
Het doel van mijn onderzoek was het verkrijgen van een beter begrip van de wisselwerking
tussen biochar en bodemorganische stof en de factoren die van invloed zijn op het functioneren
van deze voordelige wortelsymbioses na toevoeging van biochar in een tropische bodem. In
mijn onderzoek combineerde ik studies in de kas en in het veld. Ik voerde ook een zogenaamde
meta-analyse uit om de gepubliceerde onderzoeksresultaten kwantitatief te kunnen
samenvatten.
In hoofdstuk 2 combineer ik de resultaten van 46 wetenschappelijke artikelen in een meta-
analyse. Ik onderzocht de veranderingen in de uitstoot van CO2 van een groot aantal verschil-
lende gronden waaraan biochar was toegevoegd, en identificeerde de oorzaken van deze ver-
anderingen en de mogelijk betrokken factoren. Het onderzoek liet zien dat gemiddeld over alle
studies toevoegen van biochar aan de grond leidde tot een toename in CO2 uitstoot van de grond
met 29%. Een nauwkeuriger analyse liet echter zien dat een toename alleen waarneembaar was
in bodems waarin relatief grote hoeveelheden biochar waren toegevoegd, dat wil zeggen
bodems waar de verhouding tussen de koolstof van de toegevoegde biochar en de koolstof van
de bodemorganische stof groter dan twee was. Mijn gegevens zijn in overeenstemming met de
hypothese dat de toegenomen productie van CO2 na toevoegen van biochar hoofdzakelijk
veroorzaakt wordt door de afbraak van de labiele component in biochar en dat er geen sprake
is van een interactie tussen de afbraak van biochar en bodemorganische stof (priming;
versnellen of vertragen van de afbraak als gevolg van die interactie). Ik concludeer daarom dat

Samenvatting
115
positieve priming niet de oorzaak is van toename in CO2-emissies uit gronden waaraan biochar
is toegevoegd. Deze verhouding tussen koolstof uit biochar en koolstof van bodemorganische
stof vormde de beste voorspeller van de toename van CO2 productie na toepassing van biochar.
Mijn meta-analyse leidt tot de conclusies dat (i) het belangrijk is rekening te houden met de
hoeveelheid biochar die aan grond wordt toegevoegd ten opzichte van de voorraad
bodemorganische stof wanneer proeven worden opgezet; en dat (ii) de veronderstelde zeer
slechte afbreekbaarheid van biochar niet geheel juist is, doordat biochar een aanzienlijke
hoeveelheid meer labiele koolstof kan bevatten.
Het onderzoek naar wederzijdse interactie tussen afbraak van biochar en bodemorganische stof
wordt bemoeilijkt doordat we in het veld, zonder speciale technieken, niet kunnen vaststellen
of de extra geproduceerde CO2 hoofdzakelijk afkomstig is van biochar of van de
bodemorganische stof. Dit technische probleem kan echter worden opgelost door gebruik te
maken van stabiele isotopen van koolstof. In een veldproef, die beschreven wordt in hoofdstuk
3, kwantificeerde ik veranderingen in de voorraden van biochar en bodemorganische stof na
vier cycli van groei van het gewas sojaboon. De proef werd uitgevoerd in een zandige,
voedselarme bodem (een ferralsol met de voor tropische gronden kenmerkende roestkleur),
waar voordien een vegetatie groeide die bestond uit zogenaamde C4-planten. De biochar, die
werd toegevoegd in hoeveelheden van 0, 5, 10, 20 en 40 ton per hectare), was afkomstig van
zogenaamde C3-planten. De biochar werd geproduceerd met behulp van traditionele pyrolyse-
technieken zoals die thans nog gebruikt worden door de arme boerenbevolking in noordoost
Brazilië. Ik maakte gebruik van de analyse van de stabiele isotoop 13C om onderscheid te maken
tussen de twee bronnen van koolstof in de grond (biochar en organische stof). Ook
kwantificeerde ik de relatieve afbraak van zowel biochar als bodemorganische stof. De resul-
taten van dit experiment lieten zien dat de afbraak van traditioneel geproduceerde biochar veel
sneller is (25-60% werd afgebroken in één jaar) dan meestal in de literatuur wordt verondersteld
(10-20% afbraak in een periode van vijf tot tien jaar). De afbraak van biochar was ook veel
sneller dan van bodemorganische stof (5-15% per jaar). De resultaten laten dus zien dat biochar
preferentieel wordt afgebroken ten opzichte van bodemorganische stof. De intensiteit van dat
effect lijkt een functie van de hoeveelheid toegevoegde biochar. Op de langere termijn (periodes
langer dan één jaar) lijkt biochar wel bodemorganische stof te stabiliseren.
In hoofdstuk 4 verken ik mechanismen die het effect verklaren van toevoegen van biochar op
de activiteit van arbusculaire-mycorrhizaschimmels en opbrengst van soja. Ik maak daarbij
gebruik van pad-analyse. Ik testte de effecten van de toegevoegde hoeveelheid biochar en van
bemesting met fosfaat (doordat gedacht werd dat de vruchtbaarheid van de zwarte aarde
samenhangt met de grotere hoeveelheden fosfaat die in deze biochar-rijke bodems worden
gevonden) op de kolonisatiegraad van wortels van de sojaboon, de hoeveelheid en beschik-
baarheid van fosfaat in de bodem en de gewasgroei gedurende vier cycli. De resultaten wezen
op een groot verschil in effect tussen de eerste gewasgroeicyclus en de vierde cyclus; daarnaast
was er een sterk effect van fosfaat. Voor mycorrhizakolonisatie was er een statistisch
significante interactie tussen biochar en gewascyclus. In de eerste oogst was er een lineaire
Samenvatting
116
afname in wortelkolonisatie met toenemende hoeveelheid biochar. Maar in de vierde cyclus
vond ik daarentegen een lineaire toename tussen hoeveelheid biochar en wortelkolonisatie.
Gewasgroei was ook verschillend tussen de eerste en vierde cyclus; de opbrengst aan sojabonen
liet een statische significant effect zien van de interactie tussen biochar en fosfaat. De
boonopbrengst was het grootst in de vierde cyclus na toepassen van grote hoeveelheden biochar
(20 en 40 ton per hectare) in behandelingen waaraan fosfaat was toegevoegd. In de eerste cyclus
nam de bodem-pH toe met toenemende hoeveelheden biochar; dit effect was in de vierde
gewascyclus niet meer waarneembaar. Pad-analyse maakte aannemelijk dat de effecten van
biochar op de wortelkolonisatie door arbusculaire-mycorrhizaschimmels niet verliepen via
veranderingen in de bodem-pH of fosfaatbeschikbaarheid als gevolg van toepassing van
biochar. Mijn gegevens zijn in overeenstemming met de hypothese dat biochar aanvankelijk de
uitwisseling van signaalmoleculen tussen mycorrhizaschimmel en plant negatief beïnvloedt.
Ook vond ik steun voor de hypothese dat de positieve effecten van biochar op mycorrhiza en
gewasgroei zich pas in de loop van de tijd voordoen.
In hoofdstuk 5 bestudeerde ik de effecten van toepassen van biochar en fosfaatbemesting op
biologische stikstofbinding gedurende vier gewascycli door de sojaboon, die was beënt met een
commercieel beschikbare variant van de bacterie Bradyrhizobium japonicum. Ook hier bleek
dat het effect van cyclus (het verschil tussen de eerste en vierde cyclus) de grootste bijdrage
leverde tot het verklaren van variatie in resultaten tussen de verschillende behandelingen.
Biochar was geen statistisch significante bron van variatie. Wel was er een significante
interactie tussen biochar en gewascyclus voor wat betreft het stikstofgehalte van de sojaboon.
In de eerste cyclus was het stikstofgehalte na toepassing van een geringe hoeveelheid biochar
(5 ton per hectare) significant lager dan dat van planten waarbij een grotere hoeveelheid biochar
(10 of 20 ton per hectare) werd toegepast. Maar in de vierde cyclus was er geen effect van de
hoeveelheid biochar op het stikstofgehalte. Het grote effect van gewascyclus werd verklaard
door veranderingen in beheer, in het bijzonder doordat aan het einde van de proef essentiële
micronutriënten werden toegevoegd. Door toevoegen van deze micronutriënten kon de
biologische stikstofbinding toenemen en was de sojaboon in staat gebruik te maken van het
extra fosfaat dat werd toegevoegd. Mijn conclusie uit dit experiment is dat onder omstandig-
heden van goed of optimaal beheer het toevoegen van biochar aan de bodem de biologische
stikstofbinding van sojaboon niet bevordert.
In hoofdstuk 6 vat ik de resultaten van de afzonderlijke hoofdstukken samen en combineer ik
die in een synthese. Ik maak ook gebruik van resultaten van aanvullende proeven, die niet in
het proefschrift worden gerapporteerd, zoals proeven in de kas met biologische stikstofbinding
en proeven naar de afbraak van biochar met behulp van strooiselzakjes. De resultaten van
hoofdstukken 2 en 3 laten zien dat, als er al sprake is van positieve priming van de afbraak van
bodemorganische stof door biochar, dit effect klein en kortdurend is, en dat er geen sprake is
van grote verliezen van bodemorganische stof door toepassen van biochar. De proef naar
afbraak van biochar en van organisch materiaal (bladstrooisel van een vlinderbloemige) over

Samenvatting
117
een periode van twee jaar in strooiselzakjes was daarmee in overeenstemming; er werd geen
interactie tussen de afbraak van biochar en bladstrooisel waargenomen.
De stabiliteit van bodemorganische stof werd vroeger beschouwd als een eigenschap van de
organische stof zelf die gedacht werd slecht afbreekbaar te zijn. In de afgelopen jaren is dit
concept (van intrinsiek slechte afbreekbaarheid of recalcitrantie) opnieuw geëvalueerd, en thans
is men tot de opvatting gekomen dat de lage afbraaksnelheid van bodemorganische stof eerder
bepaald wordt door interactie met andere bodembestanddelen (leidend tot bescherming tegen
afbraak) dan door de intrinsieke recalcitrantie. Voor biochar bleef echter de opvatting bestaan
dat het materiaal intrinsiek recalcitrant is. Mijn onderzoek laat echter zien dat ook de stabiliteit
van biochar in de bodem sterk bepaald wordt door de omgeving en dat de recalcitrantie van
biochar overschat is. In dit hoofdstuk voer ik ook aanvullende pad-analyses uit om een beter
begrip te krijgen van de mechanismen die het effect van biochar op biologische stikstofbinding
kunnen verklaren. In deze pad-analyses combineerde ik biologische stikstofbinding,
wortelkolonisatie door mycorrhizaschimmels en bodemorganische stof in één model. Er bleek
geen significante relatie te bestaan tussen mycorrhiza en biologische stikstofbinding. Wel was
er een significant verband, voor de vierde gewascyclus, tussen wortelkolonisatie door
mycorrhizaschimmels en bodemorganische stof, een verband dat in de eerste gewascyclus
afwezig was. Deze resultaten wijzen op de mogelijkheid dat biochar de stabiliteit van
bodemorganische stof kan verhogen door middel van een toegenomen mycorrhiza-activiteit.
Deze uitkomst is in overeenstemming met onze kennis over bodemaggregatie en koolstofvast-
legging door mycorrhizaschimmels. Ik introduceer de hypothese dat hetzelfde mechanisme,
waardoor arbusculaire-mycorrhizaschimmels bodemorganische stof stabiliseren, ook stabili-
serend kan werken voor de vastlegging van biochar in de bodem.
Ik kom tot de conclusie dat de voornaamste positieve effecten van biochar op mycorrhiza en
gewasopbrengst zich met de tijd ontwikkelen, maar dat zulke effecten niet erg belangrijk zijn
onder omstandigheden van optimaal beheer. Hoewel toevoegen van biochar aan de bodem een
effectieve manier is om koolstof vast te leggen, moet tegelijk worden vastgesteld dat de posi-
tieve effecten van biochar op gewasopbrengst pas optreden doordat de biochar gedeeltelijk
afgebroken wordt. Mijn stelling is dan ook dat weliswaar sommige voordelen (koolstofvast-
legging, verhoogde gewasopbrengst) van het toevoegen van biochar aan de bodem tegelijkertijd
kunnen worden behaald, maar dat deze voordelen niet tegelijkertijd kunnen worden ge-
maximaliseerd. Dat betekent dat ook biochar het koolstofdilemma hoogstens gedeeltelijk kan
oplossen.


Sumário
119
Sumário
A matéria orgânica pirolisada (PyOM), conhecida como biochar, é o produto da combustão de
biomassa sob baixa concentração de oxigênio. Atualmente, há um interesse crescente em
pesquisas sobre o uso de PyOM como condicionador do solo, inspirado pela existência de solos
antropogênicos altamente férteis na bacia amazônica, ricos em PyOM. A presença de PyOM
nestes solos - conhecidos como Terra Preta de Índio (TPI) - em quantidades muito maiores do
que nos solos adjacentes não-antrópicos, é considerada uma das principais razões para a sua
elevada fertilidade.
As adições de PyOM têm sido promovidas como forma de aumentar a fertilidade dos solos e a
produtividade das culturas, além de proporcionar importantes serviços ambientais. A redução
das emissões de CO2 por meio do sequestro de carbono orgânico recalcitrante no solo é um
desses serviços ambientais. Simultaneamente, tal prática pode sustentar a atividade microbiana
do solo melhorando sua qualidade, mediante ciclagem de nutrientes e consequentemente
promovendo o crescimento das plantas. Este cenário de ganhos múltiplos sugere que a adição
de PyOM ao solo poderia solucionar o "dilema do carbono", que implica em benefícios
biológicos da presença da matéria orgânica do solo (MOS) decorrentes principalmente da sua
decomposição e não somente de seu acúmulo e manutenção. É improvável, entretanto, que tanto
o aumento do sequestro de C, como os benefícios decorrentes de sua decomposição sejam
maximizados simultaneamente. Assim, ao invés de um cenário de ganhos múltiplos, é possível
que o uso de PyOM como condicionador do solo esteja também subordinado a um cenário
inevitável de compensações (ganhos parciais).
Adições de PyOM ao solo podem acelerar ou desacelerar a decomposição da MOS nativa, por
meio de um mecanismo conhecido como “priming”. Embora a adição de PyOM possa causar
priming positivo (aceleração da decomposição de MOS nativa), a ocorrência de priming
negativo (desaceleração da decomposição da MOS nativa) após adições de PyOM também tem
sido reportada. A grande quantidade de C não-pirogênico nas TPI, comparada à dos solos
adjacentes não-antrópicos, é considerada evidência de que adições de PyOM podem estabilizar
a MOS nativa no longo prazo. Um fator complicador nos estudos disponíveis diz respeito ao
risco de interpretação errônea de que os aumentos de curto prazo na emissão de CO2 em solos
manejados com PyOM, sejam devidos ao priming positivo da MOS, quando na verdade, podem
ter se originado da decomposição de frações lábeis da PyOM.
Outro aspecto da adição de PyOM se refere à alteração na atividade e na estrutura das
comunidades microbianas do solo. Mudanças nas populações microbianas podem ter impacto
na sua funcionalidade, favorecendo simbioses mutualísticas das plantas com fungos
micorrízicos arbusculares (FMA) e com rizóbio em leguminosas, o qual é responsável pela
fixação biológica de nitrogênio (FBN). Embora adições de PyOM ao solo possam estimular os
FMA’s e a FBN, os resultados são contrastantes e os mecanismos envolvidos não estão claros.
A maioria dos estudos sobre os efeitos da PyOM na MOS e nas simbioses mutualísticas são

Sumário
120
oriundas de experimentos de curta duração, na maioria das vezes realizados em casas de
vegetação ou em laboratório. Embora tais estudos ajudem a elucidar os fatores potencialmente
responsáveis pelas mudanças na MOS e nas relações simbióticas em solos manejados com
PyOM, eles não permitem avaliar mudanças em condições reais de campo por períodos de
tempo mais longos do que um ou poucos ciclos de cultivo. Há portanto, lacunas no
conhecimento quanto à compreensão sobre a duração e a magnitude dos efeitos ao longo do
tempo em condições de campo, bem como, os possíveis mecanismos envolvidos. Esta tese
abordará aspectos relacionados a estas lacunas.
O objetivo desta pesquisa foi o de proporcionar uma melhor compreensão acerca das interações
entre a PyOM e a MOS, bem como, dos fatores que controlam os padrões simbióticos ao longo
do tempo, em solo tropical manejado com PyOM. Para atingir esse objetivo, combinou-se
estudos em casa de vegetação e de campo. Foi também efetuada uma meta-análise, a fim de
sintetizar quantitativamente dados disponíveis na literatura.
No Capítulo 2, foram combinados os resultados de 46 estudos em uma meta-análise. Foram
investigadas mudanças nos padrões de emissão de CO2 a partir de diferentes solos manejados
com PyOM, identificando-se as causas destas mudanças e os possíveis fatores envolvidos.
Observou-se um aumento geral de 29% na emissão de CO2 de solos manejados com PyOM.
Esses aumentos só foram evidentes quando a relação entre o carbono da PyOM (PyC) e o
carbono orgânico do solo (COS) foi maior que 2 (relação PyC:COS >2). Estes dados são
consistentes com a hipótese de que o aumento das emissões de CO2 após adições de PyOM é
aditivo, derivando principalmente, da decomposição de frações lábeis de C da própria PyOM,
ao invés do COS. O aumento das emissões de CO2 em solos manejados com PyOM não é,
portanto, decorrente de priming positivo do COS. A relação PyC:COS revelou-se como sendo
o melhor preditor do aumento da emissão de CO2 após adições de PyOM ao solo. Esta meta-
análise revelou (i) a importância de se levar em conta a quantidade de PyC aplicado em relação
ao COS, como forma de planejar futuros experimentos de decomposição da MOS e revelou que
(ii) a recalcitrância da PyOM no solo pode ser menor do que normalmente se supõe.
Uma limitação técnica para se distinguir um possível efeito priming da PyOM na MOS, de
outras interações não-aditivas, diz respeito à incerteza quanto à origem do CO2 respirado (se do
COS ou da própria PyOM). Esta limitação só pode ser superada por meio do uso de análises
isotópicas. A partir de dados de um estudo de campo (Capítulo 3), foram quantificadas
mudanças nos estoques PyOM e de COS ao longo de quatro ciclos de cultivo (CC) de soja, em
um Latossolo Amarelo arenoso, previamente dominado por plantas C4. Os tratamentos
consistiram de diferentes doses de PyOM (0, 5, 10, 20 e 40 Mg ha-1). A PyOM foi produzida a
partir de espécies lenhosas C3, usando métodos de pirólise tradicionalmente empregadas no
Nordeste do Brasil. Foram efetuadas análises da assinatura isotópica de carbono (13C) a fim de
se discriminar a origem do C remanescente no solo e quantificar as taxas de decomposição tanto
do COS nativo, quanto da PyOM. Os resultados revelaram que a decomposição da PyOM
produzida por métodos tradicionais é mais rápida em condições de campo (25-60% no primeiro
ano), do que normalmente se supunha (10-20% em 5-10 anos), podendo vir a ser maior do que

Sumário
121
a taxa de decomposição do COS nativo (5-14%). Os dados demonstram ainda, a decomposição
preferencial da PyOM em comparação com o COS nativo. A intensidade dos efeitos revelou
ser dependente da dose de PyOM aplicada ao solo. Apenas ao longo de períodos mais longos
(>1 ano), a adição de PyOM parece estabilizar o COS.
No Capítulo 4, foram explorados os mecanismos que controlam a atividade dos FMA’s e o
rendimento da soja em solos manejados com PyOM, mediante uso de Modelos de Equações
Estruturadas (análise de trilha). Foram testados os efeitos de doses de PyOM e adubação com
P na colonização das raízes de soja por FMA’s, nos teores de P no solo e no desempenho das
plantas ao longo de quatro ciclos de cultivo (CC). Os resultados evidenciaram um efeito
dominante do CC e do P, assim como da interação entre PyOM x CC, sobre a colonização
micorrízica. Houve redução linear na colonização de raízes por FMA’s no CC1 com o aumento
das doses de PyOM, em contraste com um aumento linear consistente das taxas de colonização
micorrízica no CC4. O desempenho das plantas foi afetado principalmente pelo CC, havendo
também efeito significativo da interação PyOM x P para o rendimento de grãos. No CC4, o
rendimento de grãos foi maior nas maiores doses de PyOM (20 e 40 Mg ha-1),
predominantemente nos tratamentos com adubação fosfatada. No CC1 houve aumento linear
do pH do solo com o aumento das doses de PyOM, mas no CC4 não foram observados efeitos
no pH do solo. A análise de trilha indicou que os efeitos da PyOM na colonização de raízes por
FMA’s não foram mediados por alterações no pH do solo ou pelos teores de P. Os dados obtidos
são consistentes com a hipótese de que a interferência da PyOM nos processos de sinalização
entre planta e FMA é determinante para as mudanças na atividade micorrízica e que os efeitos
positivos da PyOM sobre os FMA’s e sobre a produtividade das culturas só se tornam evidentes
com o tempo.
No capítulo 5, foram avaliados os efeitos das doses de PyOM e fertilização com P sobre a FBN
em soja inoculada com Bradyrhizobium japonicum, ao longo de quatro ciclos de cultivo. Foi
observado efeito significativo do CC sobre a maioria das variáveis dependentes, ao passo que
a adição de PyOM não se consolidou como uma fonte de variação relevante. Houve efeito
significativo da interação PyOM × CC na concentração de N na parte aérea das plantas. No
CC1, a concentração de N na parte aérea das plantas na dose de 5 Mg ha-1 de PyOM foi
significativamente menor do que a concentração de N nas plantas oriundas dos tratamentos com
10 ou 20 Mg ha-1 de PyOM. No CC4, a concentração de N na parte aérea não foi afetada pelas
doses de PyOM. O efeito dominante dos ciclos de cultivo pode ser explicado pelas mudanças
no manejo de nutrientes, especificamente devido à adubação com micronutrientes nos CC3 e
CC4. A correção da deficiência de micronutrientes no solo aumentou a FBN além de ter
desencadeado um efeito positivo da adubação com P na fixação biológica de nitrogênio.
Conclui-se que em condições de manejo adequado, aplicações de PyOM não aumentam a FBN
em soja.
No Capítulo 6 (Discussão Geral) são sintetizadas as principais descobertas descritas nos
capítulos anteriores. Foram também utilizados dados de experimentos adicionais realizados em
casa de vegetação, além de experimentos de campo com bolsas de decomposição (litterbags),
Sumário
122
como forma de integrar os resultados e aprofundar a discussão neste capítulo. Uma análise
integrada dos capítulos 2 e 3 mostrou que, caso algum efeito priming positivo ocorra devido à
adição de PyOM ao solo, tal processo se trata de um evento de curto prazo e não leva a perdas
significativas de COS nativo. Isto foi confirmado por dados de um experimento de campo
adicional, de 2 anos de duração com litterbags, o qual mostrou não haver interação entre PyOM
e matéria orgânica nativa, com reflexos em mudanças nas taxas de decomposição.
A estabilidade do COS tem sido recentemente considerada como sendo um produto de
interações com o ecossistema e não uma consequência da sua recalcitrância, mas esta definição
não inclui PyOM. Os resultados obtidos demonstram que este conceito é equivocado e que a
estabilidade da PyOM também pode ser influenciada pelo ambiente edáfico. Como forma de
integrar os efeitos da PyOM no COS e nas interações mutualísticas, foram empregadas análises
de trilha incluindo também os dados de colonização de raízes por COS (capítulo 3), FMA
(Capítulo 4) e FBN (capítulo 5) em um mesmo modelo. Não foram observados coeficientes
significativos vinculando FMA’s e FBN. O modelo indicou um coeficiente positivo
significativo vinculando a colonização das raízes por FMA’s aos teores de COS no CC4, mas
não no CC1. Os dados sugerem que a PyOM pode aumentar a estabilidade do COS ao longo do
tempo, por meio do aumento da atividade de FMA. A agregação do solo e o sequestro de COS
são fatores fortemente correlacionados com a abundância de FMA no solo. Os dados sugerem
que o mesmo mecanismo por meio do qual os FMA’s estabilizam o COS nativo, podem também
influenciar positivamente na estabilização da PyOM no longo prazo.
Em conclusão, os principais efeitos benéficos da PyOM sobre a atividade dos FMA’s e sobre a
produtividade das culturas desenvolvem-se com o tempo. Entretanto, em solos bem manejados,
o aumento da produtividade não é uma consequência direta do aumento da atividade dos
FMA’s, por sua vez decorrente da adição de PyOM. Por fim, embora adições PyOM
representem uma forma eficaz de sequestrar C no solo, os efeitos positivos da PyOM na
produtividade possivelmente ocorrem somente pós a decomposição parcial da PyOM. Embora
alguns benefícios da adição de PyOM possam ser simultaneamente obtidos (sequestro de C e
aumento da produtividade), eles não podem ser simultaneamente maximizados. Isto significa
que o dilema do carbono pode ser apenas parcialmente resolvido pela adição de PyOM ao solo.

Acknowledgements
123
Acknowledgements
Finishing a PhD is not an easy task, but it would be much more difficult without the daily
support and friendly relationship with many people. I hope to make justice to those whom
directly or indirectly contributed to this thesis.
Firstly, my thesis would not be possible without the financial support from the Brazilian
Agricultural Research Corporation (EMBRAPA) and the Northeast Bank (Banco do Nordeste
- BNB). I am also grateful to Wageningen University and Research Centre (WUR) for the
support during my stay in Wageningen.
I wish to express my gratitude to my promoters Thomas Kuyper and Ellis Hoffland. Your
challenging advice and comments, constructive criticism and patience were essential for the
construction of this thesis. Every opportunity to talk with you was pleasant and fruitful.
Gratitude also goes to those who directly contributed for the final content of individual
Chapters, especially Tatiana and Simon. In this regard, I am also grateful to Herony Mehl for
the essential support with the field experiments, to Bruno Alves and Afonso for important
chemical and biological analyses, and to Manoel Holanda, whom without help I could not
appropriately perform mycorrhizal analyses. Many thanks also to Neyla, for the commitment
and persistence.
Undertaking my PhD at the Soil Biology and Biological Soil Quality group at Wageningen
University was a great opportunity to meet many nice fellows over the years. I am thankful to
the staff members Marnella, Anita, Ester and Caroline who assisted me in issues related to my
PhD in different moments. I am also thankful for the pleasant moments with my Chinese friends
Wei, Ma Lin, Xinxin, Yunyu, Yong and many other non-Chinese friends, especially William,
Walter, Joana Frazão, Karst, Andreas, Jana, Cristian, Supriatin, Mart and Angie. It was also a
pleasure for me to be included in the “cardumen” of the Terra Preta Program. The permanent
exchange of ideas and especially, the friendship with all the former (Marielos, Angela,
Welliton, Camilo and Isabel) and current members Clara, Paulo, Stela, André, Carlos, Joana,
Simon and Tatiana was great.
Many thanks also to my friends from Embrapa living in Wageningen in different periods,
especially to Miss Grace for the invaluable help in the first months of my PhD, to Murilo Arruda
for the important tips at the beginning of my journey, and to Márcia, Franco and Giovani for
the pleasant moments. I am also grateful to my local supervisor Luiz Fernando, to Oscar,
Ranyse, Wenceslau, Beata and Rosana Leitão for all the support.
Last but not least, I owe many thanks to my family, especially my parents Orlando (in
memoriam) and Natalina. I would not have finished a PhD without their guidance throughout
my whole life. I am also indebted with my brother Eroni and sister-in-law Alice, as well as my
parents-in-law Antônio and Joana for supporting my wife and kids in a very difficult moment
of our lives. My sincere thanks.

Acknowledgements
124
Finally, I have no words to express my gratitude to my daughter Maria, my son Angelo and my
beloved wife Monica for your patience and for bringing me happiness and hope every single
day. Monica, you gave up your own plans to encourage me and take care of me during the four
years of my PhD. This thesis is dedicated to you!
Edvaldo Sagrilo
Wageningen, The Netherlands
09 of December 2014
Current affiliation of authors
125
Current affiliation of authors
Edvaldo Sagrilo
Embrapa Mid-North, Av. Duque de Caxias 5650, 64006-220 Teresina, Brazil
Department of Soil Quality, Wageningen University, PO BOX 47, 6700 AA Wageningen, The
Netherlands
Ellis Hoffland
Department of Soil Quality, Wageningen University, PO BOX 47, 6700 AA Wageningen, The
Netherlands
Simon Jeffery
Department of Soil Quality, Wageningen University, PO BOX 47, 6700 AA Wageningen, The
Netherlands
Tatiana F. Rittl
Department of Soil Quality, Wageningen University, PO BOX 47, 6700 AA Wageningen, The
Netherlands
Bruno J. R. Alves
Embrapa Agrobiology, Rodovia BR-465, Km 7 Bairro Ecologia, 23891-000 - Seropédica - RJ
Herony U. Mehl
Embrapa Mid-North, Av. Duque de Caxias 5650, 64006-220 Teresina, Brazil
Thomas W. Kuyper
Department of Soil Quality, Wageningen University, PO BOX 47, 6700 AA Wageningen, The
Netherlands


Training and Education Statement
127
PE&RC Training and Education Statement With the training and education activities listed below the PhD candidate has complied with the requirements set by the C.T. de Wit Graduate School for Production Ecology and Resource Conservation
(PE&RC) which comprises of a minimum total of 32 ECTS (= 22 weeks of activities) Review of literature (6 ECTS)
- Effect of biochar on chemical and biological soil quality
Writing of project proposal (4.5 ECTS) - Crop yield and soil quality as affected by biochar, green manure and mineral fertilizer in
north-eastern Brazil
Post-graduate courses (4 ECTS)
- The legume-rhizobium symbiosis: from molecules to farmers’ fields; PE&RC (2010)
- Introduction to R; PE&RC (2010) - Mixed linear models; PE&RC (2011) - Generalized linear models; PE&RC (2011) - Multivariate statistics models; Embrapa/UFPI, Brazil (2012)
Laboratory training and working visits (0.5 ECTS)
- Soil enzymatic analysis; Federal University of Piauí UFPI (2012)
Invited review of (unpublished) journal manuscript (2 ECTS)
- Journal of Environmental Quality: biochar on agronomic and carbon sequestration (2011) - Microbial Ecology: soil bacterial diversity in degraded and restored lands of Northeast Brazil
(2013) Competence strengthening / skills courses (2.1 ECTS)
- PhD Competence assessment (2011) - Scientific writing (2013)
PE&RC Annual meetings, seminars and the PE&RC weekend (2.4 ECTS)
- PE&RC Weekend (2010) - PE&RC Day (2010)
- PE&RC Weekend; last years (2013) - PE&RC Day (2013)
Discussion groups / local seminars / other scientific meetings (4.1 ECTS)
- The biobased economy: back to earth (2010) - Soil-plant interaction group (2010-2011) - Global soil fertility: the next generation of smart fertilizers (2011)
- Terra Preta discussion group (2011, 2013-2014) - Soil-plant interaction group; Embrapa Mid-North, Brazil (2012) - Discussion group in Soil Quality (DISQ) (2013-2014) - The future of biochar; Groningen (2013)
International symposia, workshops and conferences (8.2 ECTS)
- First Terra Preta workshop; Wageningen, the Netherlands (2011)
- Eurosoil; Bari, Italy (2012) - Second Terra Preta workshop; Manaus, Brazil (2012) - Third Terra Preta workshop; Leticia, Colombia (2013)
Supervision of 3 MSc students (8 ECTS)
- Soil Biology
- Soil Fertility - Soil Fertility

Funding
128
Funding
The research presented in this thesis was financially supported by the grant from Banco do
Nordeste - BNB (Project No. 2010/135 – FUNDECI). Edvaldo Sagrilo acknowledges the
Brazilian Agricultural Research Corporation (Embrapa) for supporting his PhD fellowship at
Wageningen University.
Cover design Luciana P. dos Santos Fernandes
Cover photo Bráulio Soares Archanjo - Materials Metrology Division, National
Institute of Metrology, Quality and Technology - INMETRO, Duque de Caxias-RJ, Brazil
Printed by Ipskamp Drukkers B.V., Enschede