
SOFTWARE QUALITY IN 2002: A SURVEY OF THE STATE OF THE ART Copyright © 2002 by SPR. All Rights...
76
SOFTWARE QUALITY IN 2002: A SURVEY OF THE STATE OF THE ART Copyright © 2002 by SPR. All Rights Reserved. Software Productivity Research an Artemis company Six Lincoln Knoll Lane Burlington, Massachusetts 01803 http://www.SPR.com July 23, 2002 Capers Jones, Chief Scientist Emeritus
-
Upload
davon-college -
Category
Documents
-
view
213 -
download
0
Transcript of SOFTWARE QUALITY IN 2002: A SURVEY OF THE STATE OF THE ART Copyright © 2002 by SPR. All Rights...
SOFTWARE QUALITY IN 2002:A SURVEY OF
THE STATE OF THE ART
Copyright © 2002 by SPR. All Rights Reserved.
Software Productivity Researchan Artemis company
Six Lincoln Knoll LaneBurlington, Massachusetts
01803http://www.SPR.com
July 23, 2002
Capers Jones, Chief Scientist Emeritus
SWQUAL97\2 Copyright © 2002 by SPR. All Rights Reserved.
SPR clients from 1984 through 2002
• About 600 companies (150 clients in Fortune 500 set)
• About 30 government/military groups
• About 12,000 total projects
• New data = about 75 projects per month
• Data collected from 24 countries
• Observations during more than a dozen lawsuits
SOURCES OF SPR’S QUALITY DATA
SWQUAL97\3 Copyright © 2002 by SPR. All Rights Reserved.
NEW LESSONS FOR SOFTWARE QUALITY IN 2002
QUALITY LESSONS FROM THE INTERNET ERA
Businesses are tightly coupled in “supply chains.”
Poor quality in one company can affect scores of companies.
Poor quality drives away clients and loses business.
Poor quality can lead to expensive litigation.
Quality and security are becoming intertwined.
Web-based “content” is a special case (i.e. graphics, sounds)
SWQUAL97\4 Copyright © 2002 by SPR. All Rights Reserved.
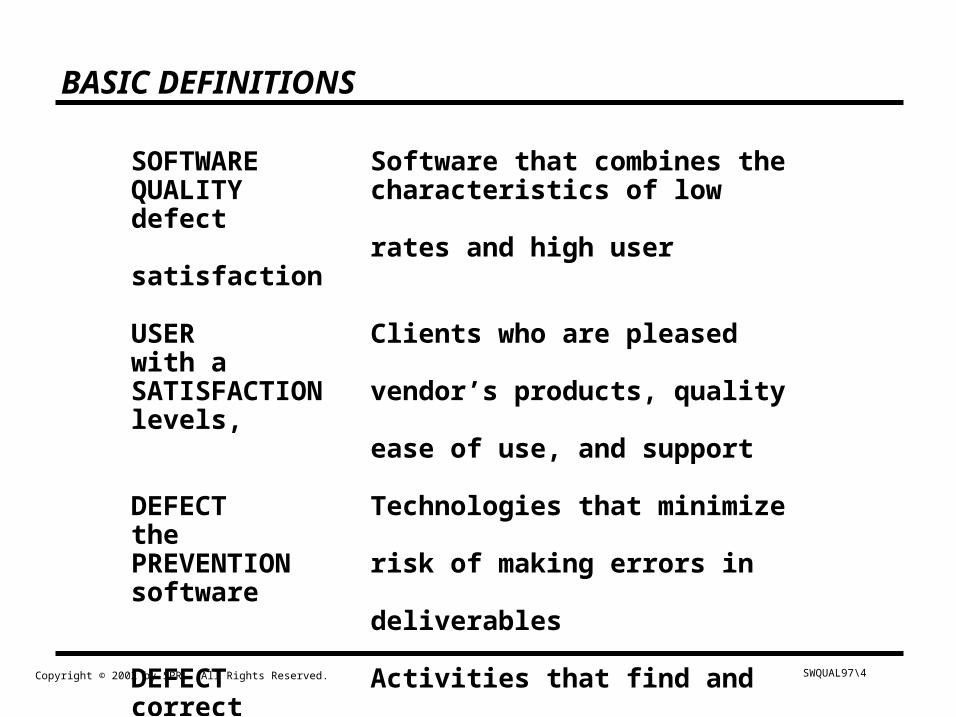
BASIC DEFINITIONS
SOFTWARE Software that combines theQUALITY characteristics of low defect
rates and high user satisfaction
USER Clients who are pleased with a SATISFACTION vendor’s products, quality levels,
ease of use, and support
DEFECT Technologies that minimize thePREVENTION risk of making errors in software
deliverables
DEFECT Activities that find and correct REMOVAL defects in software deliverables
BAD FIXES Secondary defects injected as a byproduct of defect repairs
SWQUAL97\5 Copyright © 2002 by SPR. All Rights Reserved.
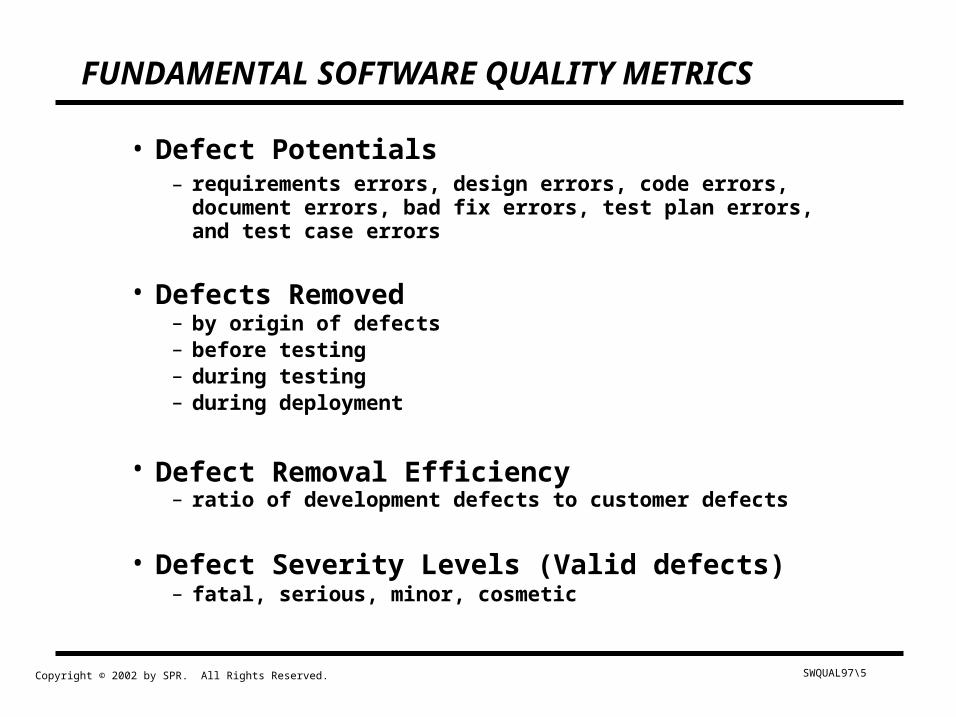
FUNDAMENTAL SOFTWARE QUALITY METRICS
• Defect Potentials– requirements errors, design errors, code errors, document
errors, bad fix errors, test plan errors, and test case errors
• Defects Removed– by origin of defects– before testing– during testing– during deployment
• Defect Removal Efficiency– ratio of development defects to customer defects
• Defect Severity Levels (Valid defects)– fatal, serious, minor, cosmetic
SWQUAL97\6 Copyright © 2002 by SPR. All Rights Reserved.
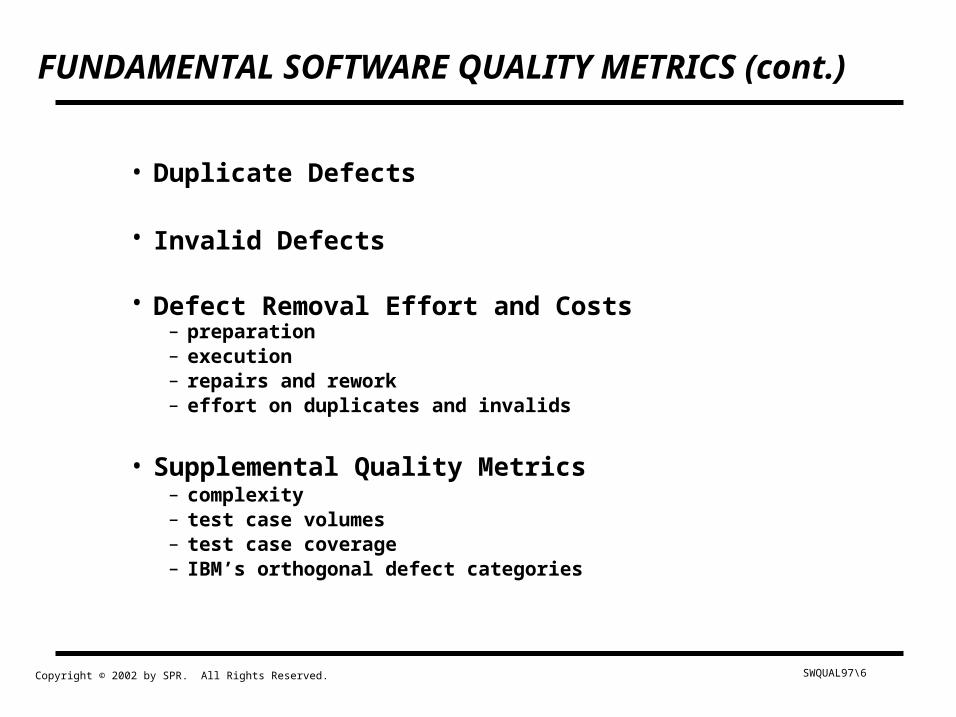
• Duplicate Defects
• Invalid Defects
• Defect Removal Effort and Costs– preparation– execution– repairs and rework– effort on duplicates and invalids
• Supplemental Quality Metrics– complexity– test case volumes– test case coverage– IBM’s orthogonal defect categories
FUNDAMENTAL SOFTWARE QUALITY METRICS (cont.)
SWQUAL97\7 Copyright © 2002 by SPR. All Rights Reserved.
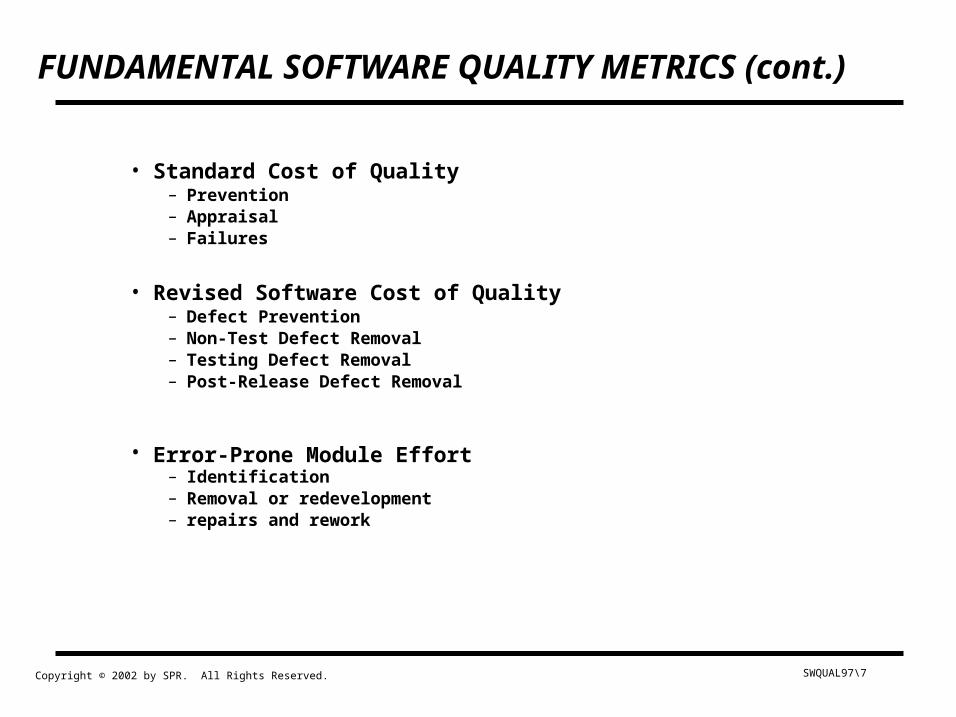
• Standard Cost of Quality– Prevention– Appraisal– Failures
• Revised Software Cost of Quality– Defect Prevention– Non-Test Defect Removal– Testing Defect Removal– Post-Release Defect Removal
• Error-Prone Module Effort– Identification– Removal or redevelopment– repairs and rework
FUNDAMENTAL SOFTWARE QUALITY METRICS (cont.)
SWQUAL97\8 Copyright © 2002 by SPR. All Rights Reserved.
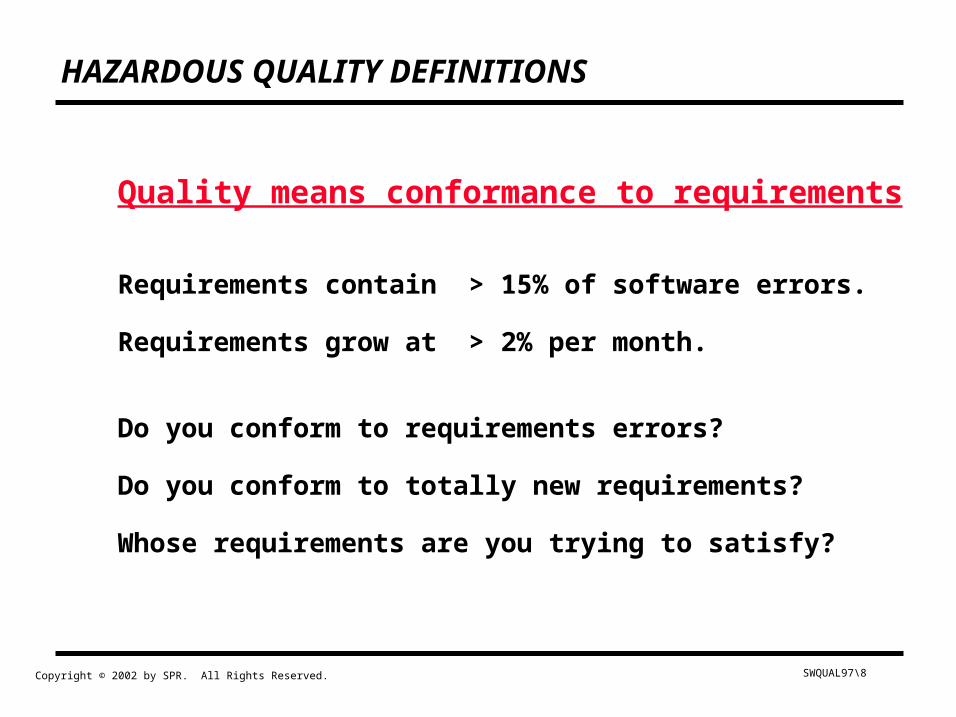
HAZARDOUS QUALITY DEFINITIONS
Quality means conformance to requirements
Requirements contain > 15% of software errors.
Requirements grow at > 2% per month.
Do you conform to requirements errors?
Do you conform to totally new requirements?
Whose requirements are you trying to satisfy?
SWQUAL97\9 Copyright © 2002 by SPR. All Rights Reserved.
HAZARDOUS QUALITY METRICS
Cost per Defect
• Approaches infinity as defects near zero
• Conceals real economic value of quality
SWQUAL97\10 Copyright © 2002 by SPR. All Rights Reserved.
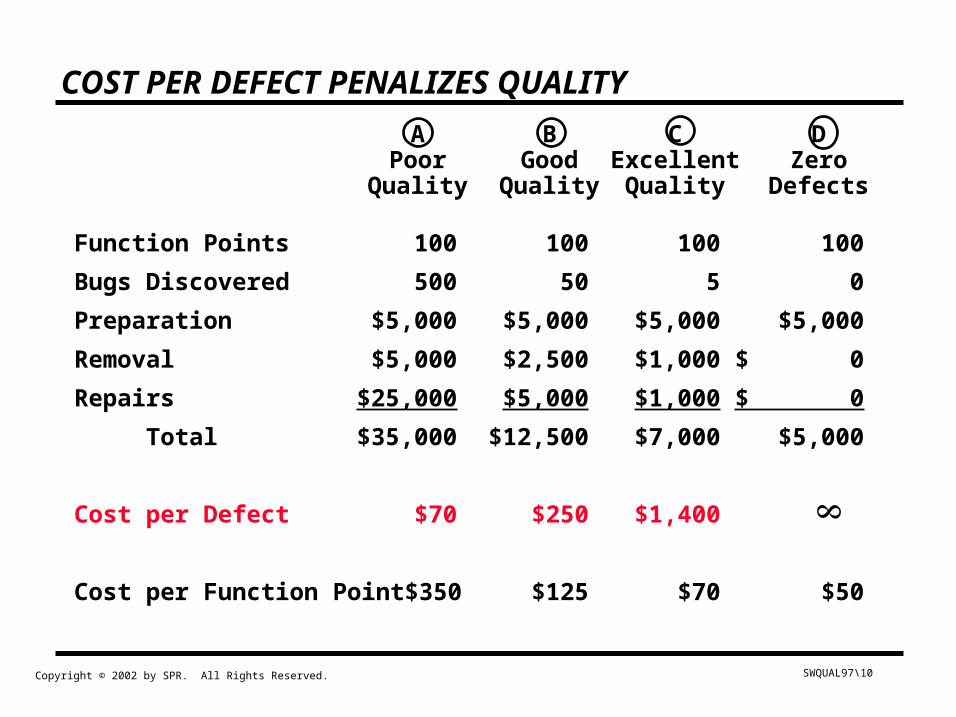
COST PER DEFECT PENALIZES QUALITY
A B C DPoor Good Excellent Zero
Quality Quality Quality Defects
Function Points 100 100 100 100
Bugs Discovered 500 50 5 0
Preparation $5,000 $5,000 $5,000 $5,000
Removal $5,000 $2,500 $1,000 $ 0
Repairs $25,000 $5,000 $1,000 $ 0
Total $35,000 $12,500 $7,000 $5,000
Cost per Defect $70 $250 $1,400
Cost per Function Point $350 $125 $70 $50
SWQUAL97\11 Copyright © 2002 by SPR. All Rights Reserved.
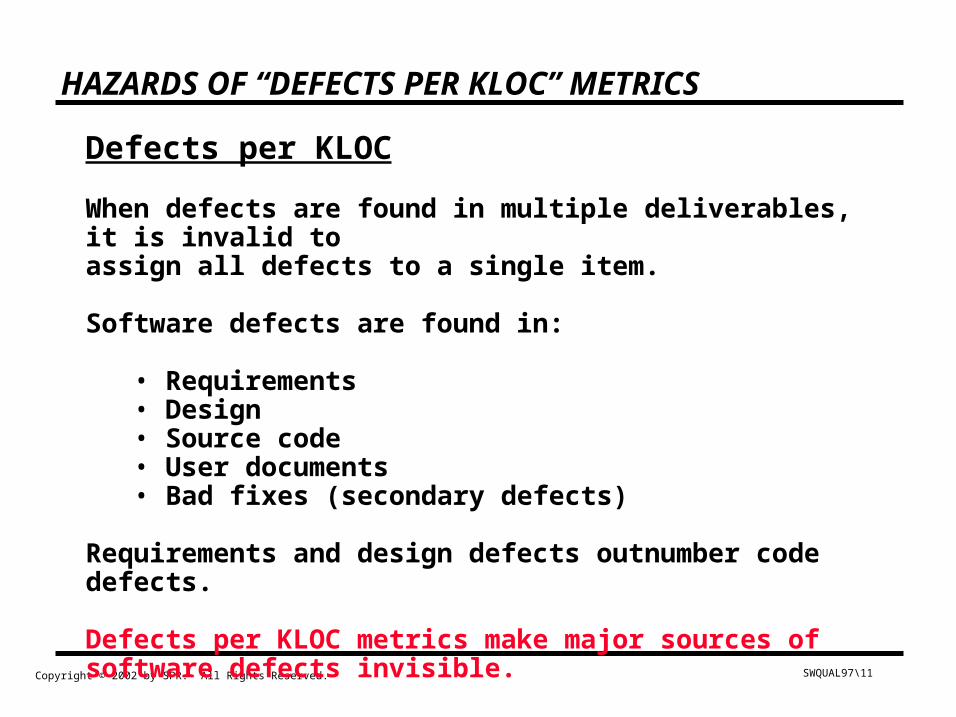
HAZARDS OF “DEFECTS PER KLOC” METRICS
Defects per KLOC
When defects are found in multiple deliverables, it is invalid toassign all defects to a single item.
Software defects are found in:
• Requirements• Design• Source code• User documents• Bad fixes (secondary defects)
Requirements and design defects outnumber code defects.
Defects per KLOC metrics make major sources of software defects invisible.
SWQUAL97\12 Copyright © 2002 by SPR. All Rights Reserved.
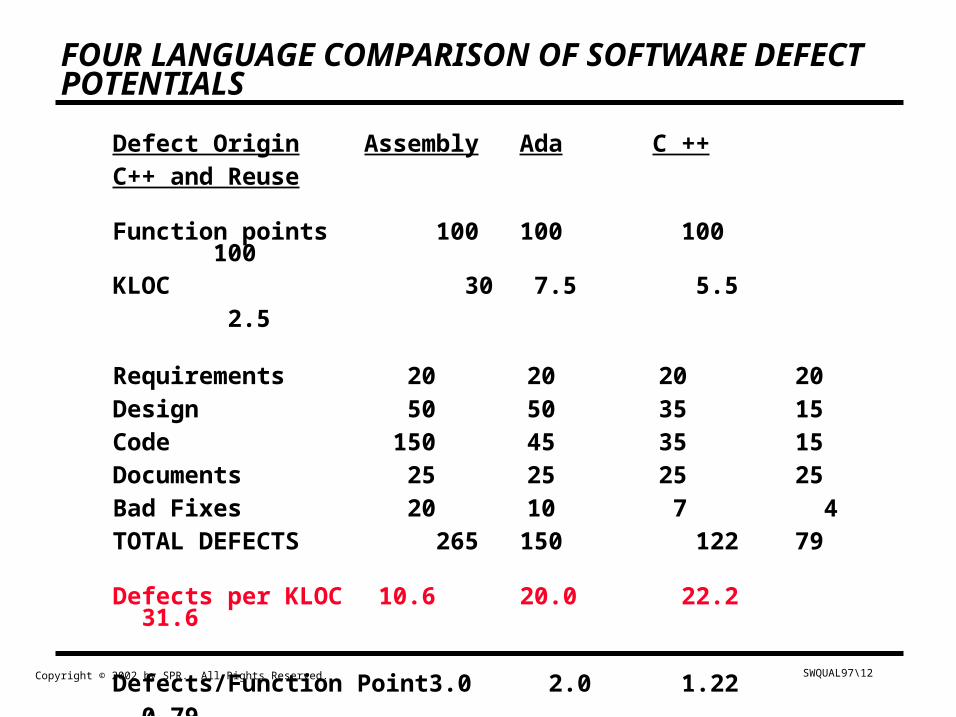
FOUR LANGUAGE COMPARISON OF SOFTWARE DEFECT POTENTIALS
Defect Origin Assembly Ada C ++ C++ and Reuse
Function points 100 100 100 100KLOC 30 7.5 5.5 2.5
Requirements 20 20 20 20Design 50 50 35 15Code 150 45 35 15Documents 25 25 25 25Bad Fixes 20 10 7 4TOTAL DEFECTS 265 150 122 79
Defects per KLOC 10.6 20.0 22.2 31.6
Defects/Function Point 3.0 2.0 1.22 0.79
Defect per KLOC may be considered to be professional malpractice.
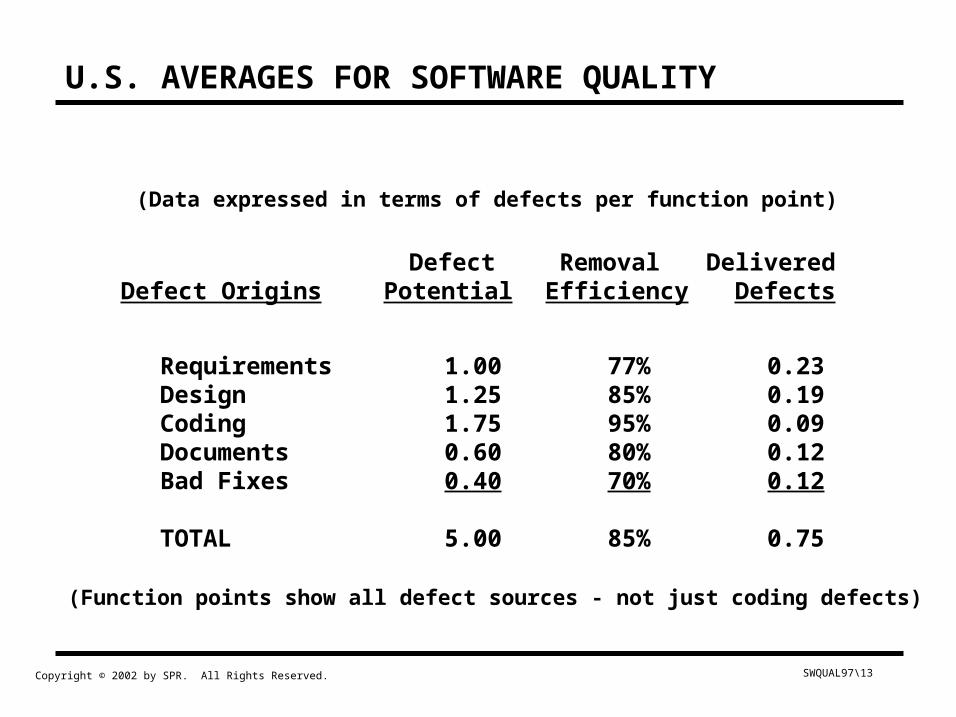
SWQUAL97\13 Copyright © 2002 by SPR. All Rights Reserved.
Defect Removal DeliveredDefect Origins Potential Efficiency Defects
Requirements 1.00 77% 0.23Design 1.25 85% 0.19Coding 1.75 95% 0.09Documents 0.60 80% 0.12Bad Fixes 0.40 70% 0.12
TOTAL 5.00 85% 0.75
(Data expressed in terms of defects per function point)
U.S. AVERAGES FOR SOFTWARE QUALITY
(Function points show all defect sources - not just coding defects)
SWQUAL97\14 Copyright © 2002 by SPR. All Rights Reserved.
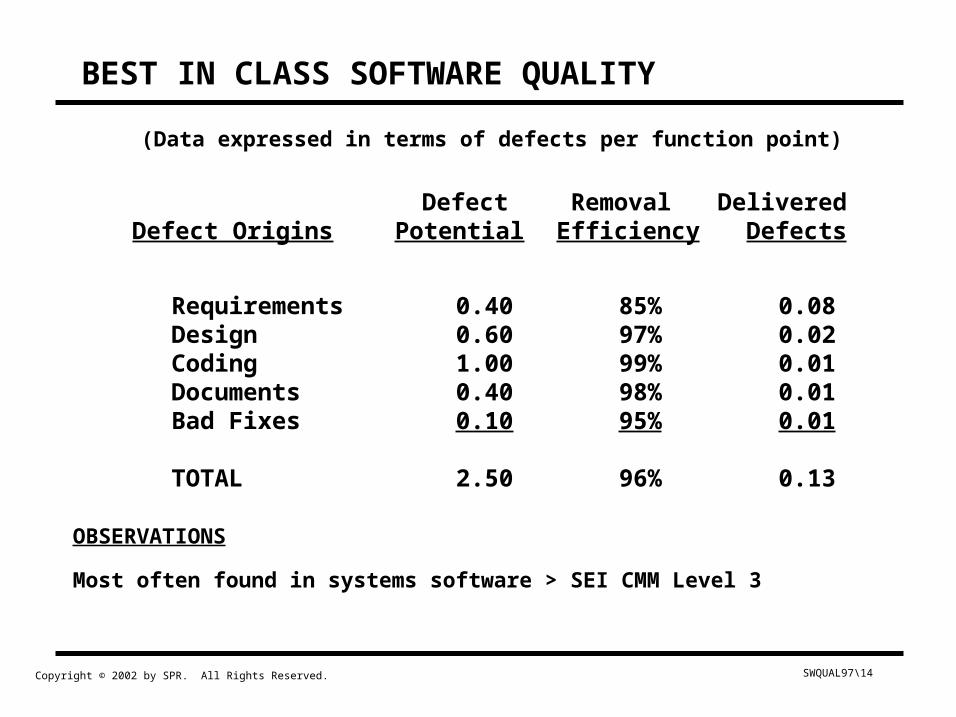
OBSERVATIONS
Most often found in systems software > SEI CMM Level 3
Defect Removal DeliveredDefect Origins Potential Efficiency Defects
Requirements 0.40 85% 0.08Design 0.60 97% 0.02Coding 1.00 99% 0.01Documents 0.40 98% 0.01Bad Fixes 0.10 95% 0.01
TOTAL 2.50 96% 0.13
(Data expressed in terms of defects per function point)
BEST IN CLASS SOFTWARE QUALITY
SWQUAL97\15 Copyright © 2002 by SPR. All Rights Reserved.
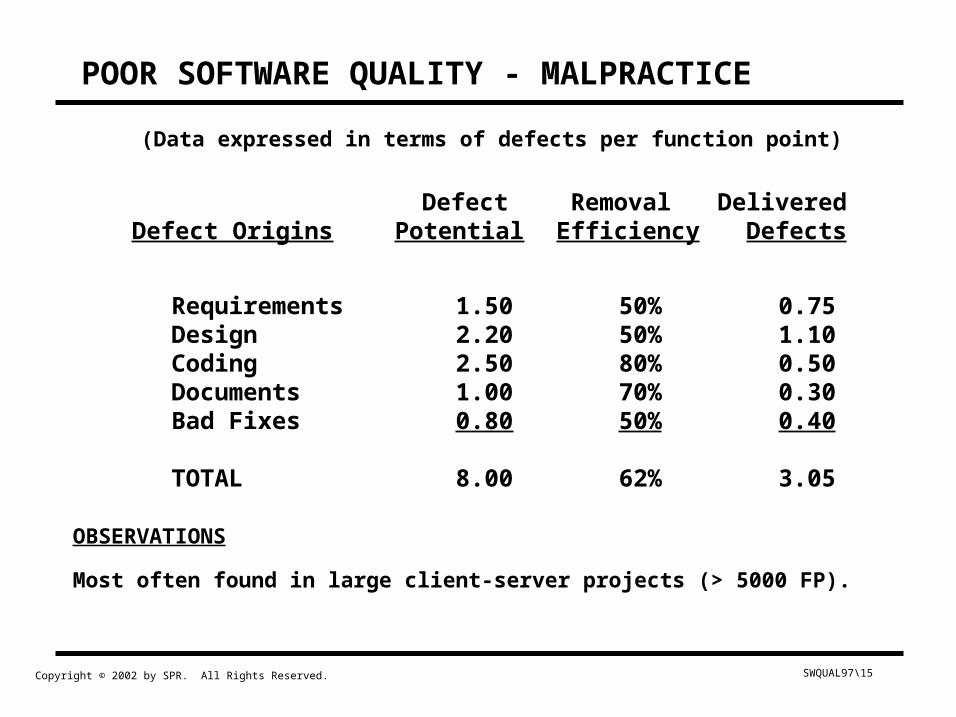
OBSERVATIONS
Most often found in large client-server projects (> 5000 FP).
Defect Removal DeliveredDefect Origins Potential Efficiency Defects
Requirements 1.50 50% 0.75Design 2.20 50% 1.10Coding 2.50 80% 0.50Documents 1.00 70% 0.30Bad Fixes 0.80 50% 0.40
TOTAL 8.00 62% 3.05
(Data expressed in terms of defects per function point)
POOR SOFTWARE QUALITY - MALPRACTICE
SWQUAL97\16 Copyright © 2002 by SPR. All Rights Reserved.
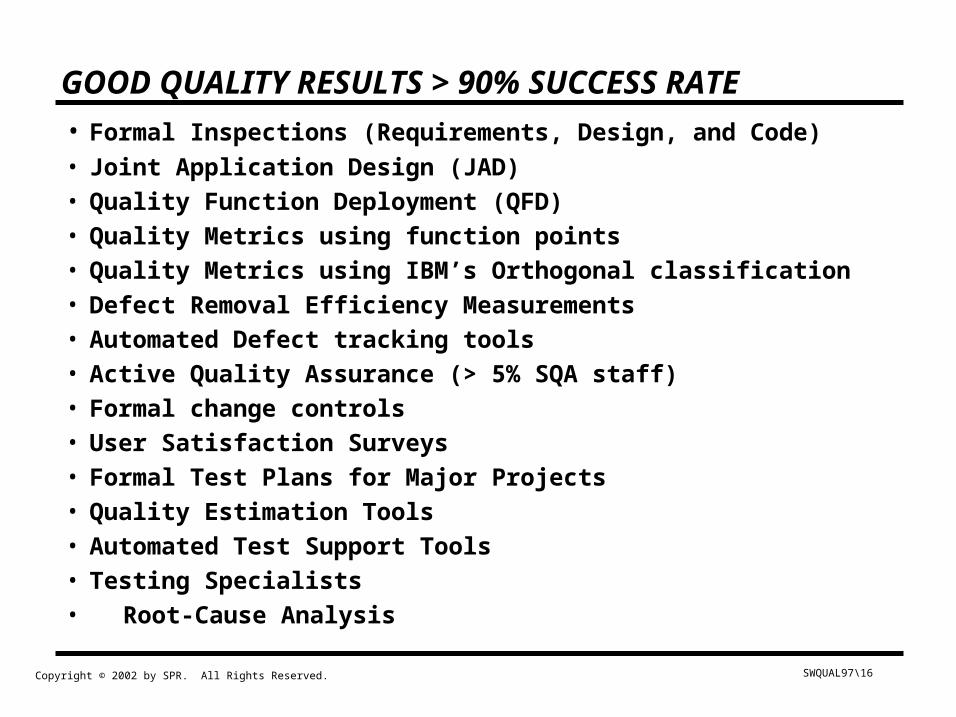
• Formal Inspections (Requirements, Design, and Code)
• Joint Application Design (JAD)• Quality Function Deployment (QFD)• Quality Metrics using function points• Quality Metrics using IBM’s Orthogonal classification• Defect Removal Efficiency Measurements• Automated Defect tracking tools• Active Quality Assurance (> 5% SQA staff)• Formal change controls• User Satisfaction Surveys• Formal Test Plans for Major Projects• Quality Estimation Tools• Automated Test Support Tools• Testing Specialists• Root-Cause Analysis
GOOD QUALITY RESULTS > 90% SUCCESS RATE
SWQUAL97\17 Copyright © 2002 by SPR. All Rights Reserved.
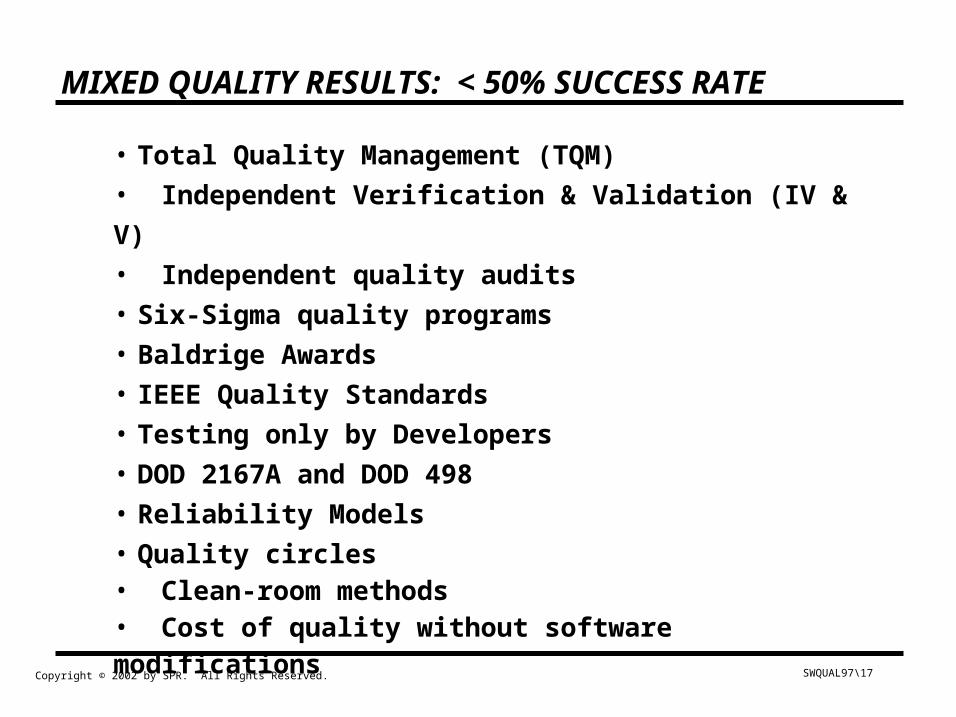
MIXED QUALITY RESULTS: < 50% SUCCESS RATE
• Total Quality Management (TQM)
• Independent Verification & Validation (IV & V)
• Independent quality audits
• Six-Sigma quality programs
• Baldrige Awards
• IEEE Quality Standards
• Testing only by Developers
• DOD 2167A and DOD 498
• Reliability Models
• Quality circles• Clean-room methods• Cost of quality without software modifications
SWQUAL97\18 Copyright © 2002 by SPR. All Rights Reserved.
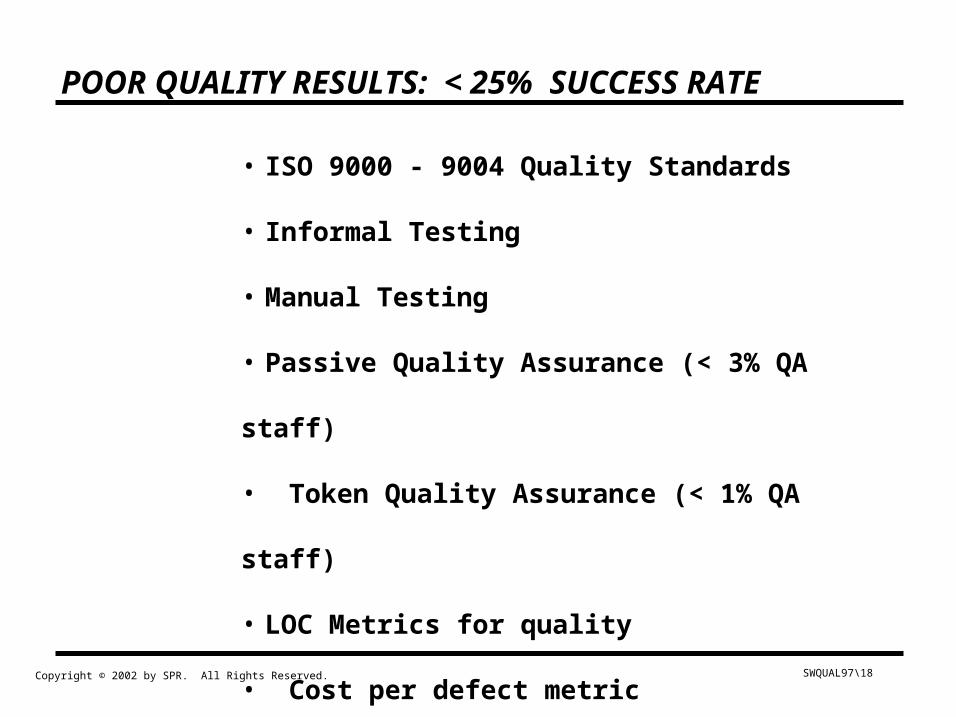
POOR QUALITY RESULTS: < 25% SUCCESS RATE
• ISO 9000 - 9004 Quality Standards
• Informal Testing
• Manual Testing
• Passive Quality Assurance (< 3% QA staff)
• Token Quality Assurance (< 1% QA staff)
• LOC Metrics for quality
• Cost per defect metric
• Rapid Application Development (RAD)
SWQUAL97\19 Copyright © 2002 by SPR. All Rights Reserved.
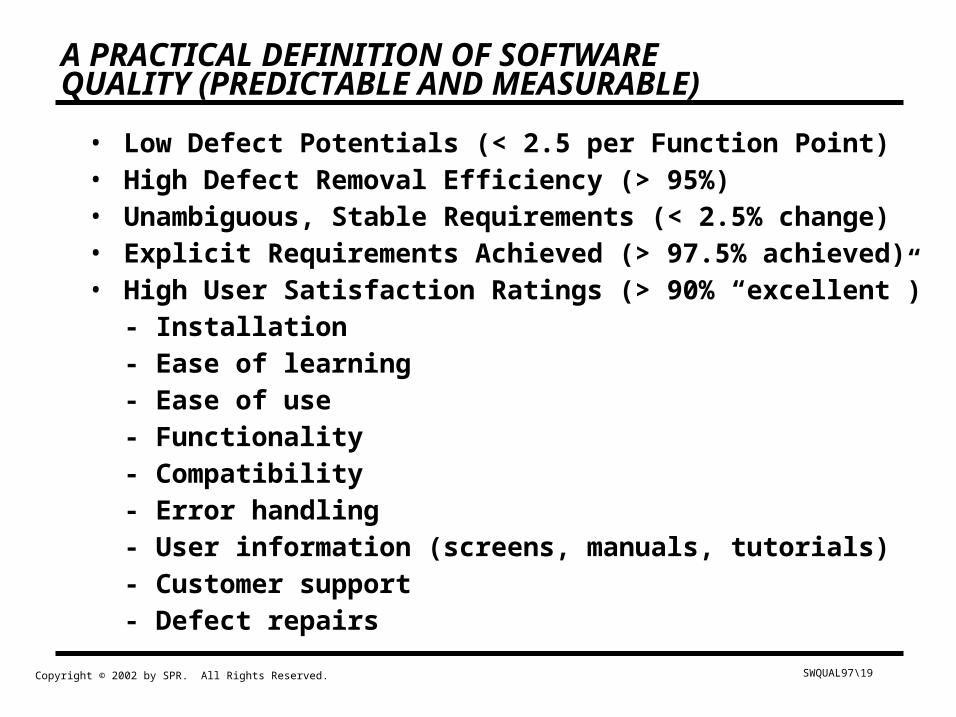
A PRACTICAL DEFINITION OF SOFTWAREQUALITY (PREDICTABLE AND MEASURABLE)
• Low Defect Potentials (< 2.5 per Function Point)• High Defect Removal Efficiency (> 95%)• Unambiguous, Stable Requirements (< 2.5% change)• Explicit Requirements Achieved (> 97.5% achieved)• High User Satisfaction Ratings (> 90% “excellent”)
- Installation- Ease of learning- Ease of use- Functionality- Compatibility- Error handling- User information (screens, manuals, tutorials)- Customer support- Defect repairs
SWQUAL97\20 Copyright © 2002 by SPR. All Rights Reserved.
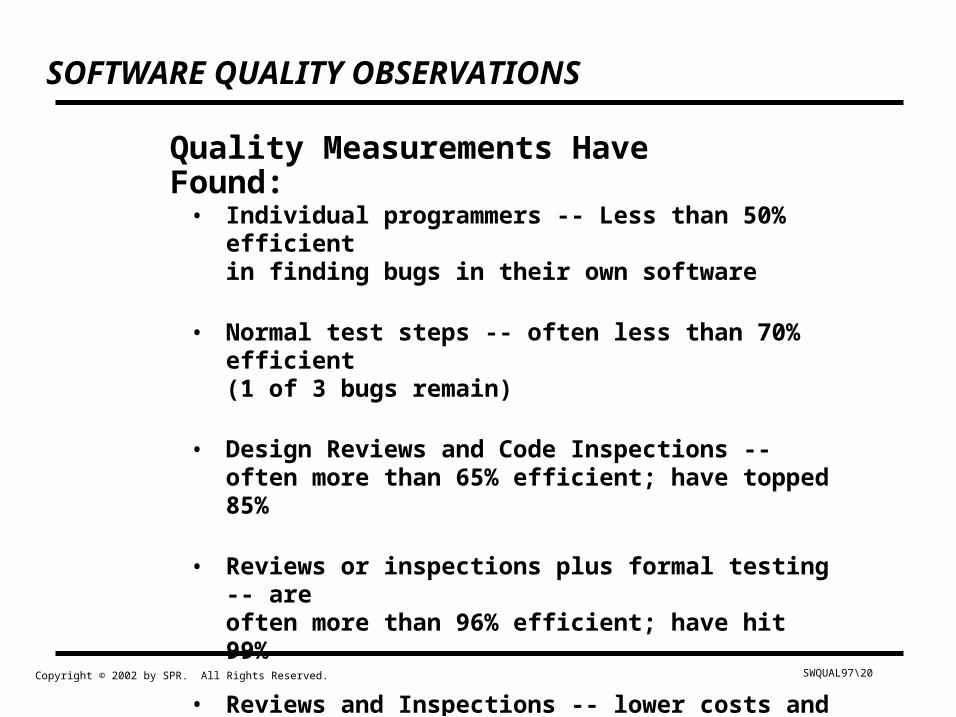
SOFTWARE QUALITY OBSERVATIONS
• Individual programmers -- Less than 50% efficientin finding bugs in their own software
• Normal test steps -- often less than 70% efficient(1 of 3 bugs remain)
• Design Reviews and Code Inspections -- often more than 65% efficient; have topped 85%
• Reviews or inspections plus formal testing -- areoften more than 96% efficient; have hit 99%
• Reviews and Inspections -- lower costs and schedules by as much as 30%
Quality Measurements Have Found:
SWQUAL97\21 Copyright © 2002 by SPR. All Rights Reserved.
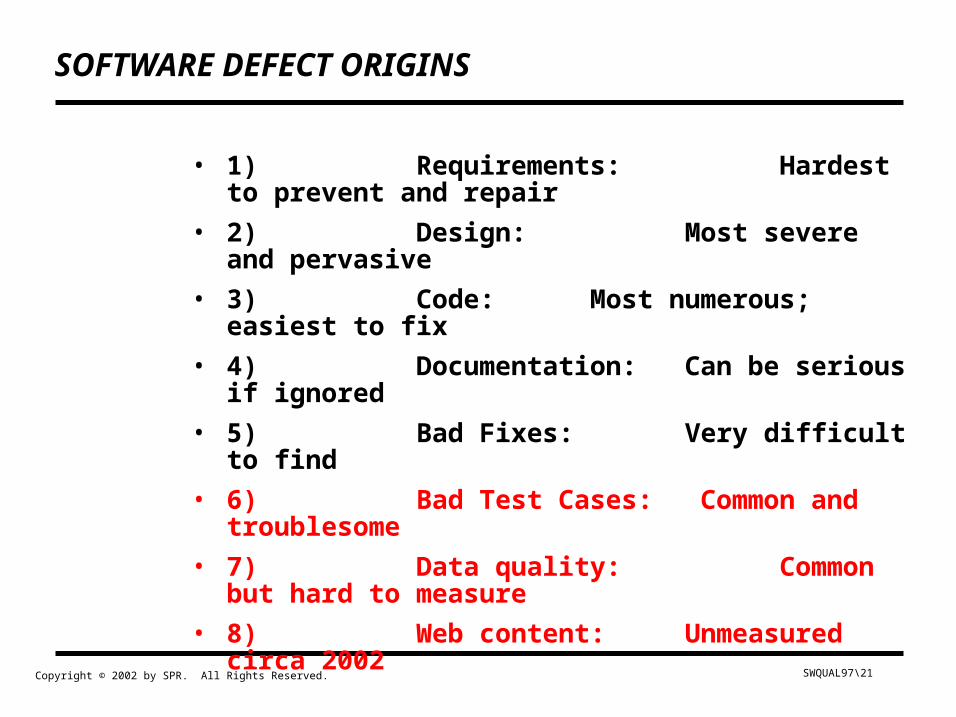
SOFTWARE DEFECT ORIGINS
• 1) Requirements: Hardest to prevent and repair
• 2) Design: Most severe and pervasive
• 3) Code: Most numerous; easiest to fix
• 4) Documentation: Can be serious if ignored
• 5) Bad Fixes: Very difficult to find
• 6) Bad Test Cases: Common and troublesome
• 7) Data quality: Common but hard to measure
• 8) Web content: Unmeasured circa 2002
SWQUAL97\22 Copyright © 2002 by SPR. All Rights Reserved.
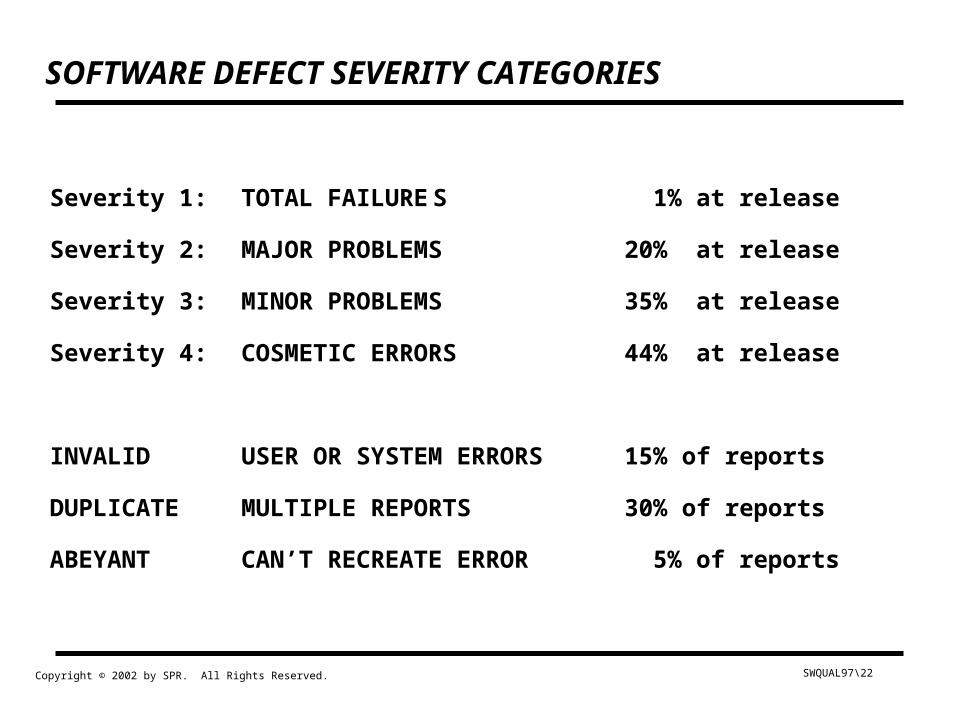
SOFTWARE DEFECT SEVERITY CATEGORIES
Severity 1: TOTAL FAILURES 1% at release
Severity 2: MAJOR PROBLEMS 20% at release
Severity 3: MINOR PROBLEMS 35% at release
Severity 4: COSMETIC ERRORS 44% at release
INVALID USER OR SYSTEM ERRORS 15% of reports
DUPLICATE MULTIPLE REPORTS 30% of reports
ABEYANT CAN’T RECREATE ERROR 5% of reports
SWQUAL97\23 Copyright © 2002 by SPR. All Rights Reserved.
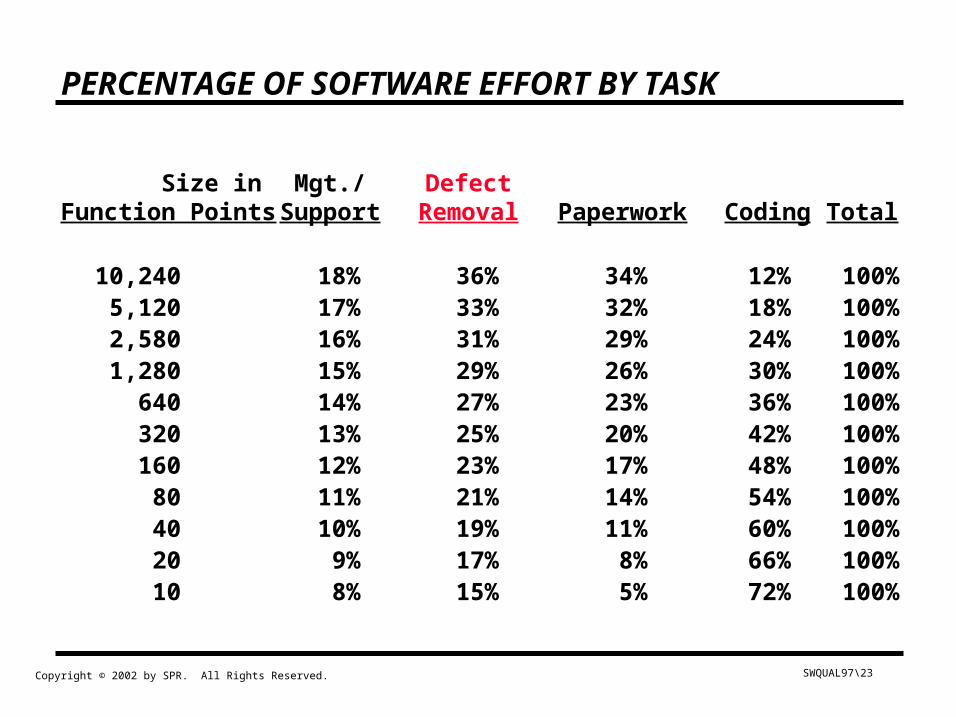
PERCENTAGE OF SOFTWARE EFFORT BY TASK
Size in Mgt./ DefectFunction Points Support Removal Paperwork Coding Total
10,240 18% 36% 34% 12% 100%5,120 17% 33% 32% 18% 100%2,580 16% 31% 29% 24% 100%1,280 15% 29% 26% 30% 100%
640 14% 27% 23% 36% 100%320 13% 25% 20% 42% 100%160 12% 23% 17% 48% 100%80 11% 21% 14% 54% 100%40 10% 19% 11% 60% 100%20 9% 17% 8% 66% 100%10 8% 15% 5% 72% 100%
SWQUAL97\24 Copyright © 2002 by SPR. All Rights Reserved.
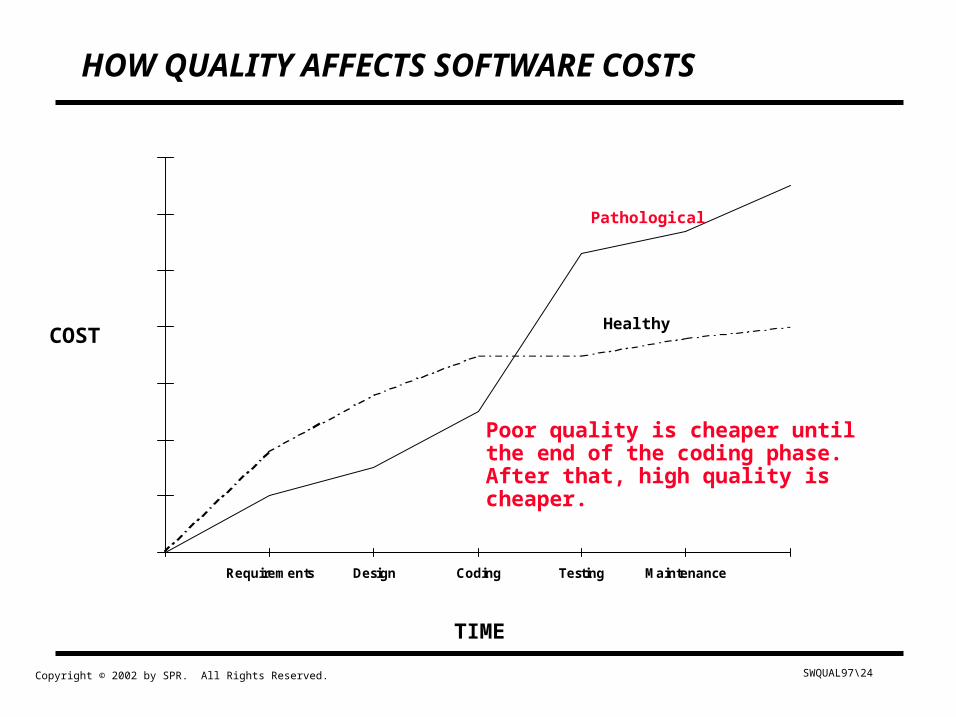
HOW QUALITY AFFECTS SOFTWARE COSTS
Requirements Design Coding Testing Maintenance
COST
TIME
Pathological
Healthy
Poor quality is cheaper untilthe end of the coding phase.After that, high quality ischeaper.
SWQUAL97\25 Copyright © 2002 by SPR. All Rights Reserved.
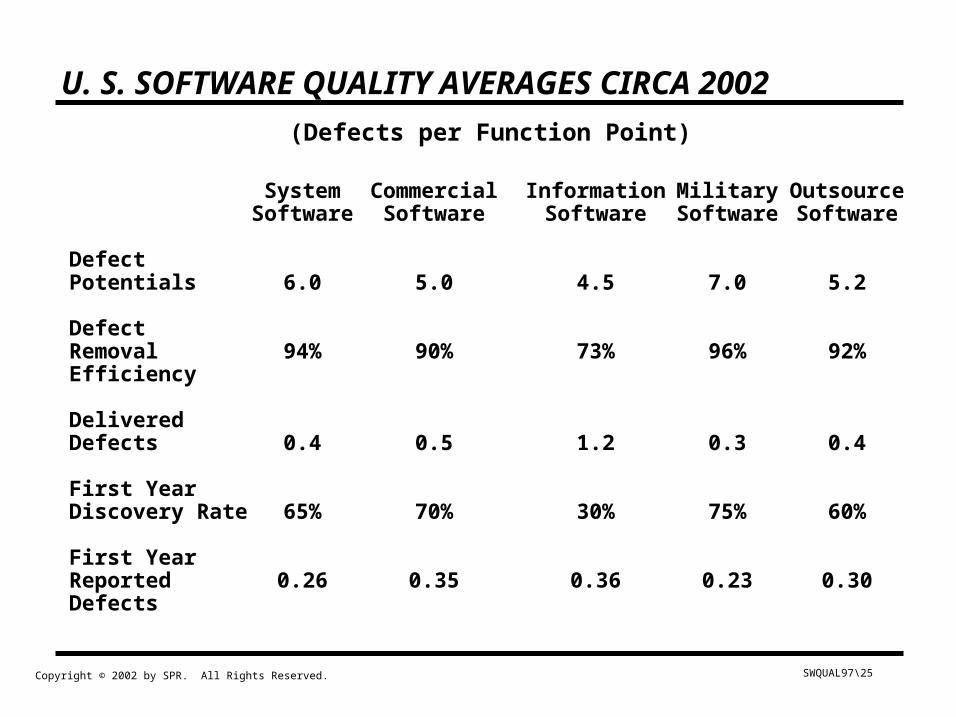
U. S. SOFTWARE QUALITY AVERAGES CIRCA 2002
(Defects per Function Point)
System Commercial Information Military OutsourceSoftware Software Software Software Software
DefectPotentials 6.0 5.0 4.5 7.0 5.2
DefectRemoval 94% 90% 73% 96% 92%Efficiency
DeliveredDefects 0.4 0.5 1.2 0.3 0.4
First YearDiscovery Rate 65% 70% 30% 75% 60%
First YearReported 0.26 0.35 0.36 0.23 0.30Defects
SWQUAL97\26 Copyright © 2002 by SPR. All Rights Reserved.
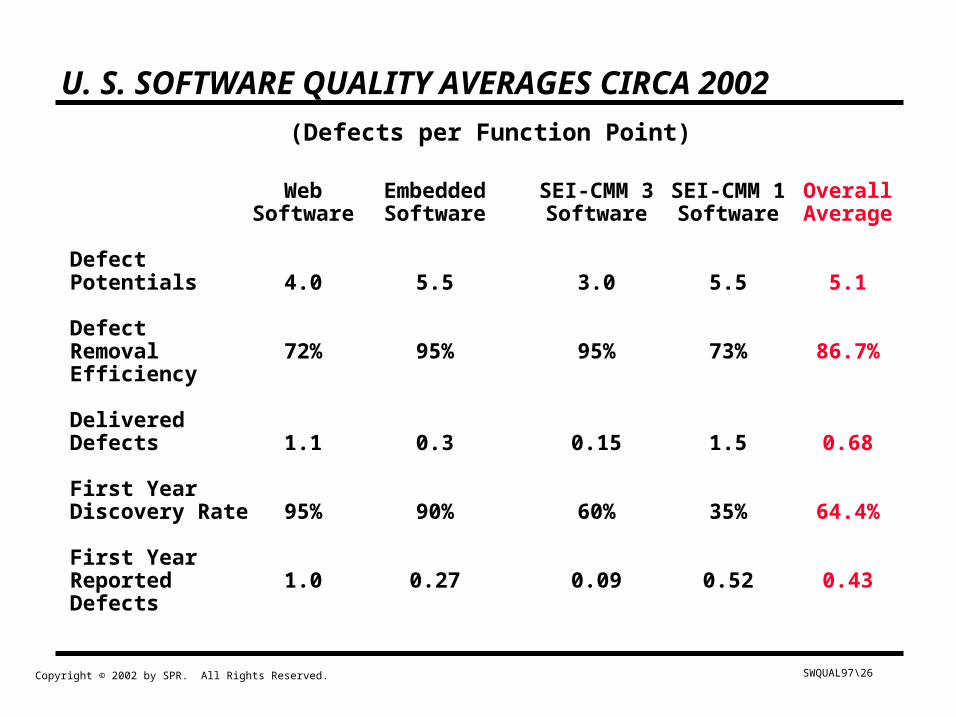
U. S. SOFTWARE QUALITY AVERAGES CIRCA 2002
(Defects per Function Point)
Web Embedded SEI-CMM 3 SEI-CMM 1 OverallSoftware Software Software Software Average
DefectPotentials 4.0 5.5 3.0 5.5 5.1
DefectRemoval 72% 95% 95% 73% 86.7%Efficiency
DeliveredDefects 1.1 0.3 0.15 1.5 0.68
First YearDiscovery Rate 95% 90% 60% 35% 64.4%
First YearReported 1.0 0.27 0.09 0.52 0.43Defects
SWQUAL97\27 Copyright © 2002 by SPR. All Rights Reserved.
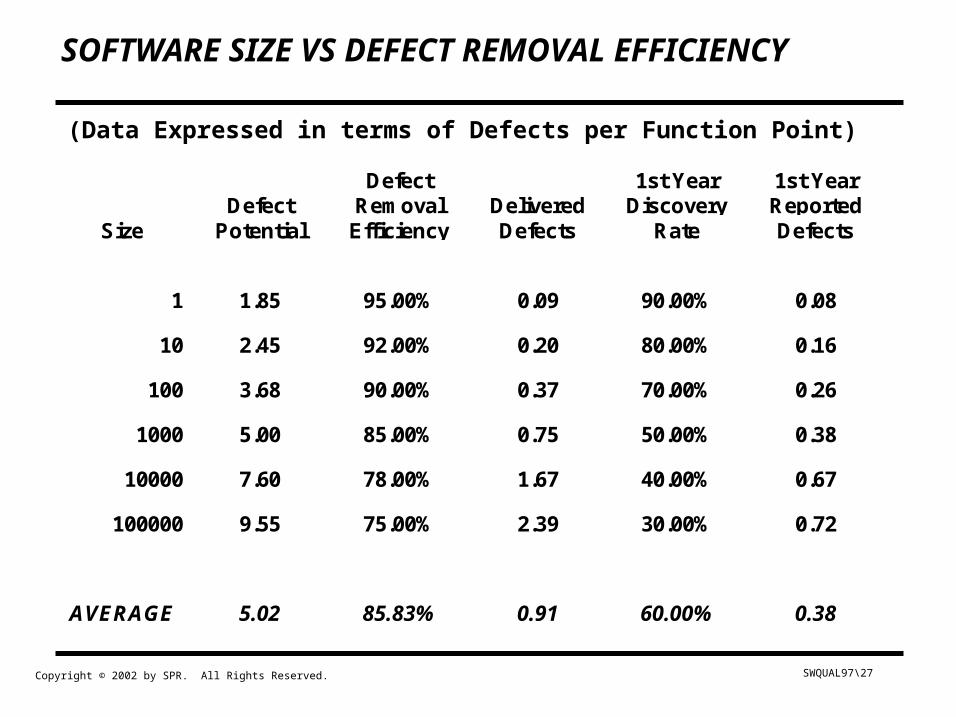
SOFTWARE SIZE VS DEFECT REMOVAL EFFICIENCY
SizeDefect
Potential
DefectRemoval
EfficiencyDeliveredDefects
1st YearDiscovery
Rate
1st YearReportedDefects
1 1.85 95.00% 0.09 90.00% 0.08
10 2.45 92.00% 0.20 80.00% 0.16
100 3.68 90.00% 0.37 70.00% 0.26
1000 5.00 85.00% 0.75 50.00% 0.38
10000 7.60 78.00% 1.67 40.00% 0.67
100000 9.55 75.00% 2.39 30.00% 0.72
AVERAGE 5.02 85.83% 0.91 60.00% 0.38
(Data Expressed in terms of Defects per Function Point)
SWQUAL97\28 Copyright © 2002 by SPR. All Rights Reserved.
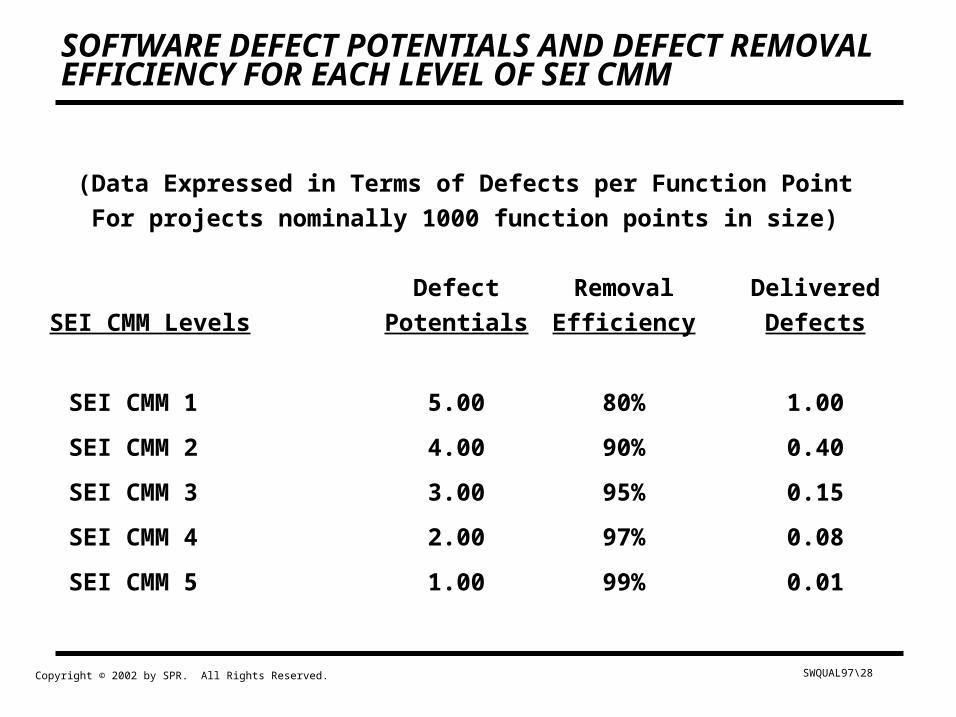
SOFTWARE DEFECT POTENTIALS AND DEFECT REMOVAL EFFICIENCY FOR EACH LEVEL OF SEI CMM
(Data Expressed in Terms of Defects per Function Point
For projects nominally 1000 function points in size)
Defect Removal Delivered
SEI CMM Levels Potentials Efficiency Defects
SEI CMM 1 5.00 80% 1.00
SEI CMM 2 4.00 90% 0.40
SEI CMM 3 3.00 95% 0.15
SEI CMM 4 2.00 97% 0.08
SEI CMM 5 1.00 99% 0.01
SWQUAL97\29 Copyright © 2002 by SPR. All Rights Reserved.
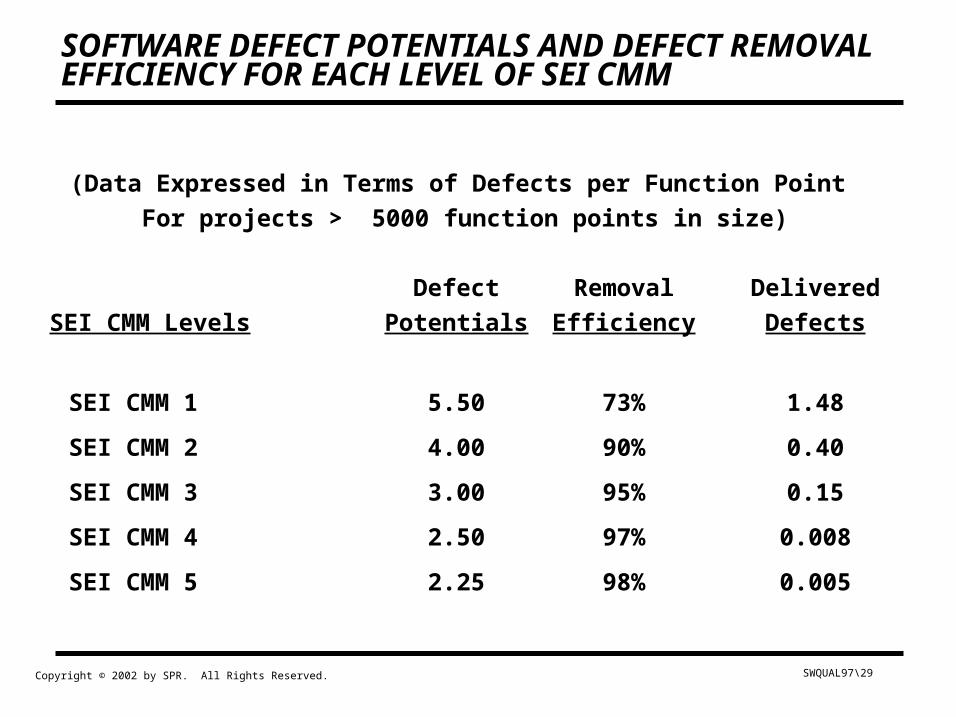
SOFTWARE DEFECT POTENTIALS AND DEFECT REMOVAL EFFICIENCY FOR EACH LEVEL OF SEI CMM
(Data Expressed in Terms of Defects per Function Point
For projects > 5000 function points in size)
Defect Removal Delivered
SEI CMM Levels Potentials Efficiency Defects
SEI CMM 1 5.50 73% 1.48
SEI CMM 2 4.00 90% 0.40
SEI CMM 3 3.00 95% 0.15
SEI CMM 4 2.50 97% 0.008
SEI CMM 5 2.25 98% 0.005
SWQUAL97\30 Copyright © 2002 by SPR. All Rights Reserved.
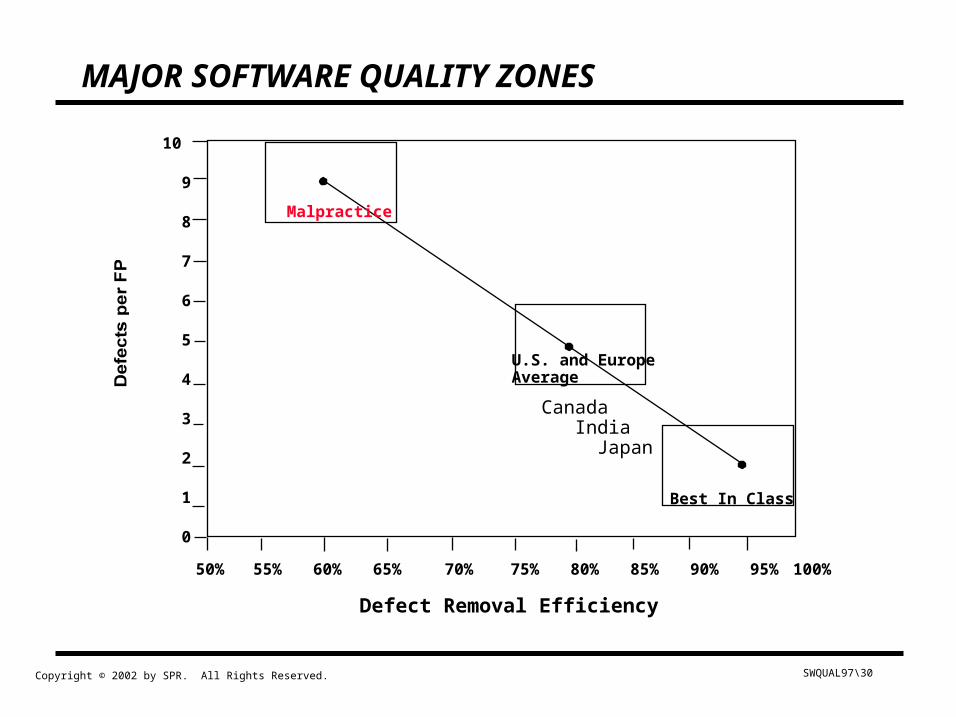
MAJOR SOFTWARE QUALITY ZONES
10
9
8
7
6
5
4
3
2
1
0
50% 55% 60% 65% 70% 75% 80% 85% 90% 95% 100%
Defect Removal Efficiency
Malpractice
U.S. and EuropeAverage
Best In Class
Canada India Japan
SWQUAL97\31 Copyright © 2002 by SPR. All Rights Reserved.
0
1
2
3
4
5
6
7
8
9
10
50% 55% 60% 65% 70% 75% 80% 85% 90% 95% 100%
Defect Removal Efficiency
Defectsper FP
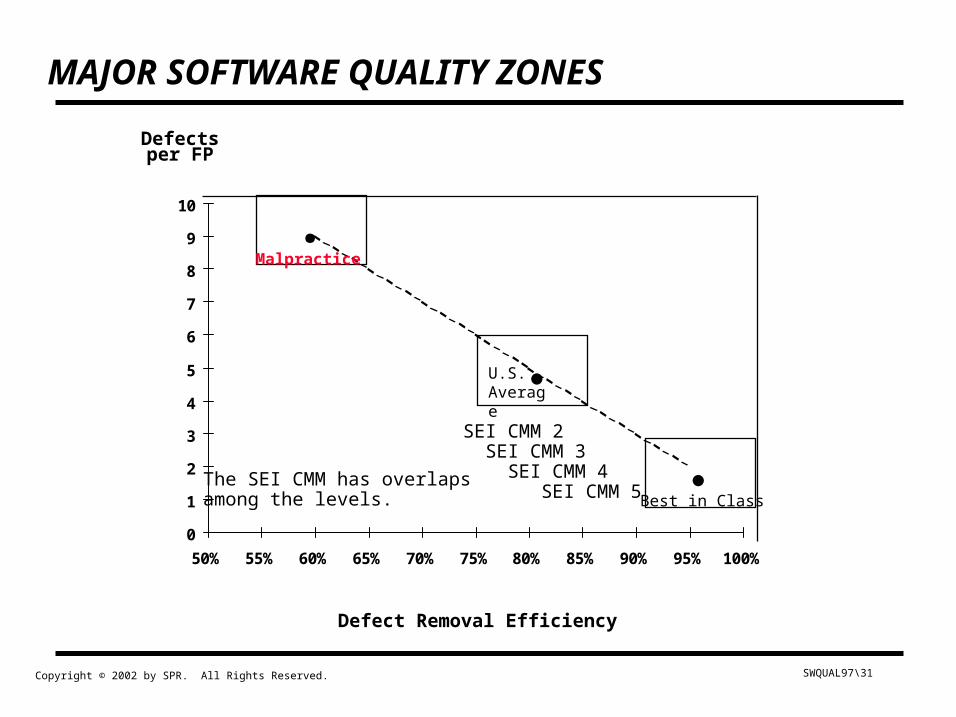
Malpractice
U.S. Average
Best in Class
.
MAJOR SOFTWARE QUALITY ZONES
SEI CMM 2 SEI CMM 3 SEI CMM 4 SEI CMM 5
The SEI CMM has overlapsamong the levels.
SWQUAL97\32 Copyright © 2002 by SPR. All Rights Reserved.
0
1
2
3
4
5
6
7
8
9
10
50% 55% 60% 65% 70% 75% 80% 85% 90% 95% 100%
Defect Removal Efficiency
Defectsper FP
Malpractice
U.S. Average
Best in Class
.
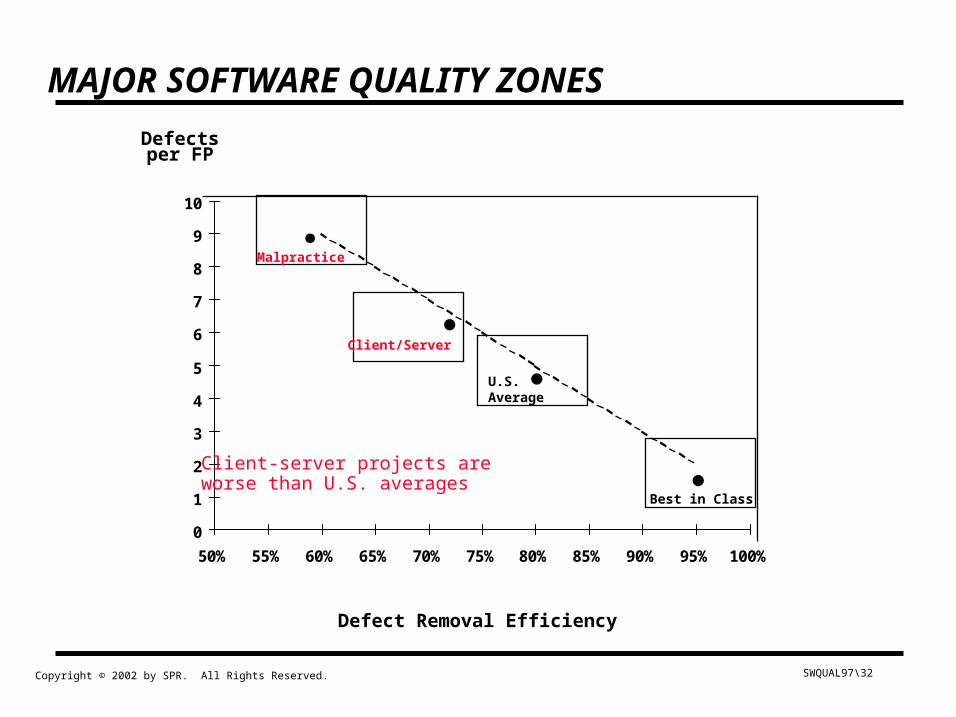
Client/Server
MAJOR SOFTWARE QUALITY ZONES
Client-server projects areworse than U.S. averages
SWQUAL97\33 Copyright © 2002 by SPR. All Rights Reserved.
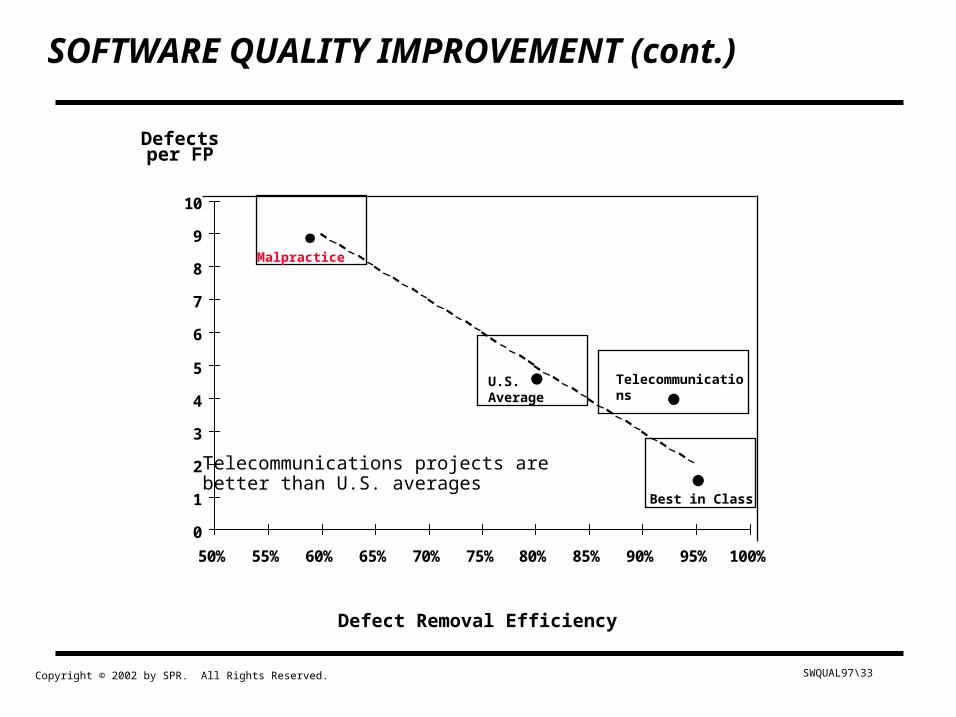
0
1
2
3
4
5
6
7
8
9
10
50% 55% 60% 65% 70% 75% 80% 85% 90% 95% 100%
Defect Removal Efficiency
Defectsper FP
Malpractice
U.S. Average
Best in Class
.
Telecommunication
s
SOFTWARE QUALITY IMPROVEMENT (cont.)
Telecommunications projects arebetter than U.S. averages
SWQUAL97\34 Copyright © 2002 by SPR. All Rights Reserved.
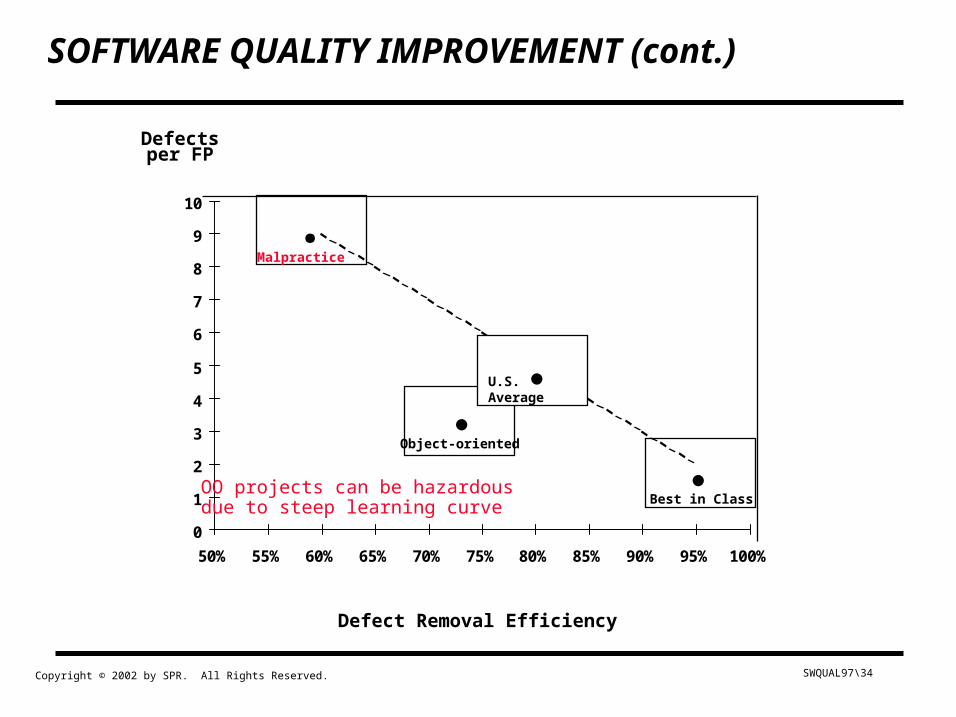
0
1
2
3
4
5
6
7
8
9
10
50% 55% 60% 65% 70% 75% 80% 85% 90% 95% 100%
Defect Removal Efficiency
Defectsper FP
Malpractice
U.S. Average
Best in Class
.
Object-oriented
SOFTWARE QUALITY IMPROVEMENT (cont.)
OO projects can be hazardousdue to steep learning curve
SWQUAL97\35 Copyright © 2002 by SPR. All Rights Reserved.
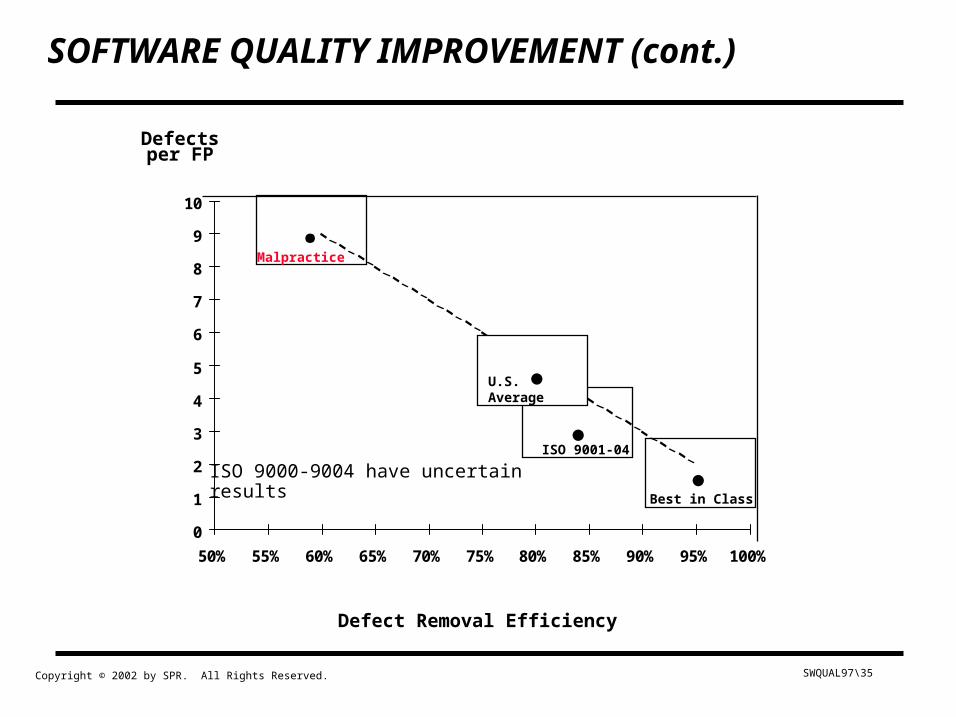
0
1
2
3
4
5
6
7
8
9
10
50% 55% 60% 65% 70% 75% 80% 85% 90% 95% 100%
Defect Removal Efficiency
Defectsper FP
Malpractice
U.S. Average
Best in Class
.
ISO 9001-04
SOFTWARE QUALITY IMPROVEMENT (cont.)
ISO 9000-9004 have uncertainresults
SWQUAL97\36 Copyright © 2002 by SPR. All Rights Reserved.
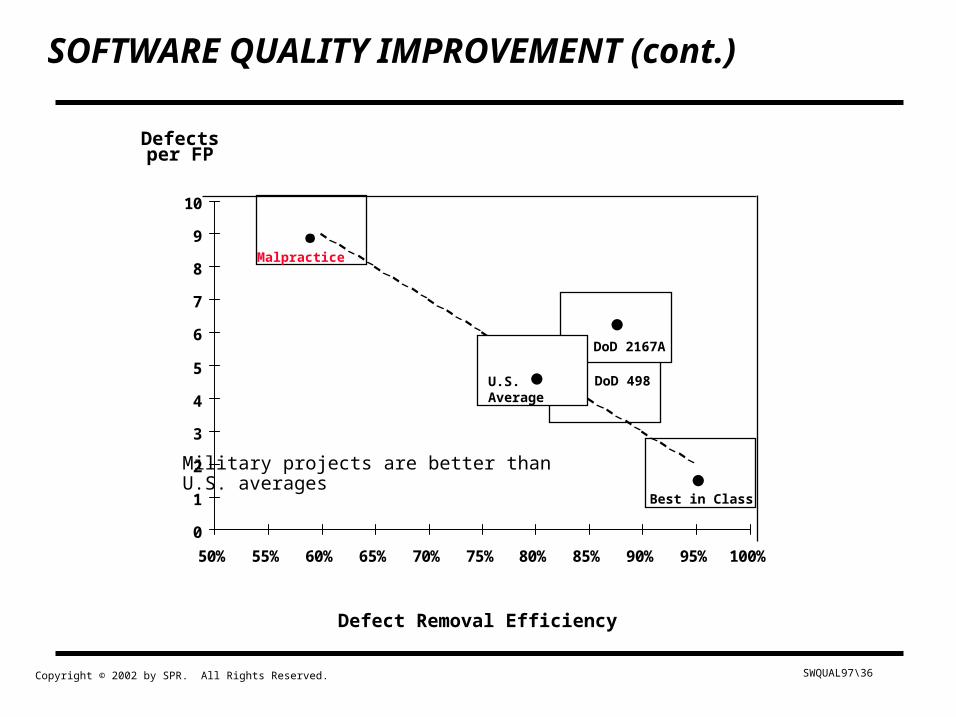
0
1
2
3
4
5
6
7
8
9
10
50% 55% 60% 65% 70% 75% 80% 85% 90% 95% 100%
Defect Removal Efficiency
Defectsper FP
Malpractice
U.S. Average
Best in Class
.
SOFTWARE QUALITY IMPROVEMENT (cont.)
DoD 2167A
DoD 498
Military projects are better thanU.S. averages
SWQUAL97\37 Copyright © 2002 by SPR. All Rights Reserved.
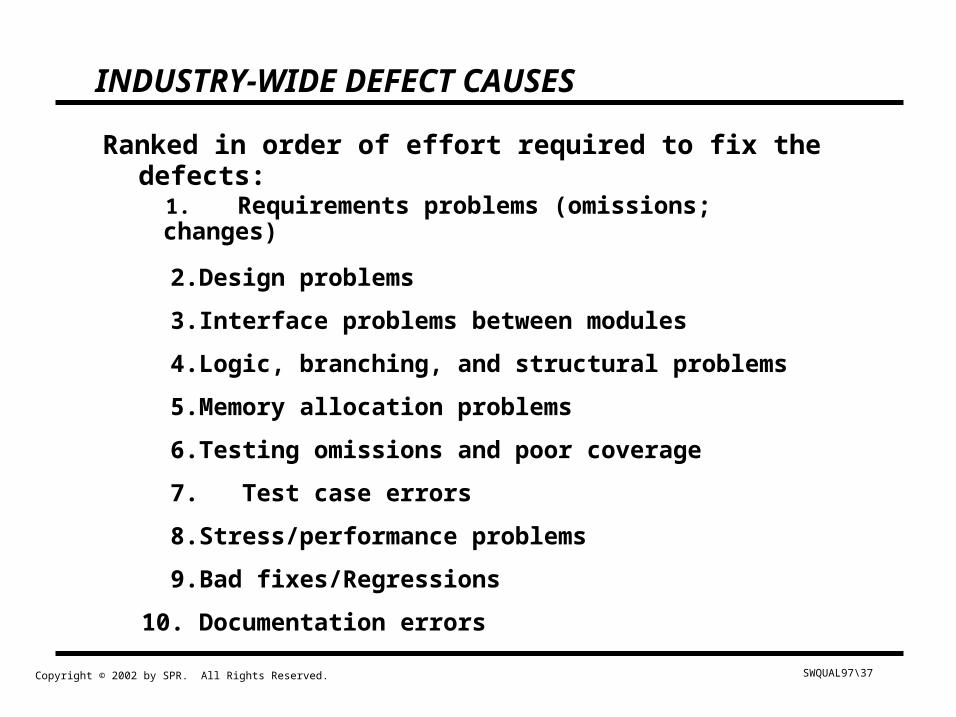
INDUSTRY-WIDE DEFECT CAUSES
1. Requirements problems (omissions; changes)
2. Design problems
3. Interface problems between modules
4. Logic, branching, and structural problems
5. Memory allocation problems
6. Testing omissions and poor coverage
7. Test case errors
8. Stress/performance problems
9. Bad fixes/Regressions
10. Documentation errors
Ranked in order of effort required to fix the defects:
SWQUAL97\38 Copyright © 2002 by SPR. All Rights Reserved.
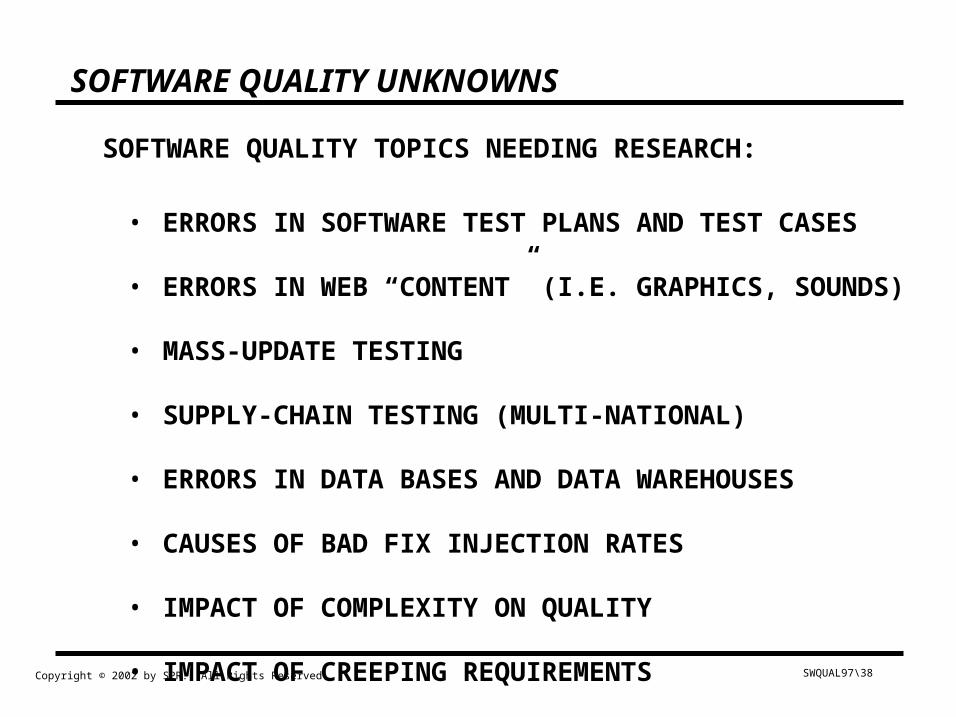
SOFTWARE QUALITY UNKNOWNS
• ERRORS IN SOFTWARE TEST PLANS AND TEST CASES
• ERRORS IN WEB “CONTENT” (I.E. GRAPHICS, SOUNDS)
• MASS-UPDATE TESTING
• SUPPLY-CHAIN TESTING (MULTI-NATIONAL)
• ERRORS IN DATA BASES AND DATA WAREHOUSES
• CAUSES OF BAD FIX INJECTION RATES
• IMPACT OF COMPLEXITY ON QUALITY
• IMPACT OF CREEPING REQUIREMENTS
SOFTWARE QUALITY TOPICS NEEDING RESEARCH:
SWQUAL97\39 Copyright © 2002 by SPR. All Rights Reserved.
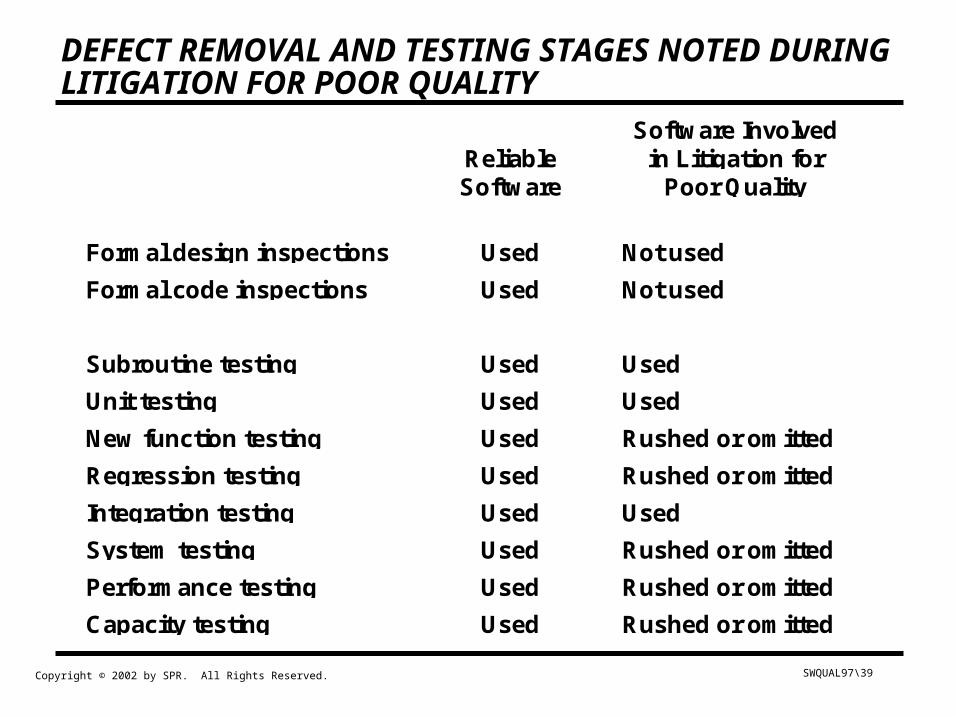
DEFECT REMOVAL AND TESTING STAGES NOTED DURING LITIGATION FOR POOR QUALITY
ReliableSoftware
Software Involvedin Litigation for
Poor Quality
Formal design inspections Used Not used
Formal code inspections Used Not used
Subroutine testing Used Used
Unit testing Used Used
New function testing Used Rushed or omitted
Regression testing Used Rushed or omitted
Integration testing Used Used
System testing Used Rushed or omitted
Performance testing Used Rushed or omitted
Capacity testing Used Rushed or omitted
SWQUAL97\40 Copyright © 2002 by SPR. All Rights Reserved.
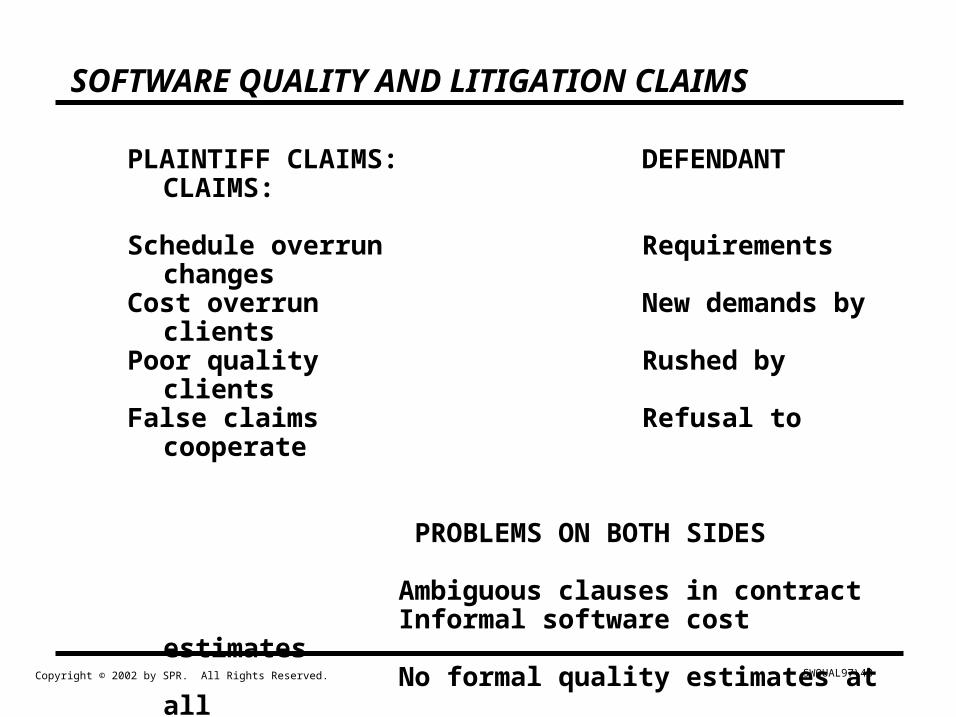
SOFTWARE QUALITY AND LITIGATION CLAIMS
PLAINTIFF CLAIMS: DEFENDANT CLAIMS:
Schedule overrun Requirements changesCost overrun New demands by clientsPoor quality Rushed by clientsFalse claims Refusal to cooperate
PROBLEMS ON BOTH SIDES
Ambiguous clauses in contract Informal software cost estimates No formal quality estimates at all No use of formal inspections Inadequate milestone tracking Friction and severe personal disputes Independent audits too late to solve issues
SWQUAL97\41 Copyright © 2002 by SPR. All Rights Reserved.
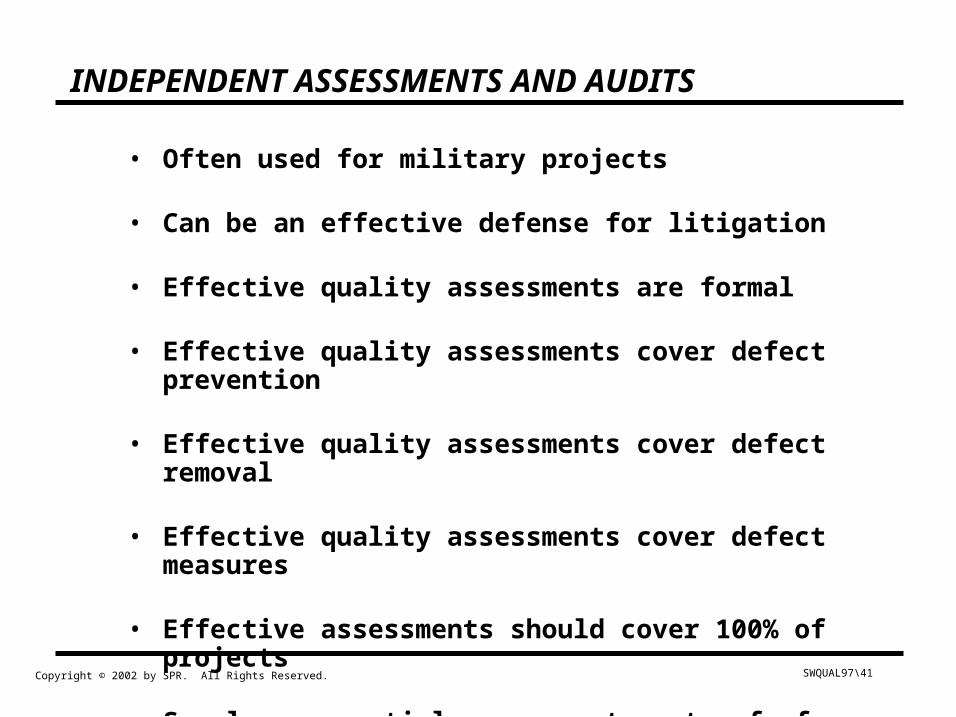
INDEPENDENT ASSESSMENTS AND AUDITS
• Often used for military projects
• Can be an effective defense for litigation
• Effective quality assessments are formal
• Effective quality assessments cover defect prevention
• Effective quality assessments cover defect removal
• Effective quality assessments cover defect measures
• Effective assessments should cover 100% of projects
• Samples or partial assessments not safe for litigation
SWQUAL97\42 Copyright © 2002 by SPR. All Rights Reserved.
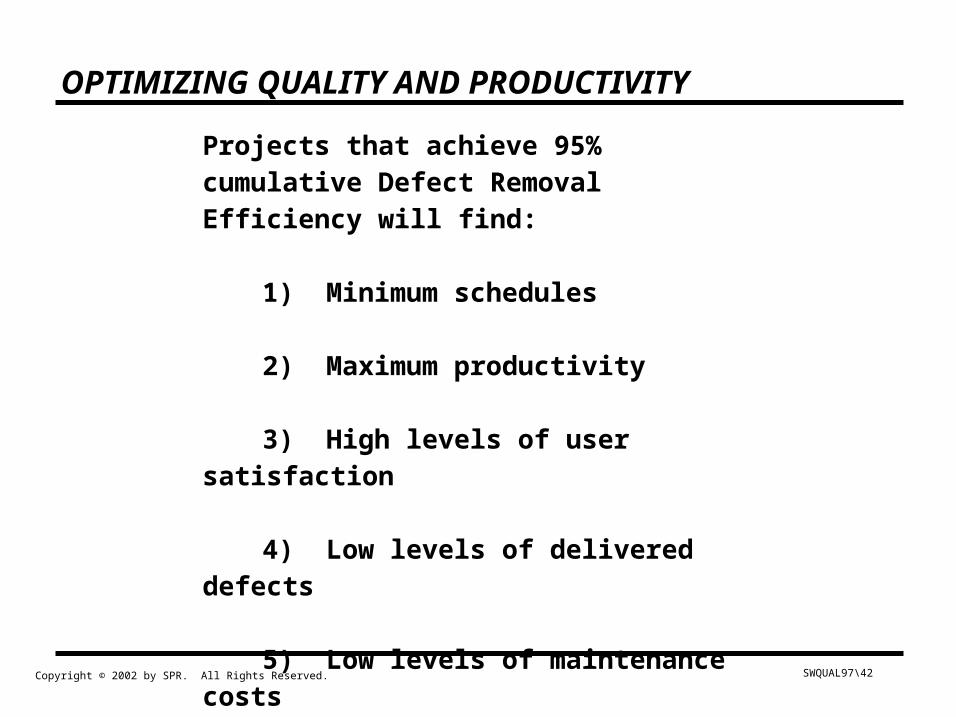
OPTIMIZING QUALITY AND PRODUCTIVITY
Projects that achieve 95% cumulative Defect Removal Efficiency will find:
1) Minimum schedules
2) Maximum productivity
3) High levels of user satisfaction
4) Low levels of delivered defects
5) Low levels of maintenance costs
6) Low risk of litigation
SWQUAL97\43 Copyright © 2002 by SPR. All Rights Reserved.
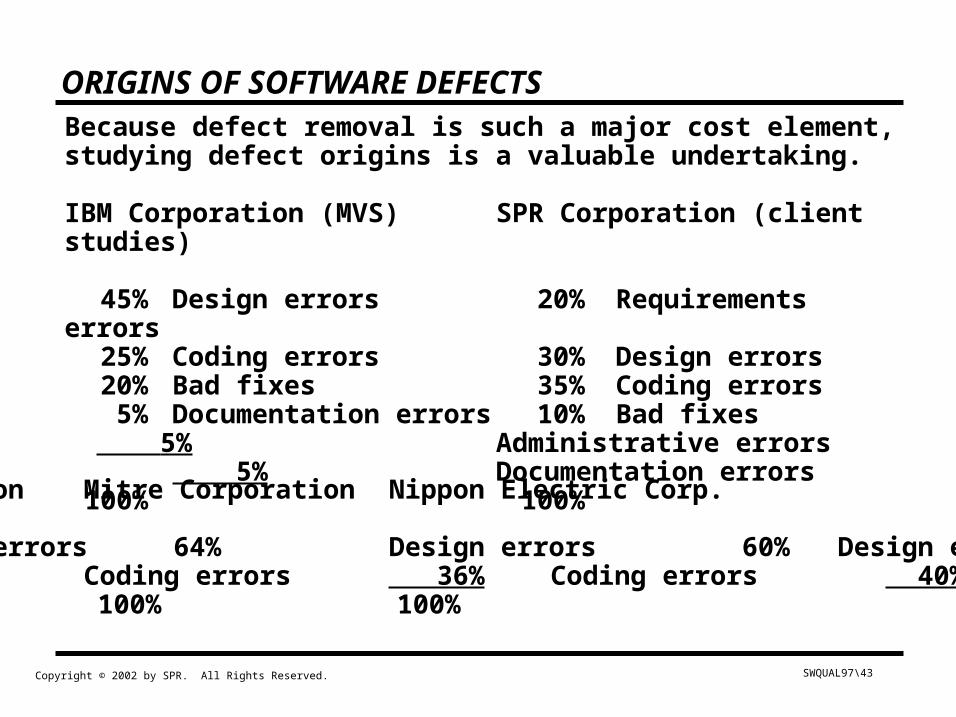
ORIGINS OF SOFTWARE DEFECTSBecause defect removal is such a major cost element, studying defect origins is a valuable undertaking.
IBM Corporation (MVS) SPR Corporation (client studies)
45% Design errors 20% Requirements errors25% Coding errors 30% Design errors20% Bad fixes 35% Coding errors
5% Documentation errors 10% Bad fixes 5% Administrative errors 5% Documentation errors100% 100%
TRW Corporation Mitre Corporation Nippon Electric Corp.
60% Design errors 64% Design errors 60% Design errors 40% Coding errors 36% Coding errors 40% Coding errors100% 100% 100%
SWQUAL97\44 Copyright © 2002 by SPR. All Rights Reserved.
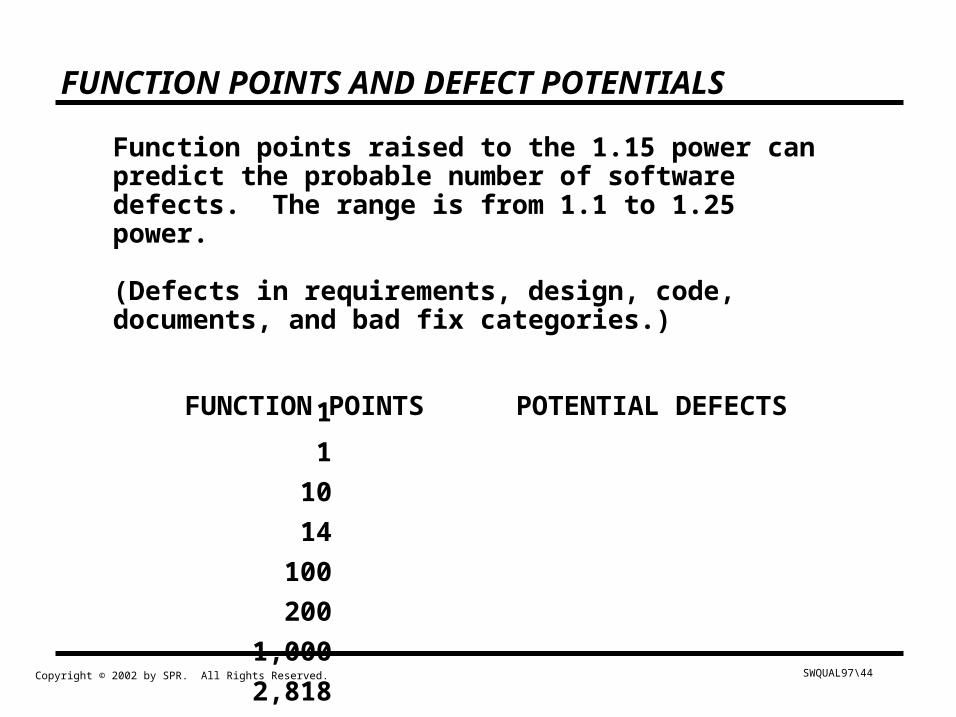
FUNCTION POINTS AND DEFECT POTENTIALS
Function points raised to the 1.15 power can predict the probable number of software defects. The range is from 1.1 to 1.25 power.
(Defects in requirements, design, code, documents, and bad fix categories.)
FUNCTION POINTS POTENTIAL DEFECTS1
1
10
14
100
200
1,000
2,818
10,000
39,811
100,000
316,228
SWQUAL97\45 Copyright © 2002 by SPR. All Rights Reserved.
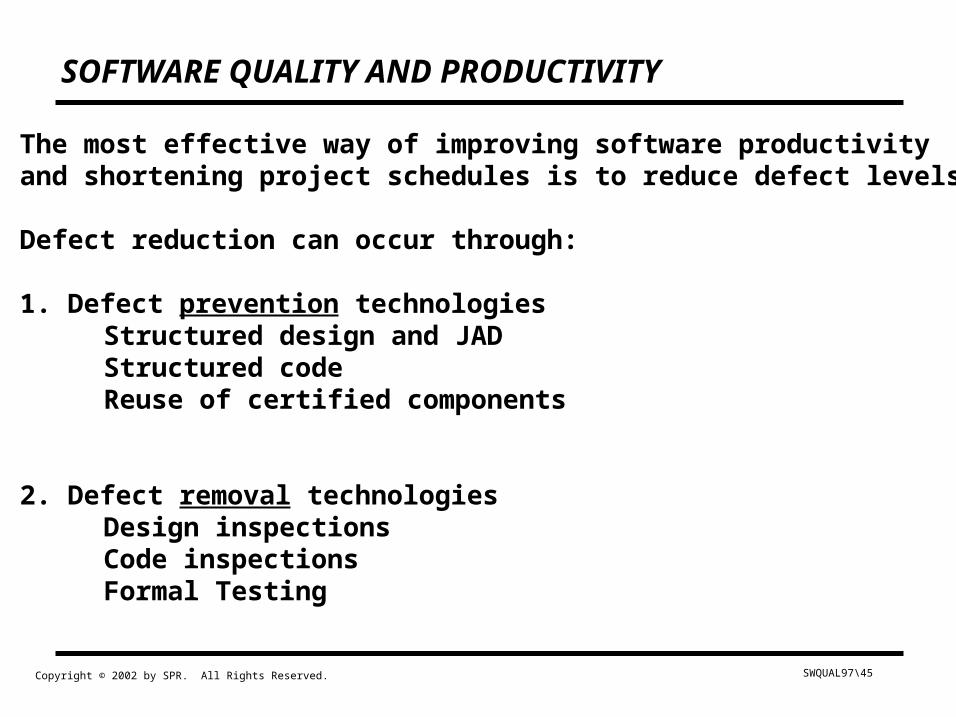
SOFTWARE QUALITY AND PRODUCTIVITY
• The most effective way of improving software productivityand shortening project schedules is to reduce defect levels.
• Defect reduction can occur through:
1. Defect prevention technologiesStructured design and JADStructured codeReuse of certified components
2. Defect removal technologiesDesign inspectionsCode inspectionsFormal Testing
SWQUAL97\46 Copyright © 2002 by SPR. All Rights Reserved.
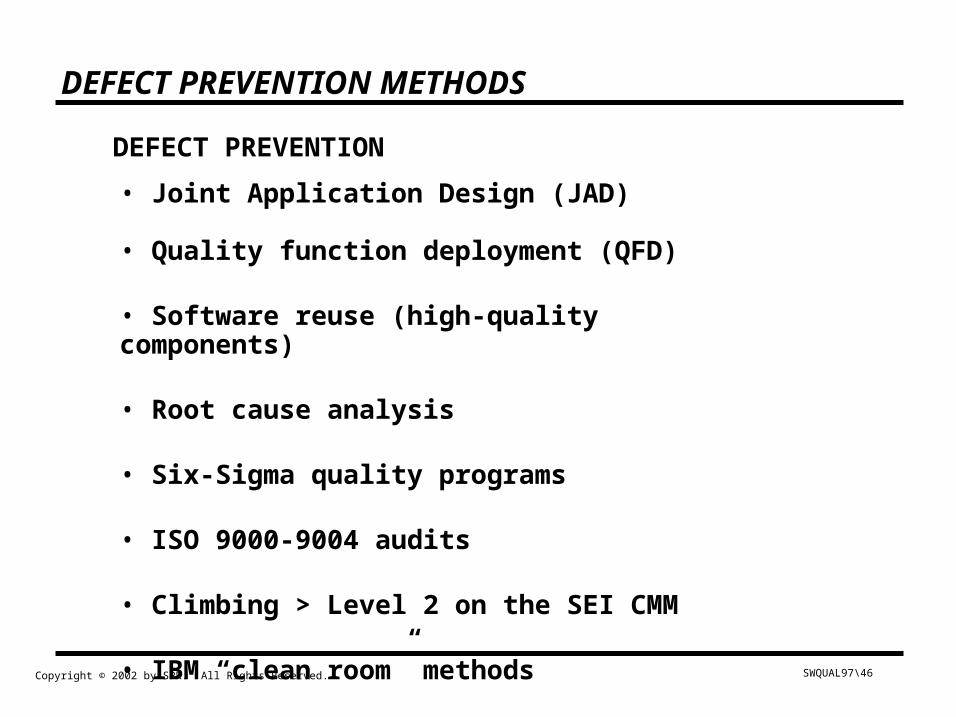
DEFECT PREVENTION METHODS
DEFECT PREVENTION
• Joint Application Design (JAD) • Quality function deployment (QFD)
• Software reuse (high-quality components)
• Root cause analysis
• Six-Sigma quality programs
• ISO 9000-9004 audits
• Climbing > Level 2 on the SEI CMM
• IBM “clean room” methods
SWQUAL97\47 Copyright © 2002 by SPR. All Rights Reserved.
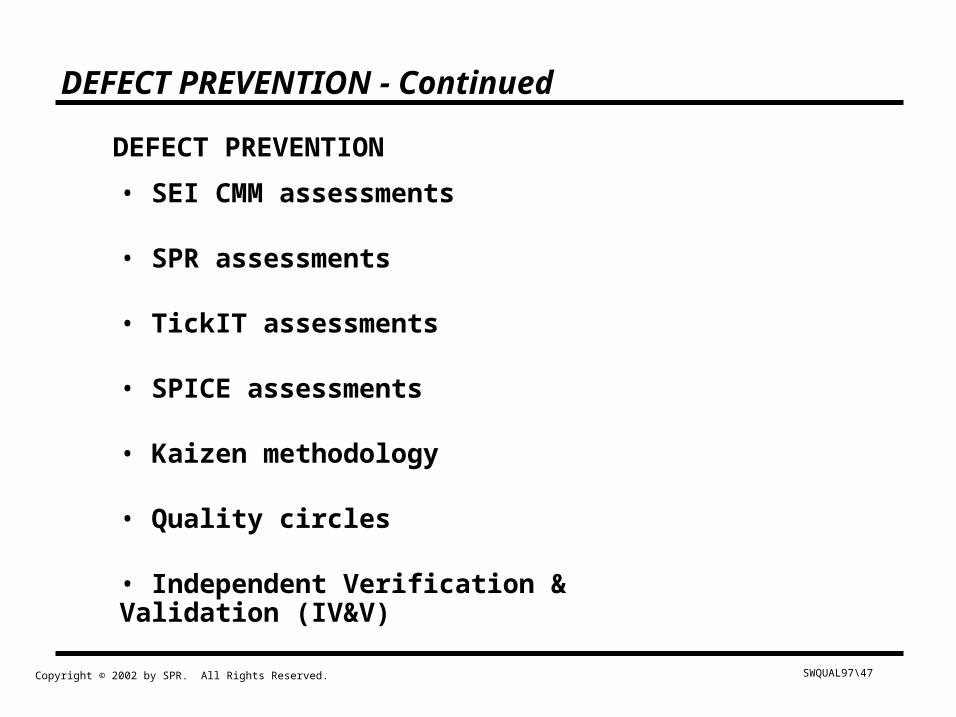
DEFECT PREVENTION - Continued
DEFECT PREVENTION
• SEI CMM assessments
• SPR assessments
• TickIT assessments
• SPICE assessments
• Kaizen methodology
• Quality circles
• Independent Verification & Validation (IV&V)
SWQUAL97\48 Copyright © 2002 by SPR. All Rights Reserved.
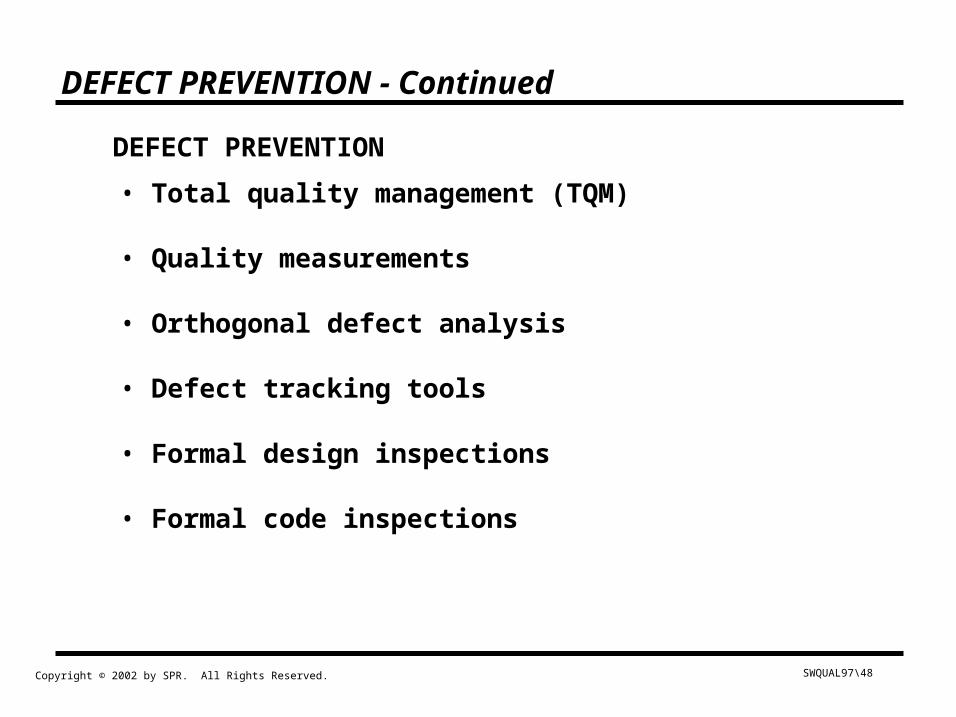
DEFECT PREVENTION - Continued
DEFECT PREVENTION
• Total quality management (TQM)
• Quality measurements
• Orthogonal defect analysis
• Defect tracking tools
• Formal design inspections
• Formal code inspections
SWQUAL97\49 Copyright © 2002 by SPR. All Rights Reserved.
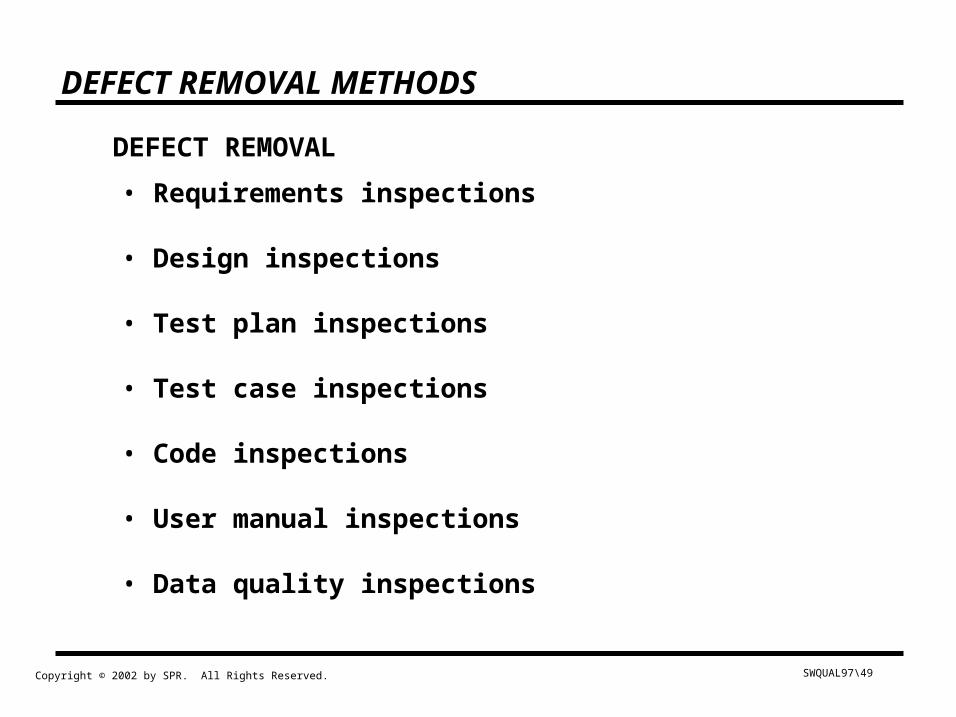
DEFECT REMOVAL METHODS
DEFECT REMOVAL
• Requirements inspections
• Design inspections
• Test plan inspections
• Test case inspections
• Code inspections
• User manual inspections
• Data quality inspections
SWQUAL97\50 Copyright © 2002 by SPR. All Rights Reserved.
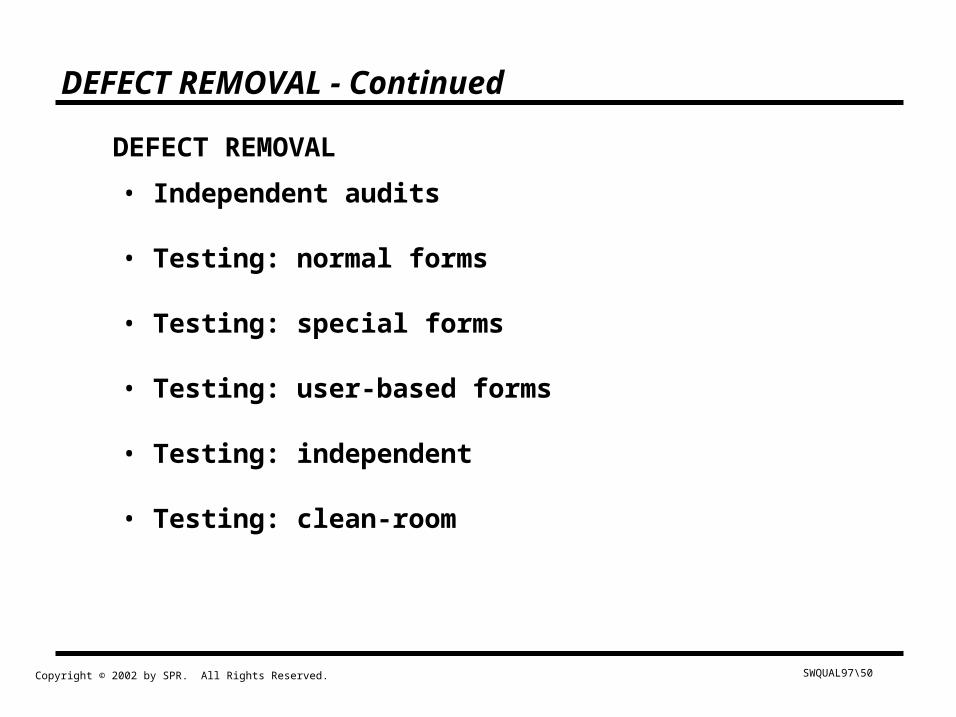
DEFECT REMOVAL - Continued
DEFECT REMOVAL
• Independent audits
• Testing: normal forms
• Testing: special forms
• Testing: user-based forms
• Testing: independent
• Testing: clean-room
SWQUAL97\51 Copyright © 2002 by SPR. All Rights Reserved.
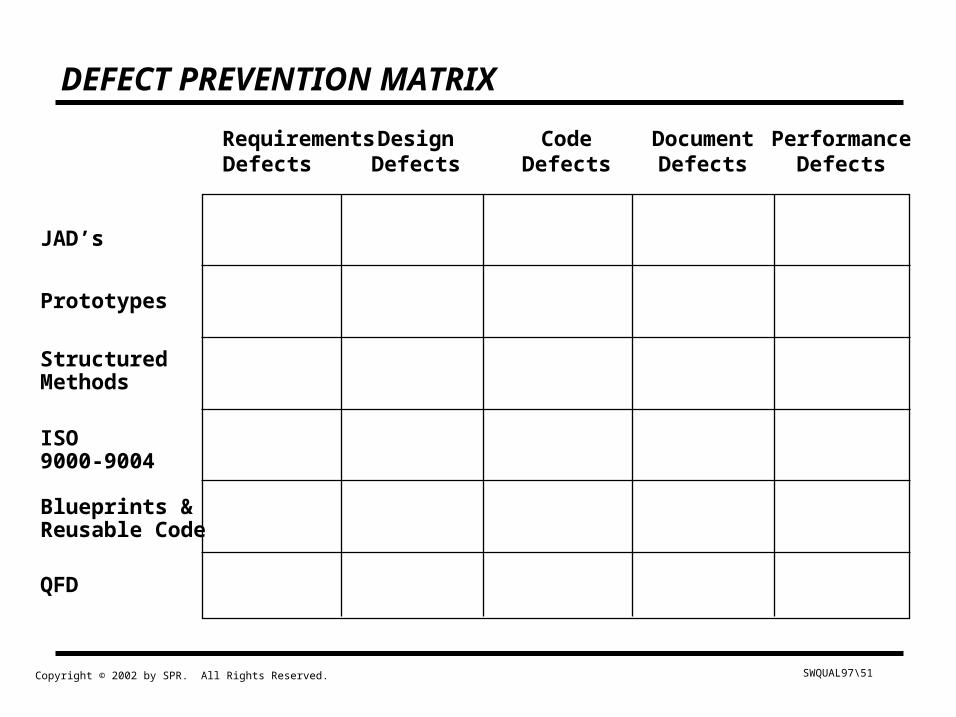
DEFECT PREVENTION MATRIX
Excellent GoodNot
Applicable Fair Poor
Excellent Excellent FairNot
Applicable Excellent
Fair Good Excellent Fair Fair
Fair Good Fair Fair Fair
Excellent Excellent Excellent Excellent Good
Good Excellent Fair Poor Good
JAD’s
Prototypes
StructuredMethods
ISO9000-9004
Blueprints &Reusable Code
QFD
Requirements Design Code Document PerformanceDefects Defects Defects Defects Defects
SWQUAL97\52 Copyright © 2002 by SPR. All Rights Reserved.
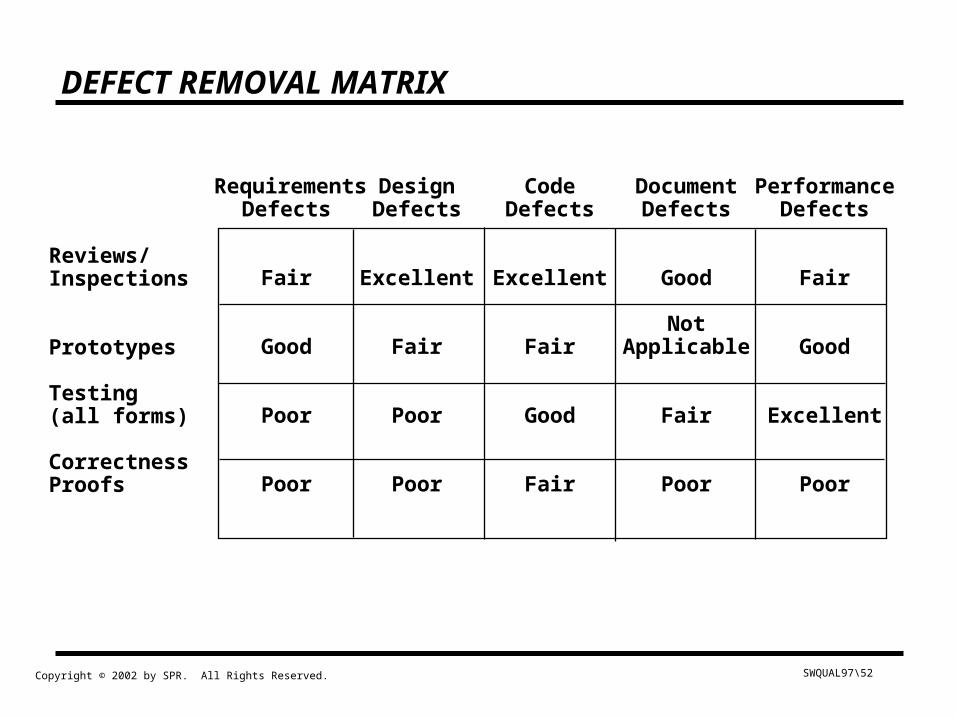
DEFECT REMOVAL MATRIX
Reviews/Inspections
Prototypes
Testing(all forms)
CorrectnessProofs
Requirements Design Code Document PerformanceDefects Defects Defects Defects Defects
Fair Excellent Excellent Good Fair
NotGood Fair Fair Applicable Good
Poor Poor Good Fair Excellent
Poor Poor Fair Poor Poor
SWQUAL97\53 Copyright © 2002 by SPR. All Rights Reserved.
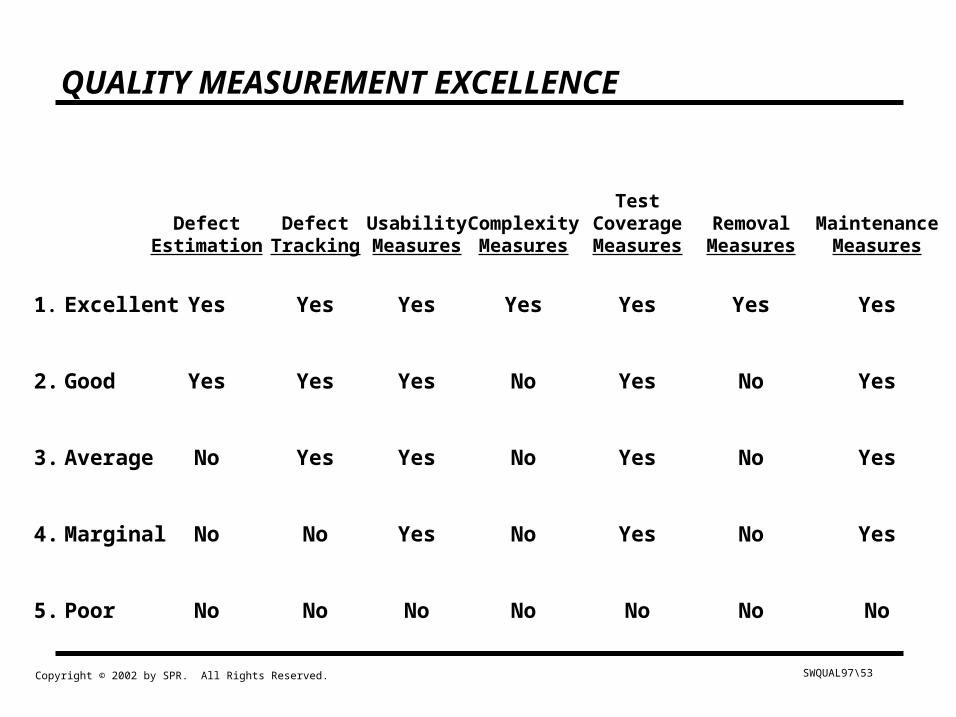
QUALITY MEASUREMENT EXCELLENCE
TestDefect Defect Usability Complexity Coverage Removal Maintenance
Estimation Tracking Measures Measures Measures Measures Measures
1. Excellent Yes Yes Yes Yes Yes Yes Yes
2. Good Yes Yes Yes No Yes No Yes
3. Average No Yes Yes No Yes No Yes
4. Marginal No No Yes No Yes No Yes
5. Poor No No No No No No No
SWQUAL97\54 Copyright © 2002 by SPR. All Rights Reserved.
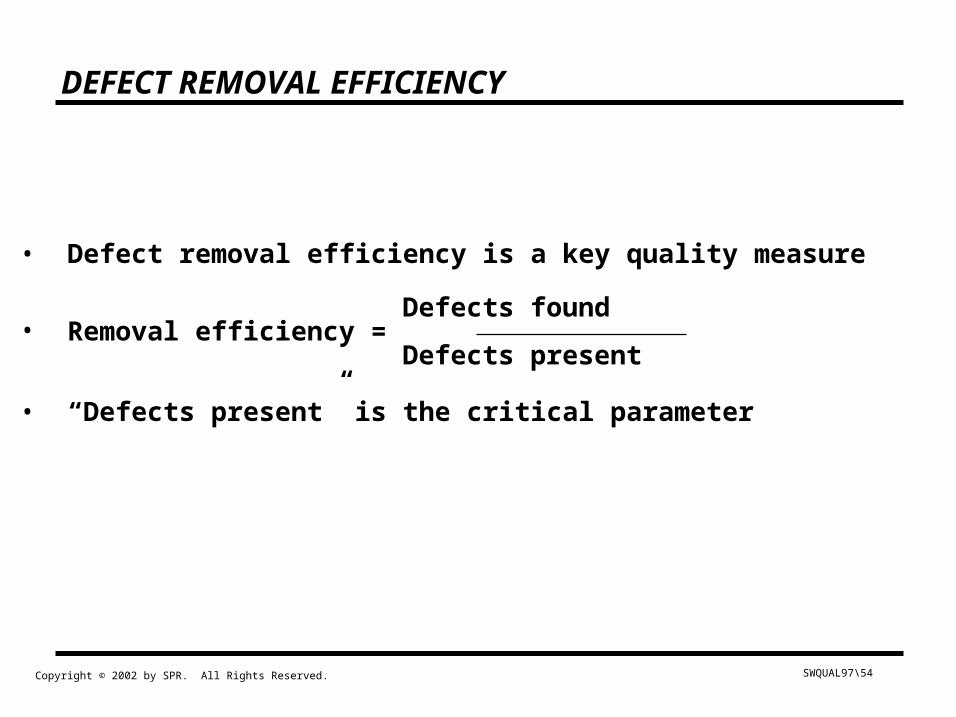
DEFECT REMOVAL EFFICIENCY
• Defect removal efficiency is a key quality measure
Defects found• Removal efficiency =
Defects present
• “Defects present” is the critical parameter
SWQUAL97\55 Copyright © 2002 by SPR. All Rights Reserved.
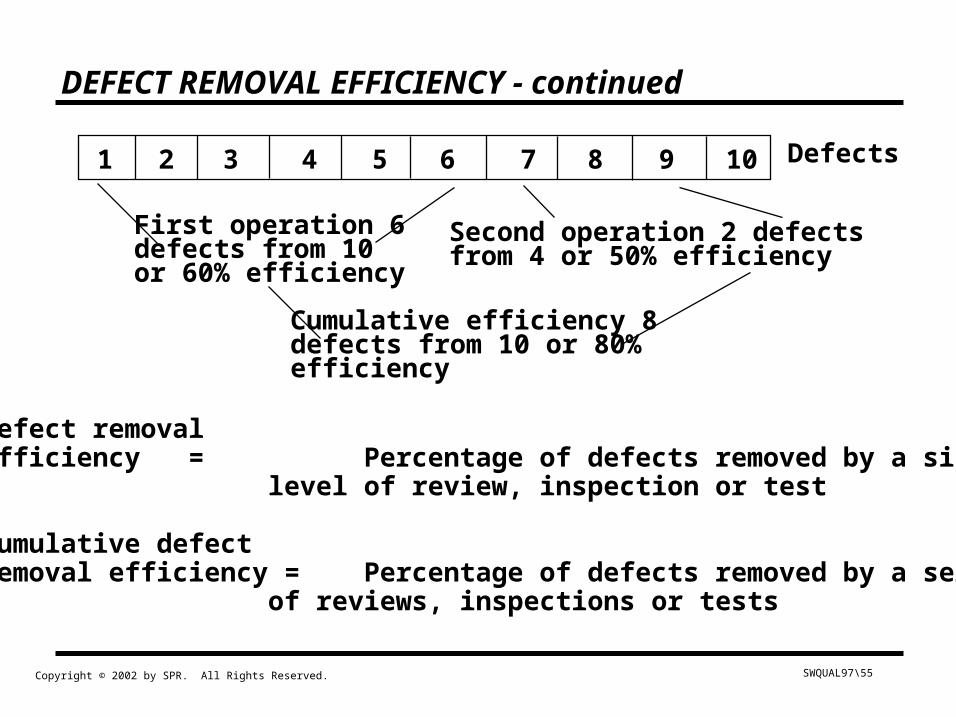
DEFECT REMOVAL EFFICIENCY - continued
1 2 3 4 5 6 7 8 9 10 Defects
First operation 6defects from 10or 60% efficiency
Second operation 2 defectsfrom 4 or 50% efficiency
Cumulative efficiency 8defects from 10 or 80%efficiency
Defect removalefficiency = Percentage of defects removed by a single
level of review, inspection or test
Cumulative defectremoval efficiency = Percentage of defects removed by a series
of reviews, inspections or tests
SWQUAL97\56 Copyright © 2002 by SPR. All Rights Reserved.
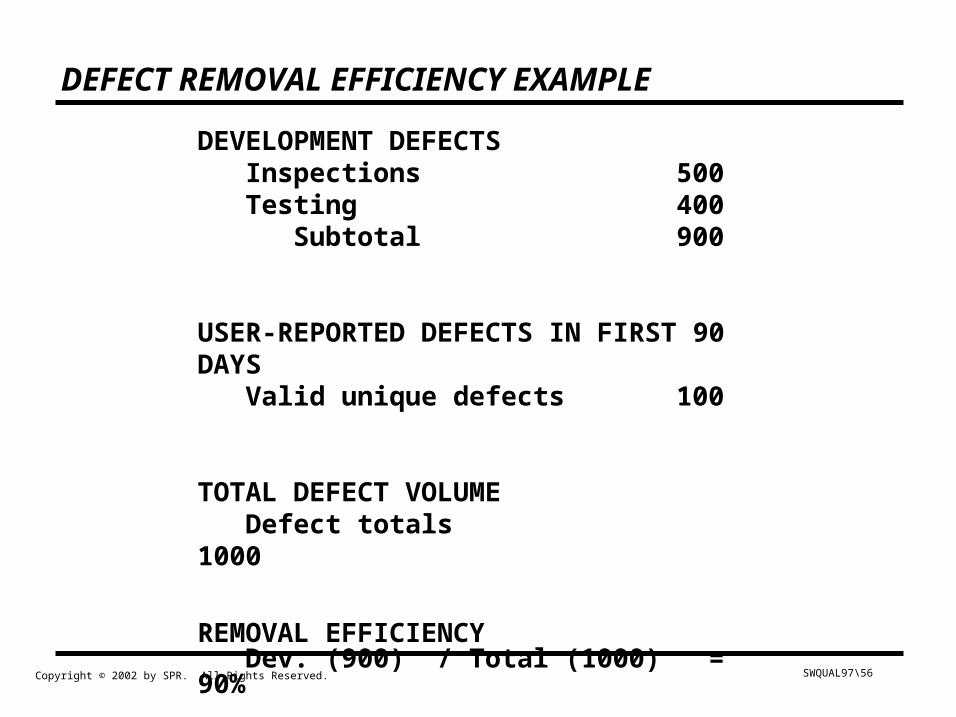
DEFECT REMOVAL EFFICIENCY EXAMPLE
DEVELOPMENT DEFECTSInspections 500Testing 400
Subtotal 900
USER-REPORTED DEFECTS IN FIRST 90 DAYSValid unique defects 100
TOTAL DEFECT VOLUMEDefect totals 1000
REMOVAL EFFICIENCYDev. (900) / Total (1000) = 90%
SWQUAL97\57 Copyright © 2002 by SPR. All Rights Reserved.
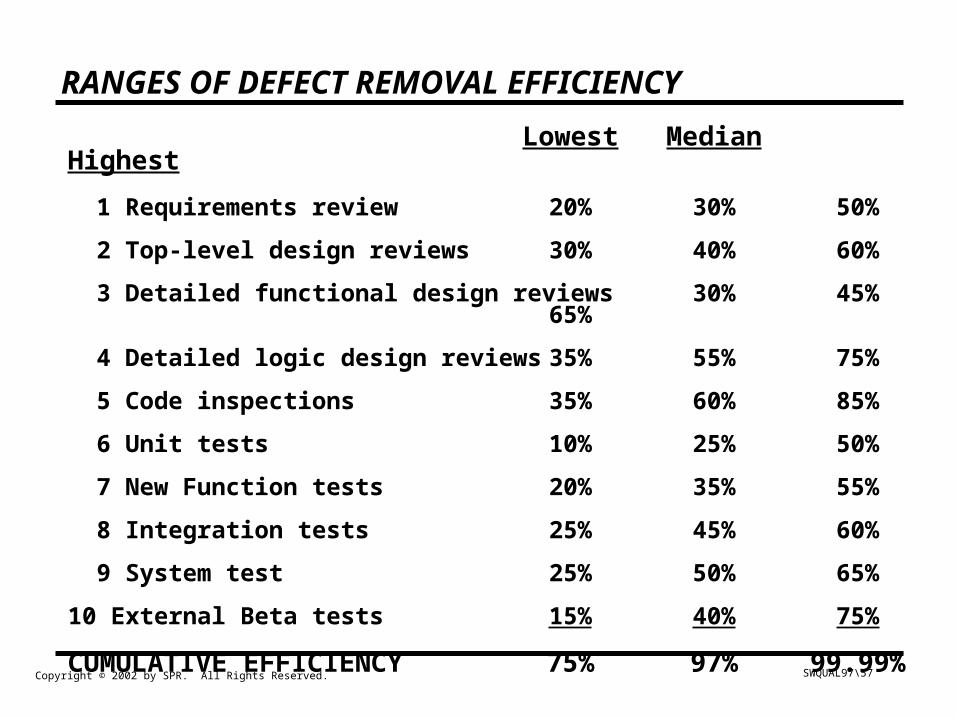
RANGES OF DEFECT REMOVAL EFFICIENCY
Lowest MedianHighest
1 Requirements review 20% 30% 50%
2 Top-level design reviews 30% 40% 60%
3 Detailed functional design reviews 30% 45% 65%
4 Detailed logic design reviews 35% 55% 75%
5 Code inspections 35% 60% 85%
6 Unit tests 10% 25% 50%
7 New Function tests 20% 35% 55%
8 Integration tests 25% 45% 60%
9 System test 25% 50% 65%
10 External Beta tests 15% 40% 75%
CUMULATIVE EFFICIENCY 75% 97% 99.99%
SWQUAL97\58 Copyright © 2002 by SPR. All Rights Reserved.
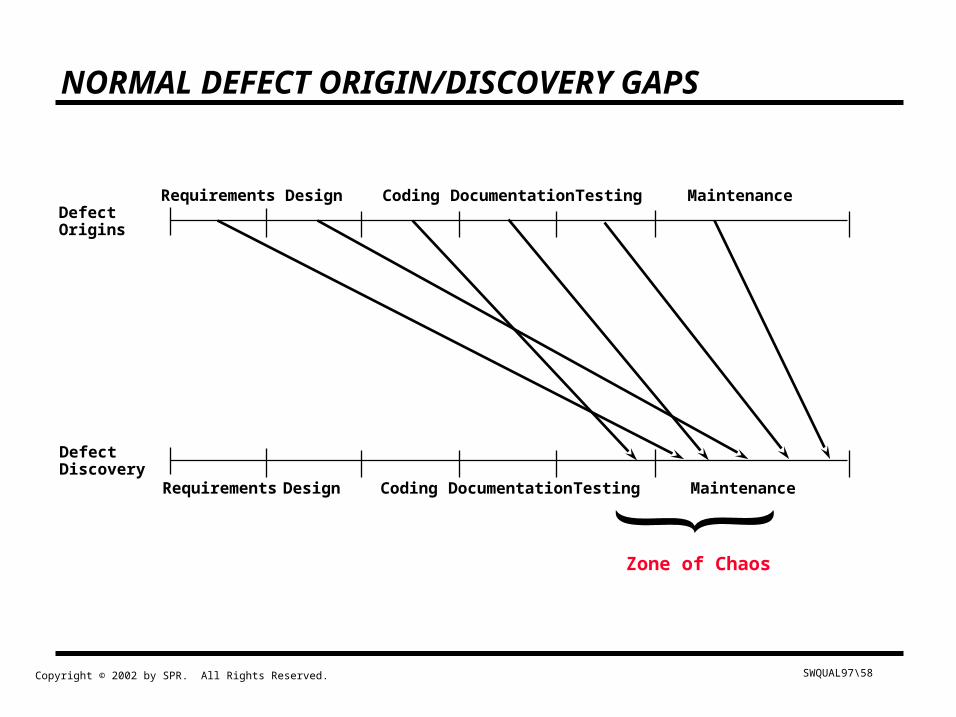
NORMAL DEFECT ORIGIN/DISCOVERY GAPS
Defect Origins
DefectDiscovery
Requirements Design Coding Documentation Testing Maintenance
Requirements Design Coding Documentation Testing Maintenance
Zone of Chaos
SWQUAL97\59 Copyright © 2002 by SPR. All Rights Reserved.
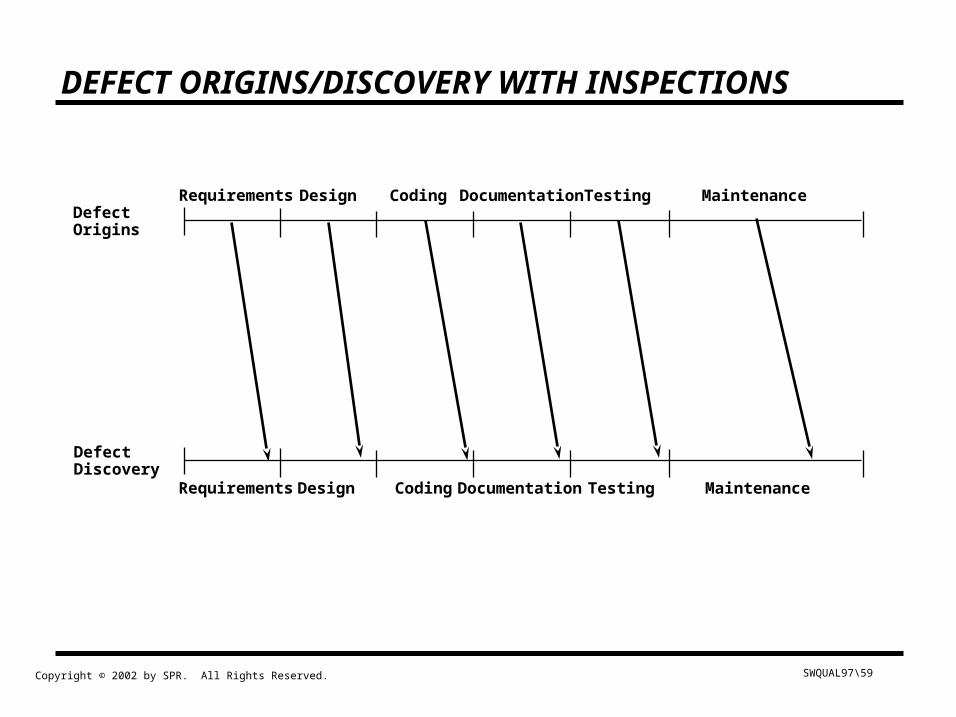
Defect Origins
DefectDiscovery
Requirements Design Coding Documentation Testing Maintenance
Requirements Design Coding Documentation Testing Maintenance
DEFECT ORIGINS/DISCOVERY WITH INSPECTIONS
SWQUAL97\60 Copyright © 2002 by SPR. All Rights Reserved.
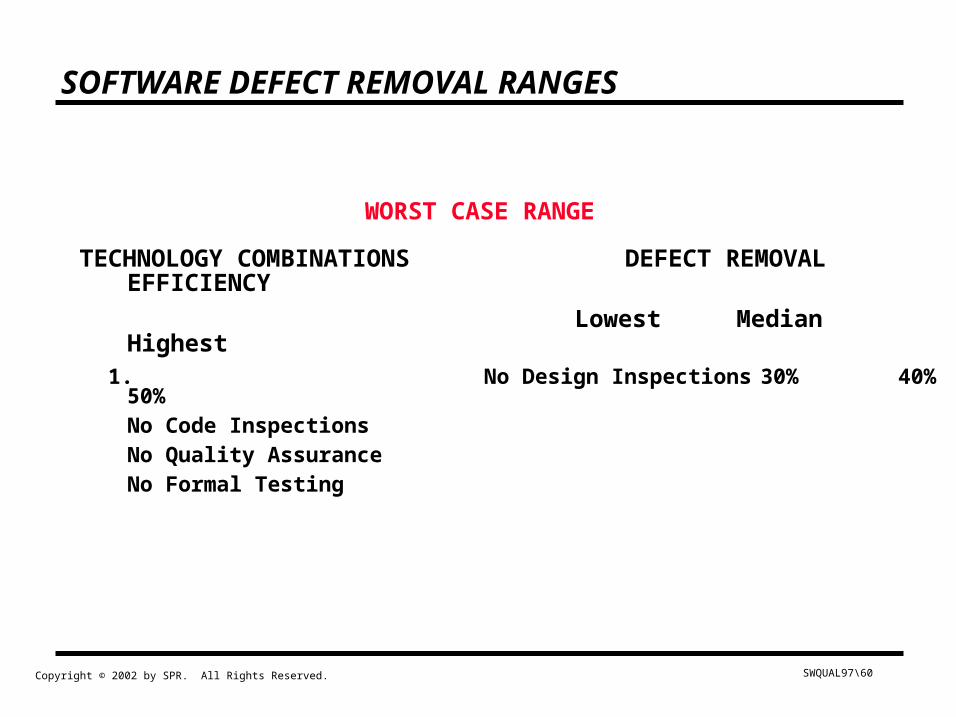
TECHNOLOGY COMBINATIONS DEFECT REMOVAL EFFICIENCY
Lowest Median Highest 1. No Design Inspections 30% 40% 50%
No Code InspectionsNo Quality AssuranceNo Formal Testing
WORST CASE RANGE
SOFTWARE DEFECT REMOVAL RANGES
SWQUAL97\61 Copyright © 2002 by SPR. All Rights Reserved.
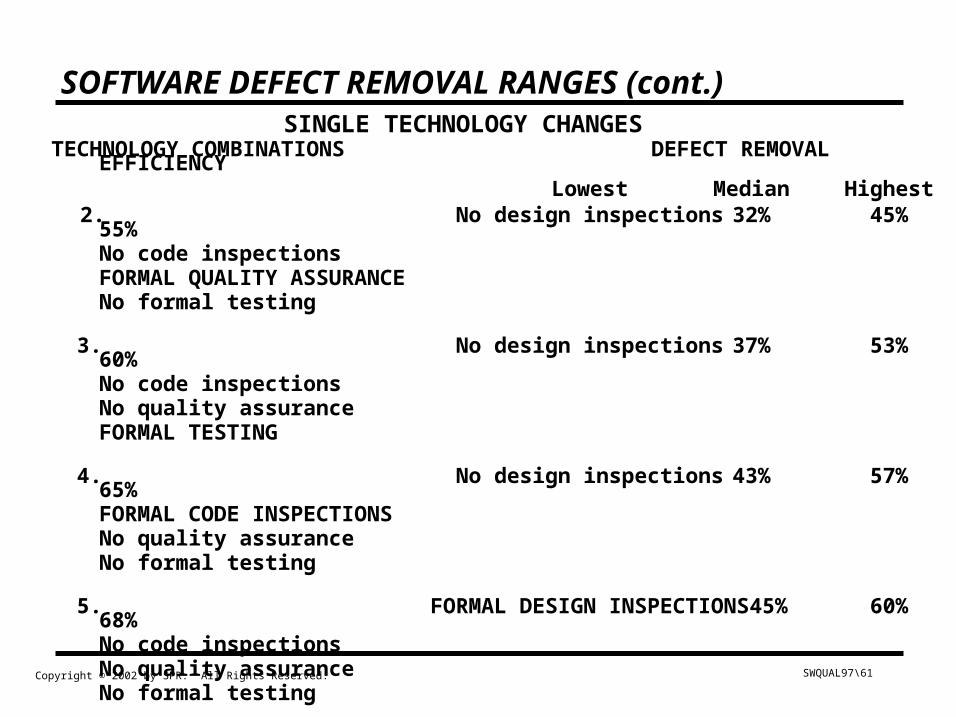
TECHNOLOGY COMBINATIONS DEFECT REMOVAL EFFICIENCYLowest Median Highest
2. No design inspections 32% 45% 55%No code inspectionsFORMAL QUALITY ASSURANCENo formal testing
3. No design inspections 37% 53% 60%No code inspectionsNo quality assuranceFORMAL TESTING
4. No design inspections 43% 57% 65%FORMAL CODE INSPECTIONSNo quality assuranceNo formal testing
5. FORMAL DESIGN INSPECTIONS 45% 60% 68%No code inspectionsNo quality assuranceNo formal testing
SOFTWARE DEFECT REMOVAL RANGES (cont.)SINGLE TECHNOLOGY CHANGES
SWQUAL97\62 Copyright © 2002 by SPR. All Rights Reserved.
SOFTWARE DEFECT REMOVAL RANGES (cont.)
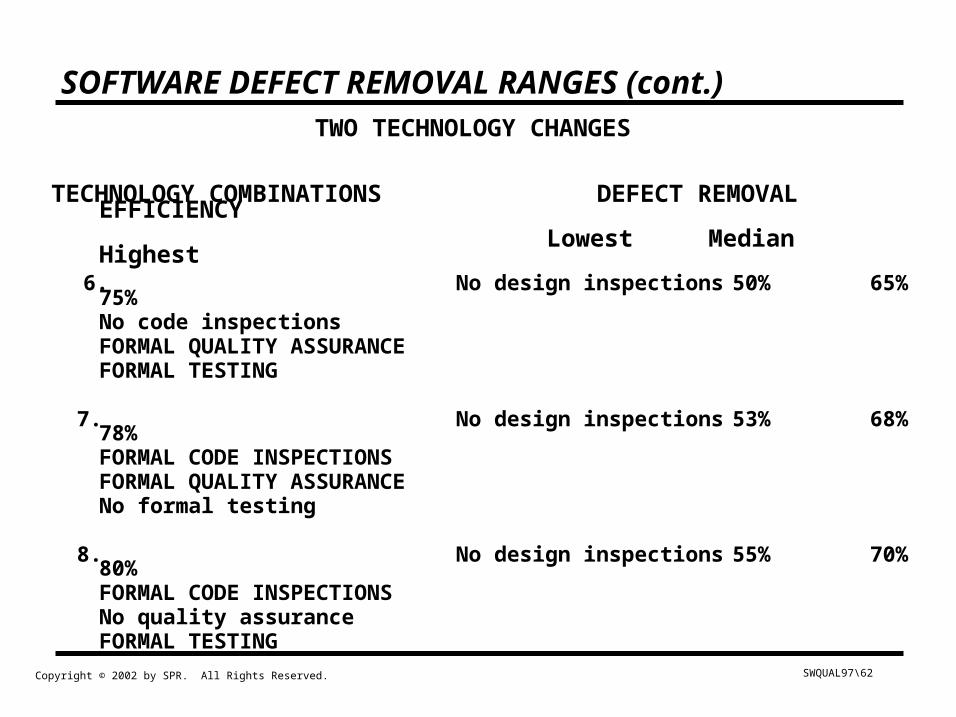
TECHNOLOGY COMBINATIONS DEFECT REMOVAL EFFICIENCYLowest Median Highest
6. No design inspections 50% 65% 75%No code inspectionsFORMAL QUALITY ASSURANCEFORMAL TESTING
7. No design inspections 53% 68% 78%FORMAL CODE INSPECTIONSFORMAL QUALITY ASSURANCENo formal testing
8. No design inspections 55% 70% 80%FORMAL CODE INSPECTIONSNo quality assuranceFORMAL TESTING
TWO TECHNOLOGY CHANGES
SWQUAL97\63 Copyright © 2002 by SPR. All Rights Reserved.
SOFTWARE DEFECT REMOVAL RANGES (cont.)
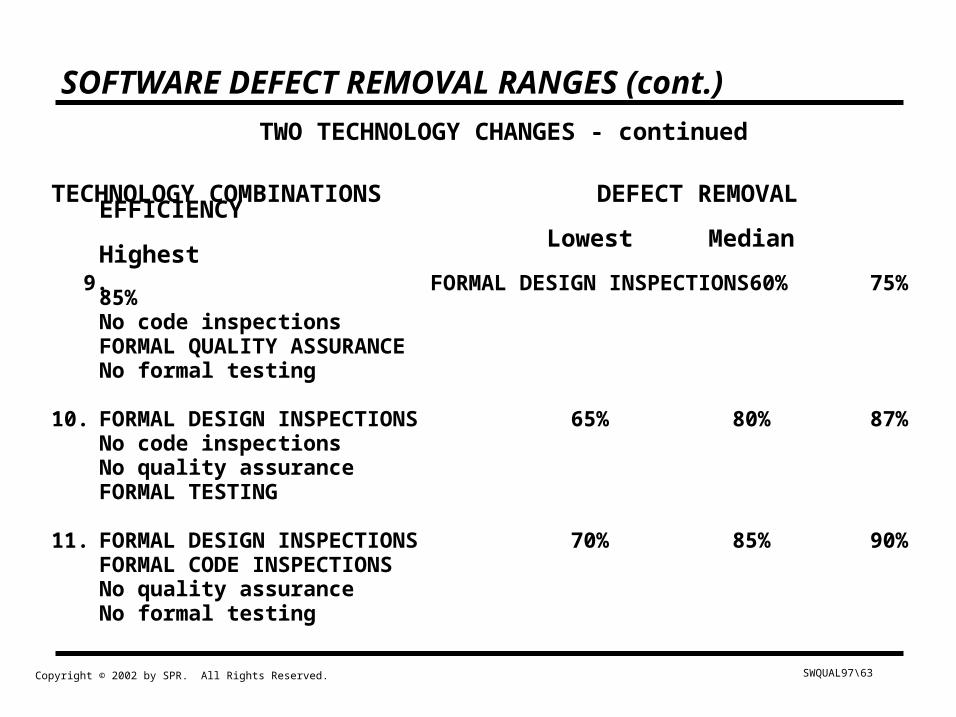
TECHNOLOGY COMBINATIONS DEFECT REMOVAL EFFICIENCYLowest Median Highest
9. FORMAL DESIGN INSPECTIONS 60% 75% 85%No code inspectionsFORMAL QUALITY ASSURANCENo formal testing
10. FORMAL DESIGN INSPECTIONS 65% 80% 87%No code inspectionsNo quality assuranceFORMAL TESTING
11. FORMAL DESIGN INSPECTIONS 70% 85% 90%FORMAL CODE INSPECTIONSNo quality assuranceNo formal testing
TWO TECHNOLOGY CHANGES - continued
SWQUAL97\64 Copyright © 2002 by SPR. All Rights Reserved.
SOFTWARE DEFECT REMOVAL RANGES (cont.)
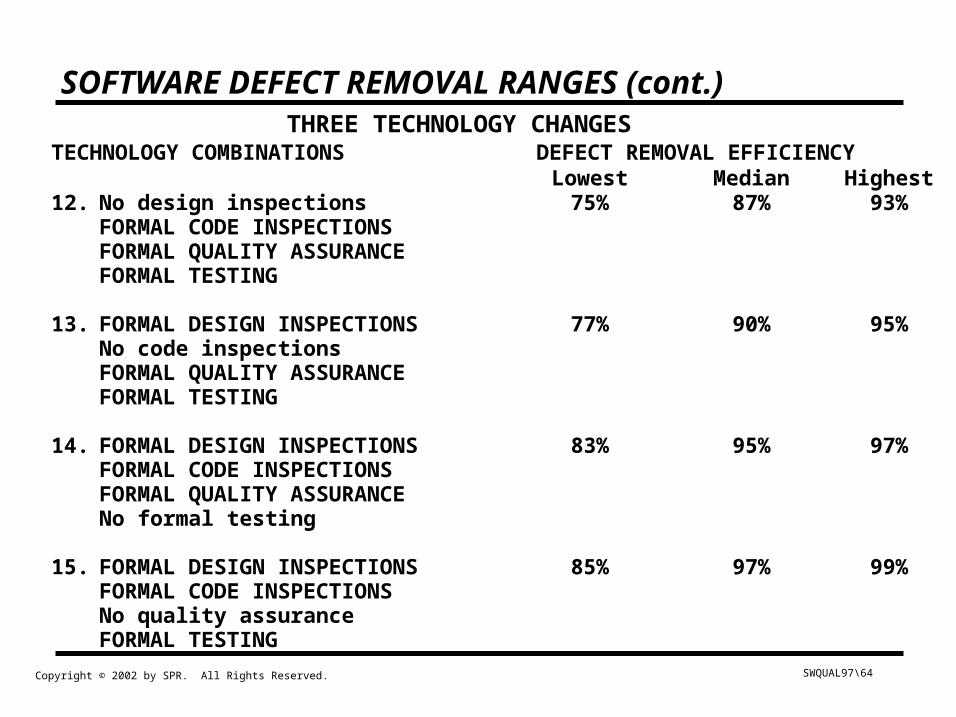
TECHNOLOGY COMBINATIONS DEFECT REMOVAL EFFICIENCYLowest Median Highest
12. No design inspections 75% 87% 93%FORMAL CODE INSPECTIONSFORMAL QUALITY ASSURANCEFORMAL TESTING
13. FORMAL DESIGN INSPECTIONS 77% 90% 95%No code inspectionsFORMAL QUALITY ASSURANCEFORMAL TESTING
14. FORMAL DESIGN INSPECTIONS 83% 95% 97%FORMAL CODE INSPECTIONSFORMAL QUALITY ASSURANCENo formal testing
15. FORMAL DESIGN INSPECTIONS 85% 97% 99%FORMAL CODE INSPECTIONSNo quality assuranceFORMAL TESTING
THREE TECHNOLOGY CHANGES
SWQUAL97\65 Copyright © 2002 by SPR. All Rights Reserved.
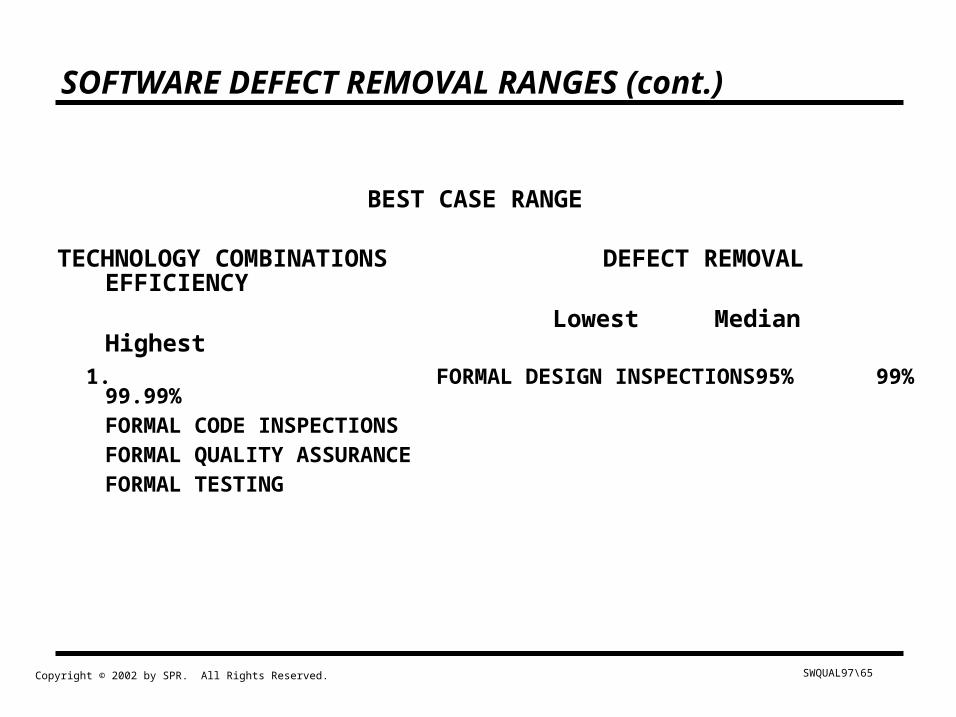
SOFTWARE DEFECT REMOVAL RANGES (cont.)
TECHNOLOGY COMBINATIONS DEFECT REMOVAL EFFICIENCY
Lowest Median Highest 1. FORMAL DESIGN INSPECTIONS 95% 99% 99.99%
FORMAL CODE INSPECTIONSFORMAL QUALITY ASSURANCEFORMAL TESTING
BEST CASE RANGE
SWQUAL97\66 Copyright © 2002 by SPR. All Rights Reserved.
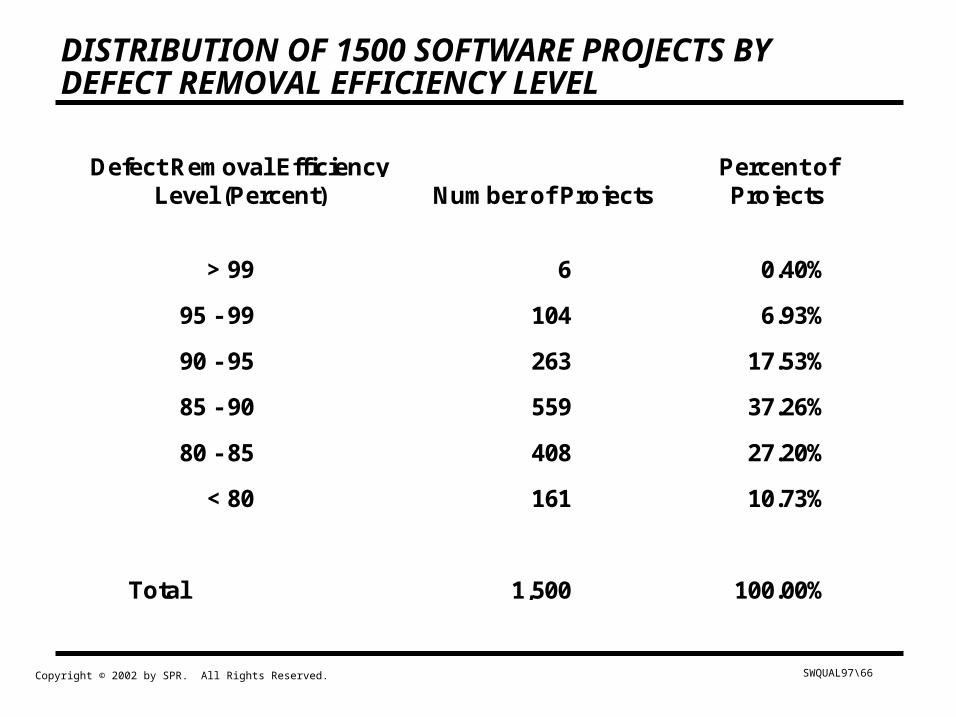
DISTRIBUTION OF 1500 SOFTWARE PROJECTS BYDEFECT REMOVAL EFFICIENCY LEVEL
Defect Removal EfficiencyLevel (Percent) Number of Projects
Percent ofProjects
> 99 6 0.40%
95 - 99 104 6.93%
90 - 95 263 17.53%
85 - 90 559 37.26%
80 - 85 408 27.20%
< 80 161 10.73%
Total 1,500 100.00%
SWQUAL97\67 Copyright © 2002 by SPR. All Rights Reserved.
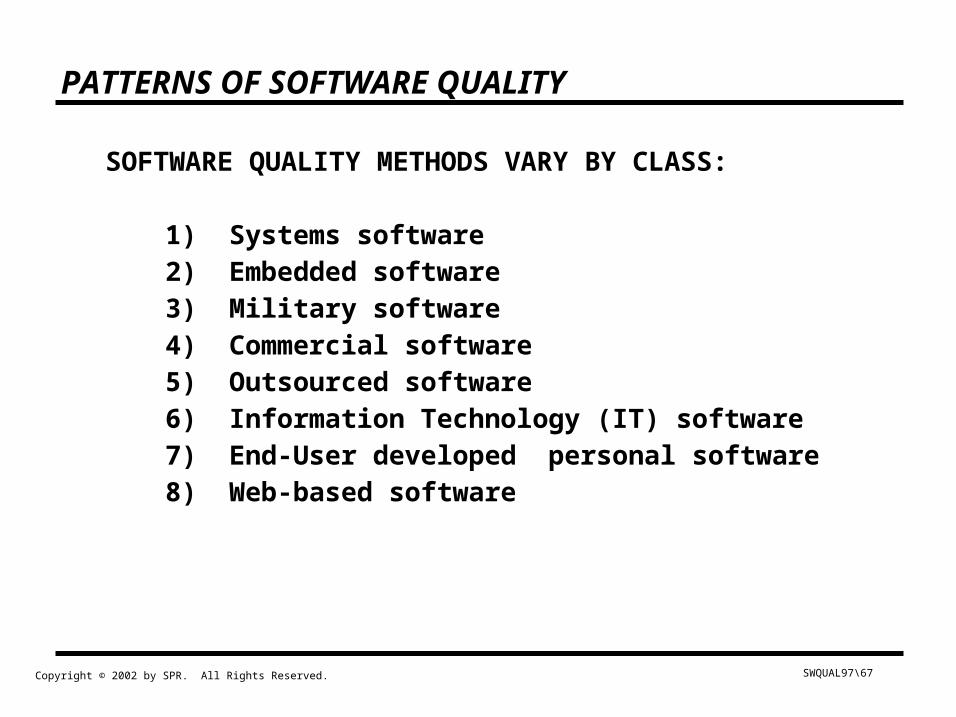
PATTERNS OF SOFTWARE QUALITY
SOFTWARE QUALITY METHODS VARY BY CLASS:
1) Systems software2) Embedded software3) Military software4) Commercial software5) Outsourced software6) Information Technology (IT) software7) End-User developed personal software8) Web-based software
SWQUAL97\68 Copyright © 2002 by SPR. All Rights Reserved.
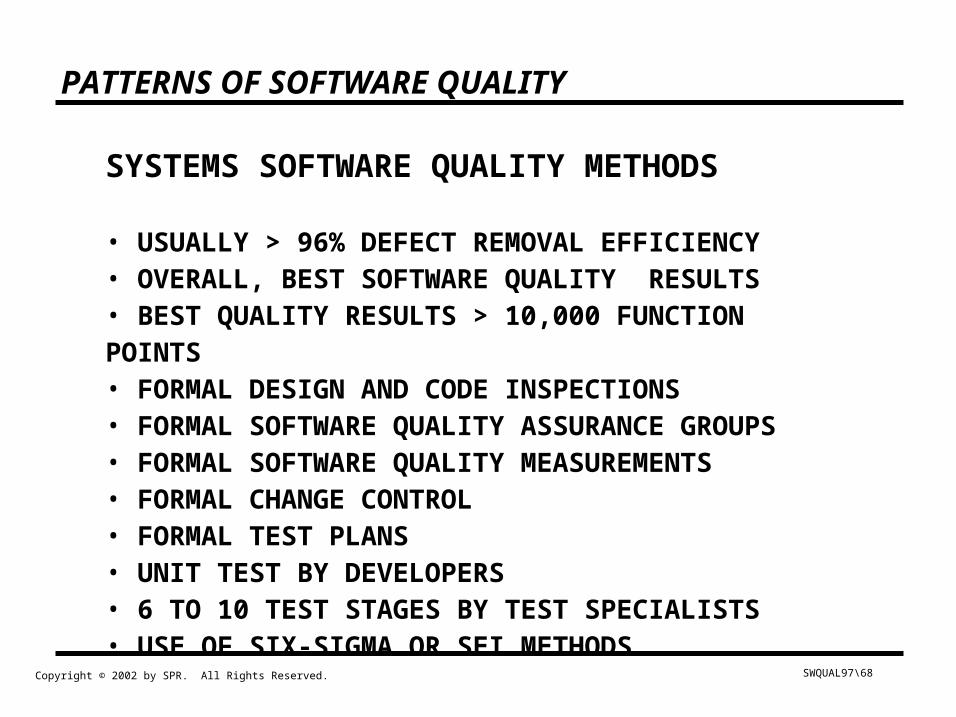
PATTERNS OF SOFTWARE QUALITY
SYSTEMS SOFTWARE QUALITY METHODS
• USUALLY > 96% DEFECT REMOVAL EFFICIENCY• OVERALL, BEST SOFTWARE QUALITY RESULTS• BEST QUALITY RESULTS > 10,000 FUNCTION POINTS• FORMAL DESIGN AND CODE INSPECTIONS• FORMAL SOFTWARE QUALITY ASSURANCE GROUPS• FORMAL SOFTWARE QUALITY MEASUREMENTS• FORMAL CHANGE CONTROL• FORMAL TEST PLANS • UNIT TEST BY DEVELOPERS• 6 TO 10 TEST STAGES BY TEST SPECIALISTS• USE OF SIX-SIGMA OR SEI METHODS
SWQUAL97\69 Copyright © 2002 by SPR. All Rights Reserved.
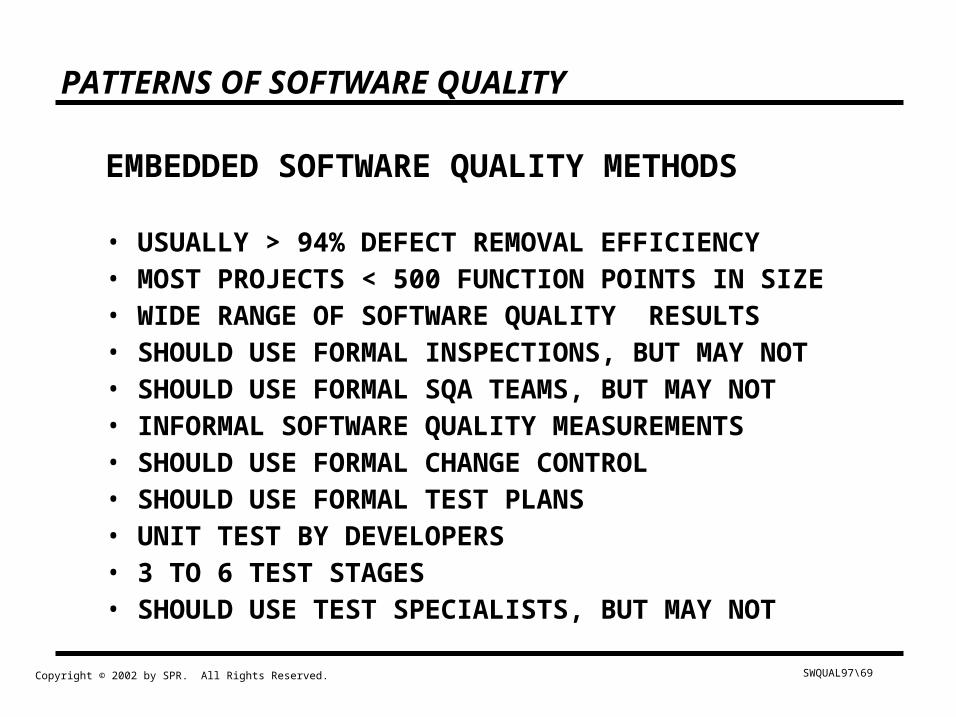
PATTERNS OF SOFTWARE QUALITY
EMBEDDED SOFTWARE QUALITY METHODS
• USUALLY > 94% DEFECT REMOVAL EFFICIENCY• MOST PROJECTS < 500 FUNCTION POINTS IN SIZE • WIDE RANGE OF SOFTWARE QUALITY RESULTS• SHOULD USE FORMAL INSPECTIONS, BUT MAY NOT• SHOULD USE FORMAL SQA TEAMS, BUT MAY NOT• INFORMAL SOFTWARE QUALITY MEASUREMENTS• SHOULD USE FORMAL CHANGE CONTROL• SHOULD USE FORMAL TEST PLANS • UNIT TEST BY DEVELOPERS• 3 TO 6 TEST STAGES• SHOULD USE TEST SPECIALISTS, BUT MAY NOT
SWQUAL97\70 Copyright © 2002 by SPR. All Rights Reserved.
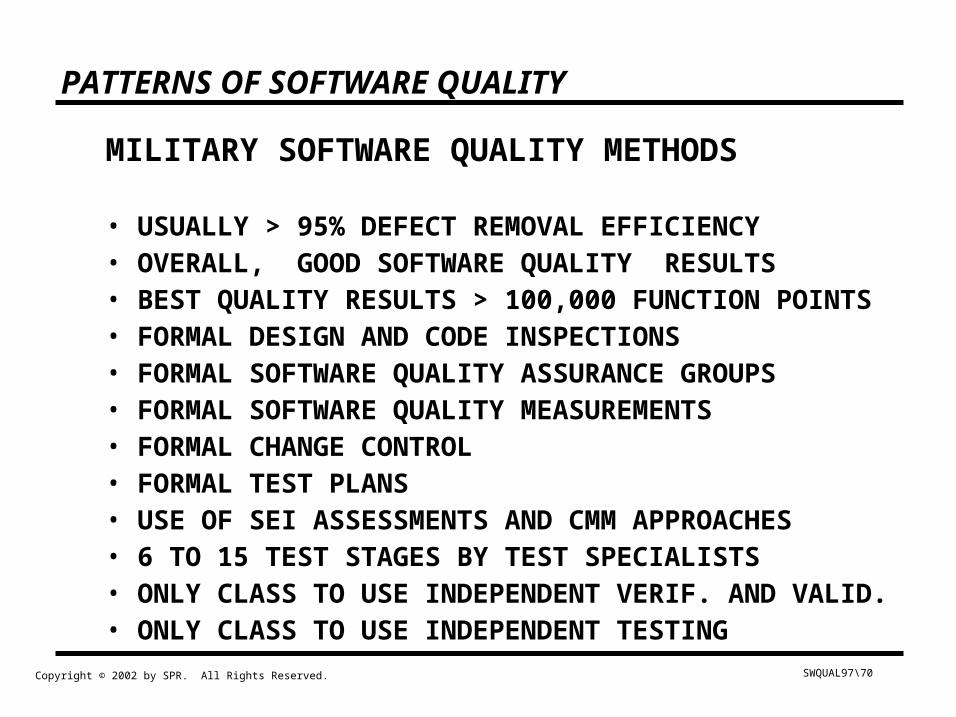
PATTERNS OF SOFTWARE QUALITY
MILITARY SOFTWARE QUALITY METHODS
• USUALLY > 95% DEFECT REMOVAL EFFICIENCY• OVERALL, GOOD SOFTWARE QUALITY RESULTS• BEST QUALITY RESULTS > 100,000 FUNCTION POINTS• FORMAL DESIGN AND CODE INSPECTIONS• FORMAL SOFTWARE QUALITY ASSURANCE GROUPS• FORMAL SOFTWARE QUALITY MEASUREMENTS• FORMAL CHANGE CONTROL• FORMAL TEST PLANS • USE OF SEI ASSESSMENTS AND CMM APPROACHES• 6 TO 15 TEST STAGES BY TEST SPECIALISTS• ONLY CLASS TO USE INDEPENDENT VERIF. AND VALID.• ONLY CLASS TO USE INDEPENDENT TESTING
SWQUAL97\71 Copyright © 2002 by SPR. All Rights Reserved.
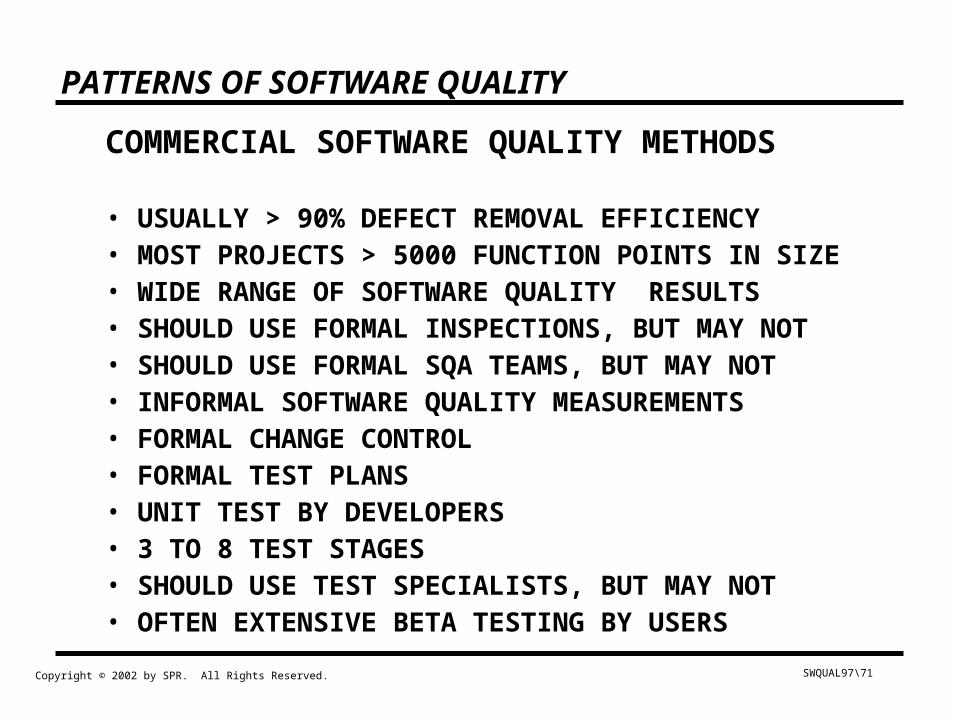
PATTERNS OF SOFTWARE QUALITY
COMMERCIAL SOFTWARE QUALITY METHODS
• USUALLY > 90% DEFECT REMOVAL EFFICIENCY• MOST PROJECTS > 5000 FUNCTION POINTS IN SIZE • WIDE RANGE OF SOFTWARE QUALITY RESULTS• SHOULD USE FORMAL INSPECTIONS, BUT MAY NOT• SHOULD USE FORMAL SQA TEAMS, BUT MAY NOT• INFORMAL SOFTWARE QUALITY MEASUREMENTS• FORMAL CHANGE CONTROL• FORMAL TEST PLANS • UNIT TEST BY DEVELOPERS• 3 TO 8 TEST STAGES• SHOULD USE TEST SPECIALISTS, BUT MAY NOT• OFTEN EXTENSIVE BETA TESTING BY USERS
SWQUAL97\72 Copyright © 2002 by SPR. All Rights Reserved.
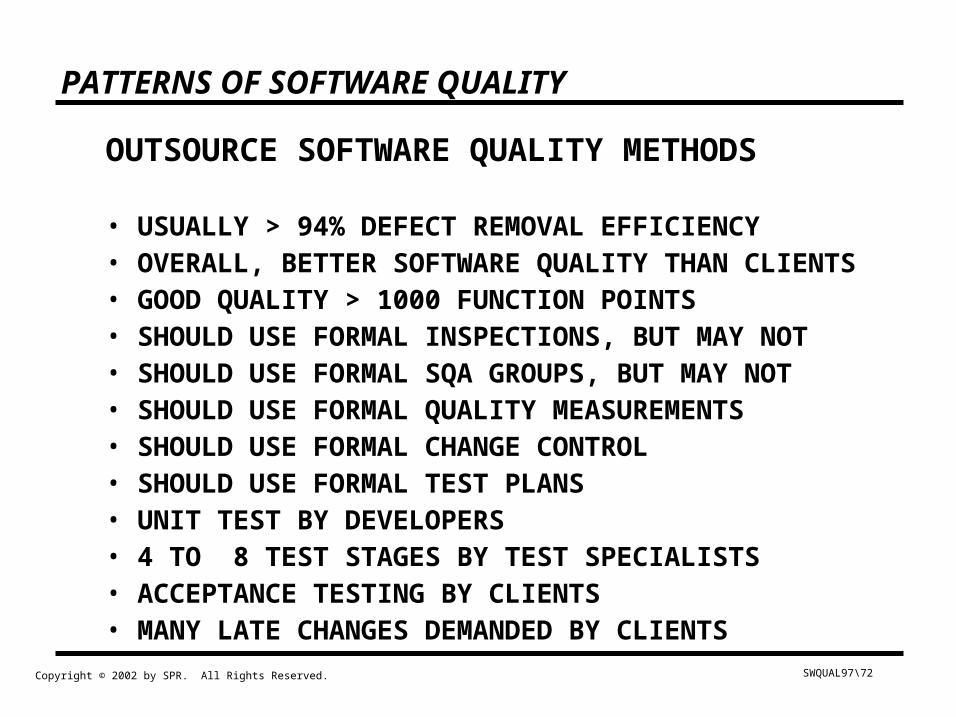
PATTERNS OF SOFTWARE QUALITY
OUTSOURCE SOFTWARE QUALITY METHODS
• USUALLY > 94% DEFECT REMOVAL EFFICIENCY• OVERALL, BETTER SOFTWARE QUALITY THAN CLIENTS• GOOD QUALITY > 1000 FUNCTION POINTS• SHOULD USE FORMAL INSPECTIONS, BUT MAY NOT• SHOULD USE FORMAL SQA GROUPS, BUT MAY NOT• SHOULD USE FORMAL QUALITY MEASUREMENTS• SHOULD USE FORMAL CHANGE CONTROL• SHOULD USE FORMAL TEST PLANS • UNIT TEST BY DEVELOPERS• 4 TO 8 TEST STAGES BY TEST SPECIALISTS• ACCEPTANCE TESTING BY CLIENTS• MANY LATE CHANGES DEMANDED BY CLIENTS
SWQUAL97\73 Copyright © 2002 by SPR. All Rights Reserved.
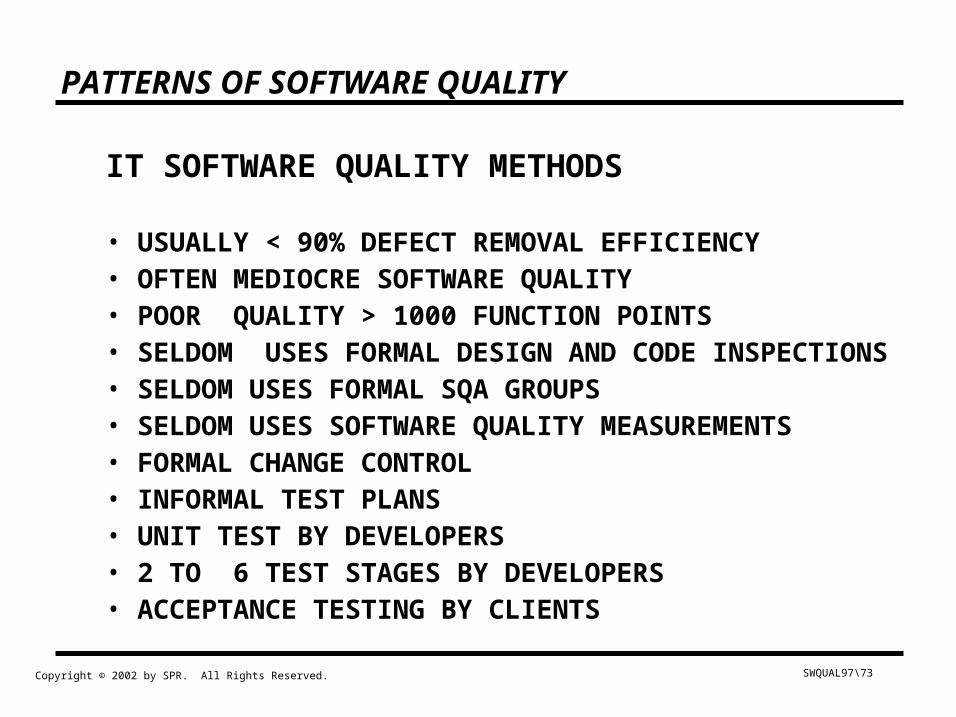
PATTERNS OF SOFTWARE QUALITY
IT SOFTWARE QUALITY METHODS
• USUALLY < 90% DEFECT REMOVAL EFFICIENCY• OFTEN MEDIOCRE SOFTWARE QUALITY • POOR QUALITY > 1000 FUNCTION POINTS• SELDOM USES FORMAL DESIGN AND CODE INSPECTIONS• SELDOM USES FORMAL SQA GROUPS• SELDOM USES SOFTWARE QUALITY MEASUREMENTS• FORMAL CHANGE CONTROL• INFORMAL TEST PLANS • UNIT TEST BY DEVELOPERS• 2 TO 6 TEST STAGES BY DEVELOPERS• ACCEPTANCE TESTING BY CLIENTS
SWQUAL97\74 Copyright © 2002 by SPR. All Rights Reserved.
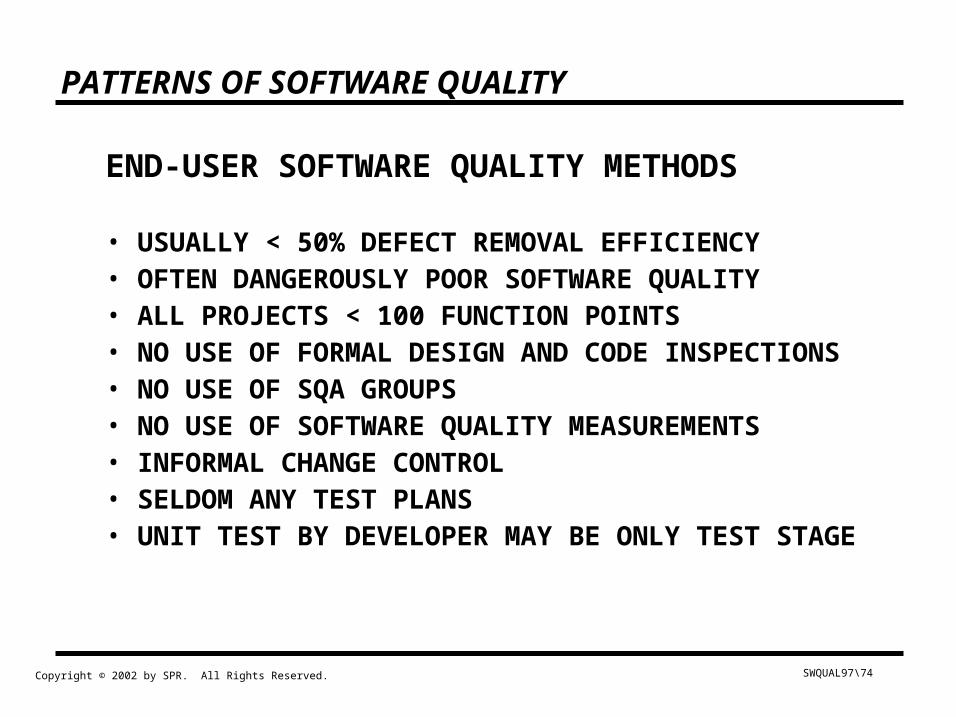
PATTERNS OF SOFTWARE QUALITY
END-USER SOFTWARE QUALITY METHODS
• USUALLY < 50% DEFECT REMOVAL EFFICIENCY• OFTEN DANGEROUSLY POOR SOFTWARE QUALITY • ALL PROJECTS < 100 FUNCTION POINTS• NO USE OF FORMAL DESIGN AND CODE INSPECTIONS• NO USE OF SQA GROUPS• NO USE OF SOFTWARE QUALITY MEASUREMENTS• INFORMAL CHANGE CONTROL• SELDOM ANY TEST PLANS • UNIT TEST BY DEVELOPER MAY BE ONLY TEST STAGE
SWQUAL97\75 Copyright © 2002 by SPR. All Rights Reserved.
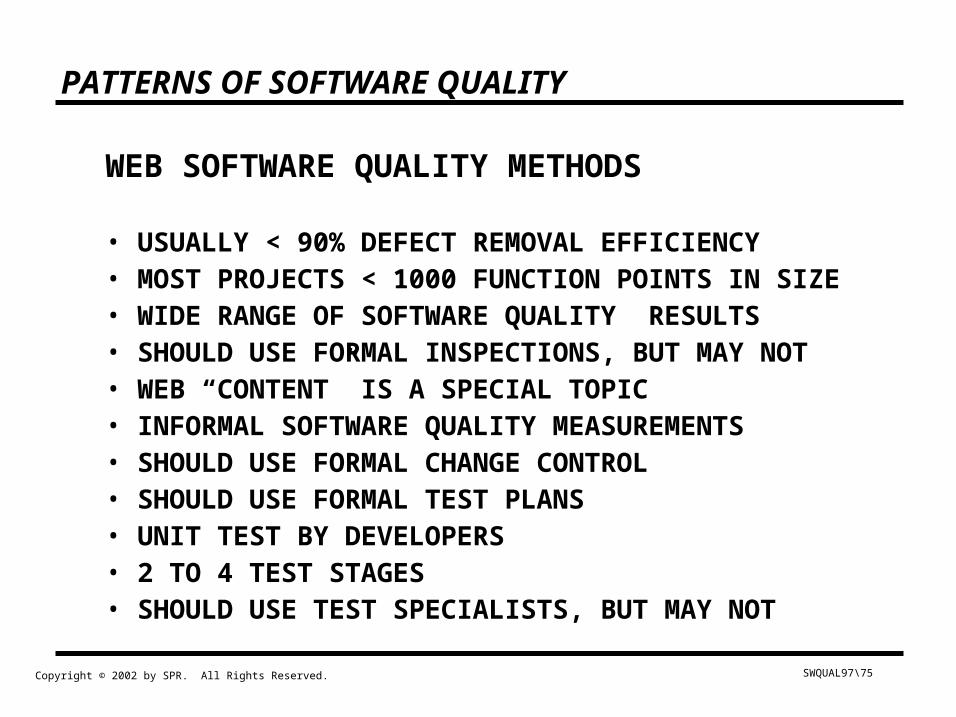
PATTERNS OF SOFTWARE QUALITY
WEB SOFTWARE QUALITY METHODS
• USUALLY < 90% DEFECT REMOVAL EFFICIENCY• MOST PROJECTS < 1000 FUNCTION POINTS IN SIZE • WIDE RANGE OF SOFTWARE QUALITY RESULTS• SHOULD USE FORMAL INSPECTIONS, BUT MAY NOT• WEB “CONTENT” IS A SPECIAL TOPIC• INFORMAL SOFTWARE QUALITY MEASUREMENTS• SHOULD USE FORMAL CHANGE CONTROL• SHOULD USE FORMAL TEST PLANS • UNIT TEST BY DEVELOPERS• 2 TO 4 TEST STAGES• SHOULD USE TEST SPECIALISTS, BUT MAY NOT
SWQUAL97\76 Copyright © 2002 by SPR. All Rights Reserved.
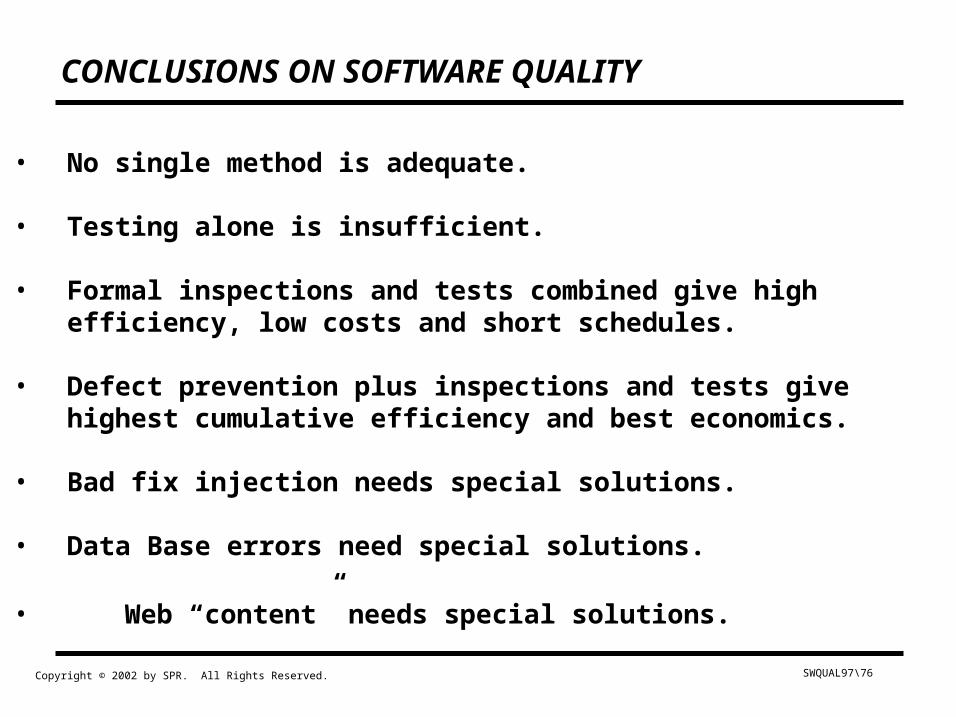
CONCLUSIONS ON SOFTWARE QUALITY
• No single method is adequate.
• Testing alone is insufficient.
• Formal inspections and tests combined give highefficiency, low costs and short schedules.
• Defect prevention plus inspections and tests givehighest cumulative efficiency and best economics.
• Bad fix injection needs special solutions.
• Data Base errors need special solutions.
• Web “content” needs special solutions.