Software Metrics 1
22
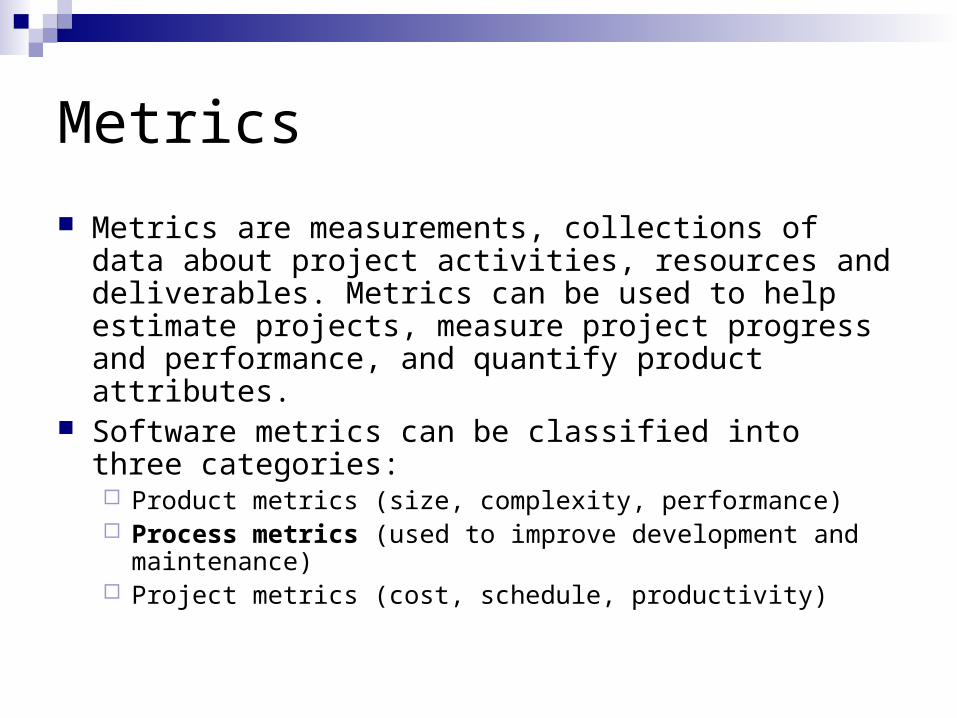
Metrics Metrics are measurements, collections of data about project activities, resources and deliverables. Metrics can be used to help estimate projects, measure project progress and performance, and quantify product attributes. Software metrics can be classified into three categories: Product metrics (size, complexity, performance) Process metrics (used to improve development and maintenance) Project metrics (cost, schedule, productivity)
-
Upload
yogesh-bansal -
Category
Documents
-
view
241 -
download
0
Transcript of Software Metrics 1
Metrics
Metrics are measurements, collections of data about project activities, resources and deliverables. Metrics can be used to help estimate projects, measure project progress and performance, and quantify product attributes.
Software metrics can be classified into three categories: Product metrics (size, complexity, performance) Process metrics (used to improve development and
maintenance) Project metrics (cost, schedule, productivity)
Metrics for software process
Some of the software metrics Productivity & efficiency metrics Management support metrics Size metrics (also used to create other
metrics):Lines of code (LOC)Function points (FP)
Lines of code
Not as simple metric as it may sound Is used in many metrics, for example in defect rate:
defects per KLOC (=thousand lines of code) or LOC inspected
Many problems The ambiguity of the counting – meaning is not the same with
Assembler or high-level languages What to count? Blank lines, comments, data definitions, only
executable lines..? Problematic for productivity studies: the amount of LOC is
negatively correlated with design efficiency
Function points
Function Points measure software size by quantifying the functionality provided to the user based solely on logical design and functional specifications
Has gained acceptance in terms of productivity (for example FP/year) and quality (defects/FP)
The IFPUG counting practices committee ( http://www.ifpug.org ) is the de facto standard for counting methods
Function points
A weighted total of five major components that form an application: Number of external inputs (e.g. transaction types)x4 Number of external outputs (e.g. report types)x5 Number of logical internal files (from the users’ point
of view as the may be conceived, not physical files)x10
Number of external interface files (files accessed by the application but not maintained by it)x7
Number of external inquiries (types of online inquiries supported)x4
Function points
Can be calculated with low or high weighting factors depending the complexity assesment of the application
Many metrics can be based on function point calculations
Although FP is usually more realistic metric than LOC... Calculating FP’s needs training Sometimes LOC is a metric fair enough
Software metrics for process purposes
The effectiveness of defect removal in-process
The pattern of testing defect arrival The response time of fix process Also in-process quality metrics improve both
the product and the process: Defect density during machine testing Phase-based defect removal pattern
Defect density during machine testing A simple metric: defects/KLOC or defects/FP Defect rate during formal machine testing is usually
connected with the defect rate in the field Higher defect rates found during testing indicate that the
software has experienced high error injection – unless some new testing approach is used or some extra testing is used for some reason
Indicates the quality of the product when the software is still tested – many defects in testing mean that there’s too much error input in process
Can be used in other metrics
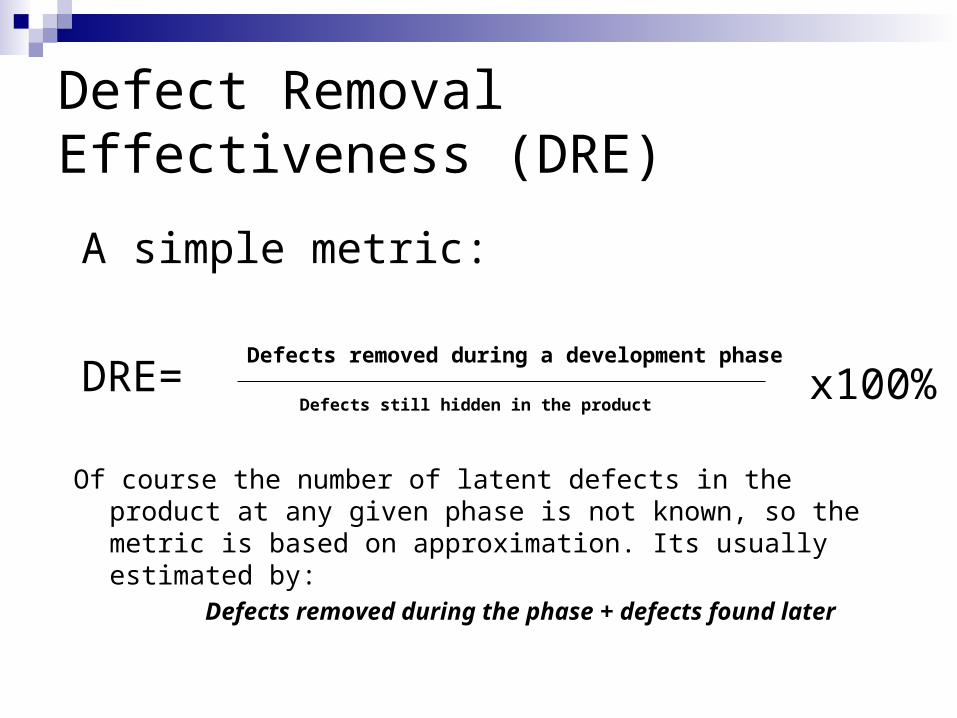
Defect Removal Effectiveness (DRE)
DRE=
A simple metric:
Defects removed during a development phase
Defects still hidden in the productx100%
Of course the number of latent defects in the product at any given phase is not known, so the metric is based on approximation. Its usually estimated by:
Defects removed during the phase + defects found later
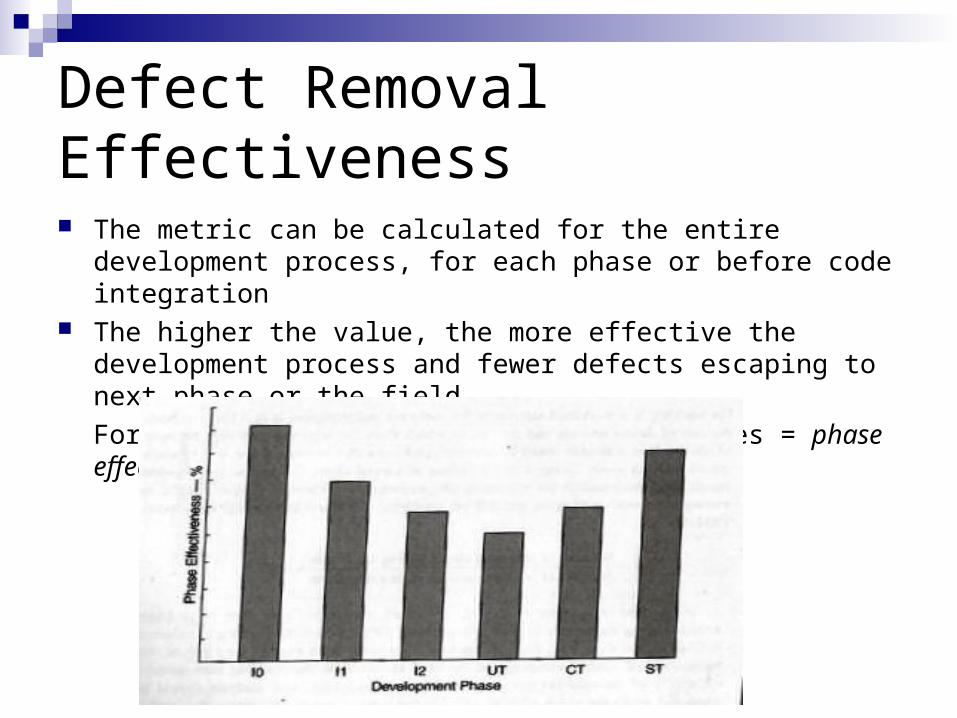
Defect Removal Effectiveness
The metric can be calculated for the entire development process, for each phase or before code integration
The higher the value, the more effective the development process and fewer defects escaping to next phase or the field
For example, calculated for spesfic phases = phase effectiveness:
About productivity metrics..
Software productivity is a complex subject concerning lots of factors (resources, quality, time..)
Metrics like LOC/hour, FP/person-month, hours / class and average person-days/class (in object metrics) etc.
Usually number of units of output per unit of effort Can be used to increase development by focusing on
certain not-efficient phases – usually problematic in other sense, too
Tools for analyzing metrics
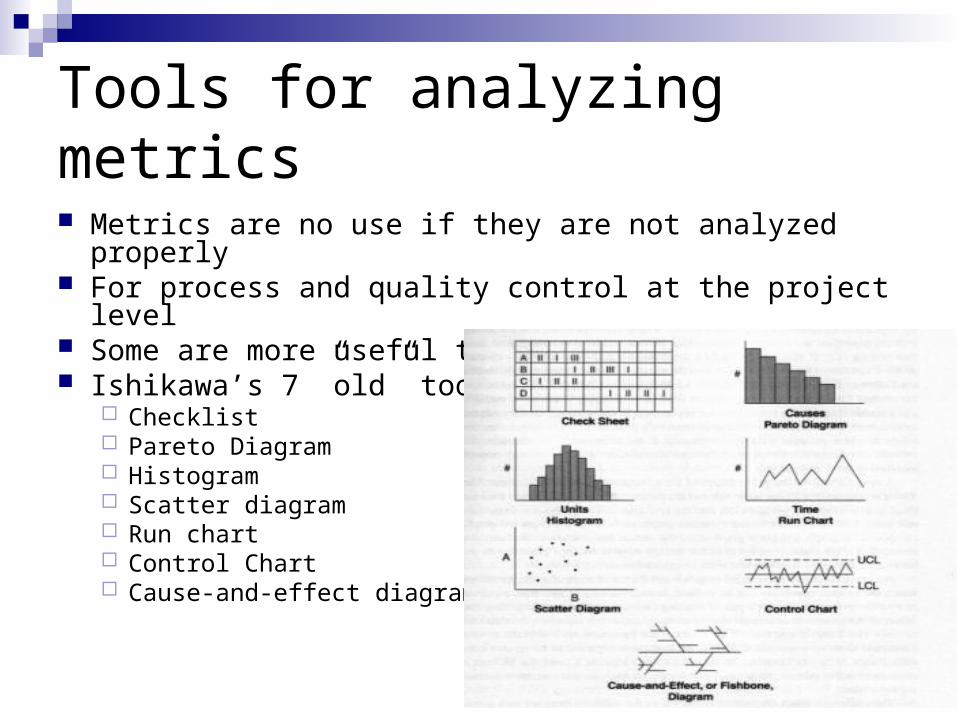
Metrics are no use if they are not analyzed properly For process and quality control at the project level Some are more useful than others Ishikawa’s 7 ”old” tools:
Checklist Pareto Diagram Histogram Scatter diagram Run chart Control Chart Cause-and-effect diagram
Tools for analyzing metrics
Also ”new” tools: the affinity diagram, the relations diagram, the tree diagram, the matrix chart, the matrix data analysis chart, the process decision program chart and the arrow diagram
Plenty of tools, but just using them doesn’t improve anything – careful and selective usage might do so
Software process improvement in general Usage of model based approach, like Capability
Maturity Model for Software (CMM) or Capability Maturity Model Integration (CMMI) for guiding and measuring process improvement effort
Goal should be improving process maturity instead of attaining CMMI level
Measures and analyzes are used when determining process’ qualities
Example: Using function point metrics to measure software process improvements What kind of value results process
improvements bring? Fewer failures? Higher productivity and quality? Shorter schedules? Higher user satisfaction?
Measurement with function points First a formal process assessment and a
baseline, followed by a six-stage improvement program
Using function point metrics to measure software process improvements
Software process assessment, baseline Assesment: finding all the strengths and weaknesses
associated with software Baseline: providing a quantitative basis for quality,
productivity, costs etc. -> collected with function point metrics
Stage 1: Focus on management technologies Stage 2: Focus on Software Processes and
methodologies
Using function point metrics to measure software process improvements
Stage 3: Focus on new tools and approaches
Stage 4: Focus on Infrastructure and Specialization
Stage 5: Focus on Reusability Stage 6: Focus on Industry Leadership
Using function point metrics to measure software process improvements
As the focus has been in all the 6 stages in improvement, data is collected and metrics are used estimating the results
Function points can measure noncoding activities such as design, documentation and management, too
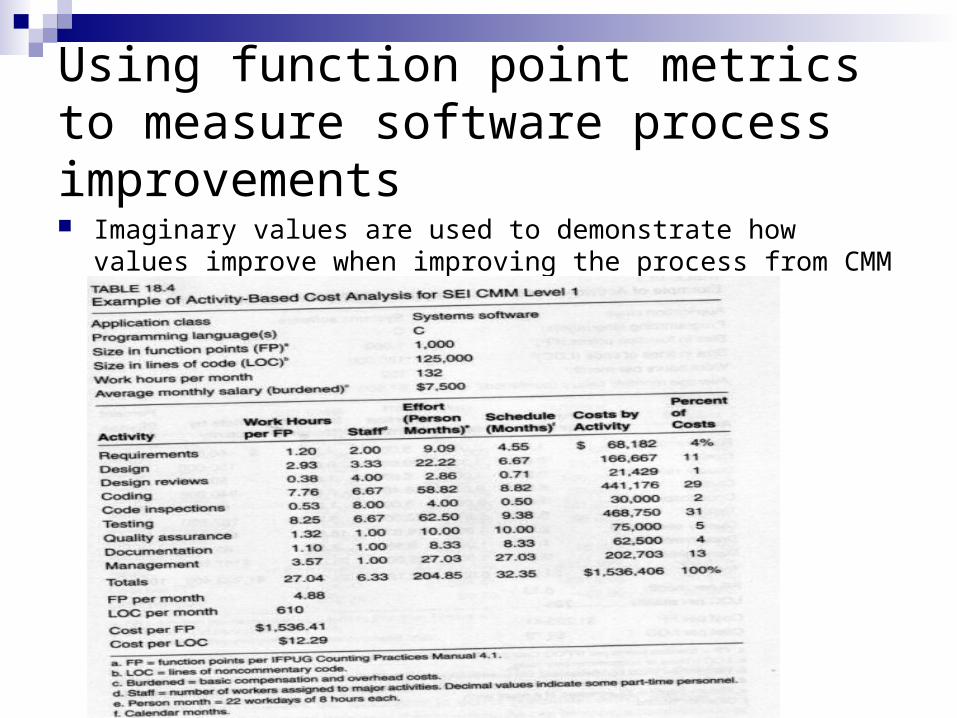
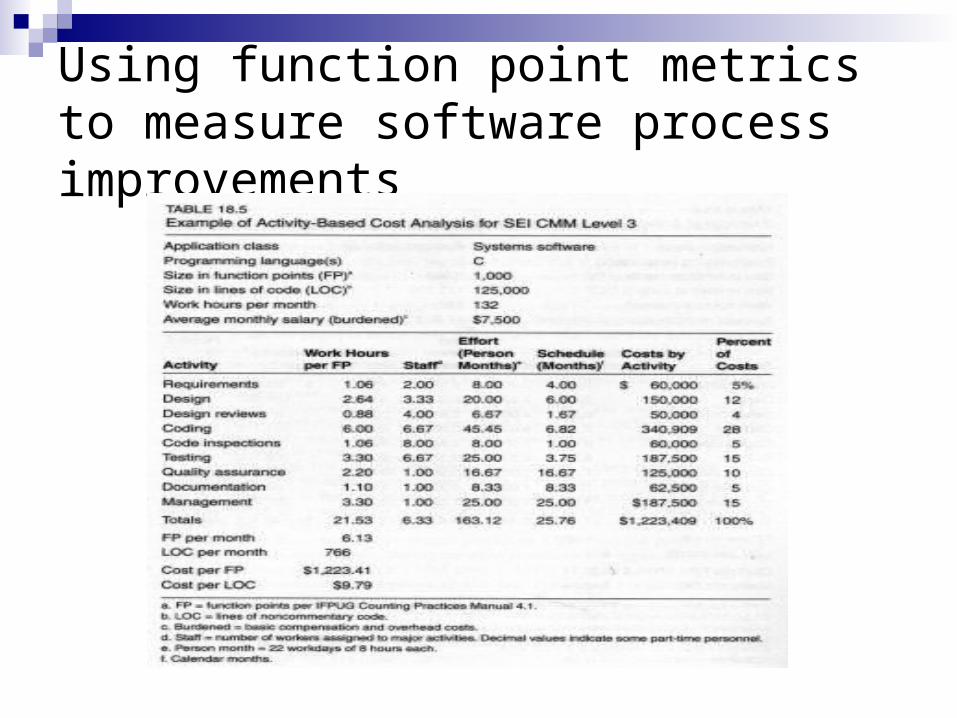
Using function point metrics to measure software process improvements Imaginary values are used to demonstrate how values improve
when improving the process from CMM 1 to CMM 3
Using function point metrics to measure software process improvements
For noticing..
Almost everything can be measured, but for what purpose?
Planned metrics vs. actual metrics (for example error estimation)
Evaluation – designed and careful, objectivity needed
Software process is a complicated matter with lots of elements like creativity and mental activity. Using statistic metrics and tools doesn’t absolutely make it better, but the right usage (Goal/Question/Metric) can help to improve the process.
Improving software process is a long way depending on various factors and should be done with a model
References
Stephen H. Kan, “Metrics and Models in Software Quality Engineering”, Pearson Education Limited 2003, Boston, United States
International Function Point Users Group, http://www.ifpug.org
SPC metrics resources, http://www.spc.ca/resources/metrics/index.htm
R.S. Pressman & Associates, Inc., Software Engineering Resources, http://www.rspa.com/spi/