Software Manual - EOS Weather Manual V2.0.pdf · Software Manual..... 1 Weather Station ... Webmin...
61
1 | Page 1 Software Manual Prepared by 9 th Mile Software Version: 2.0 01-Apr-2017
Transcript of Software Manual - EOS Weather Manual V2.0.pdf · Software Manual..... 1 Weather Station ... Webmin...
1 | P a g e
1
Software Manual Prepared by 9th Mile Software
Version: 2.0 01-Apr-2017

2 | P a g e
2
Table of Contents
............................................................... 1
Software Manual ........................................................................................................................................... 1
Weather Station ............................................................................................................................................ 5
Connection Methods ................................................................................................................................ 6
Direct ..................................................................................................................................................... 6
Remote Desktop ................................................................................................................................... 6
Browser ................................................................................................................................................. 6
First Time Setup ............................................................................................................................................ 7
Webmin Set Up ......................................................................................................................................... 7
Station ................................................................................................................................................... 9
Settings ................................................................................................................................................ 10
Modules .............................................................................................................................................. 11
NMEA .................................................................................................................................................. 13
Pushes ................................................................................................................................................. 15
Data ..................................................................................................................................................... 23
Reports ................................................................................................................................................ 24
Activation ................................................................................................................................................ 25
eor.py .................................................................................................................................................. 26
eos.py .................................................................................................................................................. 26
eosalmanac.py .................................................................................................................................... 26
nmea.py .............................................................................................................................................. 27
noaa.py ................................................................................................................................................ 27
noaayr.py ............................................................................................................................................ 27
eostide.py ............................................................................................................................................ 27
eosinfo.py ............................................................................................................................................ 27
eosplots.py .......................................................................................................................................... 27
Upgrading .................................................................................................................................................... 28
3 | P a g e
3
Internal Web Site Display ............................................................................................................................ 29
Station Logs ................................................................................................................................................. 33
EOS, EOR, PLOT Logs ............................................................................................................................... 33
Weather Station Functionality .................................................................................................................... 34
Database Access ...................................................................................................................................... 34
Back Ups .............................................................................................................................................. 35
EOS/EOR Servers ..................................................................................................................................... 38
To halt services: .................................................................................................................................. 38
To restart: ............................................................................................................................................ 39
Manual Startup: .................................................................................................................................. 39
EOS Script .................................................................................................................................................... 41
Define Station Class: ............................................................................................................................... 41
Define SQL class: ..................................................................................................................................... 42
Define EOS class: ..................................................................................................................................... 42
Define EOS READER class: ....................................................................................................................... 43
Define AOS class:..................................................................................................................................... 45
Define Send Pushover: ............................................................................................................................ 46
Define Send WUnderGround: ................................................................................................................. 46
Define NMEA Sentences: ........................................................................................................................ 46
Define Send Remote: .............................................................................................................................. 47
Define main: ............................................................................................................................................ 47
EOR Script.................................................................................................................................................... 48
Define SQL class: ..................................................................................................................................... 48
Define Station class: ................................................................................................................................ 48
Define Address class: .............................................................................................................................. 48
Define Station Poller class:...................................................................................................................... 49
Define Send Pushover: ............................................................................................................................ 49
Define Send MQTT: ................................................................................................................................. 49
Define main: ............................................................................................................................................ 49
NMEA Script ................................................................................................................................................ 50
Define Station Class: ............................................................................................................................... 50
Define ADR Class: .................................................................................................................................... 50
Define EOR Class: .................................................................................................................................... 50
Define Station Poller Class: ..................................................................................................................... 50

4 | P a g e
4
Define Main: ........................................................................................................................................... 51
Serial Output ............................................................................................................................................... 51
ADDRESS 1 (Wind) ................................................................................................................................... 52
ADDRESS 2 (Pressure) ............................................................................................................................. 54
ADDRESS 3 (Temperature) ...................................................................................................................... 55
ADDRESS 4 (Rain) .................................................................................................................................... 56
ADDRESS 5 (Solar) ................................................................................................................................... 57
ADDRESS 6 (Board) .................................................................................................................................. 58
ADDRESS 7 (Soil) ..................................................................................................................................... 59
ADDRESS 8 (Tide) .................................................................................................................................... 60

5 | P a g e
5
Weather Station This weather station works with a ‘Raspberry Pi’, a small computer running Linux. The weather station hardware is connected to the pi directly via the GPIO Header ports and sits on top of the pi. A small display is also integrated with the pi.
Typical Housing
There are several python scripts running on this operating system to manage the process of reading data and storing the weather details. One script will be used for all direct communications to the weather station hardware, using the GPIO serial port (the EOR Script). The data retrieved will be stored on a MYSQL database called ‘weather’ into a table called ‘FEED’. Another script will manage the data retrieved by the first script, processing it for archive storage into separate tables for each sensor and additional tables to interval and daily archiving. Part of this script will also pass along the sensor readings to other external systems. An optional script will manage all NMEA data communications on the USB Ports and can read specific incoming NMEA sentences and add NMEA weather sentences to an out bound USB port. General viewing of data is done using the internal web server that runs an on-board web site to retrieve the weather details from the MySQL database and generates table lists, graphs and the various graphical displays. Most of the graphical displays are done using Google API’s if a network connection is done. But other methods could be implemented. Displays can be modified to your specific

6 | P a g e
6
requirements by modifying the default web site. External instruments that can handle NMEA data can also be part of the system. However, it is the standard operating method to transfer the data out of the station to a remote site and monitor the data from there. MQTT messaging can be used or a URL transport protocol can be done to a remote service provider.
Connection Methods Once the weather station has been setup and connected to your internal network, there are three connection methods.
Direct You may have set up the pi as a normal computer with its own monitor, keyboard and mouse. This will give you access to the operating system, files and other applications. To setup the weather station see http connections below. The pi should boot up directly to the display monitor, but if you require a username-password, use root/weather.
Remote Desktop You may use any RDP client that supports the pi’s xrdp server. Most Windows/Apple RDP clients support this method. There are several apps for the iPad as well. This uses the standard 3386 port, same username-password as above. This is like a direct connect, but you share the monitor, keyboard and mouse with the local host.
Browser On any browser go to http://eos.local (or the specific IP address for the pi that has been assigned to it from your router) on your local network. If you have set up a monitor or have done a Remote Desktop, you may also open any Linux browser on the station at http://localhost/. You may also set up WAN access by opening a port on your router and pointing it to this pi’s port 80. You could also change the pi’s default website port if required.

7 | P a g e
7
First Time Setup When navigating to the default station web site the initial display may provide no specific details until the station has been initialized. Once the sensors have been initialized and the services are running you will see this type of display on http port 80 (default web server).
Webmin Set Up To configure the station, you can use a built-in browser administration application. The station configuration is done using Webmin. Webmin is a web-based interface for system administration for Unix. Using any modern web browser, you can setup user accounts, Apache, DNS, file sharing and much more. Webmin removes the need to manually edit Unix configuration files and lets you manage a system from the console or remotely
This EOS Weather Station has its own pre-installed module available for this package. You can access the Web Admin application from any computer with any browser using http://eos.local:10000 or the internal IP address of this station on your network. You can obtain the IP address on the internal display of the station using button #4: Network.
8 | P a g e
8
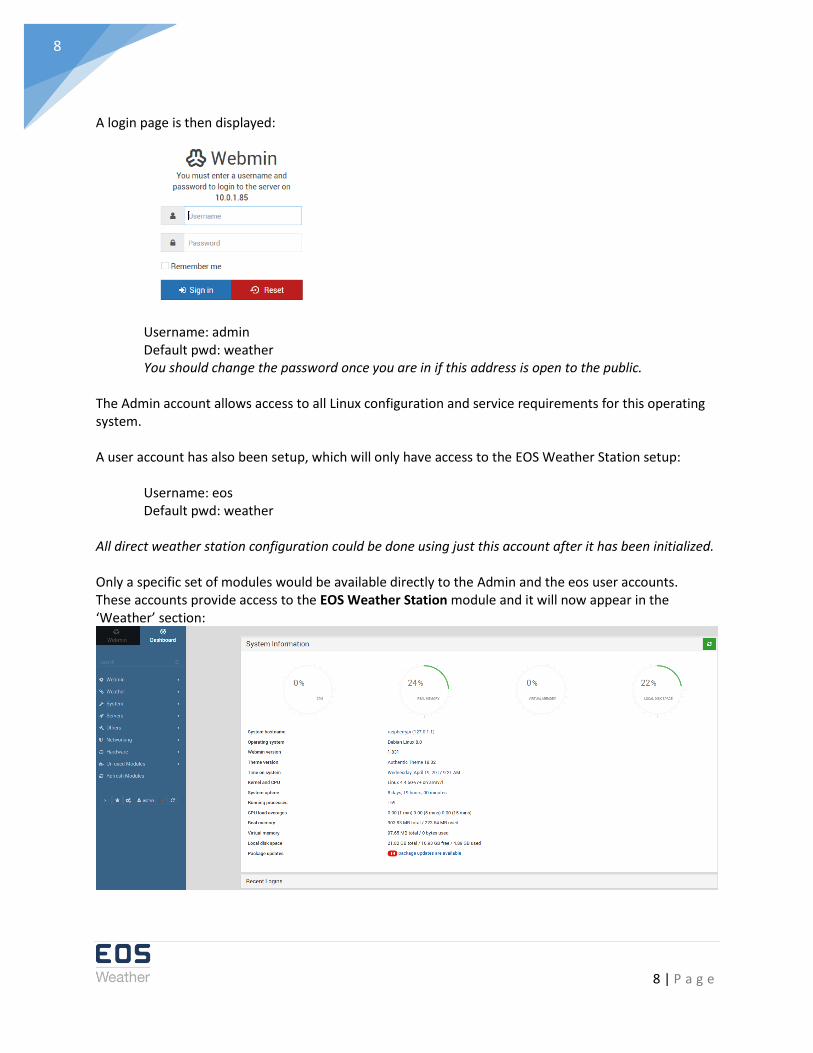
A login page is then displayed:
Username: admin Default pwd: weather
You should change the password once you are in if this address is open to the public. The Admin account allows access to all Linux configuration and service requirements for this operating system. A user account has also been setup, which will only have access to the EOS Weather Station setup:
Username: eos Default pwd: weather
All direct weather station configuration could be done using just this account after it has been initialized. Only a specific set of modules would be available directly to the Admin and the eos user accounts. These accounts provide access to the EOS Weather Station module and it will now appear in the ‘Weather’ section:

9 | P a g e
9
The weather stations setting can be done here.
Station Each configuration page is displayed by selecting a different tab, you can now setup the various station details as described below. For each section on a tab you need to choose the ‘Update to’ radio button to have that sections details written to the weather database. Example: To change the station’s name, click the radio button highlighted below (green arrow) and enter your station’s name. In this scenario, the ‘Station Location’ details will not be updated because the ‘Leave unchanged’ is checked when the ‘Make Changes’ is pressed.
When all the section changes are completed, then click the ‘Make Changes’ button to update the details. In some cases, the details will also be updated on the station’s on-board memory card. This would
only be done once the python scripts have been started.
10 | P a g e
10
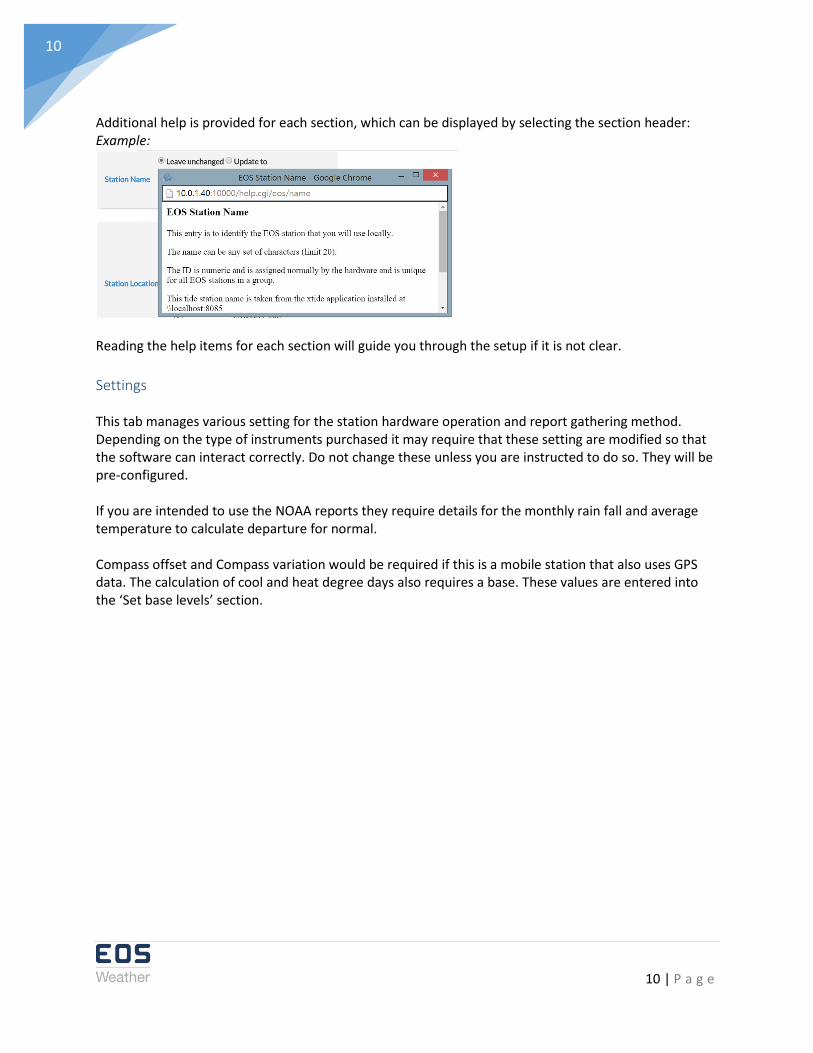
Additional help is provided for each section, which can be displayed by selecting the section header: Example:
Reading the help items for each section will guide you through the setup if it is not clear.
Settings This tab manages various setting for the station hardware operation and report gathering method. Depending on the type of instruments purchased it may require that these setting are modified so that the software can interact correctly. Do not change these unless you are instructed to do so. They will be pre-configured. If you are intended to use the NOAA reports they require details for the monthly rain fall and average temperature to calculate departure for normal. Compass offset and Compass variation would be required if this is a mobile station that also uses GPS data. The calculation of cool and heat degree days also requires a base. These values are entered into the ‘Set base levels’ section.
11 | P a g e
11
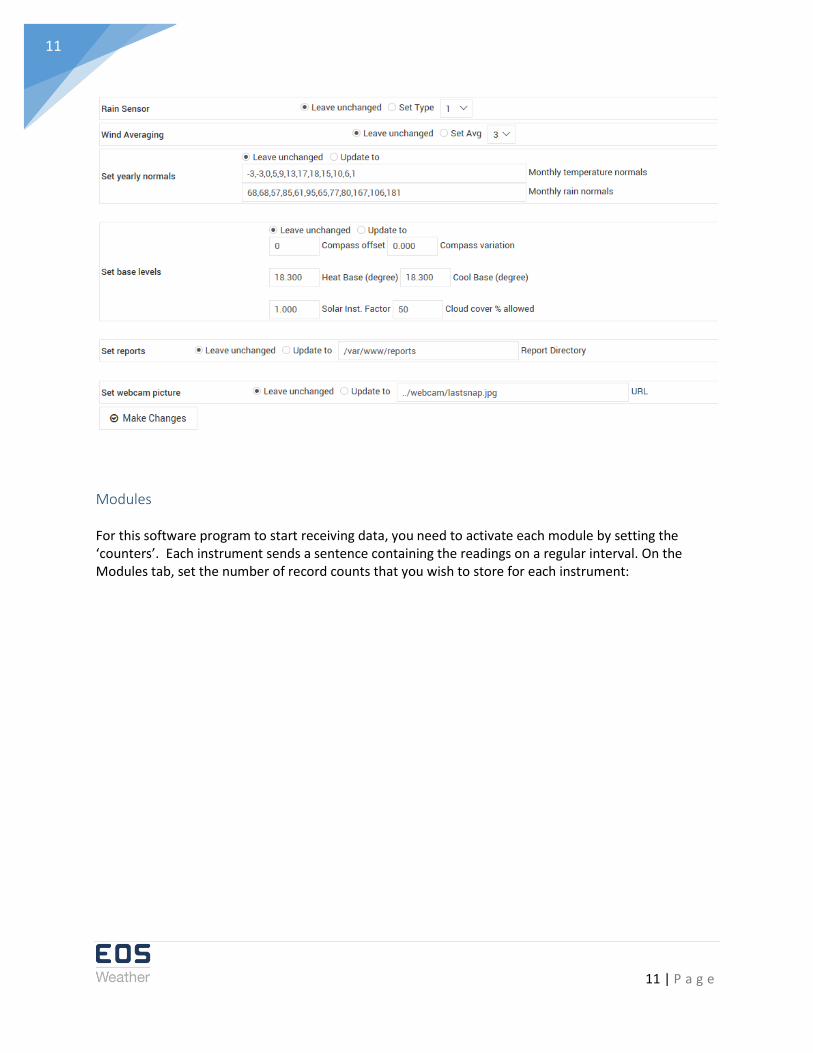
Modules For this software program to start receiving data, you need to activate each module by setting the ‘counters’. Each instrument sends a sentence containing the readings on a regular interval. On the Modules tab, set the number of record counts that you wish to store for each instrument:
12 | P a g e
12
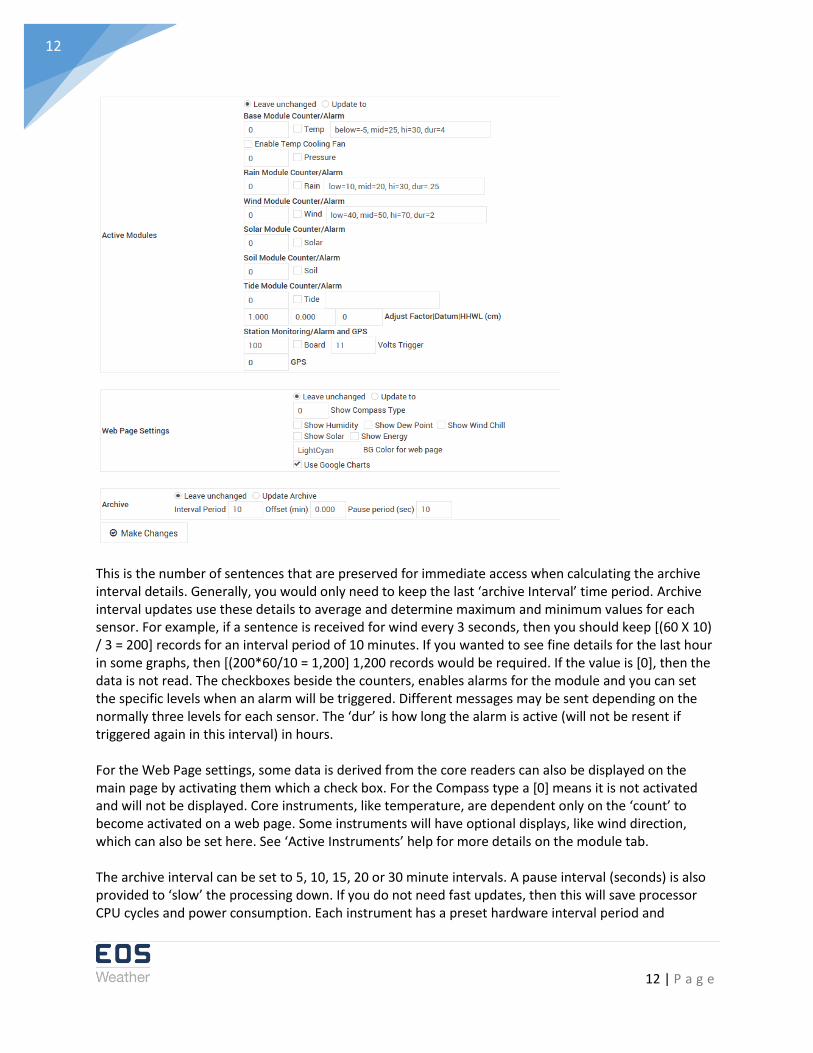
This is the number of sentences that are preserved for immediate access when calculating the archive interval details. Generally, you would only need to keep the last ‘archive Interval’ time period. Archive interval updates use these details to average and determine maximum and minimum values for each sensor. For example, if a sentence is received for wind every 3 seconds, then you should keep [(60 X 10) / 3 = 200] records for an interval period of 10 minutes. If you wanted to see fine details for the last hour in some graphs, then [(200*60/10 = 1,200] 1,200 records would be required. If the value is [0], then the data is not read. The checkboxes beside the counters, enables alarms for the module and you can set the specific levels when an alarm will be triggered. Different messages may be sent depending on the normally three levels for each sensor. The ‘dur’ is how long the alarm is active (will not be resent if triggered again in this interval) in hours. For the Web Page settings, some data is derived from the core readers can also be displayed on the main page by activating them which a check box. For the Compass type a [0] means it is not activated and will not be displayed. Core instruments, like temperature, are dependent only on the ‘count’ to become activated on a web page. Some instruments will have optional displays, like wind direction, which can also be set here. See ‘Active Instruments’ help for more details on the module tab. The archive interval can be set to 5, 10, 15, 20 or 30 minute intervals. A pause interval (seconds) is also provided to ‘slow’ the processing down. If you do not need fast updates, then this will save processor CPU cycles and power consumption. Each instrument has a preset hardware interval period and

13 | P a g e
13
sentences are not read faster than 1 each second. It normally takes 5 seconds to perform a complete cycle.
NMEA This tab is used to activate specific NMEA sentences to be received and sent back out by the system. The nmea.py python script needs to be running.
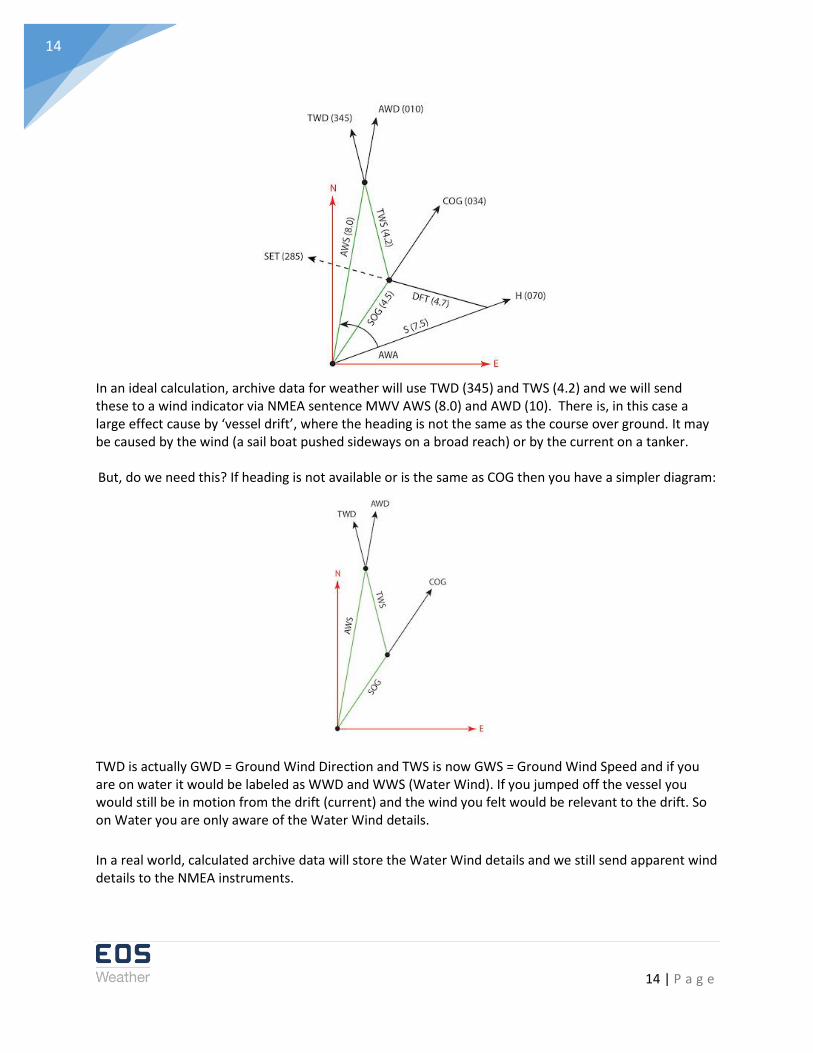
If incoming NMEA data for location, movement and heading is received the program will make adjustment to the readings based on this detail. If this station is on a moving platform the ‘North’ wind indicator should be pointing at the ‘bow’ to obtain apparent wind off the bow. If the platform is stationary then a ‘heading’ (true or magnetic) is required to calculate true wind direction. If direction is ‘fixed’ (docked) and heading details are not available then the compass/variation can be manually entered in the Setup tab. Once the platform is moving and GPS course (COG) and speed (SOG) details are available then the true wind can be calculated. NMEA wind details for direction and speed for MWV and VWR are always apparent to the platform. We expect that details in any $WI sentence is true wind speed and direction if you were not on the moving vessel. This is the complex calculation method: TWD = True Wind Direction, TWS = True Wind Speed, AWD = Apparent Wind Direction, AWS = Apparent Wind Speed, H = Heading, S = Speed of Vessel, SOG = GPS Speed COG = GPS Course, DFT = Current speed, SET = Current Direction.
14 | P a g e
14
In an ideal calculation, archive data for weather will use TWD (345) and TWS (4.2) and we will send these to a wind indicator via NMEA sentence MWV AWS (8.0) and AWD (10). There is, in this case a large effect cause by ‘vessel drift’, where the heading is not the same as the course over ground. It may be caused by the wind (a sail boat pushed sideways on a broad reach) or by the current on a tanker. But, do we need this? If heading is not available or is the same as COG then you have a simpler diagram:
TWD is actually GWD = Ground Wind Direction and TWS is now GWS = Ground Wind Speed and if you are on water it would be labeled as WWD and WWS (Water Wind). If you jumped off the vessel you would still be in motion from the drift (current) and the wind you felt would be relevant to the drift. So on Water you are only aware of the Water Wind details.
In a real world, calculated archive data will store the Water Wind details and we still send apparent wind details to the NMEA instruments.

15 | P a g e
15
Pushes During normal processing the scripts have been setup to constantly send data or notifications to remote sites. An internet connection is generally required to make this happen. You may also set up your own script, if you have the python scripting knowledge.
The currently supported push services are:
Pushover Notifications This is a service which sends notifications to smartphones via a pushover app. Visit the third-party site http://pushover.net/ for information on how to use the app and link this station. It will require a user key and an application key. If the station detects an issue, a notification will be sent. This can be handy to let you know when the station is down or a specific action has occurred. Alarm triggers are also sent to this service, on temperature or wind limits, for example.
MQTT Broker This will send MQTT messages for all current readings to a broker. These can then be used to push data into other systems and IoT devices. See http://mqtt.org/ for additional details on this protocol. You can use a public broker like http://couldmqtt.com or set up a broker on this station. See details at http://mosquitto.org/ on how to install a broker.
16 | P a g e
16
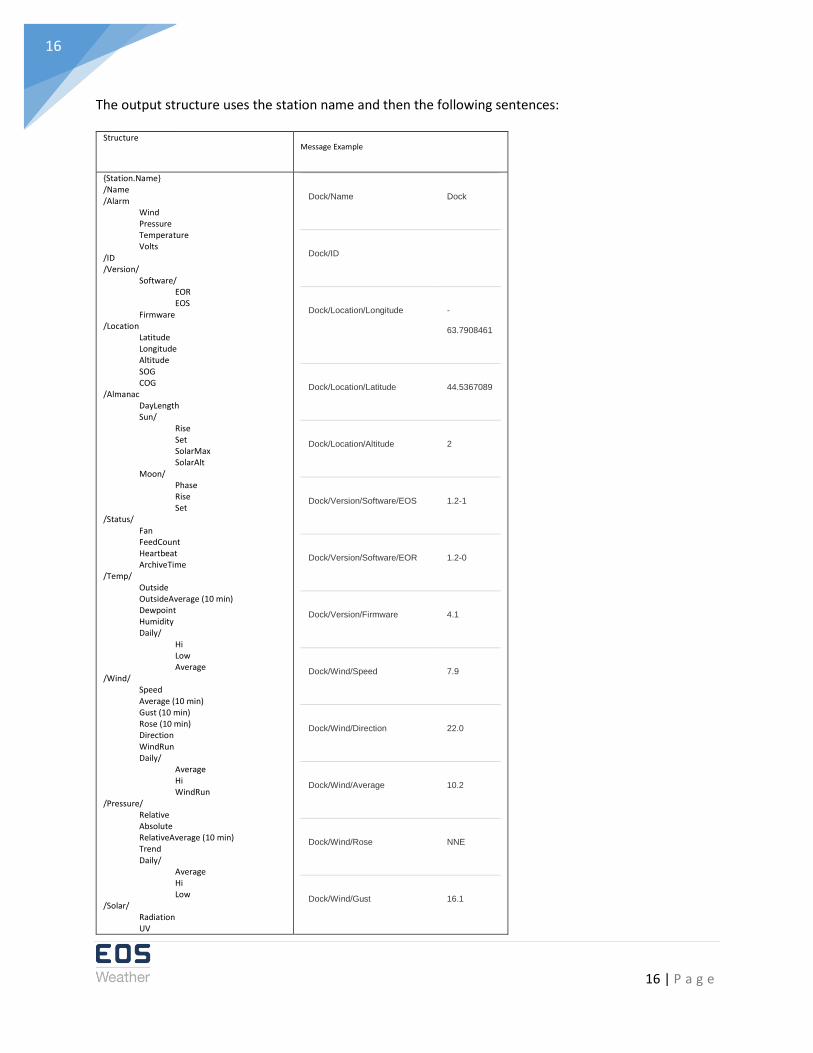
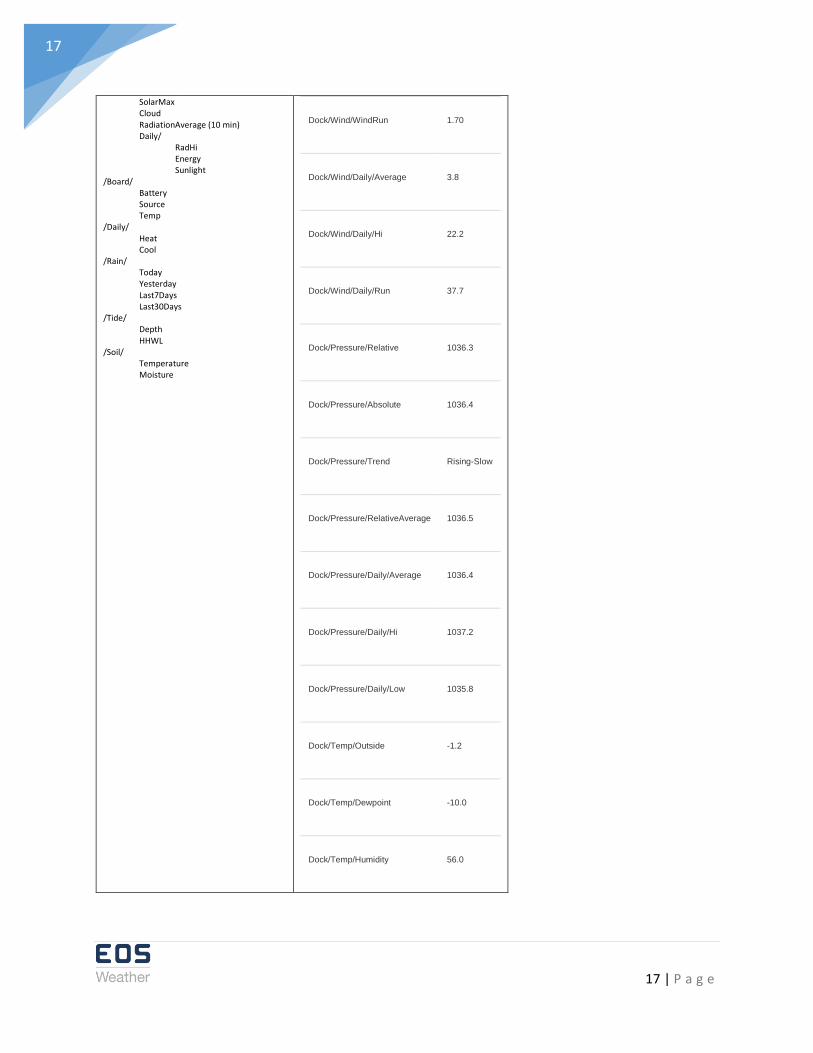
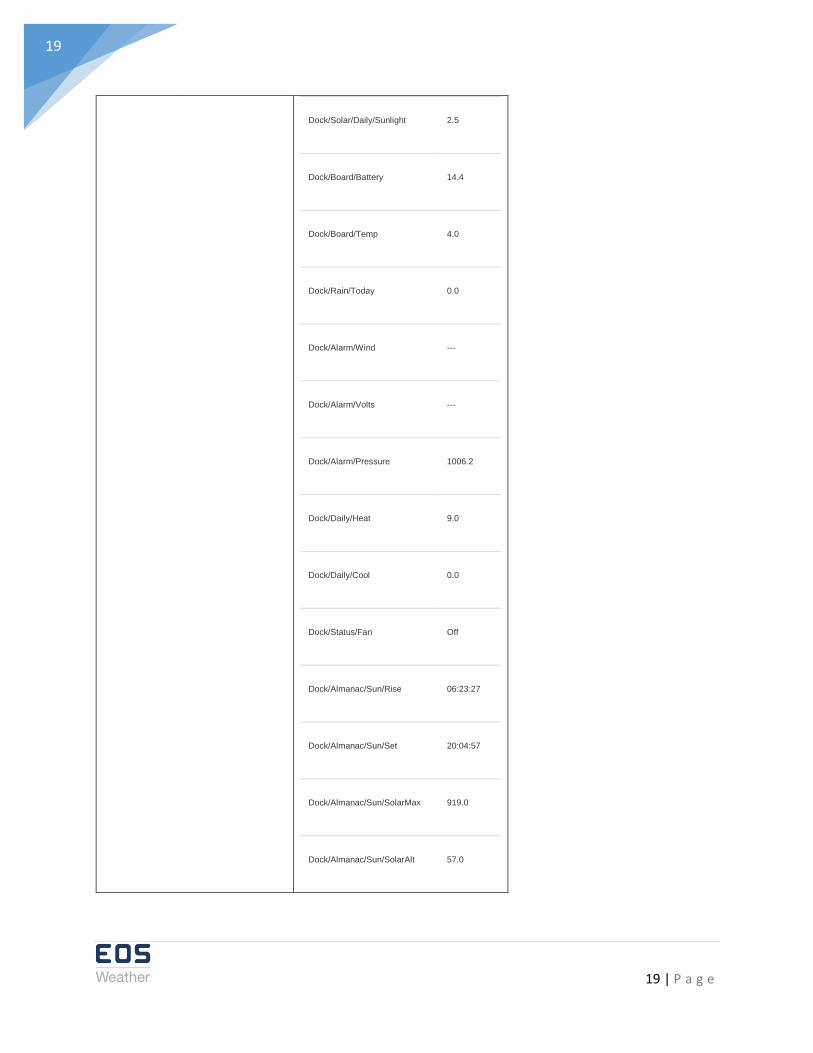
The output structure uses the station name and then the following sentences:
Structure Message Example
{Station.Name} /Name /Alarm
Wind Pressure Temperature Volts
/ID /Version/
Software/ EOR EOS
Firmware /Location
Latitude Longitude Altitude SOG COG
/Almanac DayLength Sun/
Rise Set SolarMax SolarAlt
Moon/ Phase Rise Set
/Status/ Fan FeedCount Heartbeat ArchiveTime
/Temp/ Outside OutsideAverage (10 min) Dewpoint Humidity Daily/
Hi Low Average
/Wind/ Speed Average (10 min) Gust (10 min) Rose (10 min) Direction WindRun Daily/
Average Hi WindRun
/Pressure/ Relative Absolute RelativeAverage (10 min) Trend Daily/
Average Hi Low
/Solar/ Radiation UV
Dock/Name Dock
Dock/ID
Dock/Location/Longitude -
63.7908461
Dock/Location/Latitude 44.5367089
Dock/Location/Altitude 2
Dock/Version/Software/EOS 1.2-1
Dock/Version/Software/EOR 1.2-0
Dock/Version/Firmware 4.1
Dock/Wind/Speed 7.9
Dock/Wind/Direction 22.0
Dock/Wind/Average 10.2
Dock/Wind/Rose NNE
Dock/Wind/Gust 16.1
17 | P a g e
17
SolarMax Cloud RadiationAverage (10 min) Daily/
RadHi Energy Sunlight
/Board/ Battery Source Temp
/Daily/ Heat Cool
/Rain/ Today Yesterday Last7Days Last30Days
/Tide/ Depth HHWL
/Soil/ Temperature Moisture
Dock/Wind/WindRun 1.70
Dock/Wind/Daily/Average 3.8
Dock/Wind/Daily/Hi 22.2
Dock/Wind/Daily/Run 37.7
Dock/Pressure/Relative 1036.3
Dock/Pressure/Absolute 1036.4
Dock/Pressure/Trend Rising-Slow
Dock/Pressure/RelativeAverage 1036.5
Dock/Pressure/Daily/Average 1036.4
Dock/Pressure/Daily/Hi 1037.2
Dock/Pressure/Daily/Low 1035.8
Dock/Temp/Outside -1.2
Dock/Temp/Dewpoint -10.0
Dock/Temp/Humidity 56.0

18 | P a g e
18
Dock/Temp/OutsideAverage -1.2
Dock/Temp/Daily/Hi -0.8
Dock/Temp/Daily/Low -6.0
Dock/Temp/Daily/Average -3.5
Dock/Temp/Daily/Humidity 73
Dock/Temp/Daily/Dewpoint -8.9
Dock/Temp/Daily/Windchill -7.5
Dock/Solar/Radiation 569.0
Dock/Solar/UV 0.0
Dock/Solar/RadiationAverage 533.3
Dock/Solar/SolarMax 578.0
Dock/Solar/Cloudy 8.0
Dock/Solar/Daily/RadHi 533
Dock/Solar/Daily/Energy 71
19 | P a g e
19
Dock/Solar/Daily/Sunlight 2.5
Dock/Board/Battery 14.4
Dock/Board/Temp 4.0
Dock/Rain/Today 0.0
Dock/Alarm/Wind ---
Dock/Alarm/Volts ---
Dock/Alarm/Pressure 1006.2
Dock/Daily/Heat 9.0
Dock/Daily/Cool 0.0
Dock/Status/Fan Off
Dock/Almanac/Sun/Rise 06:23:27
Dock/Almanac/Sun/Set 20:04:57
Dock/Almanac/Sun/SolarMax 919.0
Dock/Almanac/Sun/SolarAlt 57.0

20 | P a g e
20
Dock/Almanac/Moon/Phase in its last
quarter
(decreasing
from full)
Dock/Almanac/DayLength 13.69
Dock/Wind/Direction 14.0
Dock/Temp/Humidity 54.0
Dock/Solar/Radiation 571.0
Weather Underground If you have PWS account, you can provide details for this station to feed data on the archive interval to http://www.wunderground.com/ You could also obtain an API key to return data from WUnderGround, such as a radar display and for future forecast on the internal site.
Awekas This is another upload site that uses a mapping display for current weather. Based in Europe, but it does have stations feeding into it worldwide. If a site id is entered a file will be generated at: http://localhost/reports/awekas_wl.htm which can be made available to this site. You must provide external access to the eos station web site. This file can also be part of the upload FTP process to a service provider or external site.
21 | P a g e
21
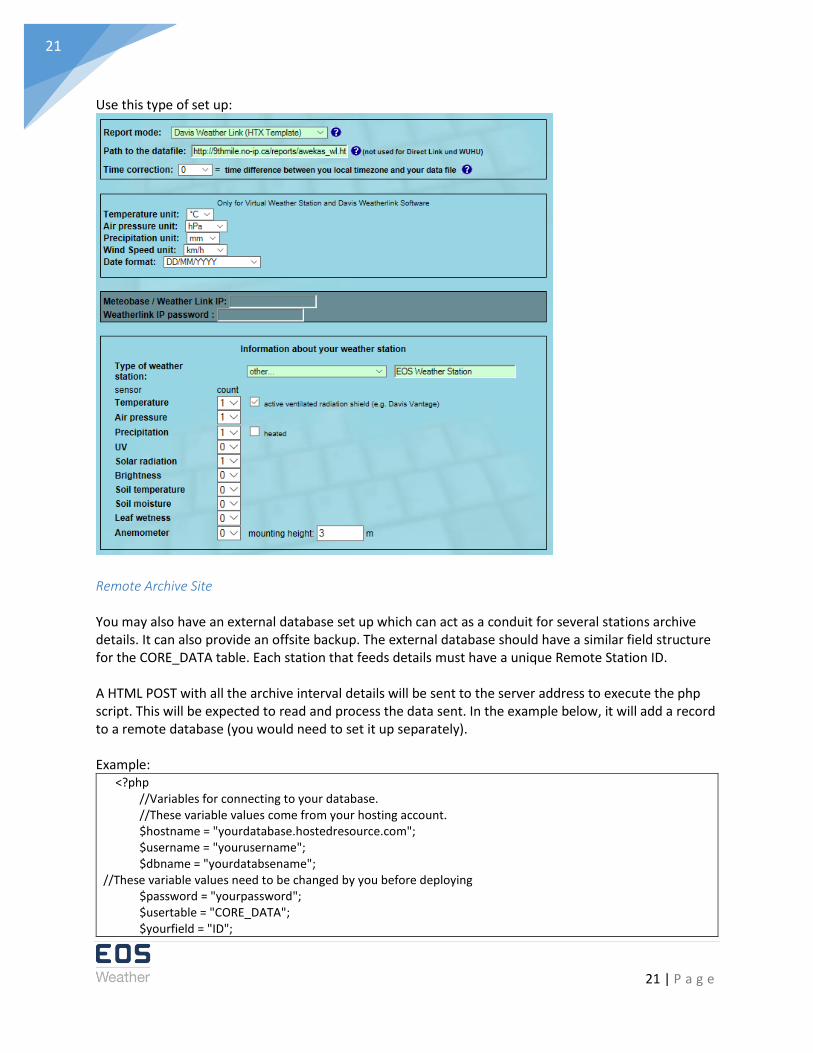
Use this type of set up:
Remote Archive Site You may also have an external database set up which can act as a conduit for several stations archive details. It can also provide an offsite backup. The external database should have a similar field structure for the CORE_DATA table. Each station that feeds details must have a unique Remote Station ID. A HTML POST with all the archive interval details will be sent to the server address to execute the php script. This will be expected to read and process the data sent. In the example below, it will add a record to a remote database (you would need to set it up separately). Example:
<?php //Variables for connecting to your database. //These variable values come from your hosting account. $hostname = "yourdatabase.hostedresource.com"; $username = "yourusername"; $dbname = "yourdatabsename"; //These variable values need to be changed by you before deploying $password = "yourpassword"; $usertable = "CORE_DATA"; $yourfield = "ID";
22 | P a g e
22
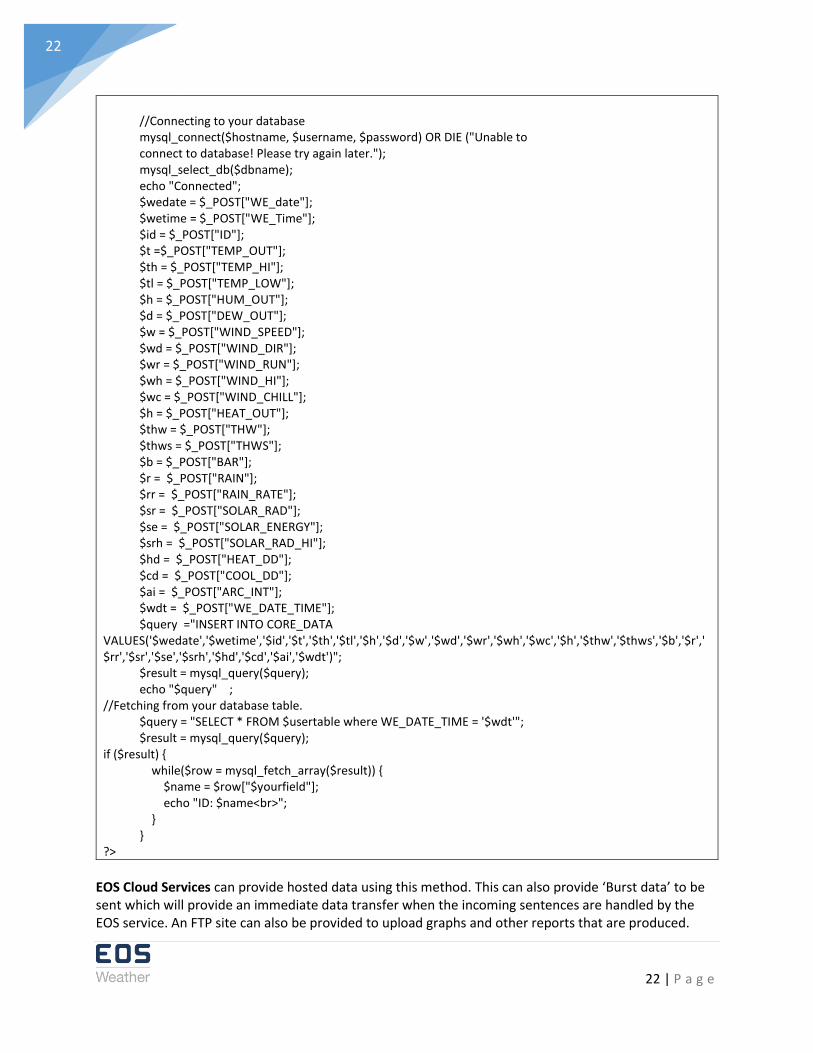
//Connecting to your database mysql_connect($hostname, $username, $password) OR DIE ("Unable to connect to database! Please try again later."); mysql_select_db($dbname); echo "Connected"; $wedate = $_POST["WE_date"]; $wetime = $_POST["WE_Time"]; $id = $_POST["ID"]; $t =$_POST["TEMP_OUT"]; $th = $_POST["TEMP_HI"]; $tl = $_POST["TEMP_LOW"]; $h = $_POST["HUM_OUT"]; $d = $_POST["DEW_OUT"]; $w = $_POST["WIND_SPEED"]; $wd = $_POST["WIND_DIR"]; $wr = $_POST["WIND_RUN"]; $wh = $_POST["WIND_HI"]; $wc = $_POST["WIND_CHILL"]; $h = $_POST["HEAT_OUT"]; $thw = $_POST["THW"]; $thws = $_POST["THWS"]; $b = $_POST["BAR"]; $r = $_POST["RAIN"]; $rr = $_POST["RAIN_RATE"]; $sr = $_POST["SOLAR_RAD"]; $se = $_POST["SOLAR_ENERGY"]; $srh = $_POST["SOLAR_RAD_HI"]; $hd = $_POST["HEAT_DD"]; $cd = $_POST["COOL_DD"]; $ai = $_POST["ARC_INT"]; $wdt = $_POST["WE_DATE_TIME"]; $query ="INSERT INTO CORE_DATA VALUES('$wedate','$wetime','$id','$t','$th','$tl','$h','$d','$w','$wd','$wr','$wh','$wc','$h','$thw','$thws','$b','$r','$rr','$sr','$se','$srh','$hd','$cd','$ai','$wdt')"; $result = mysql_query($query); echo "$query" ; //Fetching from your database table. $query = "SELECT * FROM $usertable where WE_DATE_TIME = '$wdt'"; $result = mysql_query($query); if ($result) { while($row = mysql_fetch_array($result)) { $name = $row["$yourfield"]; echo "ID: $name<br>"; } } ?>
EOS Cloud Services can provide hosted data using this method. This can also provide ‘Burst data’ to be sent which will provide an immediate data transfer when the incoming sentences are handled by the EOS service. An FTP site can also be provided to upload graphs and other reports that are produced.

23 | P a g e
23
Example of data sent to eosweather.ca cloud site:
http://www.eosweather.ca/burst/station.php?ID=7d4f236e-8eaa-11e4-ab9e-e0db5520e508
PWS Weather & Met Office UK Connection details to be used with these weather services.
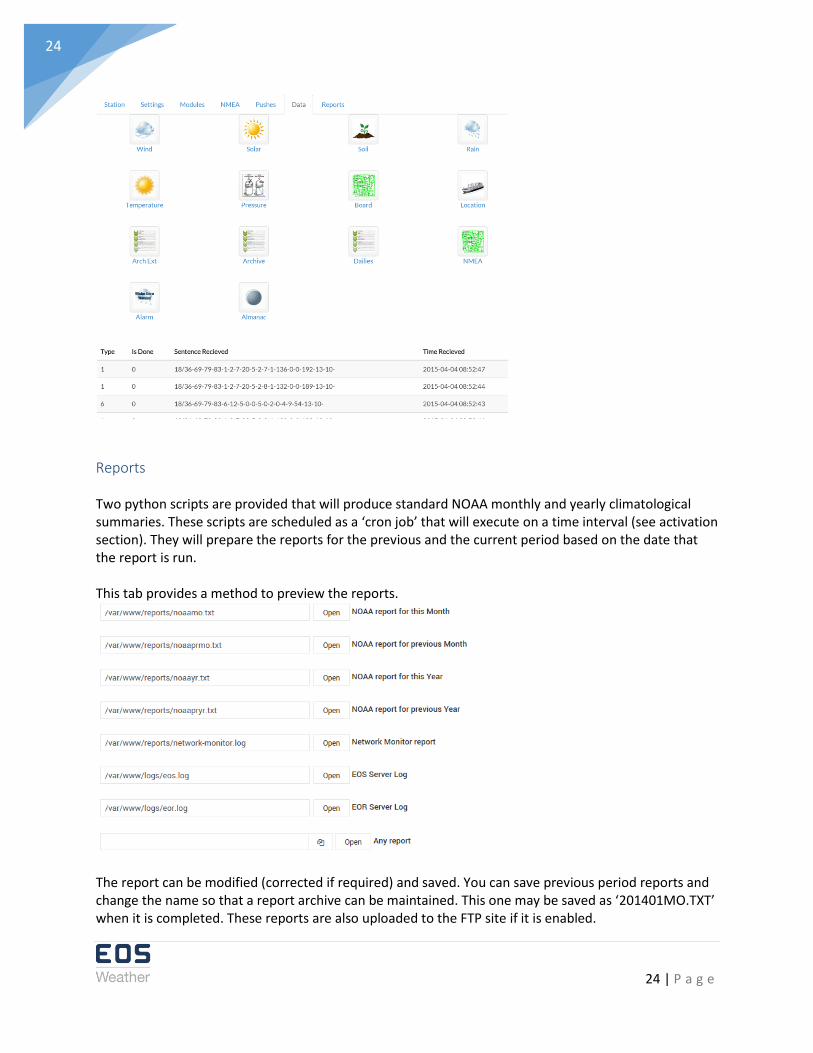
Data When the station is running, a list of the most recent sentences will be displayed. Additional details for each supported table can also be displayed. This is basically used to verify that the station is running properly and examine the data be received and processed.
24 | P a g e
24
Reports Two python scripts are provided that will produce standard NOAA monthly and yearly climatological summaries. These scripts are scheduled as a ‘cron job’ that will execute on a time interval (see activation section). They will prepare the reports for the previous and the current period based on the date that the report is run. This tab provides a method to preview the reports.
The report can be modified (corrected if required) and saved. You can save previous period reports and change the name so that a report archive can be maintained. This one may be saved as ‘201401MO.TXT’ when it is completed. These reports are also uploaded to the FTP site if it is enabled.
25 | P a g e
25
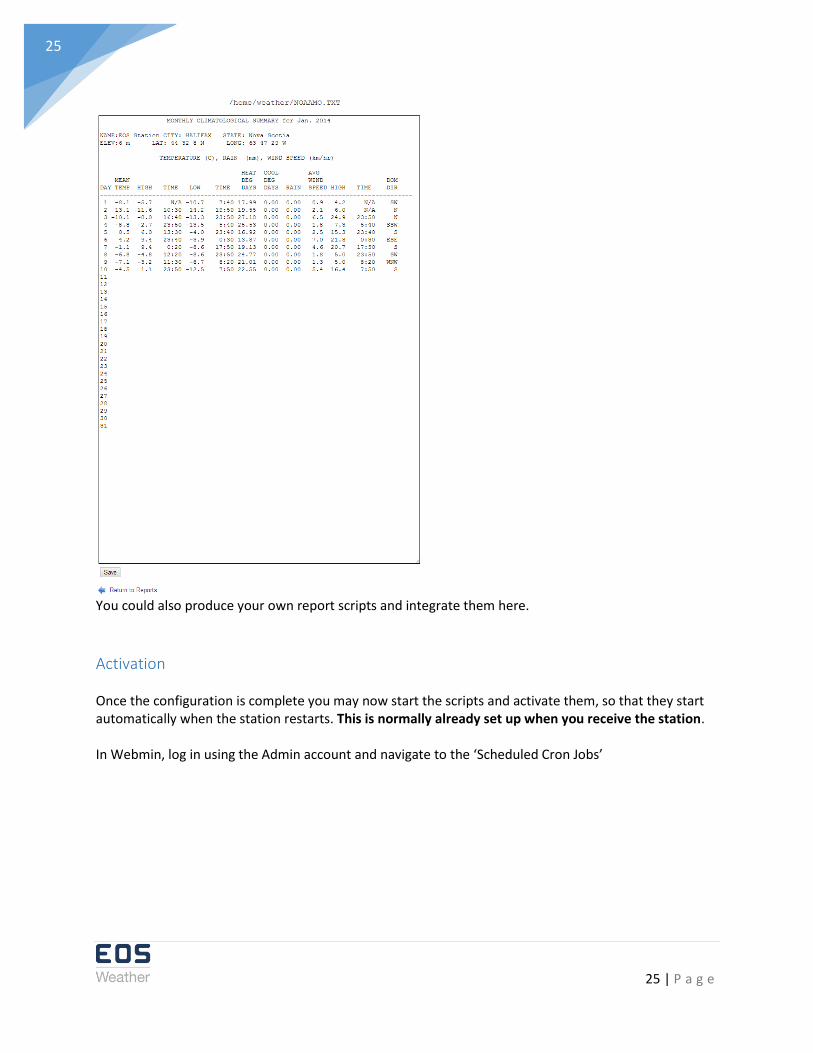
You could also produce your own report scripts and integrate them here.
Activation Once the configuration is complete you may now start the scripts and activate them, so that they start automatically when the station restarts. This is normally already set up when you receive the station. In Webmin, log in using the Admin account and navigate to the ‘Scheduled Cron Jobs’
26 | P a g e
26
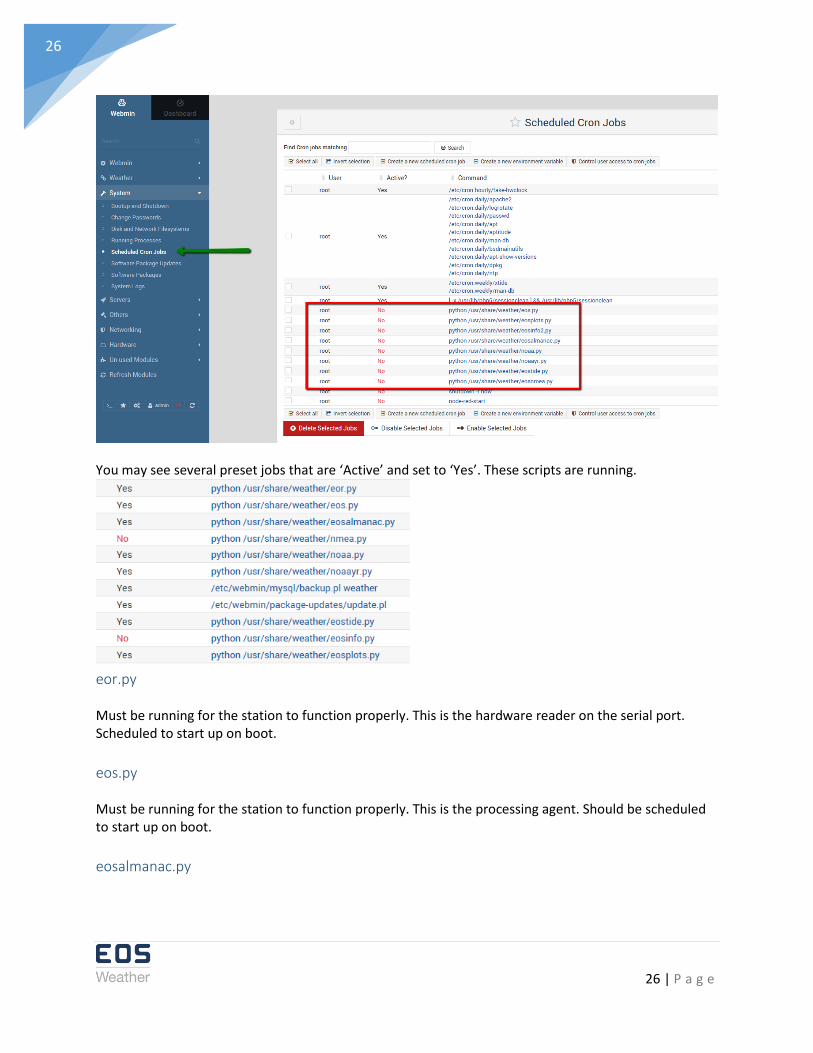
You may see several preset jobs that are ‘Active’ and set to ‘Yes’. These scripts are running.
eor.py Must be running for the station to function properly. This is the hardware reader on the serial port. Scheduled to start up on boot.
eos.py Must be running for the station to function properly. This is the processing agent. Should be scheduled to start up on boot.
eosalmanac.py
27 | P a g e
27
Optional. Calculates the almanac data if latitude and longitude is provided. Can be scheduled to run once a day and this routine populates an ALMANAC table with daily values for sun and moon that is displayed on the web page.
nmea.py Optional. Handles the reading of incoming and outgoing sentences. If GPS data is provided then this is also used for weather calculations in the EOS script. Incoming sentences that are supported can also be set for output. Should be set to start up on re-boot.
noaa.py Optional. Builds the NOAA daily report. Always builds the current (noaamo.txt) and previous (noaaprmo.txt) month reports. Can be scheduled to run once an hour. Each monthly report is also preserved with a file name yyyy-mmmo.txt (2017-04mo.txt) format. If a FTP site has been set up then all reports are uploaded to that site as well.
noaayr.py Optional. Builds the NOAA yearly report. Always builds the current (noaayr.txt) and previous (noaapryr.txt) year reports. Each yearly report is also preserved with a file name yyyyyr.txt (2017yr.txt) format. If a FTP site has been set up then all reports are uploaded to that site as well.
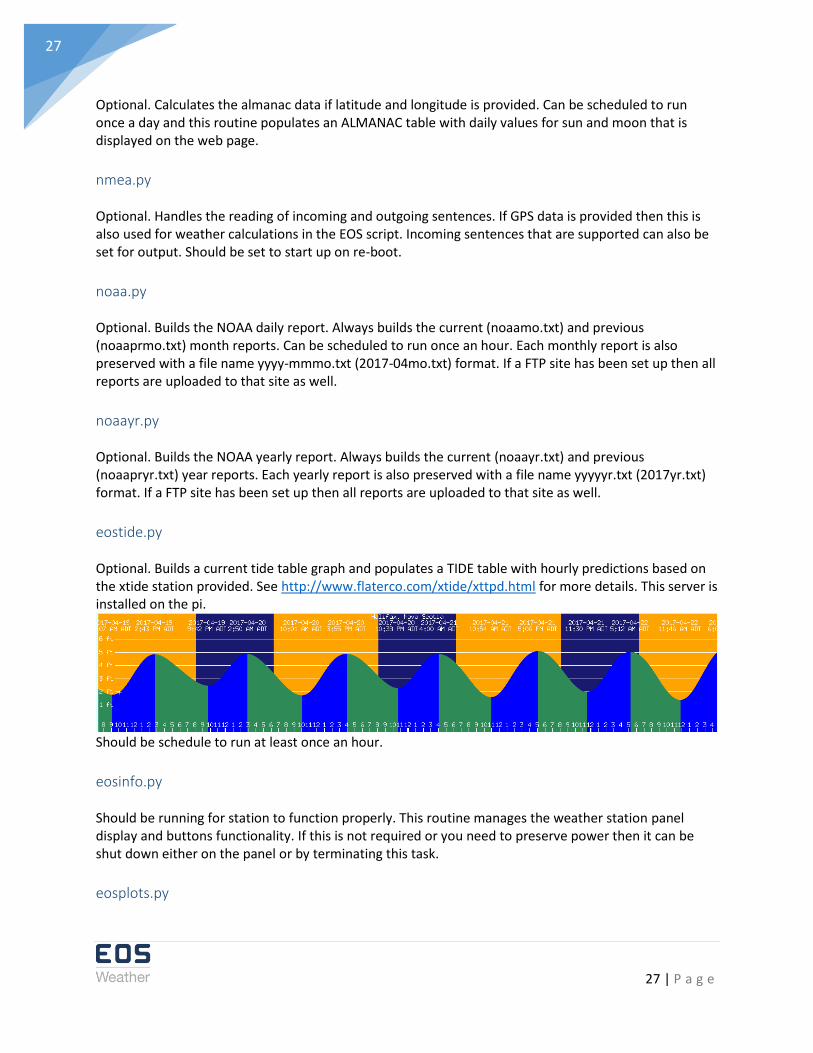
eostide.py Optional. Builds a current tide table graph and populates a TIDE table with hourly predictions based on the xtide station provided. See http://www.flaterco.com/xtide/xttpd.html for more details. This server is installed on the pi.
Should be schedule to run at least once an hour.
eosinfo.py Should be running for station to function properly. This routine manages the weather station panel display and buttons functionality. If this is not required or you need to preserve power then it can be shut down either on the panel or by terminating this task.
eosplots.py
28 | P a g e
28
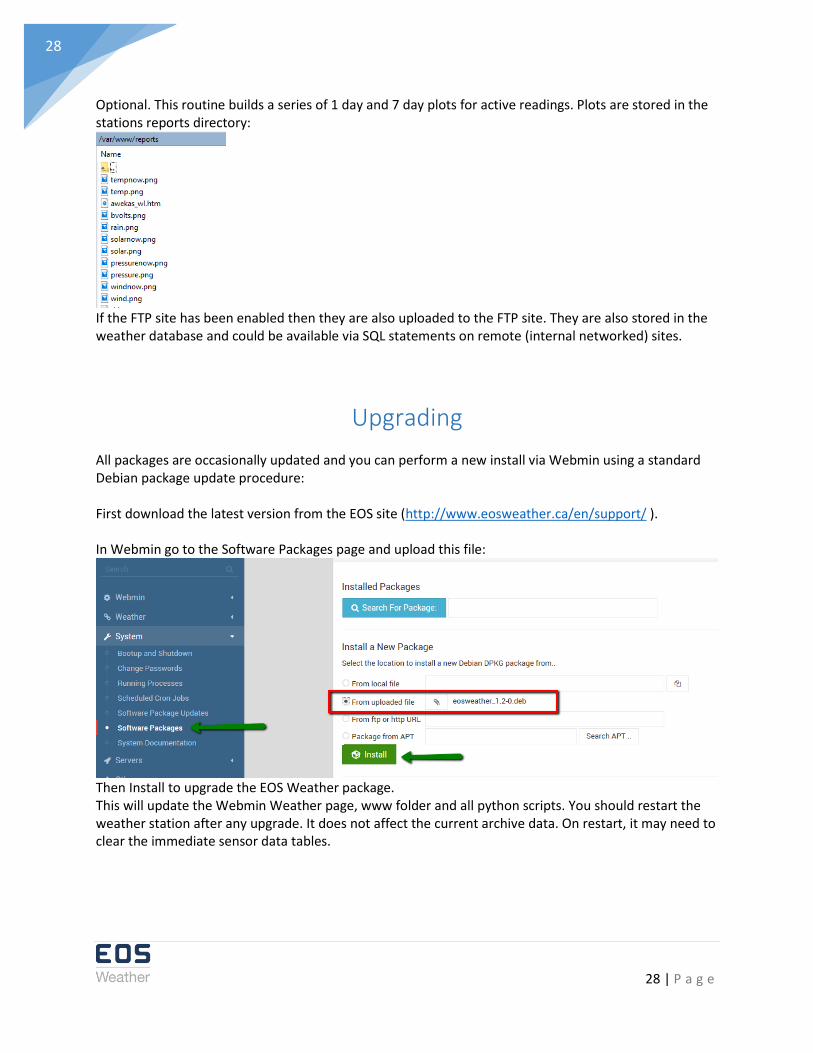
Optional. This routine builds a series of 1 day and 7 day plots for active readings. Plots are stored in the stations reports directory:
If the FTP site has been enabled then they are also uploaded to the FTP site. They are also stored in the weather database and could be available via SQL statements on remote (internal networked) sites.
Upgrading All packages are occasionally updated and you can perform a new install via Webmin using a standard Debian package update procedure: First download the latest version from the EOS site (http://www.eosweather.ca/en/support/ ). In Webmin go to the Software Packages page and upload this file:
Then Install to upgrade the EOS Weather package. This will update the Webmin Weather page, www folder and all python scripts. You should restart the weather station after any upgrade. It does not affect the current archive data. On restart, it may need to clear the immediate sensor data tables.
29 | P a g e
29
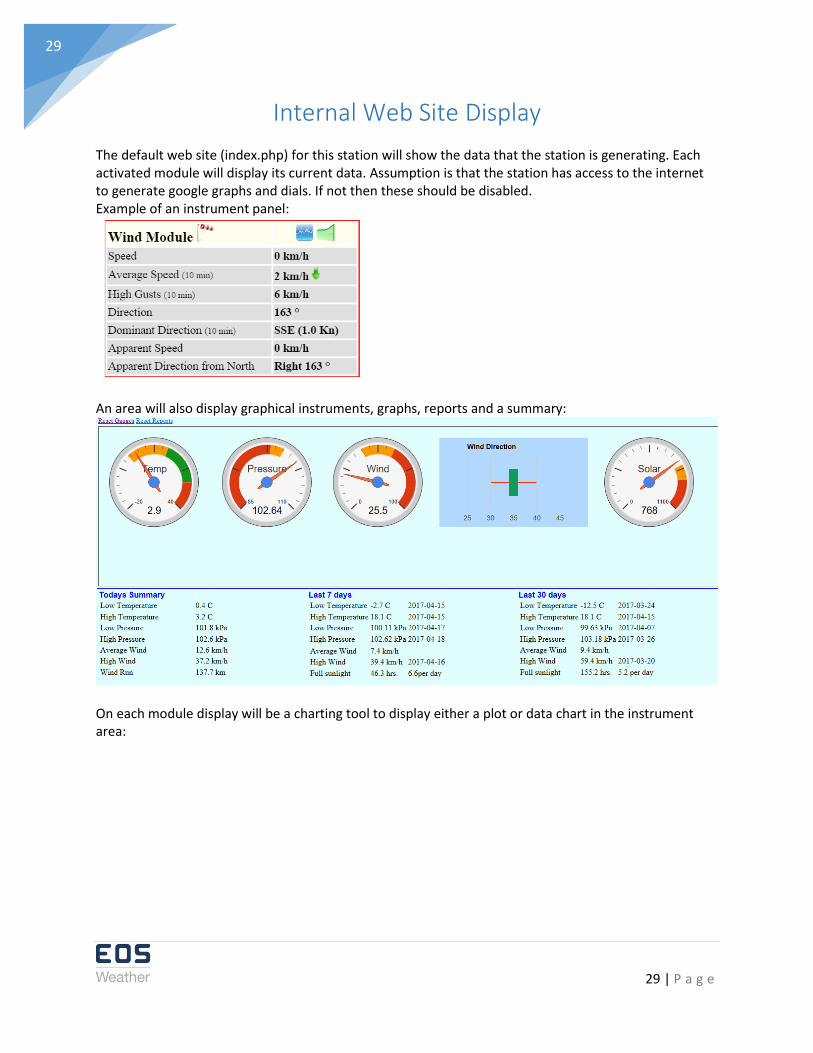
Internal Web Site Display The default web site (index.php) for this station will show the data that the station is generating. Each activated module will display its current data. Assumption is that the station has access to the internet to generate google graphs and dials. If not then these should be disabled. Example of an instrument panel:
An area will also display graphical instruments, graphs, reports and a summary:
On each module display will be a charting tool to display either a plot or data chart in the instrument area:

30 | P a g e
30
*eosplots.py service (via the con-job) must be running for plots to be generated.
*only available if the google API services can be accessed. A menu will load additional data displays.
31 | P a g e
31
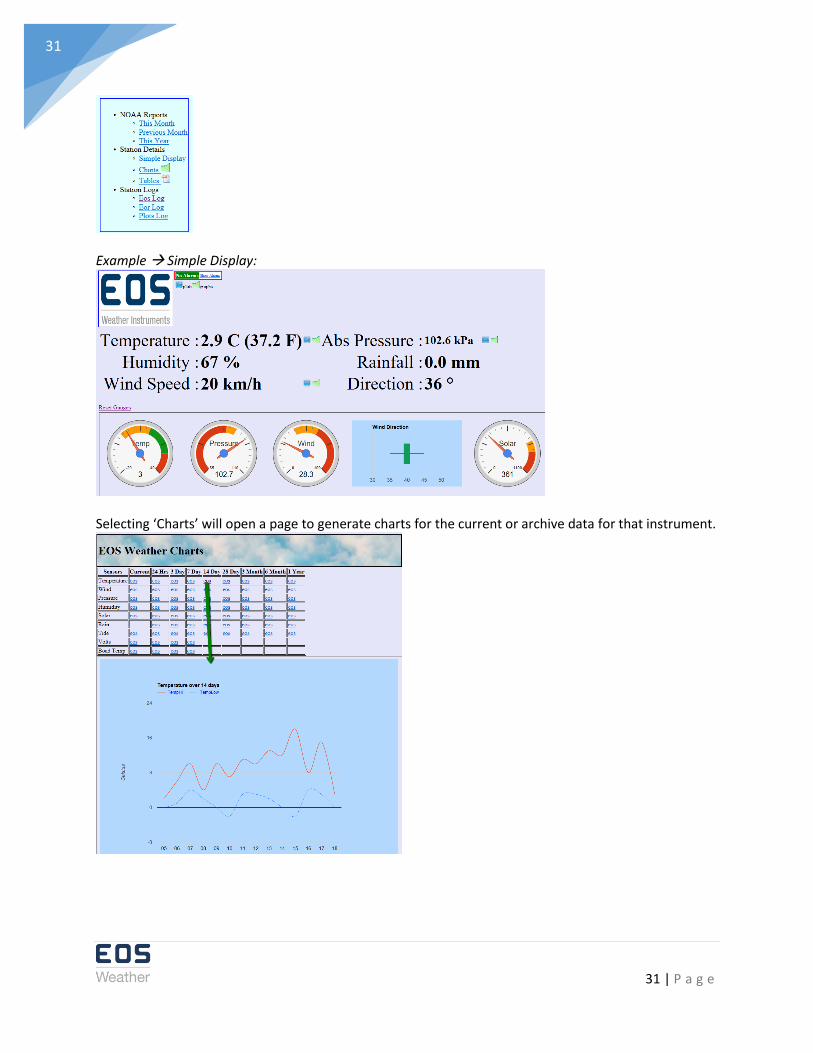
Example Simple Display:
Selecting ‘Charts’ will open a page to generate charts for the current or archive data for that instrument.
32 | P a g e
32
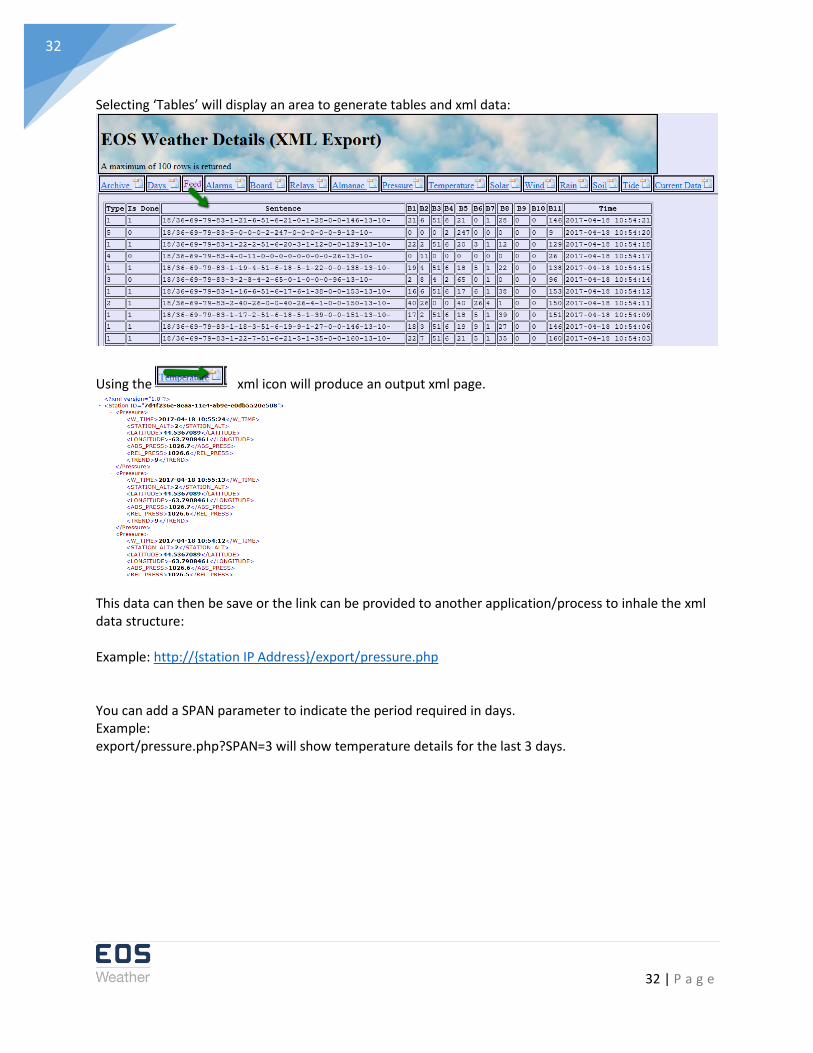
Selecting ‘Tables’ will display an area to generate tables and xml data:
Using the xml icon will produce an output xml page.
This data can then be save or the link can be provided to another application/process to inhale the xml data structure: Example: http://{station IP Address}/export/pressure.php You can add a SPAN parameter to indicate the period required in days. Example: export/pressure.php?SPAN=3 will show temperature details for the last 3 days.
33 | P a g e
33
Station Logs
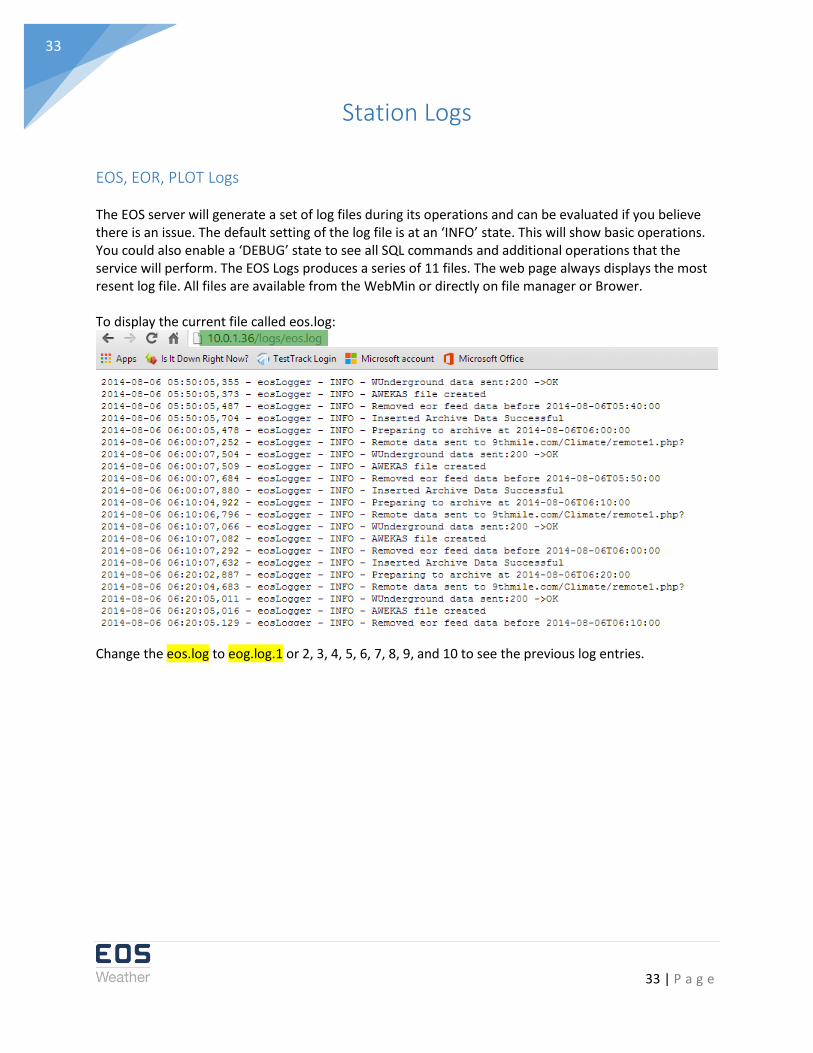
EOS, EOR, PLOT Logs The EOS server will generate a set of log files during its operations and can be evaluated if you believe there is an issue. The default setting of the log file is at an ‘INFO’ state. This will show basic operations. You could also enable a ‘DEBUG’ state to see all SQL commands and additional operations that the service will perform. The EOS Logs produces a series of 11 files. The web page always displays the most resent log file. All files are available from the WebMin or directly on file manager or Brower. To display the current file called eos.log:
Change the eos.log to eog.log.1 or 2, 3, 4, 5, 6, 7, 8, 9, and 10 to see the previous log entries.
34 | P a g e
34
Weather Station Functionality
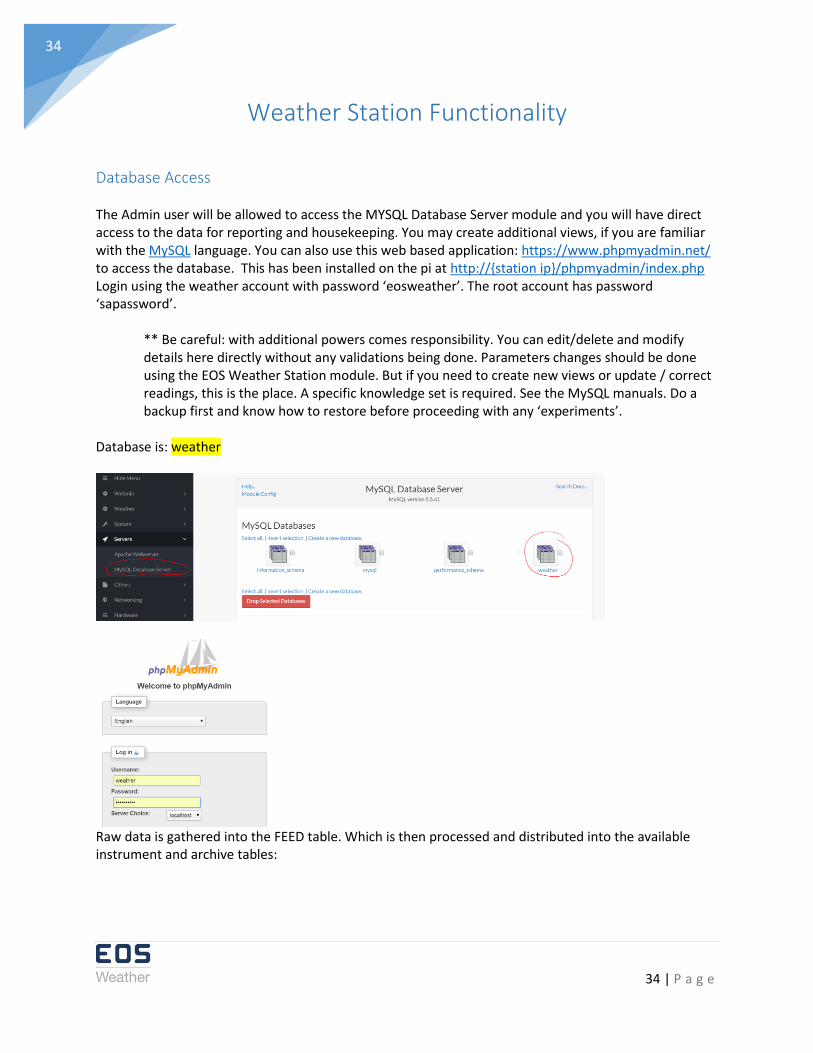
Database Access The Admin user will be allowed to access the MYSQL Database Server module and you will have direct access to the data for reporting and housekeeping. You may create additional views, if you are familiar with the MySQL language. You can also use this web based application: https://www.phpmyadmin.net/ to access the database. This has been installed on the pi at http://{station ip}/phpmyadmin/index.php Login using the weather account with password ‘eosweather’. The root account has password ‘sapassword’.
** Be careful: with additional powers comes responsibility. You can edit/delete and modify details here directly without any validations being done. Parameters changes should be done using the EOS Weather Station module. But if you need to create new views or update / correct readings, this is the place. A specific knowledge set is required. See the MySQL manuals. Do a backup first and know how to restore before proceeding with any ‘experiments’.
Database is: weather
Raw data is gathered into the FEED table. Which is then processed and distributed into the available instrument and archive tables:
35 | P a g e
35
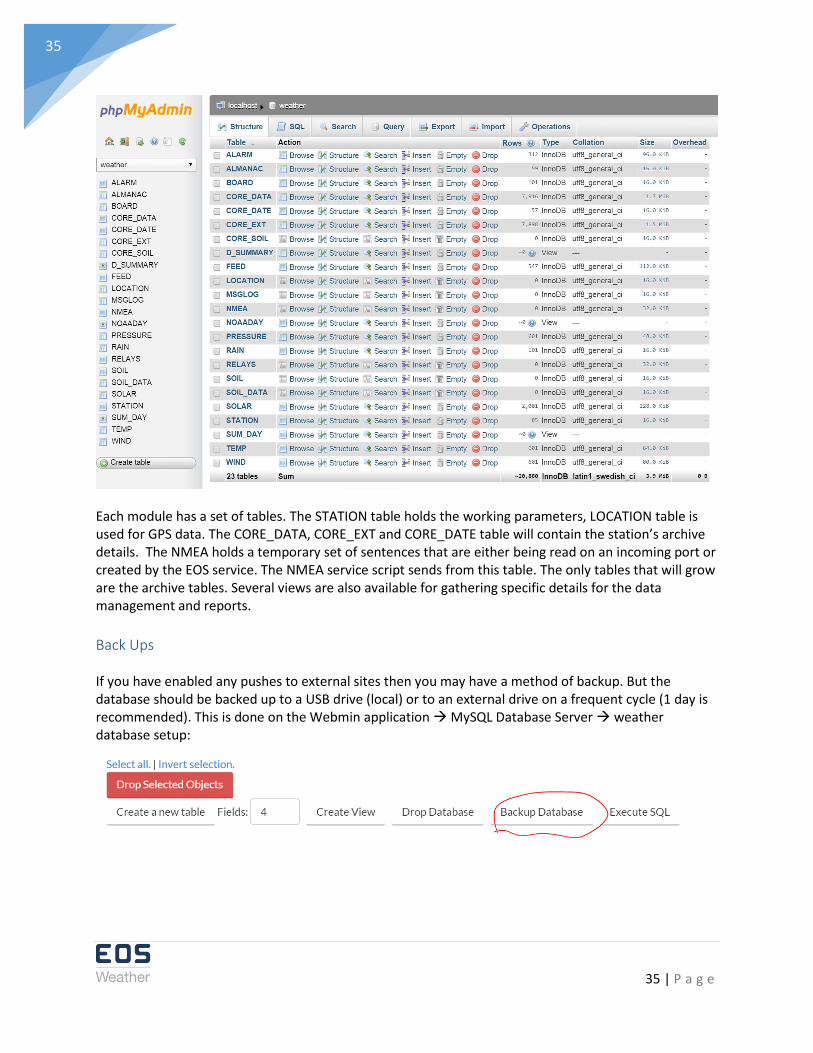
Each module has a set of tables. The STATION table holds the working parameters, LOCATION table is used for GPS data. The CORE_DATA, CORE_EXT and CORE_DATE table will contain the station’s archive details. The NMEA holds a temporary set of sentences that are either being read on an incoming port or created by the EOS service. The NMEA service script sends from this table. The only tables that will grow are the archive tables. Several views are also available for gathering specific details for the data management and reports.
Back Ups If you have enabled any pushes to external sites then you may have a method of backup. But the database should be backed up to a USB drive (local) or to an external drive on a frequent cycle (1 day is recommended). This is done on the Webmin application MySQL Database Server weather database setup:

36 | P a g e
36
Example:
Scheduling
If you want an email sent on completion of a backup then you also need to set up the Sending Email configuration:

37 | P a g e
37
Restore is done by taking the backup script and running them using the ‘Execute SQL’ ‘Run SQL from File’ method against the weather database.
38 | P a g e
38
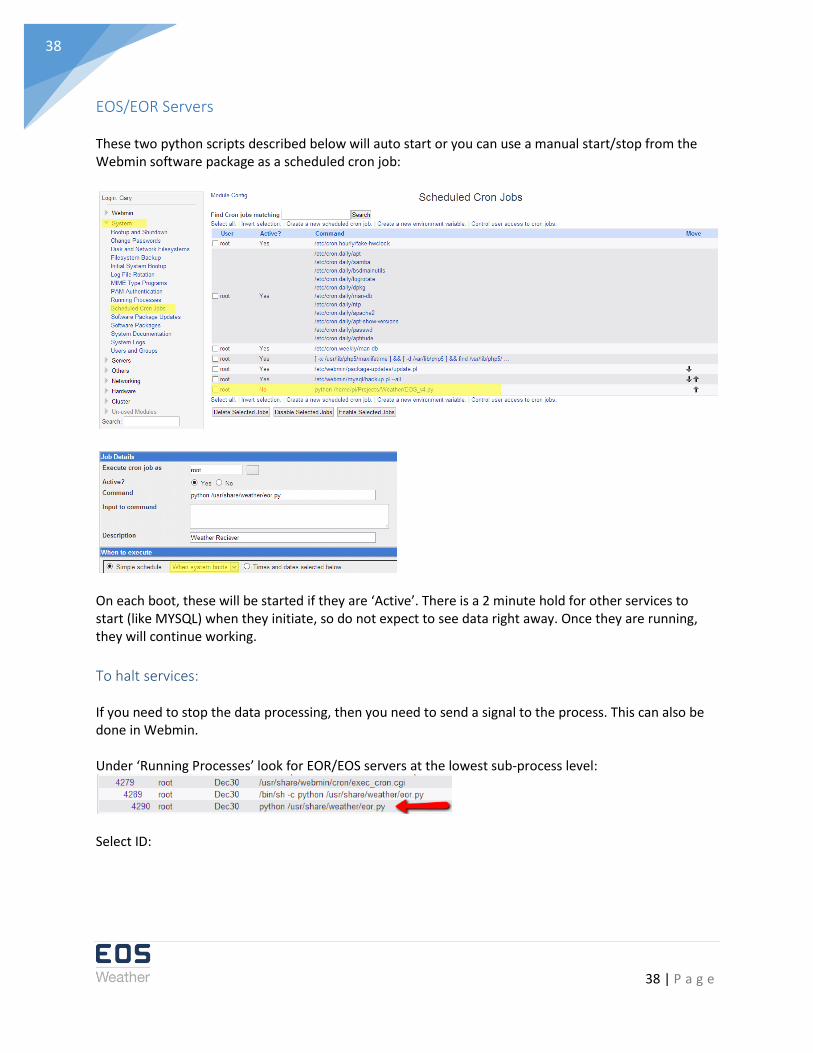
EOS/EOR Servers These two python scripts described below will auto start or you can use a manual start/stop from the Webmin software package as a scheduled cron job:
On each boot, these will be started if they are ‘Active’. There is a 2 minute hold for other services to start (like MYSQL) when they initiate, so do not expect to see data right away. Once they are running, they will continue working.
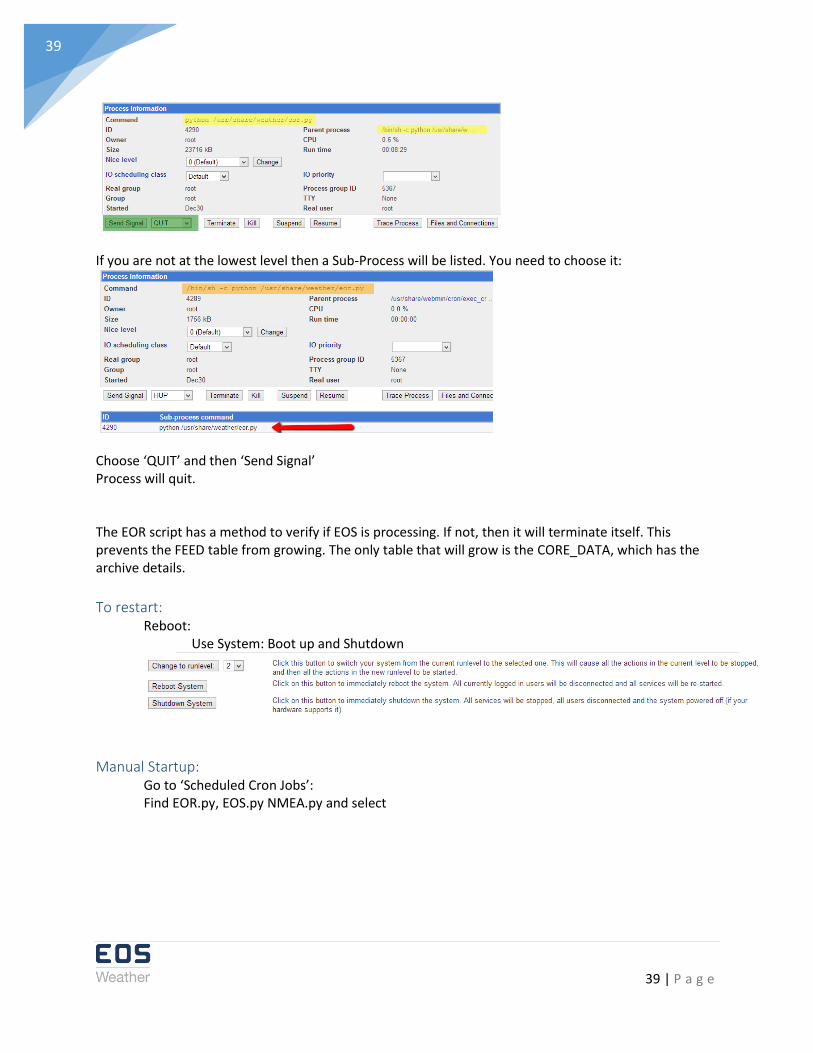
To halt services: If you need to stop the data processing, then you need to send a signal to the process. This can also be done in Webmin. Under ‘Running Processes’ look for EOR/EOS servers at the lowest sub-process level:
Select ID:
39 | P a g e
39
If you are not at the lowest level then a Sub-Process will be listed. You need to choose it:
Choose ‘QUIT’ and then ‘Send Signal’ Process will quit. The EOR script has a method to verify if EOS is processing. If not, then it will terminate itself. This prevents the FEED table from growing. The only table that will grow is the CORE_DATA, which has the archive details.
To restart: Reboot: Use System: Boot up and Shutdown
Manual Startup: Go to ‘Scheduled Cron Jobs’: Find EOR.py, EOS.py NMEA.py and select

40 | P a g e
40
Choose ‘Run Now’ If ‘Active? = Yes’, then scripts will start on reboot only if ‘Simple schedule…’ = ‘When system boots’.

41 | P a g e
41
EOS Script
Define Station Class: This will hold the station parameters. Most of the parameters will be managed by a web site (via the Webmin module). Each parameter is stored in an SQL table of the same name. STATION table structure:
Records are added for every required parameter. This allows new parameters to be added at any time: Example:
The LABEL column or record ID is referenced by the program and should not change. The description will have a short description of the parameters functionality. A value for the parameter can be stored as either a string, date, integer or floating point, depending on functionality.
42 | P a g e
42
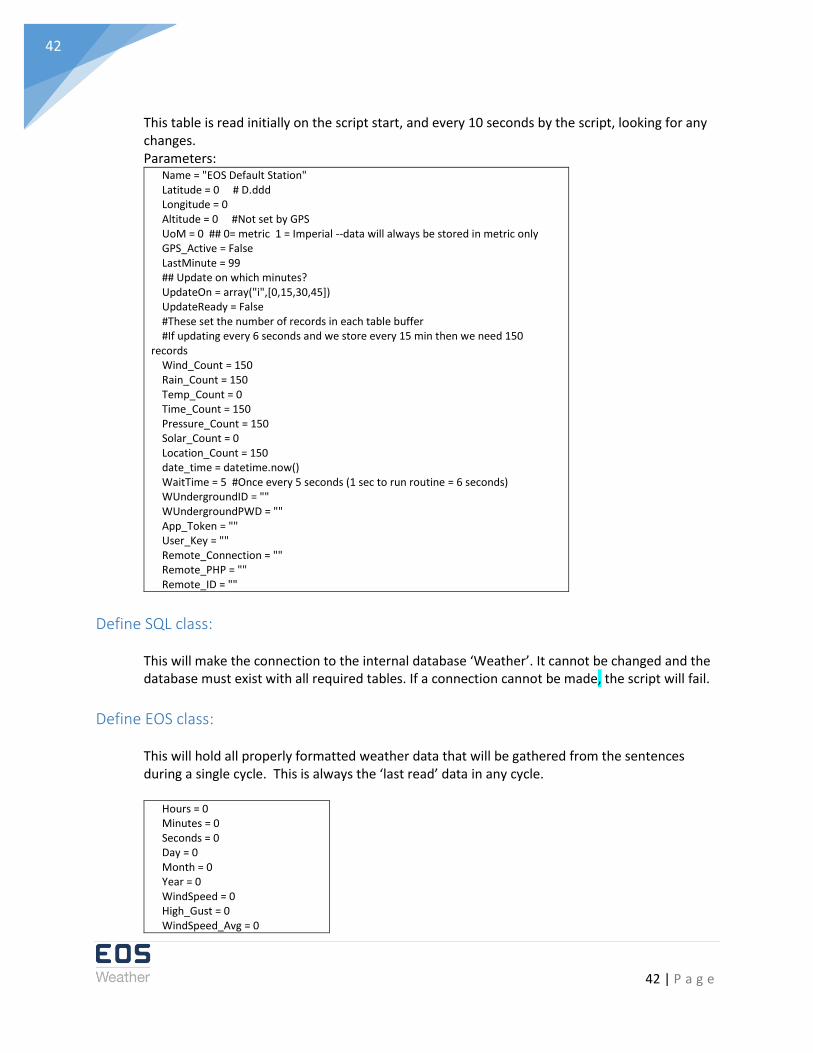
This table is read initially on the script start, and every 10 seconds by the script, looking for any changes. Parameters:
Name = "EOS Default Station" Latitude = 0 # D.ddd Longitude = 0 Altitude = 0 #Not set by GPS UoM = 0 ## 0= metric 1 = Imperial --data will always be stored in metric only GPS_Active = False LastMinute = 99 ## Update on which minutes? UpdateOn = array("i",[0,15,30,45]) UpdateReady = False #These set the number of records in each table buffer #If updating every 6 seconds and we store every 15 min then we need 150 records Wind_Count = 150 Rain_Count = 150 Temp_Count = 0 Time_Count = 150 Pressure_Count = 150 Solar_Count = 0 Location_Count = 150 date_time = datetime.now() WaitTime = 5 #Once every 5 seconds (1 sec to run routine = 6 seconds) WUndergroundID = "" WUndergroundPWD = "" App_Token = "" User_Key = "" Remote_Connection = "" Remote_PHP = "" Remote_ID = ""
Define SQL class: This will make the connection to the internal database ‘Weather’. It cannot be changed and the database must exist with all required tables. If a connection cannot be made, the script will fail.
Define EOS class:
This will hold all properly formatted weather data that will be gathered from the sentences during a single cycle. This is always the ‘last read’ data in any cycle.
Hours = 0 Minutes = 0 Seconds = 0 Day = 0 Month = 0 Year = 0 WindSpeed = 0 High_Gust = 0 WindSpeed_Avg = 0
43 | P a g e
43
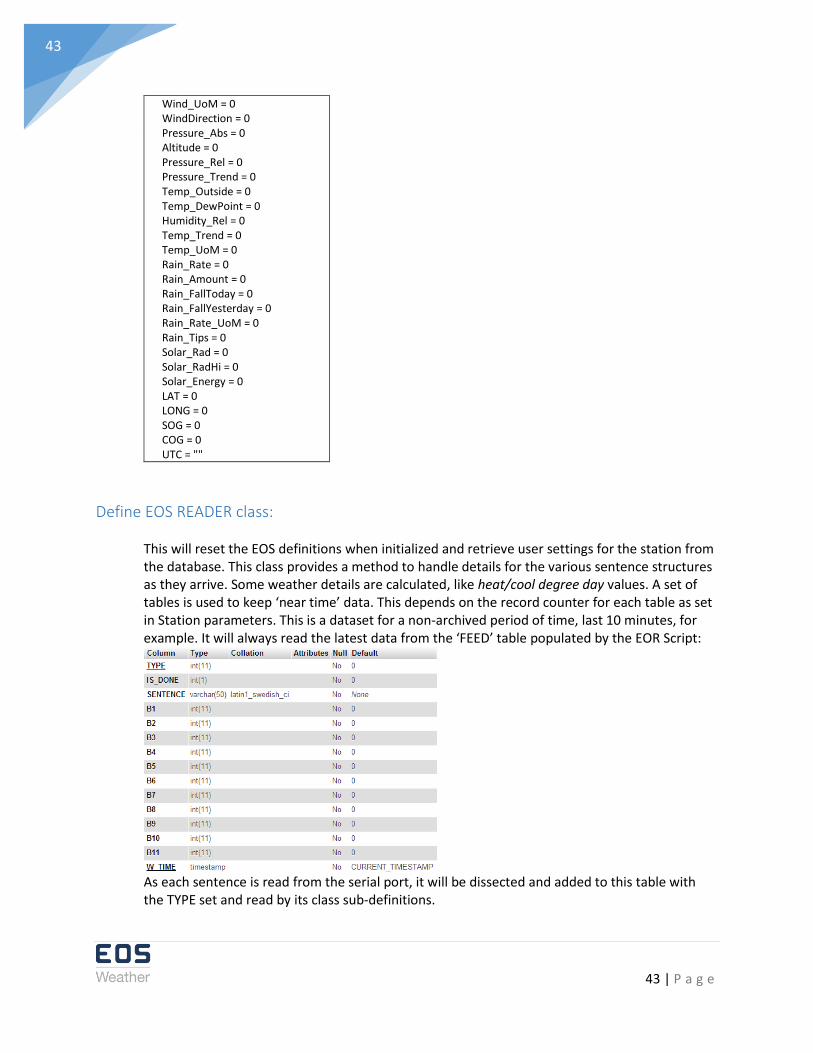
Wind_UoM = 0 WindDirection = 0 Pressure_Abs = 0 Altitude = 0 Pressure_Rel = 0 Pressure_Trend = 0 Temp_Outside = 0 Temp_DewPoint = 0 Humidity_Rel = 0 Temp_Trend = 0 Temp_UoM = 0 Rain_Rate = 0 Rain_Amount = 0 Rain_FallToday = 0 Rain_FallYesterday = 0 Rain_Rate_UoM = 0 Rain_Tips = 0 Solar_Rad = 0 Solar_RadHi = 0 Solar_Energy = 0 LAT = 0 LONG = 0 SOG = 0 COG = 0 UTC = ""
Define EOS READER class: This will reset the EOS definitions when initialized and retrieve user settings for the station from the database. This class provides a method to handle details for the various sentence structures as they arrive. Some weather details are calculated, like heat/cool degree day values. A set of tables is used to keep ‘near time’ data. This depends on the record counter for each table as set in Station parameters. This is a dataset for a non-archived period of time, last 10 minutes, for example. It will always read the latest data from the ‘FEED’ table populated by the EOR Script:
As each sentence is read from the serial port, it will be dissected and added to this table with the TYPE set and read by its class sub-definitions.

44 | P a g e
44
A set of class sub-definitions will be handled in each cycle and when data is discovered, the values stored here will be formatted and written to a set of pre-staging tables. The time data will come from the PC and it will use local time. This would be used in all subsequent tables listed below. SQL Table:
WIND (Define ESO1)
PRESSURE (define ESO2)
TEMP (define ESO3)
RAIN (Define ESO4)
SOLAR (Define ES05)
45 | P a g e
45
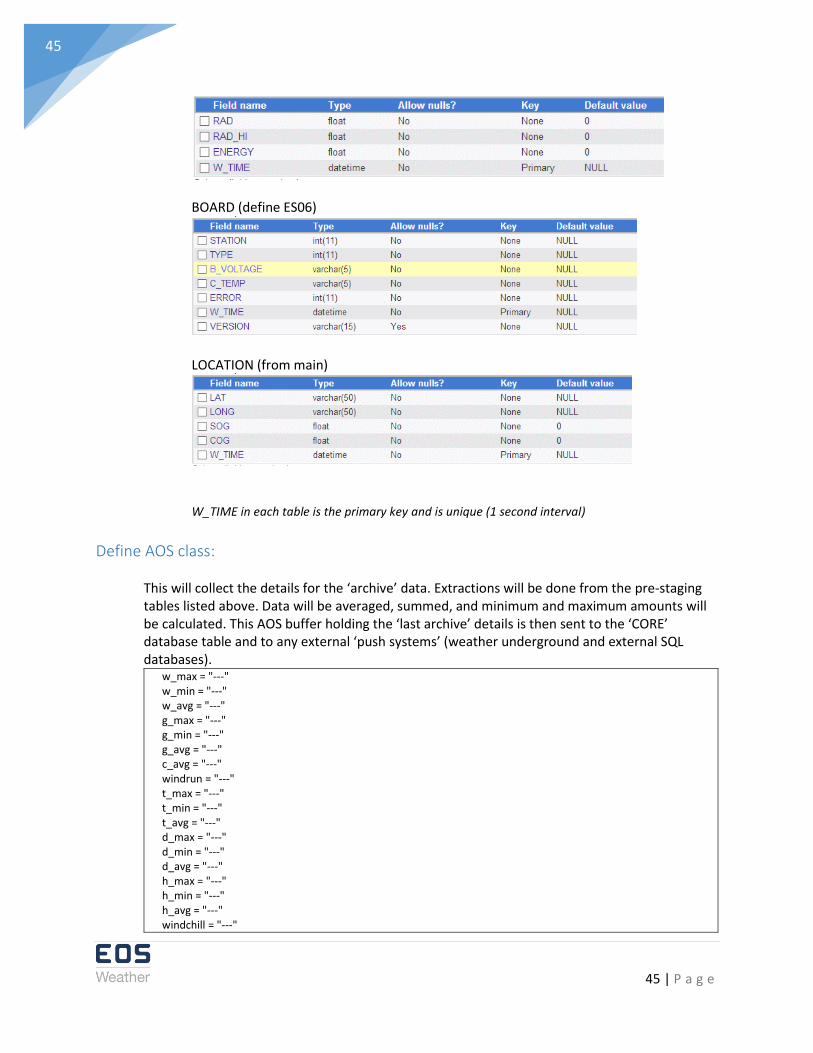
BOARD (define ES06)
LOCATION (from main)
W_TIME in each table is the primary key and is unique (1 second interval)
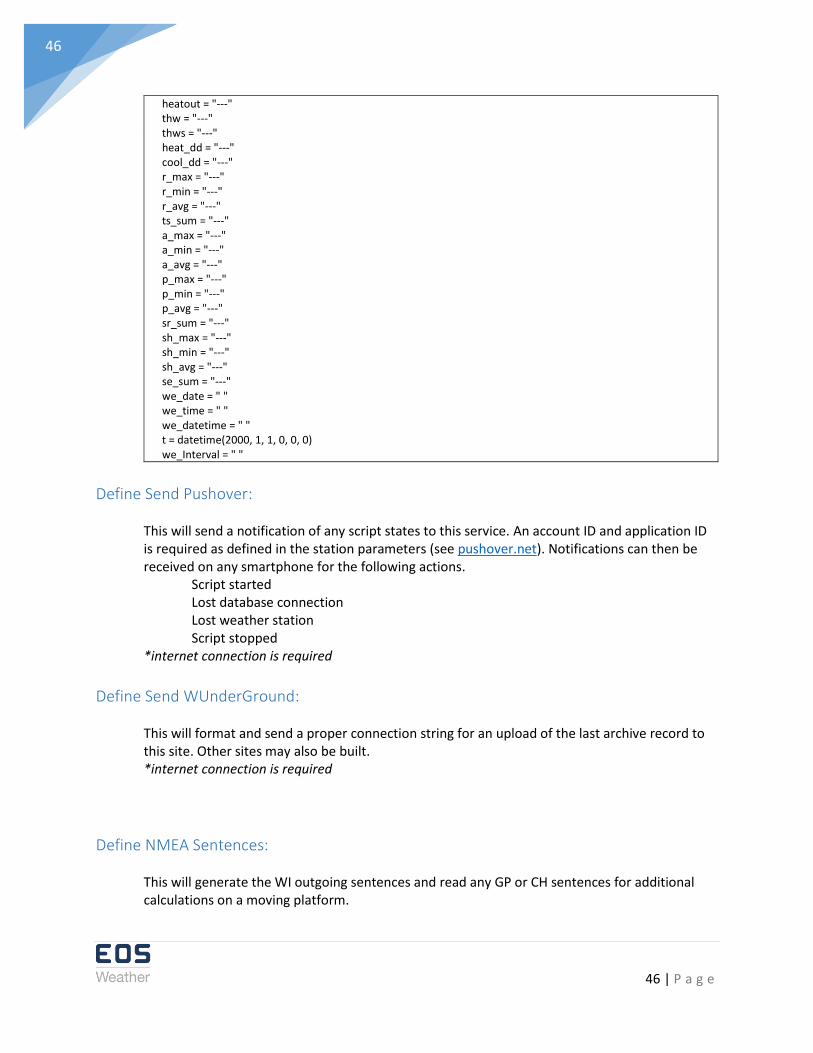
Define AOS class: This will collect the details for the ‘archive’ data. Extractions will be done from the pre-staging tables listed above. Data will be averaged, summed, and minimum and maximum amounts will be calculated. This AOS buffer holding the ‘last archive’ details is then sent to the ‘CORE’ database table and to any external ‘push systems’ (weather underground and external SQL databases).
w_max = "---" w_min = "---" w_avg = "---" g_max = "---" g_min = "---" g_avg = "---" c_avg = "---" windrun = "---" t_max = "---" t_min = "---" t_avg = "---" d_max = "---" d_min = "---" d_avg = "---" h_max = "---" h_min = "---" h_avg = "---" windchill = "---"
46 | P a g e
46
heatout = "---" thw = "---" thws = "---" heat_dd = "---" cool_dd = "---" r_max = "---" r_min = "---" r_avg = "---" ts_sum = "---" a_max = "---" a_min = "---" a_avg = "---" p_max = "---" p_min = "---" p_avg = "---" sr_sum = "---" sh_max = "---" sh_min = "---" sh_avg = "---" se_sum = "---" we_date = " " we_time = " " we_datetime = " " t = datetime(2000, 1, 1, 0, 0, 0) we_Interval = " "
Define Send Pushover: This will send a notification of any script states to this service. An account ID and application ID is required as defined in the station parameters (see pushover.net). Notifications can then be received on any smartphone for the following actions.
Script started Lost database connection Lost weather station Script stopped
*internet connection is required
Define Send WUnderGround: This will format and send a proper connection string for an upload of the last archive record to this site. Other sites may also be built. *internet connection is required
Define NMEA Sentences:
This will generate the WI outgoing sentences and read any GP or CH sentences for additional calculations on a moving platform.

47 | P a g e
47
Define Send Remote: This will send a URL parameter type connection string to any remote site. It is expected that the remote site will handle the parameters sent and insert the details into their own weather station table. The parameters sent match the internal CORE table setup. The external site should be able to handle multiple weather station feeds. A unique ID for each station is set in the stations parameters. *connection to site is required (could be local or wan network)
Define main:
This is the main loop and will initialize all classes and start the data gathering methods. It can only be stopped if an issue is raised, the user uses the [Ctrl-C] command from python or stopped in the Webmin module. It will:
• Wait 2 min for all services to start
• Make a connection to the weather database o Initialize the variables for the Station o Clear all tables that are used to buffer the data
• Send a Push notification, if required, that the station is starting
• Start a Cycle o Get time from PC (default) o Read sentence type 1, Set WIND o Read sentence type 2, Set PRESSURE o Read sentence type 3, Set TEMP o Read sentence type 4, Set RAIN o Read sentence type 5, Set SOLAR o Read sentence type 6. Set BOARD o Read sentence type 7, Set SOIL o Read sentence type 8, Set TIDE o Read NMEA sentences, location, motion details, Set LOCATION o Send MQTT feed for each new reading o Send BURST feed for each newly read sentence o Send any Pushover alarms
• Determine if this is an archive cycle (based on ’Update On’ minute match station parameter)
o Determine local PC time (truncate to update interval) o Gather wind summary data for AOS from WIND table o Gather pressure summary data for AOS from PRESSURE table o Gather temperature summary data for AOS from TEMP table. o Gather rain summary data for AOS from RAIN table o Gather solar summary data for AOS from SOLAR table

48 | P a g e
48
o Gather board summary data for AOS from BOARD table o Gather soil summary data from SOIL (multiple ID’s) o Gather tide summary data from TIDE o Gather NMEA sentence generation o Insert AOS details into CORE tables for this archive interval. o Do remote push’s
▪ Remote server (offsite storage) ▪ Weather Sites capture systems
• Sleep and repeat cycle o Escape from cycle
▪ Close database ▪ Send Pushover
EOR Script This script will be responsible for the communication methods to and from the EOS hardware using a serial port. It will start and stop using the same method in Webmin as the EOS Script.
Define SQL class: This will set the connection parameters for connection to the internal MYSQL database. If the connection fails, then the script will terminate.
Define Station class: This will host the parameters required for reading details from EOS station (serial port). It will also hold (TBA) defaults for the hardware setup, which will be stored in the database STATION table, as described above.
#port = "/dev/ttyAMA0" # Expected port port = "/dev/ttyUSB0" # USB port (used by GPS?) baudrate = 4800 # change to 9600 for station bytesize = serial.EIGHTBITS parity = serial.PARITY_NONE stopbits = serial.STOPBITS_ONE timeout = 0.1 xonoff = 0 rtscts = 0 #interCharTimeout = none
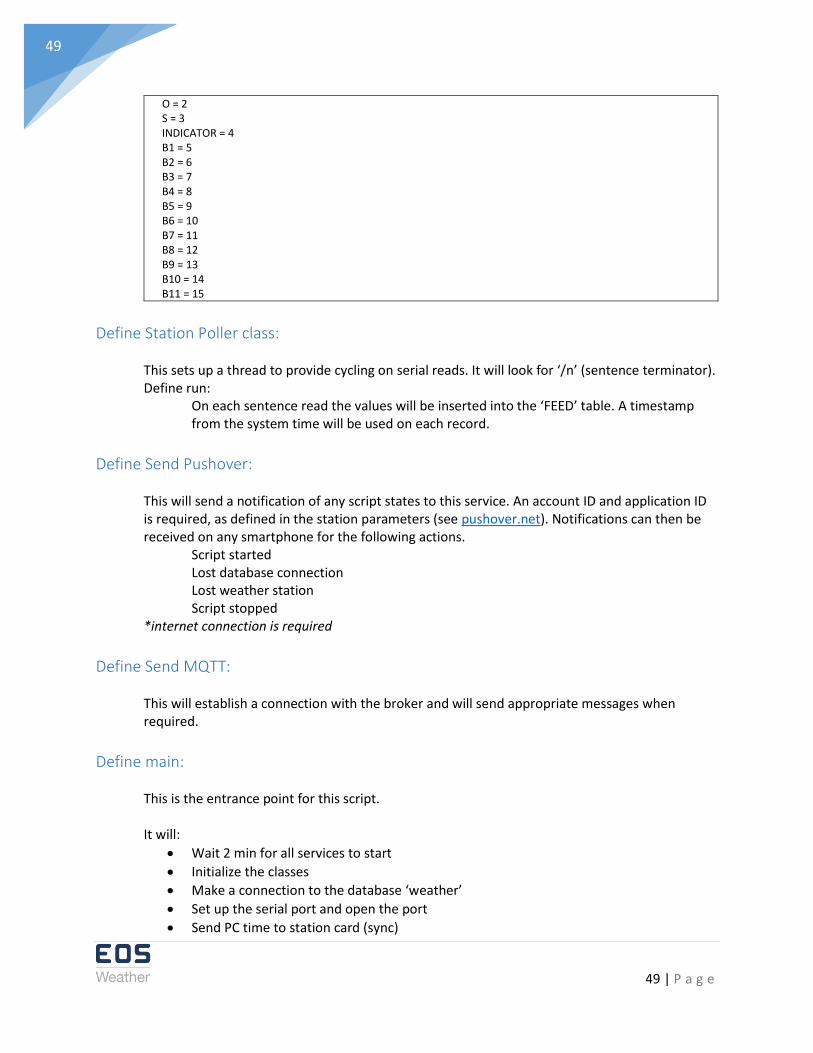
Define Address class: This will define the location of the bits transferred in a single sentence, received from the hardware station.
D = 0 E = 1
49 | P a g e
49
O = 2 S = 3 INDICATOR = 4 B1 = 5 B2 = 6 B3 = 7 B4 = 8 B5 = 9 B6 = 10 B7 = 11 B8 = 12 B9 = 13 B10 = 14 B11 = 15
Define Station Poller class: This sets up a thread to provide cycling on serial reads. It will look for ‘/n’ (sentence terminator). Define run:
On each sentence read the values will be inserted into the ‘FEED’ table. A timestamp from the system time will be used on each record.
Define Send Pushover: This will send a notification of any script states to this service. An account ID and application ID is required, as defined in the station parameters (see pushover.net). Notifications can then be received on any smartphone for the following actions.
Script started Lost database connection Lost weather station Script stopped
*internet connection is required
Define Send MQTT: This will establish a connection with the broker and will send appropriate messages when required.
Define main: This is the entrance point for this script. It will:
• Wait 2 min for all services to start
• Initialize the classes
• Make a connection to the database ‘weather’
• Set up the serial port and open the port
• Send PC time to station card (sync)
50 | P a g e
50
• Send Pushover notification
• Cycle through the EOS reader (nothing presently) o This will allow writing to EOS station o Start Station Poller
▪ Read serial port ▪ Verify checksum, sentence value
• Send Pushover notification, if no data received o Exit cycle on failure
• Repeat Cycle o Escape from cycle
▪ Close database ▪ Close Port ▪ Send Pushover notification
NMEA Script This will manage the NMEA sentences that may be incoming or outgoing on separate USB serial ports.
Define Station Class: This will hold a short list of the station parameters.
Define ADR Class:
This will hold the bites for the NMEA sentence structure.
Define EOR Class:
Initialize the reader/sender ports.
Define Station Poller Class:
Open any Serial Ports. It will perform the following actions when running:
• Read from the in-bound port any NMEA sentence o Validate line and checksum o Look for enabled sentences
▪ Store sentence in NMEA table
• Look for any enable sentences to send o Read data from NMEA table for that sentence o Send sentence to out-bound port if port has been enabled
51 | P a g e
51
Define Main:
This is the entry point for this script: It will:
• Open the database connection
• Retrieve Station parameters
• Open any enabled USB serial ports
• Start Station Poller
• Handle exit when quitting
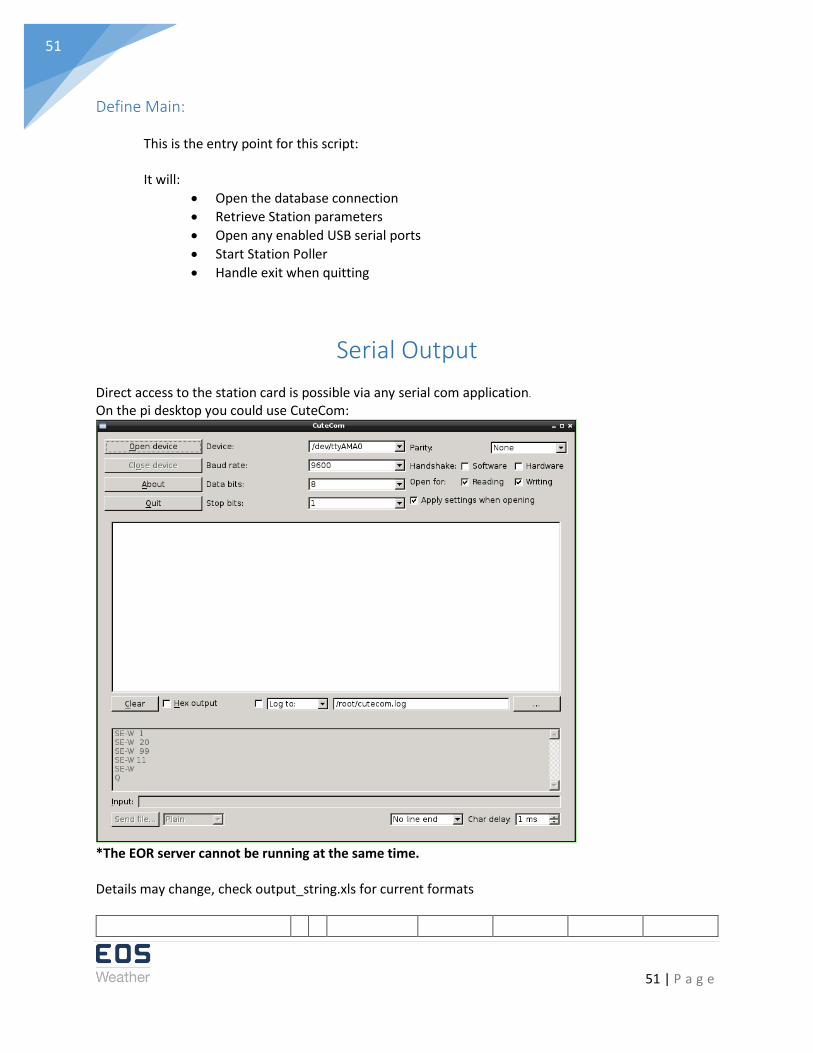
Serial Output Direct access to the station card is possible via any serial com application.
On the pi desktop you could use CuteCom:
*The EOR server cannot be running at the same time. Details may change, check output_string.xls for current formats
52 | P a g e
52
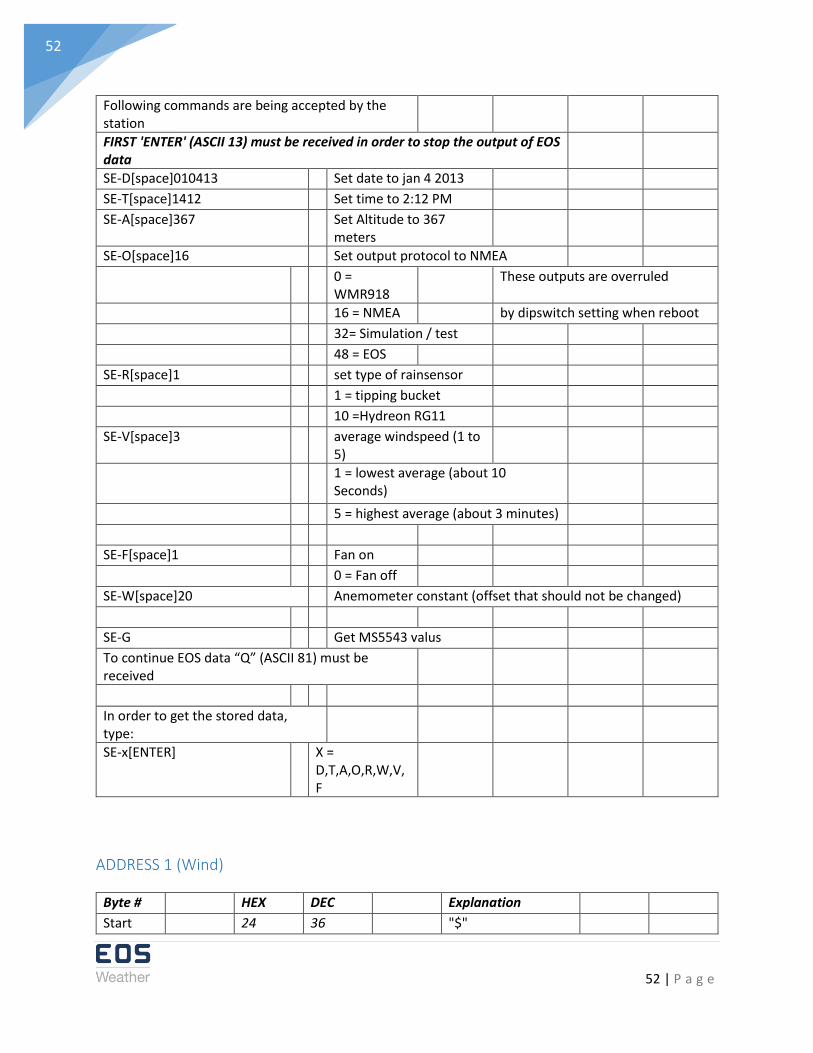
Following commands are being accepted by the station
FIRST 'ENTER' (ASCII 13) must be received in order to stop the output of EOS data
SE-D[space]010413 Set date to jan 4 2013
SE-T[space]1412 Set time to 2:12 PM
SE-A[space]367 Set Altitude to 367 meters
SE-O[space]16 Set output protocol to NMEA
0 = WMR918
These outputs are overruled
16 = NMEA by dipswitch setting when reboot
32= Simulation / test
48 = EOS
SE-R[space]1 set type of rainsensor
1 = tipping bucket
10 =Hydreon RG11
SE-V[space]3 average windspeed (1 to 5)
1 = lowest average (about 10 Seconds)
5 = highest average (about 3 minutes)
SE-F[space]1 Fan on
0 = Fan off
SE-W[space]20 Anemometer constant (offset that should not be changed)
SE-G Get MS5543 valus
To continue EOS data “Q” (ASCII 81) must be received
In order to get the stored data, type:
SE-x[ENTER]
X = D,T,A,O,R,W,V,F
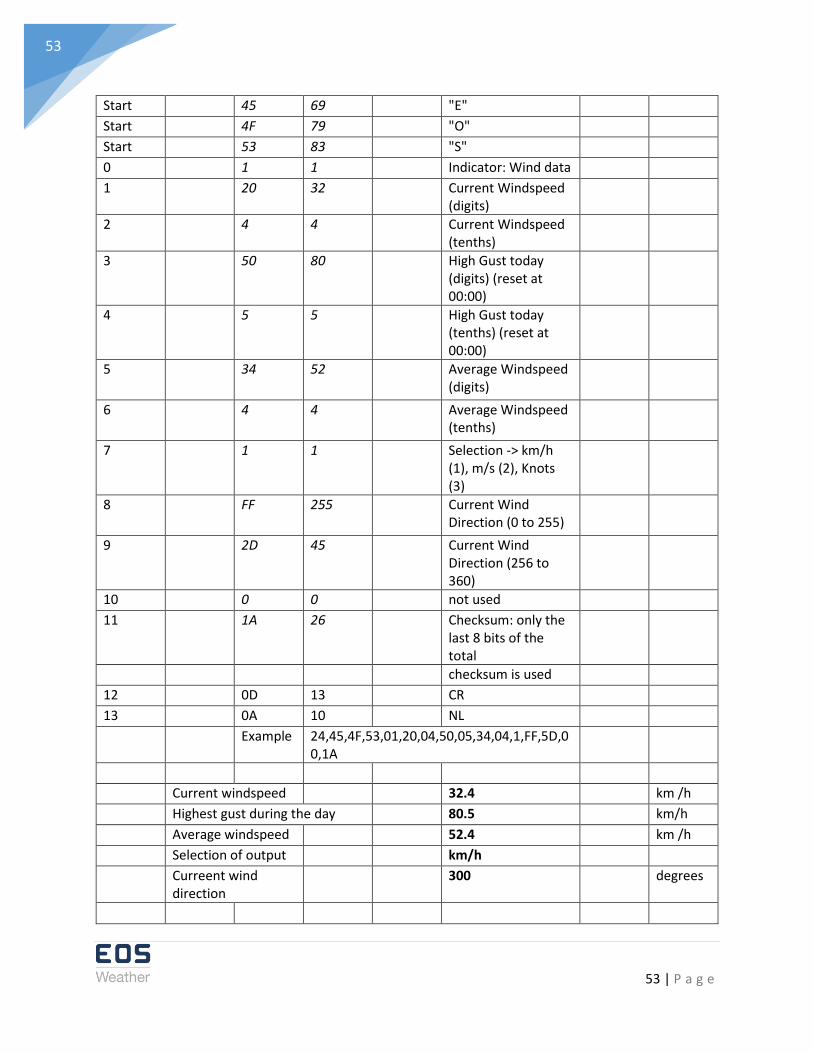
ADDRESS 1 (Wind)
Byte # HEX DEC Explanation
Start 24 36 "$"
53 | P a g e
53
Start 45 69 "E"
Start 4F 79 "O"
Start 53 83 "S"
0 1 1 Indicator: Wind data
1 20 32 Current Windspeed (digits)
2 4 4 Current Windspeed (tenths)
3 50 80 High Gust today (digits) (reset at 00:00)
4 5 5 High Gust today (tenths) (reset at 00:00)
5 34 52 Average Windspeed (digits)
6 4 4 Average Windspeed (tenths)
7 1 1 Selection -> km/h (1), m/s (2), Knots (3)
8 FF 255 Current Wind Direction (0 to 255)
9 2D 45 Current Wind Direction (256 to 360)
10
0 0
not used
11 1A 26 Checksum: only the last 8 bits of the total
checksum is used
12 0D 13 CR
13 0A 10 NL
Example 24,45,4F,53,01,20,04,50,05,34,04,1,FF,5D,00,1A
Current windspeed
32.4
km /h
Highest gust during the day
80.5
km/h
Average windspeed
52.4
km /h
Selection of output
km/h
Curreent wind direction
300
degrees
54 | P a g e
54
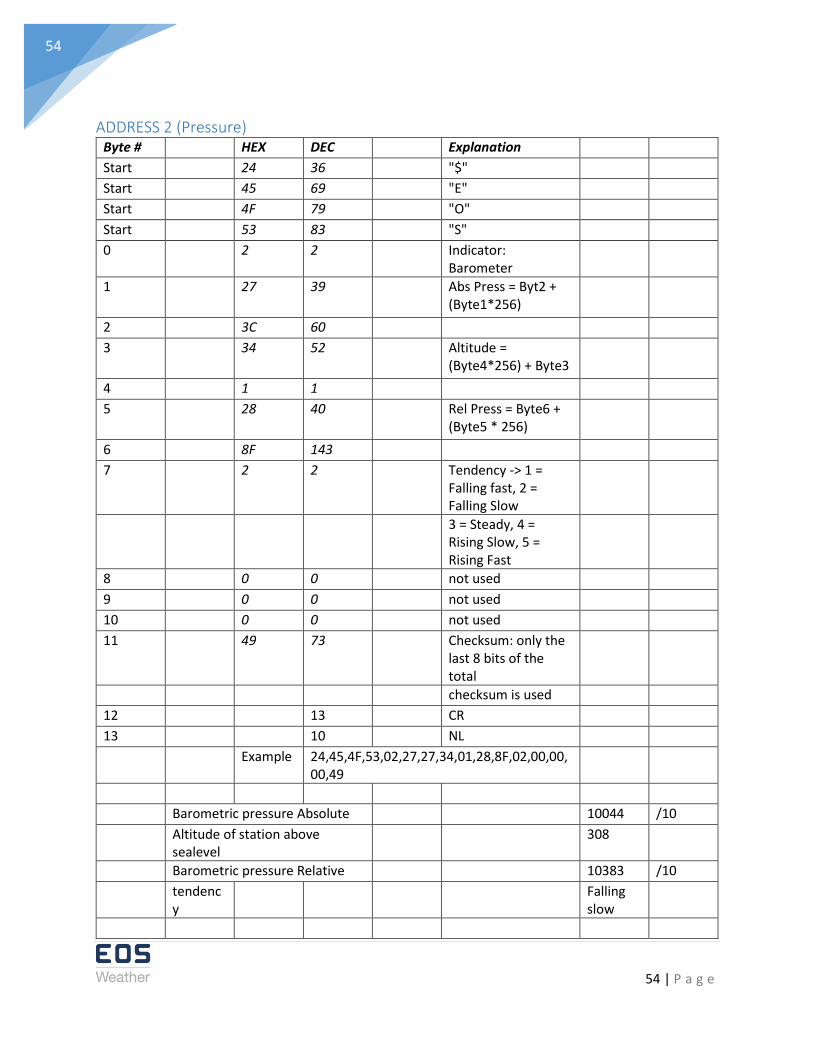
ADDRESS 2 (Pressure) Byte # HEX DEC Explanation
Start 24 36 "$"
Start 45 69 "E"
Start 4F 79 "O"
Start 53 83 "S"
0 2 2 Indicator: Barometer
1 27 39 Abs Press = Byt2 + (Byte1*256)
2 3C 60
3 34 52 Altitude = (Byte4*256) + Byte3
4 1 1
5 28 40 Rel Press = Byte6 + (Byte5 * 256)
6 8F 143
7 2 2 Tendency -> 1 = Falling fast, 2 = Falling Slow
3 = Steady, 4 = Rising Slow, 5 = Rising Fast
8
0 0
not used
9
0 0
not used
10
0 0
not used
11 49 73 Checksum: only the last 8 bits of the total
checksum is used
12 13 CR
13 10 NL
Example 24,45,4F,53,02,27,27,34,01,28,8F,02,00,00,00,49
Barometric pressure Absolute
10044 /10
Altitude of station above sealevel
308
Barometric pressure Relative
10383 /10
tendency
Falling slow

55 | P a g e
55
ADDRESS 3 (Temperature)
Byte # HEX DEC Explanation
Start 24 36 "$"
Start 45 69 "E"
Start 4F 79 "O"
Start 53 83 "S"
0 3 3 Indicator: Outside Temp, Dewpoint, Rel. Humidity
1 1E 30 Outside Temp (digits)
2 2 2 Outside Temp (tenths)
3 22 34 Dew point (digits
4 6 6 Dew point (tenths)
5 49 73 Rel. Humidity
6 0 0 bit 0 = 1 -> Ouside temp neg
7 1 1 bit 0 = 1 -> Dew temp neg
8
0 0
not used
9 2 2 Temperature Trends 0 = down, 1 = steady, 2 = up
10
0 0
Temp Indication 0 = celcius, 1 = Fahrenheit
11 A2 162 Checksum: only the last 8 bits of the total
checksum is used
12 13 CR
13 10 NL
Example 24,45,4F,53,03,01,2E,01,32,49,00,00,00,02,00,BB
Outside Temp
30.2 Degrees Celcius

56 | P a g e
56
Dewpoint
-34.6 Degrees
Celcius
Relative Humidity
73 percent
Temperature trend
Rising
ADDRESS 4 (Rain)
Byte # HEX DEC Explanation
Start 24 36 "$"
Start 45 69 "E"
Start 4F 79 "O"
Start 53 83 "S"
0 4 4 Indicator: Rain
1 6 6 Rain Rate (Digits) in mm
2 5 5 Rain Rate (tenths)
3 6 6 Rain fall Today (digits) in mm
4 43 67 Rainfall Today (tenths)
5 2 2 Rainfall Yesterday (digits)
6 A 10 Rainfall Yesterday (tenths)
7 32 50 Number of rain tips (tens and digits)
8 6 6 Number of rain tips (hundreds and thousands)
9
0 0
not used
10
0 0
not used
11 13 19 Checksum: only the last 8 bits of the total
checksum is used

57 | P a g e
57
12 13 CR
13 10 NL
Example 24,45,4F,53,04,06,16,38,0,0,0,0,0,0,0,64
Rain rate
6.5 mm per hour
Rain fall today
6.67 mm (reset at 00:00)
Rain fall Yesterday
2.1 mm
number of raintips
650
ADDRESS 5 (Solar)
Byte # HEX DEC Explanation
Start 24 36 "$"
Start 45 69 "E"
Start 4F 79 "O"
Start 53 83 "S"
0 4 5 Indicator: Sunlight, UV, visibility
1
0
2
0
3
0
4
0
5
0
6
0
7
0 0
not used
8
0 0
not used
9
0 0
not used
10
0 0
not used
11 B8 184 Checksum: only the last 8 bits of the total
checksum is used
12 13 CR

58 | P a g e
58
13 10 NL
Example 24,45,4F,53,04
ADDRESS 6 (Board)
Byte # HEX DEC Explanation
Start 24 36 "$"
Start 45 69 "E"
Start 4F 79 "O"
Start 53 83 "S"
0 6 6 Indicator: station status
1
1 1
station #
2
1 1
station type
3
C 12
Battery / Supply voltage Digits
4
8 8
Battery / Supply voltage Tenths
5
17 23
cabinet temperature
6
0 0
Cabinet temperature Negative (if bit = 1, temp neg)
7 0 0 Error Byte L
8 0 0 Error Byte H
9
3 3
Version number Digits
10
13 19
Version number tenths
11 52 82 Checksum: only the last 8 bits of the total
checksum is used
12 13 CR
13 10 NL
Example 24,45,4F,53,06,01,01,12,08,23,00,
Station#
1
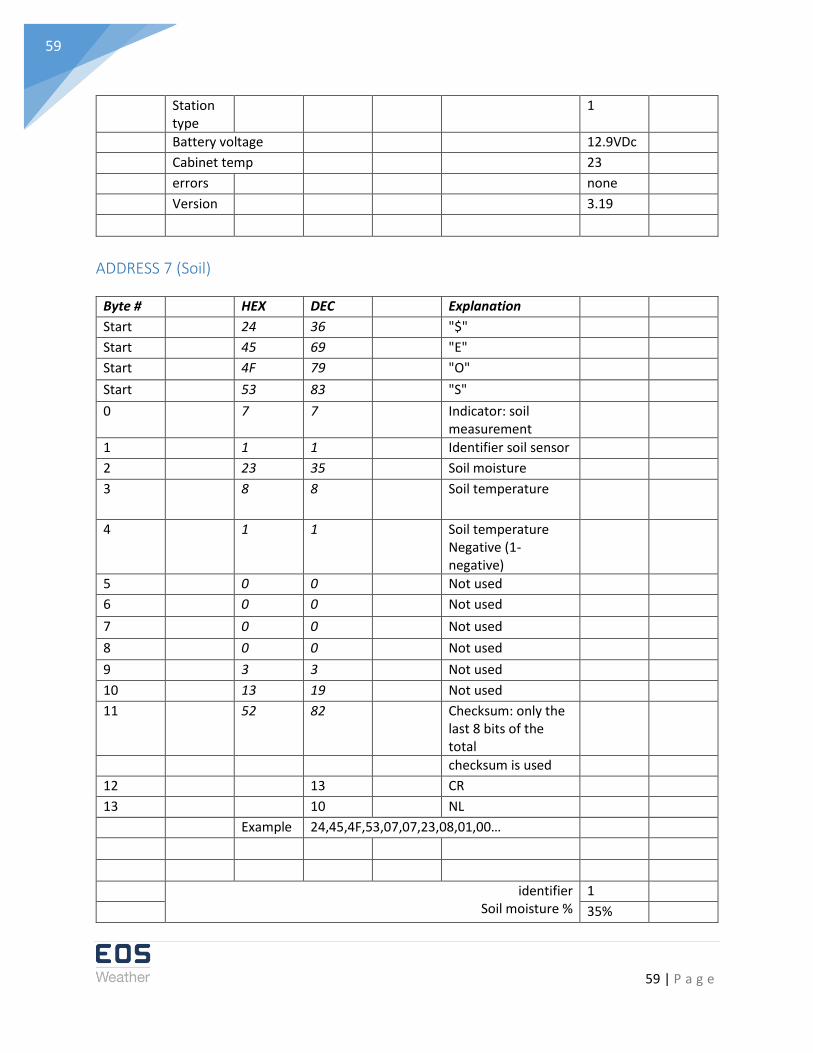
59 | P a g e
59
Station type
1
Battery voltage
12.9VDc
Cabinet temp
23
errors
none
Version
3.19
ADDRESS 7 (Soil)
Byte # HEX DEC Explanation
Start 24 36 "$"
Start 45 69 "E"
Start 4F 79 "O"
Start 53 83 "S"
0 7 7 Indicator: soil measurement
1
1 1
Identifier soil sensor
2
23 35
Soil moisture
3
8 8
Soil temperature
4
1 1
Soil temperature Negative (1-negative)
5
0 0
Not used
6
0 0
Not used
7 0 0 Not used
8 0 0 Not used
9
3 3
Not used
10
13 19
Not used
11 52 82 Checksum: only the last 8 bits of the total
checksum is used
12 13 CR
13 10 NL
Example 24,45,4F,53,07,07,23,08,01,00…
identifier Soil moisture %
1
35%

60 | P a g e
60
Soil Temp -8
ADDRESS 8 (Tide)
Byte # HEX DEC Explanation
Start 24 36 "$"
Start 45 69 "E"
Start 4F 79 "O"
Start 53 83 "S"
0 8 8 Indicator: Tide
1
1 1
Identifier tide sensor
2
3 3
Height = Byte2 + (Byte1 * 256)
3
FC 252
4
1 1
Tendency: 1 rising, 2;steady, 3;dropping
5
0 0
Not used
6
0 0
Not used
7 0 0 Not used
8 0 0 Not used
9
0 0
Not used
10
0 0
Not used
11 52 82 Checksum: only the last 8 bits of the total
checksum is used
12 13 CR
13 10 NL
Example 24,45,4F,53,08,01,03,FC,01,00…
ID # Depth / Height in CM
Trendy
1
1020
Rising

61 | P a g e
61