Software Assistance for Preoperative Risk Assessment and...
196
Software Assistance for Preoperative Risk Assessment and Intraoperative Support in Liver Resection Surgery by Christian Hansen A PhD thesis submitted in partial fulfillment of the requirements for the degree of Doctor of Philosophy in Computer Science at the School of Engineering and Science, Jacobs University Bremen. Dissertation Committee: Prof. Dr.-Ing. Horst K. Hahn (Dissertation Advisor) School of Engineering and Science, Jacobs University Bremen, Germany Prof. Dr.-Ing. Lars Linsen School of Engineering and Science, Jacobs University Bremen, Germany Prof. Dr.-Ing. Bernhard Preim Department of Computer Science, University of Magdeburg, Germany Date of Defense: May 10, 2012
-
Upload
nguyendung -
Category
Documents
-
view
218 -
download
0
Transcript of Software Assistance for Preoperative Risk Assessment and...

Software Assistance for Preoperative RiskAssessment and Intraoperative Support
in Liver Resection Surgery
by Christian Hansen
A PhD thesis submitted in partial fulfillment of the requirements for the degreeof Doctor of Philosophy in Computer Science at the School of Engineering and
Science, Jacobs University Bremen.
Dissertation Committee:
Prof. Dr.-Ing. Horst K. Hahn (Dissertation Advisor)School of Engineering and Science, Jacobs University Bremen, Germany
Prof. Dr.-Ing. Lars LinsenSchool of Engineering and Science, Jacobs University Bremen, Germany
Prof. Dr.-Ing. Bernhard PreimDepartment of Computer Science, University of Magdeburg, Germany
Date of Defense: May 10, 2012

Hansen, Christian (Dipl.-Ing.):Software Assistance for Preoperative Risk Assessmentand Intraoperative Support in Liver Resection SurgeryDissertation, Jacobs University Bremen, GermanyBremen, June 22, 2012.

Notes on Reading this Work
Expressions in bold are important for understanding the subsequent sections andchapters. In addition, this emphasizes comparisons or helps explain terms. A list ofabbreviations and symbols is provided in the appendix.
This thesis has been written independently, except where sources and collaborationsare acknowledged, and has not been submitted at another university for the conferralof a degree. Parts of this thesis are based on previously published material or materialthat is prepared for publication at the time of this writing. Previous publicationsare mentioned at the end of each chapter and a complete list can be found in theappendix.
iii


Abstract
This thesis contributes to the field of computer-assisted liver surgery witha focus on surgical planning and intraoperative support. Resection planningfor liver surgery has become an essential tool in the clinical routine. Based on
3D reconstructions from radiologic images of the patient, different resection plans canbe simulated and assessed before an intervention. During an intervention, surgicalnavigation systems align the planning information with the patient’s liver and thussupport the realization of a preoperative plan.
New techniques for preoperative risk assessment in liver surgery are presentedin this work. Thereby, the determination of safety margins around tumors is addressedwhich is a challenging task for surgeons. The spatial relation of tumors to theintrahepatic vascular anatomy and the amount of remnant liver volume are importantfactors when deciding whether a tumor-free safety margin can be achieved. Besides amethod to define safety margins with uniform width, a method to define non-uniformsafety margins is proposed while considering robustness and sensitivity of vascularrisk.
In addition, techniques for intraoperative support of liver interventions areintroduced. First, the intraoperative adaptation of surgical planning data is focused.A software assistant to quickly adapt risk analyses and resection proposals in case ofintraoperatively detected findings is presented. In this context, appropriate interfacesfor surgeon-computer interaction and an approach for automatic generation of virtualresection surfaces are proposed. Second, new visualization techniques designedfor intraoperative use are addressed. Intraoperative visualizations have to followspecific requirements such as the workflow and cognitive load of the surgeon, whichtogether call for a context-driven reduction of complexity and a focus on criticalareas. Therefore, surgical risk maps and an approach for illustrative augmentedreality are presented. The developed visualization techniques provide a new andobjective basis for the assessment of risks during liver surgery. Third, new techniquesfor auditory support for navigated liver surgery are introduced. Auditory supporthas the potential to reduce the dependency on visual presentations and freeing thesurgeon to focus attention on the situs rather than on a monitor.
The transfer of these methods from academic research to applicability in clinicalroutine was an important goal of this dissertation project. A great value was seton including clinicians in the development process by using their feedback to definedesign requirements, creating new concepts, and finally evaluating the developedmethods in a clinical environment. Therefore, the development was accompanied bya number of clinically oriented tests.
v


Table of Contents
Notes on Reading this Work . . . . . . . . . . . . . . . . . . . . . . . . . . iii
Abstract . . . . . . . . . . . . . . . . . . . . . . . . . . . . . . . . . . . . . v
Table of Contents . . . . . . . . . . . . . . . . . . . . . . . . . . . . . . . . vii
1 Introduction 1
1.1 Medical Background . . . . . . . . . . . . . . . . . . . . . . . . . . . 2
1.2 Challenges and Contributions . . . . . . . . . . . . . . . . . . . . . . 2
1.3 Structure of this Thesis . . . . . . . . . . . . . . . . . . . . . . . . . . 3
2 Fundamentals 5
2.1 Clinical Background: The Human Liver . . . . . . . . . . . . . . . . . 6
2.1.1 Anatomy and Function . . . . . . . . . . . . . . . . . . . . . . 6
2.1.2 Liver Cancer . . . . . . . . . . . . . . . . . . . . . . . . . . . 7
2.1.3 Treatment of Liver Cancer . . . . . . . . . . . . . . . . . . . . 7
2.2 Computer-Assisted Liver Surgery . . . . . . . . . . . . . . . . . . . . 9
2.2.1 Preoperative Decision Pipeline . . . . . . . . . . . . . . . . . . 9
2.2.2 Surgical Planning for Liver Surgery . . . . . . . . . . . . . . . 14
2.2.3 Intraoperative Decision Pipeline . . . . . . . . . . . . . . . . . 23
2.2.4 Navigated Liver Surgery . . . . . . . . . . . . . . . . . . . . . 25
2.3 Concluding Remarks . . . . . . . . . . . . . . . . . . . . . . . . . . . 35
3 Interactive Determination of Safety Margins 37
3.1 Clinical Background: Safety Margins . . . . . . . . . . . . . . . . . . 38
3.2 Purpose . . . . . . . . . . . . . . . . . . . . . . . . . . . . . . . . . . 38
3.3 Related Work . . . . . . . . . . . . . . . . . . . . . . . . . . . . . . . 39
3.4 Interactive Determination of Safety Margins . . . . . . . . . . . . . . 40
3.4.1 Safety Maps . . . . . . . . . . . . . . . . . . . . . . . . . . . . 40
3.4.2 Interactive Visualization of Vascular Risk . . . . . . . . . . . . 41
vii

Table of Contents
3.4.3 Combination of Vascular Risk . . . . . . . . . . . . . . . . . . 43
3.5 Evaluation . . . . . . . . . . . . . . . . . . . . . . . . . . . . . . . . . 45
3.6 Results . . . . . . . . . . . . . . . . . . . . . . . . . . . . . . . . . . . 50
3.7 Discussion and Conclusion . . . . . . . . . . . . . . . . . . . . . . . . 60
3.8 Outlook: Non-Uniform Safety Margins . . . . . . . . . . . . . . . . . 62
4 Intraoperative Adaptation of Planning Data 69
4.1 Clinical Background and Purpose . . . . . . . . . . . . . . . . . . . . 70
4.2 Related Work . . . . . . . . . . . . . . . . . . . . . . . . . . . . . . . 70
4.3 The Intraoperative Planning Assistant . . . . . . . . . . . . . . . . . 72
4.3.1 Adaptation of Oncologic Risk Analyses . . . . . . . . . . . . . 73
4.3.2 Adaptation of Resection Proposals . . . . . . . . . . . . . . . 75
4.4 Evaluation . . . . . . . . . . . . . . . . . . . . . . . . . . . . . . . . . 81
4.5 Results . . . . . . . . . . . . . . . . . . . . . . . . . . . . . . . . . . . 84
4.6 Discussion and Conclusion . . . . . . . . . . . . . . . . . . . . . . . . 86
4.7 Outlook: Automatic Generation of Resection Proposals . . . . . . . . 87
5 Surgical Risk Maps 95
5.1 Purpose . . . . . . . . . . . . . . . . . . . . . . . . . . . . . . . . . . 97
5.2 Related Work . . . . . . . . . . . . . . . . . . . . . . . . . . . . . . . 97
5.3 Risk Maps for Liver Surgery . . . . . . . . . . . . . . . . . . . . . . . 98
5.3.1 Identification of Critical Structures . . . . . . . . . . . . . . . 98
5.3.2 Visualization of Critical Areas and Resection Portals . . . . . 101
5.3.3 Visualization of Shape and Spatial Depth . . . . . . . . . . . . 101
5.4 Evaluation . . . . . . . . . . . . . . . . . . . . . . . . . . . . . . . . . 103
5.5 Results . . . . . . . . . . . . . . . . . . . . . . . . . . . . . . . . . . . 106
5.6 Discussion and Conclusion . . . . . . . . . . . . . . . . . . . . . . . . 108
6 Illustrative Augmented Reality 113
6.1 Purpose . . . . . . . . . . . . . . . . . . . . . . . . . . . . . . . . . . 114
6.2 Related Work . . . . . . . . . . . . . . . . . . . . . . . . . . . . . . . 114
6.3 Illustrative AR for Liver Surgery . . . . . . . . . . . . . . . . . . . . 117
6.3.1 Distance-Encoding Silhouettes . . . . . . . . . . . . . . . . . . 118
6.3.2 Distance-Encoding Surfaces . . . . . . . . . . . . . . . . . . . 119
6.3.3 Contour Lines for Resection Surfaces . . . . . . . . . . . . . . 120
viii

Table of Contents
6.4 Evaluation . . . . . . . . . . . . . . . . . . . . . . . . . . . . . . . . . 120
6.5 Results . . . . . . . . . . . . . . . . . . . . . . . . . . . . . . . . . . . 123
6.6 Discussion and Conclusion . . . . . . . . . . . . . . . . . . . . . . . . 126
7 Auditory Resection Guidance 129
7.1 Purpose . . . . . . . . . . . . . . . . . . . . . . . . . . . . . . . . . . 130
7.2 Related Work . . . . . . . . . . . . . . . . . . . . . . . . . . . . . . . 130
7.3 Materials and Methods . . . . . . . . . . . . . . . . . . . . . . . . . . 131
7.3.1 Navigation System: CAS-One . . . . . . . . . . . . . . . . . . 131
7.3.2 The Auditory Feedback Engine . . . . . . . . . . . . . . . . . 132
7.3.3 Auditory Resection Guidance . . . . . . . . . . . . . . . . . . 132
7.4 Evaluation . . . . . . . . . . . . . . . . . . . . . . . . . . . . . . . . . 135
7.5 Results . . . . . . . . . . . . . . . . . . . . . . . . . . . . . . . . . . . 138
7.6 Discussion and Conclusion . . . . . . . . . . . . . . . . . . . . . . . . 138
8 Conclusion 143
Appendix
Acknowledgement . . . . . . . . . . . . . . . . . . . . . . . . . . . . . . . . 149
List of Abbreviation . . . . . . . . . . . . . . . . . . . . . . . . . . . . . . 151
List of Symbols . . . . . . . . . . . . . . . . . . . . . . . . . . . . . . . . . 153
Specification of used Hardware . . . . . . . . . . . . . . . . . . . . . . . . 155
Questionaires . . . . . . . . . . . . . . . . . . . . . . . . . . . . . . . . . . 157
List of Own Publications . . . . . . . . . . . . . . . . . . . . . . . . . . . . 165
Bibliography . . . . . . . . . . . . . . . . . . . . . . . . . . . . . . . . . . 167
ix

1 Introduction
Curiosity is always the starting point forsolutions to a problem.
(Galileo Galilei)
For thousands of years, humans tried to understand the anatomy andfunction of the human liver. The introduction of radiological imaging in the20th century provided completely new insights into anatomy. This led to
significant improvements in many surgical procedures. In liver surgery, 3D models cannow be produced from scan data, allowing surgeons to see the position of tumors andtheir relation to vascular structures. Based on these patient-individual models, thisthesis introduces novel techniques for preoperative risk assessment and intraoperativesupport in liver surgery.
1

Chapter 1. Introduction
1.1 Medical Background
The liver (gr. hepar) is an essential organ with a complex vascular anatomy. Unfor-tunately, it is also an organ frequently affected by tumors. If tumors in the liver areremoved by a surgeon, the vascular anatomy must be preserved as much as possiblewhile ensuring an adequate safety margin around tumors. This becomes difficult if aliver contains multiple tumors or if tumors are located centrally or close to majorvessels.
Physicians employ x-ray computed tomography (CT) or magnetic resonance (MR)imaging to gain information about the patient’s liver anatomy and pathology. Basedon these images, surgical planning software provides 3D models of a patient. Thisadditional information assists radiologists and surgeons in choosing a resectionstrategy [Lang et al., 2005]. Once the planning is performed, surgeons would liketo utilize the planning data during an intervention. Therefore, surgical navigationsystems align the planning information with the patient’s liver and thus support therealization of a preoperative plan. Based on preoperative planning models, thesenavigation systems have the potential to support intraoperative decision makingduring liver resection.
1.2 Challenges and Contributions
A great challenge in liver surgery is the optimal planning of resection strategies.This involves the definition of a virtual resection surface, which divides the liver ina remnant part and a part to be resected. Due to better outcomes in metastasistreatment using modern chemotherapy, surgical trends have recently changed towardssmaller resection volumes [Lang et al., 2010]. For this reason, the determinationof optimal safety margins around tumors has become increasingly important.This is particularly true for patients with potentially insufficient postoperative livervolume. A software assistant to quickly determine safety margins based on the riskdistribution of vascular supply and drainage is therefore presented in this work.
Once a surgeon has defined a resection strategy with the planning software,it seems to be obvious to use this plan in the operating room during surgery.However, using intraoperative ultrasound (IOUS) during oncological interventions,between 19% and 33% of patients with primary liver malignancies or metastasesshow additional tumors [Ellsmere et al., 2007; Sietses et al., 2010; Shah et al., 2010].Intraoperative changes to the resection strategy may be necessary, especially if thenew tumors are adjoined to hepatic vessels. Therefore, techniques for the adaptationof preoperative planning data in case of additional intraoperative findings wouldbe beneficial. Besides a fast and reliable adaptation method, the design of surgeon-computer interfaces should allow usage in the sterile area of an operating room.This functionalities are provided by a software assistant for intraoperative planningadaptation which is introduced in this thesis. In addition, techniques for automaticadaptation of resection proposals are proposed.
2

1.3. Structure of this Thesis
Another challenge in liver surgery is the appropriate presentation of planningmodels in the operating room. Although software assistants for surgical planningare utilized before an intervention, the intraoperative presentation of planning modelshas thus far been limited. One reason is that these models were not developedto provide information in complex workspaces like the operating room. In thisthesis, different means of intraoperative representation (visual and auditive) areintroduced, analyzed, and evaluated. The proposed intraoperative representationsreduce the complexity of planning data by simultaneously enhancing surgicallyrelevant information.
The methods proposed in this thesis have investigated in collaboration with theUniversity of Lubeck (Institute for Robotics and Cognitive Systems), the TechnicalUniversity of Munich (Institute of Micro Technology and Medical Device Technology),and the University of Bern (Center for Biomedical Engineering Research). Whilethe work in Munich and Bern focuses on the development of a navigation system foropen liver surgery, the group from the University of Lubeck is developing a systemfor navigated laparoscopic liver surgery. The methods implemented in the context ofthis dissertation project are embedded in clinical software prototypes with a directinterface to the navigation systems mentioned above.
In addition, clinicians were included in the development and evaluation process.Their feedback was used to define and to refine design requirements, improve concepts,and verify the methods in a clinical environment. The developed techniques wereevaluated in collaboration with the surgical departments of General Hospital Celle,Asklepios Clinic Barmbek, University Hospital Lubeck, and Robert-Bosch HospitalStuttgart.
1.3 Structure of this Thesis
This thesis is structured as follows. After a report of fundamentals (Chapter 2), newtechniques for preoperative risk assessment and intraoperative support are introduced.The proposed techniques are described with examples in liver resection surgery.
• Chapter 3 introduces techniques for interactive determination of safetymargins around tumors based on patient-individual vascular risk distribution.Thereby, the determination of both uniform and non-uniform margins isaddressed.
• Chapter 4 describes new methods for intraoperative adaptation of thesurgical planning data. A tool to quickly adapt risk analyses and resectionplans in case of intraoperatively detected tumors is proposed. In this context,appropriate interfaces for surgeon-computer interaction are discussed.
• Chapter 5 introduces a new visual representation of surgical planning data,called risk maps. The technique is based on an analysis of critical structures
3

Chapter 1. Introduction
in the proximity of a planned resection surface. Distances and depth cuesare visually enhanced while model complexity is reduced.
• Chapter 6 presents visualization methods for augmented reality (AR) insurgery. To improve the understanding of spatial relations and depth, illus-trative visualization methods for 3D planning models are proposed.
• Chapter 7 proposes methods for auditory support in navigated liver surgery.An auditory display system for open liver surgery is introduced for providingsupport in guiding the tracked instrument towards and remaining on apredefined resection surface.
Clinically oriented test and evaluations are reported in respective chapters. Finally,conclusions with respect to the objectives of this thesis are drawn, and suggestionsfor further research are provided (Chapter 8).
4

2 Fundamentals
I never told anyone about my work; I toldmy wife that when people found out whatI was doing, they would think I went crazy.
(Wilhelm Conrad Rontgen)
The discovery of radiological imaging by Wilhelm Conrad Rontgen in theyear 1895 opened completely new possibilities for medicine. More than onehundred years later, medical diagnosis and treatment without the support
of radiologic imaging is unimaginable. The invention of CT scanners by God-frey Hounsfield and colleagues in 1971 enabled physicians to examine the internalstructures of the liver in detail without the loss of blood. Based on these images,anatomist such as Claude Couinaud created a new understanding of liver surgery.Computer-assisted liver surgery performed today is based on modern radiologicimaging, advanced surgical instruments, navigation technology, and complex 3Dmodels of patient livers.
This chapter provides fundamentals that are essential to understand and classifythe new techniques described in the subsequent chapters. It starts with an overviewof the human liver. In addition to liver anatomy and function, cancer diseases andtheir medical treatment are addressed. Subsequently, an overview of the state of theart in computer-assisted liver surgery is given. In this context, a surgical decisionpipeline with regard to computer-assisted liver surgery is outlined and discussed.Finally, the chapter is summarized and conclusions are drawn.
5

Chapter 2. Fundamentals
2.1 Clinical Background: The Human Liver
2.1.1 Anatomy and Function
The liver (gr. hepar) is the largest gland in the human body located in the right-upperquadrant of the abdominal cavity below the diaphragm and right of the stomach. Ithas a complex vascular anatomy with a dual blood supply and systems to drain bileand blood:
• The portal vein (PV) caries nutrient-rich blood from the abdominal organsinto the liver. Unfortunately, tumor cells can also spread from these organsthrough the portal vein into the liver parenchyma, which makes the liver afrequent site of metastatic cancer.
• The hepatic artery (HA) delivers blood from the aorta. Oxygen is providedfrom both sources. Approximately half of the liver’s oxygen is provided bythe portal vein, and half is provided by the hepatic artery [Kleinman et al.,2008].
In addition, the liver contains two drainage systems.
• The hepatic vein (HV) drains blood into the vena cava, which connectswith the right atrium of the heart. It is divided in three main branchesthe right hepatic vein (RHV), the middle hepatic vein (MHV), and the lefthepatic vein (LHV).
• The biliary duct (BD) is responsible for draining bile, which is producedby the liver cells and flows into the main bile duct and the gallbladder.
All vessels are organized in a finely branched, interwoven system inside the liverparenchyma. Based on this vascular anatomy, a numbering system developed byCouinaud [1954] is nowadays applied internationally and provides standardizedidentification of liver segments. It divides the liver into eight segments by threelongitudinal planes (through the right, middle, and left hepatic veins) and onetransverse plane (cf. Figure 2.1). The Couinaud model assumes that these segmentshave vascular inflow, outflow, and biliary drainage and can each be resected withoutdamaging the remaining segments [Brant et al., 1999]. However, studies based onCT imaging have shown that number, volume, and shape of liver segments showsignificant variation between patients [Fasel et al., 1998; Fischer et al., 2002].
The human liver performs a variety of very important functions. It synthesizes,processes, and stores substances that are essential for normal body function. Mainliver functions include:
• metabolism of carbohydrates, proteins, fats
• bile production and excretion
6

2.1. Clinical Background: The Human Liver
• storage of glycogen, vitamins, iron
• formation and destruction of certain blood components
• detoxification and excretion of harmful substances
• heat production [Walsh et al., 2007]
Most of the functions are controlled on a cellular level by the liver cells, calledhepatocytes. Hepatocytes account for approximately 80% of the liver mass andexhibit unrivaled complexity and diversity of functions [Maurel, 2010]. Anotherinteresting type of cell in the liver is the Kupffer cell. Kupffer cells are specializedmacrophages responsible for cleaning the blood of products of metabolism, bacterias,and overaged erythrocytes. For further information about liver histology, refer tothe books of Amenta [1997] and Maurel [2010].
2.1.2 Liver Cancer
The human liver is an organ frequently affected by tumors. An essential distinctionis made between benign and malignant tumors. While benign liver tumors such ascysts or hemangiomas are often asymptomatic and do not require medical treatment,malignant liver tumors can be life-threatening. Malignant tumors are subdividedinto primary and secondary tumors. Primary tumors grows at the organ wheretumor progression began, whereas secondary tumors (also called metastases) arethe spread of tumor cells from one organ to another.
The hepatocellular carcinoma (HCC), a primary malignant liver tumor, isthe third most common cause of death from cancer worldwide [Ferlay et al., 2010].According to the most recently published GLOBOCAN global analysis, the regions ofhighest incidence are Eastern and Southeastern Asia as well as Middle and WesternAfrica. Low rates are reported in developed regions, with the exception of SouthernEurope [Ferlay et al., 2010]. Besides primary liver cancer, liver metastases are thesecond most common tumor type in Germany [Neumann et al., 2010]. Althoughuntreated patients with liver metastases have poor prognoses (median time todeath ≈ 6.9 month [Scheele et al., 1990]), the 5-year survival rates for patientswho have undergone surgical resection is reported between 23 and 51% in recentstudies [Vigano et al., 2008; Brouquet et al., 2011; Swan et al., 2011] dependingon the number and diameter of metastases as well as the amount of infiltrationinto other organs. However, 5-year survial does not mean that the cancer is healedbecause approximately one-third of actual 5-year survivors suffer cancer-relateddeath [Pulitano et al., 2010].
2.1.3 Treatment of Liver Cancer
A potential curative treatment of liver cancer is the surgical resection of tumors. Theoptimal prognosis of the patient is the complete resection of the tumor including a
7

Chapter 2. Fundamentals
tumor-free safety margin (called R0 resection). There are two kinds of resectiontypes in oncologic liver surgery:
(1) Anatomical Resections
(2) Non-Anatomical Resections
Whereas resection surfaces for anatomical resection are based on the boundariesthe liver segments defined by the portal vein (cf. Fig. 2.1), resection surfaces fornon-anatomical resection, e.g., wedge resections, do not consider these anatomicalboundaries. Anatomical resections can be further divided into following types:
• Single-Segment Resection
• Bi-Segment Resection
– Right Posterior Sectionectomy (Segments VII, VIII)
– Left Posterior Sectionectomy (Segments II, III)
• Hemihepatectomy
– Right Hemihepatectomy (Segments V-VII ±I without MHV)
– Extended Right Hemihepatectomy (Segments V-VII ±I with MHV)
– Left Hemihepatectomy (Segments II-IV ±I without MHV)
– Extended Left Hemihepatectomy (Segments II-IV ±I with MHV)
• Trisectionectomy
– Right Trisectionectomy (Segments I, IV-VIII)
– Left Trisectionectomy (Segments I-VI)
• Central Resection (Segments IV,V,VIII ±I )
The decision about the resection of segment I often has to be decided individually,depending on the location and type of tumor. The described classification is similarto the nomenclature reported in Lang et al. [2005] and the IHPBA Brisbane 2000Terminology of Liver Anatomy and Resections [IHPBA, 2000]. The main differenceslie in the definition of extended hemihepatectomies. Clinical feedback concerningvirtual resection proposals revealed that many surgeons desire a consideration of theMHV [Wendt, 2011]. Existing nomenclatures do not cover this aspect. Therefore,these nomenclatures are slightly changed and extended within the scope of this thesis.
Although recent studies report that only 10 to 20% of patients are candidates forsurgical resection [Neumann et al., 2010], the number of patients with resectabletumors can be expanded significantly by increasing hepatic reserve (e.g., portalvein embolization, two-stage hepatectomy), combining resection with ablation, anddecreasing tumor size (preoperative chemotherapy) [Pawlik et al., 2008]. Besides
8

2.2. Computer-Assisted Liver Surgery
the aforementioned therapies, liver transplantation is a curative surgical option forpatients with cirrhosis and/or HCC. However, due to donor shortages and the highmedical expense of this therapy, liver transplantation is not an option for manypatients.
Beside these two curative liver cancer therapies, several palliative therapies exist.Brachytherapy, for instance, is based on the precise placement of radiation sourcesin the tumor area. In addition, a wide range of ablation techniques, such as radio-frequency ablation, laser ablation, or microwave ablation, are applied to destroytumor cells locally. However, incomplete ablation of liver tumors due to insufficienttechnology of ablation needles, tissue cooling by the neighboring blood vessels, largetumor masses, and ablation of tumors in close vicinity to heat sensitive organsremain difficult tasks in this context [Kunzli et al., 2011]. Nevertheless, with thedevelopment of preoperative simulations for heat propagation [Kroger et al., 2010],intraoperative imaging and navigation support [Bale et al., 2010], ablation therapieshave significantly improved and are candidates for curative liver cancer treatment.
According to interviewed surgeons, the selection of an optimal cancer therapy fora specific patient is often difficult. A recent study by Nathan et al. [2011] showedthat the choice of cancer therapy in the liver (liver resection, liver transplantation,and tumor ablation) depends more heavily on the surgeon’s specialty than on clinicalfactors.
2.2 Computer-Assisted Liver Surgery
Computer-assisted liver surgery represents a set of methods which use computertechnology to support preoperative planning, the actual surgery, and postoperativeassessment (cf. Fig. 2.2). This section reviews the state of the art in computer-assisted liver surgery while focusing on preoperative and intraoperative support.Before each section concerning the state of the art, the decision pipelines for bothpreoperative planning and intraoperative realization are described.
Methods in the field of computer-assisted liver surgery can be divided into twogroups. The first group represents methods that are already part of current softwareassistants and have been successfully used in clinical routines (e.g., semi-automaticsegmentation of anatomical structures). Clinical feedback concerning these methodshas led to further improvements and constructive research (e.g., fully automaticsegmentation methods). The second group represents methods that are nowadaysonly available in a small number of specialized clinics (e.g., intraoperative adaptationof planning data) and represent a new field of research in computer-assisted liversurgery.
2.2.1 Preoperative Decision Pipeline
When a patient is diagnosed with a malignant tumor, a wide range of essentialdecisions has to be made by the physicians involved. For the design of surgial
9

Chapter 2. Fundamentals
IV
II
III
V
VI
VIIVIII
I
Left HemihepatectomyRight Hemihepatectomy
Extended Right Hemihepatectomy
Extended Left Hemihepatectomy
Central Resection
Right Trisectionectomy
Left Trisectionectomy
Right Posterior Sectionectomy
Left Lateral Sectionectomy
Bile DuctPortal Vein
Hepatic Artery
Left and MiddleHepatic Vein
Gallbladder
Right Hepatic Vein
Figure 2.1: Illustration of the human liver with its vascular systems, i.e, portalvein, hepatic vein, hepatic artery, and bile duct (Image adapted fromKaraliotas et al. [2007]). The liver segments are labeled with romannumbers according to Couinaud [1954]. Associated anatomical resectionstypes are indicated at the bottom.
10

2.2. Computer-Assisted Liver Surgery
Transfer of Planning Data Follow-Up Analaysis
Preoperative Intraoperative Postoperative
Segmentation
Phase Registration
Tumor Quantification
Territory Analysis
Vascular Risk Analysis
Resection Planning
Image Aquisition
Tool Callibration
Tracking
Ultrasound Examination
Resection Guidance
Medical Visualization
Registration
Treatment Evaluation
Planning Adaptation
Interaction &
Figure 2.2: Research topics in the field of computer-assisted liver surgery. The dashedrectangle enhances the area that is addressed within the scope of thisthesis and exhibits a strong relation to the research field of medicalvisualization and surgeon-computer interaction.
planning systems it is essential to understand which decisons need to be made andwhich information is required to support decison making. One of the first decisionsis the choice of the therapy. If surgical resection is possible, this therapy is nowadaysoften the method of choice, because clinical studies indicate the best long-termsurvival rates [Neumann et al., 2010]. According to a review of Grundmann et al.[2008], the decision about surgical resection should be determined using the followingparameters:
(1) General operability of the patient
(2) Achievability of an R0 situation (if necessary, in combination with othercancer therapies such as ablation or chemotherapy)
(3) Sufficient estimated postoperative liver volume (if necessary, in combi-nation with portal vein embolization or two-stage hepatectomy)
(4) The feasibility of preserving two contiguous hepatic segments withadequate vascular inflow and outflow as well as biliary drainage
(5) Biological aspects of the tumor
In addition, they considered the experience of the surgeon and the hospital asimportant parameters for deciding about the resection. While the general operability(1) of liver resections depends mainly on patient anamnesis and the presence of
11

Chapter 2. Fundamentals
additional diseases, biological aspects of the tumor (5) depend on the results ofbiopsy. Support with medical software assistants is limited in these cases. However,decisions (2-4) address aspects that often require extensive anatomical analysis asaccessible by 3D computation.
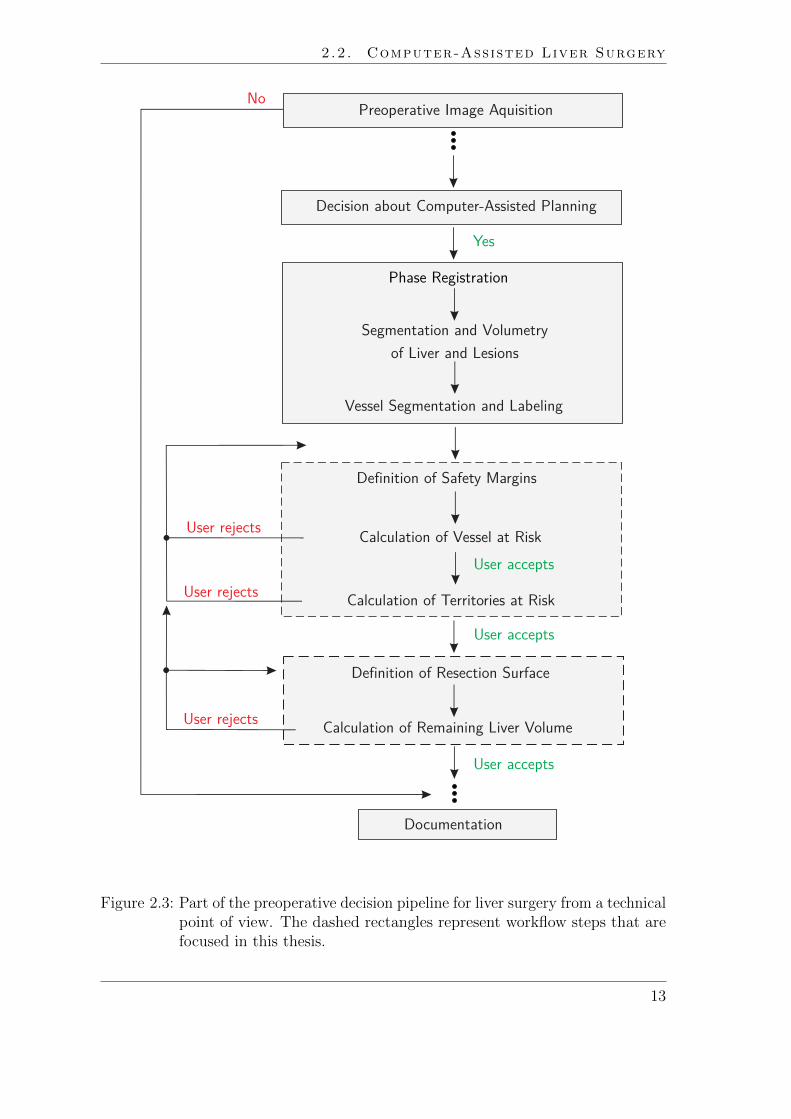
A technical view of steps performed during preoperative decision making is illus-trated in Fig. 2.3. After the preoperative image acquisition, a decision about theneed for a computer-assisted planning needs to be taken. This decision dependson many factors. Besides clinical factors such as the location of tumors and thecomplexity of the planned intervention the decision often depends on personnel orfinancial resources of the hospital.
When a decision has been made in favour of computer-assisted planning, a numberof image-processing steps have to be performed. These tasks include phase regis-tration, segmentation and volumetry of liver and lesions, vessel segmentation andlabeling of vessels. These tasks are usually performed by radiologic technicians.Contributions of surgeons are not required in most cases.
The surgical decision pipeline starts with a preoperative risk analysis. A riskanalysis includes the determination of proper safety margins around tumors. Basedon the widths of safety margins, affected vascular branches and vascular territoriesare calculated. This procedure is called vascular risk analysis. The followingworkflow steps for vascular risk analysis are described by Preim et al. [2002]:
(1) The user selects a lesion and specifies its safety margin.
(2) The system visualizes the margin and all vessels at risk.
(3) The system estimates the affected region of the liver, called territory atrisk.
(4) The user defines a resection surface based on vessels and territories at risk.
(5) The system calculates the percentage of remaining functional liver volume.
If insufficient remaining functional liver volume is calculated in step 5, the user mayreturn to step 1 to decrease the margin size and perform steps 2-5 again. Accordingto Preim et al. [2002], this may increase the chance of recurrence but could be betterthan a palliative treatment in selected cases. For a clinical discussion concerningthe optimal width of safety margins, refer to Sect. 3.1 on page 38. The width of asurgical margin is an important decision in the preoperative planning stage becauseit is related to the achievability of an R0 situation.
Once the vascular risk analysis has been performed, the determination of a virtualresection surface is necessary to estimate the postoperative liver volume and todetermine the cutting direction. However, the definition of an optimal resectionsurface through a liver is not trivial. From the mathematical point of view, this canbe considered a multi-parameter optimization problem. Based on a clinical survey ofliver surgeons, Demedts et al. [2010] defined the following parameters as importantfor the evaluation of virtual resection surfaces:
12
2.2. Computer-Assisted Liver Surgery
User rejects
Segmentation and Volumetryof Liver and Lesions
User accepts
Definition of Resection Surface
Vessel Segmentation and Labeling
Calculation of Remaining Liver Volume
Definition of Safety Margins
Documentation
Phase Registration
Calculation of Vessel at Risk
Calculation of Territories at RiskUser rejects
User rejects
User accepts
User accepts
Decision about Computer-Assisted Planning
Yes
NoPreoperative Image Aquisition
Figure 2.3: Part of the preoperative decision pipeline for liver surgery from a technicalpoint of view. The dashed rectangles represent workflow steps that arefocused in this thesis.
13

Chapter 2. Fundamentals
• Remnant volume in ml
• Safety margin around tumors in mm
• Supplied volume of the remnant liver in %
• Drained volume of the remnant liver in %
• Completely perfused remnant liver in %
• Resection area in cm2
• Curvature of resection surface
These physical values are of interest when defining a virtual resection surface. How-ever, not all parameters are weighted equally. The weights depend on factors suchas tumor type or surgical preference. In most cases, the amount of remnant livervolume and the safety margins around tumors are the most meaningful and essentialparameters.
In surgery, the amount of risk for the patient normally increases with the complexityof the surgical procedure [Zachow et al., 2010]. Therefore, the number of surgicaldecisions to be made and their difficulties vary from patient to patient. Computer-aided surgical planning can provide additional information which may supportsurgeons, especially in complex cases for which a decision is not easily made.
2.2.2 Surgical Planning for Liver Surgery
Which tools are necessary to support preoperative decision making in oncologic liversurgery? In the context of a large national survey [Oldhafer et al., 2002], 92 %of participating surgeons requested a 3D visualization that illustrates the spatialrelations between tumors and vessels, 64% requested tools that allow a simulationof different resection strategies, and 55 % requested that measurements such asvolume, diameter, and distances are included in the visualization. With an optimalintegration of such tools in a clinical workflow, participating surgeons expected abetter assessment of operability (87 %) and an increase of patient safety during theintervention (55%).
Lang et al. [2010] defined two main requirements for planning applications inoncologic liver surgery: The visualization of patient-individual anatomy and theassessment of resectability. The visualization of patient-individual anatomy includesthe illustration of hepatic vessels (PV, HV, HA, BD) and associated vascular territo-ries. The assessment of resectability includes the determination of tumor-free safetymargins and the estimation of remaining liver volume. These two basic requirementsimply many functions that need to be available in planning software. This sectiongives an overview of key components for computer-aided liver surgery planning. Itcovers image acquisition and phase registration, segmentation of anatomical andpathological structures, approximation of vascular territories, risk analysis, andvirtual resection planning.
14

2.2. Computer-Assisted Liver Surgery
Preoperative Image Acquisition
Preoperative imaging is applied several days before surgery for diagnosis and surgicalplanning. Ultrasound is often used for diagnosis. For liver surgery planning, CT orMR imaging is applied. These images build the basis for 3D planning models andfor model-based risk analysis.
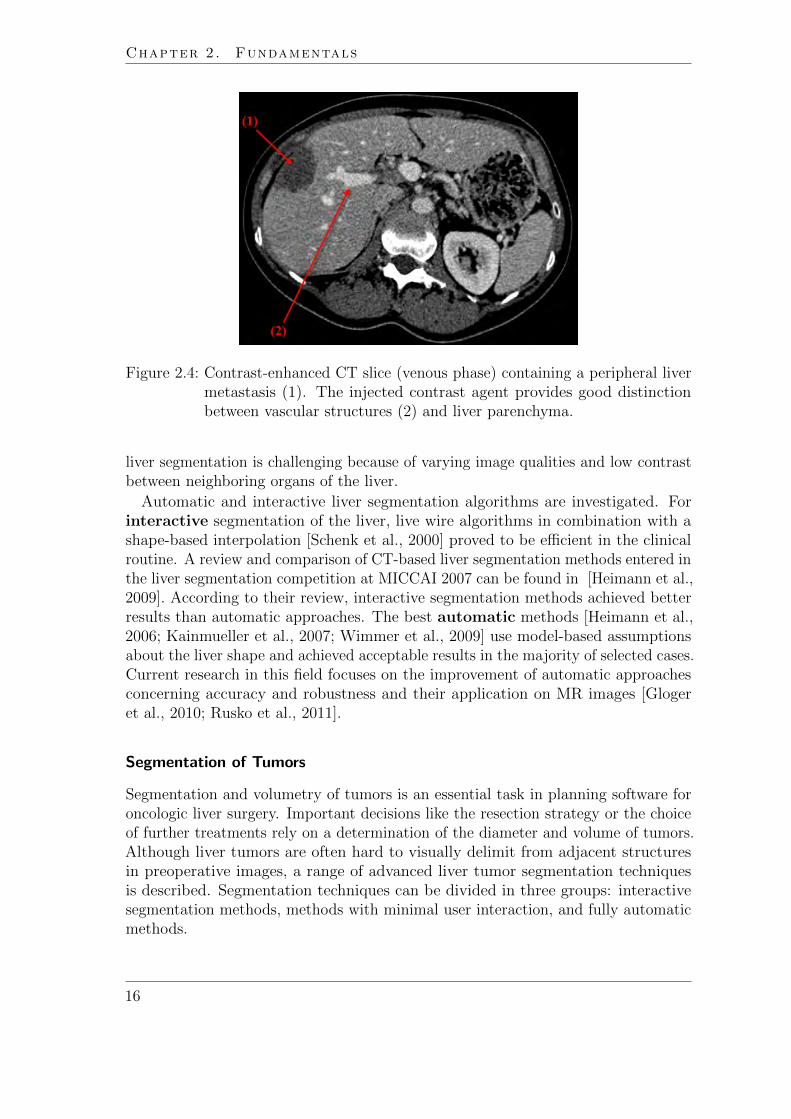
Special contrast agents injected into the patient provide a better visual contrastbetween vascular structures and liver tissue (cf. Fig. 2.4). Wide availability andestablished contrast agents are reasons to prefer a preoperative liver imaging basedon CT. A recent study by Hata et al. [2011] reports a sensitivity of CT to detect livermetastasis around 72 % which decreases to 35% for small lesions with a diameterbelow 1 cm. Consequently, small tumors are often detected only intraoperativelythrough palpation by the surgeon or by using IOUS. Refer to Sect. 4.1 on page 70for more details on intraoperatively detected lesions.
Besides preoperative CT imaging, MR imaging has been increasingly employedin recent years due to the introduction of new liver-specific contrast agents such asGadoxetic acid. Several clinical studies report that MR imaging using liver-specificcontrast agents has a greater sensitivity in visualizing liver tumors than contrast-enhanced CT imaging [Hammerstingl et al., 2008; Motosugi et al., 2011; Baek et al.,2011]. This was found to be particularly true for small liver lesions. Ongoing clinicaltrials will further evaluate advantages and disadvantages of liver-specific contrastagents.
CT or MRI data are acquired in different time phases of contrast propagation.First, the contrast agent reaches arteries, then the portal vein, and finally the hepaticvein. A good contrast-timing is essential to receive an adequate image quality fordiagnostic purposes. The following four phases are common for liver imaging: non-contrast, arterial phase, venous phase, and late phase. Liver arteries are enhanced inthe arterial phase, while veins are not. In addition, portal vein and hepatic vein areenhanced in the venous phase. The visual enhancement of lesions in the image datavaries over all phases depending on the type of lesion and the amount of supplyingblood vessels.
Phase Registration
Due to different respiration states and patient movement during the acquisition phases,the datasets have to be aligned. This is necessary for an exact spatial assessment ofintrahepatic vessels in relation to tumors. In most cases, rigid registration approachesprovide adequate accuracy for surgical planning. The accuracy can be improved byalso utilizing non-rigid registration methods [Lange et al., 2005; Huang et al., 2009].
Segmentation of the Liver
The segmentation of the liver is of utmost importance for preoperative planning. Itprovides the basis for estimating the postoperative liver volume. In combination withvessel segmentation, it allows the approximation of vascular territories. However,
15
Chapter 2. Fundamentals
Figure 2.4: Contrast-enhanced CT slice (venous phase) containing a peripheral livermetastasis (1). The injected contrast agent provides good distinctionbetween vascular structures (2) and liver parenchyma.
liver segmentation is challenging because of varying image qualities and low contrastbetween neighboring organs of the liver.
Automatic and interactive liver segmentation algorithms are investigated. Forinteractive segmentation of the liver, live wire algorithms in combination with ashape-based interpolation [Schenk et al., 2000] proved to be efficient in the clinicalroutine. A review and comparison of CT-based liver segmentation methods entered inthe liver segmentation competition at MICCAI 2007 can be found in [Heimann et al.,2009]. According to their review, interactive segmentation methods achieved betterresults than automatic approaches. The best automatic methods [Heimann et al.,2006; Kainmueller et al., 2007; Wimmer et al., 2009] use model-based assumptionsabout the liver shape and achieved acceptable results in the majority of selected cases.Current research in this field focuses on the improvement of automatic approachesconcerning accuracy and robustness and their application on MR images [Glogeret al., 2010; Rusko et al., 2011].
Segmentation of Tumors
Segmentation and volumetry of tumors is an essential task in planning software foroncologic liver surgery. Important decisions like the resection strategy or the choiceof further treatments rely on a determination of the diameter and volume of tumors.Although liver tumors are often hard to visually delimit from adjacent structuresin preoperative images, a range of advanced liver tumor segmentation techniquesis described. Segmentation techniques can be divided in three groups: interactivesegmentation methods, methods with minimal user interaction, and fully automaticmethods.
16

2.2. Computer-Assisted Liver Surgery
A wide range of interactive segmentation algorithms for liver tumors has beendescribed. To name a few, active contour models [Lu et al., 2005], graph cuts[Stawiaski et al., 2008], or energy-minimizing implicit functions [Heckel et al., 2011](cf. Fig. 2.5) were found to be effective for surgical planning. Although interactivesegmentation consumes time in clinical routines, the methods are essential in currentsoftware for surgical planning applications due to highly varying quality of clinicalimage data.
The second group attempts to require only minimal user interaction by focusingon the analysis of the acquired image data. Therefore, a region of interest is defined(e.g., by drawing a stroke) which provides parameters for the algorithm initialization.In simple cases, threshold-based approaches that automatically learn a threshold,e.g., based on the voxel distribution of the region of interest, are sufficient fortumor segmentation. However, threshold-based approaches fail if tumors are of lowcontrast or inhomogeneous and are often combined with advanced image processingsuch as model-based morphological processing [Moltz et al., 2009] or random-walksegmentation [Jolly et al., 2008]. Li et al. [2008] propose to segment tumors usingoptimization methods by minimizing a function that incorporates tumor boundary,local, and elasticity constraints. Other promising segmentation approaches withminimal user interaction are based on level sets [Smeets et al., 2010] or enhancedregion growing techniques [Zhou et al., 2010].
The third group includes tumor segmentations that are performed completelyautomatically. This is a challenging task because of the high diversity of liverlesions. The literature describes methods that work well for tumors with high contrast,such as hypodense tumors in contrast-enhanced late-phase CT images [Pescia et al.,2008; Massoptier et al., 2008; Militzer et al., 2010; Schwier et al., 2011]. Thesemethods generally consist of a detection phase followed by a dedicated segmentationstep for each detected finding. Recent research in this field focuses on the detectionof arbitrary lesions types and the automatic detection and segmentation of tumorsin MR images.
Results from segmentation algorithms are not acceptable in all cases. Therefore,tools for semi-automatic adaptation of segmentation results in 3D are meaningful.Such correction tools need to handle user inputs in real time. Low-level tools forediting contours or removing pixels are described [Olabarriaga et al., 2001; Kanget al., 2004] and can be found in radiologic applications. Such interaction techniquesare often time-consuming and require endurance of the user. High-level correctiontools for tumor segmentations are rarely available. A promising idea is to requestonly minimal user interaction such as drawing a partial contour in a single sliceand perform the correction in neighboring slices by using image information. Fora description of such image-based correction techniques refer to the work of Gradyet al. [2006] and Heckel et al. [2009].
17

Chapter 2. Fundamentals
(a) (b)
Figure 2.5: Contour-based interactive segmentation of tumors. Image Courtesy FrankHeckel, Fraunhofer MEVIS.
Segmentation and Analysis of Vascular Structures
The segmentation of vascular structures in the liver is important for an adequatevisualization of vessels in order to explore the patient-individual branching pattern. Incombination with tumor segmentation, spatial relations between vessels and tumorscan be analyzed. Therefore, the segmentation of vessels builds the basis for vascularrisk analyses. In addition, vessel segmentations provide important landmarks forintraoperative navigation.
According to Friman et al. [2010], all current vessel segmentation methods arebased on a growth process emanating from either an automatically defined or user-defined starting point. The differences lie in the growth process. A common approachis to use the region-growing algorithm [Adams et al., 1994] in combination with anappropriate shape analysis, e.g., curve evolution and front propagation. To detectsmall vessels in low contrast regions, a range of vessel tracking methods is described(refer to Friman et al. [2010]). For overviews of vessels segmentation procedures,refer to Kirbas et al. [2004] and Lesage et al. [2009].
For the visualization and exploration of vascular structures in the liver, thesegmentation is often enhanced by a mathematical model description. The followingcomputational steps, described by Selle et al. [2002], are common when calculatinga vascular model of the liver. First, skeletonization with a topology-preservingthinning algorithm yields an exact centerline and vessel radii at each voxel of theskeleton. Second, a graph analysis transforms the vessel skeleton into a directed,acyclic graph for which nodes represent furcations. Third, a 3D representation basedon a geometric surface description is generated [Hahn et al., 2001; Oeltze et al., 2005]to provide an abstract visualization of vascular structures (cf. Fig. 2.7).
18

2.2. Computer-Assisted Liver Surgery
Approximation of Vascular Territories
Once a segmentation of vascular structures in the liver is available, the issue of shapeand extent of the associated liver segments arises. Segments of the liver, as introducedin Sect. 2.1.1, are supplied or drained by specific liver vessels. Their location andvolume are important for preoperative risk analysis and resection planning. Whenliver segments were introduced by Couinaud [1954], modern radiological 3D imagingdid not exist. Thus, the Couinaud segments can only be considered a rough, schematicguideline for liver resection planning. With the use of radiological imaging and vesselsegmentation algorithms, a more accurate model of the liver segments, called vascularterritories, is provided.
Thorn et al. [1999] introduced a tool for interactive determination of portalvenous territories based on radiologic images. Therefore, three vertical and fourhorizontal planes are initialized based on user-defined landmarks (e.g., vena cava)and subsequently modified to define eight territories. However, the tool assumesplanar borders between territories as proposed by Couinaud [1954]. Anatomicalstudies show that the assumption of the planar border does not hold [Fasel et al.,1998]. Furthermore, the number of portal venous liver territories may vary in casesof vascular anomalies or large tumors.
In order to predict the location and volume of territories based on the structure andcharacteristics of liver vessels, different computational models were developed. Themodels can be distinguished by their distance metric. Selle et al. [2002] introduced amodel that is based on potential fields. In addition, they developed a model basedon a Euclidean distance metric using a Voronoi decomposition. Both models wereevaluated with vascular corrosion casts of the human liver. Therefore, the portaland hepatic veins were injected with resin. Afterwards, the liver was corroded whichleft the detailed branching structure of the vessel systems [Selle et al., 2002]. Whilethe portal venous structures of the corrosion casts could be reconstructed up to thesixth branching order, clinical datasets acquired with present imaging technologiesonly allow a reconstruction up to the third branching order [Preim et al., 2007]. Inorder to test the robustness of the methods and their clinical applicability, the portalveins of eight datasets were generated using three different pruning levels (levels ofdetail). For each vascular model, vascular territories were calculated (cf. Fig. 2.6).The comparison between the approximated and the authentic territories showed avolumetric overlap between 80% and 90% depending on the pruning level [Selle et al.,2002]. Although the Voronoi decomposition exhibits a different formulation and asignificantly lower computational complexity than the potential field method, theresulting territories showed very similar results. For a detailed presentation of theresults, refer to the thesis of Selle [1999].
In conclusion, the approximation of vascular territories in the liver using a Voronoidecomposition based on a Euclidean distance metric has revealed to be efficientand showed sufficient accuracy for liver surgery planning. The methods for theapproximation of vascular territories are part of the planning software HepaVision[Bourquain et al., 2002], an FDA-approved tool for preoperative planning in oncologic
19

Chapter 2. Fundamentals
Pruned CastCorrosion Cast
Exact Territories Approximated Territories
Figure 2.6: Segmented portal vein from a corrosion cast of the human liver (upperright) and the associated pruned vascular tree (upper left). Vascularterritories are shown for the corrosion cast (lover right) and the prunedrepresentation (lower left). Image adapted from Selle et al. [2002].
liver surgery, which has been tested in several evaluations [Schenk et al., 2008] andmore than 6500 clinical cases since 2002.
Risk Analysis
In the treatment of liver diseases, surgical risk can be measured using functionaltests like scintigraphy [Graaf et al., 2010] or the LiMax test [Stockmann et al., 2010],which is meaningful for cases with uncertain liver parenchyma quality. Furthermore,scoring systems such as the POSSUM test [Chandra et al., 2009] or the MELDscore rank patients depending on physiological and operative parameters. However,both functional test and scoring systems assist surgeons in the choice of an optimalcourse of therapy, but support resection planning only to a limited extent. Spatialinformation (e.g., distances between risk structures or the optimal course of atrajectory) and possible damages (e.g., areas of risk) cannot be evaluated usingthe aforementioned methods. Nevertheless, Asakuma et al. [2007] and Stockmannet al. [2010] showed within clinical studies that functional tests in combination withvirtual resection planning based on CT images [Bourquain et al., 2002] facilitatethe prediction of postoperative functional liver volume. Therefore, algorithms areproposed that provide a quantitative measure in order to classify patients.
When removing a part of the liver in case of a tumor resection, surgeons usuallyaim to preserve as much perfused liver tissue as possible. By considering that the
20

2.2. Computer-Assisted Liver Surgery
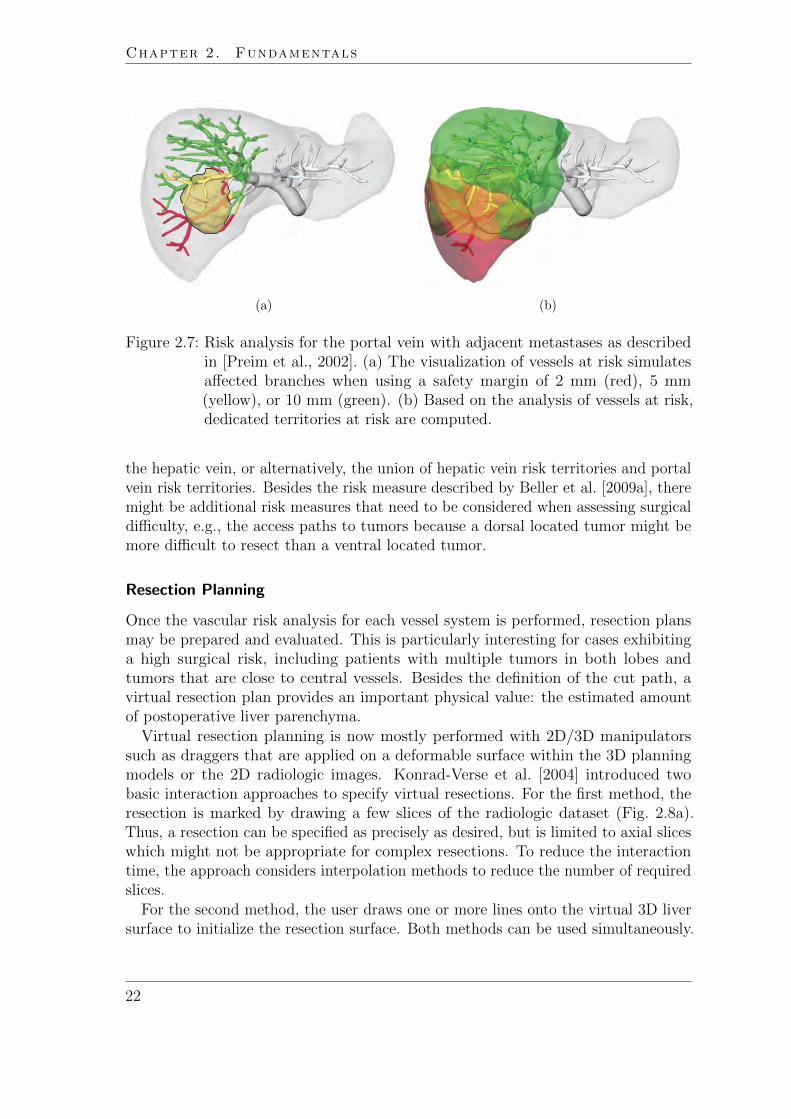
liver contains a complex, interwoven vessel structure with two supply systems (PV,HA) and two drainage systems (HV, BD) a computer-assisted vascular risk analysiscan support important surgical decisions (e.g., about the width of the safety margin)in critical cases. Preim et al. [2002] introduced a method to detect and visualizevessels at risk in oncologic liver surgery. The method assumes a limited number ofsafety margins around tumors. Standard widths were set to 5, 10, and 15 mm oralternatively to 2, 5, and 10 mm, depending on the type of tumor (cf. Fig. 2.7a). Bydefault, red is employed for the smallest margin, which is assumed to be resected;yellow and green are used for larger margins. To determine the vascular brancheswithin a certain safety margin around the tumor, the border voxels are detectedby calculating the difference of the tumor and an eroded mask using a structuringelement for erosion. Distance transformation is applied to all border voxels, andaffected vessels are identified by means of a graph analysis. A similar approachis presented by Schwaiger et al. [2010], although they visualize only the minimaldistance between tumor and vessels using three standard distances (5, 10, and 15mm). Hierarchical dependencies of vessel branches, as described by Preim et al.[2002], are not taken into account.
Based on the work of Selle et al. [2002], who evaluated different approaches for theestimation of liver territories, Preim et al. [2002] proposed approximating the affectedparenchyma using a nearest-neighbor distance model of the liver volume according tothe centerline voxels of segmented vascular structures. These calculated volumes arecalled territories at risk. For each of the three safety margins, the territories atrisk are quantitatively analyzed. Finally, an iso-surface renderer generates separatetriangular meshes and sets vertex colors that correspond to the colors of associatedvessels at risk (cf. Fig. 2.7b). Within a subsequent clinical study [Lang et al., 2005],the results of computer-assisted risk analysis led to a change of operation planning(compared to the examination of normal CT images) with regard to the extent ofresection or the need for vascular reconstruction in selected cases (7 of 21 patients).
In the field of living donor liver transplantation (LDLT), risk analyses introducedin Preim et al. [2002] and Selle et al. [2002] assist surgeons in selecting the graft type,e.g., preserving or resecting the middle hepatic vein of donors when transplantingthe right liver lobe. Therefore, the potential congestion volume can be calculatedby detecting affected hepatic vessels and estimating the associated regional hepaticvenous volumetry [Asakuma et al., 2007]. Model-based risk analyses for LDLT aretherefore an important tool in the clinical routine [Radtke et al., 2007; Asakumaet al., 2007].
In order to find a standardized, comparable value for the vascular risk of a patient,Beller et al. [2009a] presented a measure to assess surgical difficulty of tumorresection. First, the volumes of territories at risk with safety margins from 1 to30 mm are determined for the portal vein and hepatic vein. All volumes are statedas a percentage of the total liver. Second, the normalized integral of all risk volumesis calculated and defines a risk coefficient for the tumor. A performed surgical userstudy which compared the proposed risk coefficient with the opinion of surgicalexperts revealed that the risk coefficient is best illustrated by the territories at risk of
21
Chapter 2. Fundamentals
(a) (b)
Figure 2.7: Risk analysis for the portal vein with adjacent metastases as describedin [Preim et al., 2002]. (a) The visualization of vessels at risk simulatesaffected branches when using a safety margin of 2 mm (red), 5 mm(yellow), or 10 mm (green). (b) Based on the analysis of vessels at risk,dedicated territories at risk are computed.
the hepatic vein, or alternatively, the union of hepatic vein risk territories and portalvein risk territories. Besides the risk measure described by Beller et al. [2009a], theremight be additional risk measures that need to be considered when assessing surgicaldifficulty, e.g., the access paths to tumors because a dorsal located tumor might bemore difficult to resect than a ventral located tumor.
Resection Planning
Once the vascular risk analysis for each vessel system is performed, resection plansmay be prepared and evaluated. This is particularly interesting for cases exhibitinga high surgical risk, including patients with multiple tumors in both lobes andtumors that are close to central vessels. Besides the definition of the cut path, avirtual resection plan provides an important physical value: the estimated amountof postoperative liver parenchyma.
Virtual resection planning is now mostly performed with 2D/3D manipulatorssuch as draggers that are applied on a deformable surface within the 3D planningmodels or the 2D radiologic images. Konrad-Verse et al. [2004] introduced twobasic interaction approaches to specify virtual resections. For the first method, theresection is marked by drawing a few slices of the radiologic dataset (Fig. 2.8a).Thus, a resection can be specified as precisely as desired, but is limited to axial sliceswhich might not be appropriate for complex resections. To reduce the interactiontime, the approach considers interpolation methods to reduce the number of requiredslices.
For the second method, the user draws one or more lines onto the virtual 3D liversurface to initialize the resection surface. Both methods can be used simultaneously.
22

2.2. Computer-Assisted Liver Surgery
For further deformation in 3D, a deformable cutting plane (cf. Fig. 2.8b) is generatedby applying a principal component analysis (PCA) on the point set which formsthe lines. The user can define a sphere of influence as well as the amplitude of thedeformation to modify the cutting plane interactively. Both functions are controlledwith mouse movements at the point being modified. Besides the local modification ofthe grid, there is also a function to translate the entire mesh. Finally, both techniquesapply a volume calculation of the resected and remaining parts of the liver to providequantitative information for surgical decisions.
To further reduce the required interaction time, Hiller [2008] applies generalgeometric shapes, such as planes and wedges, that are placed at the beginningof the procedure. Subsequently, the user may manipulate the shapes based on amass-and-spring system. Reitinger et al. [2006] developed a virtual reality-basedsystem for surgical planning procedures. To plan a resection on the 3D model, theuser can choose from three different possibilities and apply those using optical trackeddevices for which even haptic feedback is offered. Besides a simple plane for straightresection paths, the application supports more complex scenarios where a deformableplane is applied. For wedge resections, a scalable sphere is placed inside the virtualreality model and can be used to define disc-like resection paths.
To improve the quality of an interactively defined resection surface, Demedts et al.[2010] introduced evaluation methods for virtual resection surfaces. Therefore, riskfactors that parameterize the evaluation function have been described [Demedts et al.,2010]. Using an optimized data structure specialized for liver volume data, interactiveframerates for the computation of the resulting resection score are achieved. Theresection score enables a quantitative comparison of different resection surfaces.Evaluations with clinical users showed that the quality of virtual resection surfacesis increased when using the interactive evaluation tool, however, the total time todefine a resection surface increases. This could be attributed to the presentation ofadditional information, which leads to increased attention and additional effort.
The question arises whether it is possible to calculate a resection proposal auto-matically. Preparatory work can be found in the field of ablation therapy and biopsy.For the placement of needles in the liver, automatic path proposal techniques areproposed [Baegert et al., 2007; Schumann et al., 2010]. These techniques use multipleclinical parameters such as tumor coverage, distance to risk structures and penetra-tion depth to calculate an optimal insertion path. However, techniques for automaticgeneration of liver resection proposals exist only in rudimentary form Preim et al.[2002]; Thorn [2004]; Beller et al. [2008]. A first software prototype for automaticgeneration of resection proposals was developed in the context of this dissertationand is presented in Chapter 4 on page 87.
2.2.3 Intraoperative Decision Pipeline
Tumor resections in the liver are among the most difficult surgical interventionsin the human body. In complex surgical cases, e.g., centrally located tumors, onlyspecialized centers accept patients for resection. Preoperative resection plans as well
23

Chapter 2. Fundamentals
(a) (b)
Figure 2.8: (a) Resection planning by drawing into slices with visualized impairedblood flow (green = HV at risk, yellow = PV at risk, red = PV + HV atrisk) [Demedts et al., 2010]. (b) Deformable cutting plane to modify avirtual resection surface [Konrad-Verse et al., 2004]. The yellow part ofthe mesh indicates the influence range of the deformation.
as the surgical experience are prerequisites for the success of such an intervention.During liver surgery, a lot of decisions must be made by the surgeons during eachstep. According to Lang et al. [2005], an anatomical liver resection can be divided inthe following steps:
(1) Access
(2) Mobilization of the liver
(3) Intraoperative sonography
(4) Liver hilum dissection
(5) Vena cava and hepatic vein dissection
(6) Parenchyma transection
(7) Care of resection surface
(8) Final stage
Each work step calls for special surgical decisions. The parenchyma transec-tion (6) is often the most critical and difficult step because risk structures withinthe parenchyma are not directly visible by surgeons. Therefore, much research isperformed to support the parenchyma transection using computational models. Theparenchyma transection includes the following surgical subtasks:
24

2.2. Computer-Assisted Liver Surgery
(6-1) Mark the planned resection surface on the liver surface (cf. Fig. 2.9a)
(6-2) Follow the planned resection course (cf. Fig. 2.9b)
(6-3) Avoid cutting risk structures such as central vessels
(6-4) Keep an adequate distance to the tumor (safety margin)
(6-5) Adapt the resection strategy in case of intraoperative findings
(6-6) Control bleeding
Navigational support during transection is currently provided by utilizing IOUS orby mentally comparing the intraoperative situation with the planning data. In recentyears, navigation systems for liver surgery have been proposed [Cash et al., 2007;Beller et al., 2007; Hildebrand et al., 2007; Peterhans et al., 2010]. These systemsintraoperatively align preoperative planning data with the patient’s liver by usingregistration techniques.
With the introduction of navigation systems in the clinical workflow, additionalworkflow steps were introduced, including:
(6-0a) Transfer of planning data to the intraoperative site
(6-0b) Calibration of tracked surgical instruments and tracking devices
(6-0c) Intraoperative registration of preoperative and intraoperative data
(6-0d) Navigated transfer of the resection plan
Furthermore, a method for intraoperative adaptation of planning data in case ofadditionally detected findings is necessary. All of these new working steps introducedwith the utilization of navigated liver surgery demand additional intraoperativedecisions, illustrated in Fig. 2.10.
2.2.4 Navigated Liver Surgery
According to the definition of Beller et al. [2010], navigation support can be dividedin the following categories:
(1) Mental navigation based on preoperative images without the use of trackingtechnology
(2) Navigation support through intraoperative imaging (such as IOUS)
(3) Navigation support through registration between preoperative imagesand patient anatomy (with or without the use of intraoperative imaging)
(4) Navigation support through registration and continuous tracking oforgan motion
25

Chapter 2. Fundamentals
(a) (b)
Figure 2.9: Workflow steps in oncologic liver surgery: (a) Mark a planned resectionsurface on the liver surface and (b) following the planned resection course.Image courtesy General Hospital Celle, Germany.
Nowadays, mental navigation (1) and intraoperative imaging (2) are widely used fornavigation support in liver surgery. For (1), surgeons use a representation of planningdata in the operating room, e.g., in print or on a video monitor. Alternatively, mentalnavigation is often based solely on the surgeon’s memory. For (2), intraoperativeimaging builds the basis for surgical navigation. IOUS is now a standard procedurein liver surgery because it exhibits several advantages over other image modalities: Itprovides real-time images of the liver, it is widely available in operating rooms, andsurgeons are very familiar with this device. Mental navigation based on preoperativeimages (1) is often combined with navigation support through intraoperative imaging(2).
One of the first navigated resections based on intraoperative imaging was performedmany years ago right after the discovery of x-rays. Cox et al. [1896] applied x-rayimaging to guide the surgical resection of a bullet in a human leg. The introductionof CT imaging for humans in 1971 opened the door for precise 3D operation planning.Now, 3D planning models and associated risk analyses are essential parts of modernplanning software. However, transferring the preoperative planning informationto the intraoperative situs only by memory represents a great cognitive challenge,because the liver surface shows only a few clear anatomical landmarks [Beller et al.,2010]. Thus, visual and tactile information have to be aligned with the 3D planningmodels mentally and continuously [Beller et al., 2010]. The amount of planninginformation that can be transferred is limited in this context.
Thanks to the introduction of clinical tracking devices, it has been possible totrack the position of surgical instruments. The use of registration methods allowsvisualizing the instruments relative to preoperative planning models (3). Recentcommercial navigation systems use only rigid registration approaches, whereas non-
26

2.2. Computer-Assisted Liver Surgery
Check Tool Calibration
Transfer of Planning Data
Tool Calibration
User accepts
Check Registration
Check for Additional Tumors
Navigated Transfer of Resection Plan
IOUS Examination
Intraoperative Registration
Determination of Tumor Location and Size
Adaptation of Risk Analysis
Adaptation of Resection Plan
Documentation
If additional tumor(s) found
Load of Planning Data
Else
Check Registration
User acceptsUser rejects
User acceptsUser rejects
User rejects
User rejects User accepts
Figure 2.10: Part of intraoperative decision pipeline for navigated liver surgery froma technical viewpoint. The dashed boxes represent workflow stepsaddressed in this thesis.
27
Chapter 2. Fundamentals
rigid registration has been applied in several research systems [Cleary et al., 2010].However, the value of a registration is limited in case of organ movement, whichis common in liver surgery. Therefore, techniques for continuously tracking organmovement (4) are part of current research. Intraoperative registration is a keycomponent of surgical navigation systems and is discussed in the next subsections.
The question arises why surgeons request this new technology. Kleemann et al.[2005] described the aim of navigated liver surgery as the precise transfer of apreoperatively planned resection surface to the patient’s liver and the considerationof adequate distance to tumors and central liver vessels. They defined the followingreasons for using navigation systems in liver surgery:
• Increased surgical accuracy
• Achievement of smaller access paths
• Transfer of preoperative planning data
• Semi-automation of steps in the surgical workflow
• Surgical training
Navigation support has been requested for both laparoscopic (minimally invasivesurgery) and open liver surgery. Open liver surgery is widely applied and thestandard resection technique for tumors in the liver. Laparoscopic liver surgery isrelatively new, however, with recent advances of laparoscopic devices the number oflaparoscopic liver interventions increased rapidly. Advantages of laparoscopy are thereduced pain due to smaller incisions and a shorter recovery time. However, due tothe absence of tactile feedback, there is a great need for navigation support in thisfield [Kleemann et al., 2005].
Besides the aforementioned reasons for navigated liver surgery, possible medicalindications for surgical navigation are described. According to Vetter et al. [2002],navigation support would be desirable for centrally located tumors. For tumors whichare palpable and located peripherally, navigation support might not be necessary.Beller et al. [2010] assume that the field of molecular imaging opens a new kind ofdiagnostics with which early staged, small tumors can be identified. These tumorsmay not be palpable or visible using conventional imaging such as CT, MRI, or IOUS.The same effect can be observed for tumors that were treated with preoperativechemotherapy. Within a case study on a patient who had undergone preoperativechemotherapy, Oldhafer et al. [2009] showed that the resection of non-palpable,invisible tumors using a surgical navigation system is feasible.
Navigated liver surgery is a promising technique to support surgical decisions andto increase patient safety in the operating room. According to Cleary et al. [2010],key components of surgical navigation systems are:
(1) Tool tracking and calibration
28
2.2. Computer-Assisted Liver Surgery
(2) Registration and organ tracking
(3) Visualization
In the following, these key components are described.
Tool Tracking and Calibration
Tracking systems (localization systems) are the core of a modern surgical navigationsystem. They provide spatial information about the objects to be tracked. Suchobjects are, for example, surgical instruments or a human organ. The following typesof tracking systems can be distinguished:
• Optical tracking systems
• Electromagnetic tracking systems
Optical tracking systems can be further divided into passive and active systems.The objects to be tracked are provided with markers. Markers of active systemsemit light, e.g., using an LED. Passive markers are illuminated by a light sourceand reflect this light. Infrared-based optical tracking systems are widely used inclinical applications [Cleary et al., 2010]. The bases of this technology are infraredmarkers (active or passive) tracked by optical CCD sensors. Three (or sometimesfour) infrared markers are arranged in a so-called marker shield. Thus, markershave a fixed spatial relation to each other, which allows calculating the positionand orientation of the marker shield. Another group of optical tracking systemsare optical videometric systems that identity marker patterns (e.g., checkerboardsor stripes) on video image sequences obtained using one or more calibrated videocameras [Cleary et al., 2010].
Electromagnetic tracking systems determine position of objects that are locatedin a pulsed electromagnetic field. The objects are equipped with electromagneticfield sensors. The data received by these field sensors permit a reliable assessmentof the sensor location. Electromagnetic trackers can be made much smaller thanoptical trackers (0.5 mm in diameter and 8mm in length [Cleary et al., 2010])but are less accurate and are affected by nearby ferromagnetic materials [Glossop,2009]. The main advantage over optical tracking systems is that there is no line-of-sight constraint. This makes electromagnetic tracking applicable for many kinds ofminimally invasive interventions, e.g., laparoscopic surgery. In open liver surgery,both electromagnetic and optical tracking systems are suitable [Beller et al., 2010].Several groups [Khan et al., 2006; Nakamoto et al., 2008; Feuerstein et al., 2009]proposed hybrid tracking systems that combine optical and electromagnetic trackingin order to compensate the drawbacks of optical tracking (line of sight, size of markershields) and electromagnetic tracking (ferromagnetic materials, less accuracy).
Surgical dissectors and ultrasound probes are instruments that need to be trackedduring navigated liver surgery. In order to receive tracking information that is valid
29
Chapter 2. Fundamentals
and reproducible within a defined world coordinate system, a calibration of theseinstruments needs to be performed. This is done by comparing the measurements witha second object with known correctness. If the tracker (marker shield, electromagneticsensor) is in a fixed spatial constellation to the surgical instrument, the calibrationhas to be performed only once. Otherwise, the calibration needs to be repeatedwhenever this spatial constellation changes.
A sophisticated task in navigated liver surgery is the calibration of the ultrasoundprobe. Thereby, the relation between pixels in the ultrasound image and the 3Dcoordinate system needs to be found. In most cases, the ultrasound calibration isperformed by placing an object with known geometry in a water bath. For a reviewof existing ultrasound calibration techniques, refer to Mercier et al. [2005].
Intraoperative Registration and Organ Tracking
Navigated liver surgery allows visualizing tracked surgical instruments in spatialrelation to 3D planning models. Therefore, the 3D models have to be mapped to theliver. This mapping is called intraoperative registration and requires a determinationof corresponding features in the preoperative dataset and on the intraoperative situs.An intraoperative registration is only valid as long as no movement of the liveroccurs. Therefore, respiratory gating techniques [Clifford et al., 2002] are applied,and the liver is immobilized with surgical sheets. Although the liver is immobilized,it is frequently squeezed, pulled, and even partly removed by the surgeons duringparenchyma transection. Without a continuous tracking of the liver, the registrationneeds to be frequently repeated in order to stay valid.
In commercial navigation systems for liver surgery, only rigid registration techniquesare applied [Cleary et al., 2010]. However, a study by Heizmann et al. [2010] showedthat there is no rigid alignment of the pre- and intraoperative organ positions dueto overall deflection of the liver. Using local registration, a rigid alignment of theanatomical structure can be achieved with less than 5 mm discrepancy relative to asegmental unit of the liver [Heizmann et al., 2010]. A surface deformation measurementstudy performed by Clements et al. [2011] indicates that the shape change thatoccurs from preoperative image acquisition to intraoperative presentation involves afattening of the liver. They measured surface displacements with magnitudes between5 and 20 mm. However, how these surface errors translate into errors observed withrespect to deep tissue structures remains unclear.
Many registration methods for navigated liver surgery are described in literature.These methods can be classified depending on the kind of features used for registration:
• Surface features of the liver
• Anatomical features within the liver parenchyma
Furthermore, the methods differ in the techniques used to acquire the featuresintraoperatively:
30

2.2. Computer-Assisted Liver Surgery
• Intraoperative imaging, e.g. IOUS, MRI, CT
• Digitization, e.g., using a tracked pointer
Just as CT or MRI are standard modalities for preoperative imaging, IOUS is thestandard modality for intraoperative imaging in liver surgery. Vascular structuresof the liver proved to be a good feature because they traverse the whole liver andare detectable in pre- and intraoperative images. The main challenges are thatIOUS images are perturbed by noise and artifacts (which results, for example, insegmentation errors) and that surgeons require a method that is robust with lowcomputation time.
Papenberg et al. [2008] proposed methods that require the definition of intrahepaticlandmarks in both pre- and intraoperative images. On the basis of this definition,the landmarks are aligned using thin plate splines or, alternatively, an image-basedterm based on normalized gradient fields. Both approaches showed acceptable resultsfor selected clinical datasets. However, the results depend on the amount andaccuracy of the defined landmarks. In case a vessel segmentation is available in bothimage modalities, graph analysis can be applied to find reasonable landmarks forregistration [Metzen et al., 2007; Lohe et al., 2008; Metzen et al., 2009]. Penneyet al. [2004] proposed a rigid registration method based on probability maps ofcorresponding vessel features in ultrasound and MRI. The intensity values of theprobability maps represent the probability of a voxel containing a vascular structureand are generated using training data sets. Another technique proposed by Weinet al. [2010] performs a direct image-based registration. The technique aligns bothimage modalities non-rigidly using similarity measures. A simulation of ultrasoundbased on CT data [Wein et al., 2007] builds the basis.
Other groups use anatomical landmarks on the liver surface as a registrationfeature. Peterhans et al. [2010] proposed to define anatomical landmarks in theplanning data (before or during surgery) and assign these points with the tip of atracked surgical dissector during surgery. Although reasonably intuitive, the accuracyof this method is limited (median accuracy ≈ 6.3 mm) and the method depends onthe availability of appropriate surface landmarks. An ongoing clinical study verifies ifa combination of surface landmarks and sub-surface landmarks using IOUS increasesregistration accuracy.
[Clements et al., 2011] evaluated methods using a laser range scanner to measurethe intraoperative liver surface and align it with the liver surface extracted frompreoperative image data. A signed closest-distance algorithm is applied to calculatea rigid transformation between the acquired surface scan and the intraoperative liver.To estimate the liver deformation, FEM-based liver models are applied [Cash et al.,2005].
Besides laser range scanning, several other surface acquisition techniques such asstereo vision and time-of-flight (TOF) are proposed for the field of image-guidedliver surgery. Maier-Hein et al. [2010] presented methods for rigid registration ofTOF data with 3D planning models of the liver. The work mainly focuses on error
31

Chapter 2. Fundamentals
and noise reduction in TOF data. With recent developments in the automotive andgame industries, it can be expected that surface acquisition devices become moreaccurate and robust in coming years. However, a substantial problem of laser rangescanning and TOF is the line-of-sight constraint. Another challenge is that surfaceacquisition techniques deliver reliable data about the surface of the liver only. Thelocation and spatial relations of structures within the liver parenchyma (which is themain interest for surgeons) needs to be estimated by computational models, whichmay introduce additional inaccuracies in particular for deep regions.
According to the review of Clifford et al. [2002], intraoperative liver motion isgreatest in the cranio-caudal direction, with translation ranging from 10 to 26 mm inquiet respiration. To avoid a repeated re-registration, organ tracking techniqueshave been introduced for liver surgery. Organ tracking using laser range scanning orTOF cameras may be possible in the future, although line-of-sight constrains have tobe considered for open liver surgery. Markert et al. [2010] proposed to fix reflectivefiducials localizable by an optical tracking system on the liver surface. The methodswere evaluated in laboratory settings. Again, line-of-sight problems may hampercontinuous tracking in an actual surgical situation. Other groups propose to fixnavigation aids localizable by an electromagnetic tracking system on the liver surfaceor within the liver parenchyma [Vetter et al., 2003; Beller et al., 2009b]. Evaluationsof these methods have been performed on phantoms and pig livers [Vetter et al.,2003; Lei et al., 2011] and on five patients undergoing oncologic liver surgery [Belleret al., 2009b].
Intraoperative Visualization
Lightboxes dominated operating rooms for almost the entire 20th century. Dozensof radiologic images were hung next to one another in order to allow the surgeonto view the preoperative information during surgery. Because the lightboxes werelocated outside the sterile area, surgeons had to leave the operating table, walk tothe light box, and return to the patient again. 3D planning models of the liver werenot available at this time.
With the introduction of computer-assisted liver surgery planning and the increas-ing complexity of such interventions, intraoperative visualization is becoming animportant part of liver surgery. Currently, there are three different ways to visualizeplanning data in the operating room. A common practice is to use preoperative 3Dplanning models as a printout (cf. Fig. 2.11). Multiple views of the 3D planningdata can be prepared beforehand, annotated if necessary, and easily positioned closeto the operating field. However, such static visualizations are not appropriate fornavigated surgery, for which planning data is visualized along with tracked surgicalinstruments.
Another common way to visualize planning data in the operating room is the pre-sentation on a display, e.g., ceiling-mounted monitors installed in modern operat-ing rooms. Unlike a printout, a monitor representation enables interaction betweensurgeon and preoperative data (cf. Fig. 2.12). Preoperative data can be visualized in
32

2.2. Computer-Assisted Liver Surgery
Figure 2.11: Visualization of preoperative planning data in the operating room byusing printouts of relevant planning models. Image Courtesy UniversityHospital Essen, Germany.
different ways. Most viewers provide at least the means to slice through the stack ofradiologic images. In addition, a 3D visualization of the data is sometimes provided,which is presented either as a direct volume rendering or an isosurface rendering(indirect volume rendering). In contrast to direct volume rendering, isosurface ren-dering requires a reliable segmentation step beforehand. For a technical descriptionof these visualization techniques refer to the book of Preim et al. [2007].
Monitor-based visualizations are used in many research prototypes, e.g., [Nowatschinet al., 2007; Hildebrand et al., 2007; Beller et al., 2009b; Peterhans et al., 2010], anddominate commercial available navigation systems. During navigated liver surgery,3D visualization of planning models is currently used for guiding tracked surgicalinstruments. One important aspect is that these planning models were not developedto provide information in complex workspaces like the operating room. They oftenportray complex geometries and demand cognitive effort and user interaction. Be-cause appropriate interaction devices are nowadays not widely available in operatingrooms, surgeon-computer interaction in the sterile area is difficult and needs often tobe performed by a medical assistant outside of the sterile area.
Effective visualizations for liver surgery are rarely described in literature. Tothe knowledge of the author, only Lamata et al. [2008] developed a system thatprovides an effective monitor-based visualization for liver surgery. Based on asurgical requirement analysis, they propose to visualize planar resection surfaces intwo different views. While a coronal view shows the resection surface, liver surface,nearby vessels, and tumors from the surgical view, a sagittal view presents theseplanning models perpendicular to the surgeon’s line of sight. Subjective assessments
33

Chapter 2. Fundamentals
Figure 2.12: Monitor-based visualization of planning data on the CAS-One navigationsystem. One surgeons (middle) interacts with the 3D visualization usinga touchscreen interface. Image Courtesy Asklepios Hospital HamburgBarmbek, Germany.
gathered in a user study indicate that the provided visualization increases theconfidence and the orientation ability of surgeons [Lamata et al., 2010].
Another problem with monitor-based visualizations is that the display location isoften not optimal with regard to ergonomic and cognitive aspects [Hanna et al., 1998].This makes it very hard for surgeons to focus on the monitor while concentratingon the operating field. Especially in critical situations (where information from thenavigation system would be helpful), it would be not applicable to avert one’s gazefrom the patient.
To allow a direct transfer of planning information, such as risk analyses andresection plans, to the operation field, navigation systems that use AR techniquesare part of current research. Instead of looking on the screen, planning informationis directly mixed with the surgical view. The basic approach to employ AR duringliver interventions is described by Ayache [2003]. The work proposes to augmentintraoperative video images with an associated 3D-reconstruction of the liver surfaceusing alpha compositing (semi-transparent overlay). Samset et al. [2008] use AR toeducate surgeons in radiofrequency ablations of liver tumors. Using a head-mounteddisplay (HMD), interventional procedures are trained on phantoms without the riskof performing an invasive intervention in reality. Nicolau et al. [2009] introduced aguidance system for liver percutaneous punctures that superimposes planning modelson video images of the interventional view. Alpha compositing is used to achievesemi-transparent planning models. However, if AR applications apply transparencyto superimpose planning models on the surgical view, visual depth cues can be
34

2.3. Concluding Remarks
degraded through lower contrast.Feuerstein et al. [2008] apply direct volume visualization of intraoperatively re-
trieved CT data to superimpose laparoscopic video images for trocar placement inliver surgery. A drawback therein is its limitation to the intraoperative processedsegmentation result, which does not provide an accentuation of risk structures andspatial relations. Several groups [Scheuering et al., 2003; Marescaux et al., 2004] inthe field of laparoscopy guidance apply transparency-based superimpositions, similarto [Ayache, 2003; Samset et al., 2008; Nicolau et al., 2009], in order to achieve asuperimposition of laparoscopic video images with planning information, which couldalso lead to misinterpretations.
Projector-based AR represents an interesting way to support surgical decisions:Krempien et al. [2008] and Riechmann [2006] showed that a projector can not onlybe used for intraoperative visualization, but also for the registration of the patient’sorgan using structured light techniques. Gavaghan et al. [2011] presented a handheld-navigated laser projector (wrapped in a sterile plastic hull) to visualize 3-D planningmodels directly onto the organ surface (cf. Fig. 2.13).
Although it is becoming more common for commercial navigations systems to makeAR visualizations available (e.g., BrainLab , Medtronic , da Vinci), it is not commonto see them used in the clinical routine [Kersten-Oertel et al., 2011]. Accordingto Kersten-Oertel et al. [2011] there are plausible reasons for that: First, the systemsare often developed as proof-of-concept prototypes and therefore may not considerclinical needs or constraints imposed by the operation and the surgeon. Second, theadded benefit is mainly for less experienced surgeons or surgical residents. Third,the systems are not sufficiently evaluated and therefore are not convincing in provingtheir value for given surgical tasks.
2.3 Concluding Remarks
With the introduction of personal computers, the era of computer-assisted surgerybegan. Research in this field was driven by the availability of improved hardware,i.e., graphic units, microprocessors, and large data storage devices. For liver surgeryplanning, 3D planning models were derived from radiologic data, enabling a model-based assessment of risk. Recent developments in computer-assisted liver surgeryfocus on the automation and improvement of surgical planning and the transfer ofplanning information in the operating room.
The decision pipeline for liver surgery described in this chapter illustrates wherecomputer assistance supports and attempts to support surgical decision making inclinical routine. With the emergence of surgical navigation systems into operatingrooms, the requirements for surgical planning data have changed. Planning dataneeds to be displayed in the operating room according to surgical needs. This includesa reduction of complexity and a focus on critical areas. In addition, planning dataneeds to be updated according to the movement and deformation of the liver and incase of intraoperative findings. At the same time, preoperative planning needs to be
35
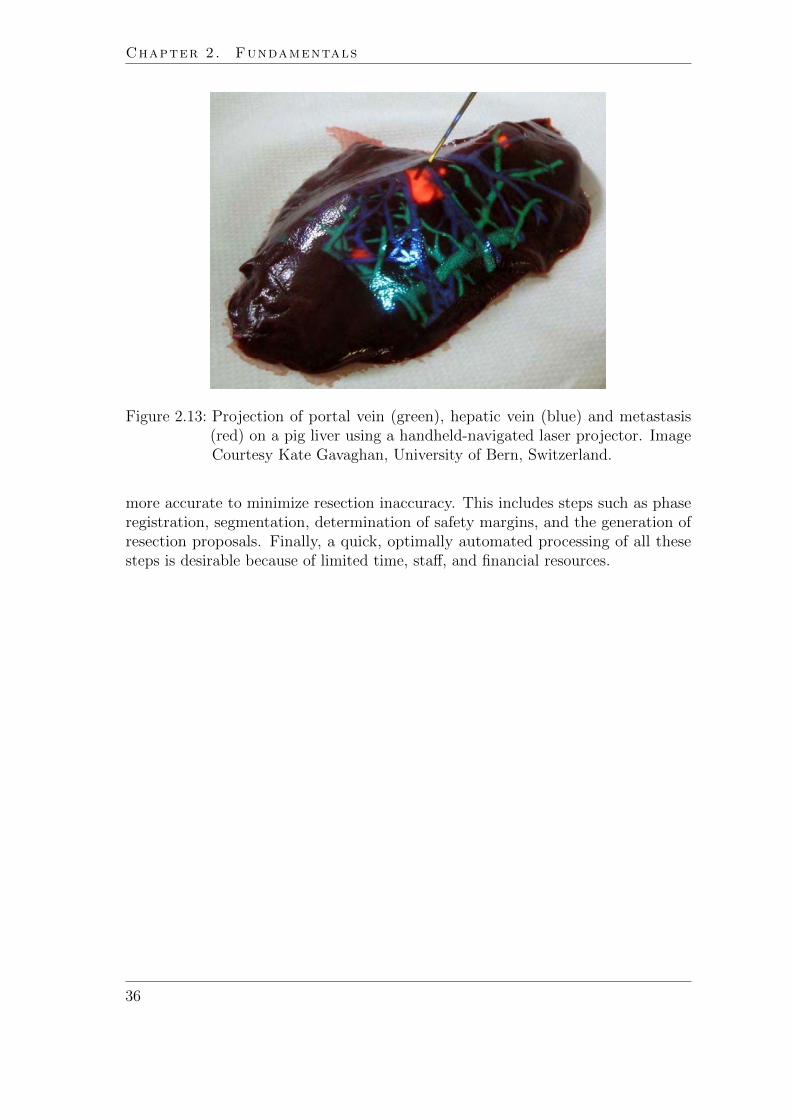
Chapter 2. Fundamentals
Figure 2.13: Projection of portal vein (green), hepatic vein (blue) and metastasis(red) on a pig liver using a handheld-navigated laser projector. ImageCourtesy Kate Gavaghan, University of Bern, Switzerland.
more accurate to minimize resection inaccuracy. This includes steps such as phaseregistration, segmentation, determination of safety margins, and the generation ofresection proposals. Finally, a quick, optimally automated processing of all thesesteps is desirable because of limited time, staff, and financial resources.
36

3 Interactive Determination ofSafety Margins around Tumors
The oldest, shortest words - ’yes’ and ’no’ -are those which require the most thought.
(Pythagoras of Samos)
This chapter presents and discusses new methods for supporting preoperativedecision making and assessing risk in the context of liver surgery planning.The surgical risk of a tumor resection depends, among other factors, on the
width of safety margins around tumors. Therefore, new methods for determinationof optimal safety margins are presented in this chapter. Besides an interactiveexploration of risk sensitivity and robustness, the combination of risk from differentvascular systems is addressed.
37

Chapter 3. Interactive Determination of Safety Margins
3.1 Clinical Background: Safety Margins
The term safety margin is often incorrectly used as another expression for resectionmargin. Whereas safety margins are predetermined and constitute a part of asurgical plan, resection margins (or surgical margins) are subsequently verified by thepathologist when the surgical piece is examined [Kopke et al., 2005]. One surgical goalduring a tumor resection is to achieve a resection margin as if it was preoperativelyplanned in terms of a safety margin.
The main factor for a good patient outcome in oncologic liver surgery is the com-plete excision of all tumors, including a tumor-free resection margin (R0-resection).Histologically unclear resection margins (R1-resection) have been described as dis-advantageous with regard to recurrence [Ooijen et al., 2003; Pawlik et al., 2005].However, when removing a tumor and its margin, adjacent vessels must be transected.These vessels may supply or drain a specific liver region and thus define a territoryat risk. Therefore, the number of vessels that can be preserved correlates withthe postoperative residual liver volume. According to [Pawlik et al., 2008], thepostoperative residual liver volume should be at least 20 % of the total estimatedliver volume for normal parenchyma, 30-60% if the liver is injured by chemotherapy,steatosis, or hepatitis, or even 40-70% in the presence of cirrhosis.
Due to better outcomes in liver metastasis treatment using modern chemotherapythe surgical trend recently changed from large anatomical resection to non-anatomicalresections [Lang et al., 2010]. In this context, the determination of optimal safetymargins around liver tumors became increasingly important in recent years.
A wider saftey margin theoretically gives a higher potential for cure, whereas asmaller margin (e.g. < 1 cm for colorectal metastases) should not be an exclusioncriterion for resection [Salloum et al., 2008]. Recent studies report that the width ofresection margins does not affect recurrence or survival rate, as long as the marginis histologically clear [Pawlik et al., 2008; Muratore et al., 2010]. However, optimalmargin width has been (and is still) uncertain because of contradicting results fromrecent studies [Muratore et al., 2010; Lordan et al., 2010].
3.2 Purpose
The determination of optimal safety margin widths around liver tumors is a challeng-ing surgical task. Type, number, volume, and location of tumors and their relationto vessels are all important factors when deciding whether a R0 resection can beachieved. Thereby, surgeons have to find a compromise between safety margin widthand the estimated postoperative liver volume.
Vascular territories at risk may be sensitive to small changes in the width of thesafety margin. However, safety margins may exist with a robust risk where changesto the width of the margin only alter the territories at risk to a limited extent.
The purpose of this work is to provide physicians with a computer-aided planningtool with which different safety margins can be evaluated concerning risk sensitivity
38

3.3. Related Work
and robustness in an adequate time period. Risk analyses from different vascularsystems (portal vein and hepatic vein) are considered in this context. In addition,definition of non-uniform safety margins is addressed to allow precise resectionplanning for patients with insufficient estimated postoperative liver volume.
3.3 Related Work
Methods for model-based risk analysis based on preoperative images are proposedin different surgical fields. The methods are adapted to clinical needs, becauseanatomical complexity and function varies depending on the treated organ. A varietyof methods for risk analysis in liver surgery planning has already been reported inSect. 2.2.2 on page 20. In addition, model-based risk analyses for tumor resectionsare also utilized in the context of neuro- and lung surgery.
Rieder et al. [2008] introduced interaction and visualization techniques to explorevirtual access paths for resection planning in neurosurgery. Therefore, functionalareas of the brain are detected from multi-modal datasets (fMRI and DTI) andpresented along an interactively definable path towards the tumor. By modifying theincision point or changing size and orientation of the access path, the observer canexplore the associated surgical risk and difficulty. Joshi et al. [2008] enhances thetechniques described by Rieder et al. [2008] by presenting different shapes of accesspaths (spherical, cubical, and ellipsoidal) and visualizing SPECT activation regionsand the position of electrodes. Another considerable work in the field of interactiverisk exploration that is focused on the analysis of fiber tracks (DTI) and functionalareas around a tumor is described in Blaas et al. [2007]. Fiber bundles that passthrough a region around a tumor are detected and can be filtered and color-enhanceddepending on the tumor distance or the distance to a functional area.
Welter et al. [2011] introduced a tool for computer-assisted lung surgery plan-ning to define safety margins around lung tumors in order to analyze the distancebetween tumors and segmental borders. They conclude that adequate margins arean additional factor to prevent recurrence after lung surgery. According to Welteret al. [2011], even larger tumors up to 6 cm could be candidates for segmentectomyin case adequate safety margins with enough distance to the segmental borders canbe determined. This creates new possibilities for patients affected with large lungtumors, because nowadays only tumor diameter ≤ 20mm is generally accepted forsegmentectomies [Okada et al., 2005].
Rieder et al. [2009] introduced methods to visualize risk structures to interactivelyplan radiofrequency ablations in the liver. A numerical simulation of the heatdistribution [Kroger et al., 2006] considers heat-sink effects caused by the coolingblood flow. Depending on the orientation and position of a virtual applicator needle,the affected liver tissue is highlighted and the colors of tumors and vessels are adaptedaccording to a color table. In a subsequent publication [Rieder et al., 2010a], apseudo-cylindrical mapping of a tumor surface onto a 2D image, called the tumormap, is presented (refer also to page Sect. 5.2 on page 97). In combination with a
39

Chapter 3. Interactive Determination of Safety Margins
3D viewer, the tumor map serves as an interactive tool to quickly explore risk. Theproposed methods may assist physicians in planning needle placement while ensuringa complete destruction of tumor cells and preserving anatomical risk structures.
3.4 Interactive Determination of Safety Margins
Standard widths for safety margins, as proposed in Preim et al. [2002], may becomputed automatically in order to assess surgical difficulty, but they do not allowfor detailed exploration of surgical feasibility. Two computational bottlenecks existin their pipeline which make an interactive exploration of arbitrary safety marginsimpossible:
(1) Calculation of territories at risk for specific safety margins in image space
(2) Update of the 3D visualization
The computation time for these steps is approximately 10 seconds on a standardmedical workstation (compare specified test framework in the appendix on page 155).In order to allow an interactive exploration of territories at risk, safety maps for eachvessel system are introduced.
3.4.1 Safety Maps
Safety maps encode the margin at which each voxel of the liver parenchyma willbe affected by the tumor. They are calculated in a preprocessing step. For theircalculation, one central question has to be answered for each liver voxel: Which vesselbranches (that are visible in the radiologic data) are responsible for the perfusionof the liver parenchyma at the position of the liver voxel? This is not easy todetermine, because the capillary vessels which perfuse the liver cells are too small tobe detectable in radiologic images.
Model assumptions have to be made. In this work, a nearest-neighbor distancemodel is utilized. The model was evaluated by Selle et al. [2002] on human corrosioncasts of the human liver. The evaluation indicated that the assumption of a nearest-neighbor distance model provides sufficient accuracy for liver surgery planning.
Following the nearest-neighbor distance model, a 3D Voronoi decomposition of theliver volume according to the centerline voxels of the segmented vascular structuresapproximates the perfusion or drainage areas. Combining this information with aEuclidean distance transformation of the tumor segmentation mask and taking thehierarchical dependencies of the vascular tree into account, the safety map for aspecific vascular tree of the liver is calculated. The map can be used as a 3D look-uptable (cf. Fig. 3.1), with which affected voxels for a specific safety margin can befound . The following sections focus on the efficient and effective visualization ofsafety maps.
40

3.4. Interactive Determination of Safety Margins
(a) (b)
Figure 3.1: Single axial slices from a safety map for a hepatic vein (a) and a portalvein (b). The grey values encode the width of the safety margin at whicheach liver voxel will be affected.
3.4.2 Interactive Visualization of Vascular Risk
For the visualization of vascular risk, representations in 2D and 3D are proposed.A 2D diagram shows the relation between affected liver volume and safety marginwidth. In addition, a 3D view visualizes the vessels and territories that are affectedwhen interactively defining a specific safety margin in the 2D diagram.
2D Visualization of Safety Maps
The quantification of territories at risk as a function of the safety margin is extractedfrom the safety maps by histogram analysis. To highlight safety margins that aresensitive to small changes, a cumulative histogram is calculated (cf. Fig. 3.2), whichvisualizes the amount of voxels (y-axis) that are affected for a specific safety marginwidth (x-axis). However, physicians are not interested in the number of remnantliver voxels, but rather in the fraction of remnant liver volume in relation to theoverall liver volume of the patient. Therefore, the volume-margin function thatvisualizes the remaining functional liver volume as a function of the safety marginwidth is introduced. As distinguished from the cumulative histogram, the volume-margin function is scaled and flipped in the y-direction. Volume-margin functionsare calculated for each hepatic vessel of a patient dataset and combined in a 2Drisk graph (cf. Fig. 3.3). A horizontal slider in the risk graph is used to modify thewidth of a specific safety margin interactively.
41

Chapter 3. Interactive Determination of Safety Margins
Num
ber
of V
oxel
s
Safety Margin (mm)
Safety Margin (mm)
Num
ber
of V
oxel
s
Num
ber
of V
oxel
sN
umbe
r of
Vox
els
Safety Margin (mm)
Safety Margin (mm)
Figure 3.2: Safety maps (left), histograms (center), and corresponding cumulatedhistograms (right) for portal vein (bottom) and hepatic vein (top)
Figure 3.3: Territories at risk of the portal vein (right) that correspond to a disconti-nuity in the volume-margin function (left). In this case, the discontinuityrepresents a safety margin of 2mm, while the affected supply volumeadds up to 32% of the total liver volume (same case as Fig. 3.2).
42

3.4. Interactive Determination of Safety Margins
3D Visualization of Safety Maps
The discontinuities in the compromised volume-margin function correspond to thetransection of major vessels, setting the dependent territories at risk (cf. Fig. 3.3).Hence, these curve discontinuities directly correspond to sensitive parameters forthe surgical planning. Given that the corresponding safety margin is required toguarantee an R0-resection, the surgeon has to decide whether the loss of functionalvolume in this magnitude can be tolerated.
A fast, interactive 3D visualization of surgical risk with respect to a selected safetymargin is essential to evaluate surgical feasibility and to prepare a resection plan.In order to facilitate a quick exploration of risk, the visualization must be renderedwith interactive framerates. This update mainly concerns the vessels at risk andterritories at risk.
To update the visualization of vessels at risk upon modifications of the safetymargin, a texture lookup from each vertex of the vascular model into the safetymap is performed. A fragment program is used for this purpose. Traversing thegraph representations of each vessel is avoided; instead, precomputed safety mapsare utilized.
To update the visualization of territories at risk upon modifications of thesafety margin, a fast, direct volume renderer [Rieder et al., 2011] that applies atransfer function on the precomputed safety map is utilized. Compared to previousapproaches, the visualization of territories at risk can be adapted in real-time, whichallows fast and detailed exploration of individual anatomic datasets. The volumerendering is mixed with the model-based representation of vascular trees, whileaffected vessels are labeled in red to highlight the relation between territories at riskand the supplying or draining vessels at risk. Quantitative information, mainly theamount of affected liver volume, enhances the visualization. The described updateprocess is illustrated in Fig. 3.4.
To assess the validity of territories at risk, it is essential that the result can also bedisplayed in a 2D slice view. For this purpose, the territories at risk are superimposedwith the original radiologic data. In addition, the user can generate iso-surfaces ofthe territories at risk for arbitrary margins to allow platform-independent utilization,e.g., in the operating room.
3.4.3 Combination of Vascular Risk
The combination of risk analyses (consideration of each vascular system) are importantto optimize a preoperative resection plan [Lang et al., 2005; Endo et al., 2007]. Forthe exploration of combined risk, the 2D risk graph is enhanced by volume-marginfunctions of intersection volume and union volume (cf. Fig. 3.5). The union ofterritories at risk from different vascular systems can be computed by assigning toeach liver voxel the minimum value of the both safety maps, while the maximumvalue is assigned when calculating the intersection of territories at risk. This allowsfor fast comparison of volume-margin functions and their mutual sensitivity of risk.
43

Chapter 3. Interactive Determination of Safety Margins
Vessel at Risk
Territory at RiskSafety Map
Volume-Margin Function
Margin
Transfer Function
1
0
Texture
Lookup
Figure 3.4: Update of vessels at risk and territories at risk upon modifications of thesafety margin.
(a) (b)
Figure 3.5: Risk graph containing volume-margin functions of the hepatic vein (green),portal vein (blue), union (black), and intersection (red) for a centrallylocated lesion (left) and a peripherical tumor (right).
44
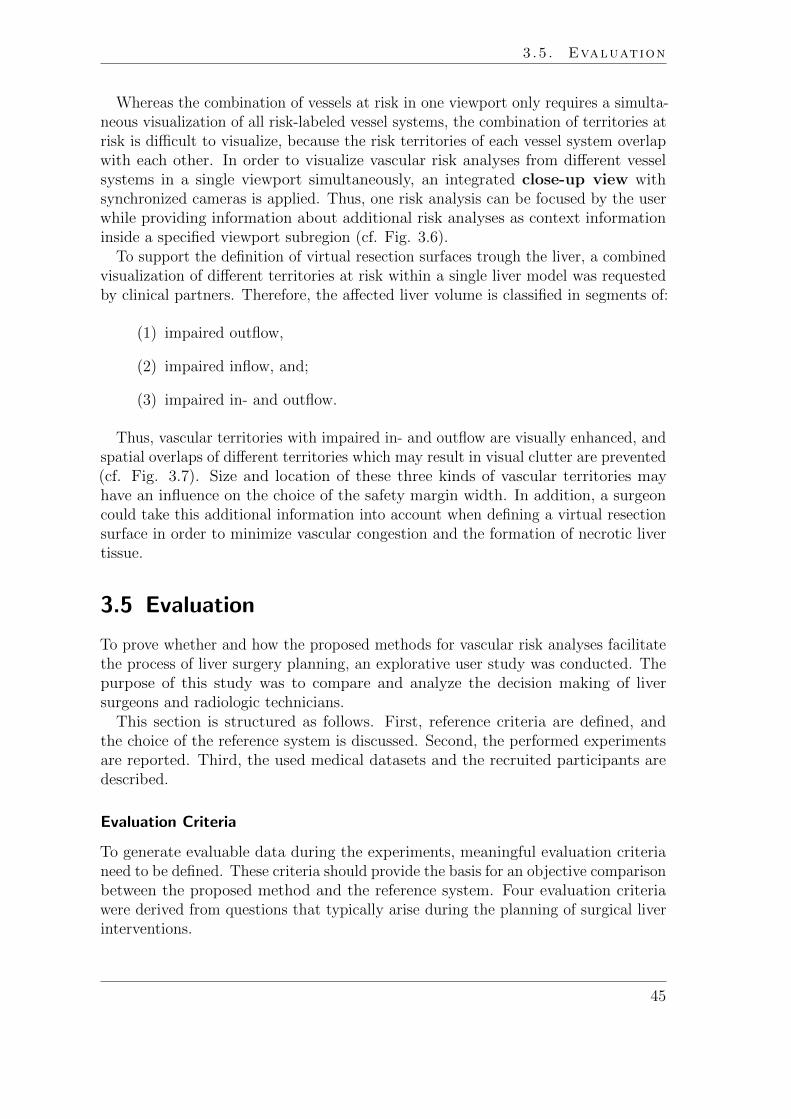
3.5. Evaluation
Whereas the combination of vessels at risk in one viewport only requires a simulta-neous visualization of all risk-labeled vessel systems, the combination of territories atrisk is difficult to visualize, because the risk territories of each vessel system overlapwith each other. In order to visualize vascular risk analyses from different vesselsystems in a single viewport simultaneously, an integrated close-up view withsynchronized cameras is applied. Thus, one risk analysis can be focused by the userwhile providing information about additional risk analyses as context informationinside a specified viewport subregion (cf. Fig. 3.6).
To support the definition of virtual resection surfaces trough the liver, a combinedvisualization of different territories at risk within a single liver model was requestedby clinical partners. Therefore, the affected liver volume is classified in segments of:
(1) impaired outflow,
(2) impaired inflow, and;
(3) impaired in- and outflow.
Thus, vascular territories with impaired in- and outflow are visually enhanced, andspatial overlaps of different territories which may result in visual clutter are prevented(cf. Fig. 3.7). Size and location of these three kinds of vascular territories mayhave an influence on the choice of the safety margin width. In addition, a surgeoncould take this additional information into account when defining a virtual resectionsurface in order to minimize vascular congestion and the formation of necrotic livertissue.
3.5 Evaluation
To prove whether and how the proposed methods for vascular risk analyses facilitatethe process of liver surgery planning, an explorative user study was conducted. Thepurpose of this study was to compare and analyze the decision making of liversurgeons and radiologic technicians.
This section is structured as follows. First, reference criteria are defined, andthe choice of the reference system is discussed. Second, the performed experimentsare reported. Third, the used medical datasets and the recruited participants aredescribed.
Evaluation Criteria
To generate evaluable data during the experiments, meaningful evaluation criterianeed to be defined. These criteria should provide the basis for an objective comparisonbetween the proposed method and the reference system. Four evaluation criteriawere derived from questions that typically arise during the planning of surgical liverinterventions.
45
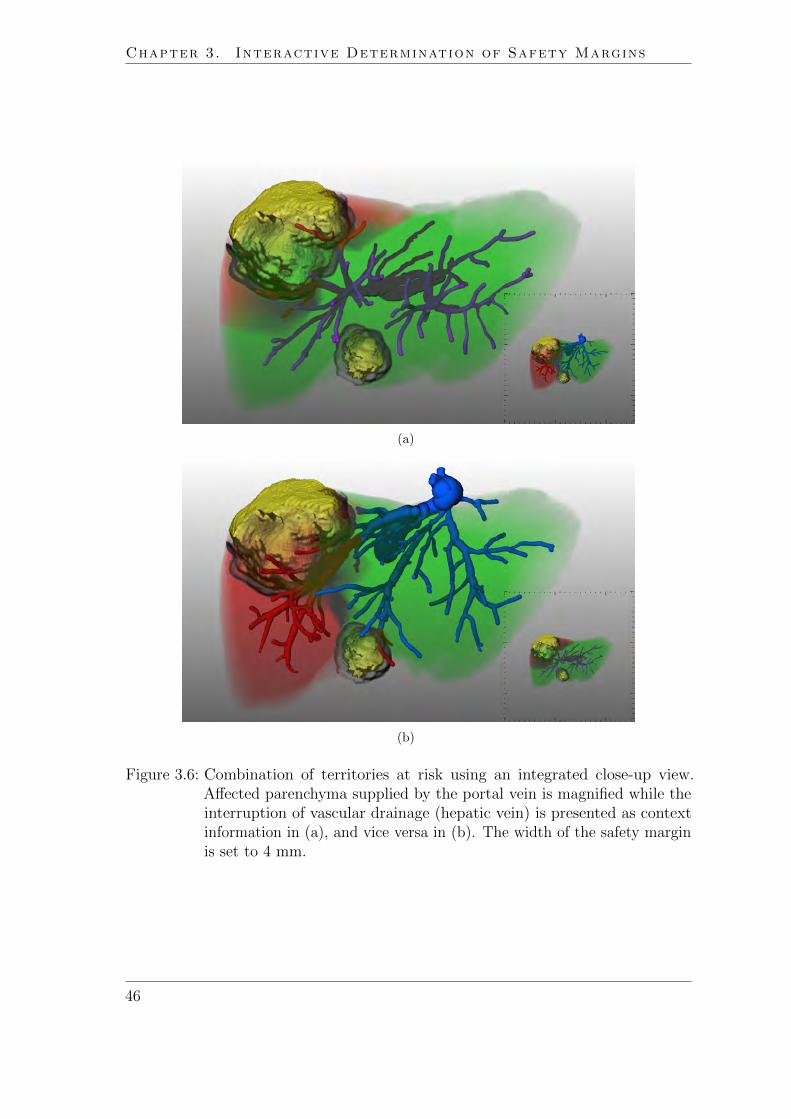
Chapter 3. Interactive Determination of Safety Margins
(a)
(b)
Figure 3.6: Combination of territories at risk using an integrated close-up view.Affected parenchyma supplied by the portal vein is magnified while theinterruption of vascular drainage (hepatic vein) is presented as contextinformation in (a), and vice versa in (b). The width of the safety marginis set to 4 mm.
46
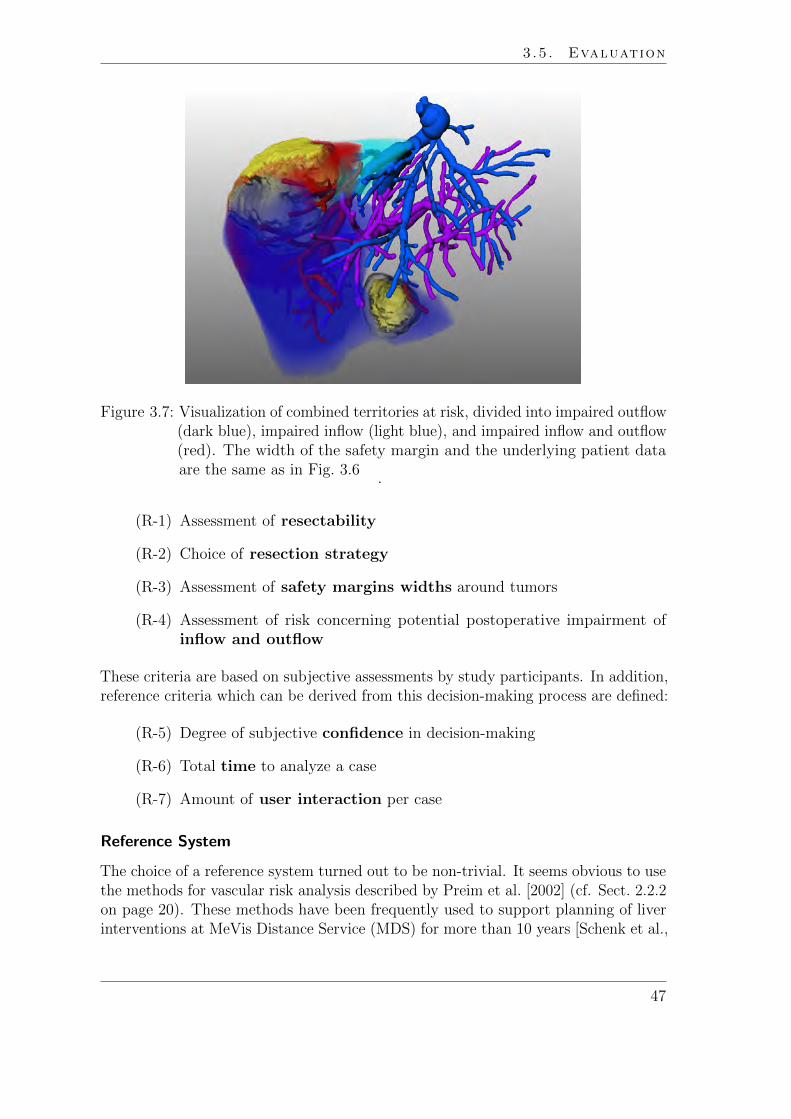
3.5. Evaluation
Figure 3.7: Visualization of combined territories at risk, divided into impaired outflow(dark blue), impaired inflow (light blue), and impaired inflow and outflow(red). The width of the safety margin and the underlying patient dataare the same as in Fig. 3.6
.
(R-1) Assessment of resectability
(R-2) Choice of resection strategy
(R-3) Assessment of safety margins widths around tumors
(R-4) Assessment of risk concerning potential postoperative impairment ofinflow and outflow
These criteria are based on subjective assessments by study participants. In addition,reference criteria which can be derived from this decision-making process are defined:
(R-5) Degree of subjective confidence in decision-making
(R-6) Total time to analyze a case
(R-7) Amount of user interaction per case
Reference System
The choice of a reference system turned out to be non-trivial. It seems obvious to usethe methods for vascular risk analysis described by Preim et al. [2002] (cf. Sect. 2.2.2on page 20). These methods have been frequently used to support planning of liverinterventions at MeVis Distance Service (MDS) for more than 10 years [Schenk et al.,
47

Chapter 3. Interactive Determination of Safety Margins
2008]. To test whether the methods represents a good reference system, more than100 risk analyses generated for clinical use by MDS were compared with the newmethods proposed in this work. The comparison of results from both risk analysesshowed that the results (territories of risk, vessels at risk, safety margins) differ inmost cases only to a limited extent. An interview of radiological technicians workingat MDS revealed that much human-computer interaction and experience are requiredto achieve risk analysis results that are suitable for planning. Many different safetymargins often need to be tested to generate an expressive visualization of risk.
In addition, the impact of the risk analyses of Preim et al. [2002] has not yetbeen thoroughly evaluated. Previous studies [Lamade et al., 2000; Lang et al., 2005]focused on the analysis of surgical decision-making when 3D visualizations of planningdata are presented in addition to the 2D radiologic images. Indeed, 3D visualizationproved to have an impact on the surgical strategy in selected clinical cases [Langet al., 2005]. To the knowledge of the author, no study exists which solely evaluatedthe impact of vascular risk analyses for liver surgery.
Therefore, the risk analysis by Preim et al. [2002] is not taken as a reference system.Instead, a conventional 2D/3D viewer application for planning data is utilized (cf.Fig. 3.8). While the 2D viewer visualizes the radiologic slice data, the 3D viewervisualizes the 3D models of vascular structures (hepatic vein, portal vein), the liversurface, and tumors. In addition, the application provides measurement tools forthe assessment of distances within the dataset.
Experiment Design
The study consisted of two separate experiments, called experiment A and experimentB. Each participant completed both experiments. In experiment A, the referencesystem as described above was presented. In experiment B, the utilized softwareapplication contained all functionalities that were included in the reference system.In addition, a volume-margin function of the dataset was visualized together with aninteractive visualization of vessels at risk and territories at risk (cf. Fig. 3.9).
In each experiment, participants were asked to analyze six CT datasets of the liver.The same six dataset were used in each experiment. For each dataset, surgeons hadto perform specific planning tasks by using the software assistant described above.These planning tasks consisted of:
• Determination of a virtual resection surface
• Selection of critical vessel structures which should be preserved
• Selection of potential areas of impaired inflow and outflow
In addition, participants completed a questionnaire for each dataset. The question-naire directly addresses the comparison criteria defined above and can be found inthe appendix (page 157). In the header of each questionnaire, a report on diagnosticfindings was given and the desired postoperative liver volume was specified (> 35%).
48

3.5. Evaluation
Figure 3.8: Screenshot of the reference system used in experiment A. The 3D viewerson the upper part show the portal vein (left) and hepatic vein (right).The 2D viewer below enables the exploration of the radiologic data.
Figure 3.9: Screenshot of the software application used in experiment B. The graphicaluser interface is identical, except that it contains the proposed riskanalysis. The volume-margin function is presented in the upper rightviewport, territories at risk in the upper left and upper middle viewport,and the radiologic data can be accessed in the lower viewport.
49

Chapter 3. Interactive Determination of Safety Margins
Each experiment was conducted as follows. First, participants were informed thatthe experiment takes between 60 and 90 minutes and that the time is measured duringthe experiment. Second, the software application was presented and its graphicaluser interface was explained. Third, a training dataset was loaded and participantsconducted the planning tasks for this dataset and filled out a questionnaire. The testsupervisor ensured that all questions and planning tasks were understood. Finally,five test datasets were loaded in random order. Participants were informed that theexperiment starts and that time is measured from now on. Analogous to the trainingphase, participants performed surgical planning tasks and filled out a questionnairefor each dataset. Verbal comments were transcribed during the experiment.
The experiments were performed in the context of two clinical workshops atAsklepios Clinic Barmbek, Hamburg, Germany (cf. Fig 3.10). Because not allsurgeons could take part at both workshops, several separate meetings took place.The distance between experiment A and B was always at least 3 weeks in order tominimize memory effects.
Medical Datasets
The case database consisted of six abdominal CT datasets (1 training dataset, 5 testdatasets). For each dataset, 3D models of the liver, hepatic vein, portal vein, andintrahepatic tumors were generated. The test datasets were selected according tothe following criteria:
• Presence of colorectal liver cancer
• Solitary metastases that are located adjacent to mayor hepatic vessels
• No presence of cirrhosis
Screenshots of the 3D models that were used in the context of the study are shownFig. 3.11.
Participants
Medical knowledge and experience in liver surgery planning are necessary to performthe planning tasks and to give meaningful answers in the questionnaire. For thatreason, the subject pool consisted of 10 liver experts (3 females, 7 males), including4 chief physicians, 1 senior physicians, 2 assistant physicians, 3 radiology technicians.The mean age of the participants was 41.45 years (± 4.7). The mean number ofyears of surgical experience were 15.6 (± 5.3), excluding the radiology technicians.
3.6 Results
Comparison of given assessments concerning patient resectability (Question 2)revealed that participants showed better agreement of answers in experiment B (cf.
50

3.6. Results
Figure 3.10: Workshop with liver surgeons at Asklepios Clinic Barmbek, Hamburg,Germany. The photo shows four participants and four test supervisors.
Fig. 3.12). In addition, the results show that participant’s decisions were much morecautious and less optimistic when using the risk analysis. For example, in case 1,two surgeons who rated a patient as “resectable” in experiment A changed theirdecision to “non-resectable” in experiment B. Furthermore, all participants whorated a patient as “resectable with a large safety margin” (> 5mm) in case 1, 3and 5 changed their decision to “resectable with a small safety margin” (< 5mm).Although there exist no significant differences between experiment A and B (p > 0.05,Wilcoxon test), the results indicate that the proposed vascular risk analysis enhancesthe awareness of surgical risk during in the planning stage.
Figures 3.13 - 3.17 illustrate the changes in the resection strategy that weremade in the study. The amount and direction of changes reveal that the risk analysishas different magnitudes of influence on surgical decision-making that depend, amongother factors, on the selected medical dataset. For cases 1 and 2, the changes showa clear trend towards the choice of smaller resections when using the risk analysis.The same trend, to a lesser extent, can also be observed for cases 4 and 5. For case3, the majority of subjects did not change their resection strategy when using therisk analysis.
The analysis shows that subjects changed their resection strategy in many cases.This is unsurprising, because it can be expected that when repeating experiment A(or B) several times with the same participants, the preferred resection strategy willnot be constant (test-retest variability). However, the changes observed in this studyfollow a clear trend towards the choice of smaller resection volumes in case the riskanalysis is available. This supports the above statement that the proposed methodsenhance the awareness of surgical risk.
51

Chapter 3. Interactive Determination of Safety Margins
(T) (1)
(2) (3)
(4) (5)
Figure 3.11: Selected datasets: Case T shows a visualization of the training datasetwith a peripherally located metastasis close to the MHV. Case 1, 3, and4 show datasets with centrally located liver metastases (yellow). In case2, the metastasis is located in the right liver lobe, while in case 5 it islocated in the left liver lobe.
52

3.6. Results
1
5
4
3
2
0% 100%80%60%40%20%(A)
1
5
4
3
2
0% 100%80%60%40%20%(B)
Figure 3.12: Assessed respectability for cases 1-5 in experiments A and B (white =“resectable with a large safety margin (> 5mm)”, light grey = “resectablewith a small safety margin (< 5mm)”, dark grey = “not resectable”).
Local or Bisect.
HemiExt.HemiTrisect.
Central
Non-Resectable
L
R
L
R
L
R
1
32
1
1
1 1
Figure 3.13: Changes in resection strategy for case 1. While a right hemihepatectomywas the most frequently chosen resection strategy in experiment A, 6participants changed their strategy in experiment B. The trend favorslocal resections (0/4) and rejecting surgical resection (0/2). Thesechanges indicate that participants underestimated risk in experiment Aand prefer a smaller resection volume in experiment B.
53

Chapter 3. Interactive Determination of Safety Margins
Local or Bisect.
HemiExt.HemiTrisect.
Central
Non-Resectable
L
R
L
R
L
R
3 1
1 3
2
1
Figure 3.14: Changes in resection strategy for case 2. Participants show a similartrend such as in case 1. Right hemihepatectomy and extended righthemihepatectomy were found to be the most appropriate resectionstrategies in experiment A. However, whereas local resections werenot taken into account in experiment A, five subjects chose a localresection. Analogously to case 1, these changes indicate that participantsunderestimated risk in experiment A and prefer a smaller resectionvolume in experiment B.
Local or Bisect.
HemiExt.HemiTrisect.
Central
Non-Resectable
L
R
L
R
L
R
2
1
1
1
3
11
Figure 3.15: Changes in resection strategy for case 3. The majority of subjects didnot change their resection strategy. No significant trend can be observedfor this case.
54
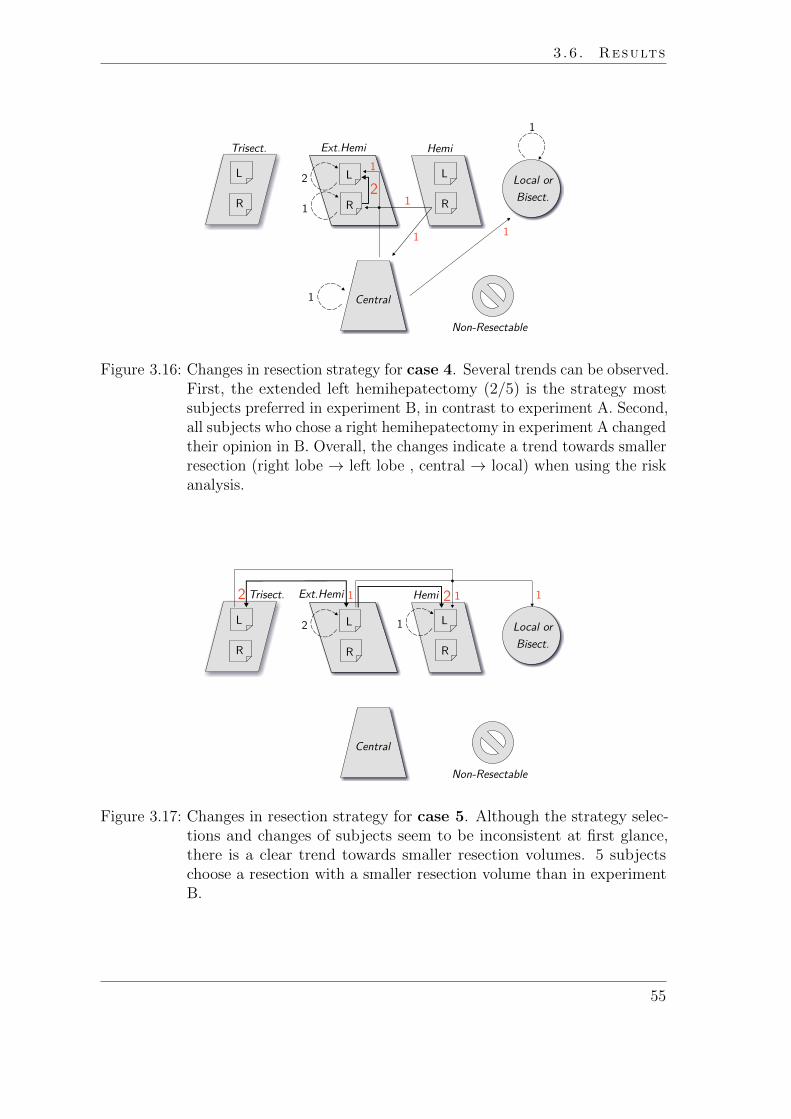
3.6. Results
Local or Bisect.
HemiExt.HemiTrisect.
Central
Non-Resectable
L
R
L
R
L
R
22
1
1
1
1
1
1
1
Figure 3.16: Changes in resection strategy for case 4. Several trends can be observed.First, the extended left hemihepatectomy (2/5) is the strategy mostsubjects preferred in experiment B, in contrast to experiment A. Second,all subjects who chose a right hemihepatectomy in experiment A changedtheir opinion in B. Overall, the changes indicate a trend towards smallerresection (right lobe → left lobe , central → local) when using the riskanalysis.
Local or Bisect.
HemiTrisect.
Central
Non-Resectable
L
R
L
R
L
R
2
1Ext.Hemi 12
1
12
Figure 3.17: Changes in resection strategy for case 5. Although the strategy selec-tions and changes of subjects seem to be inconsistent at first glance,there is a clear trend towards smaller resection volumes. 5 subjectschoose a resection with a smaller resection volume than in experimentB.
55

Chapter 3. Interactive Determination of Safety Margins
The analysis of selected safety margins widths showed that the variation ofvalues was lower for all cases in experiment B (cf. Fig. 3.18). Thus, subjects agreemore when the safety margin is chosen with the proposed risk analysis (experimentB) than with 3D measurement tools (experiment A). A selected safety margin widthdepends on the chosen resection strategy. Thus, the measured trend to choose smallerresection volumes in experiment B seems to have an influence on the width of safetymargins, or vice versa. Statistically significant differences were not found (p > 0.05,Wilcoxon test).
The comparison of times taken to complete the test tasks (cf. Fig. 3.19) revealedthat there are no significant differences between experiments A and B (p > 0.05,Wilcoxon test). However, the way surgeons used the provided 2D/3D visualizationtechniques was different in each experiment. In experiment A, the CT slices weremore often accessed than in experiment B (cf. Fig. 3.21). The numbers are manytimes higher in experiment A, especially for cases 1 and 2. An analysis of userinteraction during the experiments also showed that the amount of interaction withthe volume margin function was highest in cases 1 and 2 (cf. Fig. 3.20). Thisrelation indicates that interaction with the 2D slice data is required less when therisk analyses is extensively used.
Several surgeons stated verbally that the risk analysis is especially helpful in case1 (five surgeons), case 2 (three surgeons), and case 5 (two surgeons), because thepotential areas of risk are hard to identify with 3D planning models or 2D slices.However, three surgeons noted that the territories of risk visualized for the firstbranching of the left portal vein in case 5 is misleading, because this part of thevessel could be saved intraoperatively by applying a special cutting approach andwould therefore not represent a risk for the patient. Similar comments were alsomade for the inferior vena cava (extrahepatic vein with inflow of the hepatic vein).Participants suggested integrating a function that allows excluding specific vesselsfrom the risk analyses.
During the experiments, participants were asked to select potential areas ofpostoperatively impaired inflow and outflow and to rank the potential risk inthe questionnaire on an ordinal scale from 1 to 5. The analysis showed that the meanassessed risk for potential impaired outflow was higher for all cases in experiment B(cf. Table 3.1). The mean assessed risk for potentially impaired inflow was higherin three cases, equal in one case, and lower in one case (cf. Table 3.2). In addition,the standard deviation of given answers was smaller in the majority of cases forexperiment B. Statistically significant differences were not found (p > 0.05, Wilcoxontest).
There are several reasons why these subjective assessments are of limited validity.First, the areas of inflow and outflow strongly depend on the selected resectionstrategy. Because the selection of resection strategies was not homogeneous withineach experiment, the potentially impaired perfusion correlates with the selectedresection strategy. Second, an analysis of user interaction revealed that the riskanalysis has received relatively little attention when answering this question. Thus,most participants estimated risk of impaired inflow and outflow without directly
56

3.6. Results
l
ll
l
l
02
46
810
Case 1 Case 2 Case 3 Case 4 Case 5
Safe
ty M
argi
n (m
m)
A B A B A B A B A B
Figure 3.18: Selected safety margin widths for cases 1-5 in experiments A and B.
A B
3040
5060
70Ti
me
(min
)
Figure 3.19: Time needed by participants for the completion of test tasks in ex-periment A and experiment B. The antennas in the box plot visualizemaximum and minimum values. Data points that exceed the interquar-tile range more than one and a half time are defined as outliers.
57

Chapter 3. Interactive Determination of Safety Margins
0 200 400 600 800 1000 1200
Case 1
Case 2
Case 5
Case 4
Case 3
Figure 3.20: Number of values from the volume-margin function that were accessedin experiment B.
0 2000 4000 6000 8000 10000 12000
Case 4
Case 3
Case 2
Case 5
Case 1
Figure 3.21: Total number of CT slices that were accessed by participants in ex-periment A (light grey) and experiment B (dark grey) for datasets1-5.
58

3.6. Results
using a visualization of territories of risk. Third, the question was unambiguous.Participants had a different understanding of “potential” risk. Therefore, the resultsconcerning this question need to be handled with care.
The questionnaire asked participants to rank their confidence in decision-makingconcerning questions 2, 3, 5, and 6 on an ordinal scale from 1 to 4 (1 = very sure,2 sure, 3 = less sure, 4 = not sure). An analysis of the data revealed that thereexist no significant differences between experiment A and B (p > 0.05, Wilcoxontest). However, the mean values indicate that participants felt more confidence inexperiment A (cf. Table 3.3). An interesting observation in this context was thatseveral participants mentioned that it is even more difficult to make a final decisionwhen considering the additional information provided by the risk analysis. Twosurgeons mentioned that they selected “less sure” or “not sure” in experiment Bbecause they would prefer to discuss the resection strategy with colleagues beforemaking a final decision. Such verbal comments were not made in experiment A.The results of the user study can be summarized as follows:
• The risk analysis enhances the awareness of surgical risk in the planningstage (assessment of resectability, determination of resection strategy)
• Subjects prefer smaller resection volumes in case the risk analysis isavailable.
• Subjects agree more on the safety margins width in case the risk analysisis utilized.
• Subjects do not take more time when analyzing a dataset using the riskanalysis. In this context, 2D slices were less accessed in case the riskanalyses were available.
• A reliable statement on risk assessment of postoperative inflow and out-flow could not be made for this study.
• Confidence in decision-making is not higher when using the risk analyses.
Case A B
1 3.9 (±1.30) 3.5 (±1.13)2 4.6 (±0.67) 3.4 (±1.64)3 3.5 (±1.57) 2.3 (±0.82)4 2.9 (±1.51) 2.6 (±1.07)5 4.0 (±1.41) 3.1 (±1.10)
Table 3.1: Assessed risk regarding impaired outflow in experiment A and B (mean,σ). The assessments were made on a scale from 1 to 5, where 1 = “highrisk” and 5 = “no risk”.
59

Chapter 3. Interactive Determination of Safety Margins
Case A B
1 3.5 (±1, 36) 3.5 (±1, 01)2 3.4 (±1, 57) 3.9 (±1, 44)3 4.0 (±1, 26) 3.7 (±1, 41)4 4.0 (±1, 37) 3.0 (±1, 24)5 3.4 (±1, 69) 2.6 (±1, 07)
Table 3.2: Assessed risk regarding impaired inflow in experiment A and B (mean,σ). The assessments were made on a scale from 1 to 5, where 1 = “highrisk” and 5 = “no risk”.
Question A B
2 (Resectability) 1.9 (±0.63) 2.2 (±0.75)3 (Resection Surface) 2.0 (±0.68) 2.3 (±0.62)5 (Resection Strategy) 2.0 (±0.71) 2.2 (±0.77)6 (Safety Margin) 2.3 (±0.63) 2.4 (±0.63)
Table 3.3: Subjective confidence of participants based on a scale from 1 to 4 (1 =very sure, 2 sure, 3 = less sure, 4 = not sure). The confidence assessmentwas given after participants answered questions 2, 3, 5, and 6 in thequestionnaire.
In conclusion, the results show that the methods proposed in this work facilitate theprocess of liver surgery planning.
3.7 Discussion and Conclusion
New methods for risk analysis in liver surgery planning have been presented andevaluated in the context of this work. The methods enhance approved methods foroncologic risk analysis [Preim et al., 2002] by allowing interactive feedback aboutthe effect on the associated disruption of vascular perfusion. Previous studies in thefield of liver surgery planning evaluated only the impact of 3D visualization [Lamadeet al., 2000] and virtual resection planning [Lang et al., 2005]. Thereby, the planningdata was always evaluated against a presentation of 2D CT images. The studyperformed in this work investigated the usefulness of model-based risk analysis forliver surgery planning. The results of the study show that the proposed risk analysisinfluences important planning decisions for liver surgery.
An interesting result of the study is that confidence in decision-making wasnot significantly higher when using the risk analysis. The mean confidence values areeven higher without the risk analysis. There are several reasons for this result. First,all participants were quite familiar with the 3D planning models and the exploration
60

3.7. Discussion and Conclusion
of 2D slice data available in experiment A. Thus, the level of trust in the new riskanalyses was probably lower than in the established 2D/3D exploration techniques.This might have had an effect on the level of confidence. It is expected that the levelof confidence will increase after subjects are more familiar with the approach. Second,the additional information in experiment B enhanced the awareness of surgical riskand could explain why participants rated this as less confident. Thus, the subjectiveconfidence in decision-making might correlate with risk awareness of subjects.
The mean time to complete the planning tasks was not significantly lower whenusing the risk analysis. It would be interesting to measure if this were also true ifparticipants received more training. Another reason for this could be the increasein risk awareness that opened up new questions during the planning process. Thus,additional time was required. It is also assumed that the high difficulty of the selectedcases influenced the confidence of participants and the measured time.
The methods have been evaluated under controlled conditions within two separateexperiments. For the future, it would be desirable to prove the benefit of the proposedrisk analysis by evaluating them in clinical routine. This would require a clinicalstudy with a randomized decision regarding the utilization of the results of therisk analysis and the subsequent evaluation of clinical criteria, such as complicationrate, tumor recurrence, and blood loss [Schenk et al., 2008]. In addition, evaluationcriteria concerning the surgical decision making, as addressed in this chapter, couldbe utilized. In this context, factors, such as the anamnesis of the patient, degree ofliver disease, experience of the surgeon, and surgical technique need to be carefullyconsidered [Schenk et al., 2008]. In addition, such evaluation study could shed light onthe transfer of surgical plans to the actual patient. To achieve this, the preoperativemade decisions and the final preoperative resection plan could be compared withthe intraoperatively performed resection surface. Therefore, the performed resectionneeds to be measured intraoperatively, e.g., by using a surgical navigation system, oracquired using postoperative imaging such as proposed in Beller et al. [2008].
The question about the accuracy of the risk analysis arises in the context of thiswork and needs to be addressed. The safety map, which represents the basis of theproposed methods, assigns liver voxels to certain sections of the vascular trees inthe liver. Anatomically, a scaling problem exists because sections of the vessel treesthat actually drain or supply a liver territory are usually not traceable in the imagedata because they are too small. Choosing a model-based approximation is difficultbecause the inflow and outflow is realized by complex branching structures whoseformation process is not fully understood. A nearest-neighbor distance model toapproximate liver territories was chosen in this work; studies on human corrosioncasts revealed that this model assumption provided sufficient accuracy for liversurgery planning [Selle et al., 2002]. A challenging future task would be to the furtherevaluate this model assumption in clinical studies.
Because the accuracy correlates significantly with the quality of the underlyingimage data, reliable predication of liver tissue at risk must consider the quality ofthe vessel segmentation (branching generation). Therefore, a visualization of datauncertainty would represent a valuable extension of the proposed risk analysis.
61

Chapter 3. Interactive Determination of Safety Margins
The liver function of territories at risk is not considered in this work. It mainlydepends on the status of the liver parenchyma. This status varies within theparenchyma and is related to clinical parameters, such as the actual stage of liverdamage by chemotherapy or the stage of chronic liver disease. To make a more preciseand reliable statement about the potential risk of liver failure, the visualization ofterritories at risk should include functional information. This information could beestimated on the basis of functional liver tests [Asakuma et al., 2007; Stockmannet al., 2010; Graaf et al., 2010] or by applying MR imaging in combination withliver specific contrast agents [Yamada et al., 2011; Cho et al., 2011]. Therefore, thefunctional information needs to be integrated in computational models for vascularrisk analysis and virtual liver resection planning. This would provide more reliabledecision support, especially for patients with impaired liver function.
In conclusion, this work contributes to computer-assisted liver surgery planning.It lays a basis for further evaluations in the context of vascular risk analyses andindicates promising fields for further research.
3.8 Outlook: Non-Uniform Safety Margins
The methods presented so far are based on the assumption that the safety marginaround tumors always has a uniform width. This issue was criticized by severalparticipants of the performed evaluation study (cf. Sect. 3.6). They mentioned thatsafety margins cannot be assumed to be uniform in all cases. According to theircomments, the theoretical assumption that the distances between tumor and vesselare static could not be transfered into surgical reality. They suggested a separateanalysis of specific vessels in the planning phase.
A method to determine safety margins with non-uniform widths is introduced inthe following. Therefore, critical sections within the vascular trees of the liver aredetected automatically. By arranging these critical sections in a sorted table, thesurgeon may choose whether sections should be included or excluded from resection.
Detection and Analyses of Critical Vessel Sections
The detection and analysis of critical vessel sections is based on a directed, acyclicvessel graph G = (N,E), where nodes N represent furcations and edges E representbranches. Assuming that a safety margin with a uniform width w is already definedwith existing methods, this work proposes to analyze the vascular structures withinthis safety margin in detail.
The result of the vascular analysis described here provides detailed informationabout hepatic vessels that “collide” with safety margins with uniform widths ≤ w.Within the range [0, w] safety margins are analyzed in discrete steps using the stepsizes that can be defined by the user or set depending on the voxel size of the imagedataset. In each iteration, vessels at risk are calculated for the current safety marginwidth d. The affected liver volume Vd for a safety margin d is approximated on the
62
3.8. Outlook: Non-Uniform Safety Margins
basis of a Voronoi decomposition (nearest-neighbor distance model) as describedin [Selle et al., 2002]. In addition, Vd−s is defined as the affected liver volume for asafety margin width d− s. To identify critical vessel sections, the intersection volumeVdiff between Vd and its predecessor Vd−s is calculated. Thus, vessel sections thatmay cause a loss of liver volume can be located and quantified.
In case Vdiff is larger than a given volume threshold tV ol, the first skeleton voxel(starting from root of G) of the affected subtree is labeled as the start point ofthe critical vessel section. The end point of the critical vessel section is defined bythe next skeleton in the subtree that shows a minimal distance to the tumor > d(or the last skeleton if no skeleton fulfilling this requirement is found). Note that acritical vessel section can contain multiple end points. By this means, vessel sectionswhose transection causes significant loss of functional liver volume are detected.Quantitative information about critical vessel sections, such as Vdiff and d are storedin a table for further processing (described in the next subsection).
If the affected subtree contains more than one critical vessel section, it may beimportant to know if a detected critical vessel section depends on other critical vesselsections. Two special cases are considered. First, a critical section on a lower treelevel Clow may show a larger distance d to the tumor than a critical section Cup onan upper tree level (cf. Fig. 3.22a). In that case, the surgeon may want to choosedifferent distances or want to preserve Cup. In addition, the algorithm must considerthe dependency between these critical sections, for example, by forcing the userto preserve Clow while discarding Cup. In the second case, a critical section Clow
may show a smaller minimal distance d to the tumor than a critical position Cup
(cf. Fig. 3.22b). In that case, the surgeon may preserve both critical sections usingdifferent distances or, alternatively, decide to preserve only Cup.
Algorithmically, the subtree is traversed in level order, beginning at the root.Thereby, critical vessel sections located in the highest tree level are labeled as firstorder sections, while dependent critical sections are labeled as second, third, andfourth order sections, and so on. The algorithm for the detection and analysis ofcritical vessel sections can be summarized as follows:
d = sWhile (d ≤ w)
For (all affected subtrees)Compute Vd, Vd−s
Vdiff = Vd − Vd−s
If (Vdiff > tV ol)Label start and end position of sectionIf (additional critical section)
Label all sections depending on tree hierarchyd = d + s
63

Chapter 3. Interactive Determination of Safety Margins
T4 26
D d=4mm
D d=6mm
D Cup
D Clow
(a)
T4 26
D d=6mm D Cup
D d=4mm D Clow
(b)
Figure 3.22: Special cases that have to be considered if the affected subtree containsmore than one critical vessel.
From Uniform to Non-Uniform Safety Margins
The algorithm described above provides a set of critical vessel sections along withimportant attributes such as the amount of affected liver volume, distance to thetumor, and type of vessel. To define a non-uniform safety margin, planning eitherpreservation or resection must be decided for each critical section. Because thisdecision may be significant for the patient prognosis and depends on many medicalfactors such as anamnesis of the patient and surgical technique, this work proposesto allow the surgeon to make these important decisions. Therefore, each criticalsection is arranged in a risk table as shown in Fig. 3.23a. Each row of the risk tablerepresents a critical vessel section that was identified with the methods describedabove. The checkboxes in the first column allow selecting or deselecting the vesselsection from resection. The second column visualizes the minimal distance of thisvessel section to the tumor, i.e., the possible margin width at this location. Thethird column shows the vessel type (also visualized through the small icon in thefirst column), and the fourth column represents the amount of affected liver volume.The volume is given in ml and percentage of the total functional liver volume.
The user chooses which critical section to preserve by activating the associatedcheck box in the risk table. Therefore, visualization and interaction techniques thatallow quick assessment of vessel sections are provided (cf. Fig. 3.24). By selectinga critical section in the risk table following the 3D position of the vessel section ishighlighted in the 3D visualization using contrasting color, and the associated livervolume at risk is calculated and visualized . To allow a fast update of the affectedliver volume for a selected vessel section, a precomputed 3D texture (similar to thesafety map introduced in Sect. 3.4.2) is exploited. This 3D texture assigns a uniquevessel section ID to each liver voxel. Thus the affected liver voxels for a specific vesselsection can be accessed using a transfer function on the 3D texture, and interactiveframerates can be achieved.
64

3.8. Outlook: Non-Uniform Safety Margins
(a) (b)
Figure 3.23: (a) Risk table for the determination of non-uniform safety margins and(b) corresponding risk graph. The discontinuities of the volume-marginfunctions in the risk graph directly correspond to entries in the risktable. Note that the risk table enables a more detailed visualization ofthe risk distribution, e.g., two portal venous risk volumes are presentedat a safety margin of 1.4 mm. In addition, a hierarchical dependency isindicated, e.g., for the fourth critical vessel section with safety margin2.9 mm.
Besides using the set of automatically calculated critical sections, arbitrary vesselsections can be labeled in the 3D visualization. These positions are subsequentlyanalyzed in a similar fashion, described in the previous subsection, and are insertedinto the risk table.
Concluding Remarks
Non-uniform margins, as introduced in this work, support the decision of excludingvessels within a uniform margin from transection. This opportunity may increase theamount of postoperative residual liver volume. Theoretically, non-uniform marginscould also increase the probability of histologically unclear margins. However, thisissue has been controversially discussed in recent years. Recent studies reportthat expected narrow surgical margins should not exclude patients from potentiallycurative surgery [Pawlik et al., 2005; Salloum et al., 2008; Muratore et al., 2010].Thus, patients not thought to be candidates for resection due to insufficient residualliver volume may indeed become eligible for curative surgery. The definition ofresection plans based on non-uniform safety margins could be a valuable tool in thiscontext.
The new method allows a planning of safety margins by considering sub-centimeterwidths. The question of whether this accuracy is necessary for preoperative planningarises, because it can generally not be realized during common liver interventions.
65

Chapter 3. Interactive Determination of Safety Margins
(a) (b)
(c) (d)
Figure 3.24: Risk visualizations that correspond to different selected items of therisk table shown in Fig 3.23a. (a) shows the corresponding visualizationfor the selected item with distance 2.9 mm (portal vein), while (b) and(c) show the risk visualization for its subitems with distances 0 mmand 1.4 mm. Note that the critical vessel sections shown in (b) and(c) depend on the preservation of (a) as indicated in the risk table. (d)shows the risk visualization for the hepatic vein by selecting the itemwith distance 4.3 mm. The critical vessel section is highlighted in red.The associated liver volume is visualized as a transparent isosurface.The isosurface is colored blue for areas that are supplied by the portalvein and green for areas that are drained by the hepatic vein.
66
3.8. Outlook: Non-Uniform Safety Margins
However, recent developments in navigated liver surgery show that a precise transferof planning data in the operating room is feasible (cf. Sect. 2.2.4). It can beanticipated that navigation accuracy for liver resection surgery will further increasein the next years. Together with a precise surgical planning such as the one proposedin this work, borderline patients that are treated palliatively with the techniquesavailable today may be selected as candidates for curative surgery in the future.
In conclusion, non-uniform safety margins represent a valuable extension to theestablished concept of uniform safety margins. In combination with navigated liversurgery the concept has the potential to improve the treatment of liver tumors.
Publications The first part of this chapter which describes the determination of uniformsafety margins (Sect. 3.4.1-3.4.3) was published as an abstract and presentation at the 22thCongress for Computer Assisted Radiology and Surgery (CARS), Berlin, Germany [Hansenet al., 2009a]. In addition, an extended version was published in the International Journalof Computer Assisted Radiology and Surgery [Hansen et al., 2009b]. The method forthe determination of non-uniform safety margins and the performed evaluation were notpublished at the time of submission of this thesis.
67


4 Intraoperative Adaptation ofPlanning Data
There is nothing more constant thanchange.
(Charles Darwin)
The more complex and dangerous a procedure, the more effort is ofteninvested in planning [Zachow et al., 2010]. However, to achieve the bestpossible result, almost every plan needs to be adapted during execution
because of events that were unexpected at the time of initial planning. An illustrativeexample of such an event is a little car accident on a highway that causes a big,unexpected traffic jam. Car navigation systems take such events into account andcalculate an adapted route plan.
69

Chapter 4. Intraoperative Adaptation
4.1 Clinical Background and Purpose
Computer-assisted risk analyses support surgeons in the planning phase. Basedupon safety margins around each tumor, disturbances of blood supply and drainagewithin the remaining liver parenchyma can be computed, quantified, and visualizedpreoperatively (cf. Chapter 3).
Using IOUS during oncological liver interventions, between 19% and 33% ofpatients show additional tumors [Ellsmere et al., 2007; Sietses et al., 2010; Shahet al., 2010]. Although the diameter of these intraoperative findings is smaller than 1cm in the majority of cases [Hata et al., 2011], changes to the resection strategy arereported in 18 % to 90 % of these cases [Zacherl et al., 2002; Conlon et al., 2003;Wildi et al., 2008; Mazzoni et al., 2008]. A tool to intraoperatively adapt risk analysesand resection proposals (including volumetric information) would be beneficial incase the resection strategy needs to be updated.
Closely related to the adaptation of planning data is the control of intraoperativeplanning software. Interfaces for surgeon-computer interaction need to considerspecific requirements such as the cognitive load, workflow, sterility, and workspace ofsurgeons. Besides the adaptation of risk analyses and resection proposals, appropriateinterfaces could also enable intraoperative adaptation of the planning model’s visualrepresentation.
This chapter presents methods for the adaptation of surgical planning data in caseof intraoperative findings. Thereby, oncologic risk analyses and resection proposalsare addressed. In addition, the chapter provides first results and an outlook oftechniques for automatic generation of oncologic resection proposals.
4.2 Related Work
Several groups developed sophisticated planning applications for liver surgery [Meinzeret al., 2002; Bourquain et al., 2002; Ayache, 2003; Reitinger et al., 2006]. However,these applications were restricted to the preoperative planning stage. Appropriateuser interfaces for the adaptation of planning data in operating rooms (risk analysesand resection proposals) are not available. This section reviews two approaches inthe field of computer-assisted surgery that aim to adapt surgical planning data inthe operating room. Furthermore, related methods for surgeon-computer interactionare reported.
Adaptation of Planning Data
An initial concept for the adaptation of risk analyses in case of newly found tumorswas presented by Ritter et al. [2005]. They proposed to determine tumor attributesby means of mouse interactions on a notebook inside the operating room. With thismethod, location and radius of a newly found tumor are marked within a single sliceof the original CT data by mouse clicks and dragging. Thus, the result of the risk
70

4.2. Related Work
analyses depends on the mental ability of a surgeon to transfer location and radius oftumors into the planning dataset. The approach is not designed for sterile areas, butrather for a second physician who controls the application away from the operatingtable.
Other groups have developed methods to estimate organ deformation using in-traoperative registration methods in order to adapt preoperative imaging to theintraoperative situation. For an overview refer to Sect. 2.2.4. Thereof, a promisingapproach by Feuerstein et al. [2008] is described, where an optically tracked mobileC-arm is applied during laparoscopic liver surgery. Instead of using preoperativeplanning data, they work directly with the intraoperatively acquired CT images.Thus, vessel positions can be updated and directly superimposed onto the laparo-scopic video stream. Assuming that new tumors are visible in the intraoperative CTdata, their approach could be enhanced to consider these additional tumors.
Surgeon-Computer Interaction
Commercially available interaction devices have been used in the sterile area ofoperating rooms for years. In many cases, touchscreens are used, e.g. in laparoscopicliver surgery [Schlichting, 2008] or in open liver surgery [Peterhans et al., 2010]. Adisadvantage of touchscreen is that they need to be wrapped in a sterile plasticsheath during surgery. According to observations by the author, the plastic sheathconsiderably reduces the image quality and leads to interaction errors. In addition,touchscreen interaction is only possible if the surgeons’ hand can reach the display.During liver surgery, this is often hard to achieve because of limited space aroundthe examination table.
Nowatschin et al. [2007] proposed to install a 3D mouse close to the surgeon in orderto allow the interaction with a surgical navigation system. 3D mice are appropriateto support a precise rotation of 3D models, however, they are inappropriate forsimple (but essential) interaction tasks such as the selection of objects.
Other systems attempt to detect finger positions using stereo cameras [Chojeckiet al., 2009] or TOF cameras [Penne et al., 2009] to control a mouse cursor. Ritteret al. [2009] track the movements of hands to allow simple interaction tasks such asrotating geometric planning models or triggering of events via buttons.
Several groups use surgical navigation systems (intended to localize surgicalinstruments) to track a sterilizable pointer in the operating room [Fischer et al., 2005;Reitinger et al., 2006]. In addition, Fischer et al. [2005] introduced a sterile sticker withdistinct patterns that can be tracked optically. Being fixes on an appropriate surgicalinstrument, the instrument is used to interact with the navigation system. Accordingto the literature, none of these approaches has been systematically evaluated underintraoperative working conditions.
71

Chapter 4. Intraoperative Adaptation
4.3 The Intraoperative Planning Assistant
A new application for intraoperative adaptation of planning data, termed the In-traoperative Planning Assistant (IPA), is proposed. In order to provide surgeonswith an interface to the IPA, appropriate interaction devices and methods for theintraoperative inspection of surgical planning data are presented.
Several methods introduced in this section employ an ultrasound-based navigationsystem, and their benefit depends on proper alignment of preoperative data tothe intraoperative situation. Hence, the navigation system’s setup and the appliedregistration technique are reported. Subsequently, novel methods for intraoperativeadaptation of planning data are introduced. First, a method for intraoperativeadaptation of oncologic risk analyses is described. Second, methods for the in-traoperative adaptation of resection proposals through the modification of apreoperatively defined virtual resection surface are presented. The probe of anultrasound-based navigation system and, alternatively, the Wii Remote pointingdevice are proposed as intraoperative interaction devices. Third, techniques forthe intraoperative adaptation of the visual representation of planning data areproposed. All described methods are implemented within the IPA.
Navigation System
In this work, a prototypical ultrasound-based navigation system for laparoscopicliver surgery with electromagnetic tracking is utilized (cf. Fig. 4.1). The systemis developed by the Institute for Robotics and Cognitive Systems at Universityof Lubeck, Germany. A detailed description can be found in [Hildebrand et al.,2007]. The system is equipped with a touchscreen that can be used as a device forsimple interaction tasks during surgery. An important feature of the ultrasound-based navigation system is its ability to act as service provider and consumer in aservice-oriented architecture (SOA) [Strahle et al., 2007], which allows registeredcomputer systems in the operating room to grab the current navigation data, includingthe corresponding ultrasound image, via a network connection. This architecture,together with a well-defined exchange protocol, is the basis for the communicationbetween the IPA and the navigation system.
Intraoperative Registration
In order to calculate the relative position of surgical instruments to preoperativeplanning data, a registration between the IOUS images and the preoperative planningdata is necessary. The registration algorithm is developed by the Institute ofMathematics and Image Computing at University of Lubeck, Germany.
The algorithm requires the definition of a small set of corresponding landmarksin both the preoperative radiological data (before surgery) and the IOUS images(during surgery). For this purpose, bifurcations of hepatic vessels are used becausethey are relatively good to detect in IOUS. Intraoperative landmarks are acquired
72
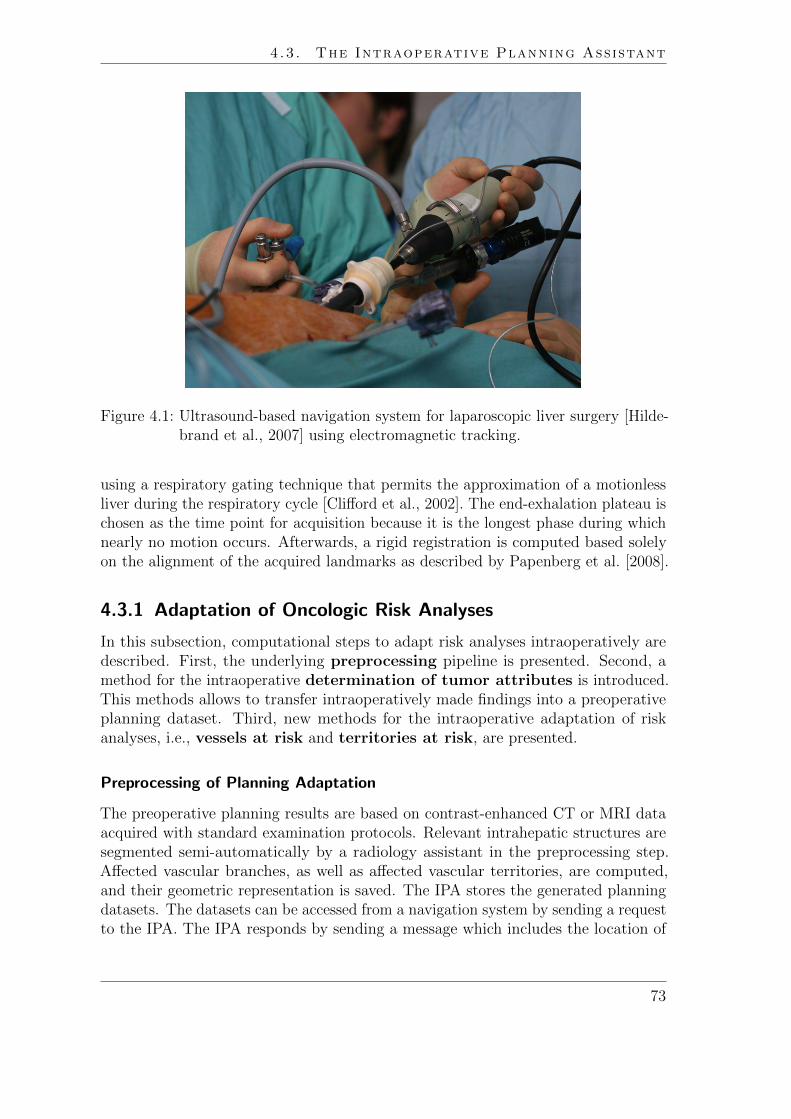
4.3. The Intraoperative Planning Assistant
Figure 4.1: Ultrasound-based navigation system for laparoscopic liver surgery [Hilde-brand et al., 2007] using electromagnetic tracking.
using a respiratory gating technique that permits the approximation of a motionlessliver during the respiratory cycle [Clifford et al., 2002]. The end-exhalation plateau ischosen as the time point for acquisition because it is the longest phase during whichnearly no motion occurs. Afterwards, a rigid registration is computed based solelyon the alignment of the acquired landmarks as described by Papenberg et al. [2008].
4.3.1 Adaptation of Oncologic Risk Analyses
In this subsection, computational steps to adapt risk analyses intraoperatively aredescribed. First, the underlying preprocessing pipeline is presented. Second, amethod for the intraoperative determination of tumor attributes is introduced.This methods allows to transfer intraoperatively made findings into a preoperativeplanning dataset. Third, new methods for the intraoperative adaptation of riskanalyses, i.e., vessels at risk and territories at risk, are presented.
Preprocessing of Planning Adaptation
The preoperative planning results are based on contrast-enhanced CT or MRI dataacquired with standard examination protocols. Relevant intrahepatic structures aresegmented semi-automatically by a radiology assistant in the preprocessing step.Affected vascular branches, as well as affected vascular territories, are computed,and their geometric representation is saved. The IPA stores the generated planningdatasets. The datasets can be accessed from a navigation system by sending a requestto the IPA. The IPA responds by sending a message which includes the location of
73

Chapter 4. Intraoperative Adaptation
relevant data files, providing quantitative information (XML) and geometric objects(VRML), which can be downloaded via FTP (see exchange protocol in Fig. 4.6 onpage 80). This data exchange allows a simultaneous visualization of 3D planningmodels and navigated 2D ultrasound on the screen of the ultrasound-based navigationsystem.
Intraoperative Determination of Tumor Location and Size
As discussed above, the result of oncologic risk analyses in the liver depends on theposition and dimension of tumors and their safety margins. If additional tumors arediscovered during surgery, risk analyses (vessels at risk and territories at risk) areincomplete and thus no longer valid. It is assumed that intraoperatively detectedtumors are relatively small (diameter ≤ 1cm) [Hata et al., 2011] and approximatelyspherical in shape.
To define position and size of new tumors, the navigation system’s touchscreenis used. Therefore, the surgeon labels the tumor inside the 2D ultrasound viewby defining the tumor center with a single click and determining the size of thetumor by dragging a finger towards the tumor’s border. Thus, a circle is definedin the 2D ultrasound image (cf. Fig. 4.8). Subsequently, center position and circleradius are transformed from ultrasound image coordinates into world coordinatesof the preoperative planning dataset by considering registration and calibrationmatrices as described in Schlichting [2008]. This transformation is calculated by theultrasound-based navigation system. To achieve reliable results, it should be notedthat the definition of the sphere should happen in the same respiratory phase as theperformed intraoperative registration.
After tumor attributes have been determined, the navigation system sends a requestto the IPA containing the new tumor size and position. In case the IPA is availablein the network, the coordinates of the circle and the radius are transferred to theIPA using a communication protocol that was designed together with medical devicevendors (Siemens Healthcare and Drager Medical). The IPA checks if the patientID from the currently loaded dataset in the IPA corresponds to the patient ID sentby the navigation system. If this comparison is successful, the request is confirmed.Otherwise, the IPA sends the confirmation after loading the corresponding datasetor sends an error message to the navigation system if loading was unsuccessful.
Adaptation of Vessels at Risk
If the request is accepted by the IPA, the position and radius provided by thenavigation system are used to raster a sphere inside a tumor segmentation maskSTum. STum contains all preoperative segmented and intraoperatively acquiredtumors of the patient dataset. To create a visualization of vessels at risk, a Euclideandistance transformation is applied to STum. The Euclidean distance transformationis used to query the minimum distance from each vessel voxel to STum in constantcomputation time. Thus, vessels at risk are identified and relabeled inside the vessel
74

4.3. The Intraoperative Planning Assistant
graph G depending on standard safety margins widths (5 mm, 10 mm, and 15 mm)around tumors (cf. Fig. 4.2). After the computation has finished, the updatedplanning models are loaded onto an FTP server. Subsequently, the IPA sends arequest to the navigation system, informing about the availability and location of newplanning data. The new planning models are thereafter automatically downloaded bythe navigation system via FTP (cf. Figure 4.6 on page 80 for the exchange protocoldefined between IPA and navigation system).
Adaptation of Territories at Risk
The visualization of vessels at risk provides information about the vessels which areadditionally affected when applying a certain safety margin around the detectedtumors. According to involved clinical partners, updated quantitative informationabout the amount of liver volume with probable impaired inflow and outflow couldbe an intraoperative benefit. Therefore, the option to adapt the affected territoriesat risk is provided.
In order to calculate territories at risk, a 3D Voronoi decomposition (nearest-neighbor distance model) with respect to G is calculated to approximate the impairedliver volume for each safety margin width (cf. Fig. 4.3). This procedure has to beapplied for each vascular system provided by the IPA. However, during the clinicaltests described below, the adaptation was constrained to the two main vessel systems,i.e., hepatic vein and portal vein. Finally, the 3D representation of the territoriesat risk and corresponding volume information are calculated. The updated volumeinformation is arranged in an XML file, while all 3D models are saved in a standardfile format (VRML).
The updated 3D planning models of territories at risk as well as the XML file areuploaded to an FTP server. Subsequently, the IPA sends a request to the navigationsystem that new territories at risk are available by providing information about thelocation of the data.
4.3.2 Adaptation of Resection Proposals
Once a risk analysis has been adapted intraoperatively, the preoperative resectionproposal should be adapted. This includes the definition of a new resection surfacethat divides the liver in the intended remaining and resection volumes. The amountof remaining volume is of utmost importance because it determines if a patient isresectable or not. In contrast to the preoperative planning stage, there is a lack ofcomputer-assisted tools to support this decision intraopertively.
In this subsection, two interaction methods for the intraoperative adaptation ofresection proposals are presented. The first method is based on position data from atracked ultrasound probe; the second method uses the interaction device Wii Remote.
75
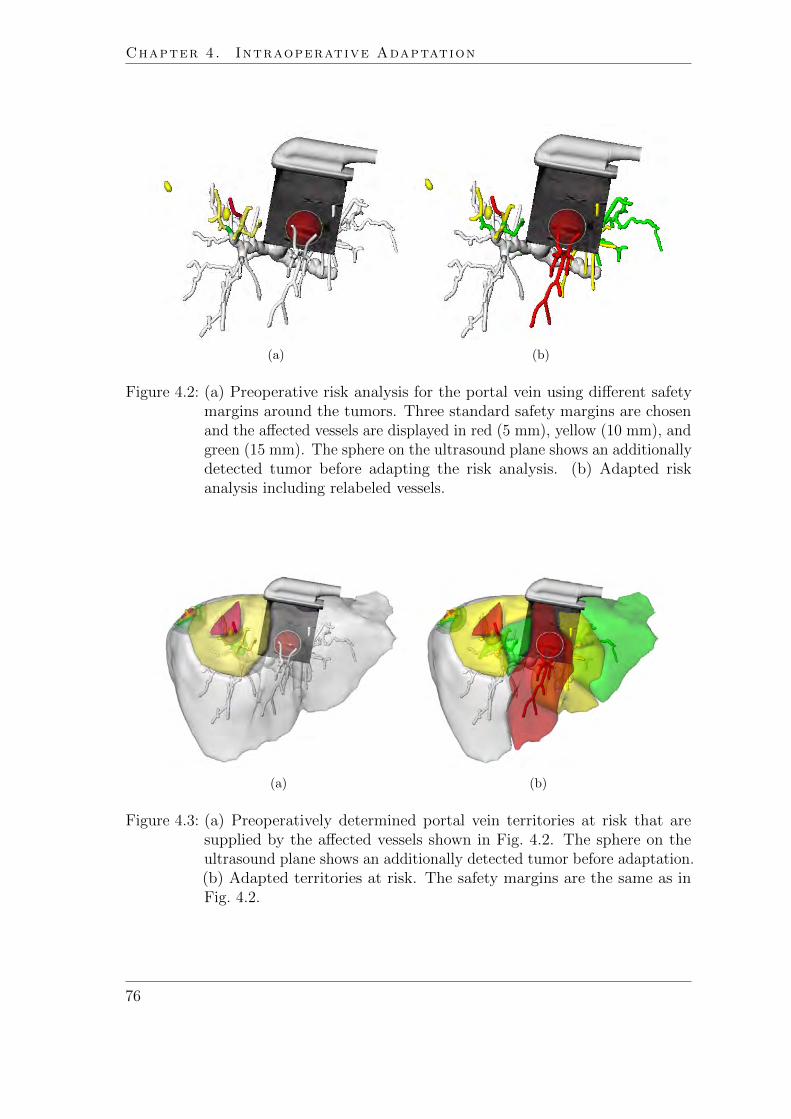
Chapter 4. Intraoperative Adaptation
(a) (b)
Figure 4.2: (a) Preoperative risk analysis for the portal vein using different safetymargins around the tumors. Three standard safety margins are chosenand the affected vessels are displayed in red (5 mm), yellow (10 mm), andgreen (15 mm). The sphere on the ultrasound plane shows an additionallydetected tumor before adapting the risk analysis. (b) Adapted riskanalysis including relabeled vessels.
(a) (b)
Figure 4.3: (a) Preoperatively determined portal vein territories at risk that aresupplied by the affected vessels shown in Fig. 4.2. The sphere on theultrasound plane shows an additionally detected tumor before adaptation.(b) Adapted territories at risk. The safety margins are the same as inFig. 4.2.
76
4.3. The Intraoperative Planning Assistant
Intraoperative Adaptation based on Tracking Information
A method that uses a tracked probe of an ultrasound imaging system as an intra-operative interaction device is presented. The interaction method can be used toredefine a preoperatively defined resection proposal intraoperatively or alternativelyto define a completely new resection proposal.
The surgeon determines the desired position and orientation of the resection surfaceon the patient’s liver using a tracked ultrasound probe. While taking the informationon the ultrasound image into account, risk structures such as important vessels canbe considered. The procedure is divided in three steps:
(1) Preprocessing
(2) Plane definition
(3) Update of planning data, return to step (2) if necessary
Let us take a look at these steps in detail:
(1) Preprocessing: The preprocessing is the same as the preprocessing stepsdescribed for the update of oncologic risk analyses in subsection 4.3.1. Inaddition, all 3D mask images that were used to define the selected resectionproposal are cached.
(2) Plane definition: The plane definition is performed with the navigationsystem. Therefore, a simultaneous visualization of ultrasound probe and theresection proposal is provided on the screen of the navigation system. Todefine a new resection surface, a method to save the geometric representationof a current ultrasound plane in the planning dataset is provided. Theplane is confirmed using a button on the navigation system’s touch screen.The plane’s normal determines the part of the liver to be resected. It isdisplayed as an arrow widget in the center of the plane and can be swappedusing the touch screen. When the definition of the plane is completed,the navigation system sends an update request to the IPA that containsinformation about the plane position and normal.
(3) Update of planning data: When the IPA receives a request from thenavigation system, the halfspaces of the defined plane are voxelized into abinary mask HS. This is performed by a raster function algorithm thattakes the plane position and normal as input. Let SLiv be the preoperativesegmentation mask of the liver, the resection volume RS (RS ⊂ SLiv)and the remnant volume RM are provided from the preoperative planningphase. The new resection liver volume RSnew and the new remnant volumeRMnew are calculated as follows:
RSnew = RSold ∨HS (4.1)
77

Chapter 4. Intraoperative Adaptation
RMnew = RMold ∧ ¬HS (4.2)
Thus, the result considers both, the preoperative defined volumes RSold
and RMold and the intraoperative defined volume HS (cf. Fig. 4.4a). Inaddition, an option to exclude the preoperative resection mask from thecalculation is provided:
RSnew = HS (4.3)
RMnew = ¬HS (4.4)
This allows defining a new resection surface independent from the preop-eratively defined one. Finally, the virtual resection surface that bordersRSnew and RMnew is calculated. Therefore, a dilation D is applied onRSnew. Subsequently, RSnew is subtracted from D(RSnew) to calculate thehull of RSnew. A logical conjunction between SLiv and this hull deliversthe adapted resection surface.
In some cases, preoperatively segmented tumors lie closely to the virtualresection surface. To avoid that the tumor (or parts thereof) are counted asRMnew, pre-computed safety margins of the tumors are accessed and usedto change the shape of a virtual resection surface. This ensures that tumorsand their safety margins are automatically labeled as RMnew. Finally,the volumes of RMnew and RMnew are calculated and geometric surfacerepresentations of the updated volumes are generated (cf. Fig. 4.5b).
After computation of all surface representations, the IPA sends a response to thenavigation system including the location of relevant data files. These files provideupdated volumetric information (XML) and geometric objects (VRML) which canbe downloaded via FTP (cf. Fig. 4.6). This data exchange allows a simultaneousvisualization of updated planning data and tracked surgical instruments on thenavigation system’s screen. To sculpt non-planar resection surface the surgeon canreturn to step (2) and define an additional plane (cf. Fig. 4.4b).
Intraoperative Adaptation using a 3D Pointing Device
A general interaction device to adapt planning data (without the need of a surgicalnavigation system) would be beneficial. Preliminary user tests in our institute showed,that a pointing device such as Nintendos Wii Remote turned out to be appropriatefor intraoperative interaction tasks like modifying and refining a virtual resectionsurface or basic user interactions in 3D such as the rotation of planning models.
The Wii Remote is a wireless pointing device for Nintendo’s gaming consoleWii [Nintendo, 2011]. Its motion-sensing capability, based an optical sensor andan accelerometer, allows the user to interact with items on a screen. Recent APIsprovide data exchange between the Wii Remote and an arbitrary operating system
78

4.3. The Intraoperative Planning Assistant
(a) (b)
Figure 4.4: Adaptation of a resection proposal using a tracked ultrasound probe.(a) A new plane within the liver is defined. The displayed plane normaldetermines the part of the liver to be resected. (b) A second plane isdefined in order to optimize the shape of the new resection surface.
(a) (b)
Figure 4.5: (a) Preoperatively planned right hemihepatectomy with hepatic vein.The left part of the liver model shows the parenchyma to be resected(red), while the right part is intended to remain (green). The smallnodules in the left part represent preoperatively segmented metastases.(b) Adapted resection proposal. The added sphere close to the middlehepatic vein represents an intraoperatively determined tumor.
79

Chapter 4. Intraoperative Adaptation
Figure 4.6: Exchange protocol defined between ultrasound-based navigation systemand IPA based on a SOA.
using the open Bluetooth standard for data transfer. Thus, the pointing device runsindependently of Nintendo’s gaming console and can be used in other applications.
To utilize the optical sensor technology of the Wii Remote, a sensor bar has to belocated near the interaction screen. The sensor bar features ten infrared LEDs withfive LEDs being arranged at each end of the bar. The Wii Remote can locate theLEDs (i.e., the relative position of the interaction screen) by means of an integratedinfrared camera. This allows controlling the mouse pointer by moving the WiiRemote. As shown in Fig. 4.7, the device offers several interaction buttons and adirectional pad which can be mapped to mouse clicks, keyboard inputs, or evencomplex instructions. To allow haptic and acoustic feedback, basic audio and rumblefunctionality is provided.
An open source Bluetooth API [WiiMote API, 2011] for the Wii Remote wasintegrated into the IPA to use the capability of the Wii Remote. For the evaluationin the operating room (described below), the device was wrapped in a sterile plasticsheath. To allow an intraoperative adaptation of resection proposals, existinginteraction techniques for the modification of virtual resections were extended forthe use with the Wii Remote, i.e., ’drawing into slices’ and ’drawing onto a virtual3D liver surface’ (refer to Sect. 2.2.2 on page 22).
For drawing into slices, the A button (cf. Fig. 4.7) is reserved to define aresection line in a slice while the B button is used to pick and translate theseresection lines. The accelerometer and IR tracking data allow for movement directionand speed information to be reported, with which the mouse cursor is controlled.To navigate through a stack of slices, the surgeon moves the Wii Remote in theintended direction while pressing the 1 button. The speed and direction of navigationis also determined through the accelerometer and IR tracking data of Wii Remote.For stepwise navigation through a stack of 2D images, e.g. viewing exactly the CT
80

4.4. Evaluation
A ButtonButtons(-, home, +)
Buttons(1,2)
Directional Pad
B Button
Figure 4.7: Wii Remote wrapped in a sterile plastic sheath. The photo was takenduring the evaluation of the WiiMote interaction in the experimentaloperating room of the Institute of Biomedical Optics, University ofLubeck, Germany. The annotations show the positions of interactionbuttons on the WiiMote.
image below the currently selected CT image, the user may also employ the + and -buttons.
To draw onto a virtual 3D liver surface, the A button is used to draw aninitial line set, while the B button is used to deform the cutting plane. View rotationis performed in 22.5o steps around the x and y axes of the camera coordinate systemand can be controlled with the directional pad. Pressing the Home button resetsthe view to the standard camera position. Rotating the model by using the opticaltracking system was not implemented, as an informal user test preformed under labconditions showed that participants (two surgeons, two computer scientist, and onestudent of computer science) spent too much time trying to attain a desired cameraposition. Another reason for using the directional pad for the rotation tasks was thefact that it can also be used without a line of sight between the Wii Remote and thesensor bar.
4.4 Evaluation
To evaluate the IPA, a feasibility study was conducted. The study has been performedin cooperation with technical partners from the Institute for Robotics and CognitiveSystems, University of Lubeck, Germany and clinical partners from the Department ofGeneral and Visceral Surgery, University Hospital Lubeck, Germany. The experiments
81

Chapter 4. Intraoperative Adaptation
were conducted in an experimental operating room of the Institute of BiomedicalOptics, University of Lubeck, Germany. The feasibility study addressed followingaspects:
(1) Technical feasibility
(2) Integration of the IPA in the surgical workflow
(3) Time in that a planning adaptation is achievable
To evaluate the technical feasibility, two experiments on a tumor mimic model ofthe liver are described. Subsequently, three experiments performed in the context ofan animal study with pigs are reported.
Evaluation with a Tumor Mimic Model
To simulate an intervention in the liver, a perfusable ex vivo tumor mimic model ofthe liver was utilized. Four tumor mimics were injected (a mixture consisting of 3%agarose, 3% cellulose, 7% glycerol, and 0.05% methylene blue) creating hyperechoiclesions in ultrasound and CT [Schlichting, 2008]. Afterwards, CT images were acquiredand vascular risk analyses and a resection proposal for the model were prepared.
To prove the technical feasibility of the adaptation of planning data, one ad-ditional tumor mimic was injected into the model after performing the CT scan.The planning model was registered to the IOUS using a landmark-based registra-tion approach [Papenberg et al., 2008]. Subsequently, the tumor mimic model wascompletely scanned with the tracked IOUS and the additional tumor mimic wassearched and detected. The position and extension of the finding were determined(cf. Fig. 4.8) and transferred to the IPA. New vessels at risk and territories at riskwere calculated as described in Sect. 4.3.1 and provided at the navigation systemsdisplay (cf. Fig. 4.9). In a second experiment with the tumor mimic model, riskanalyses as well as the adaptation of the resection plan were tested.
The planning adaptation was performed by two scientist who were familiar withthe use of the ultrasound-based navigation system.
Evaluation within an Animal Study
In order to verify the described concepts within a surgical environment, the tech-niques were applied in an animal study with pigs that was conducted in the contextof the FUSION project. The goal of the study was to evaluate usability and naviga-tion accuracy of the navigation system for laparoscopic liver surgery as describedin [Hildebrand et al., 2008]. In the context of this study, the adaptation of riskanalyses and resection proposals was evaluated during laparoscopic liver resection intwo surgical cases.
The detailed protocol of the animal study has already been described in the thesisof Schlichting [2008]. In summary, two to three sterile gold fiducials (IZI Medical
82

4.4. Evaluation
Figure 4.8: Touchscreen of the utilized navigation system [Hildebrand et al., 2007].The lower right part shows an IOUS image where a tumor mimic is cur-rently detected. The upper right part of the screen shows the laparoscopicvideo image. The left viewport visualizes the detected tumor mimics andthe territories at risk of a porcine liver.
Figure 4.9: Evaluation of the IPA within an experimental operating room (Instituteof Biomedical Optics, University of Lubeck, Germany) using a tumormimic model. The left screen belongs to the IPA; the right screen belongsto the navigation system.
83
Chapter 4. Intraoperative Adaptation
Products, Baltimore, MD, USA) were inserted in the liver under ultrasound guidance.These fiducials simulated small tumors inside the liver. Subsequently, a contrast-enhanced CT scan was acquired, and the fiducials and relevant anatomical structureswere segmented and 3D planning data (including risk analyses and a resection plan)was prepared. The surgical resection was performed approximately one week later.
During surgery, a landmark-based registration between IOUS and preoperativeplanning models was performed. Furthermore, two additional gold fiducials wereplaced in the liver in order to simulate the detection of new tumors. The intraopera-tively placed fiducials were detected by the surgeons using the tracked IOUS andmarked on the ultrasound display of the navigation system. Subsequently, the IPAprovided updated risk analyses and resection proposals which were defined by thesurgeons (using the tracked ultrasound plane) to guide the laparoscopic instruments.
In a third experiment (cf. Fig. 4.11), the surgeons were asked to define a newresection surface using the Wii Remote. Therefore, the planning models, includingthe preoperatively planned resection surface, were visualized on the display of theIPA. In addition, the tumor mimic captured with the ultrasound-based navigationsystem was inserted in the model. The Wii Remote was inserted in a sterile plasticsheath and given to the surgeon.
4.5 Results
The experiments with the tumor mimic model showed that the concepts for intraoper-ative planning adaptation described in Sect. 4.3.1-4.3.2 are technically feasible. Theimplemented communication protocol between navigation system and IPA turnedout to be an appropriate way for platform independent data exchange. The com-munication allowed a distributed development and combined the strengths of bothsystems.
The experiments within the animal study showed that the participated surgeonswere able to determine the location and size of intraoperatively detected gold markers.The touchscreen of the navigation system was found to be an appropriate interactioninterface for this task. In contrast, the determination of resection proposals usingthe tracked ultrasound device turned out to be relatively inconvenient. Defining acomplex shape, like a curved surface (approximation the shape by a set of planes)lead to a lengthy interaction task.
The Wii Remote is a intuitively manageable interaction device for the IPA, espe-cially for the adaptation of resection proposals. To allow precise user interaction, thelocation of the interaction screen, its size, and the distance between user and screenmust be adequate. Assuming a 19” display, a distance of 0.5 − 3.0 m between userand screen turned out to be adequate for the intended interaction tasks. The sterileplastic sheath influenced the control of the Wii Remote only marginally. Only theactivation of the B button, which is located on the bottom side of the Wii Remote,was more difficult than without the plastic sheath. Therefore, it is proposed to usethis button for less important functions. The plastic sheath did not influence the
84

4.5. Results
(a)
(b)
Figure 4.10: Animal study in the experimental operating room of the Institute ofBiomedical Optics, University Lubeck, Germany. While the ultrasound-based navigation system (a) is located in the sterile area of the operatingroom, the IPA (b) runs on a workstation outside of the sterile area.
85

Chapter 4. Intraoperative Adaptation
Figure 4.11: Interaction with the Wii Remote in an experimental operating room(Institute of Biomedical Optics, University of Lubeck, Germany).
performance of the infrared camera.
Within the animal study, the adaptation of risk analyses was performed in lessthan one minute (see hardware specification for test system at Sect. 8), which is anacceptable time frame in clinical routine. Thereby, only one plane was defined usingthe tracked ultrasound device to get a rough estimation of the remaining liver volume.Because the calculations for the planning adaptation were performed independentlyfrom the surgical navigation system on a peripherical computation unit (IPA), theultrasound-based navigation system could be used for further exploration of the liverwithout performance losses.
4.6 Discussion and Conclusion
So far, preoperative risk analyses and resection proposals for liver surgery wereof limited value during interventions if resection strategies needed to be updated.In this work, a software assistant for intraoperative adaptation of planning data,i.e., the IPA, is presented and evaluated. The performed experiments confirm thatthe described concept for intraoperative adaptation of planning data is technicallyfeasible. In addition, the new computer-assisted planning adaptation integrated wellin the surgical workflow of navigated liver interventions. The underlying interactionconcepts allows an intuitive and quick determination of additional findings.
The accuracy of the proposed methods is an important point for discussion. Thesuccess of an intraoperative adaptation of planning data correlates with inaccuraciesin tracking and the applied registration technique. It is important to measure how
86

4.7. Outlook: Automatic Generation of Resection Proposals
inaccuracies in tracking and registration influence the adaptation of planning data.In experiments described in this chapter, registration landmarks are acquired at equalrespiration time points. As a result, the registration is only valid on the same pointin the respiratory cycle and only as long as no further mobilization or repositioning ofthe patient occurs. Besides the registration inaccuracy, the accuracy of the trackingsystem and the calibration of the ultrasound probe to the tracking system is anothercritical point. The root-mean-square error of both calibration and tracking sums upto a landmark localization error of approximately 4 mm [Hildebrand et al., 2008],neglecting the liver movement. Although recent advances in navigated liver surgeryindicate a continuous minimization of these errors [Beller et al., 2009b; Peterhanset al., 2010], inaccuracies have always to be taken into account in future applications.Therefore, an analysis and visualization of uncertainty would be a valuable extensionof the IPA.
Another important topic for discussion is the applicability of the IPA in clinicalroutine concerning usability and workflow. If an ultrasound-based navigation systemis used during surgery, no additional interaction device has to be installed in orderto adapt a resection proposal intraoperatively. This is one of the great advantages,because additional interaction devices demand additional space and setup time.However, the level of detail of adapted resection surfaces is limited when using thetracked ultrasound probe as a planar sculpting tool. In addition, it might lead tolengthy interaction tasks as described above. It can be assumed that such interactionis not applicable in clinical routine and would only be used in exceptional cases.
In the case of the Wii Remote interaction, the ultrasound information is not used.Consequently, both modification techniques have clear limitations. A combination ofboth seems to be promising, i.e., to use the tracked ultrasound probe to define a firstapproximation of the desired resection plane, and subsequently use the Wii Remoteor alternatively a sterilizable, trackable pointer as described in the patent by Broers[2005] for refinement.
In conclusion, the proposed combination of planning adaptation and intraoperativenavigation provides surgeons with an efficient tool for quantitative risk assessment incase of changes in the resection strategy. The IPA has the potential to provide majorsupport for decision-making during oncologic liver surgery and thus may improvethe safety of surgical interventions. However, before using the IPA in clinical routinefurther studies concerning accuracy and usability are necessary.
4.7 Outlook: Automatic Generation of ResectionProposals
The IPA provides valuable tools to adapt resection proposals intraoperatively. Theadaptation is performed interactively in that the surgeon defines the orientation andshape of the resection surface. However, this approach has several disadvantages.First, the human-computer interaction needed to define the resection proposal is
87

Chapter 4. Intraoperative Adaptation
prone to error [Demedts, 2010] and consumes time. Second, the resultingresection proposal is not standardized and varies depending on the experienceand endurance of the user (refer to the user study described by Demedts [2010]).Therefore, an automated generation of resection proposals would be of great benefit.
In the following, new methods for automatic generation of resection proposalsare presented. The methods extend previous approaches [Preim et al., 2002; Thorn,2004; Beller et al., 2008] which attempt to generate resection proposals using vascularterritories. The evaluation is performed by comparing the automatically generatedresection proposals with resection proposals which were manually defined on CTdatasets of the liver by radiology technicians.
Recall that there exist two kinds of resection types in oncologic liver surgery (referto Sect. 2.1.3 on page 7). Whereas resection surfaces for anatomical resection arebased on the boundaries the liver segments defined by the portal vein (cf. Fig. 2.1),resection surfaces for non-anatomical resection, e.g., wedge resections, do notconsider these anatomical boundaries. This work addressed both resection types.
Generation of Anatomical Resection Proposals
For anatomical resections, the boundaries of the portal venous territories guide theresection proposal. Therefore, the terminology of anatomical resections describedby Lang [2007] is utilized (cf. Fig. 2.1 on page 10). In a pre-computation step,portal venous territories are calculated as described in Selle et al. [2002] and providedas a 3D image TPV . In addition, the segmentation mask of the liver SLiv and thesegmentation mask of hepatic tumors STum are provided from previous planningsteps.
As illustrated in Fig. 4.12 the proposed algorithm is described in five steps: First,portal venous territories affected by the tumors are identified by comparing TPV
with STum. If the percentage volume overlap between an affected territory and thetumor is above a predefined threshold, the territory is labeled as affected. Second,the set of affected territories is mapped to a set TRes of territories which conform toan anatomical resection volume. Third, help markers are generated at the borders ofTRes, fulfilling the condition that the markers are located inside of SLiv. Fourth, aplane is defined by applying a PCA on the help markers and using the two largesteigenvectors. Fifth, the plane is divided into a regular grid and transformed inorthogonal plane direction to fit the set of help markers. As described by Konrad-Verse et al. [2004], this is performed by scanning all grid cells and testing whetherany help marker is projected in this cell. Finally, SLiv is divided into two parts bythe deformed plane. These two parts are termed the remnant volume and theresection volume. Volume fractions for this subsets of SLiv are calculated in mland percentage.
In case the user is not satisfied with the result, the utilization of the deformablecutting plane within this procedure allows for further adaption of the proposal. Thisis particularly important because main branches of the hepatic vein are often locatedalong anatomical resection surfaces. Thus, additional vessels not directly affected by
88

4.7. Outlook: Automatic Generation of Resection Proposals
the tumor might be part of the resection volume. In case this is not the intention ofthe user, the resection proposal calculated on the basis of the portal vein territoriescan be adjusted appropriately.
Generation of Non-Anatomical Resection Proposals
For the generation of non-anatomical resection proposals, two different methods areproposed. The first method considers geometric constraints of the tumors andthe liver surface (geometric method). The second method attempts to generate aresection proposal based on an estimation of vascular perfusion (perfusion-basedmethod). The perfusion is thereby simulated by means of a vascular risk analysis (cf.Chapter 3).
Initially, both methods require the selection of the tumor that should beresected non-anatomically. This is required, because non-anatomical resections areoften combined with other resections, e.g. for patients with metastasis in both liverlobes. The selection of the tumor is done by picking the tumor in a 3D viewer whichvisualizes all segmented tumors. This procedure is only applicable in the planningstage after the segmentation result of tumors is available. For generation of resectionproposals during surgery, an intraoperative selection and determination of tumorposition and extent using IOUS as introduced in Sect. 4.3.1 is proposed.
Both methods require the determination of a safety margin around each tumor.Because an evaluation of different safety margins is not applicable intraoperatively,standard safety margins that are determined by the surgeon (e.g. 5 mm for colorectalliver metastases) are proposed for intraoperative applications. SLiv and SLes areprovided from previous planning steps.
The geometric method defines the resection surface solely based on the selectedtumor, its safety margin, and the 3D models of the liver surface. First, an accesspath from the tumor to the liver surface is calculated. The access path is definedas a 3D line segment that has its start point in the geometric center of the tumor.The end point is defined as a point on the convex hull of the liver model that showsthe shortest Euclidean distance to the tumor center. The convex hull of the livermodel is used because otherwise locations on the liver fissures, in particular the portahepatis, might have the shortest distance to the tumor center though it is not usualto resect a tumor from this direction.
Second, a 3D object is generated and aligned to the line segment. The objectconsists of a half sphere combined with a truncated cone. The diameter of the halfsphere is defined by the maximum diameter of the tumor plus the determined safetymargin. The circular base of the truncated cone has the same radius as the sphere.The center point of the sphere is fixed to the tumor center. The axis of the truncatedcone is aligned with the 3D line segment.
The perfusion-based method generates a resection proposal based on a vascularrisk analyses as presented in Chapter 3. First, the territories at risk regarding theportal vein drainage and the hepatic vein supply are determined. The territoriesat risk contain the tumor and its safety margin. Recall that the size and shape of
89

Chapter 4. Intraoperative Adaptation
Affected PV territoriesPVTREST
Alignment of deformable mesh
Final resection proposal
User interaction
Figure 4.12: Computational steps to calculate anatomical resection proposals.
territories at risk depends on the width of the defined safety margin.Second, the intersection volume of both territories is calculated (cf. Fig. 4.13).
The intersection volume represents a volume that is potentially necrotic tissue afterresection because it is neither supplied nor drained according to the vascular riskanalysis. Third, an access path is calculated analogous to the geometric method.Instead of the tumor center, the center of the intersection volume is utilized tocalculate the access path. Contrary to the geometric approach, the diameter of thehalf sphere is defined by the maximum diameter of the intersection volume.
For both methods (geometric and perfusion-based) SLiv is divided into two volumefractions and the user can perform quick modifications by dragging the deformable3D mesh of the proposed resection surface if necessary.
Evaluation
The methods were evaluated by comparing their resection volumes with resectionvolumes that were manually defined by medical technicians. For the manual definition,a virtual resection tool using a deformable cutting plane [Konrad-Verse et al., 2004]was utilized.
For the evaluation of automatically generated anatomical resection proposals, 10CT liver datasets from LDLT donors were selected. These datasets did not containany diagnosed malignities. For each CT dataset, a medical technician manuallydetermined five anatomical resection surfaces according to the nomenclature of Lang
90

4.7. Outlook: Automatic Generation of Resection Proposals
Territory at risk (PV)
Territory at risk (HV)
Intersection volume withdeformable mesh
User interaction
Figure 4.13: The volumes of territories at risks from portal vein and hepatic vein areused to define an intersection volume. Subsequently, a deformable meshis fitted on the boundaries the intersection volume.
et al. [2005] by considering following five groups of liver resection:
(1) Left Hemihepatectomy and Extended Right Hemihepatectomy
(2) Right Hemihepatectomy and Extended Left Hemihepatectomy
(3) Left Lateral Sectionectomy and Right Trisectionectomy
(4) Right Posterior Sectionectomy and Left Trisectionectomy
(5) Central Resection
Note that an anatomical resection surface may belong to two resection types (thepairs are grouped above). In this cases, the shape of the resection surface is identicalbut the location of remnant and resection volume are reversed (cf. Fig. 2.1 on page10). Overall, the test database for the anatomical resections consisted of 45 manuallydefined resection surfaces (5 resection planes per group, and 10 resection volumes foreach resection type, respectively).
For the evaluation of automatically generated non-anatomical resection proposals,44 colorectal liver metastases were selected from 42 CT datasets. For these datasets acomputer-assisted resection planning was performed. Analogous to the evaluation ofanatomical resections, these resection proposals were defined by medical technicians.
Automatically and manually generated resection proposals were compared pair-wise regarding a similarity measure between the resection volumes. As a similarity
91

Chapter 4. Intraoperative Adaptation
measure the Dice coefficient (DC) between the resection volumes was used. TheDC of two volumes x and y is defined as
2 · |x ∩ y||x|+ |y|
, (4.5)
where x represents the remnant volume and y the resection volume or vice versa.
Results
Post-experiment analysis revealed that several of the automatically generated anatom-ical resection volumes coincide very well with the resection volumes defined manu-ally by medical technicians (cf. Table 4.1). Nevertheless, automatically generatedresection surfaces located in the right liver lobe, i.e., Right Posterior Sectionectomy,Left Trisectionectomy and Central Resections, showed comparatively poorer results.A visual comparison with the manually defined resection surface revealed that themanually defined resection surfaces within the right liver lobe do not align withportal venous territories. Instead, parts of the the right hepatic vein are often usedas a border for these resections. A subsequent discussion with medical techniciansconcerning this issue revealed that the consideration of the right hepatic vein wouldbetter fit to the needs of most surgeons.
Apart from that, the consideration of the hepatic vein should be important for allresection types. A subsequent analysis of the utilized 3D planning models provedthat the borders of the portal vein territories align quite well with the middle andleft hepatic vein. This fact was not found to be true for the right hepatic vein.
The analysis of non-anatomical resections provided different result dependingon the generation methods (geometric-based, perfusion-based) and the selected safetymargin (cf. Table 4.2 and 4.3). The best DC was achieved for the perfusion-basedmethods. Overall, the variation is much higher and the mean DC is considerablylower compared to the anatomical approach. There might be several reasons forthese differences. First, the access path calculation used in the proposed methodis relatively simple (shortest path between tumor center and the convex hull of theliver). From a surgical point of view, this methods let to non-optimal access paths.Second, the proposed methods for non-anatomical resections are sensitive againstchanges in the safety margin. This is especially true for the perfusion-based method.
Concluding Remarks
As expected, the outcome of the proposed algorithms is not exactly the same asthe manually planned resection proposals. As shown by Demedts [2010], manuallydefined resection proposals do not provide a gold standard. The chosen safety margin,the access path, and thus the location and extend of virtually planned resectionvolumes may vary depending on the medical user. A task for future evaluationstudies might be to find a more appropriate benchmark. One possible solution couldbe to ask more than one surgeon to define the best possible resection proposal for
92
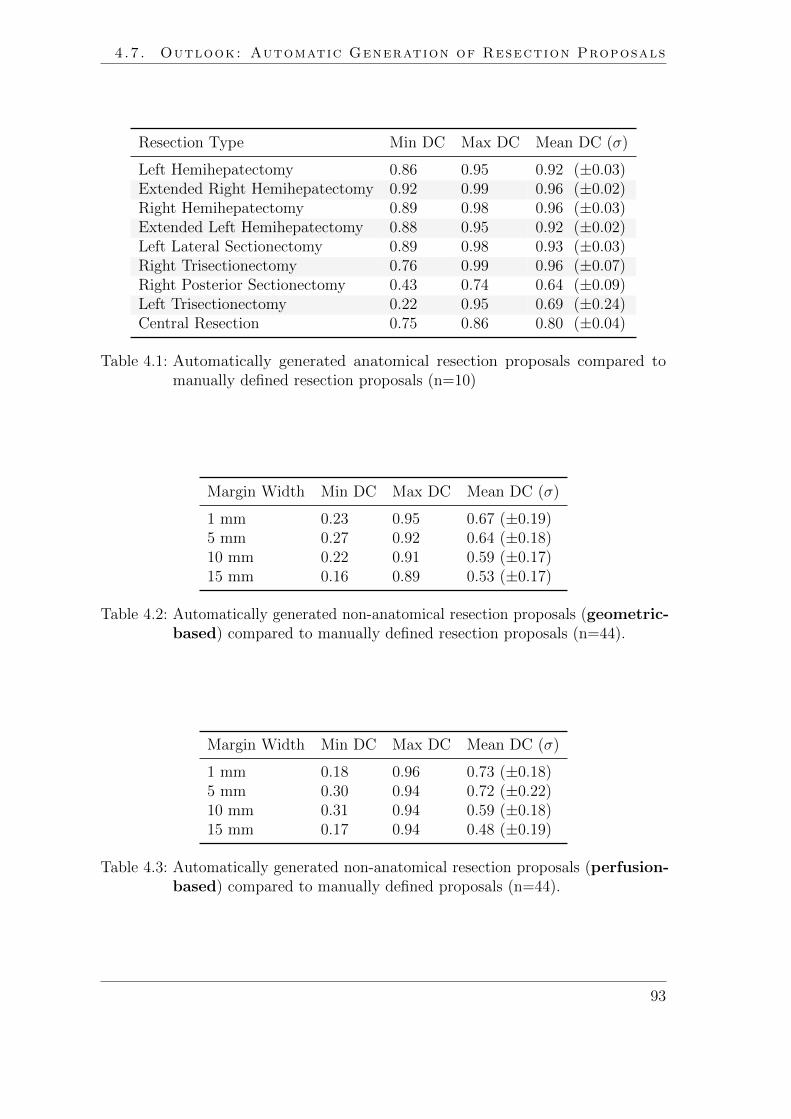
4.7. Outlook: Automatic Generation of Resection Proposals
Resection Type Min DC Max DC Mean DC (σ)
Left Hemihepatectomy 0.86 0.95 0.92 (±0.03)Extended Right Hemihepatectomy 0.92 0.99 0.96 (±0.02)Right Hemihepatectomy 0.89 0.98 0.96 (±0.03)Extended Left Hemihepatectomy 0.88 0.95 0.92 (±0.02)Left Lateral Sectionectomy 0.89 0.98 0.93 (±0.03)Right Trisectionectomy 0.76 0.99 0.96 (±0.07)Right Posterior Sectionectomy 0.43 0.74 0.64 (±0.09)Left Trisectionectomy 0.22 0.95 0.69 (±0.24)Central Resection 0.75 0.86 0.80 (±0.04)
Table 4.1: Automatically generated anatomical resection proposals compared tomanually defined resection proposals (n=10)
Margin Width Min DC Max DC Mean DC (σ)
1 mm 0.23 0.95 0.67 (±0.19)5 mm 0.27 0.92 0.64 (±0.18)10 mm 0.22 0.91 0.59 (±0.17)15 mm 0.16 0.89 0.53 (±0.17)
Table 4.2: Automatically generated non-anatomical resection proposals (geometric-based) compared to manually defined resection proposals (n=44).
Margin Width Min DC Max DC Mean DC (σ)
1 mm 0.18 0.96 0.73 (±0.18)5 mm 0.30 0.94 0.72 (±0.22)10 mm 0.31 0.94 0.59 (±0.18)15 mm 0.17 0.94 0.48 (±0.19)
Table 4.3: Automatically generated non-anatomical resection proposals (perfusion-based) compared to manually defined proposals (n=44).
93

Chapter 4. Intraoperative Adaptation
each dataset. This would increase the information value of the comparison resultcould lead to a better and more complete evaluation.
For further developments it would be important to know if participants couldreliably distinguish between manually and automatically generated method andwhich parameters influence their decision. An evaluation study similar to a Turingtest could provide this information. Therefore, a set of virtual resection proposalscould be presented to surgeons separately and in sequence. While not providinginformation about the underlying generation method, participants could be asked toselect the resection proposal they think is most appropriate for the patient.
A valuable extensions of the non-anatomical approach would be the improvement ofthe access path calculation. Therefore, multiple criteria such as a preferred directionor the spatial relation to adjacent lesions and vessels might be considered. A promisingapproach would be a combination with sophisticated access path calculations forliver tumor such as presented by Schumann et al. [2010].
It is an ambitious task to automatically create feasible resection proposals and itremains unclear whether this is even possible for all cases. However, in simple anatom-ical situation, the proposed methods achieve reasonable results, as demonstrated inthis work.
Publications Large parts of this chapter are published in different scientific papers. Apreliminary version of the methods for intraoperative adaptation of risk analyses waspresented at the 6th Annual Meeting of the German Society of Computer- and Robot-Assisted Surgery, Karlsruhe, Germany [Hansen et al., 2007a]. An improved and extendedversion including first results of the performed evaluation was presented at the SPIE MedicalImaging conference, San Diego, USA [Hansen et al., 2008b]. The methods for adaptationof resection proposals were presented on the 23th congress for Computer Assisted Radiologyand Surgery (CARS), Barcelona, Spain and published in the International Journal ofComputer Assisted Radiology and Surgery [Hansen et al., 2008d]. The final version of theIPA was presented on the MICCAI Workshop on Image Guidance and Computer Assistancefor Soft-Tissue Interventions, New York, USA [Hansen et al., 2008c]. Work concerning theinteraction with the Wii Remote was published together with Felix Ritter in the journal ofi-com within a special issue for Human-Computer Interaction in the Operating Room [Ritteret al., 2009].A first approach for the automatic generation of resection proposals has been implementedby Bjorn Lindow within his master’s thesis (supervised by the author) [Lindow, 2009].Longquan Chen implemented a conical raster function within the scope of a student project(supervised by the author). The methods were further evaluated and extended within thecontext of this dissertation and have been presented on the 24th congress for ComputerAssisted Radiology and Surgery (CARS), Genf, Switzerland [Hansen et al., 2010c].
94

5 Surgical Risk Maps
Less is sometimes more.
(Proverbial saying)
Many similarities exist between aeronautical navigation and the emergingfield of navigated liver surgery. However, few pilots would prefer to navigatetheir aircraft based on 3D models of virtual buildings, mountains, or clouds.
Instead, the information pilots need for navigation is highly specific and abstract.Modern aeronautical cockpits are therefore equipped with displays which show theoptimal flight path on distance-encoded maps (cf. Fig. 5.1).
Analogously, the work presented in this chapter aims to strip the superfluousinformation (the information not needed during surgery) from the preoperativemodels and only provide information required during surgery (critical structures andnavigation aids).
95

Chapter 5. Surgical Risk Maps
Figure 5.1: Maps in the in the cockpit of an aircraft during the approach of amountainous island. The topographic map in the upper right visualizesthe position of the aircraft and the location and height of surroundingmountains.
Figure 5.2: Common representation of a 3D planning model for liver surgery in theoperation room. In cases in which interaction with the planning model isimpossible or inapplicable, critical structures along the resection surface(red) are difficult to perceive.
96

5.1. Purpose
5.1 Purpose
Optimal display of preoperative planning data in the operating room is challenging.Although advanced navigation systems for liver surgery are currently used in clinicalstudies, an expressive and effective intraoperative visualization of 3D planning modelsis still a pressing need.
During navigated liver surgery, visualizations of 3D planning models are currentlyused for guiding tracked surgical instruments. However, these 3D visualizationswere actually intended for the exploration during the preoperative planning stage.As shown in Fig. 5.2, the intraoperative represented models often portray complexgeometries and therefore demand cognitive effort and user interaction, especially ifthe surgeon wants to use them as a navigation aid. However, during surgery it isimportant that the surgeon focuses on the operating field and not on the navigationdisplay on which the planning models are presented. Therefore, the presentationof information during surgery calls for a context-driven reduction of complexity.Attention should be focused on the preoperatively planned resection surface, adjacenttumors, and vessels at risk.
The objective of this work is to visualize surgically relevant information usinga map display. Therefore, a new approach for risk analysis and visualization ofplanning models is presented that provides relevant information at a glance withoutthe need for user interaction.
5.2 Related Work: Map Displays in Diagnosis andTreatment Planning
Map displays play an important role in diagnosis and medical treatment planning.They are mostly applied to reduce the exploration space from 3D to 2D. This sectionreviews important work in this field.
The introduction of virtual colonoscopy provided a new, non-invasive way to findpathologies in the colon. Because of the length of the colon, its inspection is timeconsuming and prone to errors [Hong et al., 2006]. Instead of navigating throughthe 3D model of the colon, Haker et al. [2000] introduced virtual colon flattening.The main challenge in this field is to provide a map that provides minimal distortionand preserves the shape of polyps. Research in this field is described in numerouspublications, e.g., [Hong et al., 2006; Yao et al., 2010; Zeng et al., 2011] to name afew.
In neuroscience, cortical brain flattening is applied to compare patterns of brainactivity across different individuals. The differences are usually hard to comparebecause of differences in cortical folding and functional foci are often buried withincortical sulci [Hurdal et al., 2009]. Similar to colon flattening, the minimization ofdistortion is a main challenge in order to provide a meaningful visualization. Fora comprehensive overview of mapping techniques in this field refer to Hurdal et al.
97

Chapter 5. Surgical Risk Maps
[2009]. Apart from comparing brain activity patterns, maps are used for planning ofneurosurgical interventions. In order to assist surgeons in selecting an access pathto a target by avoiding risk structures, Navkar et al. [2010] proposed access mapsfor neurosurgery. Therefore, blood vessels are projected on the skin model of thepatients head. The depth of the vessels is color-coded. A preliminary evaluationstudy indicated that the maps provide efficient planning support for procedures suchas biopsy, tumor ablation, and deep brain stimulation.
In myocardial imaging, the so-called bulls eye plot is a commonly used visual-ization technique to represent the viability of the left ventricular myocardium. Theviability is color-coded in a single 2D map. Therefore, a long-axis mapping of themyocardium is calculated based on late enhanced cardiac MRI images. Termeeret al. [2007] describe several techniques to further enhance conventional bulls eyeplots. Particularly, they propose to annotate the map with the locations of coronaryarteries. In addition, interaction and visualization techniques are provided to relatea selected area of the bulls eye plot to the 3D anatomy.
In the field of radio-frequency ablation, Rieder et al. [2010b] introduced the tumormap. It represents a pseudo-cylindrical mapping of a color-coded tumor surface on a2D map. Colors encode simulated post-interventional coagulation zones. The tumormap allows for an immediate detection of residual tumor tissue and thus providesan effective way to assess the treatment success. A related approach for cerebralaneurysm surfaces is presented by Neugebauer et al. [2009]. They map the result ofa 3D blood flow simulation on a 2D map. This provides an overview visualization aswell as a bidirectional link to the 3D data.
5.3 Risk Maps for Liver Surgery
The aim of this work is to reduce the visual complexity of 3D planning models bymapping surgically relevant information onto a risk map. Therefore, methods for theidentification and classification of critical anatomical structures in the proximity ofa preoperatively planned resection surface are introduced (Sect. 5.3.1). For quickdistance assessment during the intervention (without human-computer interaction), itis crucial to provide adequate spatial hints on the risk map. To visualize the distancefrom the resection surface to the critical structures shadow-like distance indicatorsare proposed (Sect. 5.3.2). In addition, contour lines are utilized to accentuate shapeand spatial depth (Sect. 5.3.3).
5.3.1 Identification of Critical Structures
During a liver resection, the proximities of critical structures (vessels and tumors) tothe resection surface need to be determined frequently. However, not all structuresadjacent to a preoperatively planned resection surface are critical structures. Theircriticality depends on several factors, such as the associated functional volume loss,their spatial relation to other structures, and the distance to the resection plane.
98

5.3. Risk Maps for Liver Surgery
Whereas Lamata et al. [2008] classified all structures close to the resection surface ascritical and are thus still confronted with a high number of structures to visualize,this work proposes to analyze the criticality of these structures in detail to reducethe number of visualized items.
To calculate critical regions along a resection surface, it is important to classifyanatomical structures with respect to their importance. Potential critical structuresinclude:
• Tumors
• Hepatic vessels
For tumors, the minimal distance to the resection surface is the main criterion,because contact with cancer cells must be avoided. Therefore, tumors are classifiedas critical structures if the minimum distance between a preoperatively defined safetymargin around the tumor and the resection surface is smaller than a given threshold.The threshold can be determined by the surgeon.
For hepatic vessels, the identification of critical branches requires a more intensiveanalysis. Apart from the minimal distance to the resection surface, the associatedfunctional volume loss V is a main criterion to define a branch as critical. Thecriticality analysis is based on an acyclic graph G = (N,E), where nodes N representvessel furcations and edges E represent branches.
Given a centerline voxel GI of an edge EJ located inside the resection volume, itsdistance to the resection surface is irrelevant, because GI is planned to be resectedanyway. The same holds true for vessel sections inside the remnant volume whoseparent branches are located inside the resection volume (cf. Fig. 5.3). In these cases,the criticality C of a centerline voxel GI is set to 0. In all other cases, vessels thatare critically close to the resection surface (cf. Fig. 5.4), and whose transectioncauses significant loss of functional liver volume, are classified as critical, which canbe described as:
C(GI) =
{1, if (VGI ≥ IV ) ∧ (DGI ≤ ID),
0, else(5.1)
where VGI is the amount of liver volume that is affected when the vessel is transectedat GI , and DGI is the minimal distance between GI and the resection surface. IV andID are boundary values (margins) that can be adapted by the user, i.e., dependingon the surgical strategy. These values have clear physical meaning: IV representsthe minimal affected liver volume (ml) for the associated branch and ID representsthe maximal Euclidean distance to the resection surface (mm).
In order to compute the minimal distance DGI for all centerline voxels GI , aEuclidean distance transformation of the resection surface DSURF is calculated. Tocalculate VGI , a Voronoi decomposition (nearest neighbor distance model) of the livervolume according to all centerline voxels of the segmented vascular structure is appliedto approximate the perfusion and drainage areas. Combining this information with
99

Chapter 5. Surgical Risk Maps
(1)
(2)
(3)
Resection Surface
Tumor
Figure 5.3: Portal venous vessel sections inside the resection volume (1) and vesselsections whose parent branches are located inside the resection volume(2) are defined as non-critical (red), while all other sections (3) are furtheranalyzed in subsequent computation steps. For this, DGI and VGI areconsidered.
Figure 5.4: Tumor and critical vessel sections (C=1) within a specific margin (DGI ≤20mm) around the resection surface. The patient case is the same as inFig. 5.3.
100

5.3. Risk Maps for Liver Surgery
DSURF and taking the hierarchical dependencies of the vascular trees into accountby traversing G in level order (starting at leaves), a 3D lookup table is generated.This lookup table provides the affected liver volume in ml for each skeleton voxel GI .
5.3.2 Visualization of Critical Areas and Resection Portals
Instead of enhancing the critical anatomic structures in the 3D model, a risk map isproposed which corresponds to the geometric model of the virtual resection surfaceand visually encodes the minimal distance to critical structures using shadow-likedistance indicators. Therefore, a Euclidean distance transformation applied toanatomical structures that are classified as critical (C = 1) is calculated in 3D.Because the critical structures can be categorized into hepatic vessels (portal vein,hepatic vein) and tumors, three separate distance transformations DPV , DHV , DT
are generated. The hepatic artery and bile duct are not considered in the currentprototype. In order to assess the distance transformation inside an OpenGL fragmentprogram, DPV , DHV , DT and DSURF are stored in an 3D RGBA texture. Thereby,each distance map (DPV , DHV , DT , DSURF ) is mapped to one of the four channels(RGBA). A texture lookup into the 3D texture (linear interpolation) returns thecurrent value for each distance map.
To allow a quantitative assessment of distances between the resection surface andcritical structures, the range of values on each map is divided into intervals, andcolors are assigned to each interval (cf. Fig. 5.5). The colors encode different safetymargins to the critical structures. These safety margin widths and colors can beadjusted by the user. By using different color templates for vessels and tumors, itis easy to visually identify so-called portals in which the surgeon must cut betweentwo or more critical structures, e.g., between a tumor on one side and an importantvessel on the other side of the resection surface (cf. Fig. 5.5a). In fact, portals arelocated at areas where intervals from vessels and tumors intersect.
5.3.3 Visualization of Shape and Spatial Depth
In liver surgery, preoperatively planned resection surfaces exhibit different shapesdepending on factors such as the location of tumors or the surgical strategy. For quickdistance assessment during the intervention (without human-computer interaction),it is crucial to provide adequate shape and depth hints on the risk map.
In this work contour lines as established in cartography are applied to encodedifferent levels of elevation. To this end, a precomputed Euclidean distance mapDB provides the minimum distance from each vertex on the resection surface tothe boundary of the resection surface. The current value of DB on the resectionsurface is accessed via 3D texture lookup. Equidistant contour lines are mappedonto the resection surface by employing a smooth threshold function which providesstroke antialiasing as described in [Freudenberg, 2003] by evaluating the thresholdfunction for each pixel in a fragment program, the line thickness can be influenced ona pixel-by-pixel basis (cf. Fig. 5.6). Thus, line thickness can be held constant or vary
101

Chapter 5. Surgical Risk Maps
(a)
(b)
Figure 5.5: Risk maps (IV = 10ml, ID = 10mm) on the right and associated 3D plan-ning models on the left. The connecting arrows indicate correspondingpoints in both models. (a) shows a resection proposal for an extendedleft hemihepatectomy and (b) for a central tumor resection. Shadow-likedistance indicators on the risk map encode different safety margins tocritical structures such as portal vein (blue contour intervals) and hepaticvein (green contour intervals). The light red area encodes the proximity(≤ 10mm) to a tumor.
102

5.4. Evaluation
linearly depending on the current value of DB. In addition, the distances betweenlines can be adjusted, e.g., by 5mm, which facilitates a quantitative assessment ofspatial depth.
5.4 Evaluation
In order to get clinical feedback about the risk map visualization, the development wasaccompanied by regular meetings with liver surgeons where the current developmentprogress was presented and discussed. In addition, two formal evaluation studieswere conducted that are described in this section. The central aim of these studies isto measure whether and how the visualization of risk maps facilitates the process ofsurgical risk assessment.
Study I: Experiment Design
Three experienced liver surgeons, not involved in the development of the risk maps,were interviewed. In the beginning, each surgeon was familiarized with the concept ofidentification of critical structures along a planned resection surface (cf. Sect. 5.3.1)which builds the basis for the risk map. This was done in a short slide presentationand an interactive software demo. All interviewed surgeons agreed that the proposedvisualization of the risk map is intuitive and would be beneficial to support surgicalplanning and the execution of liver resections.
After the training phase, eight stimuli were presented separately and in ran-domized order. Each stimulus consisted of a resection plan (hemihepatectomy orextended hemihepatectomy) including vascular structures, tumors, and resectionsurface. Overall, four resection plans were presented to the surgeons. Each resectionplan was presented twice, once without the risk map and once with risk map. Therisk map was thereby displayed within the 3D planning model of the liver as shownin Fig. 5.7. Based on a discussion with a liver surgeon (who did not take part in theevaluation study), the distance values for all color intervals on the risk map were setto 1 mm and 5 mm. IV was set to 10 ml and ID to 5 mm.
For each stimulus, surgeons were asked to mark locations on the resection surface atwhich they would expect risk or difficulties during the actual resection. To accomplishthat task, each surgeon received three colored pencils and several sheets of paperswhere different outlines of resection surfaces were printed on (
”empty“ risk maps).
The marking had to be done in specific colors: red for the tumor, green for thehepatic vein, and blue for the portal vein (cf. Fig 5.9). Time and the amount ofmodel rotation were captured. Within an attached questionnaire, surgeons had torank how much the risk map supported them in assessing the surgical risk.
Study I provided first evaluation results (cf. Sect. 5.5) and facilitated the definitionof hypotheses. These hypotheses were evaluated in a subsequent study.
103

Chapter 5. Surgical Risk Maps
Figure 5.6: Risk map for an extended left hemihepatectomy (IV = 10ml, ID = 10mm).Equidistant contour lines encode the distance to the liver surface.
Figure 5.7: 3D model with risk map inside the model as used in study I. Comparedto study II, the risk map was not additionally visualized in a secondviewport.
104

5.4. Evaluation
Study II: Hypotheses
The improvement of user performance during navigated liver surgery is the mainreason why the risk map was developed. Recall that surgical risk for a focused areaon the planned resection surface needs to be frequently assessed during liver resectionsurgery, in particular during the transection of the liver parenchyma. Therefore,aspects of human-computer interaction in risk assessment were evaluated in a larger,second study.
In order to evaluate the risk map, the techniques have to be compared with acomparison system C that represents the state of the art in navigated liver surgery.In the context of this study, C is defined as the 3D visualization of planning modelssuch as it is commonly used in navigation systems for liver resection surgery [Cashet al., 2007; Nowatschin et al., 2007; Beller et al., 2009b; Peterhans et al., 2010]. LetR be a system that provides a risk map visualization. The following null hypothesesregarding human-computer interaction are evaluated in the context of this study:
(H-1) R requires equal time for risk assessment as C, and
(H-2) the same amount of errors are made when estimating the surgical riskusing R and C,
The hypotheses address the assessment of surgical risk for positions on the plannedresection surface.
Study II: Experiment Design
The study consisted of two separate experiments. The two experiments for eachparticipant were no closer than two weeks apart to minimize memory effects. Eachparticipant was asked to evaluate 50 different positions of a virtual surgicaldissector in 5 datasets (10 positions per dataset). In order to avoid expectationeffects, half of the participants started with experiment C, while the other halfstarted with experiment R. The question to be answered was the same for eachposition of the surgical dissector:
”Which risk structures are located close (5 mm) to
the instrument tip?“. The following possible answers were provided and had to beselected in a checkbox list:
• Portal vein
• Hepatic vein
• Tumor
• No risk
Multiple selections were possible. Subsequently, the participant was asked to directlypress a next-button which triggers the loading of the next stimuli.
105

Chapter 5. Surgical Risk Maps
In experiment R, the stimulus consisted of a 3D planning model of the liver,including vascular structures, tumors, resection surface (hemihepatectomy or ex-tended hemihepatectomy), and the 3D model of a surgical dissector. The instrumenttip of the dissector was always located on the resection surface (cf. Fig 5.8). Inaddition, the risk map for the dataset was displayed in a second viewport. Thestimulus in experiment C was identical except the fact that the risk map for thedataset was not displayed. In order to facilitate distance assessment in experimentC, a half-transparent sphere with a radius of 5 mm was located in the center of theinstrument tip.
Before starting each experiment session, participants were informed which struc-tures in the liver model are defined as risk structures. Therefore, a printout ofFig. 5.3 was presented and the concept to identify risk structures was explained (cf.Sect. 5.3.1). In addition, the following instructions were given to participants at thebeginning of each experiment:
(1) Please interact with the provided visualization only if this is necessary inorder to answer the current question.
(2) Please answer the questions as fast as possible.
(3) Please answer each question correctly.
Subsequently, the participants started the experiment with a training dataset of10 stimuli. Within this training phase open questions were answered by the testsupervisor. After finishing the training phase, every participant confirmed that sheor he understood the task. Subsequently, the test phase started with a presentationof 50 test stimuli as described above.
The subject pool consisted of 10 participants, including 7 scientists (engineers,mathematicians, computer scientists) and 3 radiologic technicians. All participantswere familiar with the anatomy of the human liver and had experience with 3Dplanning models of the liver and 3D viewers.
5.5 Results
An analysis of the recorded data from Study I revealed that surgeons were fasterin risk assessment when the risk maps were presented. In addition, the amount ofmodel rotations (cumulated rotation angle of the viewer camera) was lower. However,these differences did not reach statistical significance (Wilcoxon test with p > 0.05),which could be ascribed to the little number of participants. The analysis of thequalitative results from the questionnaire indicated that the risk map supportedsurgeons in assessing risk. The mean response was 3.06 (σ = 0.4) on a Likert scalefrom 1 to 4 (1 = strongly disagree, 2 = disagree, 3 = agree, 4 = strongly agree).
An analysis of the hand-drawn risk maps revealed that the assessment of riskalong a planned resection surface varies depending on the observer. Surgeons had
106

5.5. Results
Figure 5.8: Screenshot of the software application that was used in experiment R.The 3D planning model is shown on the left and the risk map on theright. The superimposed legend in the right viewer (lower right corner)maps the used colors of the risk map to distance values. At the bottompart of the screenshot, four checkboxes and a next-button are arrangedin order to gather answers from the participants.
107

Chapter 5. Surgical Risk Maps
differing definitions of what a critical area on a resection surface would be (cf.Fig. 5.9). This might be ascribed to the fact that participants exhibit different levelsof experience and thus different kinds of risk awareness. The perceived level of riskcan be technically described through the volume threshold IV , the distance thresholdID, and the distances used for the color intervals on the risk map. The analysis ofthe drawings showed that especially changes of IV simulate different levels of risk (cf.Fig. 5.9). In conclusion, the parameters of the risk map need to adapt not only tothe type of intervention but also to surgical preferences and the level of individualexperience with this type of intervention.
Study II focused on aspects of human-computer interaction. Statistical analysisconsisted of comparisons of the arithmetic means between data from experiment Cand experiment R. Differences were tested using the Wilcoxon test and a p < 0.05was defined as statistically significant. Both null hypotheses defined above could berejected. The measured times for risk assessment (cf. Fig. 5.10) were significantlylower in experiment R. In addition, participants made fewer errors in risk assessmentduring experiment R than in C (cf. Fig. 5.11). Only 81.4 % of judgments werecorrect in C, compared to 99.96 % in R. In experiment C, false negative judgments(50.6 %) were approximately as often made as false-positive judgments (49.4 %).
The risk map approach was implemented using the rapid prototyping softwareMeVisLab [Ritter et al., 2011]. The rendering is performed using GLSL. Because theresultant visualization is solely based on a single OpenGL fragment program and a setof 3D textures, the risk map can be displayed on any system which supports OpenGL2.0. Only a custom fragment shader needs to be implemented. The calculation ofthe required 3D textures requires around 10 s, depending on the size of the volumedataset and the hardware setup (compare hardware specification for the planningsystem in the appendix on page 155). The risk map visualization achieves interactiveframerates on the specified graphic hardware.
5.6 Discussion and Conclusion
The first study showed that the parameter IV is especially important to visualizedifferent risk levels. An interactive manipulation of IV would be desirable. However,changes in IV require a re-identification of critical vascular structures as described inSect. 5.3.1. Although not all calculation steps need to be repeated completely, theupdate requires at least the re-calculation of the Euclidean distance transformation(which encodes the distance to the critical structures) and an update of the associated3D texture. A complete implementation on the GPU would probably facilitate fasterupdate processes. Another possibility would be to identify standard parametersettings for IV . Such standardization would enable better comparison of risk mapsfrom different patients and might introduce a reliable measure for the difficulty of aresection, similar to the approach described by Beller et al. [2009a].
Alternative criticality measures, such as the vessel diameter at the position ofGI or the path length were not considered in this work. The parameter VGI is of
108

5.6. Discussion and Conclusion
(a) (b) (c)
(d) (e) (f)
Figure 5.9: (a-c) Hand-painted risk maps by three different surgeons based on apresentation of 3D planning models. The drawings show that the levelof perceived risk varies depending on the observer. (d-f) Computer-generated risk maps using different values of IV (500 ml, 100 ml, 10 ml).1 mm and 5 mm were chosen as distance values for the color intervals.
109

Chapter 5. Surgical Risk Maps
C R
010
2030
4050
Tim
e (s
)
Figure 5.10: Mean times per participant for experiment C (Min = 1.0, 1st Qu. =5.1, Median = 8.4, 3rd Qu. = 14.2, Max = 27.6) and for experiment R(Min = 1.0, 1st Qu. = 2.1, Median = 2.7, 3rd Qu. = 4.4, Max = 7.7).
C R
Num
ber o
f erro
rs
l
ll
02
46
810
12
Figure 5.11: Number of errors per participant for experiment C (Min = 6.0 , 1stQu. = 9.0, Median = 9.5, 3rd Qu. = 11.0, Max = 12.0) and experimentR (Min = 0.0 , 1st Qu. = 0.0, Median = 0.0 , 3rd Qu. = 0.0, Max =1.0).
110

5.6. Discussion and Conclusion
utmost importance when assessing criticality (particularly for patients with marginalremnant liver volume), because clinical studies report the remnant liver volume asan essential factor for operability [Broek et al., 2008]. Nevertheless, a combinationof VGI with risk measures involving an analysis of different safety margins aroundtumors (cf. Chapter 3) could be a valuable extension to the method.
The second study revealed that risk maps are an effective visualization to assess riskin liver resection surgery. Using the risk map as additional information, participantsare faster and make fewer errors. However, the performed experiments did not exactlymatch the situation of an actual liver resection. Instead of having to concentrate onthe operating field, participants could completely focus on the visualized planningdata. Assuming a realistic operational setting, it is suspected that the amount of userinteraction (model rotation, camera panning) and process time decreases for settingssuch as those in experiment C. This decrease would probably be accompanied withan increase in assessment errors. In this context, it would be interesting to measurehow many errors are made when using the risk map.
A future step will be the application of risk maps in the operating room duringliver surgery. Because the liver is a deformable object, the issue of the validity ofthis distance information during liver surgery arises. It is obvious that the staticdistance information visualized in the risk map could not be valid during the wholeintervention, especially during parenchyma transection. Methods for intraoperativeadaptation of the risk map might be necessary to provide reliable support for resectionguidance. This requires repeated re-registration or a continuous tracking of liverdeformation (refer Sect. 2.2.4 on page 30). Nevertheless, apart from an accuratevisualization of distance information, the risk map provides a general overview ofpotential areas at risk along the planned resection surface. Besides intraoperativeapplication, the risk map could also support resection planning.
In summary, a method for the identification and classification of critical structuresalong a resection surface is introduced in the context of this work. Critical regionsare visualized on a risk map in a clear and intuitive way. Thus, surgeons are providedwith additional information that is not directly visible in the radiological data.The approach provides a new and objective basis for the assessment of risks. Theperformed evaluations indicate that the risk map may prevent possible damage torisk structures and thus has the potential to enhance patient safety during liversurgery. To the knowledge of the author, the presented method is, in addition tothe work of Lamata et al. [2008], one of the first approaches towards a simplifiedand effective visualization of surgical risk in liver surgery. Related methods for riskassessment were primarily designed for the preoperative planning stage and of limiteduse during liver interventions.
The concept of risk maps was designed for intraoperative guidance in navigatedliver surgery. Application during preoperative planning or to other surgical fields,such as neurosurgery, shows great promise and could be part of future research. Evenwithout integration in the surgical navigation system, the risk maps may improve theorientation and the confidence of surgeons while transferring a preoperative resectionplan to the operative site.
111

Chapter 5. Surgical Risk Maps
Publications The methods described in this chapter have been presented at the SPIE Med-ical Imaging conference, San Diego, USA [Hansen et al., 2010b]. The presented evaluationstudies have not been published at the time of submission of this thesis.
112

6 Illustrative Augmented Reality
We know nothing truly, for the truth lieshidden in the depth.
(Democritus)
During navigated liver intervention, surgeons need to frequently shift theirvisual focus to access preoperative planning data (cf. Fig. 6.1). Based onobservations from such interventions and many discussions with surgeons, a
mental fusion of planning models with the current surgical view is prone to error.Furthermore, it results in frequent distracting comparisons during the interventionthat consume an unacceptable amount of time. Therefore, AR approaches thataugment planning information with the surgical view obtain increasing acceptancein navigated surgery.
This chapter presents methods for intraoperative visualization of 3D planningmodels which extend illustrative rendering and AR techniques.
113

Chapter 6. Illustrative Augmented Reality
6.1 Purpose
Numerous applications for medical AR apply classical rendering methods (e.g.,Gouraud or Phong Shading) for overlaying graphical information [Kersten-Oertelet al., 2011]. However, opaque planning models such as vascular structures, organsurfaces, and tumors can occlude the surgical view in a way that is inappropriatein surgical routine. The use of transparency, on the other hand, complicates theperception of relative depth distances between surfaces [Interrante et al., 1997],particularly if manual rotation of the model is not possible. Moreover, the assessmentof spatial relations in static images is difficult even when opaque models are presented(refer to the study described in Ritter et al. [2006]).
A meaningful augmentation of the surgical view with a 3D visualization of planningdata which allows reliable comparisons of distances and spatial relations is still anopen request. To improve the understanding of spatial relations and depth, illustrativevisualization methods for complex 3D planning models that encode relevant distanceinformation are presented in this chapter. The methods reduce visual complexityof 3D planning models and accentuate spatial relations between relevant objects.The main contribution is an advanced silhouette algorithm for 3D planning models(distance-encoding silhouettes) combined with procedural textures (distance-encodingsurfaces). In addition, a method for illustrative visualization of resection surfaces ispresented. The methods are integrated in an AR application for liver surgery.
6.2 Related Work: Techniques for Improvement ofSpatial Perception in Medical AR
Incorrect depth interpretation is the most common perceptional problem in ARapplications, interfering with the interpretation of spatial relationships between thefirst person perspectives, the objects in view, and the overlaid information [Kruijffet al., 2010]. The surgical need to exactly assess spatial information of planningmodels during an intervention has lead to the development of several techniqueswhich attempt to improve spatial perception in AR applications.
Several AR applications provide depth cues through motion parallax. Motionparallax is an important depth cue that is observed when objects with a short distanceto the observer move farther across the field of view than objects far away from theobserver. This effect occurs when the observer or the objects move. In the contextof projector-based AR, Riechmann [2006] proposed to project vascular structuresonto an organ surface via projective texture mapping while tracking the surgeonshead. However, a permanent tracking via head-attached tracking applicators isnecessary to perceive depth cues via motion parallax. This head movement mightaffect the surgical workflow, e.g. by forcing surgeons to move their head to improvedepth perception. Another approach by Sielhorst et al. [2006] that utilizes motionparallax describes a “virtual window” for HMD-based AR which creates the feeling
114

6.2. Related Work
(a) (b)
Figure 6.1: (a) Intraoperative visualization of 3D planning models on the screen ofa navigation system for laparoscopic surgery. The screen shows the 3Dplanning model (left), the laparoscopic video stream (upper right), and theIOUS stream (lower right). (b) Intraoperative visualization of 3D planningmodels for navigated open liver surgery. Image Courtesy UniversityHospital Lubeck, Germany and General Hospital Celle, Germany.
115

Chapter 6. Illustrative Augmented Reality
of getting a view on the inside of the patient. The window plane is slightly structuredwith a texture in order to additionally enhance depth perception through partialocclusion when using a tracked HMD. However, HMD’s can handicap a surgeonduring interventions and need further technological improvement before getting intothe operating room.
Multiple viewports have been proposed to enhance depth perception in AR withoutforcing observers to change their viewing position or to rotate the model. Navabet al. [2007b] presented a render-to-texture approach, termed virtual mirror, formedical AR which provides additional views on the planning model. Particularly, theinterpretation of partial self-occlusions inside complex planning models is improved.
The correct display of occlusion between virtual models and real objects is amain challenge in AR. In an ideal case, the real object is tracked and its geometry isknown, e.g., a surgical instrument that is tracked by a navigation system. Otherwisethe position and geometry needs to be captured, e.g. through video analysis. Fischeret al. [2007] use a TOF camera, which provides a 2D distance map of the real scene.By performing a registration between distance map and virtual 3D models, thedistance map is used to decide which objects are rendered in front. A commonway is to change the rendering style for occluded objects, e.g., using a wireframepresentation [Tsuda et al., 2005], transparency [Elmqvist et al., 2007], or focus andcontext techniques [Kalkofen et al., 2007].
Based on traditional illustration techniques, a variety of illustrative visualiza-tion methods have been proposed in order to increase expressiveness of 3D models.Detailed overviews can be found in the theses of Bruckner [2008] and Tietjen [2009].An interesting approach is described by Lerotic et al. [2007]. They analyze surface fea-tures from stereo laparoscopic camera images and derive the orientation of the organsurface. This information is used to generate a translucent contour layer. Surfacesof the real scene that are parallel to the viewing plane are rendered as transparentwhilst sloped structures are accentuated using non-photorealistic rendering (strokes).Thereby, surface features are extracted and augmented in correct depth order. Anassociated user study proved that the proposed visualization led to improved depthassessment.
Bichlmeier et al. [2007] presented an approach that uses surface topology, viewingattributes, and the location of surgical instruments to generate a transparency mapthat is applied to control the pixel transparency of video images. Thus, a context-preserving focus region is provided that facilitates depth perception. Fischer et al.[2005] developed an illustrative rendering technique that is capable of generating astylized augmented video stream. Based on an edge-detection algorithm, silhouettesare extracted and applied to both the camera image and the virtual objects. Throughthis approach, visual realism of the virtual objects and the real camera image isreduced. Both modalities become less distinguishable from each other and thus animproved immersion can be achieved. A similar approach is described in [Kalkofenet al., 2007], however, they apply silhouettes to visualize hidden objects in the areaof augmentation (x-ray visualization). Complexity of the superimposed silhouettes iscontrolled by an importance measure and an interactive, user controlled filter.
116

6.3. Illustrative AR for Liver Surgery
Prior Work
The new techniques proposed in the following section are based on prior work [Hansen,2006; Ritter et al., 2006] in the field of illustrative visualization. The techniquesaccentuate spatial depth of 3D vascular structures and improve the perceptiveseparation of important vascular properties such as branching level and supply area.Besides a GPU-based hatching algorithm for tubular structures (distance-encodingsurfaces), shadow-like depth indicators (distance-encoding shadows), which enablereliable comparisons of depth distances, are introduced. A user study that wasperformed in the context of this preliminary work revealed that the developedtechniques provide appropriate monoscopic depth cues to assess distances in staticrepresentations of 3D liver planning models.
6.3 Illustrative AR for Liver Surgery
This section presents new techniques for illustrative visualization of 3D planningmodels for liver surgery. Thereby, planning information is either projected onto theliver surface during open liver surgery using a light projector as described in [Glossop,N. 2003; Riechmann et al., 2006; Krempien et al., 2008; Gavaghan et al., 2011], orrather superimposed with the images from a laparoscopic camera [Feuerstein et al.,2008; Scheuering et al., 2003; Marescaux et al., 2004].
First, a requirement analysis is presented. Second, clinical visualization scenariosthat guided the development are described. Third, an advanced silhouette algorithmfor 3D planning models, termed distance-encoding silhouettes, is introduced. Fourth,several visualization techniques are presented in which distance-encoding silhouettesare applied together with distance-encoding surfaces. Finally, a method for illustrativevisualization of resection surfaces is presented.
Requirement Analysis
An augmentation of the surgical view by planning models may result in unacceptableocclusions of the operation field or misinterpretation of spatial relations, colors,and contrast. Therefore, the proposed visualization approach is guided by threerequirements:
• Spatial depth of planning models must be perceivable, even in static images,
• occlusion of the surgical view by planning models should be minimal,
• transitions in color and brightness must be avoided in order to ensure amaximal contrast.
117

Chapter 6. Illustrative Augmented Reality
Visualization Scenarios
To test the usability of the methods, three visualization scenarios were specified incollaboration with experienced liver surgeons. These scenarios represent surgicalsituations wherein expressive visualizations are requested:
(1) Anatomical Overview: This scenario contains all tumors identified pre-operatively and their relations to relevant vascular structures. Besidesproviding an abstract overview of available planning objects, this visualiza-tion scenario allows fast assessment of alignment errors between the realand the virtual world.
(2) Focusing the current tumor: During the treatment of a specific tumor,this visualization provides information about surrounding risk structuressuch as vessels which are invisible for the surgeon.
(3) Focusing the virtual resection surface: In case of a precise preparedresection strategy, this scenario provides spatial information of the virtualresection surface, while enhancing its relation to risk structures.
Predefined views for each scenario are generated in advance and provided intraopera-tively. In the following subsections the developed illustrative rendering techniquesare described.
6.3.1 Distance-Encoding Silhouettes
Silhouettes play an important role in figure-to-ground distinction and can be appliedto reduce the visual complexity of geometric models. However, the abstraction ofa classical shaded object to its silhouette results in the loss of shading informationand consequently in a reduction of depth cues. Therefore, conventional silhouettealgorithms are enhanced by two optional rendering settings.
The first extension allows for varying the stroke thickness of silhouettes con-tinuously by using the distance to relevant objects (organ surface, adjacent riskstructures, or surgical tracked instruments) as input. The distance-dependent scalingof silhouettes is similar to the concept described by Isenberg et al. [2002], however, thealgorithm proposed in this work controls the stroke thickness on the GPU using twoframebuffer objects. The algorithm is based on a translation of each vertex of the 3Dplanning model in direction of its normal by a vertex shader. Utilizing multiple rendertargets, the silhouette is calculated by subtracting the original planning model fromthe scaled model in a fragment program. The length of the applied vertex translationis defined by calculating a distance value, e.g. the distance between a vertex andthe tip of a tracked surgical instrument, via built-in shader functions. Alternatively,it is possible to exploit a precomputed 3D distance map via texture lookup. Thealgorithm controls stroke thickness within a user-defined interval (minimum andmaximum stroke thickness). Irrelevant parts of the model can thus be omitted.
118

6.3. Illustrative AR for Liver Surgery
(a) (b) (c)
Figure 6.2: (a) Focusing a tumor using classical rendering techniques. (b) A silhouetterepresentation of the scene results in a loss of depth cues. Occluded vesselbranches are not visible. (c) Distance-encoding silhouettes allow for theaccentuation of important vessels by applying varying stroke thickness,while occluded vessels are emphasized via varying stroke styles.
The second extension uses different stroke styles (solid, dashed, dotted) toaccentuate view-dependent spatial relations (in front, within, behind) of interwovenobjects. The developed rendering styles are particularly important for vessels thatintersect other planning models such as resection volumes, territories at risk, ortumors. The stroke styles are varied by means of a sawtooth function in a fragmentprogram. Occluded objects are detected using the depth buffer, while overlappingobjects are identified by a texture look-up in the underlying 3D segmentation masksof planning models. Figure 6.2a shows an example for a close-up view of a tumorwith surrounding vessels rendered with classical shading (cf. Fig. 6.2a), conventionalsilhouettes (cf. Fig. 6.2b), and the proposed techniques termed distance-encodingsilhouettes (cf. Fig. 6.2c).
6.3.2 Distance-Encoding Surfaces
Distance-encoding surfaces provide the observer with distance information displayedon the surface of geometric objects. This technique was introduced in [Ritter et al.,2006] to visualize the distance of vascular structures to the observer by using texturegradients as additional depth cues. A procedural stroke texture with varying strokethickness is used for this purpose.
Instead of applying a hatching texture on the whole vessel system, a distance-based transfer function is exploited to limit the use of texture to a specific scope.Thus, distances between arbitrary planning objects can be visualized, e.g. vessels atrisk can be accentuated while their spatial relation to other objects (organ surface,vascular territories, and tracked surgical instruments) is encoded by distance-encodingsilhouettes. In addition, this enables the combination of distance-encoding surfaceswith distance-encoding silhouettes. Figure 6.4 shows an example for the combinationof both techniques: vessels at risk are emphasized using a distance-encoding surface
119
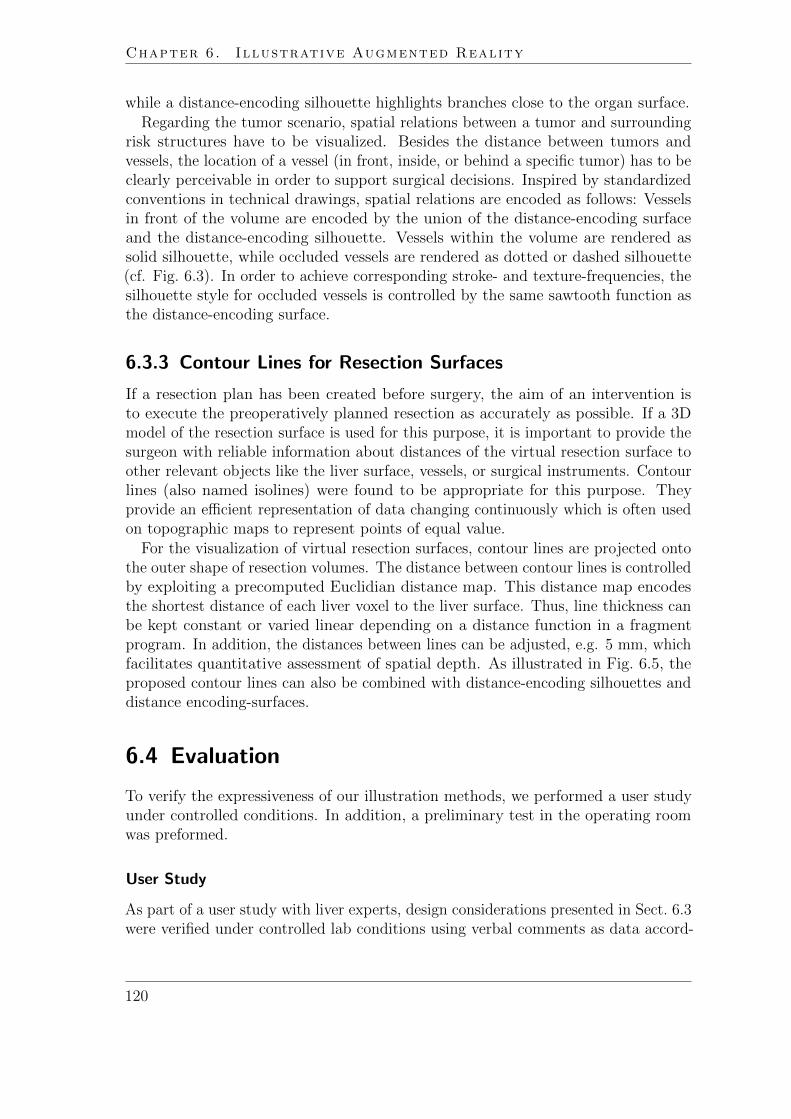
Chapter 6. Illustrative Augmented Reality
while a distance-encoding silhouette highlights branches close to the organ surface.Regarding the tumor scenario, spatial relations between a tumor and surrounding
risk structures have to be visualized. Besides the distance between tumors andvessels, the location of a vessel (in front, inside, or behind a specific tumor) has to beclearly perceivable in order to support surgical decisions. Inspired by standardizedconventions in technical drawings, spatial relations are encoded as follows: Vesselsin front of the volume are encoded by the union of the distance-encoding surfaceand the distance-encoding silhouette. Vessels within the volume are rendered assolid silhouette, while occluded vessels are rendered as dotted or dashed silhouette(cf. Fig. 6.3). In order to achieve corresponding stroke- and texture-frequencies, thesilhouette style for occluded vessels is controlled by the same sawtooth function asthe distance-encoding surface.
6.3.3 Contour Lines for Resection Surfaces
If a resection plan has been created before surgery, the aim of an intervention isto execute the preoperatively planned resection as accurately as possible. If a 3Dmodel of the resection surface is used for this purpose, it is important to provide thesurgeon with reliable information about distances of the virtual resection surface toother relevant objects like the liver surface, vessels, or surgical instruments. Contourlines (also named isolines) were found to be appropriate for this purpose. Theyprovide an efficient representation of data changing continuously which is often usedon topographic maps to represent points of equal value.
For the visualization of virtual resection surfaces, contour lines are projected ontothe outer shape of resection volumes. The distance between contour lines is controlledby exploiting a precomputed Euclidian distance map. This distance map encodesthe shortest distance of each liver voxel to the liver surface. Thus, line thickness canbe kept constant or varied linear depending on a distance function in a fragmentprogram. In addition, the distances between lines can be adjusted, e.g. 5 mm, whichfacilitates quantitative assessment of spatial depth. As illustrated in Fig. 6.5, theproposed contour lines can also be combined with distance-encoding silhouettes anddistance encoding-surfaces.
6.4 Evaluation
To verify the expressiveness of our illustration methods, we performed a user studyunder controlled conditions. In addition, a preliminary test in the operating roomwas preformed.
User Study
As part of a user study with liver experts, design considerations presented in Sect. 6.3were verified under controlled lab conditions using verbal comments as data accord-
120

6.4. Evaluation
Figure 6.3: Combination of distance-encoding silhouettes and distance-encoding sur-faces to visualize spatial relations between vessels and a tumor (tumorscenario).
Figure 6.4: Illustrative visualization approach (a) in comparison to the classicalrendering (b). While the spatial relations between vessels and tumorsare difficult to perceive in (a), vessels at risk are accentuated in (b)using a varying stroke texture, termed distance-encoding surface. Thedistance-encoding silhouette enhances branches close to the organ surface(varying silhouette thickness). The part of the vessel behind the lefttumor is accentuated with dashed strokes.
121

Chapter 6. Illustrative Augmented Reality
(a) (b)
Figure 6.5: (a) Illustration of a wedge-shaped resection via contour lines. Linethickness depends on the distance to the organ’s surface and is reducedwith increasing distance. Contour lines are equidistant which allows aquantitative assessment of distance. (b) Illustration of a planar resection.Spatial depth is encoded via the thickness of silhouettes and contourlines.
ing to the Think-Aloud protocol [Ericsson et al., 1993]. Therefore, an electronicquestionnaire was created that contained single video frames from laparoscopic andopen liver interventions with overlayed planning models as well as photos from aprojector-based AR visualization using a cadaver liver of a pig. In order to probethe subjects’ perception of spatial relations, tasks that require a precise judgmentof distances were designed. Three vessel positions in each image were labeled withmarkers, while each task started with a question about the distance of these markersto a second object (e.g. tumor, resection surface, organ surface). Participantswere asked to determine the correct order of marks. Because the effect of the newtechniques should be assessed, a visualization of the planning model using one of thenew techniques had to be compared with a second visualization of the same modelidentical in every aspect, except for the rendering algorithms. This requirement hasbeen met by using the same model and viewpoint. Each visualization scenario wasevaluated using three paired tests in different sequences: Fig. 6.6 shows an examplefor a paired test for scenario 1 (overview scenario), Fig. 6.7 for scenario 2 (focusingthe current tumor), and Fig. 6.8 for scenario 3 (focusing the resection surface). Thefirst paired test for each scenario was conducted with video images from open liversurgery, the second paired test with video images from laparoscopic liver surgery,and the third paired test with images from planning models projected on a pig’sliver using a light projector. Six liver specialists participated in the study: twosurgeons, two radiologist, and two medical software engineers. Before performing thetest, participants were informed about the underlying principles for visual distanceencoding.
122

6.5. Results
Clinical Test
To evaluate the clinical applicability of the new methods, a test in the operating roomwas preformed. Therefore, the images from a video camera focusing the patient’sliver during an open liver intervention were captured. A rigid registration of theplanning model to one video frame was carried out while the liver was immobilized.Subsequently, associated planning models were superimposed onto the video streamwhich itself was presented on a display in front of the surgeon.
(a) (b)
Figure 6.6: Scenario 1 for open liver surgery: Superimposition using classical render-ing techniques (a) and the proposed illustrative approach (b). Distance-encoding silhouettes are applied to visualize the distance between vesselsand liver surface, while a distance-encoding surface emphasizes vesselsthat are located close to tumors.
6.5 Results
User Study
The user study confirmed the results of our previous study [Ritter et al., 2006] in thefield of explicit distance encoding: Compared to classical rendering methods, all sixparticipants were better and faster in judging distances. Because the advantage ofexplicit distance encoding had already been stated in the previous study, the recentstudy focused on a collection of qualitative data. Liver experts have been asked toexpress their thoughts on the application while executing the tasks using a Think-Aloud protocol. In case of a wrong distance judgment, participants were informed andasked to describe their decision in detail. Thus, a number of constructive suggestionswere made:
123

Chapter 6. Illustrative Augmented Reality
(a) (b)
Figure 6.7: Scenario 2 for projector-based AR: (a) Classical rendering that shows atransparent tumor and adjacent vessels. (b) A distance-encoding surfaceis applied to vessels at risk, while their spatial relation is accentuatedusing a distance-encoding silhouette.
(a) (b)
Figure 6.8: Scenario 3 for a laparoscopic camera view: Classical rendering (a) causesocclusions of the surgical view while depth of the wedge-resection surfaceis difficult to perceive. The illustrative visualization technique (b) usesequidistant contour lines for a better assessment of spatial depth. Insidethe resection volume, the distance between vessels and resection surfaceis visualized using distance-encoding surfaces. In addition, a distance-encoded silhouette is applied to illustrate the spatial relation betweenvessels and resection surface.
124

6.5. Results
(1) Although the proposed visualization methods aim at reducing the complex-ity of planning models, participants reported that too much informationwas presented in scenario 3. One surgeon proposed to use the position of atracked surgical instrument to select a specific depth layer of the resectionsurface. In addition, vessels that do not supply or drain healthy parenchymacould be omitted.
(2) When presenting scenario 3, several experts asked for a better emphasis ofintersections between vessels and resection surface in order to judge depth.Similar requests were made for scenario 2, where the intersections betweentumor and vessels are important.
(3) In several tests, two independent parameters were presented. One pa-rameter was encoded using distance-encoding surfaces, while the secondparameter was visualized using distance-encoding silhouettes. However, afew participants mixed up the parameters. After being informed about themistake, subjects proposed to enhance the visualization with appropriatelabels.
(4) Concerning the projector-based AR approach, the assessment of distanceof an object from varying stroke styles (dashed, dotted) was not successfulin all cases. Participants noted that the variation in style and frequency isnot always perceivable on the liver surface.
(5) To assess the spatial relation of tumors and vessels in scenario 2, participantsasked for an improved visualization of tumors. Particularly, quantitativedistance information and additional shape hints would be necessary.
Clinical Test
The developed algorithms have been embedded into a clinical prototype that has beentested in the operating room for a preliminary evaluation. Because the movementof the liver surface was not tracked during the test, the performed registration wasonly valid as long as the liver was immobilized. This situation occurred before themarking of the resection line on the liver surface (before parenchyma transaction).Thus, a registration was preformed prior to this step. The superimposition ofthe planned resection surface (scenario 3) on the video image revealed that themarking of the resection line on the patients liver surface could be supported with theproposed visualization method. Subsequent discussions indicated that the presentedvisualization has considerable advantages, compared to traditional intraoperativevisualization methods. However, during the cutting phase, the surgeons could notmake reliable statements about the surgical benefit of the augmentation.
125

Chapter 6. Illustrative Augmented Reality
6.6 Discussion and Conclusion
The performed user study revealed that the applied double-encoding of distancesmay be misleading, especially if users are not familiar with the encoding scheme.A similar effect is described by Kruijff et al. [2010] who argue that perceptionalincorrect augmentations are often a result of conflicting cues. Because the usabilityof the visualization correlates with the surgeon’s familiarity with these concepts itcould be reasonable to integrate the illustrative techniques in software assistants forliver surgery training such as proposed in [Cordes et al., 2009]. In order to preventthat surgeons take a wrong decision, the encoding of distances should be limited toone distance parameter. In addition, information about the visualized distance hasto be included in the visualization, e.g., in the form of a legend.
Nevertheless, the possibility to visualize distances using different illustrative ren-dering styles could be important: The encoding of one distance parameter using twodistance visualizations techniques (redundant representation) may lead to a clearervisualization compared to a visualization that uses only one distance visualizationtechnique. In addition, a combination with color-based distance encoding could beconsidered. However, as mentioned in the requirement analysis, transitions in colorand brightness should be avoided in order to ensure a maximal contrast.
An important requirement on intraoperative AR applications is that the occlu-sion of the surgical view by planning models should be minimal. Therefore, threevisualization scenarios have been proposed in this work. The visualization scenariosreduced the set of available planning models to a set that is necessary to answer aspecific surgical question. In addition, illustrative rendering techniques were appliedto reduce model complexity. The limitation to a small number of planning modelsand the scenario-based reduction of model complexity reduce visual clutter. However,according to feedback that was collected in the context of the user study a furtherreduction of model complexity is desirable. A systematic workflow analysis suchas proposed in [Navab et al., 2007a] could be a good basis for a definition of morespecific and effective visualization scenarios. The choice of relevant information hasto be made in collaboration with liver surgeons. As an alternative to predefinedvisualization scenarios, interactive AR would allow surgeons to interact with an aug-mented image, e.g., by using tracked surgical instruments. Examples for interactiveAR in medicine are presented in [Fischer et al., 2005; Navab et al., 2007a; Kocevet al., 2011].
While expectations of surgeons on accuracy and stability in AR settings arehigh [Kruijff et al., 2010], an accurate and time-stable registration is hard to achieve.With commercially available navigation systems for liver surgery, a reliable registra-tion can only be calculated for immobilized organs. Thus, the augmentation is onlyaccurate if the liver is immobilized. To alleviate this limitation, surface-based organtracking methods as proposed in [Cash et al., 2007; Schwaiger et al., 2011] need tobe integrated into surgical navigation systems to adapt intraoperative registrations.However, inaccuracies in camera calibration, tracking and registration have always to
126

6.6. Discussion and Conclusion
be taken into account in liver surgery. Another computational problem is the latencyof the augmentation. From today’s perspective, an intraoperative augmentation ofplanning data on a patient’s liver without any alignment errors is technically notfeasible. Therefore, a visualization of uncertainty (quality of the alignment betweenvirtual and real world) could be important for clinical acceptance.
A general problem of AR that was experienced during the test in the operatingroom is the visual blocking of the liver during surgery, e.g., when a surgeon moves asurgical instrument between the line of sight of projector-camera system and liversurface. This is quite often the case during a liver intervention. As a result, projectedplanning models look like they do not belong to the scene. One pragmatic solutioncould be to limit the augmentation to the visible part of the liver. The visible partcould be determined by an analysis of video images. Another way to visualize objectsthat are occluded by another object is to use a different rendering style, e.g., someform of x-ray rendering as proposed in Kalkofen et al. [2007].
Technically and methodologically, there is room for improvement. First of all,existing methods for tracking of liver movement need to be transferred from academicresearch to clinical applicability. In addition, work is required to further evaluate theproposed visualization techniques during surgical interventions in order to understandhow the techniques would influence surgical decisions. In addition, perceptionalstudies are required to better understand the effects of illustrative augmentation.
As shown in this work, illustrative AR has a high potential to improve spatialperception, an essential problem in medical AR. The proposed visualization methodsreduce the amount of superimposed information by applying focus and contextvisualization techniques. The selection of important planning objects is also givenby predefined visualization scenarios. Occlusions of the surgical view by planningmodels are thus kept minimal. Depth cues are encoded using texture gradients andvarying silhouette thickness which provides strong monocular depth cues withoutthe requirement of a medium able to display color.
Publications An AR application with the illustrative visualization techniques presented inthis chapter was implemented together with Jan Wieferich as a part of his bachelor thesisat Fraunhofer MEVIS (supervised by the author) [Wieferich, 2008]. The prototype waspresented at the 7th Annual Meeting of the German Society of Computer and Robot-assistedSurgery (CURAC), Leipzig, Germany [Hansen et al., 2008a]. Based on a ranked result ofthe review, the paper was selected for an invited publication in the International Journal ofComputer Assisted Radiology and Surgery (IJCARS) [Hansen et al., 2010a]. This chaptercontains large parts of the journal publication.
127


7 Auditory Resection Guidance
We can’t solve problems by using thesame kind of thinking we used when wecreated them.
(Albert Einstein)
Visualization is a powerful way to present planning data. A route with acar, for example, can be explored with route planners of navigation systemsconcerning parameters such as journey time, estimated fuel consumption,
or sightseeing opportunities along the route. However, the execution of the planoften takes place under completly different conditions. Because the driver has toconcentrate on the surrounding traffic, only quick glances at the navigations system’sdisplay are appropriate. This means that the visualization can only be used to alimited extent. To this end, car navigations systems make uses of auditory display tonotify and guide the driver when important landmarks are approached. Additionalinformation is visualized on the navigation’s system screen and can be accessed bythe driver if necessary.
In this chapter, an auditory display system for open liver surgery is introduced byproviding support for guiding the tracked instrument towards and remaining on apredefined resection line.
129

Chapter 7. Auditory Resection Guidance
7.1 Purpose
Navigated resection of tumors in the liver enable a higher degree of precision andcould lead to smaller resection volumes, more frequent tumor-free margins, andthus, improved outcomes [Oldhafer et al., 2009]. However, surgeons frequently needto consult the navigation system, which leads to increased mental load and timepressure during surgery [Manzey et al., 2009]. Viewing the navigation system’s screeninterrupts the surgical workflow.
The purpose of this work is to integrate concepts from the field of auditory displayto enhance intraoperative visualizations for navigated liver surgery. Auditory displayis applied as an additional information channel. It might reduce the dependenceon the visual display. Thereby, it frees the eyes for other tasks, and provides hightemporal resolution and fast processing [Jovanov et al., 1999].
Although auditory alarms and monitoring devices are commonplace in operatingrooms, audio has been a neglected modality in navigated surgery. During liverresection, the auditory channel is relatively unused by the surgeon, and thus is moreopen to provide information that supplements or complements the visual display.
This work presents a solution for a primary problem in navigated liver surgery:the excessive dependence on the visual display during resection guidance. This workfocuses on marking the resection path on the liver surface. The resection markshelp determine the subsequent cut path through the liver parenchyma. Until now,resection guidance has been supported solely by visual displays.
7.2 Related Work
Despite research in the field of alarms and auditory status monitoring [Sandersonet al., 2005; Wee et al., 2008], only a few publications describe auditory display tosupport navigated surgical tasks. To the knowledge of the authors, only two groupshave developed auditory displays for this field.
Wegner et al. [Wegner et al., 1997; Wegner, 1998] introduced a navigation systemfor the blind placement of a biopsy needle. Based on an electromagnetic trackedneedle, surgeons attempted to follow a planned trajectory inside a custom gelatinphantom with an embedded target (tumor mimic). Three relevant methods aredescribed in their papers: The first method applies a beat interference method, forwhich two sinus waves (one with fixed, the other with varying frequency) are mappedto the positional error in one spatial dimension. By bringing the frequencies inharmony, the user can guide the needle. However, to guide the needle in 3D, threewave pairs are needed which can be misleading if the sinus waves of one spatialdimension are in harmony with the sinus wave of another dimension. The secondmethod is used to perform intraoperative distance measurements. Therefore, theuser determines a start point with the tracked needle. As the user moves the needleaway from the start point, short sound events are triggered in equidistant distances.For example, at each millimeter an audible click is triggered and at each centimeter
130

7.3. Materials and Methods
a speech sample that indicates the distance in centimeter is triggered. The thirdmethod aims to explore surface characteristics of anatomical 3D models. The anglebetween the needle and the surface of the 3D models is measured. Based on a2D wave table, a homogeneous tone is produced when the needle is located in ahomogeneous surface region. The sound frequency varies when the user passes theneedle across an uneven surface. These changes in sound frequency are intended toguide the operator. Although the proposed methods by Wegner et al. showed greatpotential, formal evaluations were not reported in literature.
A group from the University Medical Center in Utrecht, Netherlands presenteda method for auditory display for neurosurgery. In this case, auditory display wasapplied to resect a floral foam phantom meant to simulate brain tissue [Willemset al., 2005] and later for operation on six patients [Woerdeman et al., 2009]. Whenthe tracked instrument approached the tumor, the system produced a pure tonewith a duration of 0.1 seconds emitted approximately 3 times per second. Frequencyand amplitude of the tone increased when approaching the target. Directionalinformation was not encoded. The task involving the phantom consisted of removinga target volume from a block of floral foam. The resection using auditory display wascompared to resection with visual-based navigation (using a computer monitor fordisplay) and with a heads-up display (for which contours of segmented structures weresuperimposed onto real-time microscopic images) [Willems et al., 2005]. Resectionquality (similarity of actual and planned resection volume) and resection time didnot significantly differ when comparing the results between interaction with auditorydisplay and visual display. In clinical tests, the auditory display was employed on 6patients and evaluated on instrument handling during the course of surgery. Thestudy results showed that the speed of the instrument tip was not significantly fasterwhen using auditory support. However, in both studies participants felt that theyperformed better when auditory feedback was added because they could focus moreon the working area.
7.3 Materials and Methods
This section describes an auditory display for image-guided liver surgery. First, theapplied navigation system, the underlying planning data, and the auditory feedbackengine are described. Second, a novel method for auditory resection guidance isintroduced. Third, the performed evaluation of the developed auditory display isdescribed.
7.3.1 Navigation System: CAS-One
Surgical navigation systems are intended to assist surgeons when placing or movingsurgical instruments. Generally based on visual display, the position of trackedsurgical instruments such as dissectors, ultrasound probes, and needles, can beviewed in relation to 3D planning models.
131

Chapter 7. Auditory Resection Guidance
The planning models are generated based on CT or MR scans acquired fromthe patient’s liver using planning software for liver surgery [Bourquain et al., 2002].Besides anatomical 3D models of the liver, the planning model includes relevantfunctional information such as a virtual resection surface [Konrad-Verse et al., 2004].One element of the virtual resection surface is the resection line (on the organ surface),which is used within the evaluation study of this work.
The surgical navigation system CAS-One (CAScination AG, Switzerland) is usedwithin this project to visualize planning models relatively to tracked surgical in-struments. CAS-One provides visual support during liver resection and has beenevaluated in the context of clinical trials [Peterhans et al., 2010]. The system consistsof an infrared-based optical tracking system (Vicra R©, Northern Digital Inc., Canada),an ultrasound device, a touchscreen, and a computer unit. A rigid body with passivemarkers is mounted on surgical instruments (ultrasound and dissector) intraopera-tively, or on a pointer for laboratory experiments. Landmark-based registration isapplied during the first phase of the procedure, so that the modalities of the physicalpatient and 3D planning model align.
7.3.2 The Auditory Feedback Engine
As development platforms the medical image processing framework MeVisLab [Ritteret al., 2011] and the audio synthesis environment SuperCollider [McCartney, 2002]were chosen. The developed prototype application was independently implementedfrom the certified navigation software provided by the manufacturer of the navigationsystem. All necessary visualizations for navigation support including the representa-tion of tracked instruments and 3D planning models were provided by a customizedMeVisLab application installed on the navigation system. In addition, the applicationcontinuously sends distances and information about associated object entities to theSuperCollider engine using the OSC (Open Sound Control) protocol. In the followingsubsection, a novel method for auditory resection guidance is presented.
7.3.3 Auditory Resection Guidance
For complex liver operations, resection surfaces are preoperatively defined usingsurgical planning software. Intraoperatively, surgeons aim to resect according tothese plans by means of surgical navigation systems. Before cutting the liver, theresection path is marked on the organ surface. An accurate marking of the resectionpath is a decisive factor for the quality of the whole resection. The marks provideorientation aid during the relatively long cutting phase (≈ 1-2 hours) and thus impactthe subsequent cut path through the liver parenchyma.
The proposed auditory feedback for resection guidance is a function of δ, where δdescribes the distance between surgical instrument tip and the nearest point on theplanned resection line. A precomputed Euclidean distance transformation provides δfor each position in the patient dataset. Thus, the auditory feedback can access δ inconstant computation time.
132

7.3. Materials and Methods
The distance from the instrument tip on either side of the resection line is dividedinto three margins:
• safe
• warning
• outside
The first margin, called safe, is located on both sides of the resection line. When theinstrument tip is in this margin, it is permissible for the surgeon to resect or mark.The second margin, the warning range, is located outside of the safe margin andreaches from the outer border of the safe range to the warning-range width. Whenthe instrument tip is located in this margin, the surgeon is roughly near the plannedresection line but not close enough for a safe resection marking. Finally, the outsidemargin includes all distances that are further from the resection line than the outsidewidth of the warning margin. The distances for the safe and warning margins can beset by the surgeon or planning staff depending on the surgical situation.
To communicate the presence of these different margins and to direct the surgeontowards the resection line, two tones for auditory resection guidance are proposedwhich correspond to both the safe and warning margins. When the instrument tipis in the safe margin (0 ≤ δ ≤ safe width), signifying that it is permissible to markthe resection line, the safe tone is produced. When the tip is in the warning range(safe width < δ ≤ warning width), the warning tone aids the surgeon in directingthe instrument tip to enter the in-range margin. When the instrument tip is in theoutside margin (warning width < δ), no tone is produced. The combination of bothwarning and confirmation tones provides the user with a way of both locating andremaining on the planned resection line.
Prior Work
Based on our prior work in the field of auditory display [Black et al., 2010; Black,2010] a refined resection guidance model is introduced. Within this prior work,different auditory display models for resection guidance have been developed. Thesefirst models ranged from very simple using only a single sine wave, to more complexfeaturing banks of digital resonating bodies, to ones that modeled real-life soundssuch as ringing bells. A preliminary user study was carried out, first to providea general consensus on whether or not auditory display would be beneficial fornavigated liver surgery, and thereafter to gather clinicians’ opinions regarding thefunctions and aesthetics of a range of exploratory auditory display models. The studyrevealed that auditory display was recognized by a majority of surgeons to be a usefuladdition to the visual interaction with the navigation system. A systematic analysisof user comments confirmed that the auditory feedback combated main limitationsof the current navigation system, i.e., the dependence on the visual display andthe lack of notification when approaching risk structures. In addition, the meaning
133

Chapter 7. Auditory Resection Guidance
of the sound and the interaction with the systems was easily learned within lessthan two minutes of training. The second aim of these preliminary studies was togather comments about a selection of different auditory display models for resectionguidance. Comments regarding these first models were used in the development ofthe refined resection guidance model.
A Refined Resection Guidance Model
As part of the process of continual evaluation and refinement, the most popularelements of the exploratory resection guidance sound models were used to createa single model that could be used for the quantitative evaluation described in thispaper. The concept of this model is broadly similar to a Geiger counter in that theinter-onset interval of a series of very short auditory events is one parameter that ismapped to the urgency of a situation. In the case of resection guidance, an increasein distance from the planned resection line causes an increase in urgency.
Safe Margin Tone When the instrument tip is in the safe margin, a “safe margintone” is produced to guide the surgeon to δ = 0 and to inform that it permissibleto mark the resection at that point. The safe tone consist of two elements. First, atwo-pole resonant filter with a frequency of 698.5 Hz (corresponding to MIDI note 77)and a 60 dB decay time of 1.0 second is triggered at a variable inter-onset interval.At a distance of δ = 0, this inter-onset interval is 1.5 Hz, and at the edge of the safemargin, the interval is 5.5 Hz. By moving the instrument tip so that the inter-onsetinterval is longer, the surgeon is guided towards the planned resection line. Second,a bank of sine oscillators with frequencies of 220.0, 261.6, 349.2, 440.0, and 523.3 Hz(corresponding to MIDI notes 57, 60, 65, 69, and 72) is produced when δ = 0 andmuted at all other distances. Thus, this confirmation element informs the surgeonwhen it is optimal to mark the line.
Warning Margin Tone When the instrument tip is outside the safe margin, awarning margin tone helps guide the surgeon towards the safe margin. Similar tothe safe tone, a series of repeating two-pole resonant filters are employed. In thismodel, three primary auditory characteristics are used to relay distance informationand thus convey a sense of urgency (see [Edworthy et al., 1991]) when approachingthe outside of the warning margin and a sense of calm when approaching the safemargin. Each of these variables varies linearly over δ.
The sound settings for the resection guidance model (inter-onset interval, tonelength and pitch) are described in [Hansen et al., 2012]. The combination of onsetfrequency, tone length, and rising and falling pitch relay to the surgeon both thedistance to the resection line and which side of the resection line the tracked in-strument occupies. By moving the instrument back and forth across the safe andwarning margins, the surgeon should be able to use these auditory cues to placethe instrument tip directly on the planned resection line and be aware when theinstrument deviates from the optimal line.
134

7.4. Evaluation
7.4 Evaluation
The objective of this work is to evaluate the suitability of auditory display as anenhancement to visual display in navigated liver surgery. Therefore, a clinicallyoriented study was conducted in which participants were asked to accomplish surgicaltasks on a special manufactured 3D liver phantom. User performance was evaluatedquantitatively by analyzing instrument movement and aspects of human-computerinteraction.
Liver Phantom
Because an evaluation of the new interaction techniques would not be fruitful unlessa physical representation of a human liver were present, a CT liver dataset withsegmented anatomical structures was used to create a stereolithographical model ofthe liver. This liver phantom only includes an outer shell with a cuboid cavity in thefront to enable access to the interior with the tracked instrument. A piece of floralfoam ( R©mosy colorfoam) was trimmed to fit inside this cavity to provide tactileresistance to the tracked instrument during testing (Fig. 7.1a). The phantom wasmounted on a wooden board together with a trackable marker shield, which allowedfor easy calibration with the navigation system’s camera.
Evaluation Criteria
Appropriate evaluation criteria for the evaluation were found by an analysis of whichcharacteristics of the auditory display could potentially improve the surgical workflowof open liver interventions. The dependence on the visual display, which is a primaryproblem, was observed during the study. In addition, the movement of the instrumenttip was compared. The following evaluation criteria were defined:
• Total time participants looked at the screen relative to looking at thephantom
• Time needed to draw the resection line
• Mean distance between planned resection line and subject-drawn resectionline
Experiment Design
The tests were performed in a clinical environment with 12 surgeons from theRobert-Bosch Hospital in Stuttgart, Germany. The liver phantom was affixed to anexamination table. Participants were asked to stand next to the liver phantom. Thenavigation systems display was placed on the opposite side of the table, as commonduring clinical interventions that employ video displays (see Fig. 7.2).
First, two training tasks had to be performed by the participants. Therefore,a red resection line and a 3D model of the liver phantom were displayed on the
135
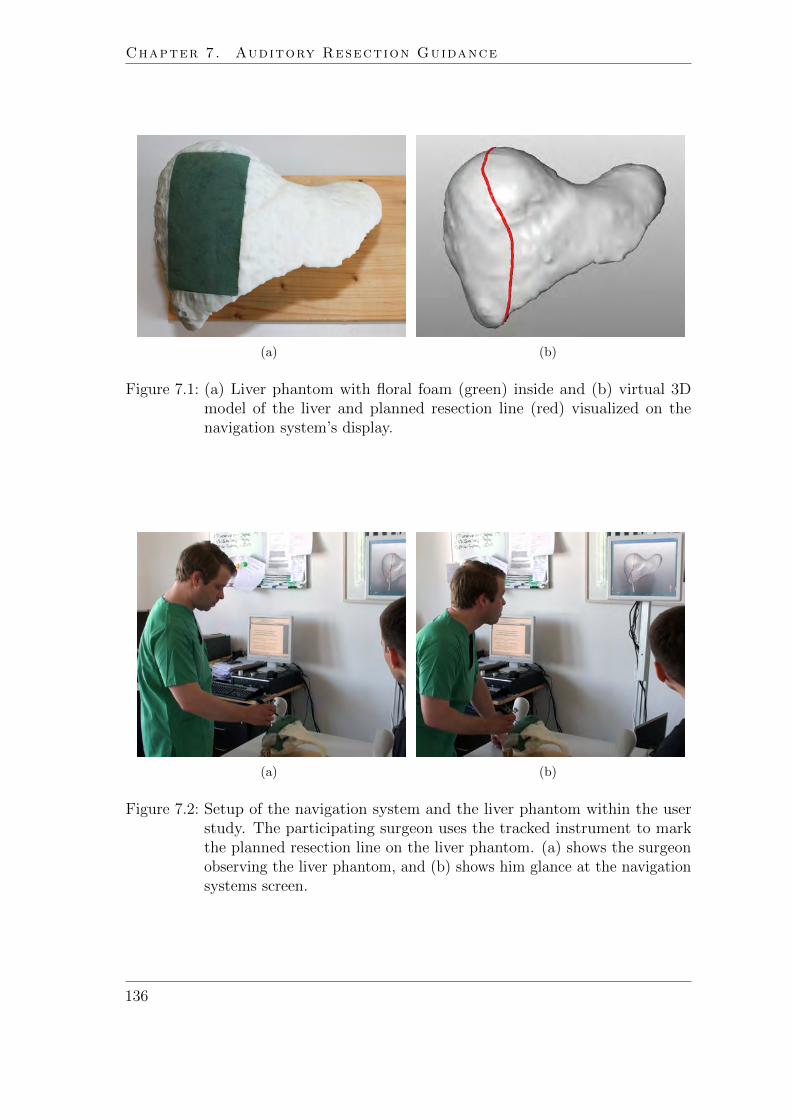
Chapter 7. Auditory Resection Guidance
(a) (b)
Figure 7.1: (a) Liver phantom with floral foam (green) inside and (b) virtual 3Dmodel of the liver and planned resection line (red) visualized on thenavigation system’s display.
(a) (b)
Figure 7.2: Setup of the navigation system and the liver phantom within the userstudy. The participating surgeon uses the tracked instrument to markthe planned resection line on the liver phantom. (a) shows the surgeonobserving the liver phantom, and (b) shows him glance at the navigationsystems screen.
136

7.4. Evaluation
navigation system’s display (see Fig. 7.1b). Participants were asked to transferthe resection line visualized on the video monitor to the liver phantom by lightlymarking the path on the floral foam using a pointer whose position was tracked bythe navigation system. Participants were instructed to look at the video monitor onlyif necessary and to concentrate on the surgical instrument and the liver phantom.One training task was to be performed without auditory support (visual only) andthe other training task with auditory support (combined condition).
Second, eight test tasks had to be performed by the participants. Thereby, fourresection lines (with the 3D model of the liver phantom) were separately presentedtwo times on the screen of the navigation system. The test tasks were divided intotwo groups: While four tasks (V1 − V4) did not make use of auditory display (visualonly), the other four tasks (A1 − A4) presented both visual and auditory displays(combined condition). The presentation of these test tasks occurred in random order.In order to reduce the memory effect, a randomization algorithm was chosen whichprohibited two test tasks with the same resection line to be performed in succession.
Before starting each test, participants were informed of the group to which theupcoming test belonged. Participants were further asked to look at the video monitoronly when necessary. After marking the resection line on the foam, participants wereasked to draw the final resection line a second time. The position and orientation ofthe pointer were recorded during the whole experiment. In addition, all tests wererecorded with a video camera.
Third, each participant completed a questionnaire consisting of personal questions(regarding age, gender, handedness, surgical experience, etc.) and statements forwhich the participants chose the degree to which they agreed or disagreed.
Analysis
A post-experiment video analysis provided the timing data for subjects’ looks at thescreen or the phantom, respectively. These data were used to construct the timebudget data and the mean times between changes of looks between phantom andscreen.
Data for marking accuracy was sampled using the tracking mechanisms of thenavigation system. The distance δ between the pointer tip position and the nearestpoint on the resection line was calculated for each sample. Because these samples weretaken in equal temporal distance, arithmetic means of δ would be skewed by differentdrawing speeds. When, for example, a subject did not move the tracked pointerat all, remaining in a position with low δ, the data with low δ would accumulateover time and thus overrepresent a low δ in the mean. Therefore, the mean distancebetween planned resection line Ip and subject-drawn resection line Id was introducedas a benchmark for marking quality. Given the arclength s on Id, the mean distanceis defined in the continuum as:
1
L·∫Id
δ(s) ds, where L =
∫Id
ds is the total length of Id. (7.1)
137

Chapter 7. Auditory Resection Guidance
Statistical analysis consisted of comparisons of the arithmetic means between datafor the auditory and visual conditions. Differences were tested using the Wilcoxontest and p < 0.05 was defined as statistically significant.
7.5 Results
For all evaluation criteria, differences between the visual and combined conditionswere found. For the visual only condition, subjects looked nearly 100 % of the timeat the screen. This time was reduced to around 10 % for the condition where theauditory signal was additionally available (Fig. 7.3).
When the additional auditory information was available to the subjects, deviationfrom the planned resection line was smaller than with the visual information alone(Fig. 7.4). However, subjects could not mark the resection line as fast as when relyingon the auditory information as opposed to the visual display only (Fig. 7.5).
Qualitative data for this evaluation was gathered from both voluntary commentsfrom the participants as well as a questionnaire filled out by each participant. Fromthis data, the direction of future development may be guided. Table 7.1 lists eachstatement and the average response and standard deviation.
Statement Average Response (σ)
The sounds could be heard well 3.92 (±0.29)The sounds were appropriate for the operating situation 3.25 (±0.75)The meaning of the sounds was clear 3.67 (±0.65)The system was intuitive 3.58 (±0.67)The audio feedback matched the visual feedback 3.42 (±0.67)The interaction was fun to use 3.58 (±0.90)The sounds helped me concentrate on the resection task 3.58 (±0.90)The sounds reduced my dependence on the visual display 3.17 (±0.83)I would use the sound feedback in my surgical task 3.33 (±0.65)I would recommend this to a colleague 3.33 (±0.65)
Table 7.1: Results of the questionnaire with chart showing average responses andstandard deviation σ, with a response of 1 corresponding to “stronglydisagree” and a response of 4 corresponding to “strongly agree”.
7.6 Discussion and Conclusion
The clinically oriented tests performed in the context of this work revealed thatauditory feedback could be a beneficial extension to surgical navigation systems.However, tests during surgical interventions have to still be performed in order tofurther adapt the proposed sound model for clinical routine. Specifically, the effects
138

7.6. Discussion and Conclusion
Combined Visual
0.0
0.2
0.4
0.6
0.8
1.0
Prop
ortio
n of
tim
e lo
okin
g at
scr
een
Figure 7.3: Proportion of time looking at screen for combined condition (Min = 0.00,1st Qu. = 0.03, Median = 0.10, 3rd Qu. = 0.23, Max = 0.30) and visualcondition (Min = 0.90, 1st Qu. = 0.93, Median = 0.96, 3rd Qu. = 0.96,Max = 0.99).
Mea
n di
stan
ce [m
m]
Combined Visual
01
23
4
Figure 7.4: Mean distance between planned resection line and subject-drawn resectionline for combined condition (Min = 0.31, 1st Qu. = 0.53, Median = 0.68,3rd Qu. = 1.00, Max = 1.62) and visual condition (Min = 0.36 , 1st Qu.= 0.85, Median = 1.48, 3rd Qu. = 2.19, Max = 4.00).
139

Chapter 7. Auditory Resection Guidance
Combined Visual
Mea
n tim
e pe
r tas
k [s]
020
4060
Figure 7.5: Mean time per task for combined condition (Min = 29.49, 1st Qu. =38.95, Median = 46.76, 3rd Qu. = 63.97, Max = 73.17) and visualcondition (Min = 13.88, 1st Qu. = 18.58, Median = 24.56, 3rd Qu. =28.09, Max = 31.49).
of environmental sounds such as speech, cutting device noise, or warning signalsfrom anesthesia devices on the surgeons’ interaction and recognition of the auditorydisplay must be evaluated.
Overall, the qualitative questionnaire showed that the subjects found the approachof using auditory display for resection marking as promising and well suited for thetask. Surgeons requested aesthetically pleasing sounds that could be tolerated tohear over a time range long enough for surgical tasks. However, it is difficult todiscover sound models that meet these requirements as well as providing the requiredresection guidance support in a clear way. An adequate variety of sound modelsmight be provided to give surgeons a choice of equally functional sound models.In addition, these sound models might be made easily configurable for surgeons orassistants to improve acceptance and reduce possible annoyance. Moreover, industrialstandards such as IEC 60601-1-8 for alarms in medical equipment [IEC, 2006] haveto be taken into account in order to meet legal requirements for audio in operatingenvironments.
In the evaluation, the auditory display significantly reduced the time that surgeonslooked on the navigation system screen. Simultaneously, the auditory display reducedthe mean distance to the planned resection line. However, the mean time neededfor each task was almost doubled. Thus, the proposed auditory display reduces thedependency on the visual display and increases accuracy, albeit at the cost of taskcompletion time.
One contributing factor for this increase in task completion time could be that theauditory display alerted the surgeon when leaving the safe margin. This auditorynotification may have caused a more cautious (but also more accurate) marking of
140
7.6. Discussion and Conclusion
the resection line than without having this information. A second contributing factorcould be the new introduction of the auditory display to the subjects, many withexperience working with visual navigation systems but none with auditory displays.When using the visual display alone, the interaction with the system was similarto using a computer mouse, because the position and movements of the on-screeninstrument directly corresponded to those of the physically tracked instrument. Dueto the novelty of the method, a longer and more intense training period would likelyreduce the task completion time. Conversations with test surgeons revealed thatlonger task times are not necessarily a negative effect if these longer times accompanyan increase in concentration. In the qualitative questionnaire, most subjects agreedthat the auditory display helped to concentrate on the resection task.
A third contributing factor to increased task completion time could be the studyconditions, which did not exactly match the situation of an actual liver resection.Although the task to mark a resection line on a liver phantom is similar to resectionmarking on a real human liver, one important difference is that during real liversurgery it would be irresponsible to mark a resection line on the liver by lookingnearly 100% of the time at the screen, as several subjects did during the tests. Itcould be assumed that during actual liver surgery, the time looking at the screendecreases, while the time to mark a resection line increases. For further laboratorystudies, the study design should consider conditions that stimulate participants tolook more often at the liver phantom, e.g., by showing essential information on thephantom that needs to be perceived by the participant to pass the test.
The work proposed in this chapter builds upon work by Wegner [1998] andWoerdeman et al. [2009], who provided a groundwork for applying auditory displayto navigated surgery tasks. However, this work aims to go beyond basic approaches,such as those of Woerdeman et al., and more deeply explore the ability of alternativemodalities like auditory display can have to reduce stress and increase concentrationand accuracy in navigated surgery.
Because the auditory display system has shown promise in helping to improvethe accuracy of resection marking and reducing the amount of time looking on thescreen, it may also improve other aspects of navigated liver surgery, and by extension,other types of navigated surgery as well. In the domain of liver surgery, auditorydisplay has also been explored [Black, 2010] for notifying the surgeon of potentialrisk structures in the vicinity of the tracked instrument, such as veins and tumorsthat should not be damaged. By emitting warning signals when the instrumenttip enters predefined distances to the risk structures, the surgeon could be notifiedof presence of such a risk without having to look at the visual display and takingconcentration away from the patient. However, when considering clinical applicabilityof available navigation systems for liver surgery, it is important to mention thatcurrently only the marking step is supported with adequate registration accuracy.An accurate, continuous tracking of liver movement during the cutting phase isstill under research [Vetter et al., 2003; Cash et al., 2007; Beller et al., 2009b]. Themethod proposed in this paper intends to support the marking step, but could alsobe applied for the cutting phase in the future.
141

Chapter 7. Auditory Resection Guidance
In addition to navigated liver surgery, auditory display methods could be usefuladditions to other types of surgery for which visual contact to the situs is importantor for which there is a strong dependence on a visual display, including neurosurgery,laparoscopic surgery, and radio-frequency ablation. Further work must discover forwhich cases auditory display is beneficial and the optimal means of implementingsuch displays.
Publications The content of this chapter contains work that is accepted for publicationin the International Journal of Medical Robotics and Computer Assisted Surgery [Hansenet al., 2012] at the time point of submission of this thesis. In addition, preliminary work waspresented at the 24th Congress for Computer Assisted Radiology and Surgery (CARS), Genf,Switerland [Black et al., 2010]. The research has been performed in strong collaboration withDavid Black (Fraunhofer MEVIS), who implemented parts of the proposed sound modelwithin his masters thesis [Black, 2010].
142

8 Conclusion
The solution to every problem is yetanother problem.
(Johann Wolfgang von Goethe)
Probably no one in 1895 could foresee that the discovery of radiologicimaging by Wilhelm Conrad Rontgen would have such an impact and wouldrevolutionize medicine over the following decades. With the later development
of scanner technologies, it was possible to provide 3D visualization of body regions,like those of complex organs such as the liver. Due to continuous research, theradiation load was reduced over the years while image quality was improved. Inaddition, other image modalities such as MR imaging and ultrasound were introducedin the clinical routine.
143

Chapter 8. Conclusion
Challenges
The increasing advance of imaging technology in hospitals during the last decadeshas led to large amounts of data for each patient. The development of softwareassistants that support physicians in extracting the essential information from thisdata is challenging.
This thesis focuses on computer-assisted liver surgery. Thereby, following clinicalproblems are addressed:
• Preoperative risk assessment for complex tumor resections
• Adaptation of surgical planning data in case of intraoperative findings
• Appropriate presentation of surgical planning data in the operating room
In this context, it is important to keep in mind that medical images and thederived surgical planning data represent only a part of reality. For this reason,software assistance should provide decision support rather than dictating finalsurgical decisions.
Contributions of this Thesis
An overall objective of this work is the separation of the essential information fromthe nonessential information. This required a closer look at the dedicated surgicalworkflow steps and the clinical questions that need to be answered.
This work introduces a software assistant to explore the dependency of vascularterritories from safety margins around tumors. Robustness and sensitivity of vascularrisk in the liver is visualized within a volume-margin function and in interactive 3Drenderings. The results of the performed user study showed that the proposed riskanalysis represents additional information that influences surgeons’ decisions. Besidesa method to evaluate the effect of safety margins with uniform width, tools for theexploration of non-uniform safety margins are proposed. Non-uniform safety marginstake into account that the minimal distance to the resection surface varies. Thisconcept expands planning possibilities and reflects the reality better than establishedmethods that utilize uniform safety margins.
Another central contribution of this work are tools for the intraoperative adaptationof risk analyses and resection plans in case of intraoperative findings. So far,preoperative planning data for liver surgery has had limited value during interventionswhen the planning strategy needed to be adapted. An intraoperative planningassistant that can be remotely controlled by surgical navigation systems is introduced.The proposed combination of planning adaptation and intraoperative navigationprovides surgeons with a tool for quantitative risk assessment in case changes to theresection strategy are necessary. A clinically oriented study proved the feasibility ofthe concept and showed how the proposed methods can be integrated in the workflowof navigated liver interventions.
144

New methods for intraoperative visualization of surgical planning data are in-troduced. A main contribution is the risk map, which enhances difficult locationson a planned resection surface and visualizes the information in one single view.Difficult locations are determined through detailed analysis of critical structuresin the proximity of the resection surface. The resulting visualization is clear andintuitive, allowing for a fast mental mapping of the current resection surface to therisk map.
In addition, illustrative visualization methods for 3D planning models are presented.The methods aim to enhance spatial relations and allow reliable distance assessmentin medical AR applications. To minimize occlusion of the surgical view, the geometriccomplexity of planning models is reduced through focus and context visualizationtechniques. The selection of important structures (focus) is guided by visualizationscenarios which address workflow steps in navigated liver surgery. As shown in thiswork, illustrative AR has great potential to improve spatial perception, an essentialproblem in medical AR.
Finally, methods for auditory resection guidance in open liver surgery are intro-duced. The methods supports guiding the tracked instrument towards and remainingon a predefined resection line. The performed user study revealed that surgeonsspent less time looking on the screen and more time looking at the working areawhen marking a resection line. Auditory display in combination with a visualizationof planning data shows great promise to become an important part of navigationsystems for liver surgery.
Proposal for Future Work
To provide a reliable software assistant for preoperative risk analysis, previous andsubsequent steps in the planning pipeline need to be adapted according to theneeds of the proposed risk analysis. A measure of the accuracy of segmentationresults would be a great benefit to indicate the level of risk analysis reliability. Inaddition, it is promising to combine the proposed risk analysis with advanced toolsfor liver resection planning, such as methods for the evaluation of resection surfacesas presented by Demedts et al. [2010]. A selected margin width for a tumor andassociated volumes at risk could be directly integrated in the evaluation function ofa virtual resection surface.
Future developments in surgical planning adaptation should further automate theupdate of planning data, particularly the definition of new resection plans. A methodthat delivers meaningful results from radiologic data in a completely automatedway is desirable but not currently technically feasible. The decision of a specificresection strategy often depends on individual parameters, such as anamnesis of thepatient, status of the liver, and the experience of the surgeon. A future applicationfor automatic adaptation of resection plans needs to take these individual parametersinto account to generate meaningful results.
Intraoperative visualization for liver surgery needs to be further investigated andevaluated in clinical settings. The reduction of model complexity enables very
145
Chapter 8. Conclusion
effective visualization of surgical risk. However, the apparent accuracy harbors risksfor the observer. An important step for future research represents the analysis andvisualization of inaccuracies. This is especially true if the visualization is used as anintraoperative navigation aid.
Accuracy of navigation systems in liver surgery needs to be further increasedto provide reliable navigation support. To use a visualization of planning dataduring navigated liver surgery, the location of critical structures needs to be updatedaccording to the actual deformation of the liver. In order to estimate the defor-mation, sophisticated intraoperative registration methods might be combined withdeformation models of the liver. Furthermore, medical vendors need to integrate ARdevices, such as camera-projector systems, in their product portfolio to promote theuse of AR techniques and to reduce setup time of required technical equipment.
The proposed method for auditory display opens up completely new possibilitiesand dangers for navigated liver surgery. While the recent concept of navigatedliver surgery is solely based on the visualization of planning models, no explicitnavigation commands are provided. Incidentally, this eases the clearance of surgicalnavigation systems for clinical trials because the navigations systems provide onlyimplicit navigation support. With auditory display, explicit navigation commands ornotifications can be provided even if the surgeon does not look on the screen. Futureevaluations of such systems during clinical interventions must be carefully preparedwith regard to legal and ethical requirements.
To sum up, the methods developed in the context of this dissertation projectcontribute to the field of computer-assisted liver surgery and have the potentialto improve the safety of surgical intervention. Research in computer-assisted liversurgery has not been completed by now. The development needs to be continued inthe future in strong collaboration between radiologist, surgeons and scientists.
146

Appendix


Acknowledgement
This thesis would not have been possible without the support of many people. First, Iwould like to thank my supervisor Horst Hahn whose understanding and encouragingguidance has been a great value for me. Horst has been a great teacher and hisdetailed and constructive feedback improved the quality of this work. Similarly, Ithank Bernhard Preim for all the discussions from the very early stages of this thesisand for his support in various ways. Many thanks go to Lars Linsen for being partof the dissertation committee and for his constructive comments.
This thesis would not have been possible without the support of my colleaguesfrom Fraunhofer MEVIS in Bremen. Big thanks go to Stephan Zidowitz and FelixRitter, who supervised my project work at Fraunhofer MEVIS, guided me during thelast years and taught me to think out of the box. I would like to thank Heinz-OttoPeitgen, who brought in fundamental ideas into this thesis, founded the MeVis groupand is mainly responsible for the outstanding work atmosphere at our institute.
Without the support and advice of Guido Prause and Markus Lang, many thingswould have been impossible. They motivated me continuously and enabled me towrite this dissertation alongside my daily project work. Special thanks go to myoffice colleague Darko Ojdanic for his advice and encouragement. I also gratefullyacknowledge Thomas Eberhardt, Milo Hindennach, Alexander Kohn, ChristophLange, and Wolf Spindler for answering almost every technical question that arose.A lot of colleagues and friends reviewed the draft versions of this thesis or relatedpublications and provided valuable comments. I would particularly like to thankDavid Black, Holger Bourquain, Ola Friman, Benjamin Geisler, Frank Heckel, JanKlein, Hans Meine, Bernd Merkel, Jan Moltz, Christian Rieder, Andrea Schenk, andChristian Schumann. I was also privileged to work with a number of great students,including David Black, Longquan Chen, Daniel Demedts, Benjamin Durth, BjornLindow, Bojan Kocev, Ursula Marciniac and Jan Wieferich.
I express gratitude to all involved physicians for all the fruitful discussions andclinical advice. Their feedback and ideas led the research in the context of this dis-sertation project. I particularly acknowledge Marcello Donati, Human Honarpisheh,Karl Oldhafer and Gregor Stavrou from Asklepios Hospital Barmbek, Markus Klee-mann from University Hospital Lubeck, Wolfram Lamade and Fabian Rieber fromRobert-Bosch Hospital Stuttgart, Nicholas Wendt from Sankt Josef Hospital Bremen,Thomas Jungbluth from Asklepios Hospital Bad Oldesloe, Hauke Lang from Univer-sity Hospital Mainz, Michael Neipp from Hospital Itzehoe, and Thomas Mansfeldfrom Asklepios Hospital Wandsbek.
I would like to thank our project partners, especially Stefan Schlichting fromDrager Medical in Lubeck, Armin Besirevic and Volker Martens from the University
149

of Lubeck, Sylvain Andregg and Matthias Peterhans from CAScination in Bern,Stefan Weber from the University of Bern, Mathias Markert from the TechnicalUniversity Munich, Konrad Muhler from the University of Magdeburg, MarcusBarann, Christiane Engel, Michaela Jesse, Ulrike Kayser, Olaf Konrad, Uwe Siems andSusanne Zentis from MeVis Medical Solutions in Bremen for productive collaborationin the last years and their contributions.
Lastly, I would like to thank my family for their love and encouragement. Myparents, who never suppressed my joy of experimentation, and my wife Daniela,whose support and understanding in the final stages of this thesis was appreciatedvery much.
150

List of Abbreviation
API Application Programming InterfaceAR Augmented RealityBD Bile DuctCCD Charge-Coupled DeviceCRLM Colorectal Liver MetastasisCT Computer TomographyDTI Diffusion Tensor ImagingFDA Food and Drug Administration (United States of America)FEM Finite Element MethodfMRI Functional Magnetic Resonance ImagingFTP File Transfer ProtocolGLSL OpenGL Shading LanguageGPU Graphics Processing UnitHA Hepatic ArteryHCC Hepatocellular Carcinoma (a primary malignant liver tumor)HMD Head-Mounted DisplayHV Hepatic VeinIOUS Intraoperative UltrasoundIPA Intraoperative Planning AssistantLDLT Living Donor Liver TransplantationLED Light-Emitting DiodeLHV Left Hepatic VeinMDS MeVis Distance ServiceMELD Model of End Stage Liver DiseaseMHV Middle Hepatic VeinMPR Multiplanar ReformationMR(I) Magnetic Resonance (Imaging)PCA Principal Component AnalysisPV Portal VeinRHV Right Hepatic VeinSOA Service-Oriented ArchitectureSPECT Single Photon Emission Computed TomographyTOF Time of FlightVR Virtual RealityVRML Virtual Reality Modeling LanguageXML Extensible Markup Language
151


List of Symbols
G Mathematical graphN Nodes of graph GE Edges of graph Gd Current width of safety margin (mm)δ Distance to the virtual resection surface (mm)DB Distance transformation encoding the distance to resection surface boundaryDHV Distance transformation coding the distance to hepatic veinDPV Distance transformation encoding the distance to portal veinDSURF Distance transformation encoding the distance to resection surfaceDT Distance transformation encoding the distance to tumorsIp Planned resection lineId Subject-drawn resection lineL Total length of subject-drawn resection line IdPin Point set for which each point is located within the liver volumePout Point set for which each point is located on the liver surfaceσ Standard deviations Arclength on subject-drawn resection line IdSLiv 3D segmentation mask of the liverSTum 3D segmentation mask of tumorsRS 3D mask encoding the resection volume of a resection planRM 3D mask encoding the remnant volume of a resection planTPV 3D mask encoding portal vein territoriesTHV 3D mask encoding hepatic vein territoriestV ol Volume thresholdVd Affected volume for a safety margin of width dVd−1 Affected volume for a safety margin of width d− 1w Width of uniform safety margin (mm)
153


Specification of used Hardware
Intraoperative Planning Assistant (IPA)
Processor Intel c©CoreTM 2 Duo E8500, 3.16GHzMain memory 8GB RAMGraphic board Nvidia GeForce 8800 GTXOperating system Windows c©Vista Enterprise 64 Bit
Preoperative Planning System
Processor Intel c©CoreTM i7-975, 3.33 GHzMain memory 12GB RAMGraphic board NVIDIA GeForce 295 GTXOperating system Windows c©7 Enterprise 64 Bit
155


Questionaires
Questionaire 1: Vascular Risk Analysis (Chapter 3)
Klinische Information: Patient mit CRLM. Anzustrebendes Leber-Rest-Volumen > 35 %.
(1) Wie stufen Sie insgesamt die Schwierigkeit dieser Tumorresektion ein?
2 Sehr groß
2 Groß
2 Mittel
2 Maßig
2 Gering
(2) Ist der vorliegende Tumor Ihrer Meinung nach resektabel?
2 Nein
2 Ja, aber mit kleinem Sicherheitsabstand (< 5mm)
2 Ja, mit großem Sicherheitsabstand (> 5mm)
2 Keine Aussage moglich
(3) Wie sicher sind Sie sich?
2 Sehr sicher
2 Sicher
2 Weniger sicher
2 Unsicher
(4) An welchen Stellen mussen Ihrer Meinung nach Gefaße durchtrennt werden?
Selektieren Sie die Stellen am Bildschirm.
157

(5) Wie sicher sind Sie sich?
2 Sehr sicher
2 Sicher
2 Weniger sicher
2 Unsicher
(6) Welche Resektionsstrategie wurden Sie vorschlagen?
• Anatomisch
2 Segmentorientierte Resektion (Segment- oder Bisegmentektomie)
2 Zentrale Leberresektion
2 Hemihepatektomie rechts
2 Hemihepatektomie links
2 Sonstiges:
• Erweitert-Anatomisch
2 Erweiterte Hemihepatektomie rechts
2 Erweiterte Hemihepatektomie links
2 Hemihepatektomie rechts
2 Hemihepatektomie links
2 Sonstiges:
• Nicht-Anatomisch
2 Lokale Resektion
2 Sonstiges:
(7) Wie sicher sind Sie sich?
2 Sehr sicher
2 Sicher
2 Weniger sicher
2 Unsicher
(8) Welche Sicherheitsabstande um die Metastase wurden Sie anstreben?
Minimaler Sicherheitsabstand: mm
158

(9) Wie sicher sind Sie sich?
2 Sehr sicher
2 Sicher
2 Weniger sicher
2 Unsicher
(10) Zu welcher/n Struktur/en wurden sie den minimalen Abstand wahlen?
Selektieren Sie die Strukturen am Bildschirm.
(11) Wie beurteilen Sie das Risiko von relevanten Abflussstorungen (Lebervene)?
2 Hohes Risiko
2
2 Mittleres Risiko
2
2 Kein Risiko
2 Keine Aussage moglich
Selektieren Sie die Bereiche am Bildschirm.
(12) Wie beurteilen Sie das Risiko von relevanten Zuflussstorungen (Portalvene)?
2 Hohes Risiko
2
2 Mittleres Risiko
2
2 Kein Risiko
2 Keine Aussage moglich
Selektieren Sie die Bereiche am Bildschirm.
159


Questionaire 2: Risk Maps (Chapter 5)
An welchen Stellen der Resektionsflache wurden sie besonders vorsichtigoperieren?
Skizzieren und klassifizieren Sie die Areale farblich mit Hilfe der auf dem Tischbefindlichen Buntstifte:
Portalvene = BLAU
Lebervene = GRUNTumor = ROT
Bitte skizzieren Sie hier
Die im Computer eingefarbte Resektionsflache hat mich bei der Risikobewertung derResektion unterstutzt?
2 Trifft zu
2 Trifft eher zu
2 Trifft eher nicht zu
2 Trifft nicht zu
161


Questionaire 3: Auditory Display (Chapter 7)
(1) Ich konnte die Tone gut horen.
2 Trifft zu
2 Trifft eher zu
2 Trifft eher nicht zu
2 Trifft nicht zu
(2) Die Tone waren an die Situation im OP angepasst.
2 Trifft zu
2 Trifft eher zu
2 Trifft eher nicht zu
2 Trifft nicht zu
(3) Die Bedeutung der Tone war mir klar.
2 Trifft zu
2 Trifft eher zu
2 Trifft eher nicht zu
2 Trifft nicht zu
(4) Das Audio-System war intuitiv zu bedienen.
2 Trifft zu
2 Trifft eher zu
2 Trifft eher nicht zu
2 Trifft nicht zu
(5) Die Tone stimmten mit der visuellen Darstellung uberein.
2 Trifft zu
2 Trifft eher zu
2 Trifft eher nicht zu
2 Trifft nicht zu
(6) Die Instrumenten-Interaktion mit Hilfe der Tone hat mir Spaß gemacht.
2 Trifft zu
2 Trifft eher zu
2 Trifft eher nicht zu
2 Trifft nicht zu
163

(7) Die Tone halfen mir mich auf das Markieren der Resektionsflache zu konzentri-eren.
2 Trifft zu
2 Trifft eher zu
2 Trifft eher nicht zu
2 Trifft nicht zu
(8) Die Tone reduzierten meine Abhangigkeit vom Bildschirm.
2 Trifft zu
2 Trifft eher zu
2 Trifft eher nicht zu
2 Trifft nicht zu
(9) Ich wurde ein solches akustisches Feedback zur Unterstutzung chirurgischerAufgaben nutzen.
2 Trifft zu
2 Trifft eher zu
2 Trifft eher nicht zu
2 Trifft nicht zu
(10) Ich wurde ein solches System an Kollegen weiterempfehlen.
2 Trifft zu
2 Trifft eher zu
2 Trifft eher nicht zu
2 Trifft nicht zu
164

List of Own Publications
Black, D., Hansen, C., Loviscach, J., and Peitgen, H.-O. (2010). “Auditory Supportfor Image-Guided Liver Surgery.” In: Proc. of the 24th International Symposiumon Computer Assisted Radiology and Surgery (CARS), 5(Supplement 1), pp. 187–188 (cited on pp. 133, 142).
Demedts, D., Schenk, A., Hansen, C., and Peitgen, H.-O. (2010). “Evaluation ofResection Proposals for Liver Surgery Planning.” In: Proc. of the 9th AnnualMeeting of the German Society of Computer- and Robot-Assisted Surgery, pp. 13–16 (cited on pp. 12, 23, 24, 145).
Hansen, C., Schlichting, S., Markert, M., Hindennach, M., Zidowitz, S., and Peitgen,H.-O. (2007a). “Intraoperative Adaptation of Preoperative Risk Analyses forOncologic Liver Surgery using tracked 2D ultrasound.” In: Proc. of the 6thAnnual Meeting of the German Society of Computer- and Robot-Assisted Surgery,pp. 155–158 (cited on p. 94).
Hansen, C., Koehn, A., Ritter, F., Zidowitz, S., and Peitgen, H.-O. (2007b). “Si-multaneous Visualization of Preoperative Planning Models and IntraoperativeUltrasound for Liver Surgery.” In: Proc. of Eurographics (Short Papers andMedical Prize Awards), pp. 117–120.
Hansen, C., Wieferich, J., Ritter, F., Rieder, C., and Peitgen, H.-O. (2008a). “Il-lustrative Visualization of 3D Planning Models for Augmented Reality in LiverSurgery.” In: Proc. of the 7th Annual Meeting of the German Society of Computer-and Robot-Assisted Surgery, pp. 1–4 (cited on p. 127).
Hansen, C., Zidowitz, S., Schenk, A., Oldhafer, K., Lang, H., and Peitgen, H.-O.(2008b). “Intraoperative Adaptation and Visualization of Preoperative RiskAnalyses for Oncologic Liver Surgery.” In: Proc. of SPIE Medical Imaging.Vol. 6918, pp. 691809–1–10 (cited on p. 94).
Hansen, C., Schlichting, S., Zidowitz, S., Kleemann, M., and Peitgen, H.-O. (2008c).“Intraoperative Adaptation of Planning Data for Oncologic Liver Surgery.” In:Proc. of MICCAI Workshop on Image Guidance and Computer Assistance forSoft-Tissue Interventions, pp. 36–45 (cited on p. 94).
Hansen, C., Kohn, A., Schlichting, S., Weiler, F., Konrad, O., Zidowitz, S., andPeitgen, H.-O. (2008d). “Intraoperative Modification of Resection Plans for LiverSurgery.” In: Int J Comput Assist Radiol Surg, 2(3-4), pp. 291–297 (cited onp. 94).
Hansen, C., Zidowitz, S., Hindennach, M., Schenk, A., Hahn, H., and Peitgen, H.-O.(2009a). “Interactive Determination of Robust Safety Margins for Oncologic LiverSurgery.” In: Proc. of the 23rd International Symposium on Computer AssistedRadiology and Surgery (CARS), 4(Supplement 1), p. 94 (cited on p. 67).
165
List of Own Publications
Hansen, C., Zidowitz, S., Hindennach, M., Schenk, A., Hahn, H., and Peitgen, H.-O.(2009b). “Interactive Determination of Robust Safety Margins for OncologicLiver Surgery.” In: Int J Comput Assist Radiol Surg, 4(5), pp. 469–474 (cited onp. 67).
Hansen, C., Wieferich, J., Ritter, F., Rieder, C., and Peitgen, H.-O. (2010a). “Il-lustrative Visualization of 3D Planning Models for Augmented Reality in LiverSurgery.” In: Int J Comput Assist Radiol Surg, 5(2), pp. 133–141 (cited onp. 127).
Hansen, C., Zidowitz, S., Schenk, A., Oldhafer, K., Lang, H., and Peitgen, H.-O.(2010b). “Risk maps for navigation in liver surgery.” In: Proc. of SPIE MedicalImaging. Vol. 7625, pp. 762528–1–8 (cited on p. 112).
Hansen, C., Lindow, B., Zidowitz, S., Schenk, A., and Peitgen, H.-O. (2010c). “To-wards Automatic Generation of Resection Surfaces for Liver Surgery Planning.”In: Proc. of the 24th International Symposium on Computer Assisted Radiologyand Surgery (CARS), 5(Supplement 1), pp. 119–120 (cited on p. 94).
Hansen, C., Black, D., Lange, C., Rieber, F., Lamade, W., Donati, M., Oldhafer,K. J., and Hahn, H. K. (2012). “Auditory Support for Resection Guidance inNavigated Liver Surgery.” In: Int J Med Robot, in print (cited on pp. 134, 142).
Muhler, K., Hansen, C., Neugebauer, M., and Preim, B. (2008). “AutomatischeKamerapositionierung fur intra-operative Visualisierungen in der onkologischenLeberchirurgie.” In: Proc. of Bildverarbeitung fur die Medizin. Informatik aktuell,pp. 143–147.
Ritter, F., Hansen, C., Dicken, V., Konrad, O., Preim, B., and Peitgen, H.-O. (2006).“Real-time illustration of vascular structures.” In: IEEE Visualization, 12(5),pp. 877–884 (cited on pp. 114, 117, 119, 123).
Ritter, F., Hansen, C., Wilkens, K., Kohn, A., and Peitgen, HO (2009). “UserInterfaces for Direct Interaction with 3D Planning Data in the Operation Room.”In: Journal of i-com (Zeitschrift fur interaktive und kooperative Medien), 8(1),pp. 24–31 (cited on pp. 71, 94).
166

Bibliography
Adams, R. and Bischof, L. (1994). “Seeded Region Growing.” In: IEEE Trans.Pattern Anal. Mach. Intell. 16 (6), pp. 641–647 (cited on p. 18).
Amenta, P. S. (1997). Histology: From Normal Microanatomy to Pathology. PiccinNuova Libraria, Italy (cited on p. 7).
Asakuma, M., Fujimoto, Y., Bourquain, H., Uryuhara, K., Hayashi, M., Tanigawa,N., Peitgen, H. O., and Tanaka, K. (2007). “Graft selection algorithm basedon congestion volume for adult living donor liver transplantation.” In: Am. J.Transplant. 7, pp. 1788–1796 (cited on pp. 20, 21, 62).
Ayache, N. (2003). “Epidaure: a research project in medical image analysis, simulation,and robotics at INRIA.” In: IEEE Transactions on Medical Imaging, 22(10),pp. 1185–1201 (cited on pp. 34, 35, 70).
Baegert, C., Villard, C., Schreck, P., Soler, L., and Gangi, A. (2007). “Trajectoryoptimization for the planning of percutaneous radiofrequency ablation of hepatictumors.” In: Comput. Aided Surg. 12, pp. 82–90 (cited on p. 23).
Baek, C. K., Choi, J. Y., Kim, K. A., Park, M. S., Lim, J. S., Chung, Y. E., Kim,M. J., and Kim, K. W. (2011). “Hepatocellular carcinoma in patients with chronicliver disease: A comparison of gadoxetic acid-enhanced MRI and multiphasicMDCT.” In: Clin Radiol (cited on p. 15).
Bale, R., Widmann, G., and Stoffner, D. I. (2010). “Stereotaxy: breaking the limitsof current radiofrequency ablation techniques.” In: Eur J Radiol, 75, pp. 32–36(cited on p. 9).
Beller, S., Hunerbein, M., Eulenstein, S., Lange, T., and Schlag, P. M. (2007).“Feasibility of navigated resection of liver tumors using multiplanar visualizationof intraoperative 3-dimensional ultrasound data.” In: Annals of Surgery, 246(2),pp. 288–294 (cited on p. 25).
Beller, S., Lange, T., Eulenstein, S., Beller, L., Chopra, S., Dudeck, O., Schlag, P.,and Hunerbein, M. (2008). “3D-Elaboration of postoperative CT data after liverresection: technique and utility.” In: Int J Comput Assist Radiol Surg, 3(6),pp. 581–589 (cited on pp. 23, 61, 88).
Beller, S., Eulenstein, S., Lange, T., Niederstrasser, M., Hunerbein, M., and Schlag,P. M. (2009a). “A new measure to assess the difficulty of liver resection.” In:European Journal of Surgical Oncology, 35(1), pp. 59–64 (cited on pp. 21, 22,108).
Beller, S., Eulenstein, S., Lange, T., Hunerbein, M., and Schlag, P. M. (2009b).“Upgrade of an optical navigation system with a permanent electromagneticposition control: a first step towards ‘‘navigated control’’ for liver surgery.” In:
167

Bibliography
Journal of Hepato-Biliary-Pancreatic Surgery, 16(2), pp. 165–170 (cited on pp. 32,33, 87, 105, 141).
Beller, S., Hunerbein, M., Lange, T., Eulenstein, S., and Schlag, P. M. (2010).“Navigation in der offenen Leberchirurgie.” In: Computerassistierte Chirurgie.Urban & Fischer Verlag, pp. 525–532 (cited on pp. 25, 26, 28, 29).
Bichlmeier, C., Wimmer, F., Heining, M., and Navab, N. (2007). “ContextualAnatomic Mimesis Hybrid In-Situ Visualization Method for Improving Multi-Sensory Depth Perception in Medical Augmented Reality.” In: Proc. of 6th IEEEand ACM International Symposium on Mixed and Augmented Reality. IEEEComputer Society, pp. 1–10 (cited on p. 116).
Blaas, J., Botha, C. P., Majoie, C., Nederveen, A., Vos, F. M., and Post, F. H. (2007).“Interactive Visualization of Fused fMRI and DTI for Planning Brain TumorResections.” In: Proc. of SPIE Medical Imaging. Vol. 6509 (cited on p. 39).
Black, D., Hansen, C., Loviscach, J., and Peitgen, H.-O. (2010). “Auditory Supportfor Image-Guided Liver Surgery.” In: Proc. of the 24th International Symposiumon Computer Assisted Radiology and Surgery (CARS), 5(Supplement 1), pp. 187–188 (cited on pp. 133, 142).
Black, David (2010). “Auditory Display for Liver Surgery.” MA thesis. Departmentof Computer Science, University of Applied Sciences Bremen, Germany (cited onpp. 133, 141, 142).
Bourquain, H., Schenk, A., Link, F., Preim, B., Prause, G., and Peitgen, H.-O. (2002).“HepaVision2: A software assistant for preoperative planning in living-relatedliver transplantation and oncologic liver surgery.” In: Proc. of Computer AssistedRadiology and Surgery (CARS). Springer, pp. 341–346 (cited on pp. 19, 20, 70,132).
Brant, W. and Helms, C. (1999). Fundamentals of Diagnostic Radiology. 2nd ed.Lippincott Williams and Wilkins (cited on p. 6).
Broek, M. A. J. van den, Olde Damink, S. W. M., Dejong, C. H. C., Lang, H.,Malago, M., Jalan, R., and Saner, F. H. (2008). “Liver failure after partialhepatic resection: definition, pathophysiology, risk factors and treatment.” In:Liver International : Official Journal of the International Association for theStudy of the Liver, 28(6), pp. 767–780 (cited on p. 111).
Broers, H. (2005). “Probe and optical measuring system.” Pat. EP1498688 (cited onp. 87).
Brouquet, A., Abdalla, E. K., Kopetz, S., Garrett, C. R., Overman, M. J., Eng,C., Andreou, A., et al. (2011). “High survival rate after two-stage resectionof advanced colorectal liver metastases: response-based selection and completeresection define outcome.” In: J. Clin. Oncol. 29, pp. 1083–1090 (cited on p. 7).
Bruckner, S. (2008). “Interactive Illustrative Volume Visualization.” PhD thesis.Department of Computer Science, Vienna University of Technology, Austria(cited on p. 116).
Cash, D. M., Miga, M. I., Sinha, T. K., Galloway, R. L., and Chapman, W. C. (2005).“Compensating for intraoperative soft-tissue deformations using incomplete sur-
168

Bibliography
face data and finite elements.” In: IEEE Trans Med Imaging, 24, pp. 1479–1491(cited on p. 31).
Cash, D. M., Miga, M. I., Glasgow, S. C., Dawant, B. M., Clements, L. W., Cao,Z., Galloway, R. L., and Chapman, W. C. (2007). “Concepts and PreliminaryData Toward the Realization of Image-guided Liver Surgery.” In: Journal ofGastrointestinal Surgery, 11(7), pp. 844–859 (cited on pp. 25, 105, 126, 141).
Chandra, A., Mangam, S., and Marzouk, D. (2009). “A review of risk scoring systemsutilised in patients undergoing gastrointestinal surgery.” In: J. Gastrointest. Surg.13, pp. 1529–1538 (cited on p. 20).
Cho, S. H., Kang, U. R., Kim, J. D., Han, Y. S., and Choi, D. L. (2011). “The valueof gadoxetate disodium-enhanced MR imaging for predicting posthepatectomyliver failure after major hepatic resection: a preliminary study.” In: Eur J Radiol,80, pp. 195–200 (cited on p. 62).
Chojecki, P. and Leiner, U. (2009). “Beruhrungslose Gestik-Interaktion im Opera-tionssaal Touchless Gesture-Interaction in the Operating Room.” In: Journal ofi-com (Zeitschrift fur interaktive und kooperative Medien), 8(1), pp. 13–18 (citedon p. 71).
Cleary, K. and Peters, T. (2010). “Image-guided interventions: technology reviewand clinical applications.” In: Annual Review of Biomedical Engineering, 12,pp. 119–142 (cited on pp. 28–30).
Clements, L., Dumpuri, P., Chapman, W., Dawant, B., Galloway, R., and Miga, M.(2011). “Organ surface deformation measurement and analysis in open hepaticsurgery: Method and preliminary results from 12 clinical cases.” In: IEEE TransBiomed Eng (cited on pp. 30, 31).
Clifford, M. A., Banovac, F., Levy, E., and Cleary, K. (2002). “Assessment ofhepatic motion secondary to respiration for computer assisted interventions.” In:Computer Aided Surgery, 7(5), pp. 291–299 (cited on pp. 30, 32, 73).
Conlon, R., Jacobs, M., Dasgupta, D., and Lodge, J. P. (2003). “The value ofintraoperative ultrasound during hepatic resection compared with improvedpreoperative magnetic resonance imaging.” In: Eur J Ultrasound, 16, pp. 211–216(cited on p. 70).
Cordes, J., Dornheim, J., and Preim, B. (2009). “Scenario-Based Design of SurgicalTraining and Planning Systems.” In: Journal of i-com (Zeitschrift fur interaktiveund kooperative Medien), 8(1), pp. 5–12 (cited on p. 126).
Couinaud, C. (1954). “Lobes et segments hepatiques.” In: La Presse Medicale, 62(33),pp. 709–712 (cited on pp. 6, 10, 19).
Cox, J. and Kirkpatrick, R. C. (1896). “The new photography, with report of a casein which a bullet was photographed in the leg.” In: Montreal Med, 24, pp. 661–665(cited on p. 26).
Demedts, D. (2010). “Bewertung von Resektionvorschlagen fur die Leberchirurgie.”MA thesis. Institute of Mathematics and Image Computing, University of Lubeck,Germany (cited on pp. 88, 92).
Demedts, D., Schenk, A., Hansen, C., and Peitgen, H.-O. (2010). “Evaluation ofResection Proposals for Liver Surgery Planning.” In: Proc. of the 9th Annual
169

Bibliography
Meeting of the German Society of Computer- and Robot-Assisted Surgery, pp. 13–16 (cited on pp. 12, 23, 24, 145).
Edworthy, J., Loxley, S., and Dennis, I. (1991). “Improving auditory warning design:relationship between warning sound parameters and perceived urgency.” In: HumFactors, 33, pp. 205–231 (cited on p. 134).
Ellsmere, J., Kane, R., Grinbaum, R., Edwards, M., Schneider, B., and Jones, D.(2007). “Intraoperative ultrasonography during planned liver resections: why arewe still performing it?” In: Surg Endosc. 34(4), pp. 353–358 (cited on pp. 2, 70).
Elmqvist, N., Assarsson, U., and Tsigas, P. (2007). “Employing dynamic transparencyfor 3D occlusion management: design issues and evaluation.” In: Proc. of the 11thInternational Conference on Human-Computer Interaction. Springer, pp. 532–545(cited on p. 116).
Endo, I., Shimada, H., Takeda, K., Fujii, Y., Yoshida, K., Morioka, D., Sadatoshi, S.,Togo, S., Bourquain, H., and Peitgen, H. O. (2007). “Successful duct-to-ductbiliary reconstruction after right hemihepatectomy. Operative planning usingvirtual 3D reconstructed images.” In: J. Gastrointest. Surg. 11, pp. 666–670(cited on p. 43).
Ericsson, K. A. and Simon, H. A. (1993). Protocol analysis: Verbal Reports as Data.The MIT Press (cited on p. 122).
Fasel, J. H., Selle, D., Evertsz, C. J., Terrier, F., Peitgen, H.-O., and Gailloud, P.(1998). “Segmental anatomy of the liver: poor correlation with CT.” In: Radiology,206(1), pp. 151–6 (cited on pp. 6, 19).
Ferlay, J., Shin, H.-R., Bray, F., Forman, D., Mathers, C., and Parkin, D. M. (2010).“Estimates of worldwide burden of cancer in 2008: GLOBOCAN 2008.” In: Int JCancer (cited on p. 7).
Feuerstein, M., Mussack, T., Heining, S. M., and Navab, N. (2008). “Intraoperativelaparoscope augmentation for port placement and resection planning in minimallyinvasive liver resection.” In: IEEE Transactions on Medical Imaging, 27(3),pp. 355–369 (cited on pp. 35, 71, 117).
Feuerstein, M., Reichl, T., Vogel, J., Traub, J., and Navab, N. (2009). “Magneto-optical tracking of flexible laparoscopic ultrasound: model-based online detectionand correction of magnetic tracking errors.” In: IEEE Trans Med Imaging, 28,pp. 951–967 (cited on p. 29).
Fischer, J., Bartz, D., and Straßer, W. (2005). “Stylized Augmented Reality forImproved Immersion.” In: Proc. of IEEE Virtual Reality, pp. 195–202 (cited onpp. 71, 116, 126).
Fischer, J., Huhle, B., and Schilling, A. (2007). “Using Time-of-Flight Range Data forOcclusion Handling in Augmented Reality.” In: Proc. of Eurographics Symposiumon Virtual Environments (EGVE), pp. 109–116 (cited on p. 116).
Fischer, L., Cardenas, C., Thorn, M., Benner, A., Grenacher, L., Vetter, M., Lehnert,T., Klar, E., Meinzer, H.-P., and Lamade, W. (2002). “Limits of Couinaudsliver segment classification: a quantitative computer-based three-dimensionalanalysis.” In: J Comput Assist Tomogr, 26(6), pp. 962–7 (cited on p. 6).
170

Bibliography
Freudenberg, B. (2003). “Real-Time Stroke-Based Halftoning.” PhD thesis. Schoolof Computer Science, University of Magdeburg, Germany (cited on p. 101).
Friman, O., Hindennach, M., Kuhnel, C., and Peitgen, H. O. (2010). “Multiplehypothesis template tracking of small 3D vessel structures.” In: Med Image Anal,14, pp. 160–171 (cited on p. 18).
Gavaghan, K. A., Peterhans, M., Oliveira-Santos, T., and Weber, S. (2011). “Aportable image overlay projection device for computer-aided open liver surgery.”In: IEEE Trans Biomed Eng, 58, pp. 1855–1864 (cited on pp. 35, 117).
Gloger, O., Kuhn, J., Stanski, A., Volzke, H., and Puls, R. (2010). “A fully automaticthree-step liver segmentation method on LDA-based probability maps for multiplecontrast MR images.” In: Magn Reson Imaging, 28, pp. 882–897 (cited on p. 16).
Glossop, N. D. (2009). “Advantages of optical compared with electromagnetic track-ing.” In: J Bone Joint Surg Am, 91(Supplement 1), pp. 23–28 (cited on p. 29).
Glossop, N. (2003). “Laser projection augmented reality system for computer-assistedsurgery.” In: International Congress Series, 1256, pp. 65–71 (cited on p. 117).
Graaf, W. de, Lienden, K. P. van, Dinant, S., Roelofs, J. J., Busch, O. R., Gouma, D.J., Bennink, R. J., and Gulik, T. M. van (2010). “Assessment of future remnantliver function using hepatobiliary scintigraphy in patients undergoing major liverresection.” In: J. Gastrointest. Surg. 14, pp. 369–378 (cited on pp. 20, 62).
Grady, L. and Funka-Lea, G. (2006). “An energy minimization approach to the datadriven editing of presegmented images/volumes.” In: Proc. of Medical ImageComputing and Computer-Assisted Intervention (MICCAI), 9, pp. 888–895 (citedon p. 17).
Grundmann, R. T., Hermanek, P., Merkel, S., Germer, C. T., Grundmann, R. T.,Hauss, J., Henne-Bruns, D., et al. (2008). “Diagnosis and treatment of colorectalliver metastases - workflow.” In: Zentralbl Chir, 133, pp. 267–284 (cited on p. 11).
Hahn, H.K., Preim, B., Selle, D., and Peitgen, H.-O. (2001). “Visualization andInteraction Techniques for the Exploration of Vascular Structures.” In: IEEEVisualization, pp. 395–402 (cited on p. 18).
Haker, S., Angenent, S., Tannenbaum, A., and Kikinis, R. (2000). “Nondistortingflattening maps and the 3-D visualization of colon CT images.” In: IEEE TransMed Imaging, 19, pp. 665–670 (cited on p. 97).
Hammerstingl, R., Huppertz, A., Breuer, J., Balzer, T., Blakeborough, A., Carter, R.,Fuste, L. C., et al. (2008). “Diagnostic efficacy of gadoxetic acid (Primovist)-enhanced MRI and spiral CT for a therapeutic strategy: comparison with intra-operative and histopathologic findings in focal liver lesions.” In: Eur Radiol, 18,pp. 457–467 (cited on p. 15).
Hanna, G. B., Shimi, S. M., and Cuschieri, A. (1998). “Task performance in endoscopicsurgery is influenced by location of the image display.” In: Ann. Surg. 227, pp. 481–484 (cited on p. 34).
Hansen, C. (2006). “Verwendung von Textur in der Gefaßvisualisierung.” MA thesis.School of Computer Science, University of Magdeburg, Germany (cited on p. 117).
Hansen, C., Schlichting, S., Markert, M., Hindennach, M., Zidowitz, S., and Peitgen,H.-O. (2007a). “Intraoperative Adaptation of Preoperative Risk Analyses for
171

Bibliography
Oncologic Liver Surgery using tracked 2D ultrasound.” In: Proc. of the 6thAnnual Meeting of the German Society of Computer- and Robot-Assisted Surgery,pp. 155–158 (cited on p. 94).
Hansen, C., Koehn, A., Ritter, F., Zidowitz, S., and Peitgen, H.-O. (2007b). “Si-multaneous Visualization of Preoperative Planning Models and IntraoperativeUltrasound for Liver Surgery.” In: Proc. of Eurographics (Short Papers andMedical Prize Awards), pp. 117–120.
Hansen, C., Wieferich, J., Ritter, F., Rieder, C., and Peitgen, H.-O. (2008a). “Il-lustrative Visualization of 3D Planning Models for Augmented Reality in LiverSurgery.” In: Proc. of the 7th Annual Meeting of the German Society of Computer-and Robot-Assisted Surgery, pp. 1–4 (cited on p. 127).
Hansen, C., Zidowitz, S., Schenk, A., Oldhafer, K., Lang, H., and Peitgen, H.-O.(2008b). “Intraoperative Adaptation and Visualization of Preoperative RiskAnalyses for Oncologic Liver Surgery.” In: Proc. of SPIE Medical Imaging.Vol. 6918, pp. 691809–1–10 (cited on p. 94).
Hansen, C., Schlichting, S., Zidowitz, S., Kleemann, M., and Peitgen, H.-O. (2008c).“Intraoperative Adaptation of Planning Data for Oncologic Liver Surgery.” In:Proc. of MICCAI Workshop on Image Guidance and Computer Assistance forSoft-Tissue Interventions, pp. 36–45 (cited on p. 94).
Hansen, C., Kohn, A., Schlichting, S., Weiler, F., Konrad, O., Zidowitz, S., andPeitgen, H.-O. (2008d). “Intraoperative Modification of Resection Plans for LiverSurgery.” In: Int J Comput Assist Radiol Surg, 2(3-4), pp. 291–297 (cited onp. 94).
Hansen, C., Zidowitz, S., Hindennach, M., Schenk, A., Hahn, H., and Peitgen, H.-O.(2009a). “Interactive Determination of Robust Safety Margins for Oncologic LiverSurgery.” In: Proc. of the 23rd International Symposium on Computer AssistedRadiology and Surgery (CARS), 4(Supplement 1), p. 94 (cited on p. 67).
Hansen, C., Zidowitz, S., Hindennach, M., Schenk, A., Hahn, H., and Peitgen, H.-O.(2009b). “Interactive Determination of Robust Safety Margins for OncologicLiver Surgery.” In: Int J Comput Assist Radiol Surg, 4(5), pp. 469–474 (cited onp. 67).
Hansen, C., Wieferich, J., Ritter, F., Rieder, C., and Peitgen, H.-O. (2010a). “Il-lustrative Visualization of 3D Planning Models for Augmented Reality in LiverSurgery.” In: Int J Comput Assist Radiol Surg, 5(2), pp. 133–141 (cited onp. 127).
Hansen, C., Zidowitz, S., Schenk, A., Oldhafer, K., Lang, H., and Peitgen, H.-O.(2010b). “Risk maps for navigation in liver surgery.” In: Proc. of SPIE MedicalImaging. Vol. 7625, pp. 762528–1–8 (cited on p. 112).
Hansen, C., Lindow, B., Zidowitz, S., Schenk, A., and Peitgen, H.-O. (2010c). “To-wards Automatic Generation of Resection Surfaces for Liver Surgery Planning.”In: Proc. of the 24th International Symposium on Computer Assisted Radiologyand Surgery (CARS), 5(Supplement 1), pp. 119–120 (cited on p. 94).
172
Bibliography
Hansen, C., Black, D., Lange, C., Rieber, F., Lamade, W., Donati, M., Oldhafer,K. J., and Hahn, H. K. (2012). “Auditory Support for Resection Guidance inNavigated Liver Surgery.” In: Int J Med Robot, in print (cited on pp. 134, 142).
Hata, S., Imamura, H., Aoki, T., Hashimoto, T., Akahane, M., Hasegawa, K., Bekku,Y., Sugawara, Y., Makuuchi, M., and Kokudo, N. (2011). “Value of VisualInspection, Bimanual Palpation, and Intraoperative Ultrasonography DuringHepatic Resection for Liver Metastases of Colorectal Carcinoma.” In: World JSurg (cited on pp. 15, 70, 74).
Heckel, F., Moltz, J. H., Bornemann, L., Dicken, V., Bauknecht, H.-C., Fabel, M.,Hittinger, M., et al. (2009). “3D contour based local manual correction of tumorsegmentations in CT scans.” In: SPIE Medical Imaging. Vol. 7259. 1. SPIE,pp. 72593L–1–9 (cited on p. 17).
Heckel, F., Konrad, O., Hahn, H. K., and Peitgen, H.-O. (2011). “Interactive 3D Med-ical Image Segmentation with Energy-Minimizing Implicit Functions.” In: Com-puter & Graphics: Special issue on Visual Computing for Biology and Medicine,35(2), pp. 275–287 (cited on p. 17).
Heimann, T., Wolf, I., and Meinzer, H. P. (2006). “Active shape models for a fullyautomated 3D segmentation of the liver–an evaluation on clinical data.” In: MedImage Comput Comput Assist Interv, 9, pp. 41–48 (cited on p. 16).
Heimann, T., Ginneken, B. van, Styner, M. A., Arzhaeva, Y., Aurich, V., Bauer,C., Beck, A., et al. (2009). “Comparison and evaluation of methods for liversegmentation from CT datasets.” In: IEEE Trans Med Imaging, 28, pp. 1251–1265(cited on p. 16).
Heizmann, O., Zidowitz, S., Bourquain, H., Potthast, S., Peitgen, H. O., Oertli, D.,and Kettelhack, C. (2010). “Assessment of intraoperative liver deformation duringhepatic resection: prospective clinical study.” In: World J Surg, 34, pp. 1887–1893(cited on p. 30).
Hildebrand, P., Schlichting, S., Martens, V., Besirevic, A., Kleemann, M., Roblick,U., Mirow, L., Burk, C., Schweikard, A., and Bruch, H. (2007). “Prototypeof an intraoperative navigation- and documentation system for laparoscopicradiofrequency ablation: First Experiences.” In: European Journal of SurgicalOncol. 34(4), pp. 418–421 (cited on pp. 25, 33, 72, 73, 83).
Hildebrand, P., Schlichting, S., Martens, V., Besirevic, A., Kleemann, M., Roblick,U., Mirow, L., Burk, C., Schweikard, A., and Bruch, H.-P. (2008). “Prototypeof an intraoperative navigation and documentation system for laparoscopicradiofrequency ablation: first experiences.” In: European Journal of SurgicalOncology, 34(4), pp. 418–421 (cited on pp. 82, 87).
Hiller, S. (2008). “Konzeption und Implementierung eines Verfahrens zur Erstellungvon Resektionsebenen fur die Leberchirurgieplanung.” MA thesis. School ofComputer Science, University of Magdeburg, Germany (cited on p. 23).
Hong, W., Gu, X., Qiu, F., Jin, M., and Kaufman, A. (2006). “Conformal virtualcolon flattening.” In: Proc. of ACM symposium on Solid and physical modeling.ACM, pp. 85–93 (cited on p. 97).
173

Bibliography
Huang, X., Wang, W., Wang, X., Liu, R., Ke, S., and Wu, Z. (2009). “A HybridImage Registration for Different Phases of Contrast Enhanced Liver CT Data.”In: Computer Science and Information Engineering, 6, pp. 239–243 (cited onp. 15).
Hurdal, M. K. and Stephenson, K. (2009). “Discrete conformal methods for corticalbrain flattening.” In: Neuroimage, 45, pp. 86–98 (cited on p. 97).
IEC, 60601-1-8 (2006). Collateral Standard: General Requirements, Tests and Guid-ance for Alarm Systems in Medical Electrical Equipment and Medical ElectricalSystems. IEC, Geneva, Switzerland (cited on p. 140).
IHPBA, Brisbane (2000). “Terminology of Liver Anatomy and Resections.” In: TheOfficial Journal of the International Hepato Pancreato Biliary Association, 2,pp. 333–339 (cited on p. 8).
Interrante, V., Fuchs, H., and Pizer, S. M. (1997). “Conveying the 3d shape ofsmoothly curving transparent surfaces via texture.” In: IEEE Transactions onVisualization and Computer Graphics, 3, pp. 98–117 (cited on p. 114).
Isenberg, T., Halper, N., and Strothotte, T. (2002). “Stylizing Silhouettes at Interac-tive Rates: From Silhouette Edges to Silhouette Strokes.” In: Computer GraphicsForum, 21(3), pp. 249–258 (cited on p. 118).
Jolly, M.P. and Grady, L. (2008). “3D general lesion segmentation in CT.” In: Proc.of 5th IEEE International Symposium on Biomedical Imaging: From Nano toMacro, pp. 796–799 (cited on p. 17).
Joshi, A., Scheinost, D., Vives, K. P., Spencer, D. D., Staib, L. H., and Papademetris,X. (2008). “Novel interaction techniques for neurosurgical planning and stereo-tactic navigation.” In: IEEE Trans Vis Comput Graph, 14, pp. 1587–1594 (citedon p. 39).
Jovanov, E., K., Wegner, V., Radivojevic, D., Starcevic, S., Quinn M., and B., KarronD. (1999). “Tactical audio and acoustic rendering in biomedical applications.” In:IEEE Transactions on Information Technology in Biomedicine, 3(2), pp. 109–118(cited on p. 130).
Kainmueller, D., Lange, T., and Lamecker, H. (2007). “Shape constrained automaticsegmentation of the liver based on a heuristic intensity model.” In: Proc. ofMICCAI Workshop 3D Segmentation in the Clinic: A Grand Challenge, pp. 109–116 (cited on p. 16).
Kalkofen, Denis, Mendez, Erick, and Schmalstieg, Dieter (2007). “Interactive Focusand Context Visualization for Augmented Reality.” In: Proc. of the 6th IEEEand ACM International Symposium on Mixed and Augmented Reality. IEEEComputer Society, pp. 1–10 (cited on pp. 116, 127).
Kang, Y., Engelke, K., and Kalender, W. A. (2004). “Interactive 3D editing tools forimage segmentation.” In: Med Image Anal, 8, pp. 35–46 (cited on p. 17).
Karaliotas, C., E., Broelsch C., and A., Habib N. (2007). Liver and Biliary TractSurgery: Embryological Anatomy to 3D-Imaging and Transplant Innovations.Springer (cited on p. 10).
174

Bibliography
Kersten-Oertel, M., Jannin, P., and Collins, D. L. (2011). “DVV: A Taxonomy forMixed Reality Visualization in Image Guided Surgery.” In: IEEE Trans VisComput Graph, in press (cited on pp. 35, 114).
Khan, M. F., Dogan, S., Maataoui, A., Wesarg, S., Gurung, J., Ackermann, H.,Schiemann, M., Wimmer-Greinecker, G., and Vogl, T. J. (2006). “Navigation-based needle puncture of a cadaver using a hybrid tracking navigational system.”In: Invest Radiol, 41, pp. 713–720 (cited on p. 29).
Kirbas, Cemil and Quek, Francis (2004). “A review of vessel extraction techniquesand algorithms.” In: ACM Comput. Surv. 36 (2), pp. 81–121 (cited on p. 18).
Kleemann, M., Hildebrand, P., Mirow, L., Roblick, U., Burk, C. G., and Bruch, H.-P.(2005). “Navigation in der Vizeralchirurgie.” In: Chir Gastroenterol, 21(Supple-ment 2), pp. 1–7 (cited on p. 28).
Kleinman, R., Goulet, O.-J., Mieli-Vergani, G., Sanderson, I., Sherman, P., andShneider, B. (2008). Walker’s Pediatric Gastrointestinal Disease. 5th ed. Vol. 2.PMPH, USA (cited on p. 6).
Kocev, B., Ojdanic, D., and Peitgen, H.-O. (2011). “An Approach for Projector-based Surgeon-Computer Interaction using Tracked Instruments.” In: Proc. ofGI Workshop: Emerging Technologies for Medical Diagnosis and Therapy, inpress (cited on p. 126).
Konrad-Verse, O., Preim, B., and Littmann, A. (2004). “Virtual Resection with aDeformable Cutting Plane.” In: Proc. of Simulation und Visualisierung, pp. 203–214 (cited on pp. 22, 24, 88, 90, 132).
Kopke, L. F. F., Bastos, J. C. F., Andrade Filho, J. de S., and Gouvea, P. S.(2005). “Safety margin: an old and relative concept.” In: Anais Brasileiros deDermatologia, 80(3) (cited on p. 38).
Krempien, R., Hoppe, H., Kahrs, L., Daeuber, S., Schorr, O., Eggers, G., Bischof, M.,Munter, M., Debus, J., and Harms, W. (2008). “Projector-Based AugmentedReality for Intuitive Intraoperative Guidance in Image-Guided 3D InterstitialBrachytherapy.” In: International Journal of Radiation Oncology*Biology*Physics,70(3), pp. 944–952 (cited on pp. 35, 117).
Kroger, T., Altrogge, I., Preusser, T., Pereira, P. L., Schmidt, D., Weihusen, A., andPeitgen, H. O. (2006). “Numerical simulation of radio frequency ablation withstate dependent material parameters in three space dimensions.” In: Proc. ofMedical Image Computing and Computer-Assisted Intervention (MICCAI), 9,pp. 380–388 (cited on p. 39).
Kroger, T., Patz, T., Altrogge, I., Schenk, A., Lehmann, K. S., Frericks, B. B., Ritz,J. P., Peitgen, H. O., and Preusser, T. (2010). “Fast Estimation of the VascularCooling in RFA Based on Numerical Simulation.” In: Open Biomed Eng J, 4,pp. 16–26 (cited on p. 9).
Kruijff, E., Swan II, J. E., and Feiner, S. (2010). “Perceptual Issues in AugmentedReality Revisited.” In: Proc. of IEEE International Symposium on Mixed andAugmented Reality. IEEE Computer Society, pp. 3–12 (cited on pp. 114, 126).
175

Bibliography
Kunzli, B. M., Abitabile, P., and Maurer, C. A. (2011). “Radiofrequency ablation ofliver tumors: Actual limitations and potential solutions in the future.” In: WorldJ Hepatol, 3, pp. 8–14 (cited on p. 9).
Lamade, W., Glombitza, G., Fischer, L., Chiu, P., Cardenas, C. E., Thorn, M.,Meinzer, H. P., et al. (2000). “The impact of 3-dimensional reconstructions onoperation planning in liver surgery.” In: Arch Surg, 135, pp. 1256–1261 (cited onpp. 48, 60).
Lamata, P., Jalote-Parmar, A., Lamata, F., and Declerck, J. (2008). “The ResectionMap, a proposal for intraoperative hepatectomy guidance.” In: Int J ComputAssist Radiol Surg, 3(3-4), pp. 299–306 (cited on pp. 33, 99, 111).
Lamata, P., Lamata, F., Sojar, V., Makowski, P., Massoptier, L., Casciaro, S., Ali, W.,et al. (2010). “Use of the Resection Map system as guidance during hepatectomy.”In: Surgical Endoscopy, 24(9), 2327–2337 (cited on p. 34).
Lang, H. (2007). “Technik der Leberresektion: Teil II. Operationsdurchfuhrung.” In:Der Chirurg, 78, 849–866(18) (cited on p. 88).
Lang, H., Radtke, A., Hindennach, M., Schroeder, T., Fruhauf, N. R., Malago, M.,Bourquain, H., Peitgen, H.-O., Oldhafer, K. J., and Broelsch, C. E. (2005). “Im-pact of virtual tumor resection and computer-assisted risk analysis on operationplanning and intraoperative strategy in major hepatic resection.” In: Archives ofSurgery, 140(7), pp. 629–38 (cited on pp. 2, 8, 21, 24, 43, 48, 60, 90).
Lang, H. and Schenk, A. (2010). “Planung von Leberresektionen.” In: Computeras-sistierte Chirurgie. Urban & Fischer Verlag, pp. 515–524 (cited on pp. 2, 14,38).
Lange, T., Wenckebach, T., Lamecker, H., Seebas, M., Hunerbein, M., Eulenstein, S.,and M., Schlag P. (2005). “Registration of different phases of contrast-enhancedCT/MRI data for computer-assisted liver surgery planning: Evaluation of state-of-the-art methods.” In: Int. J. Medical Robotics and Computer Assisted Surgery.Vol. 1 (3), pp. 6 –20 (cited on p. 15).
Lei, P., Moeslein, F., Wood, B. J., and Shekhar, R. (2011). “Real-time tracking ofliver motion and deformation using a flexible needle.” In: Int J Comput AssistRadiol Surg, 6, pp. 435–446 (cited on p. 32).
Lerotic, M., Chung, A. J., Mylonas, G., and Yang, G.-Z. (2007). “Pq-space based non-photorealistic rendering for augmented reality.” In: Medical Image Computingand Computer-Assisted Intervention (MICCAI), 10(Pt 2), pp. 102–109 (cited onp. 116).
Lesage, D., Angelini, E. D., Bloch, I., and Funka-Lea, G. (2009). “A review of 3Dvessel lumen segmentation techniques: models, features and extraction schemes.”In: Med Image Anal, 13, pp. 819–845 (cited on p. 18).
Li, K. and Jolly, M. (2008). “Simultaneous detection of multiple elastic surfaces withapplication to tumor segmentation in CT images.” In: Proc. of SPIE MedicalImaging. Vol. 6914. 2, 69143S 1–11 (cited on p. 17).
Lindow, B. (2009). “Automatic Generation of Resection Surfaces for Liver SurgeryPlanning.” MA thesis. School of Computer Science, University of Rostock, Ger-many (cited on p. 94).
176

Bibliography
Lohe, T., Kroger, T., Zidowitz, S., Peitgen, H.-O., and Jiang, X. (2008). “HierarchicalMatching of Anatomical Trees for Medical Image Registration.” In: ICMB,pp. 224–231 (cited on p. 31).
Lordan, J. T. and Karanjia, N. D. (2010). “’Close shave’ in liver resection forcolorectal liver metastases.” In: European Journal of Surgical Oncology, 36(1),pp. 47–51 (cited on p. 38).
Lu, R., Marziliano, P., and Hua Thng, C. (2005). “Liver tumor volume estimationby semi-automatic segmentation method.” In: Proc. of IEEE Eng Med Biol Soc,3, pp. 3296–3299 (cited on p. 17).
Maier-Hein, L., Schmidt, M., Franz, A. M., Santos, T. R. dos, Seitel, A., Jahne, B.,Fitzpatrick, J. M., and Meinzer, H. P. (2010). “Accounting for anisotropic noisein fine registration of time-of-flight range data with high-resolution surface data.”In: Med Image Comput Comput Assist Interv, 13, pp. 251–258 (cited on p. 31).
Manzey, D., Rottger, S., Bahner-Heyne, J. E., Schulze-Kissing, D., Dietz, A., Meix-ensberger, J., and Strauss, G. (2009). “Image-guided navigation: the surgeon’sperspective on performance consequences and human factors issues.” In: Int.J. Medical Robotics and Computer Assisted Surgery, 5, pp. 297–308 (cited onp. 130).
Marescaux, J., Rubino, F., Arenas, M., Mutter, D., and Soler, L. (2004). “Augmented-Reality-Assisted Laparoscopic Adrenalectomy.” In: JAMA: The Journal of theAmerican Medical Association, 292(18), pp. 2214–2215 (cited on pp. 35, 117).
Markert, M., Koschany, A., and Lueth, T. (2010). “Tracking of the liver for navigationin open surgery.” In: Int J Comput Assist Radiol Surg, 5, pp. 229–235 (cited onp. 32).
Massoptier, L. and Casciaro, S. (2008). “A new fully automatic and robust algorithmfor fast segmentation of liver tissue and tumors from CT scans.” In: EuropeanRadiology, 18(8), pp. 1658–1665 (cited on p. 17).
Maurel, P. (2010). Hepatocytes: Methods and Protocols. Methods in Molecular Biology.Springer Verlag (cited on p. 7).
Mazzoni, G., Napoli, A., Mandetta, S., Miccini, M., Cassini, D., Gregori, M., Colace,L., and Tocchi, A. (2008). “Intra-operative ultrasound for detection of livermetastases from colorectal cancer.” In: Liver Int. 28, pp. 88–94 (cited on p. 70).
McCartney, J. (2002). “Rethinking the Computer Music Language: SuperCollider.”In: Computer Music Journal, 26(4), pp. 61–68 (cited on p. 132).
Meinzer, H. P., Thorn, M., and Cardenas, C. E. (2002). “Computerized planningof liver surgery—an overview.” In: Computers & Graphics, 26(4), pp. 569 –576(cited on p. 70).
Mercier, L., Lang? T., Lindseth, F., and Collins, D. L. (2005). “A review of calibrationtechniques for freehand 3-D ultrasound systems.” In: Ultrasound Med Biol, 31,pp. 449–471 (cited on p. 30).
Metzen, J. H., Kroger, T., Schenk, A., Zidowitz, S., H.-O., Peitgen, and Jiang, X.(2007). “Matching of Tree Structures for Registration of Medical Images.” In:vol. 4538. Lecture Notes in Computer Science. Springer, pp. 13–24 (cited onp. 31).
177
Bibliography
Metzen, J. H., Kroger, T., Schenk, A., Zidowitz, S., Peitgen, H.-O., and Jiang,X. (2009). “Matching of anatomical tree structures for registration of medicalimages.” In: Image Vision Comput. 27 (7), pp. 923–933 (cited on p. 31).
Muhler, K., Hansen, C., Neugebauer, M., and Preim, B. (2008). “AutomatischeKamerapositionierung fur intra-operative Visualisierungen in der onkologischenLeberchirurgie.” In: Proc. of Bildverarbeitung fur die Medizin. Informatik aktuell,pp. 143–147.
Militzer, A., Hager, T., Jager, F., Tietjen, C., and Hornegger, J. (2010). “AutomaticDetection and Segmentation of Focal Liver Lesions in Contrast Enhanced CTImages.” In: Proc. of the 20th International Conference on Pattern Recognition.IEEE Computer Society, pp. 2524–2527 (cited on p. 17).
Moltz, J. H., Bornemann, L., Kuhnigk, J. M., Dicken, V., Peitgen, E., Meier, S.,Bolte, H., et al. (2009). “Advanced Segmentation Techniques for Lung Nodules,Liver Metastases, and Enlarged Lymph Nodes in CT Scans.” In: IEEE Journalof Selected Topics in Signal Processing, 3(1), pp. 122–134 (cited on p. 17).
Motosugi, U., Ichikawa, T., Morisaka, H., Sou, H., Muhi, A., Kimura, K., Sano, K.,and Araki, T. (2011). “Detection of pancreatic carcinoma and liver metastaseswith gadoxetic acid-enhanced MR imaging: comparison with contrast-enhancedmulti-detector row CT.” In: Radiology, 260, pp. 446–453 (cited on p. 15).
Muratore, A., Ribero, D., Zimmitti, G., Mellano, A., Langella, S., and Capussotti, L.(2010). “Resection margin and recurrence-free survival after liver resection ofcolorectal metastases.” In: Annals of Surgical Oncology, 17(5), pp. 1324–1329(cited on pp. 38, 65).
Nakamoto, M., Nakada, K., Sato, Y., Konishi, K., Hashizume, M., and Tamura, S.(2008). “Intraoperative magnetic tracker calibration using a magneto-optic hybridtracker for 3-D ultrasound-based navigation in laparoscopic surgery.” In: IEEETrans Med Imaging, 27, pp. 255–270 (cited on p. 29).
Nathan, H., Bridges, J. F., Schulick, R. D., Cameron, A. M., Hirose, K., Edil, B.H., Wolfgang, C. L., Segev, D. L., Choti, M. A., and Pawlik, T. M. (2011).“Understanding Surgical Decision Making in Early Hepatocellular Carcinoma.”In: J Clin Oncol, in print (cited on p. 9).
Navab, N., Traub, J., Sielhorst, T., Feuerstein, M., and Bichlmeier, C. (2007a).“Action- and workflow-driven augmented reality for computer-aided medicalprocedures.” In: IEEE Computer Graphics and Applications, 27(5), pp. 10–14(cited on p. 126).
Navab, N., Feuerstein, M., and Bichlmeier, C. (2007b). “Laparoscopic Virtual MirrorNew Interaction Paradigm for Monitor Based Augmented Reality.” In: VirtualReality Conference, IEEE, pp. 43–50 (cited on p. 116).
Navkar, N. V., Tsekos, N. V., Stafford, J. R., Weinberg, J. S., and Deng, Z. (2010).“Visualization and planning of neurosurgical interventions with straight access.”In: Proc. of the First International Conference on Information Processing inComputer-Assisted Interventions. Springer-Verlag, pp. 1–11 (cited on p. 98).
Neugebauer, M., Gasteiger, R., Beuing, O., Diehl, V., Skalej, M., and Preim, B.(2009). “Map Displays for the Analysis of Scalar Data on Cerebral Aneurysm
178

Bibliography
Surfaces.” In: Computer Graphics Forum (EuroVis). Vol. 28 (3), pp. 895–902(cited on p. 98).
Neumann, U. P., Seehofer, D., and Neuhaus, P. (2010). “The Surgical Treatment ofHepatic Metastases in Colorectal Carcinoma.” In: Deutsches Arzteblatt Interna-tional, 107(19), pp. 335–342 (cited on pp. 7, 8, 11).
Nicolau, S. A., Pennec, X., Soler, L., Buy, X., Gangi, A., Ayache, N., and Marescaux,J. (2009). “An augmented reality system for liver thermal ablation: Design andevaluation on clinical cases.” In: Medical Image Analysis, 13(3), pp. 494–506(cited on pp. 34, 35).
Nintendo (Jan. 2011). Internet source: www.nintendo.com/wii/what/controllers,visited: 2011, October 15 (cited on p. 78).
Nowatschin, S., Markert, M., Weber, S., and Luth, T. C. (2007). “A system foranalyzing intraoperative B-Mode ultrasound scans of the liver.” In: Proc. IEEEEng Med Biol Soc, pp. 1346–1349 (cited on pp. 33, 71, 105).
Oeltze, S. and Preim, B. (2005). “Visualization of vasculature with convolutionsurfaces: method, validation and evaluation.” In: IEEE Trans Med Imaging, 24,pp. 540–548 (cited on p. 18).
Okada, M., Nishio, W., Sakamoto, T., Uchino, K., Yuki, T., Nakagawa, A., andTsubota, N. (2005). “Effect of tumor size on prognosis in patients with non-smallcell lung cancer: the role of segmentectomy as a type of lesser resection.” In: J.Thorac. Cardiovasc. Surg. 129, pp. 87–93 (cited on p. 39).
Olabarriaga, S. D. and Smeulders, A. W. (2001). “Interaction in the segmentation ofmedical images: a survey.” In: Med Image Anal, 5, pp. 127–142 (cited on p. 17).
Oldhafer, K. J., Preim, B., Dorge, C., Peitgen, H. O., and Broelsch, C. E. (2002). “[Ac-ceptance of computer-assisted surgery planning in visceral (abdominal) surgery].”In: Zentralbl Chir, 127, pp. 128–133 (cited on p. 14).
Oldhafer, K. J., Stavrou, G. A., Prause, G., Peitgen, H.-O., Lueth, T. C., and Weber,S. (2009). “How to operate a liver tumor you cannot see.” In: Langenbeck’sArchives of Surgery, 394(3), pp. 489–494 (cited on pp. 28, 130).
Ooijen, P. M. A. van, Wolf, R., Schenk, A., Rouw, D. B., Slooff, M., Peitgen, H.-O., andOudkerk, M. (2003). “Recent Developments in Organ-Selective Reconstructionand Analysis of Multiphase Liver CT.” In: Imaging Decisions MRI, 7(1), pp. 37–43 (cited on p. 38).
Papenberg, N., Lange, T., Modersitzki, J., Schlag, P. M., and Fischer, B. (2008).“Image registration for CT and intraoperative ultrasound data of the liver.” In:Proc. of SPIE Medical Imaging. Vol. 6918, pp. 691808–1–8 (cited on pp. 31, 73,82).
Pawlik, T. M., Scoggins, C. R., Zorzi, D., Abdalla, E. K., Andres, A., Eng, C.,Curley, S. A., et al. (2005). “Effect of surgical margin status on survival and siteof recurrence after hepatic resection for colorectal metastases.” In: Ann. Surg.241, pp. 715–722 (cited on pp. 38, 65).
Pawlik, T. M., Schulick, R. D., and Choti, M. A. (2008). “Expanding criteria forresectability of colorectal liver metastases.” In: The Oncologist, 13(1), pp. 51–64(cited on pp. 8, 38).
179
Bibliography
Penne, J., Soutschek, S., Sturmer, M., Schaller, C., Placht, S., Kornhuber, J., andHornegger, J. (2009). “Touchless 3D Gesture Interaction for the OperationRoom.” In: Journal of i-com (Zeitschrift fur interaktive und kooperative Medien),8(1), pp. 19–23 (cited on p. 71).
Penney, G. P., Blackall, J. M., Hamady, M. S., Sabharwal, T., Adam, A., and Hawkes,D. J. (2004). “Registration of freehand 3D ultrasound and magnetic resonanceliver images.” In: Med Image Anal, 8, pp. 81–91 (cited on p. 31).
Pescia, D., Paragios, N., and Chemouny, S. (2008). “Automatic detection of livertumors.” In: ISBI, pp. 672–675 (cited on p. 17).
Peterhans, M., Vom Berg, A., Dagon, B., Inderbitzin, D., Baur, C., Candinas, D., andWeber, S. (2010). “A navigation system for open liver surgery: Design, workflowand first clinical applications.” In: Int. J. Medical Robotics and Computer AssistedSurgery, 7(1), pp. 7–16 (cited on pp. 25, 31, 33, 71, 87, 105, 132).
Preim, B., Bourqain, H., Selle, D., Peitgen, H.-O., and Oldhafer, K. (2002). “ResectionProposals for Oncologic Liver Surgery based on Vascular Territories.” In: Proc. ofthe 17th International Symposium on Computer Assisted Radiology and Surgery(CARS). Elsevier, pp. 353–358 (cited on pp. 12, 21–23, 40, 47, 48, 60, 88).
Preim, B. and Bartz, D. (2007). Visualization in Medicine. Theory, Algorithms, andApplications. Morgan Kaufmann (cited on pp. 19, 33).
Pulitano, C., Castillo, F., Aldrighetti, L., Bodingbauer, M., Parks, R. W., Ferla,G., Wigmore, S. J., and Garden, O. J. (2010). “What defines ’cure’ after liverresection for colorectal metastases? Results after 10 years of follow-up.” In: TheOfficial Journal of the International Hepato Pancreato Biliary Association, 12,pp. 244–249 (cited on p. 7).
Radtke, A., Nadalin, S., Sotiropoulos, G. C., Molmenti, E. P., Schroeder, T., Valentin-Gamazo, C., Lang, H., et al. (2007). “Computer-assisted operative planning inadult living donor liver transplantation: a new way to resolve the dilemma of themiddle hepatic vein.” In: World J Surg, 31, pp. 175–185 (cited on p. 21).
Reitinger, B., Bornik, A., Beichel, R., and Schmalstieg, D. (2006). “Liver surgeryplanning using virtual reality.” In: IEEE Computer Graphics and Applications,26(6), pp. 36–47 (cited on pp. 23, 70, 71).
Riechmann, M. (2006). “Visualisierungskonzept fur die Projektorbasierte ErweiterteRealitat in der Leberchirurgie.” MA thesis. Institute for Process Control andRobotics, University of Karlsruhe, Germany (cited on pp. 35, 114).
Riechmann, M., Kahrs, L. A., Ulmer, C., Raczkowsky, J., Lamade, W., and Worn,H. (2006). “Visualisierungskonzept fur die projektorbasierte Erweiterte Realitatin der Leberchirurgie.” In: Proc. of Gemeinsame Jahrestagung der Deutschen,Osterreichischen und Schweizerischen Gesellschaft fur Biomedizinische Technik,p. 209 (cited on p. 117).
Rieder, C., Ritter, F., Raspe, M., and Peitgen, H.-O (2008). “Interactive Visualizationof Multimodal Volume Data for Neurosurgical Tumor Treatment.” In: ComputerGraphics Forum (Special Issue on Eurographics Symposium on Visualization),27(3), pp. 1055–1062 (cited on p. 39).
180

Bibliography
Rieder, C., Schwier, M., Weihusen, A., Zidowitz, S., and Peitgen, H.-O. (2009).“Visualization of Risk Structures for Interactive Planning of Image Guided Ra-diofrequency Ablation of Liver Tumors.” In: Medical Imaging 2009: Visualization,Image-Guided Procedures, and Modeling. Vol. 7261. Proc. of the SPIE MedicalImaging, pp. 726134.1–726134.9 (cited on p. 39).
Rieder, C., Altrogge, I., Kroger, T., Zidowitz, S., and Preusser, T. (2010a). “In-teractive Approximation of the Ablation Zone incorporating Heatsink Effectsfor Radiofrequency Ablation.” In: Proc. of 9th Annual Meeting of the GermanSociety of Computer- and Robot-Assisted Surgery, pp. 9–12 (cited on p. 39).
Rieder, C., Weihusen, A., Schumann, C., Zidowitz, S., and Peitgen, H.-O. (2010b).“Visual Support for Interactive Post-Interventional Assessment of RadiofrequencyAblation Therapy.” In: Computer Graphics Forum (Special Issue on EurographicsSymposium on Visualization), 29(3), pp. 1093–1102 (cited on p. 98).
Rieder, C., Palmer, S., Link, F., and K., Hahn H. (2011). “A Shader Frameworkfor Rapid Prototyping of GPU-Based Volume Rendering.” In: Computer Graph-ics Forum (Special Issue on Eurographics Symposium on Visualization), 30(3),pp. 1031–1040 (cited on p. 43).
Ritter, F., Hindennach, M., Lamade, W., Oldhafer, K., and Peitgen, H.-O. (2005).“Intraoperative Adaptation of Preoperative Risk Analysis in Oncological LiverSurgery.” In: Proc. of the 4th Annual Meeting of the German Society of Computer-and Robot-Assisted Surgery (cited on p. 70).
Ritter, F., Hansen, C., Dicken, V., Konrad, O., Preim, B., and Peitgen, H.-O. (2006).“Real-time illustration of vascular structures.” In: IEEE Visualization, 12(5),pp. 877–884 (cited on pp. 114, 117, 119, 123).
Ritter, F., Hansen, C., Wilkens, K., Kohn, A., and Peitgen, HO (2009). “UserInterfaces for Direct Interaction with 3D Planning Data in the Operation Room.”In: Journal of i-com (Zeitschrift fur interaktive und kooperative Medien), 8(1),pp. 24–31 (cited on pp. 71, 94).
Ritter, F., Boskamp, T., Homeyer, A., Laue, H., Schwier, M., Link, F., and Peitgen,H. O. (2011). “Medical image analysis.” In: IEEE Pulse, 2, pp. 60–70 (cited onpp. 108, 132).
Rusko, L. and Bekes, G. (2011). “Liver segmentation for contrast-enhanced MRimages using partitioned probabilistic model.” In: Int J Comput Assist RadiolSurg, 6, pp. 13–20 (cited on p. 16).
Salloum, C. and Castaing, D. (2008). “Surgical margin status in hepatectomy forliver tumors.” In: Bulletin du Cancer, 95(12), pp. 1183–1191 (cited on pp. 38,65).
Samset, E., Schmalstieg, D., Vander Sloten, J., Freudenthal, A., Declerck, J., Casciaro,S., Rideng, Ø., and Gersak, B. (2008). “Augmented reality in surgical procedures.”In: Proc. of SPIE Medical Imaging. Vol. 6806, 68060K–1–12 (cited on pp. 34,35).
Sanderson, P. M., Watson, M. O., and Russell, W. J. (2005). “Advanced patientmonitoring displays: tools for continuous informing.” In: Anesth. Analg. 101,pp. 161–168 (cited on p. 130).
181

Bibliography
Scheele, J., Stangl, and Altendorf-Hofmann, A. (1990). “Hepatic metastases fromcolorectal carcinoma: impact of surgical resection on the natural history.” In: BrJ Surg, 77(11), pp. 1241–1246 (cited on p. 7).
Schenk, A., Prause, G., and Peitgen, H.-O. (2000). “Efficient Semiautomatic Segmen-tation of 3D Objects in Medical Images.” In: Proc. of Medical Image Computingand Computer-Assisted Intervention (MICCAI), pp. 186–195 (cited on p. 16).
Schenk, A., Zidowitz, S., Bourquain, H., Hindennach, M., Hansen, C., Hahn, H. K.,and Peitgen, H.-O. (2008). “Clinical relevance of model based computer-assisteddiagnosis and therapy.” In: Proc. of SPIE Medical Imaging. Vol. 6915, 691502 1–19 (cited on pp. 20, 47, 61).
Scheuering, M., Schenk, A., Schneider, A., Preim, B., and Greiner, G. (2003). “Intra-operative Augmented Reality for Minimally Invasive Liver Interventions.” In:Proc. of SPIE Medical Imaging. Vol. 5029, pp. 407–417 (cited on pp. 35, 117).
Schlichting, S. (2008). “Konzeption und Entwicklung eines klinisch einsetzbarenNavigationsystem fur die laparoskopische Leberchirurgie.” PhD thesis. Institutefor Medical Informatics, University of Lubeck, Germany (cited on pp. 71, 74, 82).
Schumann, C., Bieberstein, J., Trumm, C., Schmidt, D., Bruners, P., Niethammer,M., Hoffmann, R. T., Mahnken, A. H., Pereira, P. L., and Peitgen, H.-O. (2010).“Fast Automatic Path Proposal Computation for Hepatic Needle Placement.”In: Proc. of SPIE Medical Imaging. Vol. 7625, 76251J–1 –76251J–10 (cited onpp. 23, 94).
Schwaiger, J., Markert, M., Seidl, B., Shevchenko, N., Doerfler, N., and Lueth, T. C.(2010). “Risk analysis for intraoperative liver surgery.” In: Proceeding of IEEEEng Med Biol Soc, 2010, pp. 410–413 (cited on p. 21).
Schwaiger, J., Markert, M., Shevchenko, N., and Lueth, T. C. (2011). “The effects ofreal-time image navigation in operative liver surgery.” In: Int J Comput AssistRadiol Surg (cited on p. 126).
Schwier, M., Moltz, J. H., and Peitgen, H. O. (2011). “Object-based analysis of CTimages for automatic detection and segmentation of hypodense liver lesions.” In:Int J Comput Assist Radiol Surg, in press (cited on p. 17).
Selle, D. (1999). “Analyse von Gefaßstrukturen in medizinischen Schichtdatensatzenfur die computergestutzte Operationsplanung.” PhD thesis. School of Mathemat-ics and Computer Science, University of Bremen, Germany (cited on p. 19).
Selle, D., Preim, B., Schenk, A., and Peitgen, H.-O. (2002). “Analysis of vasculaturefor liver surgical planning.” In: IEEE Transactions on Medical Imaging, 21(11),pp. 1344–1357 (cited on pp. 18–21, 40, 61, 63, 88).
Shah, A. J., Callaway, M., Thomas, M. G., and Finch-Jones, M. D. (2010). “Contrast-enhanced intraoperative ultrasound improves detection of liver metastases duringsurgery for primary colorectal cancer.” In: The Official Journal of the Interna-tional Hepato Pancreato Biliary Association, 12, pp. 181–187 (cited on pp. 2,70).
Sielhorst, T., Bichlmeier, C., Heining, S. M., and Navab, N. (2006). “Depth perception–a major issue in medical AR: evaluation study by twenty surgeons.” In: Proc.
182
Bibliography
of Medical Image Computing and Computer-Assisted Intervention (MICCAI), 9,pp. 364–372 (cited on p. 114).
Sietses, C., Meijerink, M. R., Meijer, S., and Tol, M. P. van den (2010). “The impactof intraoperative ultrasonography on the surgical treatment of patients withcolorectal liver metastases.” In: Surg Endosc, 24, pp. 1917–1922 (cited on pp. 2,70).
Smeets, D., Loeckx, D., Stijnen, B., De Dobbelaer, B., Vandermeulen, D., and Suetens,P. (2010). “Semi-automatic level set segmentation of liver tumors combining aspiral-scanning technique with supervised fuzzy pixel classification.” In: MedImage Anal, 14, pp. 13–20 (cited on p. 17).
Stawiaski, J., Decenciere, E., and F., Bidault (2008). Interactive liver tumor seg-mentation using graph cuts and watershed, Workshop on 3D Segmentation inthe Clinic: A Grand Challenge II. Liver Tumor Segmentation Challenge. LiverTumor Segmentation Challenge. MICCAI, New York, USA., Internet source:http://hdl.handle.net/10380/1416 (cited on p. 17).
Stockmann, M., Lock, J. F., Malinowski, M., Niehues, S. M., Seehofer, D., andNeuhaus, P. (2010). “The LiMAx test: a new liver function test for predictingpostoperative outcome in liver surgery.” In: The Official Journal of the Interna-tional Hepato Pancreato Biliary Association, 12, pp. 139–146 (cited on pp. 20,62).
Strahle, M., Ehlbeck, M., Prapavat, V., Kuck, K., Franz, F., and Meyer, J. U. (2007).“Towards a Service-Oriented Architecture for Interconnecting Medical Devicesand Applications.” In: Proc. of Joint Workshop on High Confidence MedicalDevices, Software, and Systems and Medical Device Plug-and-Play Interoperability,pp. 153–155 (cited on p. 72).
Swan, P. J., Welsh, F. K., Chandrakumaran, K., and Rees, M. (2011). “Long-term survival following delayed presentation and resection of colorectal livermetastases.” In: Br J Surg (cited on p. 7).
Termeer, M., Olivan Bescos, J., Breeuwer, M., Vilanova, A., Gerritsen, F., andGroller, E. (2007). “CoViCAD: comprehensive visualization of coronary arterydisease.” In: IEEE Trans Vis Comput Graph, 13, pp. 1632–1639 (cited on p. 98).
Thorn, M., Sonntag, S., Glombitza, G.-P., Lamade, W., and Meinzer, H.-P. (1999).“Ein interaktives Tool fur die Segmenteinteilung der Leber in der chirurgischenOperationsplanung.” In: Proc. of Bildverarbeitung fur die Medizin, pp. 155–159(cited on p. 19).
Thorn, M. S. (2004). “Konzeption, Integration und Evaluierung unterstutzender Soft-waremodule in der konventionellen Chirurgie der Leber und Niere. Analyse vonGefaßstrukturen in medizinischen Schichtdatensatzen fur die computergestutzteOperationsplanung.” PhD thesis. School of Medicine, Ruprecht-Karls-UniversitatHeidelberg, Germany (cited on pp. 23, 88).
Tietjen, C. (2009). “Illustrative Visualisierungstechniken zur Unterstutzung derpraoperativen Planung von chirurgischen Eingriffen.” PhD thesis. Otto-von-Guericke University Magdeburg, School of Computer Science, Germany (citedon p. 116).
183

Bibliography
Tsuda, T., Yamamoto, H., Kameda, Y., and Ohta, Y. (2005). “Visualization methodsfor outdoor see-through vision.” In: Proc. of the Iinternational Conference onAugmented Tele-Existence. ACM, pp. 62–69 (cited on p. 116).
Vetter, M., Hassenpflug, P., Cardenas, C., Thorn, M., Glombitza, G., and Meinzer,H. P. (2002). “Navigation in der Leberchirurgie - Ergebnisse einer Anforderungs-analyse.” In: Proc. of Bildverarbeitung fur die Medizin, pp. 49–53 (cited onp. 28).
Vetter, M., Wolf, I., Hassenpflug, P., Hastenteufel, M., Ludwig, R., Grenacher, L.,Richter, G. M., Uhl, W., Buchler, M. W., and Meinzer, H. P. (2003). “Navigationaids and real-time deformation modeling for open liver surgery.” In: Proc. ofSPIE Medical Imaging. Vol. 5029, pp. 58–68 (cited on pp. 32, 141).
Vigano, L., Ferrero, A., Lo Tesoriere, R., and Capussotti, L. (2008). “Liver surgeryfor colorectal metastases: results after 10 years of follow-up. Long-term survivors,late recurrences, and prognostic role of morbidity.” In: Ann. Surg. Oncol. 15,pp. 2458–2464 (cited on p. 7).
Walsh, M. and Crumbie, A. (2007). Watson’s Clinical Nursing and Related Sciences.7th ed. Bailliere Tindall, USA (cited on p. 7).
Wee, A. N. and Sanderson, P. M. (2008). “Are melodic medical equipment alarmseasily learned?” In: Anesth. Analg. 106, pp. 501–508 (cited on p. 130).
Wegner, C. M. and Karron, D. B. (1997). “Surgical navigation using audio feedback.”In: Stud Health Technol Inform, 39, pp. 450–458 (cited on p. 130).
Wegner, K. (1998). “Surgical navigation system and method using audio feedback.”In: British Computer Society (cited on pp. 130, 141).
Wein, W., Khamene, A., Clevert, D.-A., Kutter, O., and Navab, N. (2007). “Simu-lation and fully automatic multimodal registration of medical ultrasound.” In:Medical Image Computing and Computer-Assisted Intervention (MICCAI), 10(Pt1), pp. 136–143 (cited on p. 31).
Wein, W., Kutter, O., Aichert, A., Zikic, D., Kamen, A., and Navab, N. (2010).“Automatic non-linear mapping of pre-procedure CT volumes to 3D ultrasound.”In: Proc. IEEE International Symposium on Biomedical Imaging, pp. 1225 –1228(cited on p. 31).
Welter, S., Stocker, C., Dicken, V., Kuhl, H., Kraß, S., and Stamatis, G. (2011). “Lungsegment geometry study: Simulation of largest possible tumours that fit intobronchopulmonary segments.” In: The Thoracic and Cardiovascular Surgeon), inpress (cited on p. 39).
Wendt, N. (2011). Based on an oral discussion with Dr. Nicholas Wendt, St. JosefHospital, Bremen, Germany (cited on p. 8).
Wieferich, J. (2008). “Visualisierungskonzept zur intraopertiven Unterstutzung inder Leberchirurgie.” MA thesis. Department of Computer Science, University ofApplied Sciences Bremen, Germany (cited on p. 127).
WiiMote API (2011). Internet source: code.google.com/p/wiimote-api/, visited: 2011,October 15 (cited on p. 80).
Wildi, S. M., Gubler, C., Hany, T., Petrowsky, H., Clavien, P. A., Jochum, W.,Gerlach, T., Fried, M., and Mullhaupt, B. (2008). “Intraoperative sonography in
184
Bibliography
patients with colorectal cancer and resectable liver metastases on preoperativeFDG-PET-CT.” In: J Clin Ultrasound, 36, pp. 20–26 (cited on p. 70).
Willems, P. W., Noordmans, H. J., Overbeeke, J. J. van, Viergever, M. A., Tulleken,C. A., and Sprenkel, J. W. van der (2005). “The impact of auditory feedback onneuronavigation.” In: Acta Neurochir, 147, pp. 167–173 (cited on p. 131).
Wimmer, A., Soza, G., and Hornegger, J. (2009). “A generic probabilistic activeshape model for organ segmentation.” In: Proc. of Medical Image Computingand Computer-Assisted Intervention (MICCAI), 12, pp. 26–33 (cited on p. 16).
Woerdeman, P. A., Willems, P. W. A., Noordmans, H. J., and Sprenkel, J. W. B.van der (2009). “Auditory feedback during frameless image-guided surgery in aphantom model and initial clinical experience.” In: J Neurosurg, 110, pp. 157–262(cited on pp. 131, 141).
Yamada, A., Hara, T., Li, F., Fujinaga, Y., Ueda, K., Kadoya, M., and Doi, K.(2011). “Quantitative evaluation of liver function with use of gadoxetate disodium-enhanced MR imaging.” In: Radiology, 260, pp. 727–733 (cited on p. 62).
Yao, J., Chowdhury, A. S., Aman, J., and Summers, R. M. (2010). “Reversibleprojection technique for colon unfolding.” In: IEEE Trans Biomed Eng, 57,pp. 2861–2869 (cited on p. 97).
Zacherl, J., Scheuba, C., Imhof, M., Zacherl, M., Langle, F., Pokieser, P., Wrba, F.,et al. (2002). “Current value of intraoperative sonography during surgery forhepatic neoplasms.” In: World J Surg, 26, pp. 550–554 (cited on p. 70).
Zachow, S., Hahn, H., and Lange, T. (2010). “Computerassistierte Chirurgieplanung.”In: Computerassistierte Chirurgie. Urban & Fischer Verlag, pp. 119–149 (citedon pp. 14, 69).
Zeng, W., Marino, J., Kaufman, A., and Gu, X. D. (2011). “Volumetric Colon WallUnfolding Using Harmonic Differentials.” In: Comput Graph, 35, pp. 726–732(cited on p. 97).
Zhou, J. Y., Wong, D. W., Ding, F., Venkatesh, S. K., Tian, Q., Qi, Y. Y., Xiong,W., Liu, J. J., and Leow, W. K. (2010). “Liver tumour segmentation usingcontrast-enhanced multi-detector CT data: performance benchmarking of threesemiautomated methods.” In: Eur Radiol, 20, pp. 1738–1748 (cited on p. 17).
185