Softness in Drugstore Front-End Sales MONTHLY ...
15
DISCLOSURE APPENDIX AT THE BACK OF THIS REPORT CONTAINS IMPORTANT DISCLOSURES, ANALYST CERTIFICATIONS, LEGAL ENTITY DISCLOSURE AND THE STATUS OF NON-US ANALYSTS. US Disclosure: Credit Suisse does and seeks to do business with companies covered in its research reports. As a result, investors should be aware that the Firm may have a conflict of interest that could affect the objectivity of this report. Investors should consider this report as only a single factor in making their investment decision. 7 February 2017 Americas/United States Equity Research Drug Retail Drugstore Trend Tracker MONTHLY Research Analysts Robert Willoughby 212 325 1497 [email protected] Edward J. Kelly, CFA, CPA 212 325 3241 [email protected] Stephanie Chang, CFA 212 325 8939 [email protected] Anthony Bonadio, CFA 212 538 7532 [email protected] Disappointing Volumes Drive Continued Softness in Drugstore Front-End Sales ■ CS View: Nielsen drugstore front-end sales remained soft at -0.2% y/y for the most recent four-week period ended January 28, roughly consistent with the prior six-month average of -0.3%. Pressure to top-line trends from unit volumes persisted for the 11 th consecutive month (-2.8% y/y), decelerating by ~60bps sequentially. This trend was largely offset by positive Price/Mix, which accelerated 40bps sequentially to 2.6% y/y. Both metrics remained in-line with the respective prior six month average. Our long-term outlook on front-end sales in the drugstore channel remains cautious given weak traffic trends overall and intensifying competition from peers as well as other channels across retail. ■ Volumes slip further into negative territory. Volume growth for the January period decelerated ~60bps sequentially to -2.8% and remained in- line with the prior six-month average. Relative weakness in General Merchandise, Combo Packs, and Dairy offset gains in Produce and Packaged Meat. ■ Price/mix posts sequential improvement. Price/mix growth accelerated ~40bps sequentially to 2.6% y/y for the January period, roughly consistent with the prior six-month average of 2.5% y/y. Fresh Meat, Combo Packs and Deli exhibited the best relative performance, despite moderate declines in Dairy and Fresh Produce in-line with recent CPI trends. ■ Heightened promotional levels persist. The percentage of product sold on promotion in the drugstore channel was 44.0% for the January period, down slightly vs. December, but up ~230bps and ~150bps vs. the year-ago period and prior six-month average, respectively. ■ Private label penetration increases sequentially. Private label mix for the period increased 90bps to 16.9%, in-line with the year-ago period and slightly above the prior six month average. Branded and private label dollar growth both decelerated sequentially, to -0.2% and -0.4% y/y. Volumes for both categories showed sequential declines, at -2.8% y/y. ■ About the proprietary Credit Suisse Drug Retail Tracker. In this report, we performed an analysis of the current front-end sales trends at U.S. chain drugstores (including volumes, price/mix, and promotional levels) based on point-of-sale data collected by The Nielsen Company as of January 28. Our goal is to provide investors with a regular update on the performance of the chain drugstores between quarterly reporting cycles.
Transcript of Softness in Drugstore Front-End Sales MONTHLY ...
DISCLOSURE APPENDIX AT THE BACK OF THIS REPORT CONTAINS IMPORTANT DISCLOSURES, ANALYST CERTIFICATIONS, LEGAL ENTITY DISCLOSURE AND THE STATUS OF NON-US ANALYSTS. US Disclosure: Credit Suisse does and seeks to do business with companies covered in its research reports. As a result, investors should be aware that the Firm may have a conflict of interest that could affect the objectivity of this report. Investors should consider this report as only a single factor in making their investment decision.
7 February 2017Americas/United States
Equity ResearchDrug Retail
Drugstore Trend Tracker MONTHLYResearch Analysts
Robert Willoughby212 325 1497
Edward J. Kelly, CFA, CPA212 325 3241
Stephanie Chang, CFA212 325 8939
Anthony Bonadio, CFA212 538 7532
Disappointing Volumes Drive Continued Softness in Drugstore Front-End Sales■ CS View: Nielsen drugstore front-end sales remained soft at -0.2% y/y for
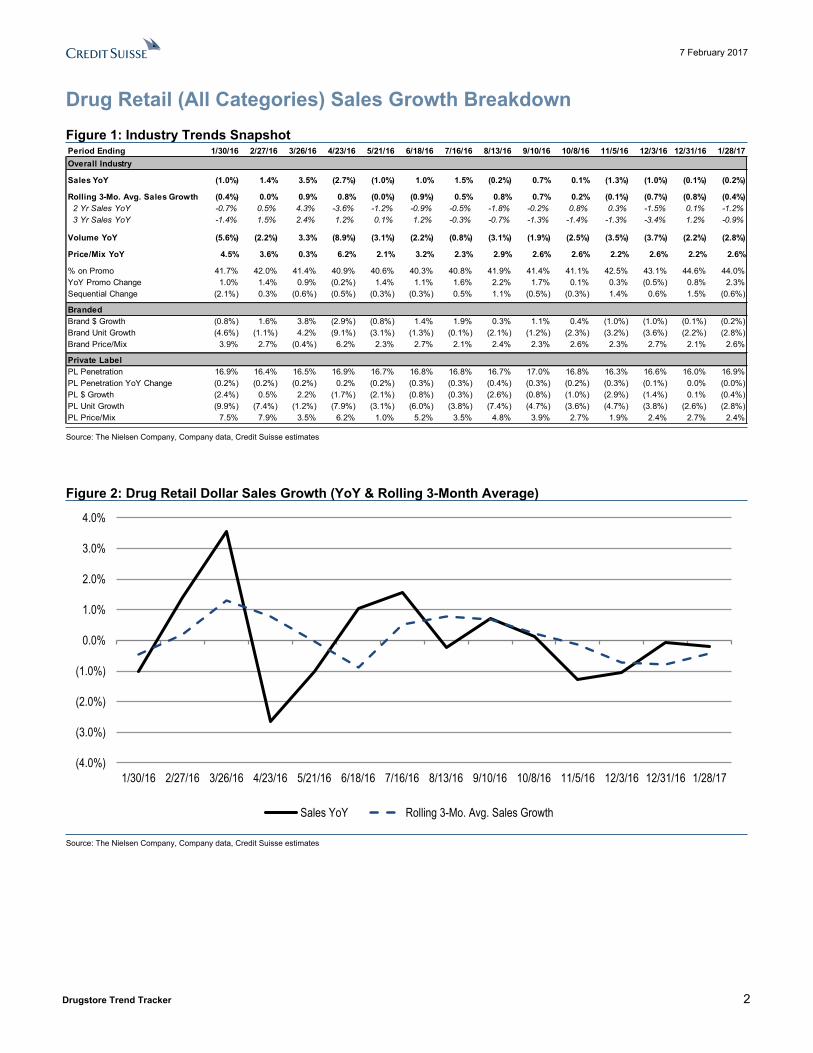
the most recent four-week period ended January 28, roughly consistent with the prior six-month average of -0.3%. Pressure to top-line trends from unit volumes persisted for the 11th consecutive month (-2.8% y/y), decelerating by ~60bps sequentially. This trend was largely offset by positive Price/Mix, which accelerated 40bps sequentially to 2.6% y/y. Both metrics remained in-line with the respective prior six month average. Our long-term outlook on front-end sales in the drugstore channel remains cautious given weak traffic trends overall and intensifying competition from peers as well as other channels across retail.
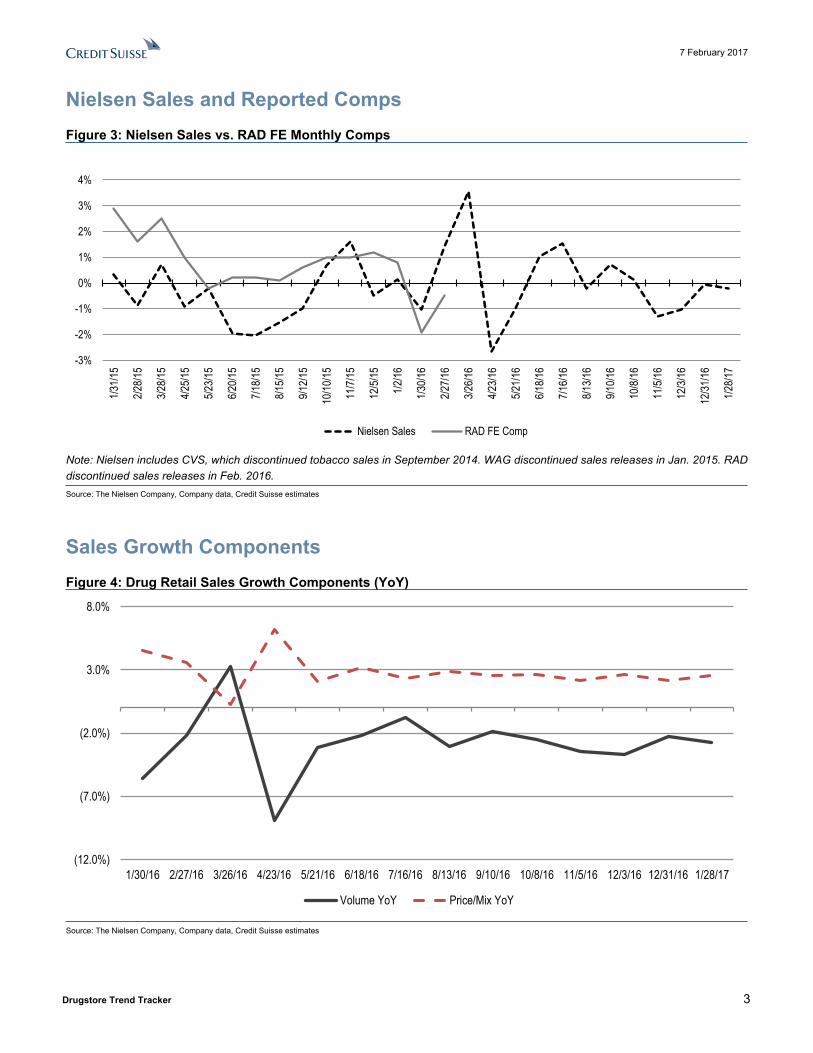
■ Volumes slip further into negative territory. Volume growth for the January period decelerated ~60bps sequentially to -2.8% and remained in-line with the prior six-month average. Relative weakness in General Merchandise, Combo Packs, and Dairy offset gains in Produce and Packaged Meat.
■ Price/mix posts sequential improvement. Price/mix growth accelerated ~40bps sequentially to 2.6% y/y for the January period, roughly consistent with the prior six-month average of 2.5% y/y. Fresh Meat, Combo Packs and Deli exhibited the best relative performance, despite moderate declines in Dairy and Fresh Produce in-line with recent CPI trends.
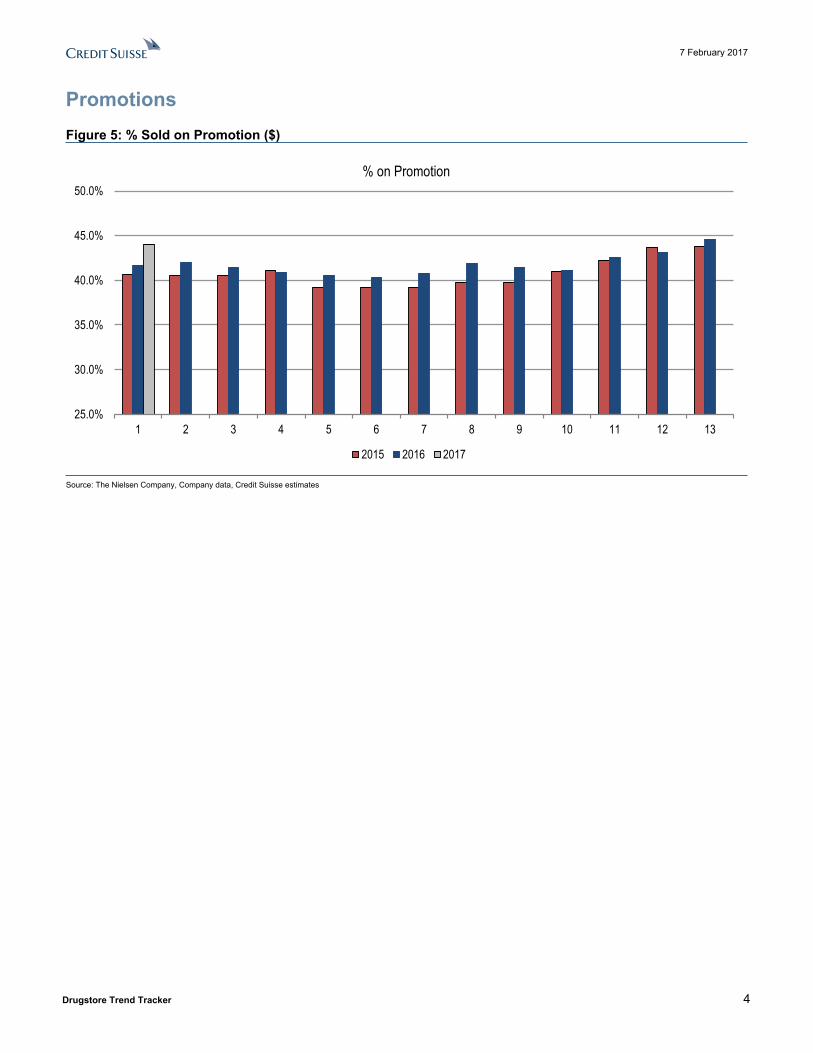
■ Heightened promotional levels persist. The percentage of product sold on promotion in the drugstore channel was 44.0% for the January period, down slightly vs. December, but up ~230bps and ~150bps vs. the year-ago period and prior six-month average, respectively.
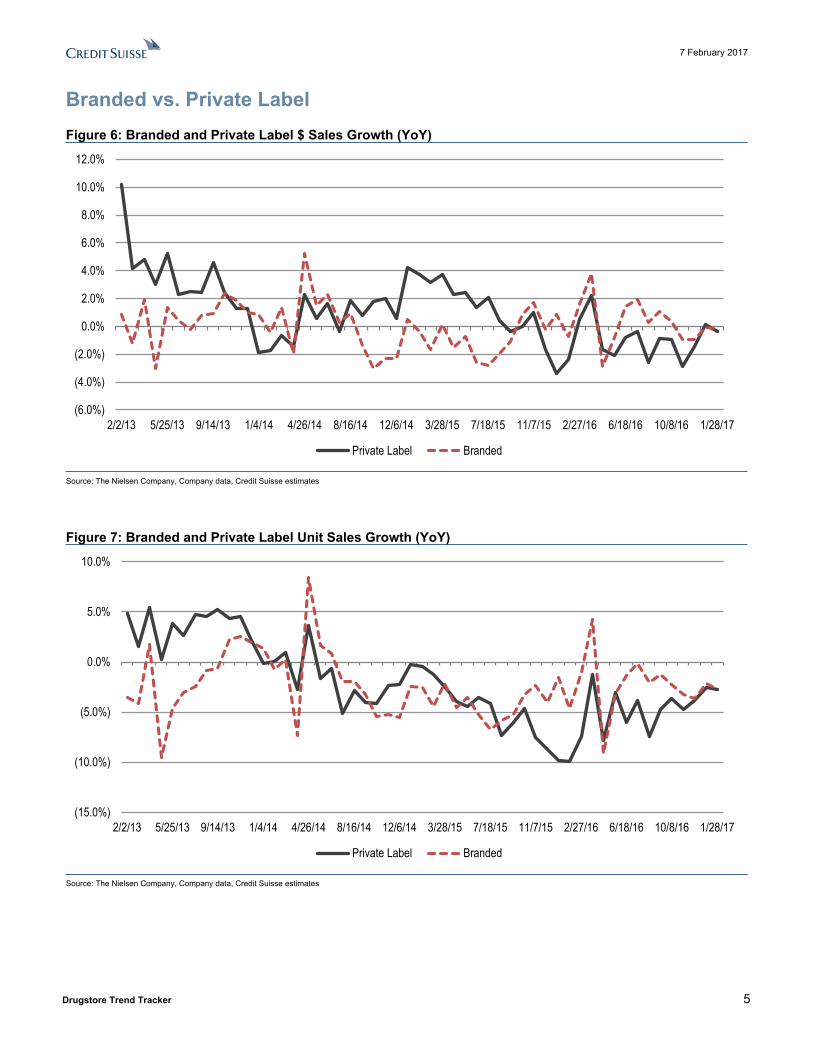
■ Private label penetration increases sequentially. Private label mix for the period increased 90bps to 16.9%, in-line with the year-ago period and slightly above the prior six month average. Branded and private label dollar growth both decelerated sequentially, to -0.2% and -0.4% y/y. Volumes for both categories showed sequential declines, at -2.8% y/y.
■ About the proprietary Credit Suisse Drug Retail Tracker. In this report, we performed an analysis of the current front-end sales trends at U.S. chain drugstores (including volumes, price/mix, and promotional levels) based on point-of-sale data collected by The Nielsen Company as of January 28. Our goal is to provide investors with a regular update on the performance of the chain drugstores between quarterly reporting cycles.
7 February 2017
Drugstore Trend Tracker 2
Drug Retail (All Categories) Sales Growth BreakdownFigure 1: Industry Trends Snapshot Period Ending 1/30/16 2/27/16 3/26/16 4/23/16 5/21/16 6/18/16 7/16/16 8/13/16 9/10/16 10/8/16 11/5/16 12/3/16 12/31/16 1/28/17Overall Industry
Sales YoY (1.0%) 1.4% 3.5% (2.7%) (1.0%) 1.0% 1.5% (0.2%) 0.7% 0.1% (1.3%) (1.0%) (0.1%) (0.2%)
Rolling 3-Mo. Avg. Sales Growth (0.4%) 0.0% 0.9% 0.8% (0.0%) (0.9%) 0.5% 0.8% 0.7% 0.2% (0.1%) (0.7%) (0.8%) (0.4%) 2 Yr Sales YoY -0.7% 0.5% 4.3% -3.6% -1.2% -0.9% -0.5% -1.8% -0.2% 0.8% 0.3% -1.5% 0.1% -1.2% 3 Yr Sales YoY -1.4% 1.5% 2.4% 1.2% 0.1% 1.2% -0.3% -0.7% -1.3% -1.4% -1.3% -3.4% 1.2% -0.9%
Volume YoY (5.6%) (2.2%) 3.3% (8.9%) (3.1%) (2.2%) (0.8%) (3.1%) (1.9%) (2.5%) (3.5%) (3.7%) (2.2%) (2.8%)
Price/Mix YoY 4.5% 3.6% 0.3% 6.2% 2.1% 3.2% 2.3% 2.9% 2.6% 2.6% 2.2% 2.6% 2.2% 2.6%
% on Promo 41.7% 42.0% 41.4% 40.9% 40.6% 40.3% 40.8% 41.9% 41.4% 41.1% 42.5% 43.1% 44.6% 44.0%YoY Promo Change 1.0% 1.4% 0.9% (0.2%) 1.4% 1.1% 1.6% 2.2% 1.7% 0.1% 0.3% (0.5%) 0.8% 2.3%Sequential Change (2.1%) 0.3% (0.6%) (0.5%) (0.3%) (0.3%) 0.5% 1.1% (0.5%) (0.3%) 1.4% 0.6% 1.5% (0.6%)
BrandedBrand $ Growth (0.8%) 1.6% 3.8% (2.9%) (0.8%) 1.4% 1.9% 0.3% 1.1% 0.4% (1.0%) (1.0%) (0.1%) (0.2%)Brand Unit Growth (4.6%) (1.1%) 4.2% (9.1%) (3.1%) (1.3%) (0.1%) (2.1%) (1.2%) (2.3%) (3.2%) (3.6%) (2.2%) (2.8%)Brand Price/Mix 3.9% 2.7% (0.4%) 6.2% 2.3% 2.7% 2.1% 2.4% 2.3% 2.6% 2.3% 2.7% 2.1% 2.6%
Private LabelPL Penetration 16.9% 16.4% 16.5% 16.9% 16.7% 16.8% 16.8% 16.7% 17.0% 16.8% 16.3% 16.6% 16.0% 16.9%PL Penetration YoY Change (0.2%) (0.2%) (0.2%) 0.2% (0.2%) (0.3%) (0.3%) (0.4%) (0.3%) (0.2%) (0.3%) (0.1%) 0.0% (0.0%)PL $ Growth (2.4%) 0.5% 2.2% (1.7%) (2.1%) (0.8%) (0.3%) (2.6%) (0.8%) (1.0%) (2.9%) (1.4%) 0.1% (0.4%)PL Unit Growth (9.9%) (7.4%) (1.2%) (7.9%) (3.1%) (6.0%) (3.8%) (7.4%) (4.7%) (3.6%) (4.7%) (3.8%) (2.6%) (2.8%)PL Price/Mix 7.5% 7.9% 3.5% 6.2% 1.0% 5.2% 3.5% 4.8% 3.9% 2.7% 1.9% 2.4% 2.7% 2.4%
Source: The Nielsen Company, Company data, Credit Suisse estimates
Figure 2: Drug Retail Dollar Sales Growth (YoY & Rolling 3-Month Average)
(4.0%)
(3.0%)
(2.0%)
(1.0%)
0.0%
1.0%
2.0%
3.0%
4.0%
1/30/16 2/27/16 3/26/16 4/23/16 5/21/16 6/18/16 7/16/16 8/13/16 9/10/16 10/8/16 11/5/16 12/3/16 12/31/16 1/28/17
Sales YoY Rolling 3-Mo. Avg. Sales Growth
Source: The Nielsen Company, Company data, Credit Suisse estimates
7 February 2017
Drugstore Trend Tracker 3
Nielsen Sales and Reported CompsFigure 3: Nielsen Sales vs. RAD FE Monthly Comps
-3%
-2%
-1%
0%
1%
2%
3%
4%
1/31/1
5
2/28/1
5
3/28/1
5
4/25/1
5
5/23/1
5
6/20/1
5
7/18/1
5
8/15/1
5
9/12/1
5
10/10
/15
11/7/
15
12/5/
15
1/2/16
1/30/1
6
2/27/1
6
3/26/1
6
4/23/1
6
5/21/1
6
6/18/1
6
7/16/1
6
8/13/1
6
9/10/1
6
10/8/
16
11/5/
16
12/3/
16
12/31
/16
1/28/1
7
Nielsen Sales RAD FE Comp
Note: Nielsen includes CVS, which discontinued tobacco sales in September 2014. WAG discontinued sales releases in Jan. 2015. RAD discontinued sales releases in Feb. 2016.Source: The Nielsen Company, Company data, Credit Suisse estimates
Sales Growth ComponentsFigure 4: Drug Retail Sales Growth Components (YoY)
(12.0%)
(7.0%)
(2.0%)
3.0%
8.0%
1/30/16 2/27/16 3/26/16 4/23/16 5/21/16 6/18/16 7/16/16 8/13/16 9/10/16 10/8/16 11/5/16 12/3/16 12/31/16 1/28/17
Volume YoY Price/Mix YoY
Source: The Nielsen Company, Company data, Credit Suisse estimates
7 February 2017
Drugstore Trend Tracker 4
PromotionsFigure 5: % Sold on Promotion ($)
25.0%
30.0%
35.0%
40.0%
45.0%
50.0%
1 2 3 4 5 6 7 8 9 10 11 12 13
% on Promotion
2015 2016 2017
Source: The Nielsen Company, Company data, Credit Suisse estimates
7 February 2017
Drugstore Trend Tracker 5
Branded vs. Private LabelFigure 6: Branded and Private Label $ Sales Growth (YoY)
(6.0%)
(4.0%)
(2.0%)
0.0%
2.0%
4.0%
6.0%
8.0%
10.0%
12.0%
2/2/13 5/25/13 9/14/13 1/4/14 4/26/14 8/16/14 12/6/14 3/28/15 7/18/15 11/7/15 2/27/16 6/18/16 10/8/16 1/28/17
Private Label Branded
Source: The Nielsen Company, Company data, Credit Suisse estimates
Figure 7: Branded and Private Label Unit Sales Growth (YoY)
(15.0%)
(10.0%)
(5.0%)
0.0%
5.0%
10.0%
2/2/13 5/25/13 9/14/13 1/4/14 4/26/14 8/16/14 12/6/14 3/28/15 7/18/15 11/7/15 2/27/16 6/18/16 10/8/16 1/28/17
Private Label Branded
Source: The Nielsen Company, Company data, Credit Suisse estimates
7 February 2017
Drugstore Trend Tracker 6
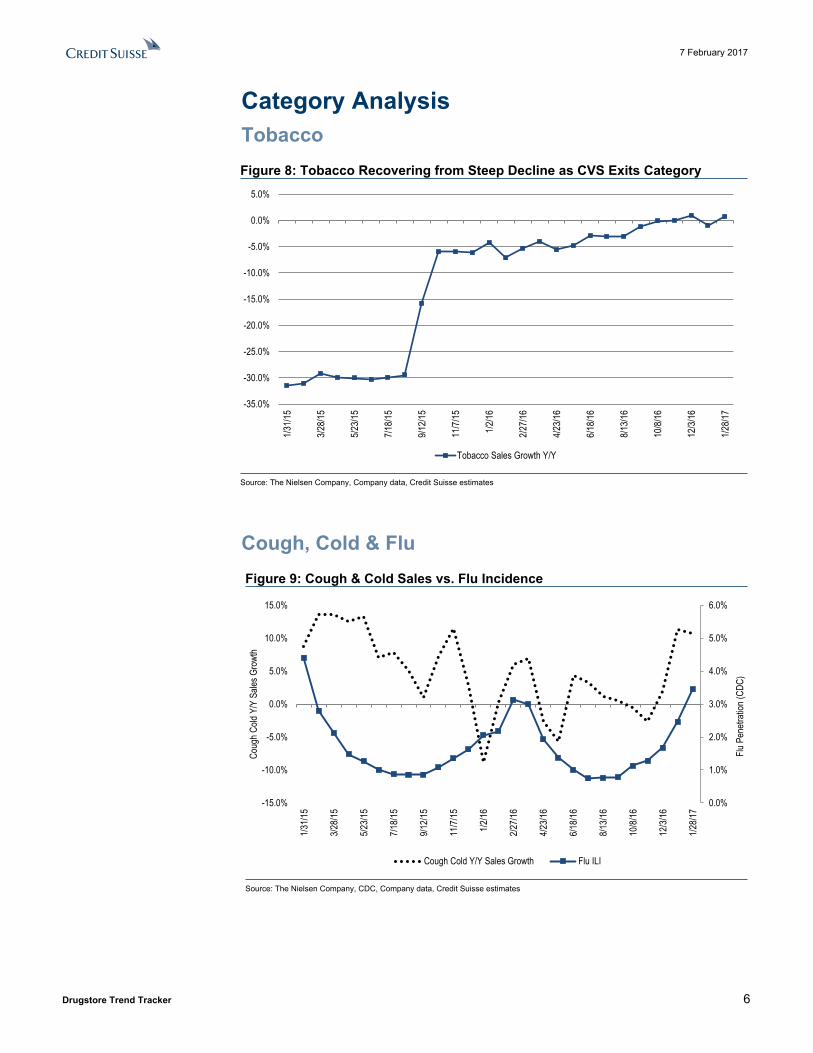
Category AnalysisTobaccoFigure 8: Tobacco Recovering from Steep Decline as CVS Exits Category
-35.0%
-30.0%
-25.0%
-20.0%
-15.0%
-10.0%
-5.0%
0.0%
5.0%
1/31/1
5
3/28/1
5
5/23/1
5
7/18/1
5
9/12/1
5
11/7/
15
1/2/16
2/27/1
6
4/23/1
6
6/18/1
6
8/13/1
6
10/8/
16
12/3/
16
1/28/1
7
Tobacco Sales Growth Y/Y
Source: The Nielsen Company, Company data, Credit Suisse estimates
Cough, Cold & FluFigure 9: Cough & Cold Sales vs. Flu Incidence
0.0%
1.0%
2.0%
3.0%
4.0%
5.0%
6.0%
-15.0%
-10.0%
-5.0%
0.0%
5.0%
10.0%
15.0%
1/31/1
5
3/28/1
5
5/23/1
5
7/18/1
5
9/12/1
5
11/7/
15
1/2/16
2/27/1
6
4/23/1
6
6/18/1
6
8/13/1
6
10/8/
16
12/3/
16
1/28/1
7
Flu P
enetr
ation
(CDC
)
Coug
h Cold
Y/Y
Sale
s Gro
wth
Cough Cold Y/Y Sales Growth Flu ILI
Source: The Nielsen Company, CDC, Company data, Credit Suisse estimates
7 February 2017
Drugstore Trend Tracker 7
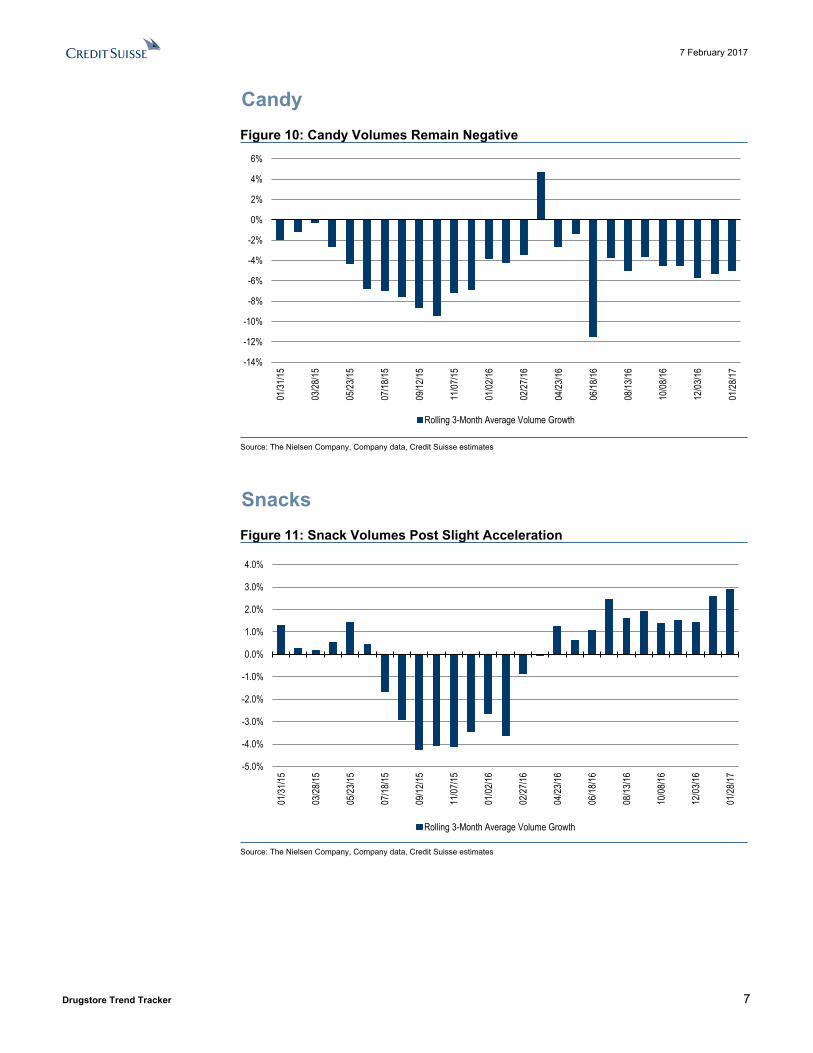
CandyFigure 10: Candy Volumes Remain Negative
-14%
-12%
-10%
-8%
-6%
-4%
-2%
0%
2%
4%
6%
01/31
/15
03/28
/15
05/23
/15
07/18
/15
09/12
/15
11/07
/15
01/02
/16
02/27
/16
04/23
/16
06/18
/16
08/13
/16
10/08
/16
12/03
/16
01/28
/17
Rolling 3-Month Average Volume Growth
Source: The Nielsen Company, Company data, Credit Suisse estimates
SnacksFigure 11: Snack Volumes Post Slight Acceleration
-5.0%
-4.0%
-3.0%
-2.0%
-1.0%
0.0%
1.0%
2.0%
3.0%
4.0%
01/31
/15
03/28
/15
05/23
/15
07/18
/15
09/12
/15
11/07
/15
01/02
/16
02/27
/16
04/23
/16
06/18
/16
08/13
/16
10/08
/16
12/03
/16
01/28
/17
Rolling 3-Month Average Volume Growth
Source: The Nielsen Company, Company data, Credit Suisse estimates

7 February 2017
Drugstore Trend Tracker 8
Bottled WaterFigure 12: Bottled Water Volumes Accelerate
-6.0%
-4.0%
-2.0%
0.0%
2.0%
4.0%
6.0%
8.0%
01/31
/15
03/28
/15
05/23
/15
07/18
/15
09/12
/15
11/07
/15
01/02
/16
02/27
/16
04/23
/16
06/18
/16
08/13
/16
10/08
/16
12/03
/16
01/28
/17
Rolling 3-Month Average Volume Growth
Note: Category excludes Carbonated Beverages.Source: The Nielsen Company, Company data, Credit Suisse estimates
Paper ProductsFigure 13: Paper Products Volume Growth Reverts Back to Positive Territory
-12%
-10%
-8%
-6%
-4%
-2%
0%
2%
4%
01/31
/15
03/28
/15
05/23
/15
07/18
/15
09/12
/15
11/07
/15
01/02
/16
02/27
/16
04/23
/16
06/18
/16
08/13
/16
10/08
/16
12/03
/16
01/28
/17
Rolling 3-Month Average Volume Growth
Source: The Nielsen Company, Company data, Credit Suisse estimates
7 February 2017
Drugstore Trend Tracker
9
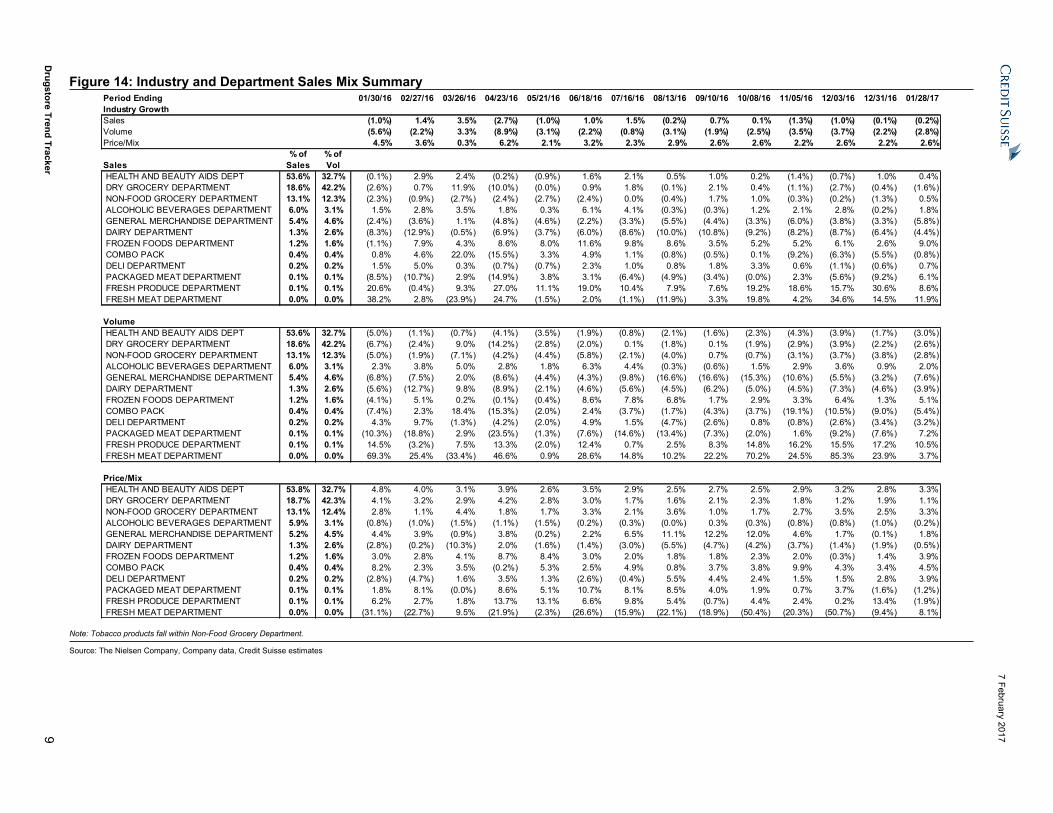
Figure 14: Industry and Department Sales Mix SummaryPeriod Ending 01/30/16 02/27/16 03/26/16 04/23/16 05/21/16 06/18/16 07/16/16 08/13/16 09/10/16 10/08/16 11/05/16 12/03/16 12/31/16 01/28/17Industry GrowthSales (1.0%) 1.4% 3.5% (2.7%) (1.0%) 1.0% 1.5% (0.2%) 0.7% 0.1% (1.3%) (1.0%) (0.1%) (0.2%)Volume (5.6%) (2.2%) 3.3% (8.9%) (3.1%) (2.2%) (0.8%) (3.1%) (1.9%) (2.5%) (3.5%) (3.7%) (2.2%) (2.8%)Price/Mix 4.5% 3.6% 0.3% 6.2% 2.1% 3.2% 2.3% 2.9% 2.6% 2.6% 2.2% 2.6% 2.2% 2.6%
SalesHEALTH AND BEAUTY AIDS DEPT 53.6% 32.7% (0.1%) 2.9% 2.4% (0.2%) (0.9%) 1.6% 2.1% 0.5% 1.0% 0.2% (1.4%) (0.7%) 1.0% 0.4%DRY GROCERY DEPARTMENT 18.6% 42.2% (2.6%) 0.7% 11.9% (10.0%) (0.0%) 0.9% 1.8% (0.1%) 2.1% 0.4% (1.1%) (2.7%) (0.4%) (1.6%)NON-FOOD GROCERY DEPARTMENT 13.1% 12.3% (2.3%) (0.9%) (2.7%) (2.4%) (2.7%) (2.4%) 0.0% (0.4%) 1.7% 1.0% (0.3%) (0.2%) (1.3%) 0.5%ALCOHOLIC BEVERAGES DEPARTMENT 6.0% 3.1% 1.5% 2.8% 3.5% 1.8% 0.3% 6.1% 4.1% (0.3%) (0.3%) 1.2% 2.1% 2.8% (0.2%) 1.8%GENERAL MERCHANDISE DEPARTMENT 5.4% 4.6% (2.4%) (3.6%) 1.1% (4.8%) (4.6%) (2.2%) (3.3%) (5.5%) (4.4%) (3.3%) (6.0%) (3.8%) (3.3%) (5.8%)DAIRY DEPARTMENT 1.3% 2.6% (8.3%) (12.9%) (0.5%) (6.9%) (3.7%) (6.0%) (8.6%) (10.0%) (10.8%) (9.2%) (8.2%) (8.7%) (6.4%) (4.4%)FROZEN FOODS DEPARTMENT 1.2% 1.6% (1.1%) 7.9% 4.3% 8.6% 8.0% 11.6% 9.8% 8.6% 3.5% 5.2% 5.2% 6.1% 2.6% 9.0%COMBO PACK 0.4% 0.4% 0.8% 4.6% 22.0% (15.5%) 3.3% 4.9% 1.1% (0.8%) (0.5%) 0.1% (9.2%) (6.3%) (5.5%) (0.8%)DELI DEPARTMENT 0.2% 0.2% 1.5% 5.0% 0.3% (0.7%) (0.7%) 2.3% 1.0% 0.8% 1.8% 3.3% 0.6% (1.1%) (0.6%) 0.7%PACKAGED MEAT DEPARTMENT 0.1% 0.1% (8.5%) (10.7%) 2.9% (14.9%) 3.8% 3.1% (6.4%) (4.9%) (3.4%) (0.0%) 2.3% (5.6%) (9.2%) 6.1%FRESH PRODUCE DEPARTMENT 0.1% 0.1% 20.6% (0.4%) 9.3% 27.0% 11.1% 19.0% 10.4% 7.9% 7.6% 19.2% 18.6% 15.7% 30.6% 8.6%FRESH MEAT DEPARTMENT 0.0% 0.0% 38.2% 2.8% (23.9%) 24.7% (1.5%) 2.0% (1.1%) (11.9%) 3.3% 19.8% 4.2% 34.6% 14.5% 11.9%
VolumeHEALTH AND BEAUTY AIDS DEPT 53.6% 32.7% (5.0%) (1.1%) (0.7%) (4.1%) (3.5%) (1.9%) (0.8%) (2.1%) (1.6%) (2.3%) (4.3%) (3.9%) (1.7%) (3.0%)DRY GROCERY DEPARTMENT 18.6% 42.2% (6.7%) (2.4%) 9.0% (14.2%) (2.8%) (2.0%) 0.1% (1.8%) 0.1% (1.9%) (2.9%) (3.9%) (2.2%) (2.6%)NON-FOOD GROCERY DEPARTMENT 13.1% 12.3% (5.0%) (1.9%) (7.1%) (4.2%) (4.4%) (5.8%) (2.1%) (4.0%) 0.7% (0.7%) (3.1%) (3.7%) (3.8%) (2.8%)ALCOHOLIC BEVERAGES DEPARTMENT 6.0% 3.1% 2.3% 3.8% 5.0% 2.8% 1.8% 6.3% 4.4% (0.3%) (0.6%) 1.5% 2.9% 3.6% 0.9% 2.0%GENERAL MERCHANDISE DEPARTMENT 5.4% 4.6% (6.8%) (7.5%) 2.0% (8.6%) (4.4%) (4.3%) (9.8%) (16.6%) (16.6%) (15.3%) (10.6%) (5.5%) (3.2%) (7.6%)DAIRY DEPARTMENT 1.3% 2.6% (5.6%) (12.7%) 9.8% (8.9%) (2.1%) (4.6%) (5.6%) (4.5%) (6.2%) (5.0%) (4.5%) (7.3%) (4.6%) (3.9%)FROZEN FOODS DEPARTMENT 1.2% 1.6% (4.1%) 5.1% 0.2% (0.1%) (0.4%) 8.6% 7.8% 6.8% 1.7% 2.9% 3.3% 6.4% 1.3% 5.1%COMBO PACK 0.4% 0.4% (7.4%) 2.3% 18.4% (15.3%) (2.0%) 2.4% (3.7%) (1.7%) (4.3%) (3.7%) (19.1%) (10.5%) (9.0%) (5.4%)DELI DEPARTMENT 0.2% 0.2% 4.3% 9.7% (1.3%) (4.2%) (2.0%) 4.9% 1.5% (4.7%) (2.6%) 0.8% (0.8%) (2.6%) (3.4%) (3.2%)PACKAGED MEAT DEPARTMENT 0.1% 0.1% (10.3%) (18.8%) 2.9% (23.5%) (1.3%) (7.6%) (14.6%) (13.4%) (7.3%) (2.0%) 1.6% (9.2%) (7.6%) 7.2%FRESH PRODUCE DEPARTMENT 0.1% 0.1% 14.5% (3.2%) 7.5% 13.3% (2.0%) 12.4% 0.7% 2.5% 8.3% 14.8% 16.2% 15.5% 17.2% 10.5%FRESH MEAT DEPARTMENT 0.0% 0.0% 69.3% 25.4% (33.4%) 46.6% 0.9% 28.6% 14.8% 10.2% 22.2% 70.2% 24.5% 85.3% 23.9% 3.7%
Price/MixHEALTH AND BEAUTY AIDS DEPT 53.8% 32.7% 4.8% 4.0% 3.1% 3.9% 2.6% 3.5% 2.9% 2.5% 2.7% 2.5% 2.9% 3.2% 2.8% 3.3%DRY GROCERY DEPARTMENT 18.7% 42.3% 4.1% 3.2% 2.9% 4.2% 2.8% 3.0% 1.7% 1.6% 2.1% 2.3% 1.8% 1.2% 1.9% 1.1%NON-FOOD GROCERY DEPARTMENT 13.1% 12.4% 2.8% 1.1% 4.4% 1.8% 1.7% 3.3% 2.1% 3.6% 1.0% 1.7% 2.7% 3.5% 2.5% 3.3%ALCOHOLIC BEVERAGES DEPARTMENT 5.9% 3.1% (0.8%) (1.0%) (1.5%) (1.1%) (1.5%) (0.2%) (0.3%) (0.0%) 0.3% (0.3%) (0.8%) (0.8%) (1.0%) (0.2%)GENERAL MERCHANDISE DEPARTMENT 5.2% 4.5% 4.4% 3.9% (0.9%) 3.8% (0.2%) 2.2% 6.5% 11.1% 12.2% 12.0% 4.6% 1.7% (0.1%) 1.8%DAIRY DEPARTMENT 1.3% 2.6% (2.8%) (0.2%) (10.3%) 2.0% (1.6%) (1.4%) (3.0%) (5.5%) (4.7%) (4.2%) (3.7%) (1.4%) (1.9%) (0.5%)FROZEN FOODS DEPARTMENT 1.2% 1.6% 3.0% 2.8% 4.1% 8.7% 8.4% 3.0% 2.0% 1.8% 1.8% 2.3% 2.0% (0.3%) 1.4% 3.9%COMBO PACK 0.4% 0.4% 8.2% 2.3% 3.5% (0.2%) 5.3% 2.5% 4.9% 0.8% 3.7% 3.8% 9.9% 4.3% 3.4% 4.5%DELI DEPARTMENT 0.2% 0.2% (2.8%) (4.7%) 1.6% 3.5% 1.3% (2.6%) (0.4%) 5.5% 4.4% 2.4% 1.5% 1.5% 2.8% 3.9%PACKAGED MEAT DEPARTMENT 0.1% 0.1% 1.8% 8.1% (0.0%) 8.6% 5.1% 10.7% 8.1% 8.5% 4.0% 1.9% 0.7% 3.7% (1.6%) (1.2%)FRESH PRODUCE DEPARTMENT 0.1% 0.1% 6.2% 2.7% 1.8% 13.7% 13.1% 6.6% 9.8% 5.4% (0.7%) 4.4% 2.4% 0.2% 13.4% (1.9%)FRESH MEAT DEPARTMENT 0.0% 0.0% (31.1%) (22.7%) 9.5% (21.9%) (2.3%) (26.6%) (15.9%) (22.1%) (18.9%) (50.4%) (20.3%) (50.7%) (9.4%) 8.1%
% of Sales
% of Vol
Note: Tobacco products fall within Non-Food Grocery Department.
Source: The Nielsen Company, Company data, Credit Suisse estimates

7 February 2017
Drugstore Trend Tracker
10
Figure 15: Industry and Department Sales Mix Summary (Rolling 3 Month Average)3-Month Rolling Period Ending 01/30/16 02/27/16 03/26/16 04/23/16 05/21/16 06/18/16 07/16/16 08/13/16 09/10/16 10/08/16 11/05/16 12/03/16 12/31/16 01/28/17Industry GrowthSales (0.4%) 0.2% 1.3% 0.8% (0.0%) (0.9%) 0.5% 0.8% 0.7% 0.2% (0.1%) (0.7%) (0.8%) (0.4%)Volume (4.5%) (3.6%) (1.5%) (2.6%) (2.9%) (4.7%) (2.0%) (2.0%) (1.9%) (2.5%) (2.6%) (3.2%) (3.1%) (2.9%)Price/Mix 4.0% 3.7% 2.8% 3.4% 2.9% 3.8% 2.6% 2.8% 2.6% 2.7% 2.5% 2.5% 2.3% 2.5%
SalesHEALTH AND BEAUTY AIDS DEPT 53.6% 32.7% 0.2% 0.7% 1.7% 1.7% 0.4% 0.2% 1.0% 1.4% 1.2% 0.6% (0.1%) (0.6%) (0.3%) 0.2%DRY GROCERY DEPARTMENT 18.6% 42.2% 0.4% 0.7% 3.4% 0.9% 0.6% (3.0%) 0.9% 0.9% 1.3% 0.8% 0.5% (1.1%) (1.4%) (1.5%)NON-FOOD GROCERY DEPARTMENT 13.1% 12.3% (3.0%) (1.8%) (1.9%) (2.0%) (2.6%) (2.5%) (1.7%) (0.9%) 0.4% 0.8% 0.8% 0.1% (0.6%) (0.3%)ALCOHOLIC BEVERAGES DEPARTMENT 6.0% 3.1% 1.9% 2.4% 2.6% 2.7% 1.8% 2.7% 3.5% 3.3% 1.2% 0.2% 1.0% 2.0% 1.6% 1.5%GENERAL MERCHANDISE DEPARTMENT 5.4% 4.6% (4.4%) (2.9%) (1.6%) (2.4%) (2.8%) (3.8%) (3.3%) (3.7%) (4.4%) (4.4%) (4.6%) (4.4%) (4.4%) (4.3%)DAIRY DEPARTMENT 1.3% 2.6% (7.4%) (9.6%) (7.2%) (6.7%) (3.7%) (5.5%) (6.1%) (8.2%) (9.8%) (10.0%) (9.4%) (8.7%) (7.8%) (6.5%)FROZEN FOODS DEPARTMENT 1.2% 1.6% 3.4% 4.2% 3.7% 7.0% 7.0% 9.4% 9.8% 10.0% 7.3% 5.8% 4.6% 5.5% 4.7% 5.9%COMBO PACK 0.4% 0.4% 1.7% 2.5% 9.1% 3.7% 3.2% (2.5%) 3.1% 1.7% (0.1%) (0.4%) (3.2%) (5.1%) (7.0%) (4.2%)DELI DEPARTMENT 0.2% 0.2% 3.4% 4.0% 2.2% 1.5% (0.4%) 0.3% 0.9% 1.4% 1.2% 2.0% 1.9% 0.9% (0.3%) (0.3%)PACKAGED MEAT DEPARTMENT 0.1% 0.1% (7.1%) (7.7%) (5.4%) (7.6%) (2.7%) (2.7%) 0.1% (2.8%) (4.9%) (2.8%) (0.4%) (1.1%) (4.2%) (2.9%)FRESH PRODUCE DEPARTMENT 0.1% 0.1% 13.1% 9.8% 9.8% 11.9% 15.8% 19.0% 13.5% 12.5% 8.7% 11.6% 15.1% 17.8% 21.6% 18.3%FRESH MEAT DEPARTMENT 0.0% 0.0% 21.6% 22.0% 5.7% 1.2% (0.3%) 8.4% (0.2%) (3.7%) (3.2%) 3.7% 9.1% 19.5% 17.8% 20.3%
VolumeHEALTH AND BEAUTY AIDS DEPT 53.6% 32.7% (4.3%) (3.6%) (2.3%) (2.0%) (2.8%) (3.2%) (2.0%) (1.6%) (1.5%) (2.0%) (2.7%) (3.5%) (3.3%) (2.9%)DRY GROCERY DEPARTMENT 18.6% 42.2% (3.9%) (3.2%) (0.0%) (2.5%) (2.7%) (6.4%) (1.6%) (1.2%) (0.5%) (1.2%) (1.6%) (2.9%) (3.0%) (2.9%)NON-FOOD GROCERY DEPARTMENT 13.1% 12.3% (7.0%) (4.5%) (4.7%) (4.4%) (5.3%) (4.8%) (4.1%) (4.0%) (1.8%) (1.4%) (1.0%) (2.5%) (3.5%) (3.4%)ALCOHOLIC BEVERAGES DEPARTMENT 6.0% 3.1% 2.1% 3.0% 3.7% 3.9% 3.2% 3.6% 4.2% 3.5% 1.2% 0.2% 1.3% 2.7% 2.5% 2.2%GENERAL MERCHANDISE DEPARTMENT 5.4% 4.6% (9.3%) (7.7%) (4.1%) (4.7%) (3.7%) (5.8%) (6.2%) (10.2%) (14.3%) (16.2%) (14.2%) (10.5%) (6.4%) (5.4%)DAIRY DEPARTMENT 1.3% 2.6% (4.0%) (7.6%) (2.8%) (3.9%) (0.4%) (5.2%) (4.1%) (4.9%) (5.4%) (5.2%) (5.2%) (5.6%) (5.4%) (5.3%)FROZEN FOODS DEPARTMENT 1.2% 1.6% (0.2%) 1.2% 0.4% 1.8% (0.1%) 2.7% 5.3% 7.7% 5.4% 3.8% 2.6% 4.2% 3.7% 4.3%COMBO PACK 0.4% 0.4% (2.0%) (1.5%) 4.4% 1.8% 0.4% (5.0%) (1.1%) (1.0%) (3.2%) (3.2%) (9.0%) (11.1%) (12.9%) (8.3%)DELI DEPARTMENT 0.2% 0.2% 4.4% 6.9% 4.2% 1.4% (2.5%) (0.4%) 1.5% 0.6% (1.9%) (2.2%) (0.9%) (0.9%) (2.3%) (3.0%)PACKAGED MEAT DEPARTMENT 0.1% 0.1% (10.1%) (12.3%) (8.8%) (13.1%) (7.3%) (10.8%) (7.8%) (11.8%) (11.8%) (7.6%) (2.6%) (3.2%) (5.1%) (3.2%)FRESH PRODUCE DEPARTMENT 0.1% 0.1% 9.1% 8.2% 6.3% 5.9% 6.2% 7.9% 3.7% 5.2% 3.8% 8.5% 13.1% 15.5% 16.3% 14.4%FRESH MEAT DEPARTMENT 0.0% 0.0% 39.1% 45.7% 20.4% 12.9% 4.7% 25.3% 14.7% 17.9% 15.7% 34.2% 39.0% 60.0% 44.6% 37.6%
Price/MixHEALTH AND BEAUTY AIDS DEPT 53.6% 32.7% 4.5% 4.3% 4.0% 3.6% 3.2% 3.3% 3.0% 3.0% 2.7% 2.6% 2.7% 2.9% 3.0% 3.1%DRY GROCERY DEPARTMENT 18.6% 42.2% 4.4% 3.9% 3.4% 3.4% 3.3% 3.3% 2.5% 2.1% 1.8% 2.0% 2.1% 1.8% 1.6% 1.4%NON-FOOD GROCERY DEPARTMENT 13.1% 12.3% 4.0% 2.7% 2.8% 2.4% 2.7% 2.3% 2.4% 3.0% 2.2% 2.1% 1.8% 2.6% 2.9% 3.1%ALCOHOLIC BEVERAGES DEPARTMENT 6.0% 3.1% (0.2%) (0.6%) (1.1%) (1.2%) (1.3%) (0.9%) (0.7%) (0.2%) (0.0%) (0.0%) (0.3%) (0.6%) (0.9%) (0.7%)GENERAL MERCHANDISE DEPARTMENT 5.4% 4.6% 4.9% 4.8% 2.5% 2.3% 0.9% 1.9% 2.8% 6.6% 9.9% 11.8% 9.6% 6.1% 2.1% 1.1%DAIRY DEPARTMENT 1.3% 2.6% (3.5%) (2.0%) (4.4%) (2.8%) (3.3%) (0.3%) (2.0%) (3.3%) (4.4%) (4.8%) (4.2%) (3.1%) (2.3%) (1.2%)FROZEN FOODS DEPARTMENT 1.2% 1.6% 3.6% 3.0% 3.3% 5.2% 7.1% 6.7% 4.5% 2.3% 1.9% 2.0% 2.0% 1.3% 1.0% 1.7%COMBO PACK 0.4% 0.4% 3.7% 4.0% 4.7% 1.9% 2.9% 2.5% 4.2% 2.7% 3.1% 2.8% 5.8% 6.0% 5.9% 4.1%DELI DEPARTMENT 0.2% 0.2% (1.1%) (2.9%) (2.0%) 0.1% 2.1% 0.7% (0.6%) 0.8% 3.2% 4.1% 2.8% 1.8% 1.9% 2.7%PACKAGED MEAT DEPARTMENT 0.1% 0.1% 3.0% 4.6% 3.3% 5.6% 4.5% 8.1% 8.0% 9.1% 6.9% 4.8% 2.2% 2.1% 0.9% 0.3%FRESH PRODUCE DEPARTMENT 0.1% 0.1% 4.0% 1.5% 3.6% 6.1% 9.5% 11.1% 9.8% 7.2% 4.8% 3.0% 2.0% 2.3% 5.3% 3.9%FRESH MEAT DEPARTMENT 0.0% 0.0% (17.6%) (23.8%) (14.8%) (11.7%) (4.9%) (17.0%) (15.0%) (21.5%) (19.0%) (30.5%) (29.9%) (40.5%) (26.8%) (17.3%)
% of Sales
% of Vol
Note: Tobacco products fall within Non-Food Grocery Department.
Source: The Nielsen Company, Company data, Credit Suisse estimates
7 February 2017
Drugstore Trend Tracker 11
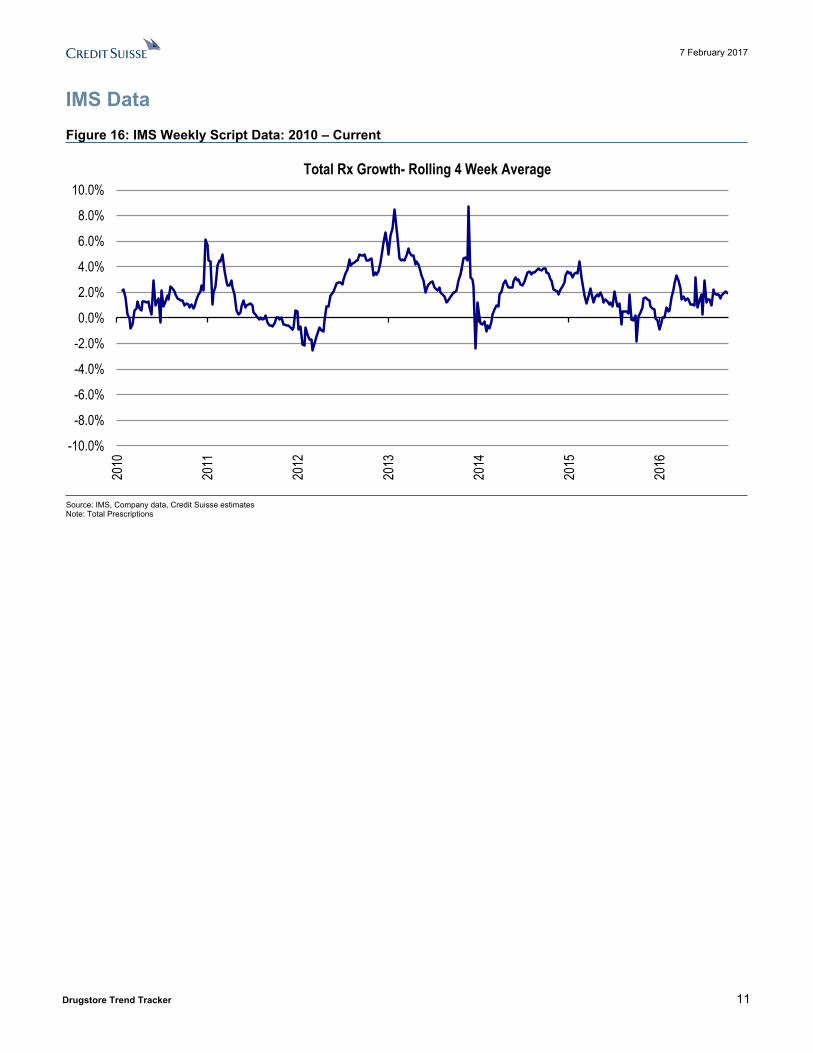
IMS DataFigure 16: IMS Weekly Script Data: 2010 – Current
-10.0%
-8.0%
-6.0%
-4.0%
-2.0%
0.0%
2.0%
4.0%
6.0%
8.0%
10.0%
2010
2011
2012
2013
2014
2015
2016
Total Rx Growth- Rolling 4 Week Average
Source: IMS, Company data, Credit Suisse estimatesNote: Total Prescriptions
7 February 2017
Drugstore Trend Tracker 12
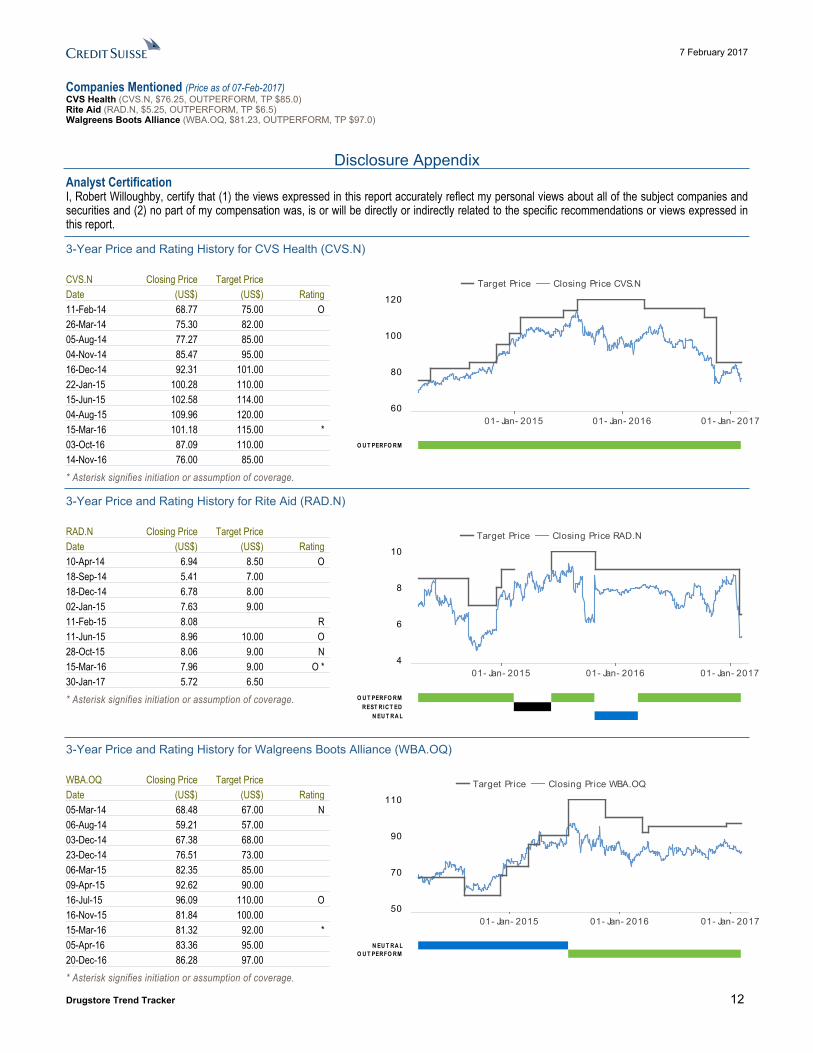
Companies Mentioned (Price as of 07-Feb-2017)CVS Health (CVS.N, $76.25, OUTPERFORM, TP $85.0)Rite Aid (RAD.N, $5.25, OUTPERFORM, TP $6.5)Walgreens Boots Alliance (WBA.OQ, $81.23, OUTPERFORM, TP $97.0)
Disclosure AppendixAnalyst Certification I, Robert Willoughby, certify that (1) the views expressed in this report accurately reflect my personal views about all of the subject companies and securities and (2) no part of my compensation was, is or will be directly or indirectly related to the specific recommendations or views expressed in this report.
3-Year Price and Rating History for CVS Health (CVS.N)
CVS.N Closing Price Target Price Date (US$) (US$) Rating 11-Feb-14 68.77 75.00 O 26-Mar-14 75.30 82.00 05-Aug-14 77.27 85.00 04-Nov-14 85.47 95.00 16-Dec-14 92.31 101.00 22-Jan-15 100.28 110.00 15-Jun-15 102.58 114.00 04-Aug-15 109.96 120.00 15-Mar-16 101.18 115.00 * 03-Oct-16 87.09 110.00 14-Nov-16 76.00 85.00 * Asterisk signifies initiation or assumption of coverage.
Target Price Closing Price CVS.N
01- Jan- 2015 01- Jan- 2016 01- Jan- 201760
80
100
120
O U T PERFO RM
3-Year Price and Rating History for Rite Aid (RAD.N)
RAD.N Closing Price Target Price Date (US$) (US$) Rating 10-Apr-14 6.94 8.50 O 18-Sep-14 5.41 7.00 18-Dec-14 6.78 8.00 02-Jan-15 7.63 9.00 11-Feb-15 8.08 R 11-Jun-15 8.96 10.00 O 28-Oct-15 8.06 9.00 N 15-Mar-16 7.96 9.00 O * 30-Jan-17 5.72 6.50 * Asterisk signifies initiation or assumption of coverage.
Target Price Closing Price RAD.N
01- Jan- 2015 01- Jan- 2016 01- Jan- 20174
6
8
10
O U T PERFO RMREST RIC T ED
N EU T RA L
3-Year Price and Rating History for Walgreens Boots Alliance (WBA.OQ)
WBA.OQ Closing Price Target Price Date (US$) (US$) Rating 05-Mar-14 68.48 67.00 N 06-Aug-14 59.21 57.00 03-Dec-14 67.38 68.00 23-Dec-14 76.51 73.00 06-Mar-15 82.35 85.00 09-Apr-15 92.62 90.00 16-Jul-15 96.09 110.00 O 16-Nov-15 81.84 100.00 15-Mar-16 81.32 92.00 * 05-Apr-16 83.36 95.00 20-Dec-16 86.28 97.00 * Asterisk signifies initiation or assumption of coverage.
Target Price Closing Price WBA.OQ
01- Jan- 2015 01- Jan- 2016 01- Jan- 201750
70
90
110
N EU T RA LO U T PERFO RM
7 February 2017
Drugstore Trend Tracker 13
The analyst(s) responsible for preparing this research report received Compensation that is based upon various factors including Credit Suisse's total revenues, a portion of which are generated by Credit Suisse's investment banking activitiesAs of December 10, 2012 Analysts’ stock rating are defined as follows:Outperform (O) : The stock’s total return is expected to outperform the relevant benchmark* over the next 12 months.Neutral (N) : The stock’s total return is expected to be in line with the relevant benchmark* over the next 12 months.Underperform (U) : The stock’s total return is expected to underperform the relevant benchmark* over the next 12 months. *Relevant benchmark by region: As of 10th December 2012, Japanese ratings are based on a stock’s total return relative to the analyst's coverage universe which consists of all companies covered by the analyst within the relevant sector, with Outperforms representing the most attractive, Neutrals the less attractive, and Underperforms the least attractive investment opportunities. As of 2nd October 2012, U.S. and Canadian as well as European ratings are based on a stock’s total return relative to the analyst's coverage universe which consists of all companies covered by the analyst within the relevant sector, with Outperforms representing the most attractive, Neutrals the less attractive, and Underperforms the least attractive investment opportunities. For Latin American and non-Japan Asia stocks, ratings are based on a stock’s total return relative to the average total return of the relevant country or regional benchmark; prior to 2nd October 2012 U.S. and Canadian ratings were based on (1) a stock’s absolute total return potential to its current share price and (2) the relative attractiveness of a stock’s total return potential within an analyst’s coverage universe. For Australian and New Zealand stocks, the expected total return (ETR) calculation includes 12-month rolling dividend yield. An Outperform rating is assigned where an ETR is greater than or equal to 7.5%; Underperform where an ETR less than or equal to 5%. A Neutral may be assigned where the ETR is between -5% and 15%. The overlapping rating range allows analysts to assign a rating that puts ETR in the context of associated risks. Prior to 18 May 2015, ETR ranges for Outperform and Underperform ratings did not overlap with Neutral thresholds between 15% and 7.5%, which was in operation from 7 July 2011.Restricted (R) : In certain circumstances, Credit Suisse policy and/or applicable law and regulations preclude certain types of communications, including an investment recommendation, during the course of Credit Suisse's engagement in an investment banking transaction and in certain other circumstances.Not Rated (NR) : Credit Suisse Equity Research does not have an investment rating or view on the stock or any other securities related to the company at this time.Not Covered (NC) : Credit Suisse Equity Research does not provide ongoing coverage of the company or offer an investment rating or investment view on the equity security of the company or related products.Volatility Indicator [V] : A stock is defined as volatile if the stock price has moved up or down by 20% or more in a month in at least 8 of the past 24 months or the analyst expects significant volatility going forward.Analysts’ sector weightings are distinct from analysts’ stock ratings and are based on the analyst’s expectations for the fundamentals and/or valuation of the sector* relative to the group’s historic fundamentals and/or valuation:Overweight : The analyst’s expectation for the sector’s fundamentals and/or valuation is favorable over the next 12 months.Market Weight : The analyst’s expectation for the sector’s fundamentals and/or valuation is neutral over the next 12 months.Underweight : The analyst’s expectation for the sector’s fundamentals and/or valuation is cautious over the next 12 months. *An analyst’s coverage sector consists of all companies covered by the analyst within the relevant sector. An analyst may cover multiple sectors.
Credit Suisse's distribution of stock ratings (and banking clients) is:
Global Ratings DistributionRating Versus universe (%) Of which banking clients (%)Outperform/Buy* 45% (64% banking clients)Neutral/Hold* 38% (60% banking clients)Underperform/Sell* 15% (53% banking clients)Restricted 2%*For purposes of the NYSE and NASD ratings distribution disclosure requirements, our stock ratings of Outperform, Neutral, and Underperform most closely correspond to Buy, Hold, and Sell, respectively; however, the meanings are not the same, as our stock ratings are determined on a relative basis. (Please refer to definitions above.) An investor's decision to buy or sell a security should be based on investment objectives, current holdings, and other individual factors.
Important Global Disclosures Credit Suisse’s research reports are made available to clients through our proprietary research portal on CS PLUS. Credit Suisse research products may also be made available through third-party vendors or alternate electronic means as a convenience. Certain research products are only made available through CS PLUS. The services provided by Credit Suisse’s analysts to clients may depend on a specific client’s preferences regarding the frequency and manner of receiving communications, the client’s risk profile and investment, the size and scope of the overall client relationship with the Firm, as well as legal and regulatory constraints. To access all of Credit Suisse’s research that you are entitled to receive in the most timely manner, please contact your sales representative or go to https://plus.credit-suisse.com . Credit Suisse’s policy is to update research reports as it deems appropriate, based on developments with the subject company, the sector or the market that may have a material impact on the research views or opinions stated herein.Credit Suisse's policy is only to publish investment research that is impartial, independent, clear, fair and not misleading. For more detail please refer to Credit Suisse's Policies for Managing Conflicts of Interest in connection with Investment Research: https://www.credit-suisse.com/sites/disclaimers-ib/en/managing-conflicts.html . Credit Suisse does not provide any tax advice. Any statement herein regarding any US federal tax is not intended or written to be used, and cannot be used, by any taxpayer for the purposes of avoiding any penalties.
Target Price and RatingValuation Methodology and Risks: (12 months) for CVS Health (CVS.N)
Method: Our CVS Outperform rating and $85 target price is based on an EV/EBITDA valuation methodology. Our target assumes that shares can trade at 9.1x our CY 2017 EBITDA estimate of $12.7 billion, as its differentiated model remains well-positioned to drive sustainable share gains and the stock provides one of the more attractive growth profiles relative to valuation in our coverage. Our estimate factors in the
7 February 2017
Drugstore Trend Tracker 14
acquisiton of the Target pharmacies and new store locations, as well as near -term restricted network headwinds, and high single-digit growth for the Pharmacy Services segment. Share repurchases have the opportunity to add meaningfully to EPS growth.
Risk: Risks to our CVS Outperform rating and $85 target price include: 1) a continued transition to more restricted pharmacy networks excluding CVS locations, 2) continued consolidation in the managed care space including Aetna's planned $37B acquisition of Humana, 3) Percieved competitive threat if ESRX were to merge with WBA, and 4) Increased competition in the front-end & greater drug pricing transparency/control.
Target Price and RatingValuation Methodology and Risks: (12 months) for Rite Aid (RAD.N)
Method: Rite Aid's target price of $6.50 is based on ~11.5x our C17 EBITDA estimate and is the low end of the proposed price range for the acquisition by WBA. Due to the spread between the deal price and RAD's current trading price we believe an Outperform rating for RAD is justified. The stock has essentially become an arb play, in our view, as opposed to a fundamental story.
Risk: We believe the biggest risks to our $6.50 target price and Outperform rating for RAD are the risk to the closure of the deal and potential FTC anti-trust ruling.
Target Price and RatingValuation Methodology and Risks: (12 months) for Walgreens Boots Alliance (WBA.OQ)
Method: Our $97 target price for Walgreens Boots Alliance embeds a ~11.6x EV/EBITDA multiple on F17 EBITDA, which is slightly higher than its peers but not fully reflective of value added by recently announced M&A and potential future deals. We rate WBA Outperform, as we view RAD as a strategically compelling deal and see further opportunity for the company to strengthen its competitive position through M&A.
Risk: Risks to our $97 target price and Outperform rating for WBA include weaker than expected synergies from the Alliance Boots acquisition, disappointments in cost cutting initiatives, and FTC risk associated with the announced RAD deal. Further downside risk comes from pharmacy reimbursement pressure, front-end competitive pressure, and decisions around future capital allocation.
Please refer to the firm's disclosure website at https://rave.credit-suisse.com/disclosures for the definitions of abbreviations typically used in the target price method and risk sections. See the Companies Mentioned section for full company names The subject company (WBA.OQ) currently is, or was during the 12-month period preceding the date of distribution of this report, a client of Credit Suisse.Credit Suisse expects to receive or intends to seek investment banking related compensation from the subject company (CVS.N, RAD.N, WBA.OQ) within the next 3 months.As of the date of this report, an analyst involved in the preparation of this report has the following material conflict of interest with the subject company (CVS.N). TrainingFor date and time of production, dissemination and history of recommendation for the subject company(ies) featured in this report, disseminated within the past 12 months, please refer to the link: https://rave.credit-suisse.com/disclosures/view/report?i=283008&v=-flftjeq5mkcev7ay6cjvvg64 . Important Regional Disclosures Singapore recipients should contact Credit Suisse AG, Singapore Branch for any matters arising from this research report.The analyst(s) involved in the preparation of this report may participate in events hosted by the subject company, including site visits. Credit Suisse does not accept or permit analysts to accept payment or reimbursement for travel expenses associated with these events.Restrictions on certain Canadian securities are indicated by the following abbreviations: NVS--Non-Voting shares; RVS--Restricted Voting Shares; SVS--Subordinate Voting Shares.Individuals receiving this report from a Canadian investment dealer that is not affiliated with Credit Suisse should be advised that this report may not contain regulatory disclosures the non-affiliated Canadian investment dealer would be required to make if this were its own report.For Credit Suisse Securities (Canada), Inc.'s policies and procedures regarding the dissemination of equity research, please visit https://www.credit-suisse.com/sites/disclaimers-ib/en/canada-research-policy.html.An analyst involved in the preparation of this report received third party benefits in connection with this research report from the subject company (CVS.N)Credit Suisse has acted as lead manager or syndicate member in a public offering of securities for the subject company (RAD.N) within the past 3 years.Principal is not guaranteed in the case of equities because equity prices are variable.Commission is the commission rate or the amount agreed with a customer when setting up an account or at any time after that.This research report is authored by:Credit Suisse Securities (USA) LLC ...............Robert Willoughby ; Edward J. Kelly, CFA, CPA ; Stephanie Chang, CFA ; Anthony Bonadio, CFAFor Credit Suisse disclosure information on other companies mentioned in this report, please visit the website at https://rave.credit-suisse.com/disclosures or call +1 (877) 291-2683.
7 February 2017
Drugstore Trend Tracker 15
This report is produced by subsidiaries and affiliates of Credit Suisse operating under its Global Markets Division. For more information on our structure, please use the following link: https://www.credit-suisse.com/who-we-are This report may contain material that is not directed to, or intended for distribution to or use by, any person or entity who is a citizen or resident of or located in any locality, state, country or other jurisdiction where such distribution, publication, availability or use would be contrary to law or regulation or which would subject Credit Suisse or its affiliates ("CS") to any registration or licensing requirement within such jurisdiction. All material presented in this report, unless specifically indicated otherwise, is under copyright to CS. None of the material, nor its content, nor any copy of it, may be altered in any way, transmitted to, copied or distributed to any other party, without the prior express written permission of CS. All trademarks, service marks and logos used in this report are trademarks or service marks or registered trademarks or service marks of CS or its affiliates.The information, tools and material presented in this report are provided to you for information purposes only and are not to be used or considered as an offer or the solicitation of an offer to sell or to buy or subscribe for securities or other financial instruments. CS may not have taken any steps to ensure that the securities referred to in this report are suitable for any particular investor. CS will not treat recipients of this report as its customers by virtue of their receiving this report. The investments and services contained or referred to in this report may not be suitable for you and it is recommended that you consult an independent investment advisor if you are in doubt about such investments or investment services. Nothing in this report constitutes investment, legal, accounting or tax advice, or a representation that any investment or strategy is suitable or appropriate to your individual circumstances, or otherwise constitutes a personal recommendation to you. CS does not advise on the tax consequences of investments and you are advised to contact an independent tax adviser. Please note in particular that the bases and levels of taxation may change. Information and opinions presented in this report have been obtained or derived from sources believed by CS to be reliable, but CS makes no representation as to their accuracy or completeness. CS accepts no liability for loss arising from the use of the material presented in this report, except that this exclusion of liability does not apply to the extent that such liability arises under specific statutes or regulations applicable to CS. This report is not to be relied upon in substitution for the exercise of independent judgment. CS may have issued, and may in the future issue, other communications that are inconsistent with, and reach different conclusions from, the information presented in this report. Those communications reflect the different assumptions, views and analytical methods of the analysts who prepared them and CS is under no obligation to ensure that such other communications are brought to the attention of any recipient of this report. Some investments referred to in this report will be offered solely by a single entity and in the case of some investments solely by CS, or an associate of CS or CS may be the only market maker in such investments. Past performance should not be taken as an indication or guarantee of future performance, and no representation or warranty, express or implied, is made regarding future performance. Information, opinions and estimates contained in this report reflect a judgment at its original date of publication by CS and are subject to change without notice. The price, value of and income from any of the securities or financial instruments mentioned in this report can fall as well as rise. The value of securities and financial instruments is subject to exchange rate fluctuation that may have a positive or adverse effect on the price or income of such securities or financial instruments. Investors in securities such as ADR's, the values of which are influenced by currency volatility, effectively assume this risk. Structured securities are complex instruments, typically involve a high degree of risk and are intended for sale only to sophisticated investors who are capable of understanding and assuming the risks involved. The market value of any structured security may be affected by changes in economic, financial and political factors (including, but not limited to, spot and forward interest and exchange rates), time to maturity, market conditions and volatility, and the credit quality of any issuer or reference issuer. Any investor interested in purchasing a structured product should conduct their own investigation and analysis of the product and consult with their own professional advisers as to the risks involved in making such a purchase. Some investments discussed in this report may have a high level of volatility. High volatility investments may experience sudden and large falls in their value causing losses when that investment is realised. Those losses may equal your original investment. Indeed, in the case of some investments the potential losses may exceed the amount of initial investment and, in such circumstances, you may be required to pay more money to support those losses. Income yields from investments may fluctuate and, in consequence, initial capital paid to make the investment may be used as part of that income yield. Some investments may not be readily realisable and it may be difficult to sell or realise those investments, similarly it may prove difficult for you to obtain reliable information about the value, or risks, to which such an investment is exposed. This report may provide the addresses of, or contain hyperlinks to, websites. Except to the extent to which the report refers to website material of CS, CS has not reviewed any such site and takes no responsibility for the content contained therein. Such address or hyperlink (including addresses or hyperlinks to CS's own website material) is provided solely for your convenience and information and the content of any such website does not in any way form part of this document. Accessing such website or following such link through this report or CS's website shall be at your own risk.
This report is issued and distributed in European Union (except Switzerland): by Credit Suisse Securities (Europe) Limited, One Cabot Square, London E14 4QJ, England, which is authorised by the Prudential Regulation Authority and regulated by the Financial Conduct Authority and the Prudential Regulation Authority. Germany: Credit Suisse Securities (Europe) Limited Niederlassung Frankfurt am Main regulated by the Bundesanstalt fuer Finanzdienstleistungsaufsicht ("BaFin"). United States and Canada: Credit Suisse Securities (USA) LLC; Switzerland: Credit Suisse AG; Brazil: Banco de Investimentos Credit Suisse (Brasil) S.A or its affiliates; Mexico: Banco Credit Suisse (México), S.A. (transactions related to the securities mentioned in this report will only be effected in compliance with applicable regulation); Japan: by Credit Suisse Securities (Japan) Limited, Financial Instruments Firm, Director-General of Kanto Local Finance Bureau ( Kinsho) No. 66, a member of Japan Securities Dealers Association, The Financial Futures Association of Japan, Japan Investment Advisers Association, Type II Financial Instruments Firms Association; Hong Kong: Credit Suisse (Hong Kong) Limited; Australia: Credit Suisse Equities (Australia) Limited; Thailand: Credit Suisse Securities (Thailand) Limited, regulated by the Office of the Securities and Exchange Commission, Thailand, having registered address at 990 Abdulrahim Place, 27th Floor, Unit 2701, Rama IV Road, Silom, Bangrak, Bangkok10500, Thailand, Tel. +66 2614 6000; Malaysia: Credit Suisse Securities (Malaysia) Sdn Bhd; Singapore: Credit Suisse AG, Singapore Branch; India: Credit Suisse Securities (India) Private Limited (CIN no.U67120MH1996PTC104392) regulated by the Securities and Exchange Board of India as Research Analyst (registration no. INH 000001030) and as Stock Broker (registration no. INB230970637; INF230970637; INB010970631; INF010970631), having registered address at 9th Floor, Ceejay House, Dr.A.B. Road, Worli, Mumbai - 18, India, T- +91-22 6777 3777; South Korea: Credit Suisse Securities (Europe) Limited, Seoul Branch; Taiwan: Credit Suisse AG Taipei Securities Branch; Indonesia: PT Credit Suisse Securities Indonesia; Philippines:Credit Suisse Securities (Philippines ) Inc., and elsewhere in the world by the relevant authorised affiliate of the above.Additional Regional DisclaimersHong Kong: Credit Suisse (Hong Kong) Limited ("CSHK") is licensed and regulated by the Securities and Futures Commission of Hong Kong under the laws of Hong Kong, which differ from Australian laws. CSHKL does not hold an Australian financial services licence (AFSL) and is exempt from the requirement to hold an AFSL under the Corporations Act 2001 (the Act) under Class Order 03/1103 published by the ASIC in respect of financial services provided to Australian wholesale clients (within the meaning of section 761G of the Act). Research on Taiwanese securities produced by Credit Suisse AG, Taipei Securities Branch has been prepared by a registered Senior Business Person. Australia (to the extent services are offered in Australia): Credit Suisse Securities (Europe) Limited (“CSSEL”) and Credit Suisse International (“CSI”) are authorised by the Prudential Regulation Authority and regulated by the Financial Conduct Authority (“FCA”) and the Prudential Regulation Authority under UK laws, which differ from Australian Laws. CSSEL and CSI do not hold an Australian Financial Services Licence (“AFSL”) and are exempt from the requirement to hold an AFSL under the Corporations Act (Cth) 2001 (“Corporations Act”) under Class Order 03/1099 published by the Australian Securities and Investments Commission (“ASIC”), in respect of the financial services provided to Australian wholesale clients (within the meaning of section 761G of the Corporations Act). This material is not for distribution to retail clients and is directed exclusively at Credit Suisse's professional clients and eligible counterparties as defined by the FCA, and wholesale clients as defined under section 761G of the Corporations Act. Credit Suisse (Hong Kong) Limited (“CSHK”) is licensed and regulated by the Securities and Futures Commission of Hong Kong under the laws of Hong Kong, which differ from Australian laws. CSHKL does not hold an AFSL and is exempt from the requirement to hold an AFSL under the Corporations Act under Class Order 03/1103 published by the ASIC in respect of financial services provided to Australian wholesale clients (within the meaning of section 761G of the Corporations Act). Credit Suisse Securities (USA) LLC (CSSU) and Credit Suisse Asset Management LLC (CSAM LLC) are licensed and regulated by the Securities Exchange Commission of the United States under the laws of the United States, which differ from Australian laws. CSSU and CSAM LLC do not hold an AFSL and is exempt from the requirement to hold an AFSL under the Corporations Act under Class Order 03/1100 published by the ASIC in respect of financial services provided to Australian wholesale clients (within the meaning of section 761G of the Corporations Act). Malaysia: Research provided to residents of Malaysia is authorised by the Head of Research for Credit Suisse Securities (Malaysia) Sdn Bhd, to whom they should direct any queries on +603 2723 2020. Singapore: This report has been prepared and issued for distribution in Singapore to institutional investors, accredited investors and expert investors (each as defined under the Financial Advisers Regulations) only, and is also distributed by Credit Suisse AG, Singapore Branch to overseas investors (as defined under the Financial Advisers Regulations). Credit Suisse AG, Singapore Branch may distribute reports produced by its foreign entities or affiliates pursuant to an arrangement under Regulation 32C of the Financial Advisers Regulations. Singapore recipients should contact Credit Suisse AG, Singapore Branch at +65-6212-2000 for matters arising from, or in connection with, this report. By virtue of your status as an institutional investor, accredited investor, expert investor or overseas investor, Credit Suisse AG, Singapore Branch is exempted from complying with certain compliance requirements under the Financial Advisers Act, Chapter 110 of Singapore (the “FAA”), the Financial Advisers Regulations and the relevant Notices and Guidelines issued thereunder, in respect of any financial advisory service which Credit Suisse AG, Singapore Branch may provide to you. UAE: This information is being distributed by Credit Suisse AG (DIFC Branch), duly licensed and regulated by the Dubai Financial Services Authority (“DFSA”). Related financial services or products are only made available to Professional Clients or Market Counterparties, as defined by the DFSA, and are not intended for any other persons. Credit Suisse AG (DIFC Branch) is located on Level 9 East, The Gate Building, DIFC, Dubai, United Arab Emirates. EU: This report has been produced by subsidiaries and affiliates of Credit Suisse operating under its Global Markets Division This research may not conform to Canadian disclosure requirements. In jurisdictions where CS is not already registered or licensed to trade in securities, transactions will only be effected in accordance with applicable securities legislation, which will vary from jurisdiction to jurisdiction and may require that the trade be made in accordance with applicable exemptions from registration or licensing requirements. Non-US customers wishing to effect a transaction should contact a CS entity in their local jurisdiction unless governing law permits otherwise. US customers wishing to effect a transaction should do so only by contacting a representative at Credit Suisse Securities (USA) LLC in the US. Please note that this research was originally prepared and issued by CS for distribution to their market professional and institutional investor customers. Recipients who are not market professional or institutional investor customers of CS should seek the advice of their independent financial advisor prior to taking any investment decision based on this report or for any necessary explanation of its contents. This research may relate to investments or services of a person outside of the UK or to other matters which are not authorised by the Prudential Regulation Authority and regulated by the Financial Conduct Authority and the Prudential Regulation Authority or in respect of which the protections of the Prudential Regulation Authority and Financial Conduct Authority for private customers and/or the UK compensation scheme may not be available, and further details as to where this may be the case are available upon request in respect of this report. CS may provide various services to US municipal entities or obligated persons ("municipalities"), including suggesting individual transactions or trades and entering into such transactions. Any services CS provides to municipalities are not viewed as "advice" within the meaning of Section 975 of the Dodd-Frank Wall Street Reform and Consumer Protection Act. CS is providing any such services and related information solely on an arm's length basis and not as an advisor or fiduciary to the municipality. In connection with the provision of the any such services, there is no agreement, direct or indirect, between any municipality (including the officials,management, employees or agents thereof) and CS for CS to provide advice to the municipality. Municipalities should consult with their financial, accounting and legal advisors regarding any such services provided by CS. In addition, CS is not acting for direct or indirect compensation to solicit the municipality on behalf of an unaffiliated broker, dealer, municipal securities dealer, municipal advisor, or investment adviser for the purpose of obtaining or retaining an engagement by the municipality for or in connection with Municipal Financial Products, the issuance of municipal securities, or of an investment adviser to provide investment advisory services to or on behalf of the municipality. If this report is being distributed by a financial institution other than Credit Suisse AG, or its affiliates, that financial institution is solely responsible for distribution. Clients of that institution should contact that institution to effect a transaction in the securities mentioned in this report or require further information. This report does not constitute investment advice by Credit Suisse to the clients of the distributing financial institution, and neither Credit Suisse AG, its affiliates, and their respective officers, directors and employees accept any liability whatsoever for any direct or consequential loss arising from their use of this report or its content. Principal is not guaranteed. Commission is the commission rate or the amount agreed with a customer when setting up an account or at any time after that. Copyright © 2017 CREDIT SUISSE AG and/or its affiliates. All rights reserved. Investment principal on bonds can be eroded depending on sale price or market price. In addition, there are bonds on which investment principal can be eroded due to changes in redemption amounts. Care is required when investing in such instruments. When you purchase non-listed Japanese fixed income securities (Japanese government bonds, Japanese municipal bonds, Japanese government guaranteed bonds, Japanese corporate bonds) from CS as a seller, you will be requested to pay the purchase price only.