Soft Soil Impact Testing and Simulation of Aerospace … Soil Impact Testing and Simulation of...
14
Soft Soil Impact Testing and Simulation of Aerospace Structures Edwin L. Fasanella Karen E. Jackson Sotiris Kellas [email protected] [email protected] [email protected] Mail Stop 495 NASA Langley Research Center Hampton, VA 23681 Abstract In June 2007, a 38-ft/s vertical drop test of a 5-ft-diameter, 5-ft-long composite fuselage section that was retrofitted with a novel composite honeycomb Deployable Energy Absorber (DEA) was conducted onto unpacked sand. This test was one of a series of tests to evaluate the multi-terrain capabilities of the DEA and to generate test data for model validation. During the test, the DEA crushed approximately 6-in. and left craters in the sand of depths ranging from 7.5- to 9-in. A finite element model of the fuselage section with DEA was developed for execution in LS- DYNA, a commercial nonlinear explicit transient dynamic code. Pre-test predictions were generated in which the sand was represented initially as a crushable foam material MAT_CRUSHABLE_FOAM (Mat 63). Following the drop test, a series of hemispherical penetrometer tests were conducted to assist in soil characterization. The penetrometer weighed 20-lb and was instrumented with a tri-axial accelerometer. Drop tests were performed at 16-ft/s and crater depths were measured. The penetrometer drop tests were simulated as a means for developing a more representative soil model based on a soil and foam material definition MAT_SOIL_AND FOAM (Mat 5) in LS-DYNA. The model of the fuselage with DEA was re- executed using the updated soil model and test-analysis correlations are presented. Introduction Impact testing and simulation to evaluate the multi-terrain dynamic response of airframe structures is an important research area. Accident data indicate that more than 80% of helicopter crashes occur on surfaces such as water, soft soil, plowed or grassy fields, and shallow swamps, as opposed to smooth prepared surfaces. Also, studies have shown that helicopters designed for crash resistance onto hard surfaces do not perform well during impacts into water or soft soils. Since its inception in 2006, the NASA Subsonic Rotary Wing (SRW) Aeronautics Program in Rotorcraft Crashworthiness has focused attention on two main areas of research: development of an externally deployable energy absorbing concept and improved prediction of rotorcraft crashworthiness [1]. The deployable energy absorber (DEA) being developed [2, 3] is a composite honeycomb structure that can be deployed to provide energy attenuation, much like an external airbag system. Several research topics have been identified to achieve improved prediction of rotorcraft crashworthiness, including multi-terrain impact testing and simulation onto hard prepared surfaces [2], water [4], and soil. This paper will present results of impact testing and LS-DYNA simulation of a vertical drop test onto soft soil of a 5-ft diameter composite fuselage section that was retrofitted with a DEA concept. A finite element model of the test article was developed and executed in LS-DYNA [5] and analytical predictions were https://ntrs.nasa.gov/search.jsp?R=20080022954 2018-06-23T04:56:43+00:00Z
Transcript of Soft Soil Impact Testing and Simulation of Aerospace … Soil Impact Testing and Simulation of...
Soft Soil Impact Testing and Simulation of Aerospace Structures Edwin L. Fasanella Karen E. Jackson Sotiris Kellas [email protected] [email protected] [email protected]
Mail Stop 495 NASA Langley Research Center
Hampton, VA 23681
Abstract In June 2007, a 38-ft/s vertical drop test of a 5-ft-diameter, 5-ft-long composite fuselage section that was retrofitted with a novel composite honeycomb Deployable Energy Absorber (DEA) was conducted onto unpacked sand. This test was one of a series of tests to evaluate the multi-terrain capabilities of the DEA and to generate test data for model validation. During the test, the DEA crushed approximately 6-in. and left craters in the sand of depths ranging from 7.5- to 9-in. A finite element model of the fuselage section with DEA was developed for execution in LS-DYNA, a commercial nonlinear explicit transient dynamic code. Pre-test predictions were generated in which the sand was represented initially as a crushable foam material MAT_CRUSHABLE_FOAM (Mat 63). Following the drop test, a series of hemispherical penetrometer tests were conducted to assist in soil characterization. The penetrometer weighed 20-lb and was instrumented with a tri-axial accelerometer. Drop tests were performed at 16-ft/s and crater depths were measured. The penetrometer drop tests were simulated as a means for developing a more representative soil model based on a soil and foam material definition MAT_SOIL_AND FOAM (Mat 5) in LS-DYNA. The model of the fuselage with DEA was re-executed using the updated soil model and test-analysis correlations are presented. Introduction Impact testing and simulation to evaluate the multi-terrain dynamic response of airframe structures is an important research area. Accident data indicate that more than 80% of helicopter crashes occur on surfaces such as water, soft soil, plowed or grassy fields, and shallow swamps, as opposed to smooth prepared surfaces. Also, studies have shown that helicopters designed for crash resistance onto hard surfaces do not perform well during impacts into water or soft soils. Since its inception in 2006, the NASA Subsonic Rotary Wing (SRW) Aeronautics Program in Rotorcraft Crashworthiness has focused attention on two main areas of research: development of an externally deployable energy absorbing concept and improved prediction of rotorcraft crashworthiness [1]. The deployable energy absorber (DEA) being developed [2, 3] is a composite honeycomb structure that can be deployed to provide energy attenuation, much like an external airbag system. Several research topics have been identified to achieve improved prediction of rotorcraft crashworthiness, including multi-terrain impact testing and simulation onto hard prepared surfaces [2], water [4], and soil. This paper will present results of impact testing and LS-DYNA simulation of a vertical drop test onto soft soil of a 5-ft diameter composite fuselage section that was retrofitted with a DEA concept. A finite element model of the test article was developed and executed in LS-DYNA [5] and analytical predictions were
https://ntrs.nasa.gov/search.jsp?R=20080022954 2018-06-23T04:56:43+00:00Z
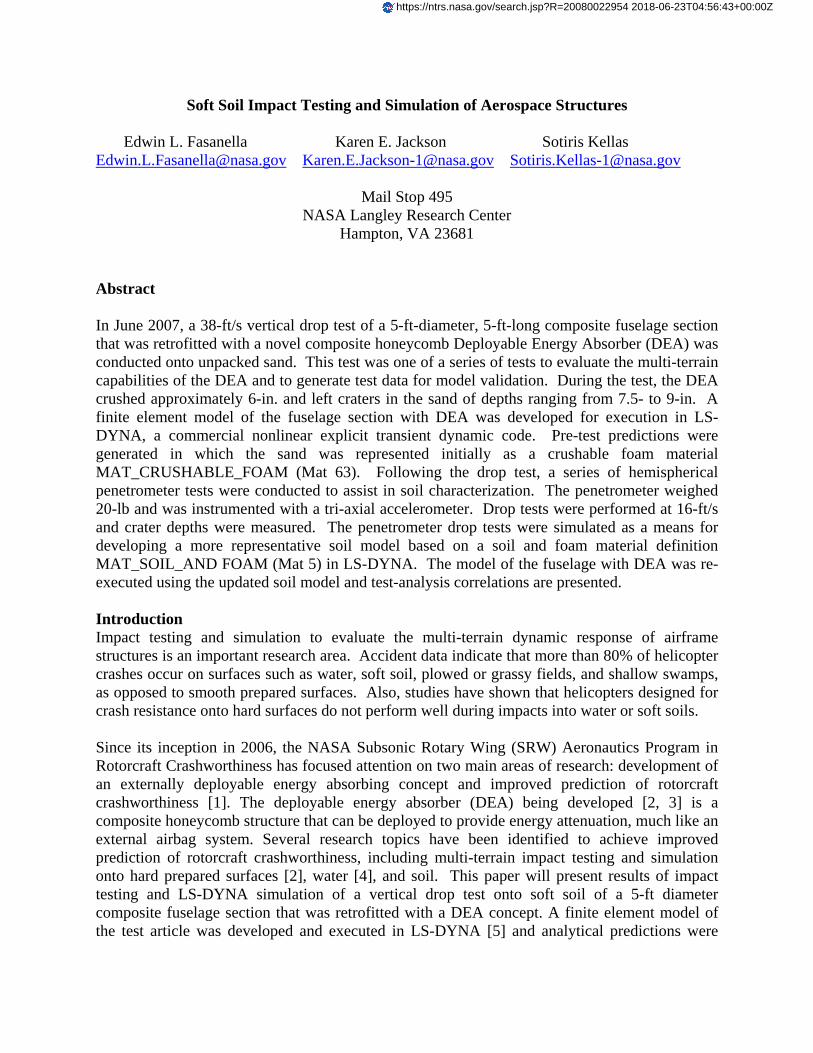
correlated with test data. The level of agreement is dependent on accurately modeling the behavior of the soil, which will be addressed in detail in this paper. A variety of factors contribute to the variability of soils, especially for dynamic impacts. The microstructure of the soil, the grain size of the soil, and the void between particles or grains can be very important. In addition, the same soil can behave quite differently for dynamic impacts depending on the moisture content. The pores between the grains can be filled with either highly compressible air or with water. The modeling of the air and moisture pore pressure was not attempted. There are cases for dynamic loading in which the media within the pores will carry the majority of the load. The strength of coarse soil-materials, such as gravel, depends highly upon gravitational effects, and the materials essentially have no inherent constitutive law. For small particle size soils, such as clays, constitutive equations do apply, and cohesion can be important. Sand has no tensile strength when dry, but wet sand does have some tensile strength due to cohesion. In the following sections of the paper, the fuselage section drop test, the DEA concept, and the finite element model development are described and pre-test predictions are correlated with test data. In the pre-test model, the sand was represented as a crushable foam using MAT_CRUSHABLE_FOAM (Mat 63) in LS-DYNA [6]. Next, penetrometer drop tests and corresponding LS-DYNA simulations are presented as part of the development of a simple, robust soil material model MAT_SOIL_AND_FOAM (Mat 5). Finally, the paper will describe the Mat 5 soil model, discuss test procedures required to generate input for the material model, and show post-test model predictions correlated with test data for the fuselage section drop test. Fuselage Section Drop Test Into Sand and LS-DYNA Simulation A 38-ft/s vertical drop test was conducted of a 5-ft-diameter, 5-ft-long composite fuselage section retrofitted with four blocks of DEA into sand. Prior to the test, ten 100-lb lead blocks were attached to the floor of the fuselage section through standard seat rails, five blocks per side. The fuselage section was instrumented with accelerometers (250-G maximum range) to record the structural response of the floor. Pre- and post-test photographs of the test article are shown in Figure 1. A 12-ft x 12-ft wooden box filled to a height of 2 ½-ft with high-grade “washed” sand was installed beneath the drop tower at NASA Langley. More details on the construction of the fuselage section can be found in Reference 7.
(a) Pre-test photo. (b) Post-test photo.
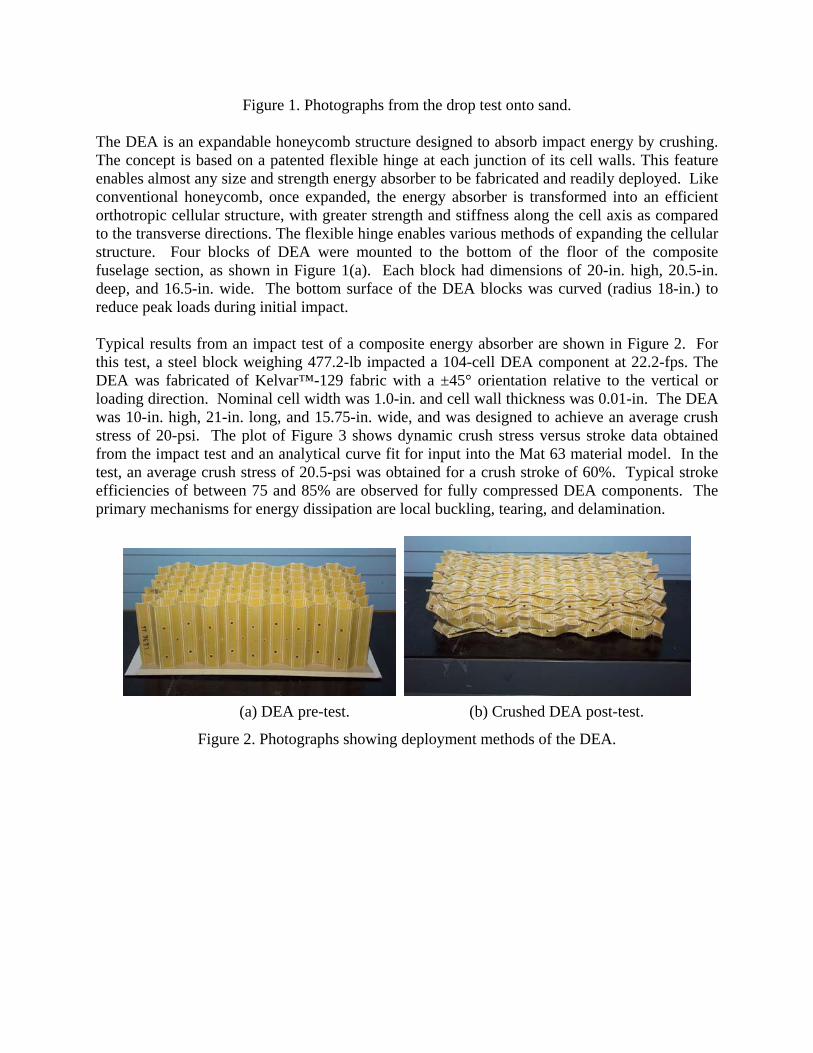
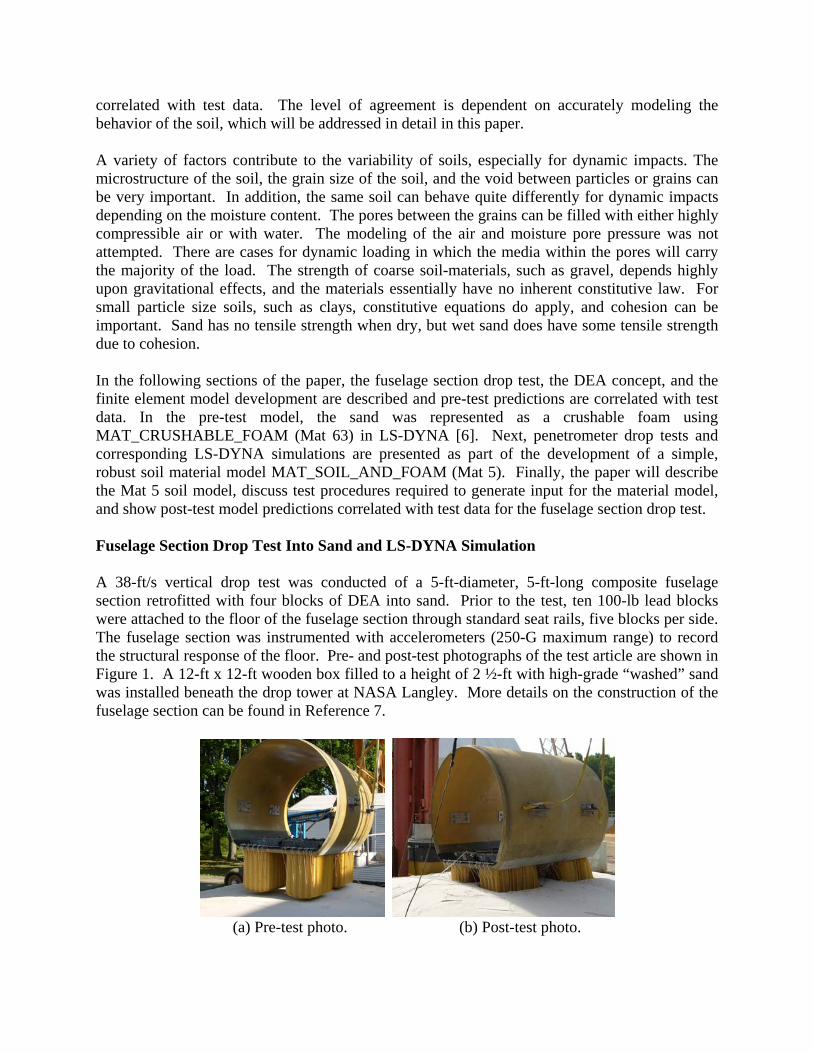
Figure 1. Photographs from the drop test onto sand. The DEA is an expandable honeycomb structure designed to absorb impact energy by crushing. The concept is based on a patented flexible hinge at each junction of its cell walls. This feature enables almost any size and strength energy absorber to be fabricated and readily deployed. Like conventional honeycomb, once expanded, the energy absorber is transformed into an efficient orthotropic cellular structure, with greater strength and stiffness along the cell axis as compared to the transverse directions. The flexible hinge enables various methods of expanding the cellular structure. Four blocks of DEA were mounted to the bottom of the floor of the composite fuselage section, as shown in Figure 1(a). Each block had dimensions of 20-in. high, 20.5-in. deep, and 16.5-in. wide. The bottom surface of the DEA blocks was curved (radius 18-in.) to reduce peak loads during initial impact. Typical results from an impact test of a composite energy absorber are shown in Figure 2. For this test, a steel block weighing 477.2-lb impacted a 104-cell DEA component at 22.2-fps. The DEA was fabricated of Kelvar™-129 fabric with a ±45° orientation relative to the vertical or loading direction. Nominal cell width was 1.0-in. and cell wall thickness was 0.01-in. The DEA was 10-in. high, 21-in. long, and 15.75-in. wide, and was designed to achieve an average crush stress of 20-psi. The plot of Figure 3 shows dynamic crush stress versus stroke data obtained from the impact test and an analytical curve fit for input into the Mat 63 material model. In the test, an average crush stress of 20.5-psi was obtained for a crush stroke of 60%. Typical stroke efficiencies of between 75 and 85% are observed for fully compressed DEA components. The primary mechanisms for energy dissipation are local buckling, tearing, and delamination.
(a) DEA pre-test. (b) Crushed DEA post-test.
Figure 2. Photographs showing deployment methods of the DEA.
Figure 3. Test data and analytical curve fit for deployable honeycomb specimen. Pre-test predictions of the soft soil (sand) impact test were generated using LS-DYNA. A picture of the fuselage and sand model is shown in Figure 4. The lead blocks on the floor are represented using 40 concentrated masses. Also, the deployable energy absorbers are modeled using solid elements that are assigned material properties obtained from a dynamic crush test of a deployable energy absorber component (see Figure 3). The sand was modeled using solid elements with material properties obtained from a model that was developed in 2001 for correlation with test data obtained in a drop test onto a similar type of sand [8]. The pre-test material model for the sand was Mat 63. The sand described in Reference 8 was sampled to obtain the density and moisture content. The volume of the soil, and thus its density, can vary depending on the packing of the sand. A hand-operated hydraulic jack was used to press a 12-in. diameter circular steel plate, approximately 1-in. thick, into the sand to determine the static in-situ load versus penetration depth. Curves of pressure versus crush factor (volumetric strain) that were obtained from testing unpacked and lightly packed sand are shown in Figure 5. The unpacked pressure data were smoothed before input into the material model. The density of the sand was approximately 0.000136 lb-sec2/in4. Other parameters used for the Mat 63 sand material model were Young’s modulus equal to 500-psi, Poisson’s ratio equal 0.08, and damping 0.02.
Pre-test predictions of acceleration-, velocity-, and displacement-time histories are correlated with test data from an accelerometer located on the right center lead block, as shown in Figure 6. The acceleration data for the analysis was run through an SAE class 60 low-pass filter [9]. The analysis accurately predicts the onset rate of acceleration and the magnitude and timing of the initial peak of the acceleration response up to 0.035 s. After that time, the level of correlation begins to deviate. In the model, the elastic stored energy is released to produce over 50-in/s rebound velocity as shown in Figure 6. In comparison, the test data shows that the maximum rebound velocity is only 30-in/s and occurs later in time. The results indicate that the Mat 63 model retains too much elastic energy, which is released to produce excessive rebound.
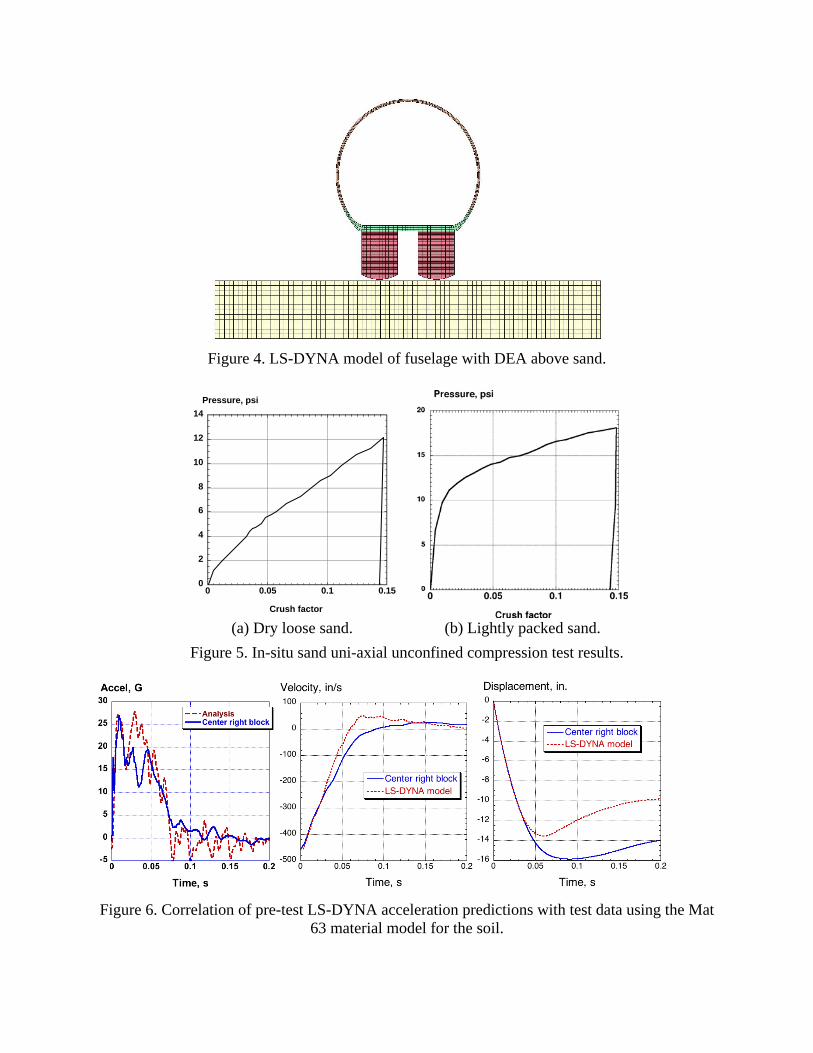
Figure 4. LS-DYNA model of fuselage with DEA above sand.
0
2
4
6
8
10
12
14
0 0.05 0.1 0.15
Pressure, psi
Crush factor (a) Dry loose sand. (b) Lightly packed sand.
Figure 5. In-situ sand uni-axial unconfined compression test results.
Figure 6. Correlation of pre-test LS-DYNA acceleration predictions with test data using the Mat 63 material model for the soil.
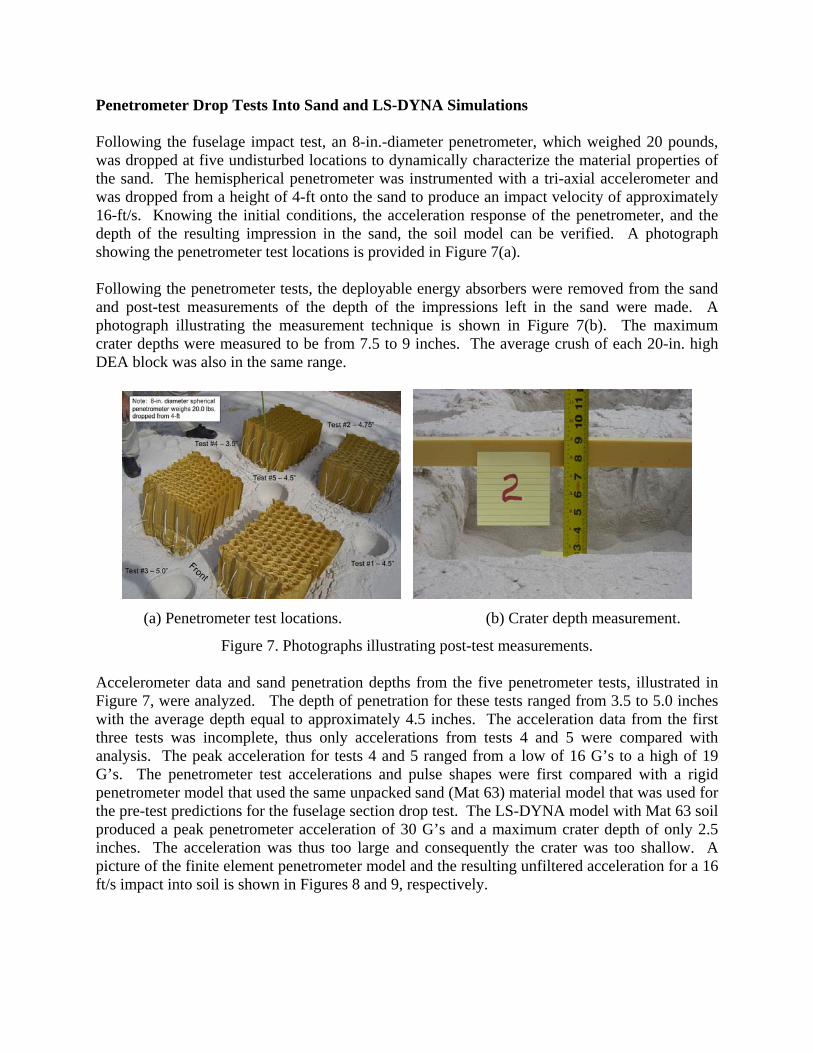
Penetrometer Drop Tests Into Sand and LS-DYNA Simulations Following the fuselage impact test, an 8-in.-diameter penetrometer, which weighed 20 pounds, was dropped at five undisturbed locations to dynamically characterize the material properties of the sand. The hemispherical penetrometer was instrumented with a tri-axial accelerometer and was dropped from a height of 4-ft onto the sand to produce an impact velocity of approximately 16-ft/s. Knowing the initial conditions, the acceleration response of the penetrometer, and the depth of the resulting impression in the sand, the soil model can be verified. A photograph showing the penetrometer test locations is provided in Figure 7(a). Following the penetrometer tests, the deployable energy absorbers were removed from the sand and post-test measurements of the depth of the impressions left in the sand were made. A photograph illustrating the measurement technique is shown in Figure 7(b). The maximum crater depths were measured to be from 7.5 to 9 inches. The average crush of each 20-in. high DEA block was also in the same range.
(a) Penetrometer test locations. (b) Crater depth measurement.
Figure 7. Photographs illustrating post-test measurements.
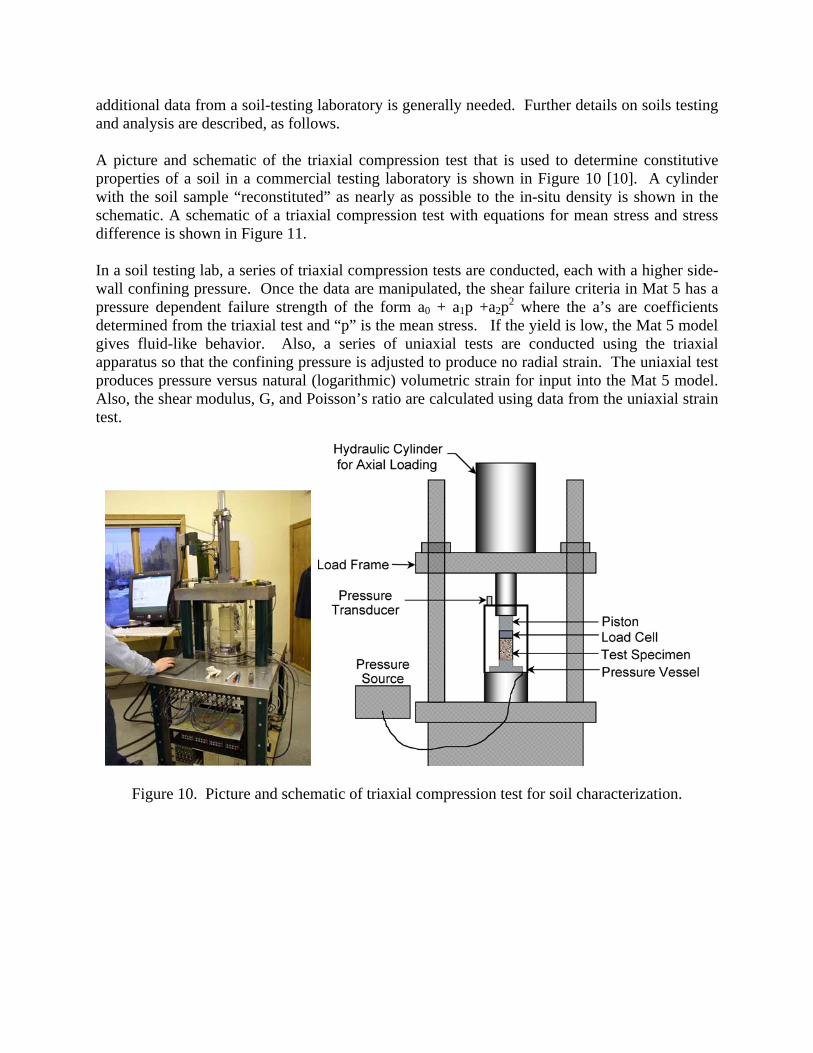
Accelerometer data and sand penetration depths from the five penetrometer tests, illustrated in Figure 7, were analyzed. The depth of penetration for these tests ranged from 3.5 to 5.0 inches with the average depth equal to approximately 4.5 inches. The acceleration data from the first three tests was incomplete, thus only accelerations from tests 4 and 5 were compared with analysis. The peak acceleration for tests 4 and 5 ranged from a low of 16 G’s to a high of 19 G’s. The penetrometer test accelerations and pulse shapes were first compared with a rigid penetrometer model that used the same unpacked sand (Mat 63) material model that was used for the pre-test predictions for the fuselage section drop test. The LS-DYNA model with Mat 63 soil produced a peak penetrometer acceleration of 30 G’s and a maximum crater depth of only 2.5 inches. The acceleration was thus too large and consequently the crater was too shallow. A picture of the finite element penetrometer model and the resulting unfiltered acceleration for a 16 ft/s impact into soil is shown in Figures 8 and 9, respectively.
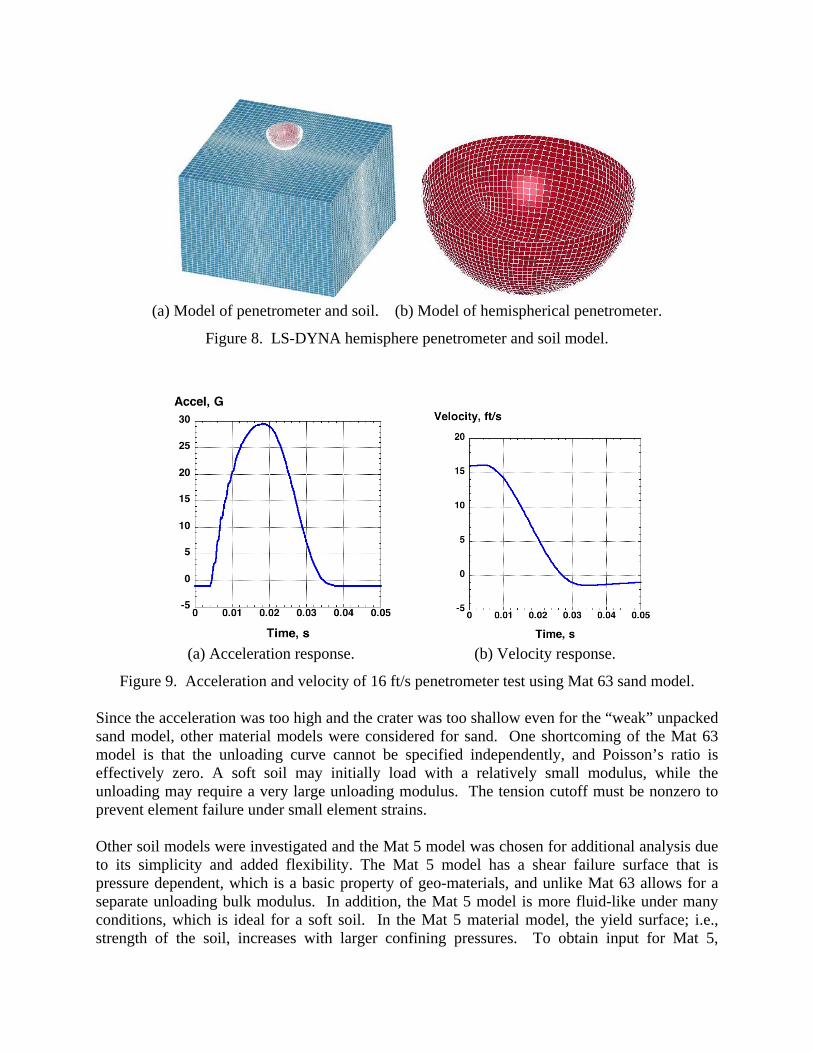
(a) Model of penetrometer and soil. (b) Model of hemispherical penetrometer.
Figure 8. LS-DYNA hemisphere penetrometer and soil model.
(a) Acceleration response. (b) Velocity response.
Figure 9. Acceleration and velocity of 16 ft/s penetrometer test using Mat 63 sand model.
Since the acceleration was too high and the crater was too shallow even for the “weak” unpacked sand model, other material models were considered for sand. One shortcoming of the Mat 63 model is that the unloading curve cannot be specified independently, and Poisson’s ratio is effectively zero. A soft soil may initially load with a relatively small modulus, while the unloading may require a very large unloading modulus. The tension cutoff must be nonzero to prevent element failure under small element strains. Other soil models were investigated and the Mat 5 model was chosen for additional analysis due to its simplicity and added flexibility. The Mat 5 model has a shear failure surface that is pressure dependent, which is a basic property of geo-materials, and unlike Mat 63 allows for a separate unloading bulk modulus. In addition, the Mat 5 model is more fluid-like under many conditions, which is ideal for a soft soil. In the Mat 5 material model, the yield surface; i.e., strength of the soil, increases with larger confining pressures. To obtain input for Mat 5,
additional data from a soil-testing laboratory is generally needed. Further details on soils testing and analysis are described, as follows. A picture and schematic of the triaxial compression test that is used to determine constitutive properties of a soil in a commercial testing laboratory is shown in Figure 10 [10]. A cylinder with the soil sample “reconstituted” as nearly as possible to the in-situ density is shown in the schematic. A schematic of a triaxial compression test with equations for mean stress and stress difference is shown in Figure 11. In a soil testing lab, a series of triaxial compression tests are conducted, each with a higher side-wall confining pressure. Once the data are manipulated, the shear failure criteria in Mat 5 has a pressure dependent failure strength of the form a0 + a1p +a2p2 where the a’s are coefficients determined from the triaxial test and “p” is the mean stress. If the yield is low, the Mat 5 model gives fluid-like behavior. Also, a series of uniaxial tests are conducted using the triaxial apparatus so that the confining pressure is adjusted to produce no radial strain. The uniaxial test produces pressure versus natural (logarithmic) volumetric strain for input into the Mat 5 model. Also, the shear modulus, G, and Poisson’s ratio are calculated using data from the uniaxial strain test.
Figure 10. Picture and schematic of triaxial compression test for soil characterization.
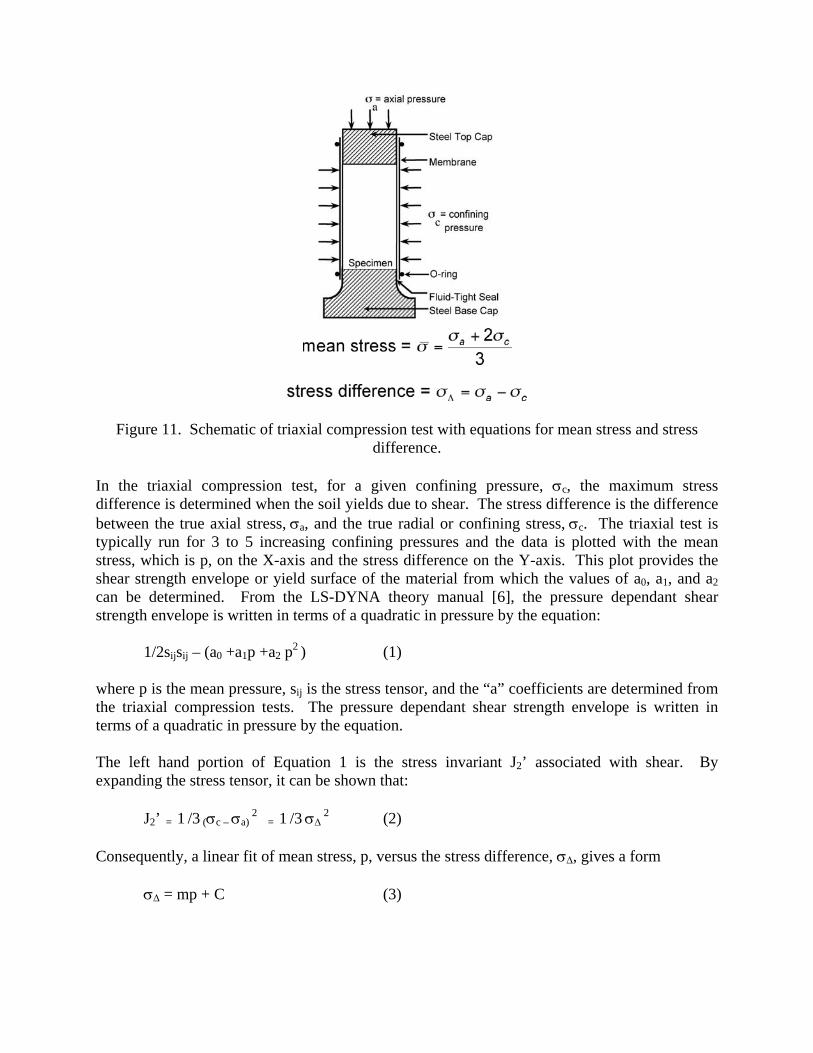
Figure 11. Schematic of triaxial compression test with equations for mean stress and stress difference.
In the triaxial compression test, for a given confining pressure, σc, the maximum stress difference is determined when the soil yields due to shear. The stress difference is the difference between the true axial stress, σa, and the true radial or confining stress, σc. The triaxial test is typically run for 3 to 5 increasing confining pressures and the data is plotted with the mean stress, which is p, on the X-axis and the stress difference on the Y-axis. This plot provides the shear strength envelope or yield surface of the material from which the values of a0, a1, and a2 can be determined. From the LS-DYNA theory manual [6], the pressure dependant shear strength envelope is written in terms of a quadratic in pressure by the equation:
1/2sijsij – (a0 +a1p +a2 p2 ) (1)
where p is the mean pressure, sij is the stress tensor, and the “a” coefficients are determined from the triaxial compression tests. The pressure dependant shear strength envelope is written in terms of a quadratic in pressure by the equation. The left hand portion of Equation 1 is the stress invariant J2’ associated with shear. By expanding the stress tensor, it can be shown that:
J2’ = 1 /3 (σc – σa) 2
= 1 /3 σΔ 2 (2)
Consequently, a linear fit of mean stress, p, versus the stress difference, σΔ, gives a form
σΔ = mp + C (3)
where m is the slope of the line and C is the Y-intercept. The Y-intercept is known as the cohesion of the soil. If the cohesion is small, as it is for dry sand, then C=0. Next by squaring equation (3)
1 /3 σΔ
2 = (1/3m2)p2 +(2/3mC)p +1/3C2 =
a0 +a1p +a2 p2 (4)
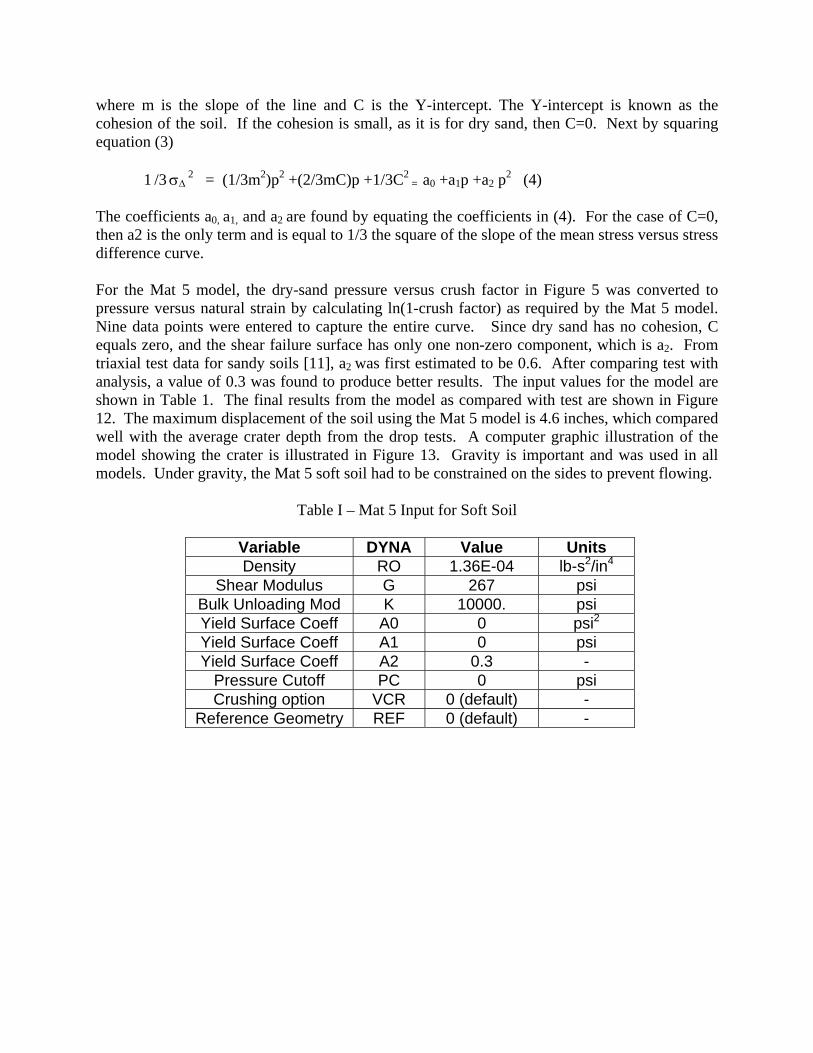
The coefficients a0, a1, and a2 are found by equating the coefficients in (4). For the case of C=0, then a2 is the only term and is equal to 1/3 the square of the slope of the mean stress versus stress difference curve. For the Mat 5 model, the dry-sand pressure versus crush factor in Figure 5 was converted to pressure versus natural strain by calculating ln(1-crush factor) as required by the Mat 5 model. Nine data points were entered to capture the entire curve. Since dry sand has no cohesion, C equals zero, and the shear failure surface has only one non-zero component, which is a2. From triaxial test data for sandy soils [11], a2 was first estimated to be 0.6. After comparing test with analysis, a value of 0.3 was found to produce better results. The input values for the model are shown in Table 1. The final results from the model as compared with test are shown in Figure 12. The maximum displacement of the soil using the Mat 5 model is 4.6 inches, which compared well with the average crater depth from the drop tests. A computer graphic illustration of the model showing the crater is illustrated in Figure 13. Gravity is important and was used in all models. Under gravity, the Mat 5 soft soil had to be constrained on the sides to prevent flowing.
Table I – Mat 5 Input for Soft Soil
Variable DYNA Value Units Density RO 1.36E-04 lb-s2/in4
Shear Modulus G 267 psi Bulk Unloading Mod K 10000. psi Yield Surface Coeff A0 0 psi2 Yield Surface Coeff A1 0 psi Yield Surface Coeff A2 0.3 -
Pressure Cutoff PC 0 psi Crushing option VCR 0 (default) -
Reference Geometry REF 0 (default) -
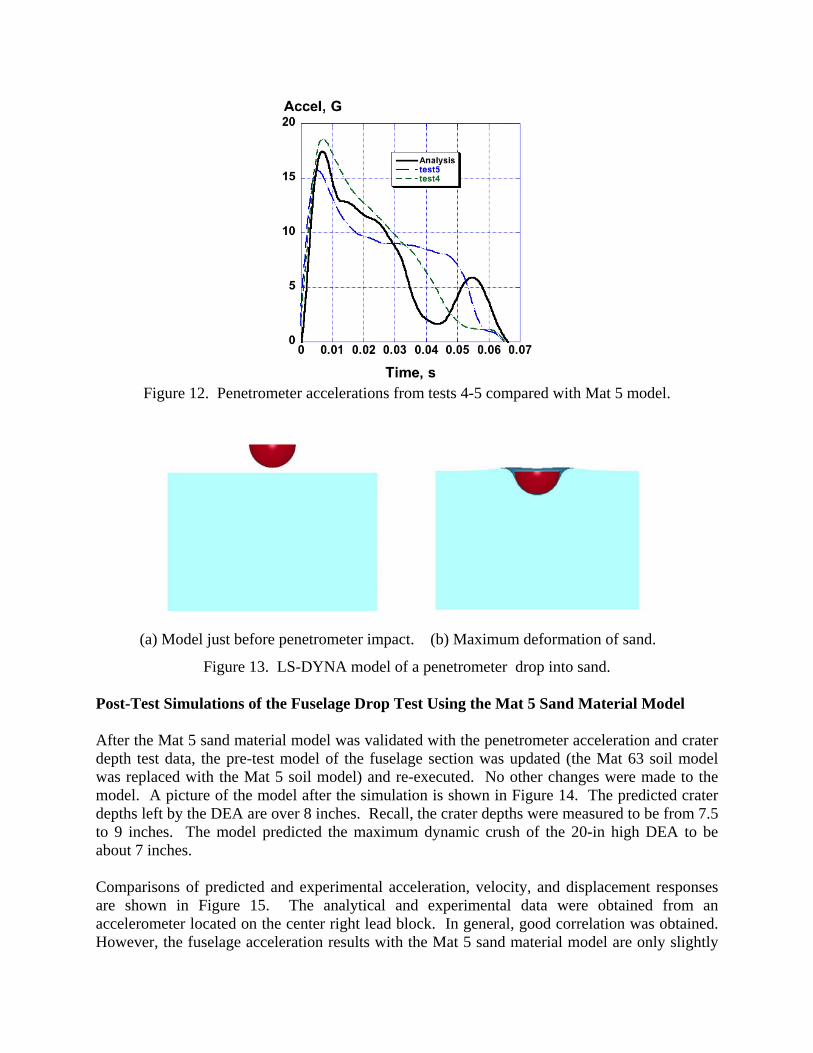
Figure 12. Penetrometer accelerations from tests 4-5 compared with Mat 5 model.
(a) Model just before penetrometer impact. (b) Maximum deformation of sand.
Figure 13. LS-DYNA model of a penetrometer drop into sand.
Post-Test Simulations of the Fuselage Drop Test Using the Mat 5 Sand Material Model After the Mat 5 sand material model was validated with the penetrometer acceleration and crater depth test data, the pre-test model of the fuselage section was updated (the Mat 63 soil model was replaced with the Mat 5 soil model) and re-executed. No other changes were made to the model. A picture of the model after the simulation is shown in Figure 14. The predicted crater depths left by the DEA are over 8 inches. Recall, the crater depths were measured to be from 7.5 to 9 inches. The model predicted the maximum dynamic crush of the 20-in high DEA to be about 7 inches. Comparisons of predicted and experimental acceleration, velocity, and displacement responses are shown in Figure 15. The analytical and experimental data were obtained from an accelerometer located on the center right lead block. In general, good correlation was obtained. However, the fuselage acceleration results with the Mat 5 sand material model are only slightly
better than the pre-test predictions with Mat 63. The predicted depth of the crater with the Mat 5 sand model compared very well with the measured depth, whereas in the pre-test model the crater depth was under predicted. Also, the velocity and displacement responses, shown in Figures 15(b) and 15(c) respectively, are closer to the test responses than the pre-test predictions, shown in Figure 6. Several factors may influence the test-analysis correlation. First, the unloading bulk modulus was not directly measured, and may be slightly too large for these simulations. A volumetric compression test with unloading is needed to get an experimental value; however, this test was not performed. Plans are underway to have this testing performed in the near future. Finally, it should be noted that the scatter from the penetrometer tests showed that the sand likely had not stabilized sufficiently to be consistent and uniform.
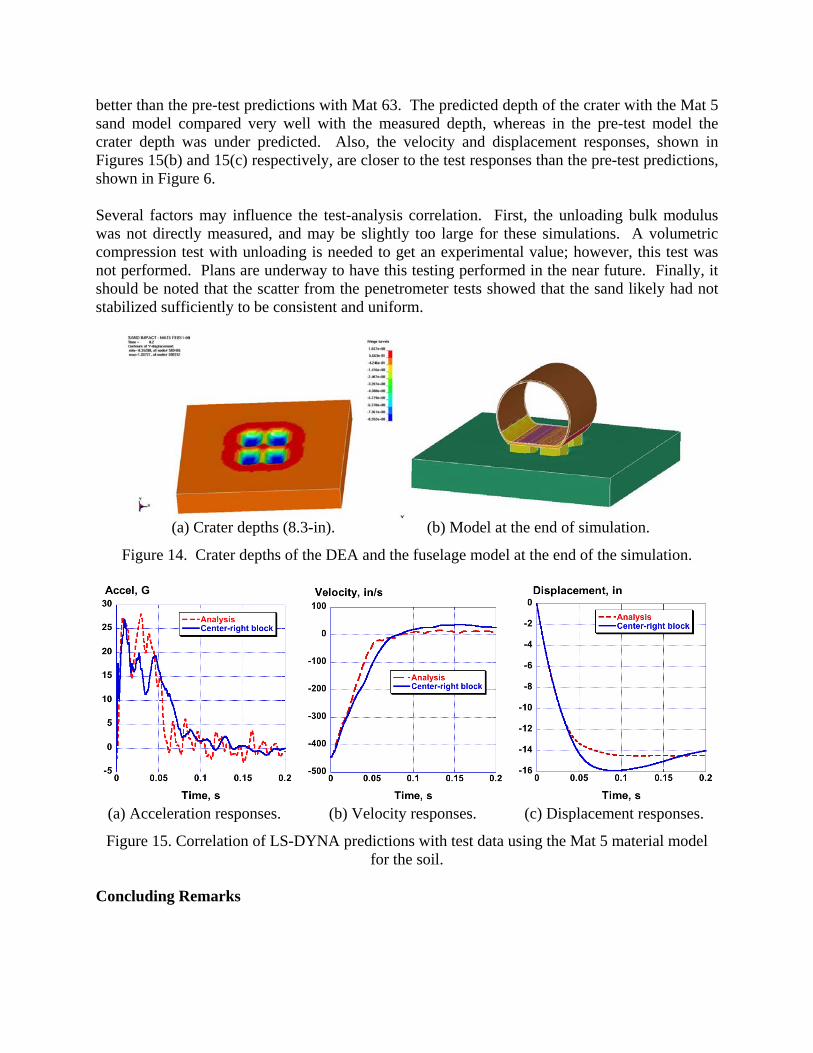
(a) Crater depths (8.3-in). (b) Model at the end of simulation.
Figure 14. Crater depths of the DEA and the fuselage model at the end of the simulation.
(a) Acceleration responses. (b) Velocity responses. (c) Displacement responses.
Figure 15. Correlation of LS-DYNA predictions with test data using the Mat 5 material model for the soil.
Concluding Remarks
A 38-ft/s vertical drop test of a 5-ft-diameter, 5-ft-long composite fuselage section into soft soil (sand) was conducted. The fuselage section was retrofitted with four blocks of a composite honeycomb deployable energy absorber (DEA). The purpose of the test was to evaluate the multi-terrain impact capabilities of the DEA concept and to generate dynamic test data for model validation. A finite element model of the fuselage section with DEA was developed to simulate the sand impact test. The sand was initially represented using a crushable foam material definition (Mat 63) in LS-DYNA. A pressure versus volumetric strain response for unpacked sand, obtained from a prior research program, was input to the Mat 63 model. Pre-test predictions were correlated with test data. The pre-test analysis accurately predicted the onset rate of acceleration and the magnitude and timing of the initial peak of the acceleration response. However, following the initial peak, the level of agreement deteriorated. In general, the results indicate that the sand model using Mat 63 stores too much elastic energy, which is released to produce excessive rebound. Following the impact test of the fuselage section, a series of penetrometer impact tests was performed to provide data for characterization of the soil properties. The penetrometer impact tests were also simulated using LS-DYNA. It quickly became evident that the May 63 model had some limitations, preventing it from accurately predicting the acceleration response and measured crater depths from the penetrometer drop tests. Consequently, a Mat 5 soil model was evaluated, which gave much improved predictions of the penetrometer responses. After the Mat 5 sand material model was validated with the penetrometer acceleration and crater depth test data, the pre-test model of the fuselage section was updated (the Mat 63 soil model was replaced with the Mat 5 soil model) and re-executed. For this updated model, the predicted crater depths left by the DEA are over 8 inches, a result that compares very favorably with the measured crater depths, which ranged from 7.5- to 9-inches. Comparisons of predicted and experimental acceleration, velocity, and displacement responses indicated that a high level of correlation is obtained. However, overall, the results were only slightly better than the pre-test predictions. Several factors may influence the test-analysis correlation. First, the unloading bulk modulus was not measured, and may be slightly too large for these simulations. A volumetric compression test is needed to get an experimental value; however, this test was not performed. Plans are underway to have this testing performed in the near future. Finally, it should be noted that the scatter from the penetrometer tests showed that the sand likely had not stabilized sufficiently to be consistent and uniform. References 1. Jackson, K.E., Fuchs, Y. T., and Kellas, S., “Overview of the NASA Subsonic Rotary Wing Aeronautics Research Program in Rotorcraft Crashworthiness,” Proceedings of the 11thASCE Earth and Space Conference, Special Symposium on Ballistic Impact and Crashworthiness of Aerospace Structures, Long Beach, CA, March 3-5 2008. 2. Kellas, S. and Jackson, K. E., “Deployable System for Crash-Load Attenuation,” Proceedings of the 63rd AHS Forum, Virginia Beach, VA, May 1-3, 2007.

3. Kellas, S. and Jackson, K.E., “Multi-Terrain Vertical Drop Tests of a Composite Fuselage Section,” Proceedings of the 64th AHS Forum, Montreal, Canada, April 29-May1, 2008. 4. Jackson, K. E. and Fuchs, Y. T., “Comparisons of ALE and SPH Simulations of Vertical Drop Tests of a Composite Fuselage Section into Water,” Proceedings of the 10th LS-DYNA Users Conference, Dearborn, MI, June 8-10, 2008. 5. Anon., “LS-DYNA Keyword User’s Manual,” Version 971, Livermore Software Technology Company, Livermore, CA, August 2006. 6. Hallquist, John O., “LS-DYNA Theory Manual,” Livermore Software Technology Corp., March 2006. 7. Jackson, K. E., "Impact Testing and Simulation of a Crashworthy Composite Fuselage Concept," International Journal of Crashworthiness, 2001, Vol. 6, No 1, pp.107-121. 8. Sareen, A. K., Sparks, C., Mullins, B. R., Fasanella, E. L., and Jackson, K. E., "Comparison of Soft Soil and Hard Surface Impact Performance of a Crashworthy Composite Fuselage Concept," Proceedings of the AHS Forum 58, Montreal, Canada, June 11-13, 2002. 9. Society of Automotive Engineers (SAE), Recommended Practice: Instrumentation for Impact Test – Part 1, Electronic Instrumentation, SAE J211/1, March 1995. 10. Applied Research Associates, Inc, “Constitutive Soil Properties for Cuddeback Lake, CA and Carson Sink, NV,” NASA CR to be published, draft February 2008. 11. Schwer, Leonard, “Geomaterial Modeling,” Class notes and personal communications, Schwer Engineering and Consulting Services.


![Osprey - Aerospace - Tiger Squadrons [Osprey - Aerospace].pdf](https://static.fdocuments.us/doc/165x107/55cf9675550346d0338b9dbe/osprey-aerospace-tiger-squadrons-osprey-aerospacepdf.jpg)