SOFT DRINKS REVIEW Foodservice & Licensed - Britvic...
32
Foodservice & Licensed SOFT DRINKS REVIEW
Transcript of SOFT DRINKS REVIEW Foodservice & Licensed - Britvic...

Foodserv ice& L icensed
S O F T D R I N K S R E V I E W

02 03
Welcome Contents
Total Soft Drinks
Foodservice & Licensed - Future Outlook
Foodservice & Licensed - The Year in Numbers
Foodservice & Licensed - Review
Channel Performance
0435
08
2707
Paul GrahamGB General Manager
Welcome to the 2017 Britvic Soft Drinks Review.
The last 12 months have passed by quickly and it’s certainly been an interesting year for our category.
Following the positive feedback from last year’s review, you’ll see that we’ve followed a similar format with more channel-specific information. However, new for this year is a more visual and less copy-heavy look throughout the review, which we hope you’ll agree makes it easier to navigate and brings the dynamic nature of the category to life.
As many of you will know, Britvic has been at the heart of the soft drinks industry since the 1930s when we started out as the British Vitamin Products Company, using soft drinks to bring an affordable source of vitamins to the people of Britain. Fast-forward to today and once again, the health agenda is at the heart of our industry and we at Britvic are leading the way, taking bold steps to help consumers make healthier soft drinks choices. 68% of our current portfolio is no or low sugar, so we are well-placed to satisfy consumers, offering them a wide and varied choice for all occasions.
Since I became GB General Manager in 2012, Britvic has focused on driving the sustainable growth of the category as well as supporting our customers to help them to unlock the further potential the category has to offer. The last year hasn’t been without its challenges, particularly following the announcement of the forthcoming Soft Drinks Industry Levy, but the soft drinks category has remained one of the most vibrant FMCG sectors in the UK, with innovative companies offering new products and new brands to meet the needs of today’s consumers.
We believe there are still huge opportunities for growth within the category for companies, brands, retailers and operators who innovate and invest in the long-term future of soft drinks. We hope this year’s review gives some useful insight into how we as an industry can make that happen.

04 05
Tota l Sof t Dr inks
2016 was a transformational year for soft drinks. An intense spotlight shone on the industry following the announcement from the Government in March of the impending Soft Drinks Industry Levy, which of course stole most of the headlines. But it was also a year of exciting launches, memorable marketing campaigns and engaging brand activations.
The total value of UK soft drink sales is estimated to have been around £14bn last year. In such a diverse category it’s perhaps not surprising that there were some differing performances at channel level, with Retail (combining the Grocery and Impulse channels) seeing value growth of +1.0%. Periods of deflation meant volume grew ahead of value at +1.5%.
The Foodservice and Licensed channel saw growth of +3.3%, due to an increasing trend for eating out and a growing consumer desire for more premium experiences. Despite these different channel performances, the underlying consumer trends that affected the category continued to accelerate.
THE TOTAL VALUE OF UK SOFT DRINK
SALES IS ESTIMATED
TO HAVE BEEN AROUND £14BN
LAST YEAR
With two thirds of UK adults now said to be overweight and obesity levels rising, food and drink manufacturers are rightly recognising that they have a part to play in combating this by helping their consumers to make healthier choices. Long before the announcement of the Soft Drinks Industry Levy, manufacturers were already responding to consumers’ increasing interest in health and wellness by offering them
no and low sugar variants of their favourite soft drinks. However, this must be balanced with maintaining great taste and choice. Britvic has been ahead of the game in this respect, leading the way in reducing the calorie and sugar content in our drinks for many years to ensure we provide consumers with a well-balanced portfolio of great tasting drinks and a breadth of choice.
Whilst existing trends of ‘on-the-go’ lifestyles and the desire for ’24hr grazing’ continued, there was an acceleration in the trend of consumers’ rising expectations around product delivery, personalisation and experience. Shoppers became increasingly
demanding and more adventurous in what they looked for and expected these personalised choices to be delivered immediately. Whilst this has undoubtedly raised expectations across the trade, it also presented an opportunity to differentiate and add value.
HEALTH ON THE AGENDA
MAKING IT PERSONAL
06 07
Channe l Per formance
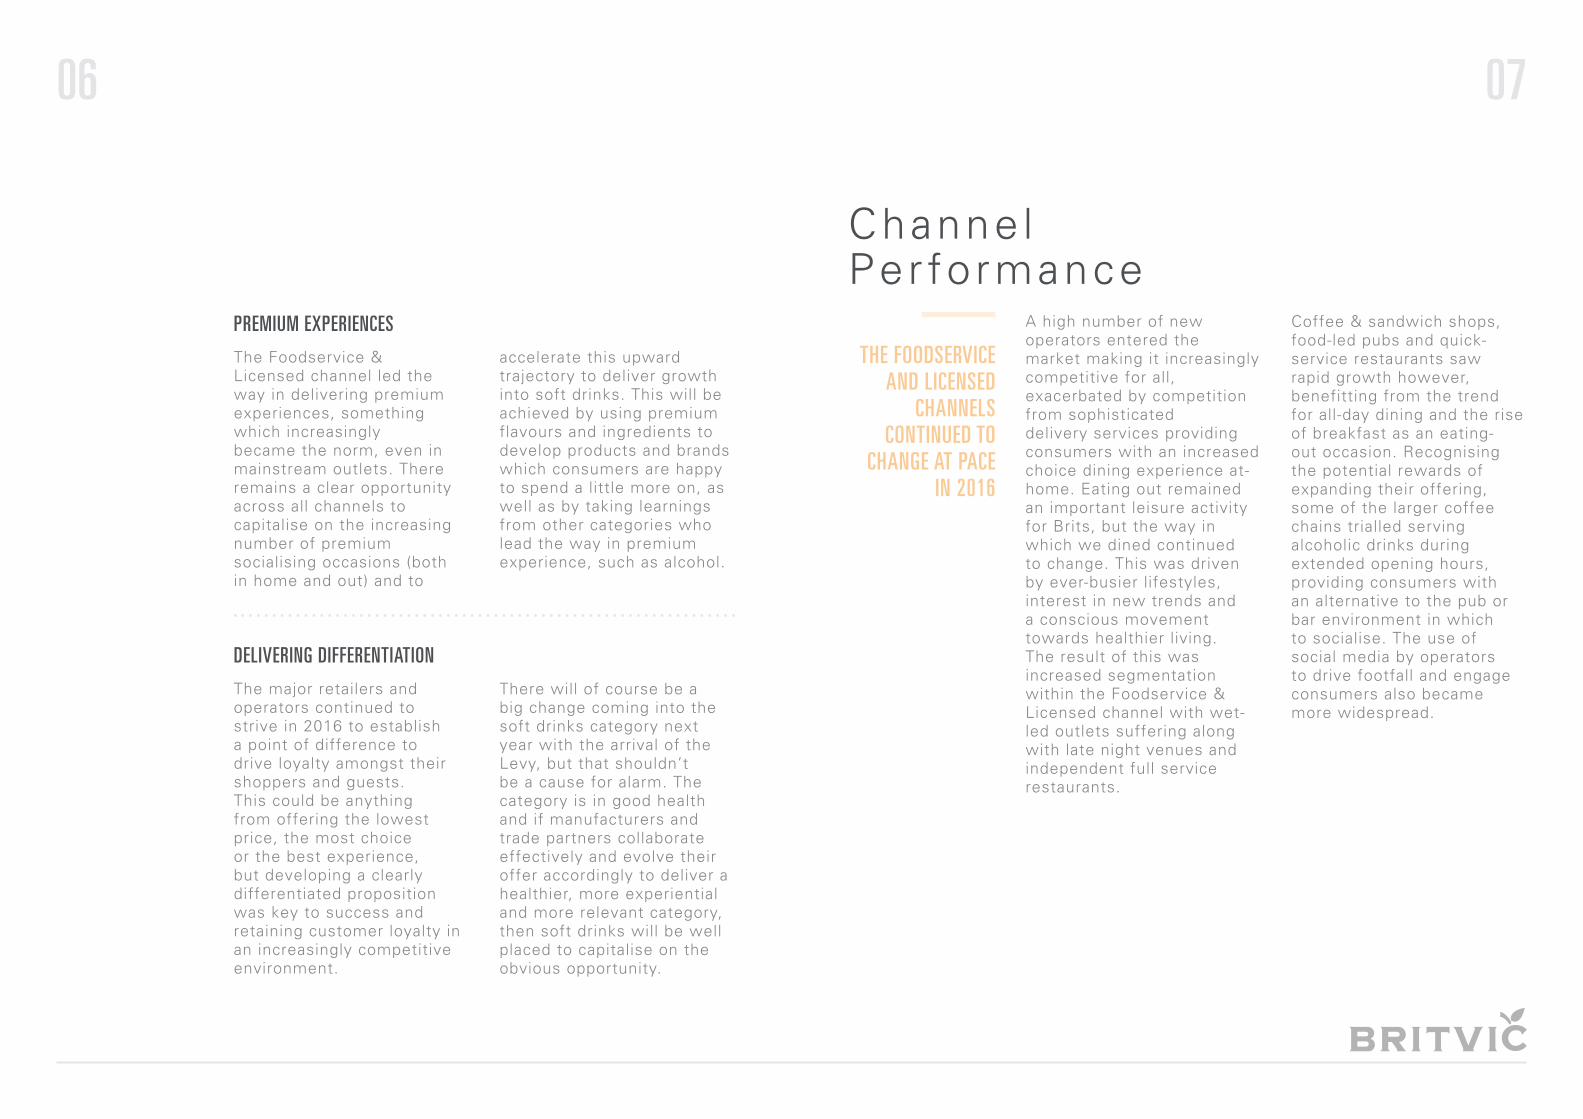
A high number of new operators entered the market making it increasingly competitive for all, exacerbated by competition from sophisticated delivery services providing consumers with an increased choice dining experience at-home. Eating out remained an important leisure activity for Brits, but the way in which we dined continued to change. This was driven by ever-busier lifestyles, interest in new trends and a conscious movement towards healthier living. The result of this was increased segmentation within the Foodservice & Licensed channel with wet-led outlets suffering along with late night venues and independent full service restaurants.
Coffee & sandwich shops, food-led pubs and quick-service restaurants saw rapid growth however, benefitting from the trend for all-day dining and the rise of breakfast as an eating-out occasion. Recognising the potential rewards of expanding their offering, some of the larger coffee chains trialled serving alcoholic drinks during extended opening hours, providing consumers with an alternative to the pub or bar environment in which to socialise. The use of social media by operators to drive footfall and engage consumers also became more widespread.
THE FOODSERVICE AND LICENSED
CHANNELS CONTINUED TO
CHANGE AT PACE IN 2016
The Foodservice & Licensed channel led the way in delivering premium experiences, something which increasingly became the norm, even in mainstream outlets. There remains a clear opportunity across all channels to capitalise on the increasing number of premium socialising occasions (both in home and out) and to
accelerate this upward trajectory to deliver growth into soft drinks. This will be achieved by using premium flavours and ingredients to develop products and brands which consumers are happy to spend a little more on, as well as by taking learnings from other categories who lead the way in premium experience, such as alcohol.
The major retailers and operators continued to strive in 2016 to establish a point of difference to drive loyalty amongst their shoppers and guests. This could be anything from offering the lowest price, the most choice or the best experience, but developing a clearly differentiated proposition was key to success and retaining customer loyalty in an increasingly competitive environment.
There will of course be a big change coming into the soft drinks category next year with the arrival of the Levy, but that shouldn’t be a cause for alarm. The category is in good health and if manufacturers and trade partners collaborate effectively and evolve their offer accordingly to deliver a healthier, more experiential and more relevant category, then soft drinks will be well placed to capitalise on the obvious opportunity.
PREMIUM EXPERIENCES
DELIVERING DIFFERENTIATION

08 09
Snapshot Facts & F igures
331,293UK EATING OUT MARKET VALUE IN 2016
Hotels, Pubs & Restaurants was by far the largest sub-sector, accounting for 72% of total turnover
TOTAL NO. OF OUTLETS EXPECTED BY DEC 2016
£87.2BN+2.3%
The UK Restaurant Market 2016, © MCA, September 2016
RETAIL, TRAVEL & LEISURE
HOTELS, PUBS, BARS & RESTAURANTS
CONTRACT CATERING
100,825 OUTLETS
167,383 OUTLETS
63,084 OUTLETS
£19.5BN
£62.9BN
£4.8BN
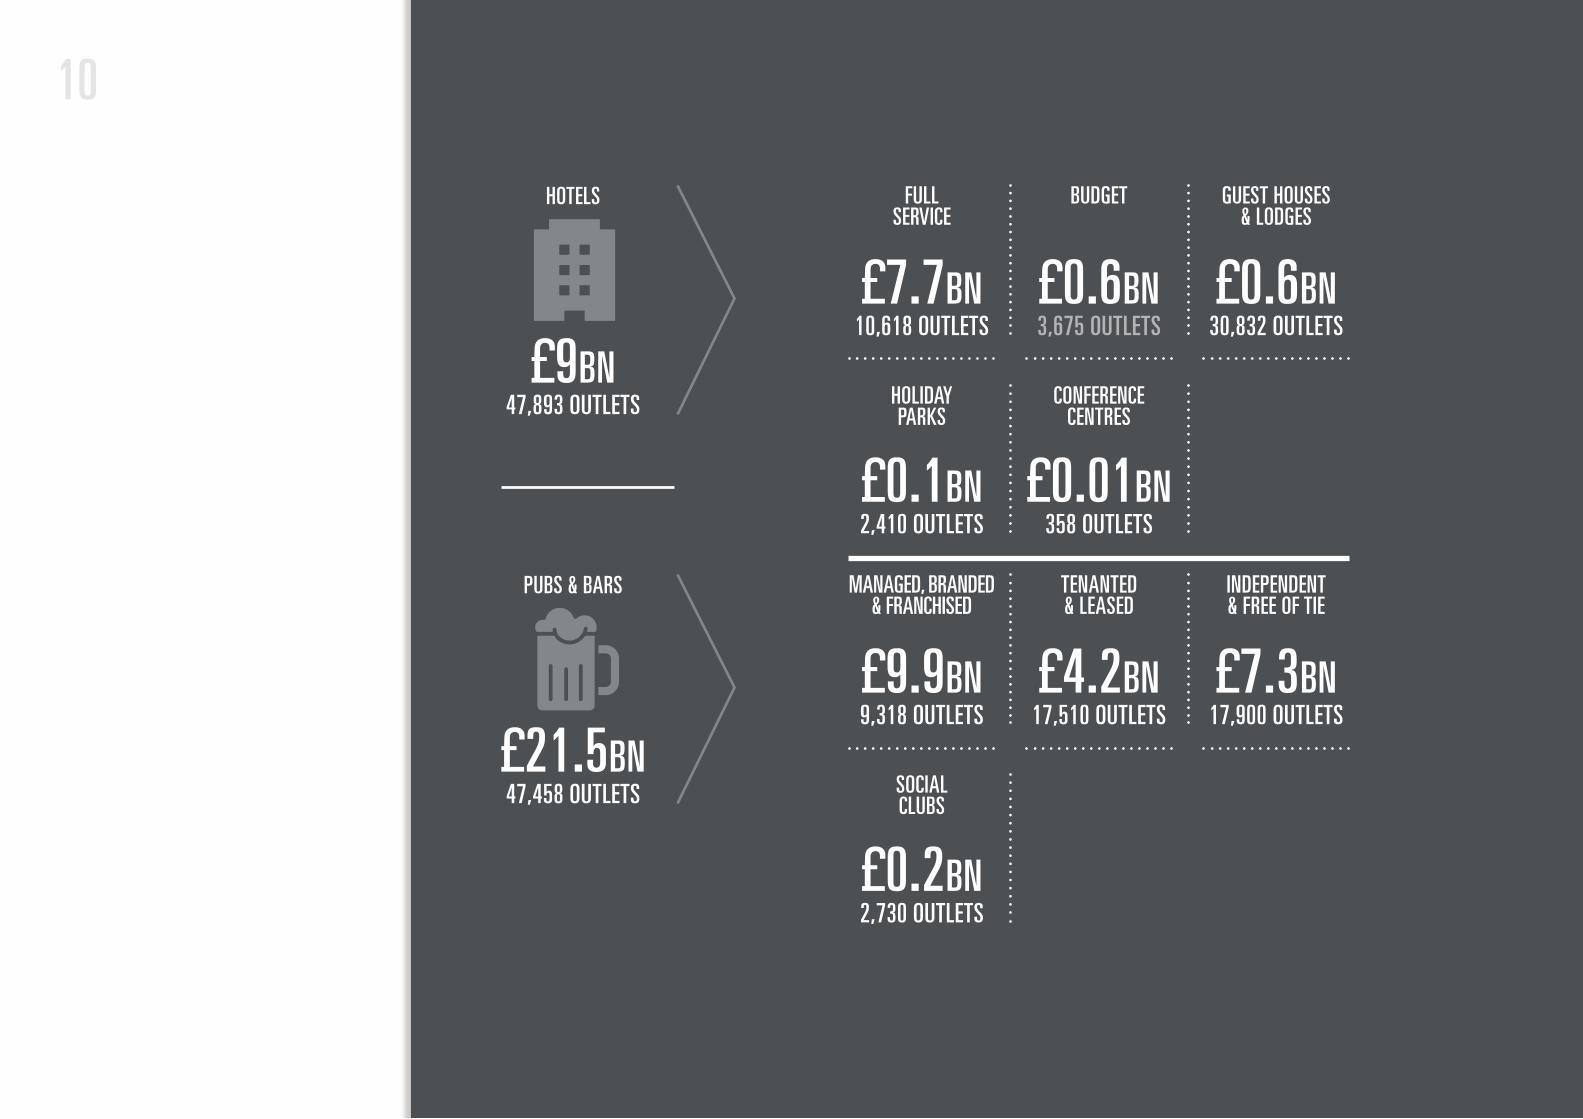
1110
47,893 OUTLETS
47,458 OUTLETS
£9BN
£21.5BN
HOTELS
PUBS & BARS
The UK Restaurant Market 2016, © MCA, September 2016
10,618 OUTLETS
9,318 OUTLETS
358 OUTLETS
3,675 OUTLETS
17,510 OUTLETS
30,832 OUTLETS
17,900 OUTLETS
2,410 OUTLETS
2,730 OUTLETS
£7.7BN
£9.9BN
£0.01BN
£0.6BN
£4.2BN
£0.6BN
£7.3BN
£0.1BN
£0.2BN
FULL SERVICE
MANAGED, BRANDED & FRANCHISED
CONFERENCE CENTRES
BUDGET
TENANTED & LEASED
GUEST HOUSES & LODGES
INDEPENDENT & FREE OF TIE
HOLIDAY PARKS
SOCIAL CLUBS

12 13
350 OUTLETS72,033 OUTLETS
100,825 OUTLETS
28,273 OUTLETS
4,725 OUTLETS
£0.8BN£32.4BN
£19.5BN
£14.4BN
£5.2BN
RESTAURANTS
RETAIL, TRAVEL & LEISURE SEGMENT
FINE DINING
COFFEE SHOPS / SANDWICH BARS / BAKERY STORES / DEP’T STORES / SUPERMARKET
CAFES / SUPERMARKET GRAB & GO / CONVENIENCE GRAB & GO
ROADSIDE & MSA / PETROL FORECOURTS / RAILWAY STATIONS / AIRPORTS / PORTS
SPORTS CLUBS / EVENT CATERING / STADIA / VISITOR ATTRACTIONS /
ENTERTAINMENT VENUES
SERVICE-LED £20.3BN / 33,348 OUTLETS
RETAIL
INDEPENDENT
BRANDED / CASUAL RESTAURANTS
3,031 OUTLETS 1,776 OUTLETS
25,834 OUTLETS 7,483 OUTLETS
560 OUTLETS£4.0BN £1.3BN
£4.9BN £1.1BN
£0.7BN
BRANDED TRADITIONAL
TRAVEL
LEISURE
FAST FOOD £12.0BN / 38,685 OUTLETS
BRANDED DELIVERY FOCUSED
INDEPENDENT INC.TAKE-AWAY
STREET FOOD & MOBILE VANS
BRANDED CONTEMPORARY
14 15
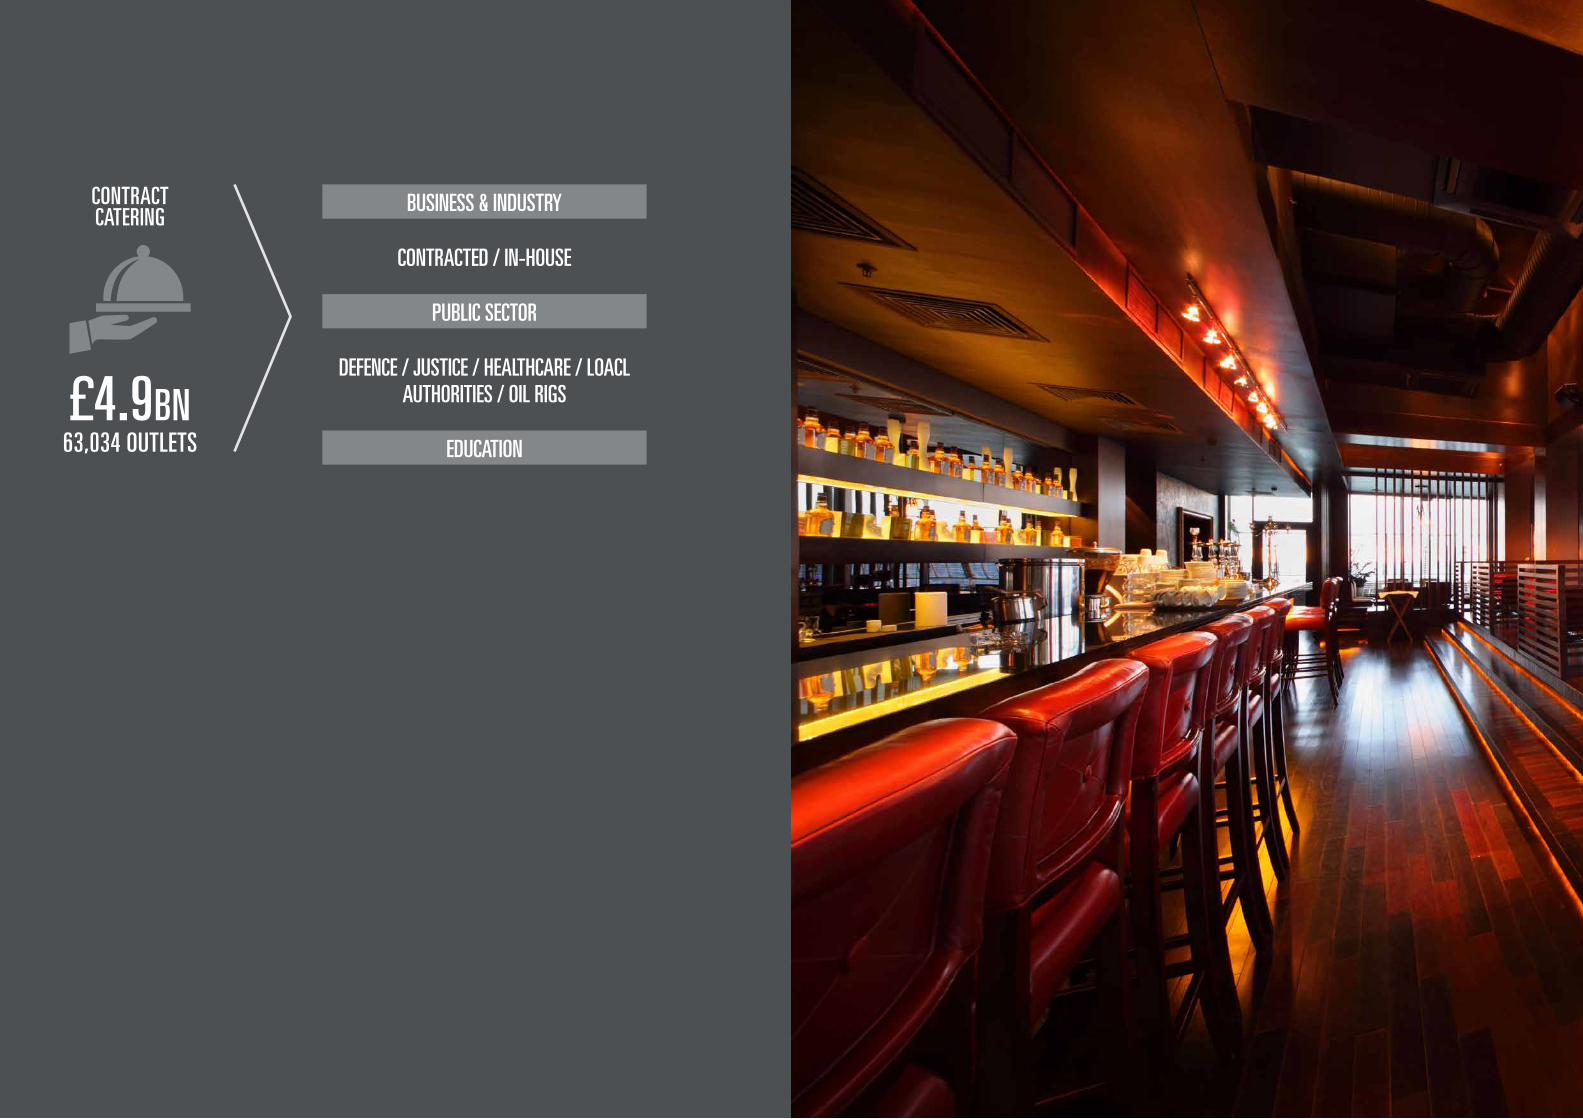
63,034 OUTLETS£4.9BN
CONTRACT CATERING
BUSINESS & INDUSTRY
PUBLIC SECTOR
EDUCATION
CONTRACTED / IN-HOUSE
DEFENCE / JUSTICE / HEALTHCARE / LOACL AUTHORITIES / OIL RIGS

16 17
4+96+MTOTAL VALUE OF SOFT DRINKS IN FOODSERVICE & LICENSED
SOFT DRINKS GROWTH
FOODSERVICE
£6.9 BNSOFT DRINKS
GROWTH
+3.3%
£2.6BN
+3.7%
8+92+MSOFT DRINKS GROWTH
HIGH ST FOOD TO G0
£489M
+7.5%5+95+MCONTRACT CATERING
SOFT DRINKS GROWTH
+4.9%
£1BN1+99+M
SOFT DRINKS GROWTH
QUICK SERVICE RESTAURANTS
£790M
+0.9% 2+98+MSOFT DRINKS GROWTH
TRAVEL & LEISURE
+1.3%
£331M
Soft Dr inks Performance
Total Foodservice & Licensed data: CGA Out of Home data MAT 31.12.2016. Foodservice data: CGA Foodservice MAT 31.12.2016
Licensed data: CGA OPMS MAT 31.12.2016
£1.6BNGROWING AT +7.5%
Food-led and wet-led pubs combined worth
3+97+MSOFT DRINKS GROWTH
LICENSED
£4.3BN
+2.8% 1+99+MSOFT DRINKS GROWTH SOFT DRINKS GROWTH
RESTAURANTS
£528M
+0.1% 4+96+MHOTELS
£844M
+3.7%13+87+MSOFT DRINKS GROWTH
FOOD-LED PUB
£971M
+13.6%
1+99+MSOFT DRINKS GROWTH
WET-LED
£1.1BN
+0.6% 4+96+MSOFT DRINKS GROWTH
WINE BAR, CIRCUIT BAR, PROPRIETARY CLUBS
WET LED PUBS AND SPORTS & SOCIAL CLUBS
LATE
£844M
-3.9%
LICENSED
FOODSERVICE

18 19
3+8+4+0+3+10+15+0+0+00+0+0+4+0+0+0+1+6+4Category Per formance
CGA Out of Home data MAT TY 31.12.2016
COLA
£2.
9BN
JUICE
DRI
NKS
£623
M
WAT
ER £
662M
FLAV
OURE
D CA
RBS
£623
M
LEM
ONAD
E £59
9M
PURE
JUICE
DRI
NKS
(OTH
ER) £
450M
PURE
JUICE
MIX
ERS
£63M
MIX
ERS
£359
M
SPOR
TS /
ENER
GY D
RINK
S £3
20M
SQUA
SH £
242M
+2.9%+7.6%
+4.3%
-3.5%
+3.4%
+9.9%
-4.2%
+15.3%
-0.6%-6.3%
20 21
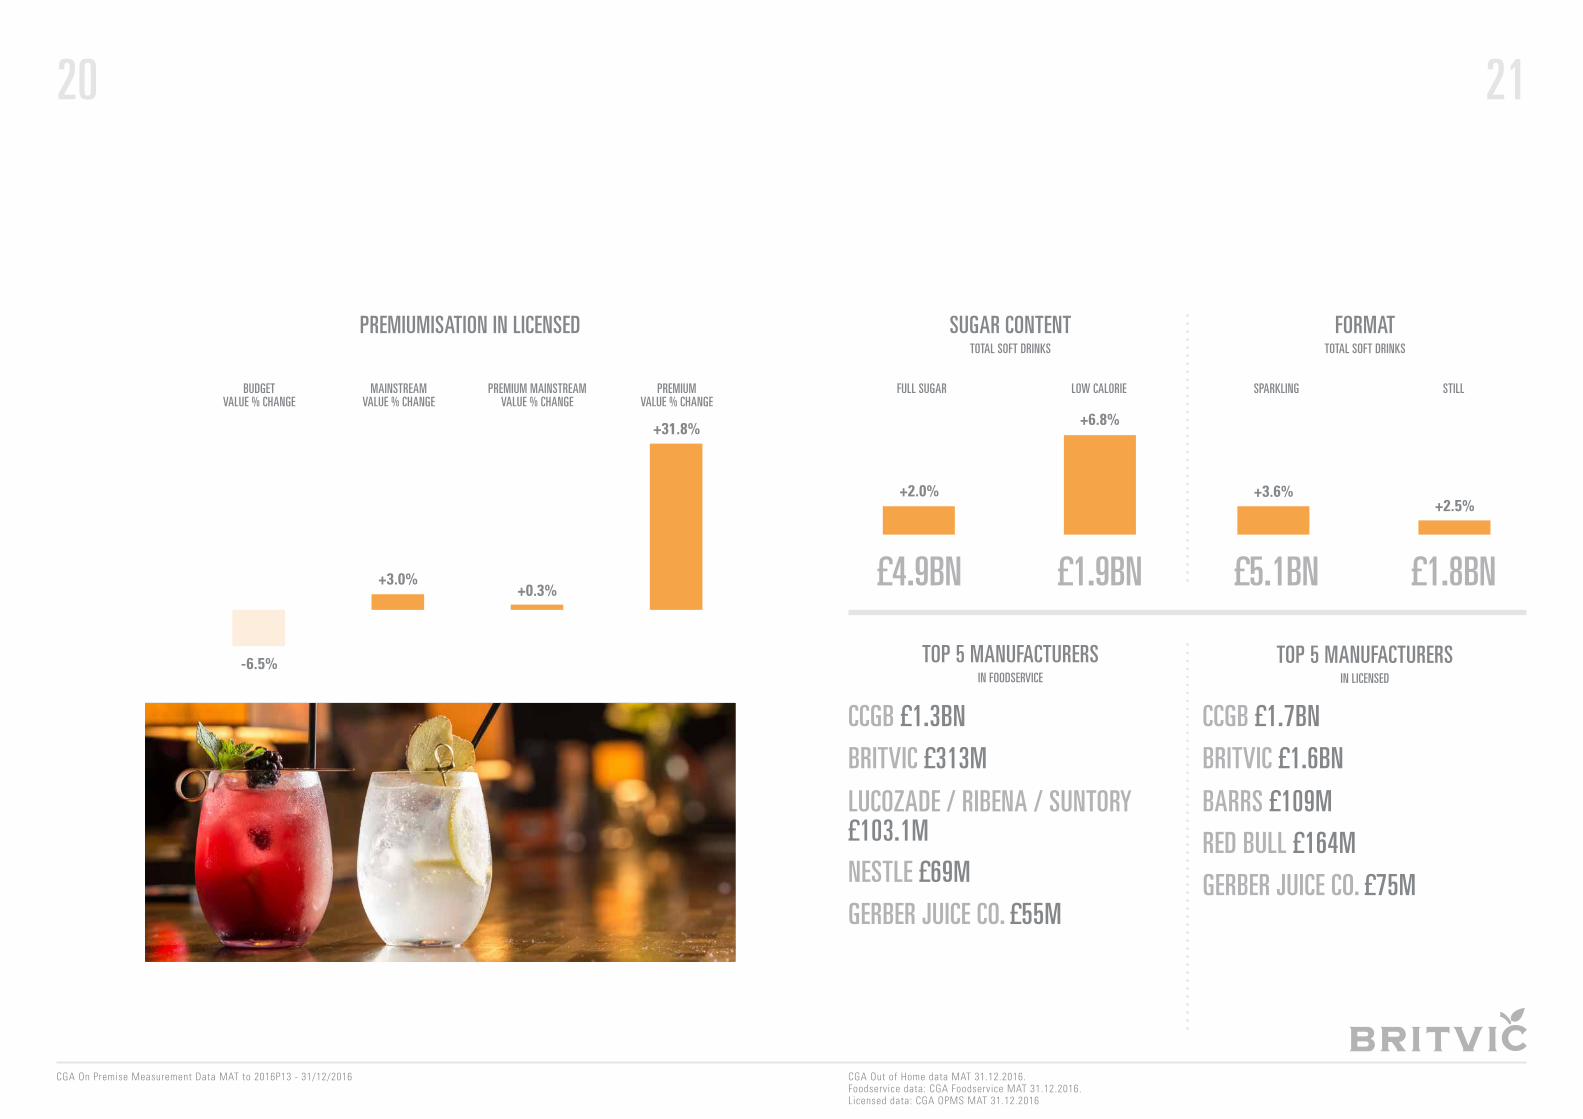
0+3+1+327+0+0+0PREMIUMVALUE % CHANGE
PREMIUM MAINSTREAMVALUE % CHANGE
MAINSTREAM VALUE % CHANGE
BUDGET VALUE % CHANGE
PREMIUMISATION IN LICENSED
CGA On Premise Measurement Data MAT to 2016P13 - 31/12/2016
+3.0%+0.3%
+31.8%
-6.5%
£4.9BN £1.9BN £5.1BN £1.8BN4+144+2FULL SUGAR SPARKLINGLOW CALORIE STILL
SUGAR CONTENT FORMATTOTAL SOFT DRINKS TOTAL SOFT DRINKS
CGA Out of Home data MAT 31.12.2016. Foodservice data: CGA Foodservice MAT 31.12.2016. Licensed data: CGA OPMS MAT 31.12.2016
CCGB £1.7BNCCGB £1.3BN
BRITVIC £1.6BN
LUCOZADE / RIBENA / SUNTORY £103.1M
BARRS £109M
BRITVIC £313M
RED BULL £164MNESTLE £69M GERBER JUICE CO. £75MGERBER JUICE CO. £55M
TOP 5 MANUFACTURERSTOP 5 MANUFACTURERSIN LICENSEDIN FOODSERVICE
+2.0%
+6.8%
+3.6%+2.5%

22 23
0+0+0+20+12+0+0+50+0+303+2+1+0+0+10+6+0+1+0
COCA
-COL
A £6
51M
PEPS
I £11
4M
OASI
S £4
6M
HARR
OGAT
E SPA
£40
M
DIET
COK
E £22
6M
FANT
A £1
41M
SUNP
RIDE
£52
M
SPRI
TE £
49M
CALY
PSO
£48M
TANG
O £4
7M
-2.3% -1.7% -1.0%
+12.3%
+19%
-10.4%-6%
+50.3%
-0.3%
+28.9%
CGA Foodservice MAT 31.12.2016
0+3+3+5+6+7+0+1+0+01+0+0+0+0+0+5+0+1+7-0.5%
-4.6%-1.1%
-6.9%
+3.2% +2.9% +4.5% +5.8% +6.4%+0.7%
COCA
-COL
A £5
68M
DIET
PEP
SI £
257M
SCHW
EPPE
S M
IXER
S £1
12M
SCHW
EPPE
S SQ
UASH
£10
3M
PEPS
I £51
2M
DIET
COK
E £42
5M
SCHW
EPPE
S LE
MON
ADE £
258M
R W
HITE
S LE
MON
ADE £
244M
J2O
£210
M
RED
BULL
£16
1M
CGA OPMS MAT w/e 31.12.2016
VALUE (£M) / % CHG YA VALUE (£M) / % CHG YA
TOP 10 BRANDS IN LICENSEDTOP 10 BRANDS IN FOODSERVICE
24
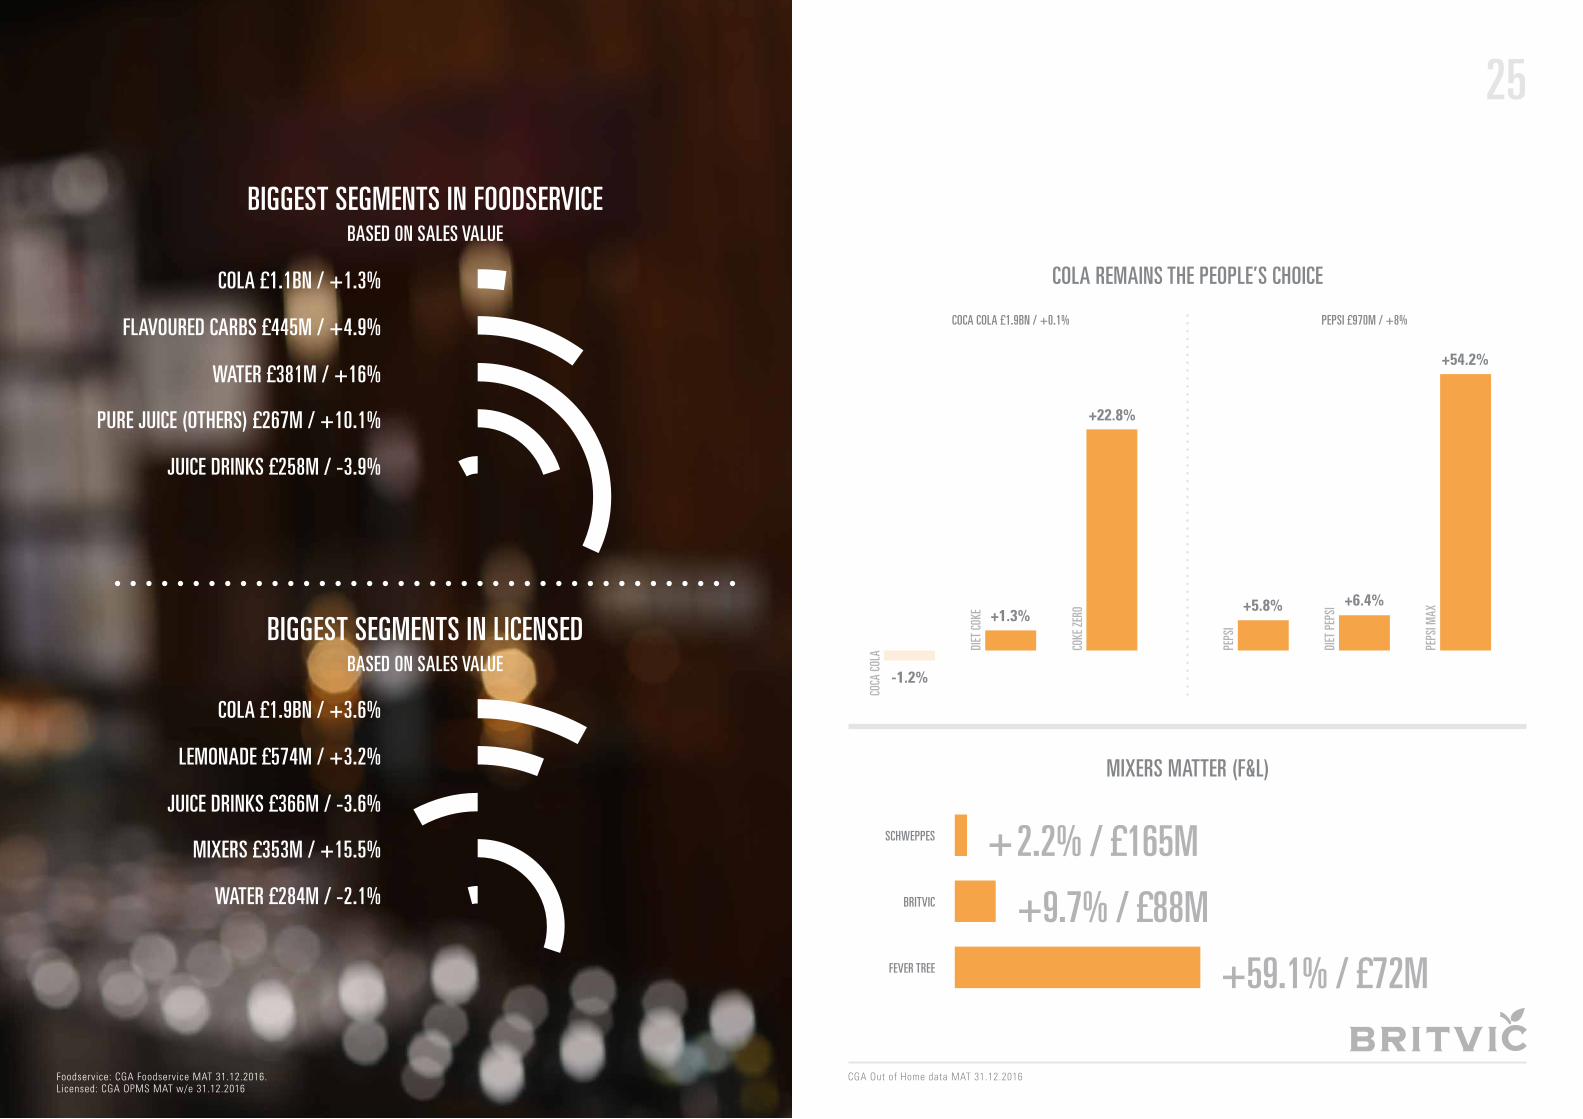
COLA £1.9BN / +3.6%
LEMONADE £574M / +3.2%
FLAVOURED CARBS £445M / +4.9%
JUICE DRINKS £366M / -3.6%
WATER £381M / +16%
MIXERS £353M / +15.5%
PURE JUICE (OTHERS) £267M / +10.1%
WATER £284M / -2.1%
JUICE DRINKS £258M / -3.9%
COLA £1.1BN / +1.3%
Foodservice: CGA Foodservice MAT 31.12.2016. Licensed: CGA OPMS MAT w/e 31.12.2016
BIGGEST SEGMENTS IN FOODSERVICE
BIGGEST SEGMENTS IN LICENSED
BASED ON SALES VALUE
BASED ON SALES VALUE0+4+446+7+552+0+0
25
COLA REMAINS THE PEOPLE’S CHOICE
MIXERS MATTER (F&L)
COCA COLA £1.9BN / +0.1% PEPSI £970M / +8%
CGA Out of Home data MAT 31.12.2016
+22.8%
+5.8% +6.4%
+54.2%
+1.3%
-1.2%
COKE
ZER
O
PEPS
I
DIET
PEP
SI
PEPS
I MAX
DIET
COK
E
COCA
COL
A 3+10+60SCHWEPPES
BRITVIC
FEVER TREE
+2.2% / £165M
+9.7% / £88M
+59.1% / £72M

26 27
2016 was full of surprises in many respects and the soft drinks industry certainly was surprised when the government announced in the Spring budget that they would be introducing a Levy on soft drinks in 2018.
Despite this and continued scrutiny by the media, the soft drinks category performed well in the Foodservice and Licensed channels with consumers choosing soft drinks on more occasions.
Forward-thinking manufacturers responded well to the health agenda which remained in the media spotlight, whilst operators began to unlock the category’s true potential by adapting their soft drinks offerings to suit today’s consumers wants and needs.
The 2016 Sof t Dr inks Story in Foodserv ice & L icensed

28What were
the key in f luences
in 2016?
Providing premium experiences in outlet became the norm, even in mainstream outlets, in 2016 as operators realised consumers’ expectations of a high-quality experience were rising. Mason jars and balloon glasses became de rigueur in bars nationwide and through more focus on presenting stylish, great tasting serves, operators were able to charge more and increase their margins as a result.
Premiumisation wasn’t limited to drinks presentation though. Across the category, new products came to market, highlighting their premium credentials with provenance, heritage and quality ingredients all proving effective ways to drive penetration. Existing soft drinks brands also upped their game, revealing new looks with more premium cues to entice the consumer.
FEVER TREE HAS ESTABLISHED ITSELF AS A MAJOR PLAYER IN THE MARKET BY FOCUSING ON ITS PREMIUM
CREDENTIALS, EV IDENT IN THE BRAND’S DESIGN, SERVES AND MARKETING COMMUNICATIONS. THE
BRAND HAS RE INVIGORATED THE MIXERS MARKET IN THE LAST FEW YEARS AND OTHER MANUFACTURERS
HAVE RESPONDED, AS NPD LAUNCHED THIS YEAR IN THE FORM OF THE LONDON ESSENCE CO. FROM
BRITVIC ’S INNOVATION INCUBATOR COMPANY, WISEHEAD PRODUCTIONS, AND THE RE-LAUNCH OF
BRITVIC ’S MIXERS RANGE, DEMONSTRATES.
SCHWEPPES ALSO RAISED ITS GAME WITH A RE-DESIGN IN 2016 , AS THE BRAND AIMED TO ACHIEVE A MORE
PREMIUM STATUS. IN OTHER CATEGORIES BRANDS SUCH AS DALSTON KOLA, FENTIMANS AND FRANKLIN & SONS ALSO MADE A PLAY FOR A SHARE OF THE MARKET
BY FOCUSING ON PREMIUM CUES.
MASON JARS AND BALLOON GLASSES
BECAME DE RIGUER IN BARS
NATIONWIDE
PREMIUMISATION TREND CONTINUES
29
J20 SPRITZ HAS HIGHLIGHTED HOW ITS L IGHT, REFRESHING STYLE MAKES IT A PERFECT PARTNER TO VARIETY OF D ISHES, RESULTING IN L IST INGS ACROSS A NUMBER OF NATIONAL OPERATORS.
Trends such as all-day dining & the growth of the social brunch occasion - particularly amongst the moderate drinking millennial generation - has provided great opportunity for soft drinks, especially at times of the day when drinking alcohol is less acceptable or desired. Adult soft drinks brands that have been quick to recognise the opportunity to align themselves with the food styles that prevail in food-led outlets have enjoyed success.
GROWTH IN SOCIALISING, PARTICULARLY WITH FOOD
SAN PELLEGRINO’S FOCUS ON THE FOODSERVICE
AND L ICENSED CHANNEL IS LONGSTANDING, WITH
THE BRAND ACTIVELY ENCOURAGING CONSUMERS
NOT TO OVERLOOK THE CHOICE OF WATER WHEN DECIDING
WHICH DRINKS TO CHOOSE TO ACCOMPANY A MEAL.
Meat Pie & Gravy Red Meat Bangers and M
ash Roast W
hite Meat
Curry
Fish & Chips
Pizza/Pasta Dressed Salads S
ticky Toffee Pudding C
hocola
te P
uddi
ng
App
le C
rum
ble
Bl
ue C
hees
e
Cured M
eat Platter
Fruity flavour and
sweetness
compliments the
strong food
flavours
Orange &
Passionfruit
WITH FOOD
30
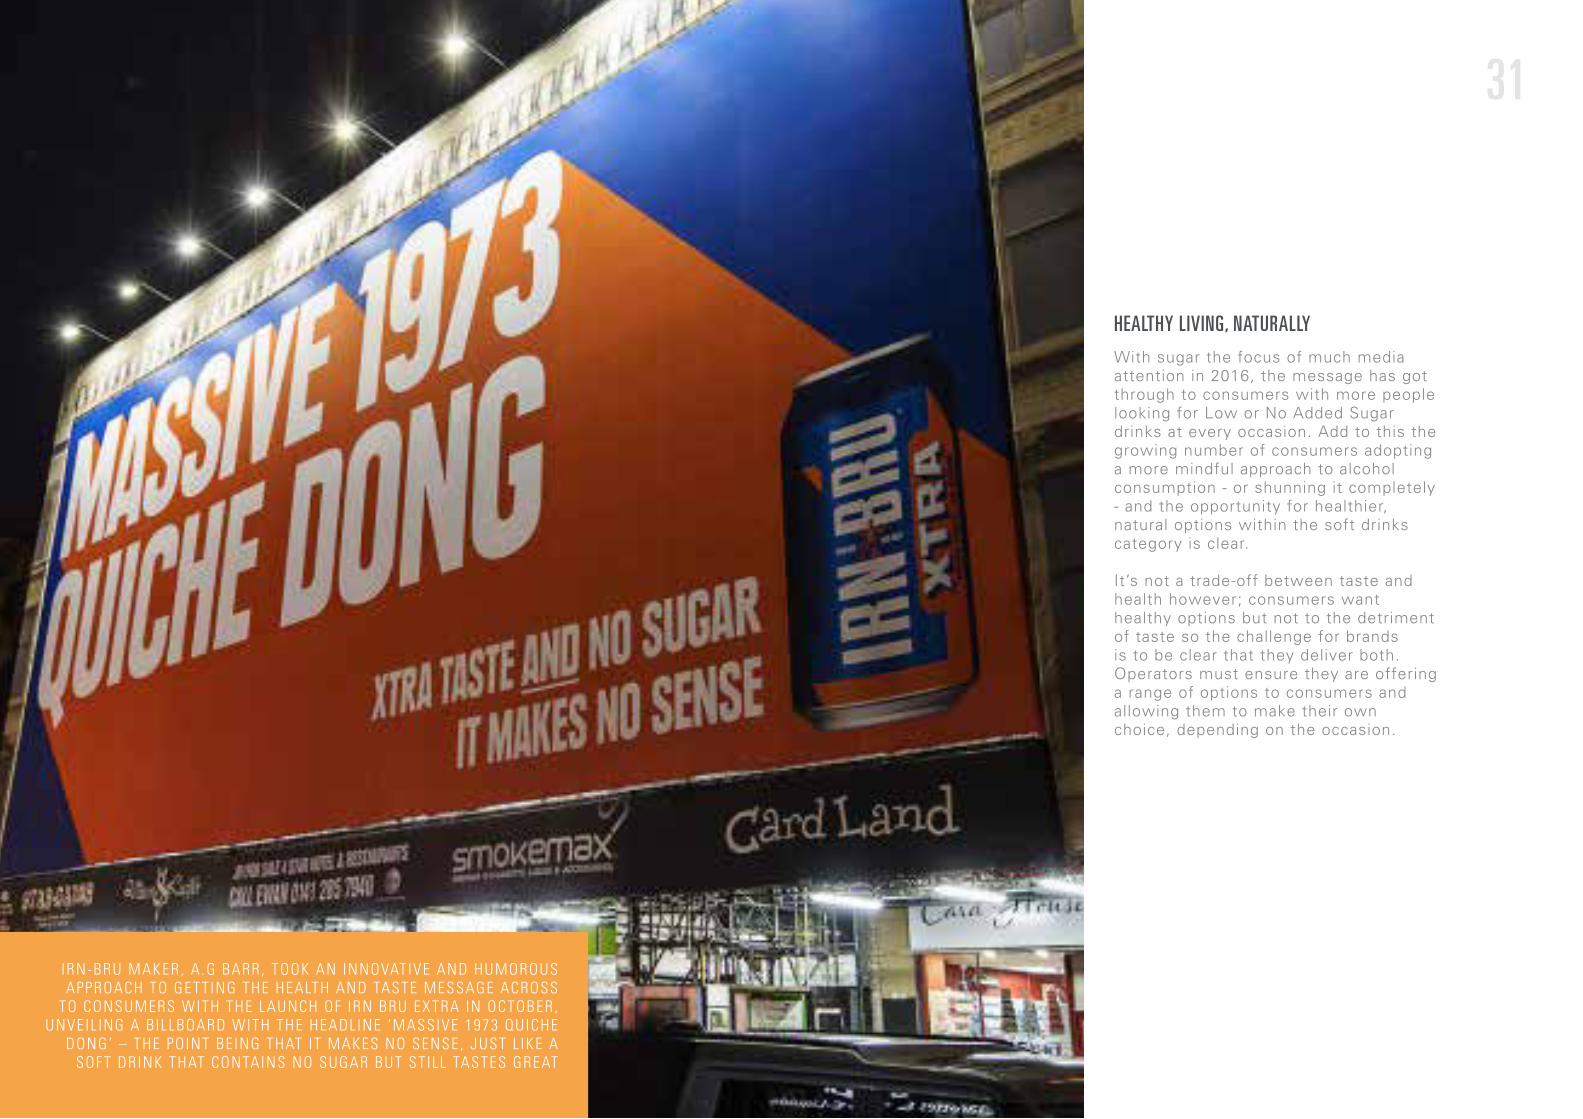
IRN-BRU MAKER, A .G BARR, TOOK AN INNOVATIVE AND HUMOROUS APPROACH TO GETTING THE HEALTH AND TASTE MESSAGE ACROSS
TO CONSUMERS WITH THE LAUNCH OF IRN BRU EXTRA IN OCTOBER, UNVEIL ING A B ILLBOARD WITH THE HEADLINE ‘MASSIVE 1973 QUICHE
DONG’ – THE POINT BE ING THAT IT MAKES NO SENSE, JUST L IKE A SOFT DRINK THAT CONTAINS NO SUGAR BUT ST ILL TASTES GREAT
31
With sugar the focus of much media attention in 2016, the message has got through to consumers with more people looking for Low or No Added Sugar drinks at every occasion. Add to this the growing number of consumers adopting a more mindful approach to alcohol consumption - or shunning it completely - and the opportunity for healthier, natural options within the soft drinks category is clear.
It’s not a trade-off between taste and health however; consumers want healthy options but not to the detriment of taste so the challenge for brands is to be clear that they deliver both. Operators must ensure they are offering a range of options to consumers and allowing them to make their own choice, depending on the occasion.
HEALTHY LIVING, NATURALLY

32 33
WITH MORE CONSUMERS ACTIVELY TRYING TO STAYING
HYDRATED, BUT LOOKING FOR SOMETHING MORE
FLAVOURSOME THAN WATER YET ST ILL BE ING HEALTHY,
BRITVIC-OWNED WATER BRAND, DRENCH, LAUNCHED A
HIGH PROFILE ATL CAMPAIGN HIGHLIGHTING TO CONSUMERS
THAT THEY DON’T HAVE TO CHOOSE BETWEEN JUICE AND
WATER – THEY CAN HAVE BOTH WITH DRENCH.
THE CAMPAIGN ALSO EMPHASISED THE BRAND’S
LOW CALORIE COUNT – LESS THAN HALF THE CALORIES
OF AN AVERAGE SPARKL ING FRUIT DRINK AND THE FACT
THE BRAND CONTAINS ONLY NATURALLY SOURCED
SWEETENERS.

34
It’s not just about the product for consumers these days, they want an experience in outlet too and good staff are crucial to this. Staff trained to offer choice and recommendation to consumers looking for guidance are invaluable as recommendations are a win-win situation for both the operator and the consumer;
the consumer feels they have an experience tailored to them whilst the operator has the opportunity to get the consumer to trade up, boosting margins. With recent research by Britvic1 revealing that millennials are particularly receptive to recommendations from bartenders, the importance of great staff shouldn’t be underestimated.
PEOPLE & PERSONALISATION = PROFIT
TECHNOLOGY HAS ALSO UNLOCKED GREAT
PERSONALISATION OPPORTUNITY IN THE
FOODSERVICE & L ICENSED CHANNEL, WITH PEPSICO
DEVELOPING ENGAGING PEPSI SP IRE© TECHNOLOGY, WHICH
ALLOWS CONSUMERS TO CUSTOMISE THEIR FOUNTAIN
DRINKS IN A MULTITUDE OF WAYS WITH DIFFERENT
SYRUPS, G IV ING THEM A TRULY UNIQUE PRODUCT TAILORED TO
THEIR OWN TASTES.
1Base: 949 (224 millennials) UK shoppers / Source: Savvy Shopper Panel August 2015
Foodserv ice & L icensed Future Out look
The competition for the leisure pound isn’t going to get any easier in the year ahead; inflation is expected to rise by 3% in 2017 and with uncertainty over Brexit, the expectation is for tougher times, with consumers of all age groups expecting to have to cut back on higher ticket and discretionary spend visits2. The impact on the channel of the Soft Drinks Industry Levy, which comes into effect in 2018, remains to be seen, but ultimately, it does provide an opportunity to nudge consumers towards lower sugar options.
Despite recent economic uncertainty, the channel has remained buoyant since the referendum and the longer term outlook is for growth in segments of the channel where soft drinks are of increasing importance. With one in five adults in the UK now teetotal and many consumers consciously trying to reduce their alcohol intake, soft drinks are becoming increasingly important in the Foodservice and Licensed channel.
The good news for operators is that if get their soft drinks offering right, tailoring it to their specific customers and focusing on creating sensational experiences for them, they can unlock the category’s true potential and reap the rewards.
2MCA Eating Out report July 2016
35

36
WHAT DOES THIS MEAN FOR SOFT DRINKS?
With traditional glass formats proving impractical for both the on-the-go shopper and for delivery services, manufacturers will be focusing on pack innovation to address these challenges.
Staying hydrated on-the-go will continue to be important for busy consumers so brands that successfully communicate their hydrating properties alongside a compelling taste message will be in demand.
37Expected Trends in
Foodserv ice & L icensed in
2017+
The established ‘foodie’ culture and the extensive breadth of high-quality outlets at all price points will see the appetite for eating out continue. Average spend per visit is forecasted to continue to grow +6%, only slightly slower than in 2016. However, eating out participation and average frequency are both expected to decline marginally by -1% in 2017.
Whilst still of great importance, family and socialising visits are
predicted to be slightly less relevant occasions in 2017, whilst convenience and on-the-go occasions are expected to continue to increase.
Frequency is expected to slow, particularly for breakfast and dinner, but lunch will be more stable. There are signs that 2017 might show the end of the breakfast boom following strong growth in recent years but the occasion will continue to be important.
EATING OUT WILL REMAIN A KEY LEISURE ACTIVITY, BUT THE PACE OF CHANGE WILL REMAIN CHALLENGING1
WHAT DOES THIS MEAN FOR SOFT DRINKS?
Soft drinks will remain the no.1 choice with food but with consumers’ expectations of choice set to remain high, operators need to widen their
soft drinks offering to succeed.
Soft drinks that work well with emerging food trends and enduringly popular food styles, such as barbecue/American, premium chicken and
Asian foods, are set for further growth, especially those that also meet other consumer needs, such as being natural or low in sugar.
The breakfast occasion will remain a lucrative opportunity for operators through juices, water and flavoured hot drinks.
MCA Top of Mind Management Briefing 2017
2Busy lifestyles will continue to drive more eating-out occasions, with 24-hour grazing and all-day dining continuing to provide opportunity for operators who tailor their offering to these occasions to maximise their profits.
There will be increasing competition from delivery services who are successfully addressing the needs of the time-poor professional.
Street food and on-the-go will grow faster than other segments and for the on-the-go consumer, ‘real food and drink’ snacking solutions will be increasingly desired.
‘ON-THE-GO’ LIFESTYLES WILL CONTINUE TO IMPACT THE CHANNEL
38 39
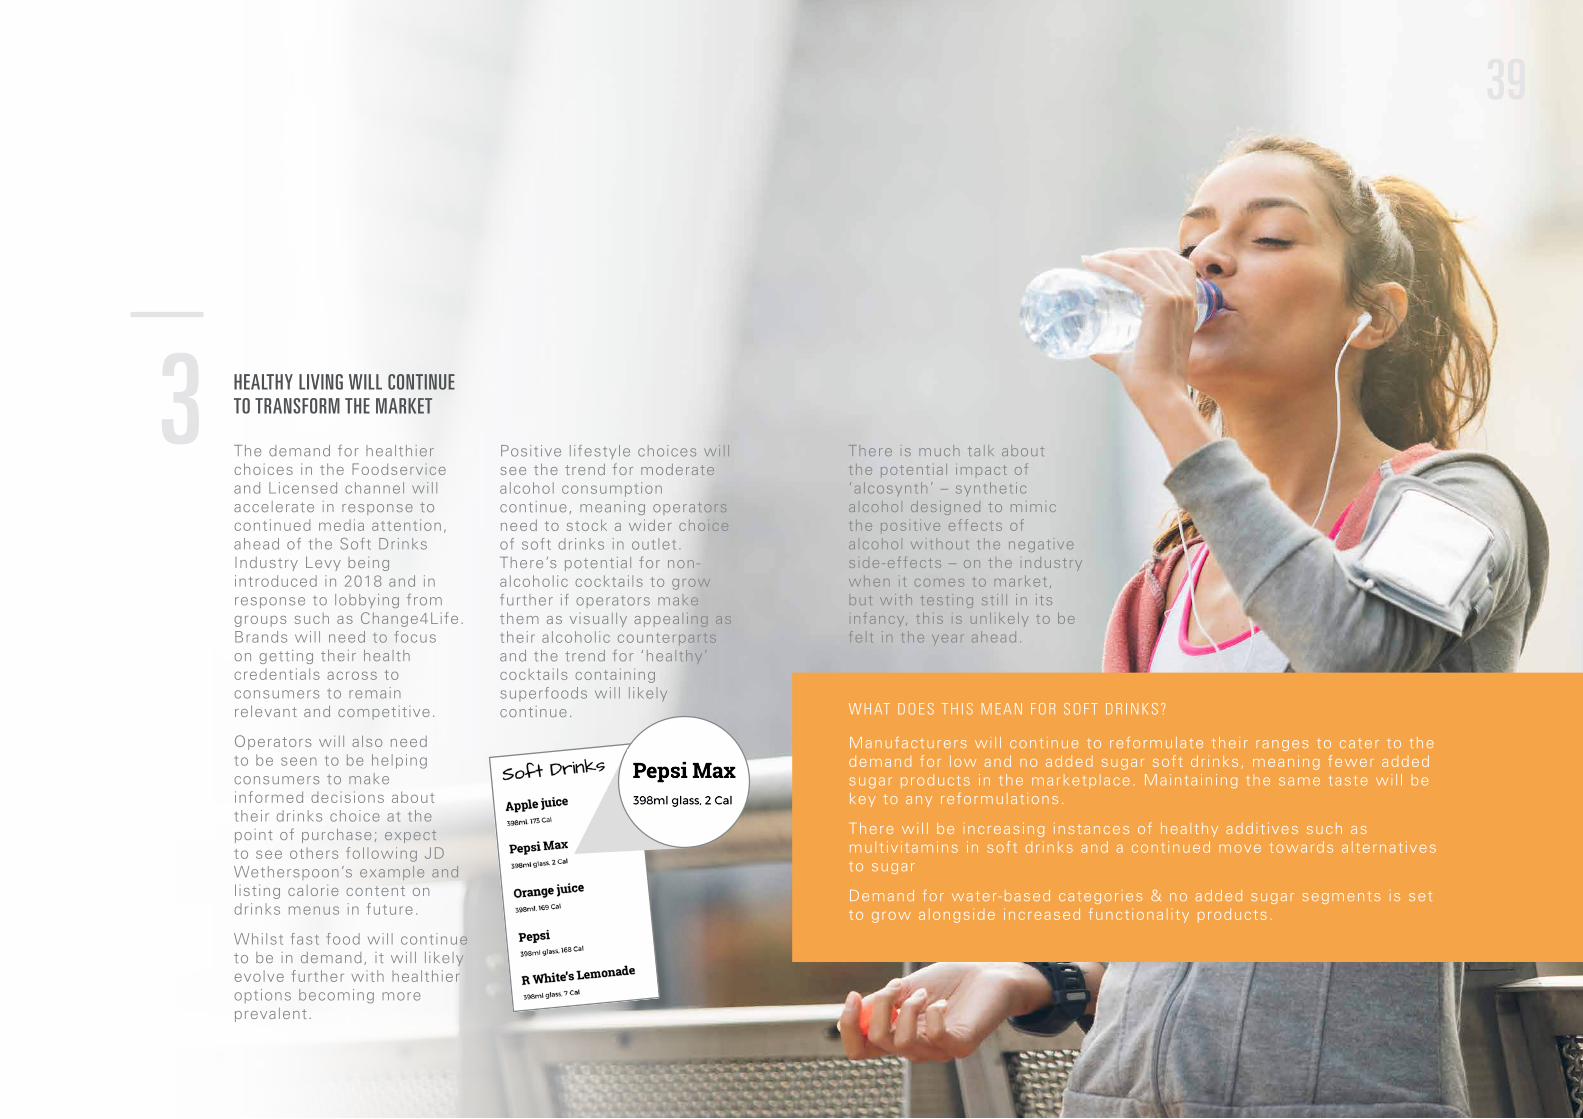
The demand for healthier choices in the Foodservice and Licensed channel will accelerate in response to continued media attention, ahead of the Soft Drinks Industry Levy being introduced in 2018 and in response to lobbying from groups such as Change4Life. Brands will need to focus on getting their health credentials across to consumers to remain relevant and competitive.
Operators will also need to be seen to be helping consumers to make informed decisions about their drinks choice at the point of purchase; expect to see others following JD Wetherspoon’s example and listing calorie content on drinks menus in future.
Whilst fast food will continue to be in demand, it will likely evolve further with healthier options becoming more prevalent.
Positive lifestyle choices will see the trend for moderate alcohol consumption continue, meaning operators need to stock a wider choice of soft drinks in outlet. There’s potential for non-alcoholic cocktails to grow further if operators make them as visually appealing as their alcoholic counterparts and the trend for ‘healthy’ cocktails containing superfoods will likely continue.
HEALTHY LIVING WILL CONTINUE TO TRANSFORM THE MARKET3
There is much talk about the potential impact of ‘alcosynth’ – synthetic alcohol designed to mimic the positive effects of alcohol without the negative side-effects – on the industry when it comes to market, but with testing still in its infancy, this is unlikely to be felt in the year ahead.
WHAT DOES THIS MEAN FOR SOFT DRINKS?
Manufacturers will continue to reformulate their ranges to cater to the demand for low and no added sugar soft drinks, meaning fewer added sugar products in the marketplace. Maintaining the same taste will be key to any reformulations.
There will be increasing instances of healthy additives such as multivitamins in soft drinks and a continued move towards alternatives to sugar
Demand for water-based categories & no added sugar segments is set to grow alongside increased functionality products.

40 41
The number of times the word ‘craft’ appears in articles about food and drink today shows that the nation’s interest in provenance and production is not fading. These discerning drinkers are willing to pay a premium where they feel its warranted – and these premiums are often significant, meaning great opportunity for better margins for manufacturers and operators alike.
The premium end of the soft drinks category was where value growth was most noticeable in 2016 with +32% growth reported by CGA3 and the signs are that growth will remain strong in 2017. The gap in the market for adult soft drinks has been well and truly identified with companies including Diageo and Britvic focusing heavily on innovation in this area with notable success for Seedlip and Thomas & Evans.
EATING OUT WILL REMAIN A KEY LEISURE ACTIVITY, BUT THE PACE OF CHANGE WILL REMAIN CHALLENGING4
WHAT DOES THIS MEAN FOR SOFT DRINKS?
As more companies wake up to the opportunity premium adult soft drinks present, more new premium products targeted at adults are likely to come to market in 2017, with heritage and provenance cues brought to the fore in packaging design and marketing communications. With price points commanded higher in this segment, competition is likely to be fierce but highly profitable for the winners.
Premiumisation is not limited to products - operators will need to deliver a premium experience at all touchpoints in outlet to remain competitive as delivery services makes the fight for the leisure pound increasingly tough.
3CGA On Premise Measurement Data MAT to 2016P13 - 31/12/2016

42 43
So what does th is mean fo r opera tors?
The opportunity for soft drinks in the Foodservice and Licensed channels is evident but to succeed, operators need to bear in mind the following key insights.

44 45Creat ing
Sensat iona l Dr inks
Exper iencesIn this age of constant connectivity, consumers’ expectations are rising. They expect to be delighted by great experiences, surprised by hidden value and tempted to be more adventurous. When they are out, they are looking for moments that are different from those they can create at home. They are happy to treat themselves, but only if they feel it’s worth paying more for and they enjoy personalising the experience to suit their tastes.
Operators need to firstly get the basics right by ensuring a wider choice of adult soft drinks that includes Low or No Added Sugar options, but then go beyond to create solutions that will inspire guests and exceed their expectations. This could be an innovative way of serving a bar staple such as a lime & soda that surprises and delights the customer, anything that adds value and makes the experience more special /personal for the consumer.
ADDING VALUE AND MAKING
THE EXPERIENCE MORE SPECIAL/
PERSONAL TO THE CONSUMER
83%of consumers would be inspired to order a
sensationally served drink if they saw it served at
another table
71%of consumers would be more likely to choose
something different from the usual if they were more aware of the range of soft
drinks available
72%would likely order a soft drink special if
it was highlighted on the menu
1 in 2would likely try a soft
drinks creation experience allowing them to mix their
own drink
THERE IS STRONG DEMAND FOR SOMETHING DIFFERENT AND GREAT POSSIBILITY TO BREAK THE ROUTINE
Source: Consumers attitudes to menu and soft drinks choice in outlet’ Britvic consumer survey July 2016

46 47
Over 6 in 10 consumers would
order a second soft drink if they receive a great
serve
4 in 10 consumers are willing to
pay more for a sensationally
served soft drink
Nearly 6 in 10 are more likely come back to the outlet
if they receive a sensationally
served soft drink
THE RIGHT SERVE AND ENGAGING STAFF CAN DELIVER GREAT
INCREMENTAL VALUE FOR SOFT DRINKS
6 in 10
4 in 10
6 in 10
Source: Consumers attitudes to menu and soft drinks choice in outlet’ Britvic consumer survey July 2016

48 49
Source: Consumers attitudes to menu and soft drinks choice in outlet’ Britvic consumer survey July 2016
Enhanc ing EveryFood
Moment
of consumers rating the choice of soft drinks as “very important” in the overall meal experience76%
When consumers eat out – be it a family dinner at a favourite restaurant or a quick break away from your desk in a sandwich shop – they want to enjoy the experience (they’re paying for it after all). In today’s world of discerning diners, it’s not enough for operators to simply provide tasty food, drinks are also important to make the overall experience the best it can be for the diner. 2.2 billion food occasions are socialising visits and with 76% of consumers rating the choice of soft drinks as “very important” in the overall meal experience, operators need to give their soft drinks range the consideration it warrants to maximise profits and give soft drinks as much care and attention as they do to the food it compliments. There are plentiful learnings to be taken from the wine and beer categories – the opportunity for staff recommendation as well as food pairing suggestions on the menu with clear taste descriptors, for example – all helping to guide the consumer and ensure their meal is enhanced by their choice of soft drink.
FOOD OCCASIONS ARE SOCIALISING VISITS

50
Over 8 in 10 consumers welcome
recommendations from staff on
drinks that complement their meal, offering a
great opportunity to trade
customers up, when appropriate
There’s great opportunity to drive profits through the
second drink with 6 in 10 consumers saying they would
order a second drink if asked by a
waiter
would likely order a soft
drink special if recommended by
staff
THE MENU AND STAFF ARE POWERFUL SOURCES OF INSPIRATION FOR CONSUMERS CHOOSING DRINKS WHEN EATING OUT
8 in 10 6 in 10 64%
Source: Consumers attitudes to menu and soft drinks choice in outlet’ Britvic consumer survey July 2016
51
would likely order a shared drink if eating out
as a group, so operators need to ensure they are offering not
just the right soft drinks, but also in the right formats
of consumers say that a description
of the drink/flavour is likely to
inspire them to buy a soft drink
Pictures of serves,
information on ingredients and calorie contents are indicated as possible sources
of inspiration
62% 34%

52 53
Insp i r ing L i festy le Cho ices
Consumers are being actively encouraged to make healthier choices these days, whether it’s drinking less alcohol, cutting down on sugar or simply being more active, so operators who help their customers to choose healthier options are the ones who will thrive. When consumers are on-the-go, they still expect to
be inspired by the choice of food and drink available in outlets. They want to see healthier options alongside ‘treat items’ - not in place of them - as choice is still of utmost importance. When healthier options are presented in an engaging way, it makes it much easier for the consumer to choose them.
THEY WANT TO SEE HEALTHIER
OPTIONS ALONG SIDE ‘TREAT
ITEMS’Sugar, calorie content and carbonation have similar importance in influencing soft drinks choice when eating out.
HEALTHIER SOFT DRINKS OPTIONS SHOULDN’T BE CONSIDERED A NICE-TO-HAVE, THEY SHOULD BE AN ESSENTIAL FIXTURE ON ANY OUTLET’S DRINKS MENU IN TODAY’S WORLD
4Source: ONS 2015. 5Source: Britvic bespoke research through MCA consumer panel 2016. 5Source: Mintel, Consumer attitudes towards sugar and sweeteners, 2015
1 in 5adults in the UK now
teetotal, soft drinks are increasingly important
to the customer in the Foodservice and Licensed channel4
of parents are worried about the amount of sugar in their
children’s diets so low and no added sugar drinks should be vital inclusions on children’s
drinks menus5
2/3cite carbonation and calories as
influences
22%of consumers state sugar is a factor for
them when choosing a soft drink
25%

54 55
Def in i t ions / G lossary
Foodservice – Defined in this report as Education, Health & Welfare, Workplace Catering, Travel & Leisure, High Street Food to Go, Quick Service Restaurants.
Total Licenced – Defined in this report as Restaurants, Food Led Pubs, Wet Led Pubs, Sport/social Clubs, Wine Bars, Circuit Bars, Proprietary Clubs, Hotels.
Food-Led Pubs – outlets that have a dining menu of some description.
Wet-Led Pubs – ‘wet-led’ pubs are outlets that don’t sell food (other than over-the-counter snacks such as packaged crisps).
Free of Tie – pubs that are bought and owned in their entirety by the landlord.
Leased – landlords of leased pubs have a long-term (traditionally 10-25 year) commercial and assignable lease.
Tenanted – landlords of tenanted pubs are more likely to have shorter term agreement which is contracted outside of the Landlord and Tenant Act (meaning that the term is fixed for 3 or 5 years and no longer).
Managed – a brewery appoints a salaried manager, while retaining ownership of the pub; this arrangement is a “managed house”.
Carbonates – a drink made predominantly from carbonated water to which juice or flavourings have been added.
Cola – cola-flavoured carbonated drinks, including cola with flavours such as cherry, twist of lemon, etc. Includes all clear and coloured colas.
Fruit Flavoured Carbonates – flavours are typically orange, cherry, lime, blackcurrant, apple, pineapple and grapefruit, lemon, lemon and lime, tropical and other mixed fruit flavours. Also includes Tizer, Dr Pepper and Vimto, as these brands contain fruit.
Non-Fruit Flavoured Carbonates – Non-fruit flavoured carbonates, excluding cola but including Irn Bru. Also includes traditionals such as cream soda, ginger beer and shandy.
Lemonade – All conventional clear and cloudy or traditional, carbonated lemonade; flavoured with lemon juice and additional fruit flavours to produce coloured lemonade.
Energy Drinks – All ‘energy boosting’ drinks such as Red Bull, normally fizzy.Sports drinks – Drinks that are specifically designed to replace minerals, sugars, trace elements and fluids as a result of exercise. Can include dilutables and powders.
Squash – Concentrated beverage, commonly called squash, cordial or syrup. Must be diluted prior to consumption.
Juice Drinks – A non-carbonated drink which generally contains fruit juice (some may not) plus added water or other ingredients.
Pure Juice (other) – A non-carbonated 100% pure juice or other juice blend with no added water or sweetener, that may be chilled or long-life. Includes all concentrated juices, with the exception of frozen juice.
Water – Still or sparkling water with nothing else added.
Flavoured water – Sparkling or still flavoured water, or functional water (excluding sports water).

56 57
L icensed Data
Value Sales (£ m)
Value % Chg vs LY
Volume Sales (‘000 Lt)
Volume % Chg vs LY
Total Soft Drinks 4,309 2.8% 738,410 0.4%
Total Soft Drinks (Draught)
2,199 2.8% 432,216 0.4%
Total Soft Drinks (Packaged)
2,110 2.9% 306,193 0.4%
Value Sales (£ m)
Value % Chg vs LY
Volume Sales (‘000 Lt)
Volume % Chg vs LY
Cola 1,877 3.6 322,561 1.5
Flavoured Carbs 180 2.2 32,510 1.6
Gluc/Stim/Sport 215 -1.1 24,803 -5.0
Juice Drinks 366 -3.6 49,117 -4.9
Lemonade 574 3.2 108,441 -0.3
Mixers 353 15.5 36,099 13.1
Pure Juice 249 6.1 30,825 6.1
Squash 211 -3.8 78,939 -2.8
Water 284 -2.1 55,114 -3.0
Value Sales (£ m)
Value % Chg vs LY
Volume Sales (‘000 Lt)
Volume % Chg vs LY
COCA-COLA 568 -0.5 96,975 -0.5
PEPSI 512 3.2 82,467 -1.6
DIET COKE 425 2.9 70,894 2.4
SCHWEPPES LEMONADE
258 4.5 46,531 -
DIET PEPSI 257 5.8 49,618 2.3
R WHITES 244 6.4 49,160 5.5
BRITVIC J2O 210 -4.6 26,402 -5.4
RED BULL 161 0.7 15,835 -1.9
SCHWEPPES MIXERS
112 -1.1 11,872 -1.7
SCHWEPPES SQUASH
103 -6.9 41,038 -4.6
LICENSED - TOTAL SOFT DRINKS
SOFT DRINK CATEGORIES IN LICENSED
TOP 10 BRANDS IN LICENSED
Total Foodservice & Licensed: CGA Out of Home data MAT 31.12.2016Foodservice data: CGA Foodservice MAT 31.12.2016
Licensed data: CGA OPMS MAT 31.12.2016

58 59
Value Sales (£ m)
Value % Chg vs LY
Volume Sales (‘000 Lt)
Volume % Chg vs LY
CCGB 1,718 0.8 301,727 -0.4
BRITVIC 1,575 3.1 276,425 0.8
BARRS 109 -7.3 22,099 -7.8
RED BULL 164 1.0 16,160 -1.5
GERBER 75 12.7 10,974 10.5
LR SUNTORY 44 -2.3 9,396 -4.7
J N NICHOLS 34 -5.1 7,413 -6.2
NESTLE 29 4.6 5,208 7.0
HARTRIDGES 21 -8.1 4,253 -10.6
COTT BEVERAGES
13 -15.3 3,251 -17.2
Value Sales (£ m)
Value % Chg vs LY
Volume Sales (‘000 Lt)
Volume % Chg vs LY
Cola 1,085 1.3 386,869 2.4
Flavoured Carbs 445 4.9 159,725 5.0
Gluc/Stim/Sport 105 -0.8 25,300 -1.3
Juice Drinks 258 -3.9 87,966 -6.1
Lemonade 28 8.4 11,257 19.8
Mixers 12 -6.2 1,610 -7.2
Pure Juice 267 10.1 102,276 11.5
Squash 31 -23.4 142,390 -33.2
Water 381 16.0 194,285 24.6
Value Sales (£ m)
Value % Chg vs LY
Volume Sales (‘000 Lt)
Volume % Chg vs LY
Total Soft Drinks 2,612 3.7 1,111,677 -0.9
Total Soft Drinks (Draught)
766 0.6 255,532 1.1
Total Soft Drinks (Packaged)
1,846 5.0 856,146 -1.4
Value Sales (£ m)
Value % Chg vs LY
Volume Sales (‘000 Lt)
Volume % Chg vs LY
TOTAL SOFT DRINKS,FULL SUGAR
3,122.0 2.1% 531,652 -0.4%
TOTAL SOFT DRINKS,LOW CALORIE
1,187.0 4.8% 206,757 2.7%
TOP 10 MANUFACTURERS IN LICENSED
SOFT DRINK CATEGORIES IN FOOD SERVICE
FOOD SERVICE - TOTAL SOFT DRINKS
FULL SUGAR VERSUS LOW CALORIE PERFORMANCE IN LICENSED
Foodserv ice Data
CGA Brand Index, Data to w/e 31.12.2016 CGA Brand Index, Data to w/e 31.12.2016

60 61
Value Sales (£ m)
Value % Chg vs LY
Volume Sales (‘000 Lt)
Volume % Chg vs LY
Coca Cola 651 -2.3 223,348 -3.0
Diet Coke 226 -1.7 82,040 2.5
Fanta 141 -1.0 50,113 -0.2
Pepsi 114 19.0 45,079 19.9
Sunpride 52 12.3 33,493 3.2
Sprite 49 -10.4 26,925 -1.3
Calypso 48 -6 26,925 -1.3
Tango 47 50.3 18,009 47.8
Oasis 46 -0.3 16,166 -2.3
Harrogate Spa 40 28.9 26,945 34.9
Value Sales (£ m)
Value % Chg vs LY
Volume Sales (‘000 Lt)
Volume % Chg vs LY
CCGB 1,343 -1.4 468,847 -0.1
Britvic 313 18.8 121,069 16.9
LR Suntory 103 -10.5 36,486 -11.9
Gerber Juice Company
55 0.9 35,383 -10.9
Nestle 69 6.9 30,038 23.8
Danone 39 4.3 15,130 2.8
Barr 32 4.5 12,974 6.6
Red Bull 37 -3.3 5,050 -4.9
J N Nichols 8 -6.2 3,115 -6.6
Bottle Green 9 24.2 1,611 57.3
TOP 10 BRANDS IN FOOD SERVICE TOP 10 MANUFACTURERS IN FOOD SERVICE
Value Sales (£ m)
Value % Chg vs LY
Volume Sales (‘000 Lt)
Volume % Chg vs LY
Total Soft Drinks FULL SUGAR
1,828 1.2 728,540 -9.7
Total Soft Drinks LOW CALORIE
784 9.8 383,137 22.0
FULL SUGAR VERSUS LOW CALORIE PERFORMANCE IN FOOD SERVICE
CGA Brand Index, Data to w/e 31.12.2016 CGA Brand Index, Data to w/e 31.12.2016

62
Br i tv ic Sof t Dr inks LtdBr i tv ic Head Of f ice
Breakspear ParkBreakspear Way
Hemel Hempstead HP2 4TZ