Soft and Hard Wheat MillingSo –what are the differences between hard and soft wheat? •Difference...
41
ة ي م اش له ة ا ي ن د ر ة ا ك ل م لم اSoft and Hard Wheat Milling 22 ND IAOM - Middle East and Africa Hashemite Kingdom of Jordan October 2011
Transcript of Soft and Hard Wheat MillingSo –what are the differences between hard and soft wheat? •Difference...

المملكة األردنية الهاشمية
Soft and Hard
Wheat Milling
22ND IAOM - Middle East and Africa
Hashemite Kingdom of Jordan
October 2011

Thanks and Acknowledgements
• Henry Stevens – for his wonderful 2000 paper on this subject to
the AOM, much of which is recycled here.
• Dr. Craig Morris and the Agricultural Research Service of the
USDA for the great SEM photos.
• The Buhler Group for their photos and contribution of materials
for this presentation.
• Dick Prior – for inviting me
• Sciencephotolibrary.com for the wonderful wheat photo.

Scope of this presentation
Physical differences
Milling Differences
Expectations

Fraternal greetings from the millers of North Africa
who cannot be with us today.

‘HARDNESS’ defined
1. The property of being rigid and resistant to pressure
2. The state or quality of being hard: the hardness of ice.
3. A relative degree or extent of this quality: wood of a
desirable hardness.
4. Mineralogy . the comparative ability of a substance to
scratch or be scratched by another.
5. Metallurgy . the measured resistance of a metal to
indention, abrasion, deformation, or machining. This is
probably the most fitting definition for milling.

Bran
Aleurone
Endosperm
© sciencephoto.com

So – what are the differences between hard and soft wheat?
• Difference is in physical hardness or
resistance to compression forces.– Is not correlated to vitreosity. (R2 of 0.18)
– Hardness IS correlated to protein. (R2=.62)
– And to whole wheat ash (r = -0.55)*
– And to semolina yield (0.52)*
– And to flour Protein (0.42)* by inference with wheat protein.
– And Zeleny sedimentation (0.32)*
– And Starch damage.
– And Flour granulometry.
– And rollermill power.
– And sifter throughput.
* Wheat Hardness in Relation to Other
Quality Factors
Marie HRUŠKOVÁ and Ivan ŠVEC

Some scientific references.

Wheat grain hardness results from highly conserved mutations in
the friabilin components puroindoline a and b
• ‘‘Soft’’ and ‘‘hard’’ are the two main market classes of
wheat (Triticum aestivum L.) and are distinguished
by expression of the Hardness gene.
• Friabilin, a marker protein for grain softness (Ha),
consists of two proteins, puroindoline a and b (pinA
and pinB, respectively).
Proc. Natl. Acad. Sci. USA
Vol. 95, pp. 6262–6266, May 1998
Genetics
MICHAEL J. GIROUX &
CRAIG F. MORRIS

Hardness to Protein - US Wheat classes

Hardness to Protein - US Wheat classes
Hard wheats
Soft wheats

To millers it is a question of;
• What is the ideal tempering time to permit
the most complete separation of
components.
• How strongly bonded the endosperm
granules are – by the ‘interstitial protein’.
• How densely packed are the endosperm
granules.
• How much compressive force is needed to
reduce the granules to flour.

Getting to the point!

Soft (L) wheat endosperm and Hard (R) Wheat
Soft Wheat Hard Wheat

A. Soft and B. Hard wheat flour

• Now we know what
hardness is – how do we
measure it?

The old millers knew
about hardness
But, biting the wheat
was subjective and
difficult to reproduce

The Single Kernel Characterization System
from Perten Instruments.
• Objective method to determine
hardness.
–And tempering time.
–And grinding pressure.
–And sifter surface.

19
© Perten instruments & others
The Perten Single Kernel Characterization System or SKCS


4 Hrs 30 Hrs
Establishing the baseline
for your optimum time tests
SKCS hardness
Using the SKCS

Weigh kernel
Sample
Very simplistic description of the
function of the SKCS
Moisture
Diameter
Crushing force
Kernels held in place by vacuum

The Tempering Process
• Hard Wheats = Osmosis (SLOW)
• Soft Wheats = Capillary Action (FAST)
Density or
Space
between
Starch
granules

Test milling - straight grade ash vs. temper time
y = 0.0036x2 - 0.1243x + 1.5309
R2 = 0.9341
0
0.05
0.1
0.15
0.2
0.25
0.3
0.35
0.4
0.45
0.5
0.55
0.6
0.65
0.7
0.75
0.8
0.85
0.9
0.95
1
1.05
1.1
1.15
1.2
1.25
1.3
1.35
1.4
0 5 10 15 20 25 30 35 40
temper time (hours)
As
h (
14
% h
2O
)
Δ1
Δ2
Δ3
Our Target
Temper Time
Statistical "Window of Opportunity"
0.55 Ash limit
Δ2
This wheat is best milled between
14 and 20 hrs.
With a tolerance between 12 and
24 hrs.
It tolerates overtempering better
than undertempering

Objectives of the Grinding process
• Break system
– Shearing force.
– Separates components of wheat.
• Reduction system
– Compressive force.
– Reduces semolina to flour.

=
=
Reduction System:Compressive force Break System:Shear force
Difference in function
Separation easy
Separation very
difficult to
impossible!

The Sifting Process Soft WheatHard Wheat
agglomerates

Process of agglomeration – soft flour
Mix of granules and clusters.
Agglomerated composites.
Natural attraction of fine particles.

Soft wheat does not sift as easily
• Agglomerates of low density do not sift as
easily as free flowing granular products.
• Soft wheat produces finer flour particles
which agglomerate. Hard wheat produces
coarser products which do not agglomerate.
• Measured in Kg/Sq.M/Hour of sifter material.
• Soft wheat mills need more Square Meters of
sifter area.
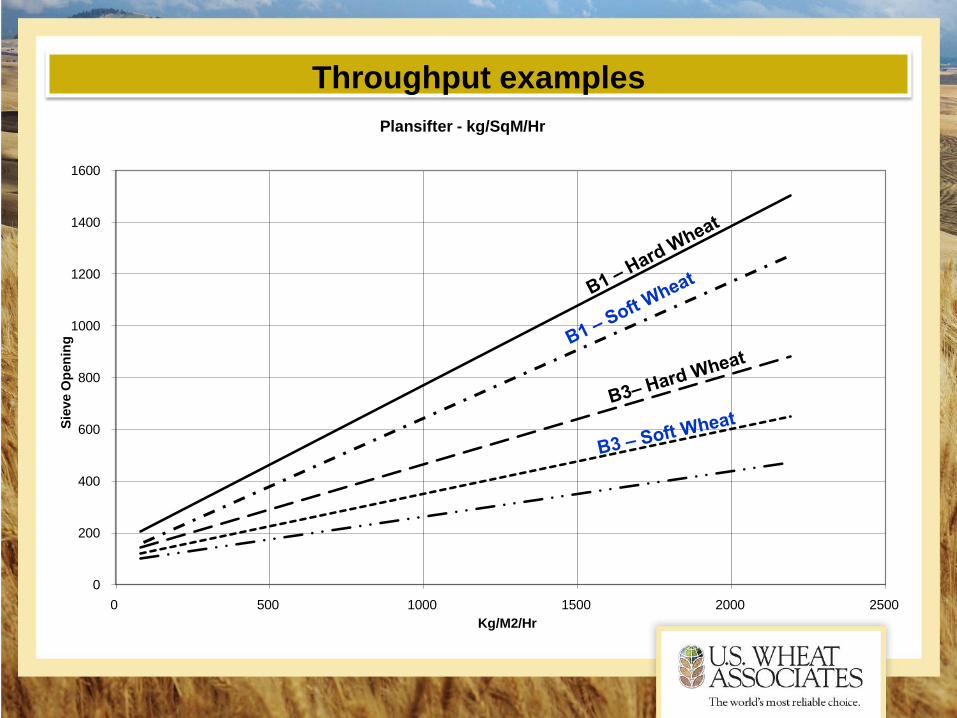
Throughput examples
0
200
400
600
800
1000
1200
1400
1600
0 500 1000 1500 2000 2500
Sie
ve O
pen
ing
Kg/M2/Hr
Plansifter - kg/SqM/Hr
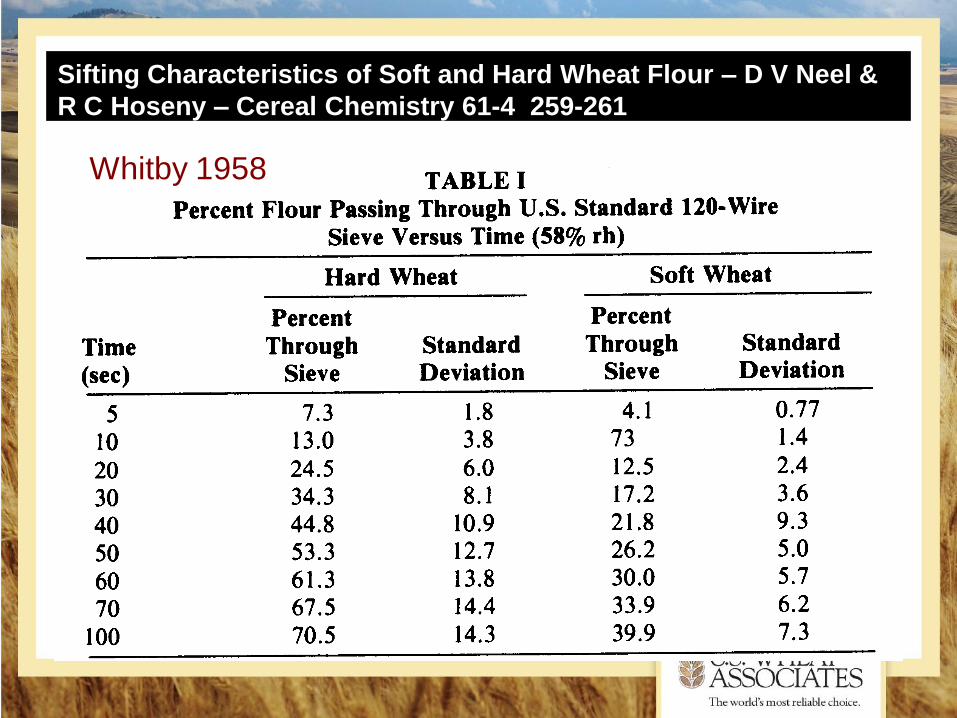
Sifting Characteristics of Soft and Hard Wheat Flour – D V Neel &
R C Hoseny – Cereal Chemistry 61-4 259-261
Whitby 1958

Conclusions of their study:
The sieving index for hard and soft wheat flour was
controlled by the cohesiveness of the flour system. The
bulking number and bridging threshold tests identified that
moisture content, presence or absence of fat, or particle
size distribution and particle surface roughness, were
involved in flour cohesion. Hard and soft wheat flour did
not have the same sieving indexes until these four
characteristics were held at equivalent values.
Hard Wheat needs more power to grind
• Physical grinding of hard wheat semolina
into flour needs more power.
• Also, more composite particles are produced
needing purification, and scratch or sizings
passages to break up composite particles for
purification.

Determination of Roll horsepower:
Pt(Kw) = QxK( )´K1éë ´K2´K3´K4]+Pv
Symbol Definition
Pt Roll power in Kilowatts (consumed)
Q Stock quantity in Kg/min
K Grinding power coefficient for passage
K1 Coefficient for power factor and mechanical losses
K2 Wheat hardness coefficient
K3 Ambient temperature coefficient
K4 Location Altitude coefficient
Pv Rollermill power – no load.
Values of coefficient K2 = 1.00 on soft wheat, 1.03
on hard wheat and 1.08 on durum wheat.

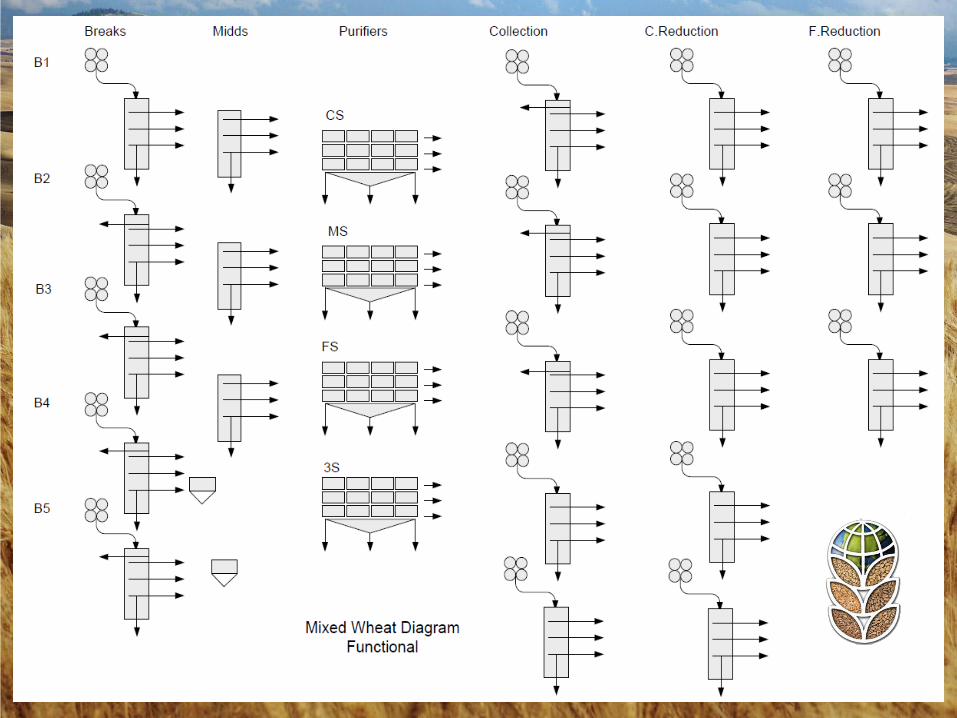
A hard wheat
Diagram

A soft wheat diagram

Durum diagram
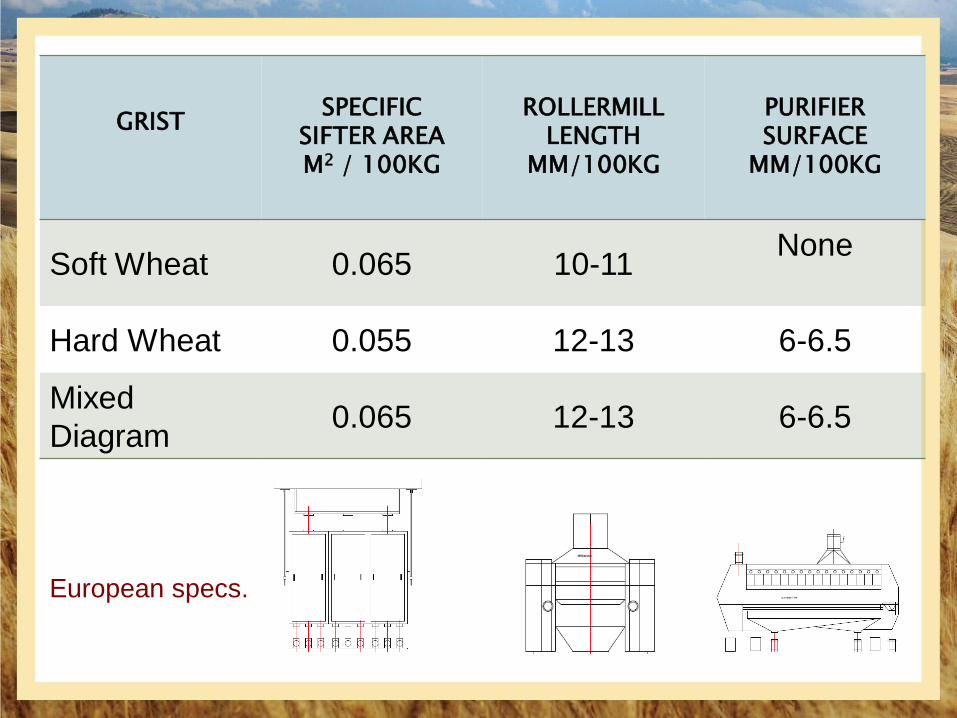
GRISTSPECIFIC
SIFTER AREAM2 / 100KG
ROLLERMILLLENGTH
MM/100KG
PURIFIERSURFACE
MM/100KG
Soft Wheat 0.065 10-11None
Hard Wheat 0.055 12-13 6-6.5
Mixed
Diagram0.065 12-13 6-6.5
European specs.

The Solution – flour blending.
Optimal cleaning & tempering
Optimal diagram
Optimal cleaning & tempering
Optimal diagram
Flours
Blended Flours

Whatever you mill – we wish you every success and
prosperity for the future.
On behalf of us all at US Wheat we thank you for your
business, and for your attention today
We wish you an enjoyable conference
المملكة األردنية الهاشمية