SOEPmonitor Individuals 1984-2013 - diw.de · SOEP Survey Papers Series E - SOEPmonitors The German...
126
SOEP Survey Papers Series E - SOEPmonitors The German Socio-Economic Panel study SOEP 2013 – SOEPmonitor Individuals 1984-2013 (SOEP v30) 284 SOEP — The German Socio-Economic Panel study at DIW Berlin 2015 SOEP Group
Transcript of SOEPmonitor Individuals 1984-2013 - diw.de · SOEP Survey Papers Series E - SOEPmonitors The German...

SOEP Survey PapersSeries E - SOEPmonitors
The GermanSocio-EconomicPanel study
SOEP 2013 – SOEPmonitor Individuals 1984-2013 (SOEP v30)
284
SOEP — The German Socio-Economic Panel study at DIW Berlin 2015
SOEP Group

Running since 1984, the German Socio-Economic Panel study (SOEP) is a wide-ranging representative longitudinal study of private households, located at the German Institute for Economic Research, DIW Berlin.
The aim of the SOEP Survey Papers Series is to thoroughly document the survey’s data collection and data processing.
The SOEP Survey Papers is comprised of the following series:
Series A – Survey Instruments (Erhebungsinstrumente)
Series B – Survey Reports (Methodenberichte)
Series C – Data Documentation (Datendokumentationen)
Series D – Variable Descriptions and Coding
Series E – SOEPmonitors
Series F – SOEP Newsletters
Series G – General Issues and Teaching Materials
The SOEP Survey Papers are available at http://www.diw.de/soepsurveypapers
Editors: Dr. Jan Goebel, DIW Berlin Prof. Dr. Martin Kroh, DIW Berlin and Humboldt Universität Berlin Prof. Dr. Carsten Schröder, DIW Berlin and Freie Universität Berlin Prof. Dr. Jürgen Schupp, DIW Berlin and Freie Universität Berlin
Please cite this paper as follows:
SOEP Group. 2015. SOEP 2013 – SOEPmonitor Individuals 1984-2013 (SOEP v30). SOEP Survey Papers 284: Series E. Berlin: DIW/SOEP
This work is licensed under a Creative Commons Attribution-ShareAlike 4.0 International License. © 2015 by SOEP
ISSN: 2193-5580 (online)
German Socio-Economic Panel (SOEP) | DIW Berlin Mohrenstr. 58 10117 Berlin, Germany Contact: [email protected]

SOEP GROUP
SOEP 2013 – SOEPMONITOR INDIVIDUALS
1984-2013 (SOEP V30)
Berlin, 2015

SOEP Survey Papers 284 1 v30
7.11.2015 / Nov. 7, 2015
SOEPmonitor 1984-2013
Zeitreihen zur Entwicklung ausgewählter Indikatoren zu zentralen Lebensbereichen/
Time Series on selected Indicators about
“Living in Germany”
Analyse-Ebene / Unit of Analysis: Person/ Individual
Contact: Dr. Jan Goebel SOEP DIW Berlin Mohrenstrasse 58 10117 Berlin [email protected] Phone: +49-(0)30-89 789 377 Fax: +49-(0)30-89 789 109
Dr. Hansjoerg Haas SOEP DIW Berlin Mohrenstrasse 58 10117 Berlin [email protected] Phone: +49-(0)30-89 789 243 Fax: +49-(0)30-89 789 109

SOEP Survey Papers 284 2 v30
Datenbasis:
• SOEP 1984-2013 o Im Prinzip basieren die Analysen auf allen zum jeweiligen Untersuchungszeitpunkt
verfügbaren Subsamples o Längsschnitt-Analysen beziehen sich auf Personen, die an zwei aufeinander folgenden
Wellen teilgenommen haben („balanced panel“) • Untersuchungspopulation: Personen in privaten Haushalten (ohne Anstaltsbereich) • Gewichtete und hochgerechnete Ergebnisse
o Querschnitt: Standardversion $PHRF aus der Datei PHRF der Datenweitergabe-Version 1984-2013
o Analysen zur Einkommensverteilung auf Basis von (Vor-)Jahreseinkommen und Monatseinkommen im Befragungsmonat basieren auf einem Hochrechnungs- und Gewichtungsfaktor PHRFINC, der für die Jahre 1984-2013 wie folgt definiert ist:
1984-1997: APHRF - NPHRF
1998: OPHRFAD 1999: PPHRF 2000: QPHRFAE 2001: RPHRF 2002: SPHRFAF 2003-2005: TPHRF - VPHRF 2006: WPHRFAG 2007-2009: XPHRF - ZPHRF. 2010: BAPHRF 2011: BBPHRFAH 2012: BCPHRFAJ 2013: BDPHRFAK
o Längsschnitt: LONGHRF = $PHRF (t0) * $PBLEIB (t0:t1)
Hinweis: Die Poststratifikation/Randanpassung der SOEP-Gewichte von Welle BD in der Datenweitergabe v30 beruhen auf einer Version des Mikrozensus von 2013, der den Zensus aus dem Jahr 2011 erstmals berücksichtigt. Aus diesem Grund ist es möglich, dass Veränderungen zwischen 2012 (BC) und 2013 (BD) in gewichteten Analysen der SOEP-Daten darauf zurückzuführen sind, dass die amtliche Statistik jetzt nach dem letzten Zensus berechnet wird. Mit der rückwirkenden, zensusbedingten Revision des Mikrozensus für die Jahre 2011 und 2012 werden deshalb mit der nächsten Datenweitergabe (soep.v31) auch die Gewichtungsvariablen der Befragungsjahre 2011 und 2012 dann rückwirkend aktualisiert. Siehe auch den Abschnitt „1. Querschnittsgewichte 2013“ in http://www.diw.de/de/diw_02.c.238122.de/aenderungen_am_datensatz.html
SOEP Survey Papers 284 3 v30
Definitionen:
• Einkommen und Armut o Monatliches Haushaltsnettoeinkommen: entspricht dem im SOEP standardmäßig
erhobenen „Income Screener“ als Messung des Haushaltsnettoeinkommens im Befragungsmonat (Frage: „Wie hoch ist das monatliche Haushaltseinkommen aller Haushaltsmitglieder heute? Bitte geben Sie den monatlichen Netto-Betrag an, also nach Abzug von Steuern und Sozialabgaben. Regelmäßige Zahlungen wie Renten, Wohngeld, Kindergeld, BAföG, Unterhaltszahlungen usw. rechnen Sie bitte dazu! “). Für den Zeitraum ab 1995 werden aufgrund von item-non-response fehlende Werte des Haushaltsnettoeinkommens mithilfe multipler Imputationsmethoden ersetzt (siehe dazu http://panel.gsoep.de/soep-docs/surveypapers/diw_ssp0252.pdf; im folgenden wird die Variable I1HINC$$ verwendet).
o Vor-Jahres-Einkommen im Sinne eines „Post-Government-Income“ nach Bezug von Renten und Transfers abzüglich simulierter Steuern und Sozialabgaben (inklusive Einkommensvorteilen aus selbstgenutztem Wohneigentum „Imputed Rent“)
o Alle Einkommen werden in Preisen von 2010 ausgewiesen („Realeinkommen“, siehe dazu Tabelle A2 „Verbraucherpreisindex“ für die verwendeten Preisindizes zur Umrechnung der Monats- und Vorjahreseinkommen. Destatis berechnet ab dem Jahr 2000 die Verbraucherpreisindizes für die Gebietsstände "Früheres Bundesgebiet" bzw. "Neue Länder und Berlin - Ost" nicht mehr. Die früher veröffentlichten Reihen für Ostdeutschland für 1991-1999 wurden deshalb von uns auf die neue Basis 2010 umbasiert. Tabelle A2: Verbraucherpreisindex (CPI) – Basisjahr = 2010).
o Äquivalenzgewichtung der Einkommen mit der modifizierten OECD-Skala (1.0 für Haushaltsvorstand; 0.5 für weitere Haushaltsmitglieder über 14 Jahren; 0,3 für Haushaltsmitglieder bis 14 Jahren)
o Relative Einkommensarmut (Operationalisierung auf Basis zweier Armutsschwellen): Armutsschwelle bei 60% des gesamtdeutschen Median-Einkommen
Aktuelle Erwerbseinkommen beziehen sich auf den Vormonat der Befragung (Variablen LABGRO$$ bzw. LABNET$$).
Aufgrund von item-non-response fehlende Angaben bei (Vor-) Jahreseinkommen sowie beim Brutto- und Netto-Erwerbseinkommen im aktuellen Monat werden imputiert (vgl. dazu Frick, Joachim R. and Grabka, Markus M. (2005): Item-non-response on income questions in panel surveys: incidence, imputation and the impact on inequality and mobility. Allgemeines Statistisches Archiv, 89: 49-60 sowie Grabka, Markus M. and Joachim R. Frick (2003): Imputation of Item-Non-Response on Income Questions in the SOEP 1984–2002, DIW Research Notes No. 29, October 2003).
Währungsdarstellung: Bis 2001 erfolgte die Erhebung aller Einkommen in DM, ab dem Erhebungsjahr 2002 in EURO. Aus Konsistenzgründen werden alle Einkommensangaben in den folgenden Tabellen auch für die Jahre 1984 bis 2001 in EURO ausgewiesen (1 EURO = 1.95583 DM). Bei der Interpretation z.B. des Verlaufs der durchschnittlichen monatlichen Haushalts-Nettoeinkommen muss mit unterschiedlichem Rundungsverhalten der Befragten bei DM bzw. EURO – Angaben gerechnet werden.
Legende:
- Im Beobachtungsjahr nicht erhoben.

SOEP Survey Papers 284 4 v30
Inhalt / Contents: Datenbasis: ................................................................................................................................ 2 Definitionen: ............................................................................................................................. 3 Inhalt / Contents: ...................................................................................................................... 4 Table A1: Fallzahlen (ungewichtet*) für SOEP-Monitor (Analyseebene: Personen) / Sample sizes (unweighted*) for SOEP-Monitor (Unit of Analysis: Individual) ................. 9 Table A2: Verbraucherpreisindex (CPI) – Basisjahr = 2010 / Consumer Price Index – Base year = 2010 .......................................................................... 10 Übersicht der im SOEP-Monitor dargestellten Indikatoren .............................................. 11 I. Bildung / Education ............................................................................................................ 20
Höchster erreichter schulischer Bildungsabschluss (Westdeutschland), in % - Population: Alle Befragungspersonen ab 17 Jahren ..................................................................................................... 20 Highest educational attainment (West Germany), in % - all persons (age 17 and older) .................. 20 Höchster erreichter schulischer Bildungsabschluss (Ostdeutschland), in % - Population: Alle Befragungspersonen ab 17 Jahren ..................................................................................................... 21 Highest educational attainment (East Germany), in % - all persons (age 17 and older) ................... 21 Höchster Bildungsabschluss nach ISCED 1997 (Westdeutschland), in % - Population: Alle Befragungspersonen ab 17 Jahren ..................................................................................................... 22 Highest educational attainment according to ISCED 1997 (West Germany), in % - All persons (age 17 and older) ...................................................................................................................................... 22 Höchster Bildungsabschluss nach ISCED 1997 (Ostdeutschland), in % - Population: Alle Befragungspersonen ab 17 Jahren ..................................................................................................... 23 Highest educational attainment according to ISCED 1997 (East Germany), in % ............................ 23
II. Sozialkapital und Freizeit / Social capital and leisure time........................................... 24
Anteil der Personen, die mindestens 1-mal pro Monat „aktiven Sport“ betreiben ........................... 24 Share of persons active in sports at least once per month .................................................................. 24 Anteil der Personen, die mindestens 1-mal pro Monat „bei Freunden, Verwandten, etc. mithelfen“ 25 Share of persons helping out friends and relatives at least once per month ...................................... 25 Anteil der Personen, die mindestens 1-mal pro Monat „ehrenamtlich tätig sind“ / Share of persons doing voluntary work at least once per month ................................................................................... 26 Anteil der Personen, die mindestens 1-mal pro Monat „politisch tätig sind“ / ................................ 27 Share of persons being politically active at least once per month ..................................................... 27 Anteil der Personen, die mindestens 1-mal pro Monat „zur Kirche gehen bzw. religiöse Veranstaltungen besuchen“ / ............................................................................................................. 28 Share of persons going to church at least once per month ................................................................. 28
III. Arbeitsmarkt & Erwerbstätigkeit / Labor market & employment ........................... 29
Stellung im Beruf (Westdeutschland), in % ...................................................................................... 29 Labor market position (West Germany), in % ................................................................................... 29 Stellung im Beruf (Ostdeutschland), in % ......................................................................................... 30 Labor market position (East Germany), in % .................................................................................... 30 Stellung im Beruf – ohne Auszubildende/Praktikanten (Westdeutschland), in %............................. 31 Labor market Position – without trainees/interns (West Germany), in % ......................................... 31 Stellung im Beruf – ohne Auszubildende/Praktikanten(Ostdeutschland), in % / .............................. 32 Labor market position – without trainees/interns (East Germany), in % ........................................... 32 Angestellte und Beamte in höheren Fach-/Führungspositionen (Westdeutschland), in % ................ 33 White-collar workers and civil servants in executive positions (West Germany), in % .................... 33 Angestellte und Beamte in höheren Fach-/Führungspositionen (Ostdeutschland), in % ................... 34 White-collar workers and civil servants in executive positions (East Germany), in % ..................... 34 Zeitlicher Umfang von Erwerbsarbeit (Vollzeit-Quote), in % / ........................................................ 35 Amount of time spent at work (full time-ratio), in % ........................................................................ 35

SOEP Survey Papers 284 5 v30
Realisierung von Erwerbsabsichten: Anteil Nichterwerbstätiger, die „ganz sicher“ eine Erwerbstätigkeit anstrebten und im Folgejahr erwerbstätig waren. /................................................. 36 Realisation of employment plans: Share of unemployed persons wanting a job and being employed the next year ....................................................................................................................................... 36 Erwerbsstatus von Personen in Partnerschaften (Westdeutschland), in % / Employment status of persons in partnerships (West Germany), in % ................................................................................. 37 Erwerbsstatus von Personen in Partnerschaften (Ostdeutschland), in % ........................................... 38 Employment status of persons in partnerships (East Germany), in % ............................................... 38 Erwerbsstatus allgemein (Westdeutschland), in % ............................................................................ 39 Employment status in general (West Germany), in % ....................................................................... 39 Erwerbsstatus allgemein (Ostdeutschland), in % ............................................................................... 40 Employment status in general (East Germany) in % ......................................................................... 40 Stabilität von Erwerbstätigkeit ........................................................................................................... 41 Stability of employment..................................................................................................................... 41 Stabilität von Geringfügiger Beschäftigung bzw. Nicht-Erwerbstätigkeit ........................................ 42 Stability of marginal employment/unemployment ............................................................................ 42 Arbeitsmarktbeteiligung (Westdeutschland/ Labor Force Status (West Germany) ........................... 43 Arbeitsmarktbeteiligung (Ostdeutschland) / Labor Force Status (East Germany) ............................ 44 Erwerbslosigkeit nach ILO 2001 (EU-L228-19) (Westdeutschland) ................................................ 45 Unemployment according to ILO 2001 (EU-L228-19) (West Germany) ......................................... 45 Erwerbslosigkeit nach ILO 2001 (EU-L228-19) (Ostdeutschland) ................................................... 46 Unemployment according to ILO 2001 (EU-L228-19) (East Germany) ........................................... 46 Erwerbstätigkeit nach Sektoren (Westdeutschland), in % ................................................................. 47 Employment by sectors (West Germany), in %................................................................................. 47 Erwerbstätigkeit nach Sektoren (Osteutschland), in % ...................................................................... 48 Employment by sectors (East Germany), in % .................................................................................. 48 Erwerbstätigkeit nach Wirtschaftsbereichen (Westdeutschland), in % ............................................. 49 Employment by economic sector (West Germany), in % .................................................................. 49 Erwerbstätigkeit nach Wirtschaftsbereichen (Ostdeutschland), in % ................................................ 50 Employment by economic sector (East Germany), in % ................................................................... 50 Zweittätigkeit von Arbeitnehmern, in % / Second jobs of employees, in % ..................................... 51 Abhängige Beschäftigung, in % / Dependent Employees, in % ........................................................ 52 Im Öffentlichen Dienst beschäftigt, in % / Employed in public service, in % ................................. 53 Berufsklassifikation nach ISCO-88 (Westdeutschland), in % ........................................................... 54 Job classification according to ISCO-88 (West Germany), in % ...................................................... 54 Berufsklassifikation nach ISCO-88 (Ostdeutschland), in % .............................................................. 55 Job classification according to ISCO-88 (East Germany), in % ........................................................ 55 Unternehmensgröße (Westdeutschland), in % / Firm size (West Germany), in % ............................ 56 Unternehmensgröße (Ostdeutschland), in % / Firm size (East Germany), in %................................ 57 Inzidenz von Überstunden (Westdeutschland), in % ........................................................................ 58 Incidence of overtime hours (West Germany), in % ......................................................................... 58 Inzidenz von Überstunden (Ostdeutschland), in % ........................................................................... 58 Incidence of overtime hours (East Germany), in % ........................................................................... 58 Abgeltung von Überstunden (Westdeutschland), in % ...................................................................... 59 Compensation of overtime hours (West Germany), in % .................................................................. 59 Abgeltung von Überstunden (Ostdeutschland), in % ........................................................................ 60 Compensation of overtime hours (East Germany), in % ................................................................... 60 Vergleich von geleisteter und gewünschter Arbeitszeit (Westdeutschland), in % ............................ 61 Comparison of actual and desired working hours (West Germany), in % ........................................ 61 Vergleich von geleisteter und gewünschter Arbeitszeit (Ostdeutschland), in % ............................... 62 Comparison of actual and desired working hours (East Germany), in % .......................................... 62
IV. Gesundheit / Health ......................................................................................................... 63
Zufriedenheit mit der Gesundheit (Mittelwert auf einer Skala von 0 bis 10) / .................................. 63 Satisfaction with health (mean on a scale from 0 to 10) .................................................................... 63 Gesundheitszustand gegenwärtig (Selbsteinschätzung) (Westdeutschland), in % ............................ 64

SOEP Survey Papers 284 6 v30
Current health status (self-evaluation) (West Germany), in % .......................................................... 64 Gesundheitszustand gegenwärtig (Selbsteinschätzung) (Ostdeutschland), in % ............................... 65 Current health status (self-evaluation) (East Germany), in % ........................................................... 65 Zahl der Arztbesuche in den letzten drei Monaten, Mittelwert / ....................................................... 66 Number of doctor consultations in the last three months, mean ........................................................ 66 Zahl der Krankenhausaufenthalte (mind. eine Nacht) im letzten Jahr, Mittelwert / .......................... 67 Number of stays in the hospital (at least one night) in the last year, mean ........................................ 67 Anteil der Personen mit Wechsel der Krankenkasse im letzten Jahr (Mittelwert) / .......................... 68 Share of persons with change of health insurance in the last year (mean) ........................................ 68 Veränderung des Gesundheitszustandes gegenüber dem Vorjahr, in % / .......................................... 69 Change in health status compared to previous year, in % ................................................................. 69
V. Einkommen, Armut, Ungleichheit, Mobilität / Income, poverty, inequality, mobility70
Aktuelles monatl. Bruttoerwerbseinkommen, Mittelwert in Euro / ................................................... 70 Monthly gross income, mean in Euro ................................................................................................ 70 Decile Ratio auf Basis des gesamtdeutschen Bruttomonatseinkommens / ........................................ 71 Decile Ratio based on monthly gross household income .................................................................. 71 Äquivalenzgewichtetes Monats-Nettoeinkommen, Mittelwert in Euro / .......................................... 72 Equivalent monthly net income, mean in Euro .................................................................................. 72 Aktuelles Bruttoerwerbseinkommen im laufenden Monat, Mittelwert in Euro / .............................. 73 Current monthly gross income, mean in Euro ................................................................................... 73 Aktuelles Nettoerwerbseinkommen im laufenden Monat, Mittelwert in Euro / ................................ 74 Current monthly net income, mean in Euro ....................................................................................... 74 60% des Median der gesamtdt. Nettomonatseinkommens (Armutsschwelle), in Euro / ................... 75 60% of the median of the monthly net household income (Poverty line), in Euro ............................ 75 Decile Ratio auf Basis des gesamtdeutschen Netto-Monatseinkommens / ....................................... 76 Decile Ratio based on monthly net household income ...................................................................... 76 Äquivalenzgewichtetes Nettoeinkommen des Vorjahres, Mittelwert in Euro / ................................. 77 Equivalent household net income of previous year, mean in Euro .................................................... 77 60% des Median des gesamtdeutschen äquivalenzgewichteten (Vor-) Jahreseinkommens (Armutsschwelle), in Euro / ............................................................................................................... 78 60% of the median of equivalent household annual income (Poverty line), in Euro......................... 78 Decile Ratio auf Basis des äquivalenzgewichteten (Vor-)Jahreseinkommens / ............................... 79 Decile Ratio based on equivalent annual household income ............................................................. 79 Einkommensungleichheit Deutschland-Gesamt - Basis: Monatseinkommen / ................................ 80 Income inequality in Germany - Base: monthly income ................................................................... 80 Einkommensungleichheit in Westdeutschland - Basis: Monatseinkommen / ................................... 81 Income inequality in West Germany - Base: monthly income .......................................................... 81 Einkommensungleichheit in Ostdeutschland - Basis: Monatseinkommen / ...................................... 82 Income inequality in East Germany - Base: monthly income ........................................................... 82 Einkommensungleichheit Deutschland-Gesamt - Basis(Vor-)Jahreseinkommen / .......................... 83 Income inequality in Germany - Base: Annual Income .................................................................... 83 Einkommensungleichheit in Westdeutschland Basis: (Vor-)Jahreseinkommen / ............................. 84 Income inequality in West Germany - Base: Annual income ............................................................ 84 Einkommensungleichheit in Ostdeutschland - Basis: (Vor-)Jahreseinkommen / .............................. 85 Income inequality in East Germany - Base: Annual income ............................................................. 85 Armutsmaße nach Foster, Greer, Thorbecke (1984) in Westdeutschland - Basis: Monatseinkommen (gesamtdeutsch) ................................................................................................................................. 86 Poverty measures (Foster, Greer, Thorbecke 1984) in West Germany - Base: monthly income .... 86 Armutsmaße nach Foster, Greer, Thorbecke (1984) in Ostdeutschland - Basis: Monatseinkommen (gesamtdeutsch) / ............................................................................................................................... 87 Poverty measures (Foster, Greer, Thorbecke 1984) in East Germany - Base: monthly income ...... 87 Armutsmaße nach Foster, Greer, Thorbecke (1984) in Deutschland - Basis: Monatseinkommen (gesamtdeutsch) / ............................................................................................................................... 88 Poverty measures (Foster, Greer, Thorbecke 1984) in Germany - Base: Monthly income .............. 88

SOEP Survey Papers 284 7 v30
Armutsmaße nach Foster, Greer, Thorbecke (1984) in Westdeutschland - Basis: (Vor-)Jahreseinkommen (gesamtdeutsch)/ ................................................................................................. 89 Poverty measures (Foster, Greer, Thorbecke 1984) in West Germany - Base: Annual income ....... 89 Armutsmaße nach Foster, Greer, Thorbecke (1984) in Ostdeutschland - Basis: (Vor-)Jahreseinkommen (gesamtdeutsch) .................................................................................................. 90 Poverty measure (Foster, Greer, Thorbecke 1984) in East Germany - Base: Annual income.......... 90 Armutsmaße nach Foster, Greer, Thorbecke (1984) in Deutschland - Basis: (Vor-)Jahreseinkommen (gesamtdeutsch) / ................................................................................................ 91 Poverty measures (Foster, Greer, Thorbecke 1984) in Germany - Base: Annual income ................. 91 Entwicklung Armutspopulation: Stabil arm (in t0 und t1) - Basis: Monatseinkommen (gesamtdeutsch) / ............................................................................................................................... 92 Development poverty population: constantly poor (in t0 and t1) - Base: Monthly income .............. 92 Entwicklung Armutspopulation: Stabil nicht arm (in t0 und t1) - Basis: Monatseinkommen (gesamtdeutsch) ................................................................................................................................. 93 Development poverty population: constantly not poor (in t0 and t1) - Base: Monthly income ........ 93 Entwicklung Armutspopulation: in Armut (nicht arm in t0, arm in t1) - Basis: Monatseinkommen (gesamtdeutsch) / ............................................................................................................................... 94 Development poverty population: into poverty (not poor in t0, poor in t1) - Base: Monthly income94 Entwicklung Armutspopulation: raus aus Armut (arm in t0, nicht arm in t1) Basis: Monatseinkommen (gesamtdeutsch) ................................................................................................. 95 Development poverty population: out of poverty (poor in t0, not poor in t1) – ................................ 95 Base: Monthly income ....................................................................................................................... 95 Entwicklung Armutspopulation: Stabil arm (in t0 und t1) - Basis: (Vor-) Jahreseinkommen (gesamtdeutsch) ................................................................................................................................. 96 Development poverty population: constantly poor (in t0 and t1) - Base: Annual income ................ 96 Entwicklung Armutspopulation: Stabil nicht arm (in t0 und t1) - Basis: (Vor-) Jahreseinkommen (gesamtdeutsch) ................................................................................................................................. 97 Development poverty population: constantly not poor (in t0 and t1) ................................................ 97 - Base: Annual income ....................................................................................................................... 97 Entwicklung Armutspopulation: in Armut (nicht arm in t0, arm in t1) - Basis: (Vor-) Jahreseinkommen (gesamtdeutsch) / ................................................................................................. 98 Development poverty population: into poverty (not poor in t0, poor in t1) - Base: Annual income . 98 Entwicklung Armutspopulation: raus aus Armut (arm in t0, nicht arm in t1) / Basis: (Vor-) Jahreseinkommen (gesamtdeutsch) / ................................................................................................. 99 Development poverty population: out of poverty (poor in t0, not poor in t1) - Base: Annual income ........................................................................................................................................................... 99 Einkommensmobilität nach Fields & Ok (1999) - Basis: Äquivalenzgewichtetes Monats-Einkommen ...................................................................................................................................... 100 Income mobility (Fields & Ok 1999) - Base: Equivalent monthly household income ................... 100 Einkommensmobilität nach Fields & Ok (1999) - Basis: Äquivalenzgewichtetes (Vor-)Jahres-Einkommen / ................................................................................................................................... 101 Income mobility (Fields & Ok 1999)- Base: Equivalence-weighted annual income ..................... 101
VI. Subjektive Indikatoren zu Sozialer Exklusion/Inklusion / Subjective indicators on social exclusion/inclusion ..................................................................................................... 102
Allgemeine Lebenszufriedenheit (Mittelwert auf einer Skala von 0 bis 10) / ................................. 102 Life satisfaction in general (mean on a scale from 0 to 10) ............................................................. 102 Bereichs-Zufriedenheit Arbeit / Satisfaction with work .................................................................. 103 Bereichs-Zufriedenheit Einkommen / Satisfaction with income ..................................................... 104 Sorgen um die allgemeine wirtschaftliche Entwicklung (Westdeutschland), in % ......................... 105 Concerns about general economic development (West Germany), in % ........................................ 105 Sorgen um die allgemeine wirtschaftliche Entwicklung (Ostdeutschland), in % ............................ 106 Concerns about general economic development (East Germany), in % .......................................... 106 Sorgen um die eigene wirtschaftliche Entwicklung (Westdeutschland), in % / .............................. 107 Concerns about own economic development (West Germany), in % ............................................. 107 Sorgen um die eigene wirtschaftliche Entwicklung (Ostdeutschland), in % / ................................. 108

SOEP Survey Papers 284 8 v30
Concerns about own economic development (East Germany), in % ............................................... 108 Veränderung der Lebenszufriedenheit gegenüber dem Vorjahr (Westdeutschland) ....................... 109 Change in life satisfaction since previous year (West Germany) .................................................... 109 Veränderung der Lebenszufriedenheit gegenüber dem Vorjahr (Ostdeutschland) .......................... 110 Change in life satisfaction since previous year (East Germany) ..................................................... 110 Veränderung der Arbeitszufriedenheit gegenüber dem Vorjahr (Westdeutschland) ....................... 111 Change in satisfaction with work since previous year (West Germany) ......................................... 111 Veränderung der Arbeitszufriedenheit gegenüber dem Vorjahr (Ostdeutschland) .......................... 112 Change in satisfaction with work since previous year (East Germany)........................................... 112 Veränderung der Einkommenszufriedenheit gegenüber Vorjahr (Westdeutschland) .................... 113 Change in satisfaction with income since previous year (West Germany) ...................................... 113 Veränderung der Einkommenszufriedenheit gegenüber Vorjahr (Ostdeutschland) ....................... 114 Change in satisfaction with income since previous year (East Germany) ....................................... 114
VII. Bevölkerung in Privathaushalten - Population in private households ................... 115
Lebensformtypologie (Westdeutschland) , in % .............................................................................. 115 Life status typology (West Germany), in % .................................................................................... 115 Lebensformtypologie (Ostdeutschland) , in % ................................................................................ 116 Life status typology (East Germany), in % ...................................................................................... 116 Altersklasse im Befragungsjahr (Westdeutschland), in % {GEBJAHR} ........................................ 117 Age classification (West Germany), in %........................................................................................ 117 Altersklasse im Befragungsjahr (Ostdeutschland), in % {GEBJAHR} ........................................... 119 Age classification (East Germany), in % ......................................................................................... 119
VIII. Wohnsituation / Housing ............................................................................................ 121
Wohneigentümerquote (Anteil der Personen in selbstgenutztem Wohneigentum) / ....................... 121 Rate of property (Share of persons living in owner-occupied property) ......................................... 121 Wohnfläche in qm pro Kopf / Housing space in square meter per capita........................................ 122 Zahl der Wohnräume (> 6 qm) pro Kopf / Number of rooms (>6 sqm) per capita ......................... 123

SOEP Survey Papers 284 9 v30
Table A1: Fallzahlen (ungewichtet*) für SOEP-Monitor (Analyseebene: Personen) /
Sample sizes (unweighted*) for SOEP-Monitor (Unit of Analysis: Individual)
Aktuelle Stichprobenregion / Current sample region
Jahr / Year Westdeutschland West Germany
Ostdeutschland East Germany
Total
1984 16 099 - 16 099 1985 14 443 - 14 443 1986 13 742 - 13 742 1987 13 496 - 13 496 1988 12 817 - 12 817 1989 12 393 - 12 393 1990 12 151 6 014 18 165 1991 12 144 5 612 17 756 1992 12 019 5 331 17 350 1993 11 906 5 087 16 993 1994 12 406 4 952 17 358 1995 13 033 4 789 17 822 1996 12 707 4 712 17 419 1997 12 445 4 584 17 029 1998 13 822 4 826 18 648 1999 13 184 4 681 17 865 2000 23 885 7 171 31 056 2001 21 617 6 593 28 210 2002 23 299 6 594 29 893 2003 21 775 6 354 28 129 2004 21 008 6 160 27 168 2005 19 960 5 933 25 893 2006 21 379 6 279 27 658 2007 19 810 5 904 25 714 2008 18 387 5 601 23 988 2009 19 400 5 920 25 320 2010 17 535 5 335 22 870 2011 19 630 5 823 25 453 2012 19 380 5 745 25 125 2013 24 649 5 814 30 463
Total (pooled data) 500 521 135 814 636 335 *: Nur Personen in Privat-Haushalten der je Welle verfügbaren Samples A-K All individuals in private households in subsamples A-K.

SOEP Survey Papers 284 10 v30
Table A2: Verbraucherpreisindex (CPI) – Basisjahr = 2010 / Consumer Price Index – Base year = 2010
Verbraucherpreisindex1 zur Deflationierung von ... / Consumer Price Index for the deflation of...
Jahr / Year
Aktuelles Monatseinkommen / Current monthly income
Vorjahreseinkommen / Annual income from previous year
Westdeutschland West Germany
Ostdeutschland East Germany
Westdeutschland West Germany
Ostdeutschland East Germany
1983 61,7 - - - 1984 63,3 - 61,7 - 1985 64,6 - 63,3 - 1986 64,5 - 64,6 - 1987 64,6 - 64,5 - 1988 65,4 - 64,6 - 1989 67,3 - 65,5 - 1990 69,1 - 67,3 - 1991 71,6 60,8 69,1 - 1992 74,5 68,9 71,6 60,8 1993 77,1 76,2 74,5 68,9 1994 79,2 79,0 77,1 76,2 1995 80,5 80,5 79,2 79,0 1996 81,5 82,0 80,5 80,5 1997 83,1 83,9 81,5 82,0 1998 83,8 84,8 83,1 83,9 1999 84,4 85,1 83,8 84,8 2000 85,7 85,7 84,4 85,1 2001 87,4 87,4 85,7 85,7 2002 88,6 88,6 87,4 87,4 2003 89,6 89,6 88,6 88,6 2004 91,0 91,0 89,6 89,6 2005 92,5 92,5 91,0 91,0 2006 93,9 93,9 92,5 92,5 2007 96,1 96,1 93,9 93,9 2008 98,6 98,6 96,1 96,1 2009 98,9 98,9 98,6 98,6 2010 100,0 100,0 98,9 98,9 2011 102,1 102,1 100,0 100,0 2012 104,1 104,1 102,1 102,1 2013 105,7 105,7 104,1 104,1
1 Quelle: Preise. Verbraucherpreisindizes für Deutschland. Lange Reihen ab 1948. (http://www.destatis.de) sowie
eigene Berechnungen.Destatis berechnet ab dem Jahr 2000 die Verbraucherpreisindizes für die Gebietsstände "Früheres Bundesgebiet" bzw. "Neue Länder und Berlin - Ost" nicht mehr. Die Zahlen für Ostdeutschland wurden deshalb auf die neue Basis 2010 umbasiert.

SOEP Survey Papers 284 11 v30
Übersicht der im SOEPmonitor dargestellten Indikatoren
Indikator Population Quer- / Längsschnitt
SOEP-Variable (hier
für 2001) SOEP-MitarbeiterIn
I. Bildung
Höchster erreichter schulischer Bildungsabschluss Alle Befragungspersonen ab 17 Jahren Q RPSBIL Charlotte Bartels,
Peter Krause, [email protected] Höchster Bildungsabschluss nach ISCED 1997 Alle Befragungspersonen ab 17
Jahren Q ISCED01
II. Sozialkapital und Freizeit Anteil der Personen, die mindestens 1-mal pro Monat „aktiven Sport“ betreiben
Alle Befragungspersonen ab 17 Jahren Q RP0303
Jürgen Schupp, [email protected]
Anteil der Personen, die mindestens 1-mal pro Monat „bei Freunden, Verwandten, etc. mithelfen“
Alle Befragungspersonen ab 17 Jahren Q RP0306
Anteil der Personen, die mindestens 1-mal pro Monat „ehrenamtlich tätig sind“
Alle Befragungspersonen ab 17 Jahren Q RP0307
Anteil der Personen, die mindestens 1-mal pro Monat „politisch tätig sind“
Alle Befragungspersonen ab 17 Jahren Q RP0308
Anteil der Personen, die mindestens 1-mal pro Monat „einen Kirchgang unternehmen“
Alle Befragungspersonen ab 17 Jahren Q RP0309

SOEP Survey Papers 284 12 v30
Indikator Population Quer- / Längsschnitt
SOEP-Variable (hier für
2001)
SOEP-MitarbeiterIn
III. Arbeitsmarkt/Erwerbstätigkeit
Stellung im Beruf Alle erwerbstätigen Befragungspersonen ab 17 Jahren Q RP4001-05
Paul Schmelzer, [email protected]
Daniel Schnitzlein.
Stellung im Beruf - ohne Auszubildende/Praktikanten
Alle erwerbstätigen Befragungspersonen ab 17 Jahren ohne Auszubildende und Praktikanten
Q RP4001-05
Angestellte und Beamte in höheren Fach- und Führungspositionen
Angestellte und Beamte in höheren Fach- und Führungspositionen ab 17 Jahren
Q RP4004-05
Zeitlicher Umfang von Erwerbsarbeit Alle erwerbstätigen Befragungspersonen ab 17 Jahren Q RP12
Realisierung von Erwerbsabsichten: Anteil Nichterwerbstätiger, die "ganz sicher" eine Erwerbstätigkeit anstrebten und im Folgejahr erwerbstätig waren.
Alle nichterwerbstätigen Befragungspersonen, die "ganz sicher" eine Erwerbstätigkeit anstrebten ab 17 Jahren
L QP12; RP12
Erwerbsstatus von Personen in Partnerschaften Alle Befragungspersonen ab 17 Jahren mit fester Partnerschaft im Haushalt
Q RP12

SOEP Survey Papers 284 13 v30
Indikator Population Quer- / Längsschnitt
SOEP-Variable (hier
für 2001) SOEP-MitarbeiterIn
Erwerbsstatus allgemein Alle Befragungspersonen ab 17 Jahren Q RP12
Paul Schmelzer, [email protected]
Alexandra Fedorets, [email protected]
Stabilität von Erwerbstätigkeit Alle erwerbstätigen Befragungspersonen ab 17 Jahren L QP10; RP12
Stabilität von Geringfügiger Beschäftigung bzw. Nicht-Erwerbstätigkeit
Alle erwerbstätigen Befragungspersonen ab 17 Jahren L QP10; RP12
Mobilität von Geringfügiger Beschäftigung bzw. Nicht-Erwerbstätigkeit
Alle erwerbstätigen Befragungspersonen ab 17 Jahren L QP10; RP12
Arbeitsmarktbeteiligung (Labor Force Status) Alle Befragungspersonen ab 17 Jahren Q LFS01
Erwerbslosigkeit nach ILO 2001 (EU-L228-19) Alle erwerbslosen Befragungspersonen ab 17 Jahren Q LFS01
Erwerbstätigkeit nach Sektoren Alle erwerbstätigen Befragungspersonen ab 17 Jahren Q NACE01
Erwerbstätigkeit nach Wirtschaftsbereichen Alle erwerbstätigen Befragungspersonen ab 17 Jahren Q NACE01
Zweittätigkeit von Arbeitnehmern Alle erwerbstätigen Befragungspersonen ab 17 Jahren Q RP5901-03
Vollzeit-Teilzeit-Quote Alle erwerbstätigen Befragungspersonen ab 17 Jahren Q RP12
Abhängige Beschäftigung Alle erwerbstätigen Befragungspersonen ab 17 Jahren Q RP12;
RP4001-05
Im Öffentlichen Dienst beschäftigt Alle erwerbstätigen Befragungspersonen ab 17 Jahren Q OEFF001
Berufsklassifikation nach ISCO-88 Alle abhängig erwerbstätigen Befragungspersonen ab 17 Jahren Q IS8801
Unternehmensgröße Alle abhängig erwerbstätigen Befragungspersonen ab 17 Jahren Q BETR01

SOEP Survey Papers 284 14 v30
Indikator Population Quer- / Längsschnitt
SOEP-Variable (hier
für 2001) SOEP-MitarbeiterIn
Inzidenz von Überstunden Alle abhängig erwerbstätigen Befragungspersonen ab 17 Jahren Q RP54 Paul Schmelzer,
Alexandra Fedorets, [email protected]
Abgeltung von Überstunden Alle abhängig erwerbstätigen Befragungspersonen ab 17 Jahren Q RP5501
Vergleich von geleisteter und gewünschter Arbeitszeit Alle erwerbstätigen Befragungspersonen ab 17 Jahren
Q RP53; RP50
IV. Gesundheit
Zufriedenheit mit der Gesundheit Alle Befragungspersonen ab 17 Jahren Q RP0101
Markus Grabka, [email protected]
Gesundheitszustand gegenwärtig (Selbsteinschätzung der Befragten)
Alle Befragungspersonen ab 17 Jahren Q RP95
Zahl der Arztbesuche im letzten Jahr Alle Befragungspersonen ab 17 Jahren Q RP9801
Zahl der Krankenhausaufenthalte (mind. eine Nacht) im letzten Jahr
Alle Befragungspersonen ab 17 Jahren Q RP10002
Anteil der Personen mit Wechsel der Krankenkasse im letzten Jahr
Alle Befragungspersonen ab 17 Jahren
Q RP94 Veränderung des Gesundheitszustandes gegenüber dem Vorjahr
Alle Befragungspersonen ab 17 Jahren L QP95; RP95

SOEP Survey Papers 284 15 v30
Indikator Population Quer- / Längsschnitt
SOEP-Variable (hier
für 2001) SOEP-MitarbeiterIn
V. Einkommen, Armut, Ungleichheit, Mobilität Brutto-Monatseinkommen Alle Personen in
privaten Haushalten Q LABGRO01
Peter Krause, [email protected] Jan Goebel, [email protected] Markus Grabka, [email protected]
Decile Ratio auf Basis des regionsspezifischen bzw. des gesamtdeutschen Brutto-Monatseinkommens
Alle Personen in privaten Haushalten Q LABGRO01
Äquivalenzgewichtetes Monats-Nettoeinkommen Alle Personen in privaten Haushalten Q RH49
60% des Median des regionsspezifischen bzw. des gesamtdeutschen Monatseinkommens (Armutsschwelle)
Alle Personen in privaten Haushalten Q RH49
Decile Ratio auf Basis des regionsspezifischen bzw. des gesamtdeutschen Monatseinkommens
Alle Personen in privaten Haushalten Q RH49
Äquivalenzgewichtetes Nettoeinkommen des Vorjahres Alle Personen in privaten Haushalten Q I1110201
60% des Median des regionsspezifischen bzw. des gesamtdeutschen (Vor-)Jahreseinkommens (Armutsschwelle)
Alle Personen in privaten Haushalten Q I1110201
Decile Ratio auf Basis des regionsspezifischen bzw. des gesamtdeutschen (Vor-)Jahreseinkommens
Alle Personen in privaten Haushalten Q I1110201
Einkommensungleichheit, Basis: Monatseinkommen Alle Personen in privaten Haushalten Q RH49
Einkommensungleichheit, Basis: Jahreseinkommen Alle Personen in privaten Haushalten Q I1110201
Armutsmaße nach Foster, Greer, Thorbecke (1984), Basis: Monatseinkommen (mit regionsspezifischer bzw. gesamtdeutscher Armutsschwelle)
Alle Personen in privaten Haushalten Q RH49
Armutsmaße nach Foster, Greer, Thorbecke (1984), Basis: (Vor-) Jahreseinkommen (mit regions-spezifischer bzw. gesamtdeutscher Armutsschwelle)
Alle Personen in privaten Haushalten Q I1110201
SOEP Survey Papers 284 16 v30
Indikator Population Quer- / Längsschnitt
SOEP-Variable (hier
für 2001) SOEP-MitarbeiterIn
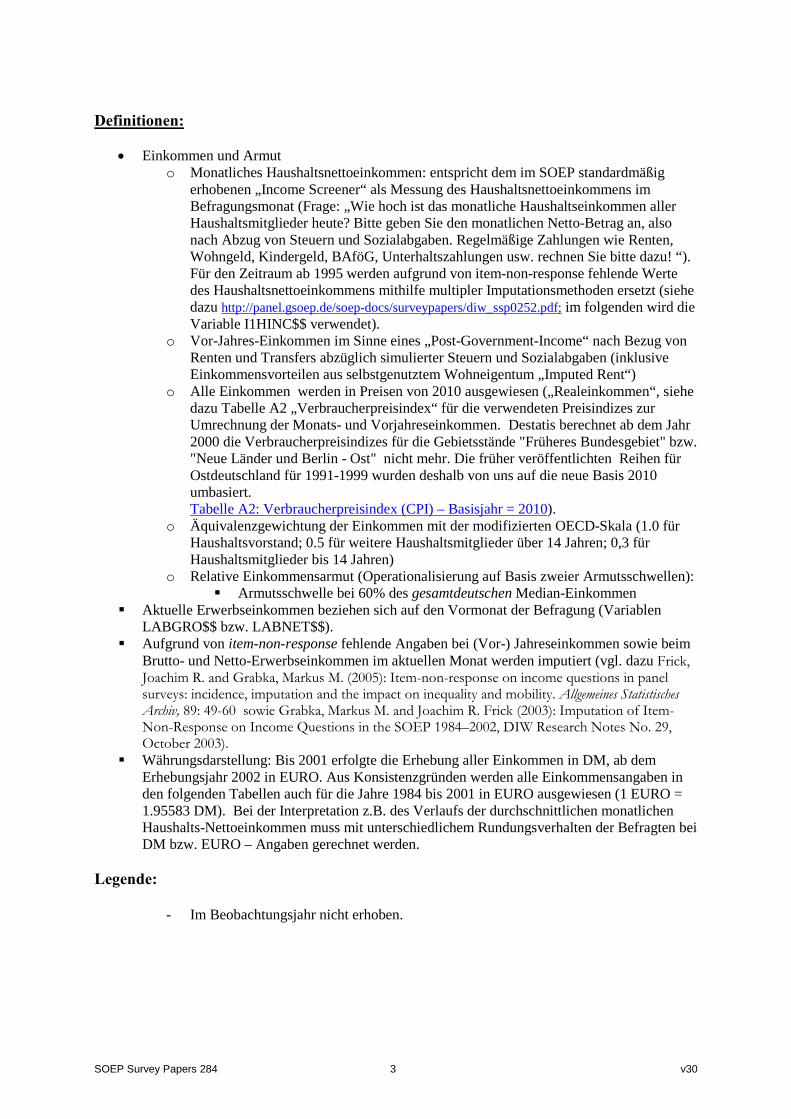
Entwicklung Armutspopulation: Stabil arm (in t0-t1), Basis: Monatseinkommen (mit gesamtdeutscher Armutsschwelle)
Alle Personen in privaten Haushalten L QH54; RH49
Peter Krause, [email protected] Jan Goebel, [email protected] Markus Grabka, [email protected]
Entwicklung Armutspopulation: Stabil nicht arm (in t0 und t1), Basis: Monatseinkommen (mit gesamtdeutscher Armutsschwelle)
Alle Personen in privaten Haushalten L QH54; RH49
Entwicklung Armutspopulation: in Armut (nicht arm in t0, arm in t1), Basis: Monatseinkommen (mit gesamtdeutscher Armutsschwelle)
Alle Personen in privaten Haushalten L QH54; RH49
Entwicklung Armutspopulation: raus aus Armut (arm in t0, nicht arm in t1), Basis: Monatseinkommen (mit gesamtdeutscher Armutsschwelle)
Alle Personen in privaten Haushalten L QH54; RH49
Entwicklung Armutspopulation: Stabil arm (in t0 und t1), Basis: (Vor-) Jahreseinkommen (mit regionsspezifischer bzw. gesamtdeutscher Armutsschwelle)
Alle Personen in privaten Haushalten L I1110200;
I1110201
Entwicklung Armutspopulation: Stabil nicht arm (in t0 und t1), Basis: (Vor-) Jahreseinkommen (mit gesamtdeutscher Armutsschwelle)
Alle Personen in privaten Haushalten L I1110200;
I1110201 Entwicklung Armutspopulation: in Armut (nicht arm in t0, arm in t1), Basis: (Vor-) Jahreseinkommen (mit gesamtdeutscher Armutsschwelle)
Alle Personen in privaten Haushalten L I1110200;
I1110201

SOEP Survey Papers 284 17 v30
Indikator Population Quer- / Längsschnitt
SOEP-Variable (hier
für 2001) SOEP-MitarbeiterIn
Entwicklung Armutspopulation: raus aus Armut (arm in t0, nicht arm in t1), Basis: (Vor-) Jahreseinkommen (mit regionsspezifischer bzw. gesamtdeutscher Armutsschwelle)
Alle Personen in privaten Haushalten L I1110200;
I1110201
Peter Krause, [email protected] Jan Goebel, [email protected] Markus Grabka, [email protected]
Einkommensmobilität nach Fields & Ok (1999): Basis: Äquivalenzgewichtetes Monats-Einkommen
Alle Personen in privaten Haushalten L QH54; RH49
Einkommensmobilität nach Fields & Ok (1999): Basis: Äquivalenzgewichtetes (Vor-)Jahres-Einkommen
Alle Personen in privaten Haushalten L I1110200;
I1110201
Aktuelles Brutto-Erwerbseinkommen im Monat nach Erwerbsumfang (Mittelwert in EURO)
Alle aktuell erwerbstätigen Personen in privaten Haushalten Q
LABGRO01 Markus Grabka, [email protected]
Aktuelles Netto-Erwerbseinkommen im Monat nach Erwerbsumfang (Mittelwert in EURO)
Alle aktuell erwerbstätigen Personen in privaten Haushalten Q
LABNET01 Markus Grabka, [email protected]

SOEP Survey Papers 284 18 v30
Indikator Population Quer- / Längsschnitt
SOEP-Variable (hier
für 2001) SOEP-MitarbeiterIn
VI. Subjektive Indikatoren zu Sozialer Exklusion / Inklusion
Allgemeine Lebenszufriedenheit Alle Befragungspersonen ab 17 Jahren Q RP13501
Peter Krause, [email protected]
Bereichs-Zufriedenheit Arbeit Alle erwerbstätigen Befragungspersonen ab 17 Jahren Q RP0102
Bereichs-Zufriedenheit Einkommen Alle Befragungspersonen ab 17 Jahren Q RP0104
Sorgen um die allgemeine wirtschaftliche Entwicklung Alle Befragungspersonen ab 17 Jahren Q RP11401
Sorgen um die eigene wirtschaftliche Entwicklung Alle Befragungspersonen ab 17 Jahren Q RP11402
Veränderung der Lebenszufriedenheit gegenüber dem Vorjahr
Alle Befragungspersonen ab 17 Jahren L QP14301;
RP13501 Veränderung der Arbeitszufriedenheit gegenüber dem Vorjahr
Alle erwerbstätigen Befragungspersonen ab 17 Jahren L AP0304;
BP0104 Veränderung der Einkommenszufriedenheit gegenüber dem Vorjahr
Alle Befragungspersonen ab 17 Jahren L AP0302;
BP0102

SOEP Survey Papers 284 19 v30
Indikator Population Quer- / Längsschnitt
SOEP-Variable (hier für 2001) SOEP-MitarbeiterIn
VII. Bevölkerung in Privathaushalten
Lebensformtypologie Alle Personen in privaten Haushalten Q RP131 —
RP13325 Christian Schmitt, [email protected]
Personen in privaten Haushalten in West- und Ostdeutschland nach Alter (Eckdaten angepasst an Mikrozensus):
Alle Personen in privaten Haushalten Q GEBJAHR Martin Kroh,
VIII. Wohnsituation Wohneigentümerquote (Anteil der Personen in selbstgenutztem Wohneigentum)
Alle Personen in privaten Haushalten Q REIGEN Markus Grabka,
Wohnfläche in qm pro Kopf Alle Personen in privaten Haushalten Q RWOHNFL
bzw. RHHGR Markus Grabka, [email protected] Zahl der Wohnräume (> 6 qm) pro Kopf Alle Personen in privaten
Haushalten Q RWOHNR bzw. RHHGR

SOEP Survey Papers 284 20 v30
I. Bildung / Education
Höchster erreichter schulischer Bildungsabschluss (Westdeutschland), in % - Population: Alle Befragungspersonen ab 17 Jahren Highest educational attainment (West Germany), in % - all persons (age 17 and older)
Westdeutschland / West Germany
Jahr / Year
Hauptschul-abschluss / Secondary
school degree
Realschul-abschluss /
Intermediate school degree
Abitur / Upper secondary
degree
Anderer Abschluss /
Other degree
Ohne Abschluss / No school
degree
Noch in schulischer
Ausbildung / In school
Total
1984 {APSBIL} 60,80 19,42 12,91 2,80 2,46 1,62 100 1985 {BPSBIL} 59,08 20,39 13,29 2,85 2,68 1,71 100 1986 {CPSBIL} 57,66 20,97 14,11 2,91 2,84 1,51 100 1987 {DPSBIL} 57,46 20,87 14,29 3,11 2,88 1,37 100 1988 {EPSBIL} 57,24 21,05 14,71 2,84 2,74 1,42 100 1989 {FPSBIL} 56,02 20,93 15,37 3,04 2,95 1,69 100 1990 {GPSBIL} 55,07 21,16 15,77 3,31 3,16 1,53 100 1991 {HPSBIL} 53,71 21,39 16,61 3,57 3,33 1,38 100 1992 {IPSBIL} 52,61 21,76 16,95 3,81 3,53 1,33 100 1993 {JPSBIL} 51,60 22,06 17,23 4,07 3,80 1,25 100 1994 {KPSBIL} 50,81 21,83 17,80 4,18 3,94 1,44 100 1995 {LPSBIL} 48,75 21,77 18,04 6,10 3,60 1,73 100 1996 {MPSBIL} 48,22 21,96 18,22 5,96 3,70 1,95 100 1997 {NPSBIL} 47,77 22,01 18,53 5,95 3,82 1,92 100 1998 {OPSBIL} 46,16 22,49 19,28 6,12 3,78 2,17 100 1999 {PPSBIL} 46,19 22,48 19,53 6,07 3,84 1,90 100 2000 {QPSBIL} 43,54 23,11 21,13 7,68 2,81 1,74 100 2001 {RPSBIL} 43,36 23,12 21,03 7,65 2,83 2,00 100 2002 {SPSBIL} 43,51 23,12 20,48 7,95 2,81 2,13 100 2003 {TPSBIL} 42,39 23,06 21,13 8,18 3,11 2,13 100 2004 {UPSBIL} 42,05 23,17 21,11 8,36 3,01 2,30 100 2005 {VPSBIL} 40,69 23,72 21,25 8,58 3,13 2,64 100 2006 {WPSBIL} 39,32 23,95 22,54 8,73 2,92 2,54 100 2007 {XPSBIL} 38,34 24,03 23,27 8,77 2,96 2,63 100 2008 {YPSBIL} 37,77 24,50 23,75 8,72 2,79 2,47 100 2009 {ZPSBIL} 36,93 24,74 24,96 7,99 2,72 2,65 100 2010 {BAPSBIL} 36,17 25,14 25,66 8,07 2,53 2,42 100 2011 {BBPSBIL} 34,67 24,50 26,27 9,29 2,59 2,68 100 2012 {BCPSBIL} 33,74 24,31 26,64 10,25 2,42 2,63 100 2013 {BDPSBIL} 32,24 23,92 27,01 11,45 2,70 2,67 100

SOEP Survey Papers 284 21 v30
Höchster erreichter schulischer Bildungsabschluss (Ostdeutschland), in % - Population: Alle Befragungspersonen ab 17 Jahren
Highest educational attainment (East Germany), in % - all persons (age 17 and older)
Ostdeutschland / East Germany
Jahr / Year
Hauptschul-abschluss / Secondary
school degree
Realschul-abschluss /
Intermediate school degree
Abitur / Upper
secondary degree
Anderer Abschluss
/ Other degree
Ohne Abschluss
/ No school degree
Noch in schulischer Ausbildung / In school
Total
1990 {GPSBIL} 42,13 43,69 11,66 1,63 0,31 0,59 100 1991 {HPSBIL} 42,71 43,39 11,46 1,35 0,49 0,61 100 1992 {IPSBIL} 41,95 43,55 11,67 1,38 0,73 0,73 100 1993 {JPSBIL} 40,96 43,78 12,33 1,26 0,71 0,96 100 1994 {KPSBIL} 40,68 43,54 12,84 0,96 0,67 1,31 100 1995 {LPSBIL} 40,54 42,80 13,49 0,93 0,81 1,43 100 1996 {MPSBIL} 38,84 43,60 13,86 1,05 0,88 1,77 100 1997 {NPSBIL} 37,85 43,67 14,42 1,04 0,96 2,06 100 1998 {OPSBIL} 36,84 44,86 14,10 1,13 1,07 2,01 100 1999 {PPSBIL} 36,02 45,33 14,41 1,15 1,01 2,07 100 2000 {QPSBIL} 35,41 43,01 16,23 2,75 0,55 2,06 100 2001 {RPSBIL} 34,34 42,62 17,34 2,42 0,90 2,39 100 2002 {SPSBIL} 34,06 43,84 16,88 2,22 0,71 2,30 100 2003 {TPSBIL} 32,90 44,78 17,24 1,87 0,76 2,44 100 2004 {UPSBIL} 32,56 44,67 17,67 2,01 0,79 2,29 100 2005 {VPSBIL} 30,89 44,53 18,89 2,29 0,91 2,50 100 2006 {WPSBIL} 29,56 44,84 19,59 2,75 1,00 2,24 100 2007 {XPSBIL} 28,86 44,31 20,34 2,74 0,91 2,83 100 2008 {YPSBIL} 28,20 45,51 20,88 2,22 0,83 2,36 100 2009 {ZPSBIL} 27,11 46,16 21,95 1,93 0,71 2,14 100 2010 {BAPSBIL} 25,47 47,44 23,40 1,81 0,72 1,17 100 2011 {BBPSBIL} 24,96 47,09 23,62 2,19 0,97 1,17 100 2012 {BCPSBIL} 25,22 46,22 23,97 2,48 1,05 1,06 100 2013 {BDPSBIL} 23,95 46,58 22,93 3,82 1,25 1,47 100

SOEP Survey Papers 284 22 v30
Höchster Bildungsabschluss nach ISCED 1997 (Westdeutschland), in % - Population: Alle Befragungspersonen ab 17 Jahren Highest educational attainment according to ISCED 1997 (West Germany), in % - All persons (age 17 and older)
Westdeutschland / West Germany
Jahr / Year (Noch) kein Ab-
schluss2 /(Pre)primary education
Sekundarstufe I3 / Lower secondary
education
Sekundarstufe II 4 / Higher secondary
education
Post-sekundärer, nicht-tertiärer Bereich 5 / Post-secondary non-tertiary
education
erste Phase Tertiärbereich 6 / First
stage of tertiary education
Tertiärbereich 7 / Second stage of
tertiary education Total
1984 {ISCED84} 4,02 30,73 48,26 2,27 7,52 7,20 100 1985 {ISCED85} 4,36 30,19 47,91 2,34 7,73 7,48 100 1986 {ISCED86} 4,31 29,46 48,46 2,45 7,69 7,63 100 1987 {ISCED87} 4,20 28,47 49,25 2,64 7,57 7,88 100 1988 {ISCED88} 4,07 27,96 49,47 2,83 7,73 7,94 100 1989 {ISCED89} 4,50 27,30 49,07 3,06 7,70 8,37 100 1990 {ISCED90} 4,58 27,37 48,53 3,17 7,72 8,64 100 1991 {ISCED91} 4,58 27,02 48,17 3,11 7,75 9,39 100 1992 {ISCED92} 4,66 26,32 48,24 3,29 7,99 9,51 100 1993 {ISCED93} 4,78 25,54 48,31 3,35 8,04 9,99 100 1994 {ISCED94} 4,99 24,57 48,36 3,33 8,22 10,53 100 1995 {ISCED95} 4,81 23,98 47,63 4,11 7,98 11,49 100 1996 {ISCED96} 4,95 23,27 47,71 4,57 7,95 11,54 100 1997 {ISCED97} 5,06 23,30 47,74 4,45 7,99 11,47 100 1998 {ISCED98} 5,23 23,03 47,12 4,57 7,93 12,11 100 1999 {ISCED99} 5,03 22,60 47,53 4,66 7,98 12,21 100 2000 {ISCED00} 3,99 20,52 48,63 5,83 7,52 13,51 100 2001 {ISCED01} 4,18 19,58 49,22 5,77 7,22 14,03 100 2002 {ISCED02} 4,43 19,45 49,57 5,91 7,16 13,48 100 2003 {ISCED03} 4,60 18,96 49,07 6,06 7,14 14,17 100 2004 {ISCED04} 4,68 18,74 48,93 6,18 7,21 14,26 100 2005 {ISCED05} 5,13 18,41 48,63 6,14 7,20 14,49 100 2006 {ISCED06} 4,83 17,72 48,64 6,38 6,84 15,59 100 2007 {ISCED07} 4,95 16,70 48,76 6,40 6,86 16,32 100 2008 {ISCED08} 4,53 16,41 49,16 6,41 6,76 16,73 100 2009 {ISCED09} 4,63 15,53 48,82 6,31 6,93 17,79 100 2010 {ISCED10} 4,41 15,69 48,29 6,45 6,89 18,27 100 2011 {ISCED11} 4,74 15,04 48,50 6,98 6,24 18,50 100 2012 {ISCED12} 4,57 14,94 47,94 6,84 6,26 19,44 100 2013 {ISCED13} 4,81 15,20 47,04 7,29 5,84 19,82 100
2 Die ISCED-Kategorien 0 und 1 werden zu der Kategorie "(noch) kein Abschluss" zusammengefasst. 3 Sekundarstufe I entspricht folgenden Ausbildungsabschlüssen: Hauptschul- und Realschulabschluss. 4 Sekundarstufe II entspricht folgenden Ausbildungsabschlüssen: Fachabitur, Abitur oder ein beruflicher Ausbildungsabschluss (Lehre). 5 Entspricht folgenden Ausbildungsabschlüssen: Fachabitur, Abitur plus beruflicher Ausbildungsabschluss (Lehre). 6 Entspricht folgenden Ausbildungsabschlüssen: Fachschule (Meister, Techniker) und höhere Beamtenausbildung. 7 Entspricht folgenden Ausbildungsabschlüssen: Fachhochschulabschluss, Universitätsabschluss.
SOEP Survey Papers 284 23 v30
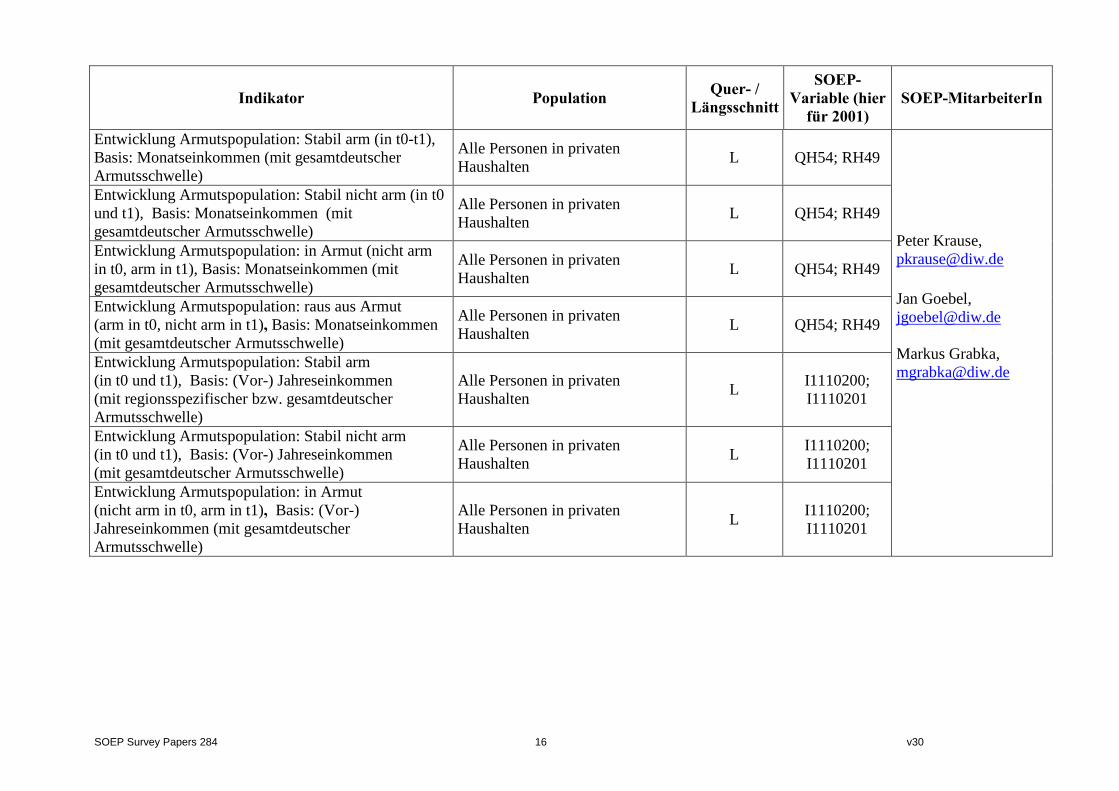
Höchster Bildungsabschluss nach ISCED 1997 (Ostdeutschland), in % - Population: Alle Befragungspersonen ab 17 Jahren
Highest educational attainment according to ISCED 1997 (East Germany), in % - All persons (age 17 and older)
Ostdeutschland / East Germany
Jahr / Year (Noch) kein
Abschluss8 / (Pre-)primary education
Sekundarstufe I9 / Lower secondary
education
Sekundarstufe II 10 / Higher secondary
education
Post-sekundärer, nicht-tertiärer Bereich 11 / Post-
secondary non-tertiary education
erste Phase Tertiärbereich 12 /
First stage of tertiary education
Tertiärbereich 13 / Second stage of
tertiary education Total
1990 {ISCED90} 1,42 12,99 57,19 1,79 5,98 20,64 100 1991 {ISCED91} 1,53 12,02 57,95 1,71 5,70 21,09 100 1992 {ISCED92} 1,78 12,24 56,79 1,63 6,29 21,28 100 1993 {ISCED93} 1,99 12,24 56,05 1,74 6,57 21,41 100 1994 {ISCED94} 2,03 12,13 55,60 1,92 6,88 21,45 100 1995 {ISCED95} 2,20 11,36 56,02 1,94 6,86 21,61 100 1996 {ISCED96} 2,59 10,62 56,36 1,98 6,63 21,83 100 1997 {ISCED97} 2,83 10,48 55,90 2,05 6,68 22,06 100 1998 {ISCED98} 2,91 10,36 56,07 1,98 6,69 21,98 100 1999 {ISCED99} 2,87 10,01 56,56 2,11 6,82 21,63 100 2000 {ISCED00} 2,67 13,11 53,16 2,07 8,31 20,68 100 2001 {ISCED01} 3,25 12,42 52,79 2,07 8,00 21,47 100 2002 {ISCED02} 3,01 12,37 53,29 2,35 8,16 20,83 100 2003 {ISCED03} 3,14 12,22 53,17 2,35 8,30 20,82 100 2004 {ISCED04} 3,14 12,06 53,05 2,73 8,16 20,85 100 2005 {ISCED05} 3,41 11,32 52,89 3,19 8,07 21,11 100 2006 {ISCED06} 3,35 11,43 53,14 2,96 7,60 21,52 100 2007 {ISCED07} 4,02 10,59 51,95 2,99 7,98 22,48 100 2008 {ISCED08} 3,36 9,94 53,10 3,30 7,87 22,42 100 2009 {ISCED09} 2,96 9,35 52,53 3,57 8,48 23,11 100 2010 {ISCED10} 1,89 9,14 53,12 3,49 8,29 24,06 100 2011 {ISCED11} 2,21 9,23 53,41 3,79 7,92 23,45 100 2012 {ISCED12} 2,17 8,80 53,26 4,04 8,40 23,33 100 2013 {ISCED13} 2,60 8,27 53,72 4,14 7,91 23,37 100
8 Die ISCED-Kategorien 0 und 1 werden zu der Kategorie "(noch) kein Abschluss" zusammengefasst. 9 Sekundarstufe I entspricht folgenden Ausbildungsabschlüssen: Hauptschul- und Realschulabschluss. 10 Sekundarstufe II entspricht folgenden Ausbildungsabschlüssen: Fachabitur, Abitur oder ein beruflicher Ausbildungsabschluss (Lehre). 11 Entspricht folgenden Ausbildungsabschlüssen: Fachabitur, Abitur plus beruflicher Ausbildungsabschluss (Lehre). 12 Entspricht folgenden Ausbildungsabschlüssen: Fachschule (Meister, Techniker) und höhere Beamtenausbildung. 13 Entspricht folgenden Ausbildungsabschlüssen: Fachhochschulabschluss, Universitätsabschluss.

SOEP Survey Papers 284 24 v30
II. Sozialkapital und Freizeit / Social capital and leisure time
Anteil der Personen, die mindestens 1-mal pro Monat „aktiven Sport“ betreiben14 Share of persons active in sports at least once per month
Population: Alle Befragungspersonen ab 17 Jahren / All persons (age 17 and older) Jahr / Year Westdeutschland /
West Germany Ostdeutschland /
East Germany Total
1985 {BP0703} 28,49 - 28,49 1986 {CP0903} 29,75 - 29,75 1987. - - - 1988 {EP0903} 30,20 - 30,20 1989 - - - 1990 {GP0413}{GP0203e} 37,42 15,82 33,27 1991 - - - 1992 {IP0703} 32,38 15,64 28,98 1993 - - - 1994 {KP1203} 31,87 15,43 28,60 1995 {LP0613} 37,86 23,63 35,11 1996 {MP0503} 33,91 19,03 31,07 1997 {NP0303} 33,40 18,80 30,61 1998 {OP0613} 39,76 26,44 37,21 1999 {PP0303} 34,35 21,49 31,94 2000 - - - 2001 {RP0303} 35,10 25,11 33,21 2002 - - - 2003 {TP1414} 42,08 34,96 40,74 2004 - - - 2005 {VP0303} 40,42 29,42 38,38 2006 - - - 2007 {XP0303} 42,44 32,12 40,34 2008 {YP1815} 48,45 40,12 46,79 2009 45,53 34,78 43,41 2010 - - - 2011 {BBP0303} 44,84 36,97 43,27 2012 - - - 2013 {BDP1116} 54,97 45,55 52,96
14 Zusammenfassung der Kategorien „Mindestens 1 mal pro Woche“ und „Mindestens 1 mal pro Monat“.
In den Jahren 1990 (West), 1995, 1998, 2003, 2008 und 2013 wurde hier zusätzlich die Antwort-Kategorie „Täglich“ berücksichtigt. Zudem ist die Frageformulierung in diesen Jahren leicht abgewandelt.
SOEP Survey Papers 284 25 v30
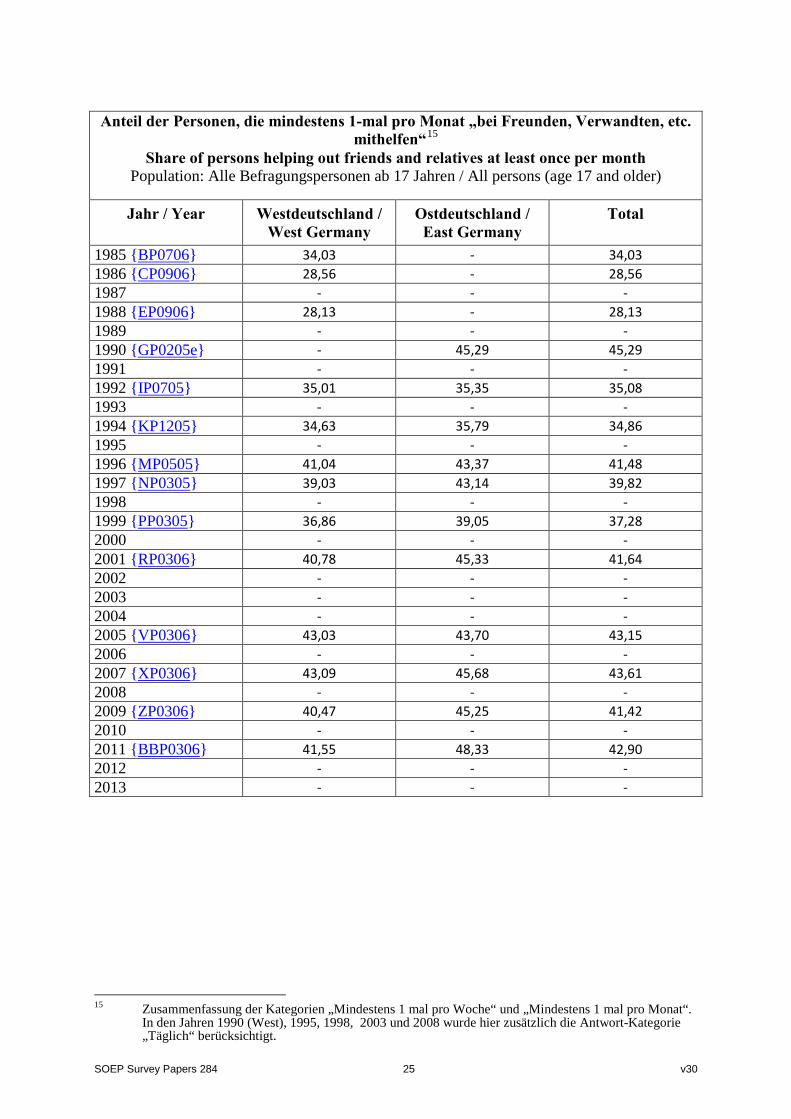
Anteil der Personen, die mindestens 1-mal pro Monat „bei Freunden, Verwandten, etc.
mithelfen“15 Share of persons helping out friends and relatives at least once per month
Population: Alle Befragungspersonen ab 17 Jahren / All persons (age 17 and older)
Jahr / Year Westdeutschland / West Germany
Ostdeutschland / East Germany
Total
1985 {BP0706} 34,03 - 34,03 1986 {CP0906} 28,56 - 28,56 1987 - - - 1988 {EP0906} 28,13 - 28,13 1989 - - - 1990 {GP0205e} - 45,29 45,29 1991 - - - 1992 {IP0705} 35,01 35,35 35,08 1993 - - - 1994 {KP1205} 34,63 35,79 34,86 1995 - - - 1996 {MP0505} 41,04 43,37 41,48 1997 {NP0305} 39,03 43,14 39,82 1998 - - - 1999 {PP0305} 36,86 39,05 37,28 2000 - - - 2001 {RP0306} 40,78 45,33 41,64 2002 - - - 2003 - - - 2004 - - - 2005 {VP0306} 43,03 43,70 43,15 2006 - - - 2007 {XP0306} 43,09 45,68 43,61 2008 - - - 2009 {ZP0306} 40,47 45,25 41,42 2010 - - - 2011 {BBP0306} 41,55 48,33 42,90 2012 - - - 2013 - - -
15 Zusammenfassung der Kategorien „Mindestens 1 mal pro Woche“ und „Mindestens 1 mal pro Monat“.
In den Jahren 1990 (West), 1995, 1998, 2003 und 2008 wurde hier zusätzlich die Antwort-Kategorie „Täglich“ berücksichtigt.
SOEP Survey Papers 284 26 v30
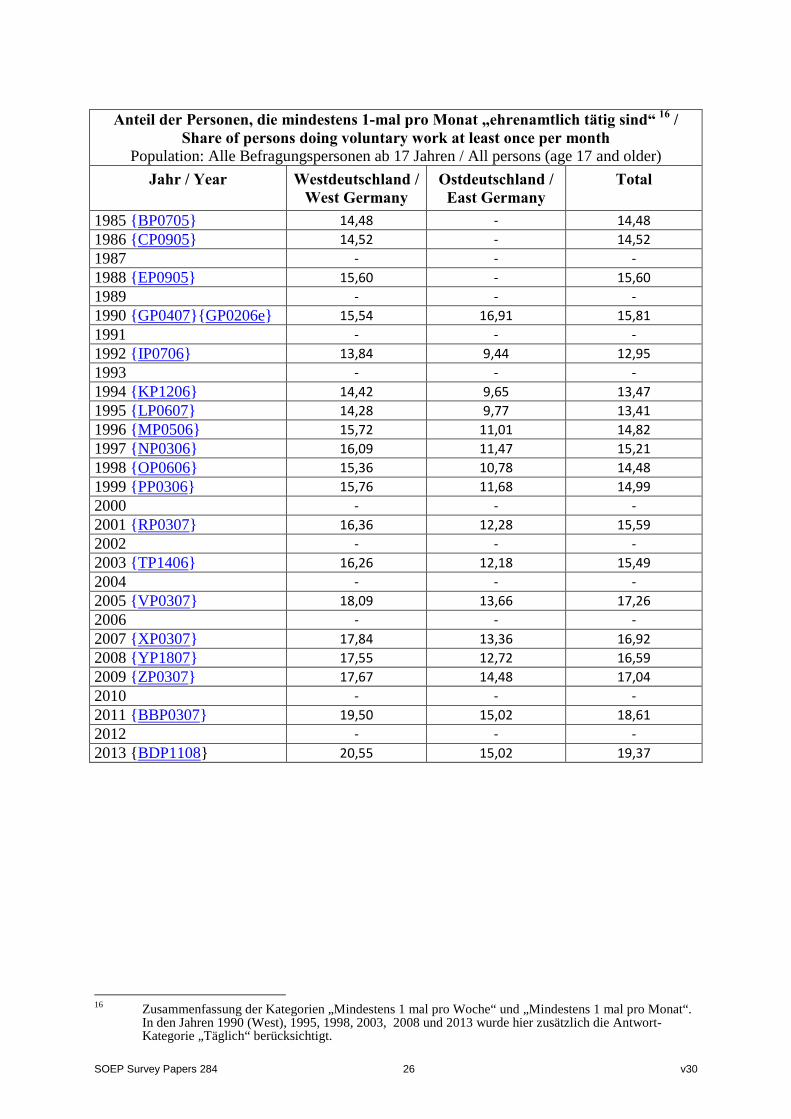
Anteil der Personen, die mindestens 1-mal pro Monat „ehrenamtlich tätig sind“ 16 /
Share of persons doing voluntary work at least once per month Population: Alle Befragungspersonen ab 17 Jahren / All persons (age 17 and older)
Jahr / Year Westdeutschland / West Germany
Ostdeutschland / East Germany
Total
1985 {BP0705} 14,48 - 14,48 1986 {CP0905} 14,52 - 14,52 1987 - - - 1988 {EP0905} 15,60 - 15,60 1989 - - - 1990 {GP0407}{GP0206e} 15,54 16,91 15,81 1991 - - - 1992 {IP0706} 13,84 9,44 12,95 1993 - - - 1994 {KP1206} 14,42 9,65 13,47 1995 {LP0607} 14,28 9,77 13,41 1996 {MP0506} 15,72 11,01 14,82 1997 {NP0306} 16,09 11,47 15,21 1998 {OP0606} 15,36 10,78 14,48 1999 {PP0306} 15,76 11,68 14,99 2000 - - - 2001 {RP0307} 16,36 12,28 15,59 2002 - - - 2003 {TP1406} 16,26 12,18 15,49 2004 - - - 2005 {VP0307} 18,09 13,66 17,26 2006 - - - 2007 {XP0307} 17,84 13,36 16,92 2008 {YP1807} 17,55 12,72 16,59 2009 {ZP0307} 17,67 14,48 17,04 2010 - - - 2011 {BBP0307} 19,50 15,02 18,61 2012 - - - 2013 {BDP1108} 20,55 15,02 19,37
16 Zusammenfassung der Kategorien „Mindestens 1 mal pro Woche“ und „Mindestens 1 mal pro Monat“.
In den Jahren 1990 (West), 1995, 1998, 2003, 2008 und 2013 wurde hier zusätzlich die Antwort-Kategorie „Täglich“ berücksichtigt.

SOEP Survey Papers 284 27 v30
Anteil der Personen, die mindestens 1-mal pro Monat „politisch tätig sind“ 17 /
Share of persons being politically active at least once per month Population: Alle Befragungspersonen ab 17 Jahren / All persons (age 17 and older)
Jahr / Year Westdeutschland / West Germany
Ostdeutschland / East Germany
Total
1985 {BP0707} 3,04 - 3,04 1986 {CP0907} 2,83 - 2,83 1987 - - - 1988 {EP0907} 2,21 - 2,21 1989 - - - 1990 {GP0406}{GP0207e} 3,90 7,04 4,50 1991 - - - 1992 {IP0707} 2,64 3,42 2,79 1993 - - - 1994 {KP1207} 2,16 3,31 2,39 1995 {LP0606} 3,02 3,63 3,14 1996 {MP0507} 2,11 2,91 2,26 1997 {NP0307} 2,51 2,80 2,57 1998 {OP0605} 2,39 2,84 2,48 1999 {PP0307} 2,45 2,65 2,49 2000 - - - 2001 {RP0308} 2,58 2,93 2,65 2002 - - - 2003 {TP1405} 2,81 2,90 2,83 2004 - - - 2005 {VP0308} 2,84 2,62 2,80 2006 - - - 2007 {XP0308} 2,19 2,01 2,16 2008 {YP1806} 2,44 2,29 2,41 2009 {ZP0308} 2,11 1,94 2,08 2010 - - - 2011 {BBP0308} 2,51 2,16 2,44 2012 - - - 2013 {BDP1107} 2,99 3,26 3,05
17 Zusammenfassung der Kategorien „Mindestens 1 mal pro Woche“ und „Mindestens 1 mal pro Monat“.
In den Jahren 1990 (West), 1995, 1998, 2003, 2008 und 2013 wurde hier zusätzlich die Antwort-Kategorie „Täglich“ berücksichtigt.

SOEP Survey Papers 284 28 v30
Anteil der Personen, die mindestens 1-mal pro Monat „zur Kirche gehen bzw. religiöse
Veranstaltungen besuchen“ 18 / Share of persons going to church at least once per month
Population: Alle Befragungspersonen ab 17 Jahren / All persons (age 17 and older)
Jahr / Year Westdeutschland / West Germany
Ostdeutschland / East Germany
Total
1990 {GP0408}{GP0208e} 26,87 8,96 23,41 1991 - - - 1992 {IP0708} 23,25 7,71 20,12 1993 - - - 1994 {KP1208} 23,58 7,11 20,31 1995 {LP0608} 24,79 7,55 21,46 1996 {MP0508} 23,18 7,14 20,12 1997 {NP0308} 22,65 8,22 19,90 1998 {OP0607} 23,72 8,29 20,76 1999 {PP0308} 21,38 7,61 18,80 2000 - - - 2001 {RP0309} 22,45 7,77 19,67 2002 - - - 2003 {TP1407} 22,14 7,38 19,37 2004 - - - 2005 {VP0309} 20,32 6,79 17,81 2006 - - - 2007 {XP0309} 19,52 7,67 17,11 2008 {YP1808} 19,10 7,19 16,73 2009 {ZP0309} 18,06 7,89 16,05 2010 - - - 2011 {BBP0309} 18,67 7,79 16,51 2012 - - - 2013 {BDP1109} 18,92 7,24 16,42
18 Zusammenfassung der Kategorien „Mindestens 1 mal pro Woche“ und „Mindestens 1 mal pro Monat“.
In den Jahren 1990 (West), 1995, 1998, 2003, 2008 und 2013 wurde hier zusätzlich die Antwort-Kategorie „Täglich“ berücksichtigt.

SOEP Survey Papers 284 29 v30
III. Arbeitsmarkt & Erwerbstätigkeit / Labor market & employment
Stellung im Beruf (Westdeutschland), in %
Labor market position (West Germany), in % Population: Alle erwerbstätigen Befragungspersonen ab 17 Jahren /
All employed persons (age 17 and older) Westdeutschland / West Germany
Jahr / Year
Arbeiter / Blue-collar
workers
Selb-ständige /
Self- employed
Auszu-bildende / In training
Ange-stellte / White collar
workers
Beamte / Civil
servants Total
1984 {AP2801-05} 37,12 9,80 6,29 38,09 8,71 100 1985 {BP3801-05} 36,02 9,84 6,52 38,80 8,83 100 1986 {CP4601-05} 36,16 9,68 6,78 38,66 8,72 100 1987 {DP3801-05} 36,64 9,67 6,54 38,55 8,60 100 1988 {EP3801-05} 35,50 9,61 5,95 40,35 8,59 100 1989 {FP3801-05} 35,17 8,74 5,65 42,18 8,26 100 1990 {GP3701-05} 35,21 8,81 5,57 41,95 8,46 100 1991 {HP4801-05} 34,58 8,93 5,68 42,56 8,25 100 1992 {IP4801-05} 33,24 9,14 5,48 44,34 7,80 100 1993 {JP4801-05} 33,42 9,51 5,19 43,47 8,41 100 1994 {KP5101-05} 31,85 9,75 4,20 44,95 9,25 100 1995 {LP4301-05} 31,34 9,21 4,62 46,04 8,79 100 1996 {MP4101-05} 30,91 10,00 4,18 46,77 8,15 100 1997 {NP3501-05} 29,93 9,61 4,84 47,26 8,35 100 1998 {OP3501-05} 29,68 9,84 4,77 47,75 7,96 100 1999 {PP3801-05} 29,64 10,63 5,06 47,41 7,26 100 2000 {QP3601-05} 31,00 10,72 4,33 47,36 6,60 100 2001 {RP4001-05} 30,28 10,71 4,87 47,46 6,68 100 2002 {SP4001-05} 31,36 9,69 5,13 47,55 6,28 100 2003 {TP6601-05} 30,41 9,80 4,99 48,45 6,36 100 2004 {UP3701-05} 29,72 10,53 4,92 48,60 6,23 100 2005 {VP4301-05} 30,64 9,93 4,64 48,19 6,59 100 2006 {WP3601-05} 29,30 10,49 4,60 49,17 6,43 100 2007 {XP4701-05} 30,39 9,90 4,08 48,83 6,80 100 2008 {YP4601-05} 30,23 9,34 4,40 49,72 6,32 100 2009 {ZP4201-05} 29,13 9,28 4,62 50,48 6,49 100 2010 {BAP3801-05} 27,26 9,12 4,53 52,24 6,84 100 2011 {BBP4201-05} 26,51 9,47 3,86 53,61 6,56 100 2012 {BCP4001-05} 25,11 9,66 3,99 54,49 6,75 100 2013 {BDP4601-05} 23,85 9,99 4,57 55,12 6,47 100

SOEP Survey Papers 284 30 v30
Stellung im Beruf (Ostdeutschland), in %
Labor market position (East Germany), in % Population: Alle erwerbstätigen Befragungspersonen ab 17 Jahren /
All employed persons (age 17 and older) Ostdeutschland / East Germany
Jahr / Year Arbeiter /
Blue-collar workers
Selb-ständige /
Self- employed
Auszu-bildende / In training
Ange-stellte / White collar
workers
Beamte / Civil
servants Total
1991 {HP4801-05} 46,15 5,37 3,66 43,76 1,06 100 1992 {IP4801-05} 41,61 6,47 5,53 45,24 1,15 100 1993 {JP4801-05} 39,92 7,43 7,11 43,80 1,73 100 1994 {KP5101-05} 39,13 7,68 7,06 44,00 2,14 100 1995 {LP4301-05} 40,00 8,09 6,82 42,63 2,47 100 1996 {MP4101-05} 40,81 8,68 6,63 41,20 2,68 100 1997 {NP3501-05} 35,60 9,69 6,65 44,71 3,35 100 1998 {OP3501-05} 37,58 8,68 7,11 43,15 3,48 100 1999 {PP3801-05} 38,54 9,11 6,98 42,06 3,31 100 2000 {QP3601-05} 35,75 10,43 6,89 43,99 2,94 100 2001 {RP4001-05} 35,33 9,55 6,91 44,59 3,62 100 2002 {SP4001-05} 34,24 9,71 7,85 45,19 3,01 100 2003 {TP6601-05} 34,18 9,75 6,37 46,22 3,48 100 2004 {UP3701-05} 34,68 10,37 7,33 44,40 3,22 100 2005 {VP4301-05} 33,17 11,26 7,51 44,69 3,36 100 2006 {WP3601-05} 31,11 13,60 6,26 45,18 3,85 100 2007 {XP4701-05} 32,56 11,25 6,66 45,61 3,92 100 2008 {YP4601-05} 33,40 11,39 6,01 45,68 3,51 100 2009 {ZP4201-05} 31,46 12,70 5,42 46,28 4,14 100 2010 {BAP3801-05} 32,26 12,18 4,84 46,36 4,36 100 2011 {BBP4201-05} 29,75 12,55 4,46 49,19 4,05 100 2012 {BCP4001-05} 27,85 11,83 4,06 51,41 4,85 100 2013 {BDP4601-05} 27,32 12,04 3,83 53,14 3,68 100

SOEP Survey Papers 284 31 v30
Stellung im Beruf – ohne Auszubildende/Praktikanten (Westdeutschland), in %
Labor market Position – without trainees/interns (West Germany), in % Population: Alle erwerbstätigen Befragungspersonen ab 17 Jahren ohne Auszubildende und
Praktikanten / All employed persons (age 17 and older) without trainees/interns Westdeutschland / West Germany
Jahr / Year Arbeiter / Blue-collar
workers
Selbständige / Self-employed
Angestellte / White-collar
workers
Beamte / Civil
servants Total
1984 {AP2801-05} 39,60 10,48 40,63 9,29 100 1985 {BP3801-05} 38,53 10,52 41,50 9,45 100 1986 {CP4601-05} 38,79 10,38 41,47 9,35 100 1987 {DP3801-05} 39,21 10,34 41,25 9,20 100 1988 {EP3801-05} 37,75 10,22 42,90 9,13 100 1989 {FP3801-05} 37,28 9,27 44,70 8,75 100 1990 {GP3701-05} 37,29 9,33 44,42 8,96 100 1991 {HP4801-05} 36,66 9,47 45,12 8,74 100 1992 {IP4801-05} 35,17 9,67 46,91 8,25 100 1993 {JP4801-05} 35,24 10,03 45,85 8,87 100 1994 {KP5101-05} 33,24 10,18 46,92 9,65 100 1995 {LP4301-05} 32,85 9,65 48,27 9,22 100 1996 {MP4101-05} 32,26 10,43 48,81 8,50 100 1997 {NP3501-05} 31,45 10,10 49,67 8,78 100 1998 {OP3501-05} 31,17 10,33 50,14 8,36 100 1999 {PP3801-05} 31,22 11,19 49,94 7,65 100 2000 {QP3601-05} 32,40 11,20 49,50 6,90 100 2001 {RP4001-05} 31,83 11,26 49,90 7,02 100 2002 {SP4001-05} 33,06 10,21 50,12 6,61 100 2003 {TP6601-05} 32,00 10,31 50,99 6,69 100 2004 {UP3701-05} 31,25 11,08 51,11 6,55 100 2005 {VP4301-05} 32,13 10,42 50,54 6,91 100 2006 {WP3601-05} 30,72 11,00 51,54 6,74 100 2007 {XP4701-05} 31,68 10,32 50,91 7,08 100 2008 {YP4601-05} 31,62 9,77 52,00 6,61 100 2009 {ZP4201-05} 30,54 9,73 52,93 6,81 100 2010 {BAP3801-05} 28,55 9,55 54,73 7,17 100 2011 {BBP4201-05} 27,57 9,85 55,76 6,82 100 2012 {BCP4001-05} 26,16 10,07 56,75 7,03 100 2013 {BDP4601-05} 24,99 10,47 57,76 6,78 100

SOEP Survey Papers 284 32 v30
Stellung im Beruf – ohne Auszubildende/Praktikanten(Ostdeutschland), in % /
Labor market position – without trainees/interns (East Germany), in % Population: Alle erwerbstätigen Befragungspersonen ab 17 Jahren ohne Auszubildende und
Praktikanten / All employed persons (age 17 and older) without trainees/interns Ostdeutschland / East Germany
Jahr / Year Arbeiter / Blue-collar
workers
Selbständige / Self-employed
Angestellte / White-collar
workers
Beamte / Civil
servants Total
1991 {HP4801-05} 47,91 5,57 45,42 1,10 100 1992 {IP4801-05} 44,04 6,85 47,89 1,21 100 1993 {JP4801-05} 42,98 8,00 47,16 1,87 100 1994 {KP5101-05} 42,10 8,26 47,34 2,30 100 1995 {LP4301-05} 42,93 8,68 45,75 2,65 100 1996 {MP4101-05} 43,71 9,29 44,13 2,87 100 1997 {NP3501-05} 38,14 10,38 47,90 3,59 100 1998 {OP3501-05} 40,45 9,35 46,45 3,74 100 1999 {PP3801-05} 41,43 9,80 45,21 3,56 100 2000 {QP3601-05} 38,39 11,20 47,25 3,15 100 2001 {RP4001-05} 37,95 10,26 47,90 3,89 100 2002 {SP4001-05} 37,16 10,54 49,04 3,26 100 2003 {TP6601-05} 36,50 10,41 49,37 3,72 100 2004 {UP3701-05} 37,43 11,19 47,91 3,48 100 2005 {VP4301-05} 35,87 12,18 48,32 3,63 100 2006 {WP3601-05} 33,19 14,50 48,20 4,11 100 2007 {XP4701-05} 34,89 12,05 48,86 4,20 100 2008 {YP4601-05} 35,54 12,12 48,60 3,73 100 2009 {ZP4201-05} 33,26 13,43 48,93 4,38 100 2010 {BAP3801-05} 33,90 12,80 48,72 4,58 100 2011 {BBP4201-05} 31,14 13,13 51,48 4,24 100 2012 {BCP4001-05} 29,03 12,33 53,59 5,05 100 2013 {BDP4601-05} 28,40 12,51 55,26 3,83 100

SOEP Survey Papers 284 33 v30
Angestellte und Beamte in höheren Fach-/Führungspositionen (Westdeutschland), in %
White-collar workers and civil servants in executive positions (West Germany), in % Population: Angestellte und Beamte in höheren Fach- und Führungspositionen im Alter ab 17
Jahren / White-collar workers and civil servants in executive positions (age 17 and older) Westdeutschland / West Germany
Jahr / Year
Angestellte mit hochqualifizierter
Tätigkeit oder Leitungsfunktion /
White-collar workers in highly qualified position
Angestellte mit umfassenden
Führungsaufgaben / White-collar
workers in management
Beamte im Höheren Dienst / Civil servants in „higher service“
Total
1984 {AP2804-05} 67,79 11,29 20,93 100 1985 {BP3804-05} 71,47 10,43 18,10 100 1986 {CP4604-05} 68,81 11,56 19,63 100 1987 {DP3804-05} 71,39 9,14 19,47 100 1988 {EP3804-05} 71,71 9,64 18,65 100 1989 {FP3804-05} 72,83 11,12 16,05 100 1990 {GP3704-05} 72,97 11,51 15,52 100 1991 {HP4804-05} 73,41 9,74 16,86 100 1992 {IP4804-05} 73,61 11,16 15,23 100 1993 {JP4804-05} 70,57 11,55 17,88 100 1994 {KP5104-05} 74,57 10,20 15,23 100 1995 {LP4304-05} 76,10 8,35 15,55 100 1996{MP4104-05} 79,20 8,87 11,93 100 1997 {NP3504-05} 77,66 9,34 13,00 100 1998 {OP3504-05} 77,81 10,51 11,68 100 1999 {PP3804-05} 79,59 9,95 10,46 100 2000 {QP3604-05} 78,87 11,15 9,98 100 2001 {RP4004-05} 79,35 10,41 10,24 100 2002 {SP4004-05} 77,77 12,57 9,66 100 2003 {TP6604-05} 79,73 10,82 9,45 100 2004 {UP3704-05} 76,74 12,63 10,63 100 2005 {VP4304-05} 78,71 10,71 10,58 100 2006 {WP3604-05} 79,17 10,13 10,70 100 2007 {XP4704-05} 80,93 7,98 11,08 100 2008 {YP4604-05} 81,09 8,03 10,89 100 2009 {ZP4204-05} 80,34 8,43 11,23 100 2010 {BAP3804-05} 80,92 8,67 10,41 100 2011 {BBP4204-05} 80,75 8,57 10,68 100 2012 {BCP4004-05} 81,99 8,38 9,63 100 2013 {BDP4604-05} 84,39 6,25 9,36 100

SOEP Survey Papers 284 34 v30
Angestellte und Beamte in höheren Fach-/Führungspositionen (Ostdeutschland), in % White-collar workers and civil servants in executive positions (East Germany), in %
Population: Angestellte und Beamte in höheren Fach- und Führungspositionen im Alter ab 17 Jahren / White-collar workers and civil servants in executive positions (age 17 and older)
Ostdeutschland / East Germany
Jahr / Year
Angestellte mit hochqualifizierter Tätigkeit oder
Leitungsfunktion / White-collar
workers in highly qualified position
Angestellte mit umfassenden
Führungsaufgaben / White-collar
workers in management
Beamte im Höheren Dienst / Civil servants
in „higher service“
Total
1991 {HP4804-05} 91,40 8,46 0,14 100 1992 {IP4804-05} 91,38 8,62 0,00 100 1993 {JP4804-05} 88,76 10,38 0,86 100 1994 {KP5104-05} 87,86 9,02 3,12 100 1995 {LP4304-05} 86,03 10,67 3,30 100 1996{MP4104-05} 91,20 6,88 1,92 100 1997 {NP3504-05} 85,72 9,35 4,94 100 1998 {OP3504-05} 84,56 11,33 4,11 100 1999 {PP3804-05} 88,45 6,92 4,64 100 2000 {QP3604-05} 86,59 10,23 3,18 100 2001 {RP4004-05} 88,28 5,84 5,89 100 2002 {SP4004-05} 88,53 8,14 3,33 100 2003 {TP6604-05} 87,67 9,38 2,96 100 2004 {UP3704-05} 84,49 10,27 5,25 100 2005 {VP4304-05} 86,33 7,86 5,81 100 2006 {WP3604-05} 85,77 7,66 6,57 100 2007 {XP4704-05} 85,86 6,19 7,95 100 2008 {YP4604-05} 87,54 8,02 4,45 100 2009 {ZP4204-05} 88,14 6,21 5,66 100 2010 {BAP3804-05} 90,10 5,26 4,64 100 2011 {BBP4204-05} 87,77 6,77 5,46 100 2012 {BCP4004-05} 88,16 5,20 6,64 100 2013 {BDP4604-05} 88,14 6,80 5,06 100

SOEP Survey Papers 284 35 v30
Zeitlicher Umfang von Erwerbsarbeit (Vollzeit-Quote), in % /
Amount of time spent at work (full time-ratio), in % Population: Alle erwerbstätigen Befragungspersonen ab 17 Jahren /
All employed persons (age 17 and older) Vollzeit-Quote / full time-ratio
Jahr / Year Westdeutschland / West Germany
Ostdeutschland / East Germany Total
1984 {AP08} 82,62 - 82,62 1985 {BP16} 82,03 - 82,03 1986 {CP16} 82,88 - 82,88 1987 {DP12} 82,61 - 82,61 1988 {EP12} 82,41 - 82,41 1989 {FP10} 82,55 - 82,55 1990 {GP12} 81,88 - 81,88 1991 {HP15} 80,60 90,88 82,85 1992 {IP15} 81,02 92,51 83,27 1993 {JP15} 80,86 91,82 82,88 1994 {KP25} 80,69 90,68 82,54 1995 {LP21} 79,71 88,46 81,34 1996 {MP15} 78,26 87,87 79,97 1997 {NP11} 78,86 87,38 80,38 1998 {OP09} 78,46 87,04 79,97 1999 {PP10} 76,89 85,16 78,31 2000 {QP10} 75,33 83,13 76,66 2001 {RP12} 74,76 82,21 76,02 2002 {SP15} 73,90 81,65 75,17 2003 {TP34} 73,14 79,10 74,11 2004 {UP09} 72,92 75,55 73,35 2005 {VP10} 71,24 77,36 72,22 2006 {WP07} 71,20 74,87 71,86 2007 {XP13} 70,00 74,90 70,89 2008 {YP19} 69,90 76,06 71,02 2009 {ZP09} 69,77 74,84 70,69 2010 {BAP09} 69,05 74,13 69,99 2011 {BBP09} 70,85 75,87 71,81 2012 {BCP11} 69,71 74,63 70,64 2013 {BDP18} 68,06 71,51 68,73

SOEP Survey Papers 284 36 v30
Realisierung von Erwerbsabsichten:
Anteil Nichterwerbstätiger, die „ganz sicher“ eine Erwerbstätigkeit anstrebten und im Folgejahr erwerbstätig waren. /
Realisation of employment plans: Share of unemployed persons wanting a job and being employed the next year Population: Alle nichterwerbstätigen Befragungspersonen, die „ganz sicher“ eine
Erwerbstätigkeit im Ausgangsjahr anstrebten, im Alter ab 17 Jahren, Längsschnitt. / All unemployed persons wanting a job (age 17 and older), longitudinal Westdeutschland /
West Germany Ostdeutschland /
East Germany
Jahr / Year Total 1984/85 {AP18; BP16} 29,72 - 29,72 1985/86 {BP17; CP16} 39,44 - 39,44 1986/87 {CP17; DP12} 37,17 - 37,17 1987/88 {DP14; EP12} 37,05 - 37,05 1988/89 {EP14; FP10} 41,10 - 41,10 1989/90 {FP12; GP12} 37,09 - 37,09 1990/91 {GP15; HP15} 40,90 - 40,90 1991/92 {HP17; IP15} 35,34 42,27 37,09 1992/93 {IP17; JP15} 38,67 45,30 40,67 1993/94 {JP17; KP25} 35,36 38,25 36,26 1994/95 {KP27; LP21} 40,34 46,28 41,98 1995/96 {LP23; MP15} 38,63 37,53 38,38 1996/97 {MP17; NP11} 38,12 41,51 38,98 1997/98 {NP13; OP09} 37,92 36,57 37,60 1998/99 {OP11; PP10} 43,44 48,94 44,95 1999/2000 {PP12; QP10} 39,48 41,69 40,06 2000/01 {QP12; RP12} 39,95 39,65 39,87 2001/02 {RP14; SP15} 36,62 34,05 35,94 2002/03 {SP17; TP34} 33,76 31,65 33,20 2003/04 {TP35; UP09} 36,47 33,31 35,62 2004/05 {UP10; VP10} 35,76 30,97 34,44 2005/06 {VP11; WP07} 36,76 34,29 36,09 2006/07 {WP08; XP13} 39,53 37,14 38,87 2007/08 {XP14; YP19} 43,32 34,31 40,95 2008/09 {YP20; ZP09} 43,14 37,79 41,70 2009/10 {ZP10; BAP09} 39,27 43,68 40,31 2010/11 {BAP10; BBP09} 47,78 41,78 46,36 2011/12 {BBP09; BCP11} 36,65 33,96 36,07 2012/13 {BCP11; BDP18} 41,18 43,11 41,64

SOEP Survey Papers 284 37 v30
Erwerbsstatus von Personen in Partnerschaften (Westdeutschland), in % / Employment status of persons in partnerships (West Germany), in % Population: Alle Personen im Alter ab 17 Jahren mit fester Partnerschaft im Haushalt / All persons with partnership in household (age 17 and older)
Westdeutschland / West Germany
Jahr / Year Beide Partner Vollzeit
erwerbstätig / both partners
full-time employed
Mann Vollzeit, Frau Teilzeit erwerbstätig
/ Man full-time employed, woman part-time employed
Mann Vollzeit, Frau nicht
erwerbstätig / Man full-time employed,
woman not employed
Beide Partner Teilzeit
erwerbstätig / both partners part-
time employed
Mann Teilzeit, Frau Vollzeit
erwerbstätig / Man part-time employed,
woman full-time employed
Mann Teilzeit, Frau nicht erwerbstätig /
Man part-time employed, woman
not employed
Beide Partner nicht
erwerbstätig / both partners not employed
Mann nicht erwerbstätig, Frau
Vollzeit erwerbstätig / Man
not employed, woman full-time
employed
Mann nicht erwerbstätig, Frau
Teilzeit erwerbstätig / Man not employed,
woman part-time employed
Total
1985 {BP16} 17,03 18,81 34,38 0,33 0,30 1,00 22,92 2,67 2,57 100 1986 {CP16} 17,49 17,92 34,50 0,65 0,49 0,92 23,36 2,52 2,15 100 1987 {DP12} 18,35 18,31 34,12 0,44 0,37 0,79 22,82 2,70 2,09 100 1988 {EP12} 17,45 19,31 33,12 0,50 0,35 0,55 23,75 2,95 2,02 100 1989 {FP10} 18,09 19,20 33,02 0,68 0,37 0,39 22,95 3,02 2,28 100 1990 {GP12} 18,33 20,66 31,70 0,25 0,34 0,67 22,73 2,77 2,55 100 1991 {HP15} 18,83 22,54 28,84 0,46 0,55 0,77 22,75 3,23 2,04 100 1992 {IP15} 19,14 21,96 27,56 0,39 0,74 1,05 23,85 3,21 2,09 100 1993 {JP15} 19,73 21,50 26,97 0,46 0,31 0,88 24,14 3,24 2,76 100 1994 {KP25} 18,99 20,93 26,88 0,64 0,41 0,67 24,47 3,84 3,17 100 1995 {LP21} 19,05 21,17 25,18 0,89 0,42 0,91 25,57 3,47 3,33 100 1999 {MP15} 17,53 21,31 24,48 1,29 0,61 0,83 26,59 3,70 3,67 100 1997 {NP11} 17,46 21,50 23,33 0,52 1,00 0,69 28,18 3,50 3,83 100 1998 {OP09} 17,64 21,57 23,63 0,91 0,79 1,06 27,47 3,39 3,54 100 1999 {PP10} 17,45 22,45 24,90 0,85 0,75 1,20 26,27 2,93 3,21 100 2000 {QP10} 15,97 23,73 23,91 1,04 0,77 1,38 26,73 2,86 3,62 100 2001 {RP12} 15,66 23,71 22,71 1,04 0,88 1,54 27,51 3,39 3,58 100 2002 {SP15} 14,43 24,66 20,96 1,08 0,68 1,24 29,40 3,26 4,28 100 2003 {TP34} 13,62 24,01 21,10 1,27 0,78 1,26 29,77 3,55 4,64 100 2004 {UP09} 13,58 24,15 20,52 1,10 0,78 1,34 29,60 3,89 5,04 100 2005 {VP10} 13,29 24,47 20,23 1,33 1,01 1,66 29,48 3,54 4,99 100 2006 {WP07} 13,04 24,44 20,34 1,29 1,23 1,43 29,61 3,45 5,18 100 2007 {XP13} 12,61 26,49 18,32 1,49 1,74 1,44 30,28 3,20 4,43 100 2008 {YP19} 14,05 27,41 17,28 1,64 1,05 2,14 28,80 3,29 4,35 100 2009 {ZP09} 13,34 27,39 16,53 1,69 1,52 2,51 28,57 3,35 5,10 100 2010 {BAP09} 14,20 26,96 14,88 2,02 1,43 2,07 30,04 3,38 5,02 100 2011 {BBP09} 16,64 26,23 15,11 1,63 1,51 1,98 29,35 2,88 4,67 100 2012 {BCP11} 16,53 26,23 15,15 1,91 1,61 1,92 29,13 2,84 4,67 100 2013 {BDP18} 15,28 26,53 14,52 1,70 1,19 2,25 30,34 2,52 5,68 100

SOEP Survey Papers 284 38 v30
Erwerbsstatus von Personen in Partnerschaften (Ostdeutschland), in % Employment status of persons in partnerships (East Germany), in % Population: Alle Personen im Alter ab 17 Jahren mit fester Partnerschaft im Haushalt /
All persons with partnership in household (age 17 and older) Ostdeutschland / East Germany
Jahr / Year Beide Partner Vollzeit
erwerbstätig / both partners
full-time employed
Mann Vollzeit, Frau Teilzeit
erwerbstätig / Man full-time employed,
woman part-time employed
Mann Vollzeit, Frau nicht erwerbstätig /
Man full-time employed, woman
not employed
Beide Partner Teilzeit
erwerbstätig / both partners
part-time employed
Mann Teilzeit, Frau Vollzeit
erwerbstätig / Man part-time employed,
woman full-time employed
Mann Teilzeit, Frau nicht erwerbstätig /
Man part-time employed, woman
not employed
Beide Partner nicht
erwerbstätig / both partners not employed
Mann nicht erwerbstätig, Frau
Vollzeit erwerbstätig / Man
not employed, woman full-time
employed
Mann nicht erwerbstätig, Frau
Teilzeit erwerbstätig / Man
not employed, woman part-time
employed
Total
1992 {IP15} 36,10 7,47 19,85 0,00 0,44 0,83 27,34 6,71 1,27 100 1993 {JP15} 35,14 8,07 17,84 0,14 0,35 0,34 28,72 8,01 1,38 100 1994 {KP25} 33,13 9,32 17,91 0,25 0,45 0,42 30,30 7,10 1,11 100 1995 {LP21} 33,71 10,85 15,41 0,42 0,70 0,30 31,28 5,60 1,73 100 1999{MP15} 31,06 10,61 16,24 0,21 0,50 0,43 31,43 6,85 2,66 100 1997 {NP11} 29,95 10,80 15,62 0,15 0,77 0,93 32,38 6,96 2,43 100 1998 {OP09} 29,65 10,79 13,85 0,13 0,55 0,60 34,34 7,02 3,07 100 1999 {PP10} 28,11 11,39 17,26 0,44 0,44 0,86 32,45 6,18 2,87 100 2000 {QP10} 27,17 11,51 15,76 0,37 0,67 1,06 34,06 6,39 3,01 100 2001 {RP12} 25,57 13,54 13,78 0,35 0,79 1,63 34,86 5,99 3,49 100 2002 {SP15} 23,41 11,92 14,58 0,54 1,04 1,27 37,49 6,16 3,59 100 2003 {TP34} 21,03 13,62 13,92 0,77 0,79 2,43 37,54 5,99 3,91 100 2004 {UP09} 19,85 12,97 14,53 1,06 0,91 2,32 38,09 6,14 4,13 100 2005 {VP10} 21,31 13,39 13,69 1,16 0,72 1,65 38,57 5,30 4,22 100 2006 {WP07} 21,49 13,52 11,34 1,53 1,13 1,50 40,58 4,82 4,09 100 2007 {XP13} 22,43 15,85 10,52 0,90 0,80 2,12 39,30 4,60 3,47 100 2008 {YP19} 23,45 16,38 11,47 0,54 1,00 1,86 36,98 5,07 3,25 100 2009 {ZP09} 22,41 17,28 10,22 1,45 0,99 1,31 37,74 4,25 4,36 100 2010 {BAP09} 23,70 17,10 11,21 1,37 1,01 1,48 34,19 4,01 5,93 100 2011 {BBP09} 25,52 16,84 9,91 1,12 1,32 1,60 36,46 3,55 3,67 100 2012 {BCP11} 23,93 17,40 10,12 1,22 0,86 1,17 35,98 5,17 4,15 100 2013 {BDP18} 24,06 19,43 9,41 1,96 0,99 1,71 35,13 3,66 3,66 100

SOEP Survey Papers 284 39 v30
Erwerbsstatus allgemein (Westdeutschland), in %
Employment status in general (West Germany), in % Population: Alle Personen im Alter ab 17 Jahren / All persons (age 17 and older)
Westdeutschland / West Germany
Jahr / Year Vollzeit / Full-time
Teilzeit / Part-time
Geringfügige Beschäftigung
/ Marginal work
Nicht Erwerbstätig / Not employed
Total
1985 {BP16} 41,80 6,88 2,20 49,12 100 1986 {CP16} 42,03 6,04 2,53 49,40 100 1987 {DP12} 42,61 6,77 2,07 48,55 100 1988 {EP12} 42,66 6,86 2,11 48,37 100 1989 {FP10} 43,31 7,04 2,02 47,63 100 1990 {GP12} 43,98 7,75 1,86 46,41 100 1991 {HP15} 44,28 8,07 2,49 45,17 100 1992 {IP15} 44,10 8,38 1,84 45,68 100 1993 {JP15} 43,99 8,20 2,11 45,71 100 1994 {KP25} 42,85 7,77 2,40 46,99 100 1995 {LP21} 42,19 7,90 2,73 47,18 100 1996 {MP15} 41,54 8,83 2,60 47,02 100 1997 {NP11} 41,04 8,64 2,27 48,04 100 1998 {OP09} 40,84 8,94 2,21 48,02 100 1999 {PP10} 40,69 8,40 3,75 47,16 100 2000 {QP10} 40,62 9,59 3,62 46,17 100 2001 {RP12} 40,29 9,71 3,74 46,26 100 2002 {SP15} 38,90 9,74 3,89 47,47 100 2003 {TP34} 38,05 9,79 4,08 48,08 100 2004 {UP09} 37,59 9,53 4,33 48,55 100 2005 {VP10} 37,16 9,90 5,04 47,90 100 2006 {WP07} 37,42 10,04 5,01 47,52 100 2007 {XP13} 37,78 10,89 5,19 46,14 100 2008 {YP19} 38,65 10,75 5,81 44,78 100 2009 {ZP09} 38,75 10,58 6,06 44,61 100 2010 {BAP09} 38,05 10,96 6,01 44,98 100 2011 {BBP09} 39,33 10,97 5,13 44,57 100 2012 {BCP11} 39,16 11,45 5,46 43,93 100 2013 {BDP18} 37,70 11,56 6,10 44,64 100

SOEP Survey Papers 284 40 v30
Erwerbsstatus allgemein (Ostdeutschland), in % Employment status in general (East Germany) in %
Population: Alle Personen im Alter ab 17 Jahren / All persons (age 17 and older) Ostdeutschland / East Germany
Jahr / Year Vollzeit / Full-time
Teilzeit / Part-time
Geringfügige Beschäftigung
/ Marginal work
Nicht Erwerbstätig / Not employed
Total
1991 {HP15} 55,39 5,02 0,48 39,11 100 1992 {IP15} 48,35 3,40 0,49 47,76 100 1993 {JP15} 45,36 3,47 0,53 50,63 100 1994 {KP25} 44,70 3,99 0,53 50,78 100 1995 {LP21} 44,57 4,93 0,85 49,65 100 1996 {MP15} 43,26 5,17 0,73 50,84 100 1997 {NP11} 42,19 5,07 0,90 51,84 100 1998 {OP09} 41,06 4,98 1,07 52,89 100 1999 {PP10} 40,70 5,55 1,46 52,29 100 2000 {QP10} 39,47 5,77 2,13 52,63 100 2001 {RP12} 38,92 6,17 2,14 52,77 100 2002 {SP15} 36,36 6,06 2,04 55,55 100 2003 {TP34} 35,04 6,64 2,49 55,84 100 2004 {UP09} 33,25 7,31 3,37 56,07 100 2005 {VP10} 33,81 7,31 2,48 56,40 100 2006 {WP07} 34,26 7,18 4,19 54,37 100 2007 {XP13} 35,42 8,26 3,54 52,78 100 2008 {YP19} 37,49 7,76 3,95 50,80 100 2009 {ZP09} 37,56 8,34 4,09 50,01 100 2010 {BAP09} 38,70 9,31 4,06 47,93 100 2011 {BBP09} 40,27 8,69 4,02 47,02 100 2012 {BCP11} 39,35 9,24 4,04 47,38 100 2013 {BDP18} 39,01 11,10 4,36 45,53 100

SOEP Survey Papers 284 41 v30
Stabilität von Erwerbstätigkeit
(=Anteil der Personen in Vollzeit/Teilzeit-Erwerbstätigkeit in % aller Vollzeit/Teilzeit Erwerbstätigen des Vorjahres) /
Stability of employment (=Share of persons in full-time-/part-time-employment in % of all full-time-/part-time-
employees of the prior year) Population: Alle erwerbstätigen Personen im Alter ab 17 Jahren, Längsschnitt /
All employed persons (age 17 and older), longitudinal
Jahr / Year Westdeutschland / West Germany
Ostdeutschland / East Germany
Total
1984/85 {AP08; BP16} 92,22 - 92,22 1985/86 {BP16; CP16} 90,30 - 90,30 1986/87 {CP16; DP12} 91,63 - 91,63 1987/88 {DP12; EP12} 91,42 - 91,42 1988/89 {EP12; FP10} 91,87 - 91,87 1989/90 {FP10; GP12} 92,72 - 92,72 1990/91 {GP12; HP15} 93,42 - 93,42 1991/92 {HP15; IP15} 93,16 81,01 90,51 1992/93 {IP15; JP15} 91,96 84,31 90,46 1993/94 {JP15; KP25} 90,29 91,06 90,44 1994/95 {KP25; LP21} 91,87 91,30 91,76 1995/96 {LP21; MP15} 91,52 88,87 91,02 1996/97 {MP15; NP11} 90,97 88,64 90,54 1997/98 {NP11; OP09} 92,06 86,91 91,03 1998/99 {OP09; PP10} 91,34 89,24 90,97 1999/2000 {PP10; QP10} 91,89 88,01 91,05 2000/01 {QP10; RP12} 91,43 88,67 90,94 2001/02 {RP12; SP15} 90,36 86,72 89,70 2002/03 {SP15; TP34} 90,13 86,74 89,56 2003/04 {TP34; UP09} 90,09 88,48 89,82 2004/05 {UP09; VP10} 89,94 86,83 89,43 2005/06 {VP10; WP07 } 91,15 87,79 90,51 2006/07 {WP07; XP13 } 91,81 91,24 91,71 2007/08 {XP13; YP19 } 91,23 91,89 91,35 2008/09 {YP19; ZP09 } 91,26 90,30 91,08 2009/10 {ZP09; BAP09 } 90,94 91,65 91,07 2010/11 {BAP09; BBP09 } 92,31 91,75 92,19 2011/12 {BBP09; BCP11} 92,47 90,55 92,08 2012/13 {BCBP11; BDP16} 91,09 91,89 91,26

SOEP Survey Papers 284 42 v30
Stabilität von Geringfügiger Beschäftigung bzw. Nicht-Erwerbstätigkeit
(=Anteil der Personen in Geringfügiger Erwerbstätigkeit bzw. Nicht-Erwerbstätigkeit in % aller Geringfügig Erwerbstätigen bzw. Nicht-Erwerbstätigen des Vorjahres) /
Stability of marginal employment/unemployment (=Share of persons in marginal employment/unemployment in % of all marginally
employed/unemployed persons of the prior year Population: Alle erwerbstätigen Personen im Alter ab 17 Jahren, Längsschnitt /
All employed persons (age 17 and older), longitudinal Jahr / Year Westdeutschland /
West Germany Ostdeutschland /
East Germany Total
1984/85 {AP08; BP16} 88,74 - 88,74 1985/86 {BP16; CP16} 91,11 - 91,11 1986/87 {CP16; DP12} 90,34 - 90,34 1987/88 {DP12; EP12} 91,34 - 91,34 1988/89 {EP12; FP10} 90,10 - 90,10 1989/90 {FP10; GP12} 90,53 - 90,53 1990/91 {GP12; HP15} 91,21 - 91,21 1991/92 {HP15; IP15} 91,67 92,04 91,73 1992/93 {IP15; JP15} 92,15 89,02 91,53 1993/94 {JP15; KP25} 92,37 89,91 91,85 1994/95 {KP25; LP21} 91,41 89,21 90,96 1995/96 {LP21; MP15} 90,95 91,07 90,97 1996/97 {MP15; NP11} 91,66 90,48 91,42 1997/98 {NP11; OP09} 92,19 90,94 91,93 1998/99 {OP09; PP10} 91,93 88,11 91,16 1999/2000 {PP10; QP10} 91,24 91,20 91,23 2000/01 {QP10; RP12} 91,31 91,31 91,31 2001/02 {RP12; SP15} 92,50 92,89 92,58 2002/03 {SP15; TP34} 91,99 92,11 92,01 2003/04 {TP34; UP09} 91,71 92,76 91,92 2004/05 {UP09; VP10} 92,46 91,20 92,20 2005/06 {VP10; WP07 } 91,94 91,54 91,85 2006/07 {WP07; XP13 } 90,25 89,78 90,14 2007/08 {XP13; ZP09 } 90,20 91,53 90,49 2008/09 {YP19; ZP09 } 91,41 90,33 91,18 2009/10 {ZP09; BAP09 } 91,32 89,78 91,01 2010/11 {BAP09; BBP09 } 89,62 89,81 89,66 2011/12 {BBP09; BCP11} 91,68 90,97 91,53 2012/13 {BCBP11; BDP16} 92,66 91,35 92,38

SOEP Survey Papers 284 43 v30
Arbeitsmarktbeteiligung (Westdeutschland/ Labor Force Status (West Germany) Population: Alle Personen im Alter ab 17 Jahren / All persons (age 17 and older)
Wenn der Privatanbieter Westdeutschland / West Germany
Jahr / Year Nicht-erwerbs-
tätig /
not em-ployed
Nicht-erwerbs-
tätig, älter 65 /
n. e., age >65
Nicht-erwerbstä-
tig, in Aus-
bildung /n. e., in training
Nicht-erwerbstätig,
in Erzieh-ungsurlaub /n. e., maternity
leave
Nicht-erwerbstätig, in
Wehr-Zivildienst /
n.e., civil/military
service
Nicht-erwerbstätig, arbeitslos gemeldet /
n. e., registered
unemployed
Nicht-erwerbstätig,
manchmal nebener-
werbstätig /n. e., occasional sideline work
Nicht-erwerbstätig, aber letzte 7
Tage er-werbstätig /n.
e., employed in last 7 days
Nicht-erwerbstätig, regelmäßig nebener-
werbstätig /n.e., regularly
sideline work
Er-werbs-tätig /
em-ployed
Erw.tätig aber letzte 7 Tage nicht erw.tätig
/employed but not in last 7 days
Total
1984{LFS84} 21,08 17,72 5,57 - 0,33 2,91 0,00 - - 52,40 - 100 1985{LFS85} 18,45 17,93 4,78 - 0,35 3,73 1,24 - 0,62 52,90 - 100 1986{LFS86} 17,62 18,25 4,41 - 0,47 3,38 1,52 - 1,17 53,18 - 100 1987{LFS87} 16,92 18,24 3,99 - 0,57 3,48 1,40 - 1,07 54,31 - 100 1988{LFS88} 16,92 18,45 4,19 - 0,61 3,54 0,98 - 1,01 54,26 - 100 1989{LFS89} 17,15 18,30 4,23 - 0,46 2,72 1,21 - 0,93 55,00 - 100 1990{LFS90} 16,22 17,92 3,70 - 0,42 2,57 1,76 - 1,31 56,10 - 100 1991{LFS91} 15,00 18,35 3,69 1,03 0,39 2,14 1,32 - 1,01 57,06 - 100 1992{LFS92} 14,64 18,55 3,65 1,35 0,38 2,72 1,55 - 1,24 55,93 - 100 1993{LFS93} 14,35 18,66 3,38 1,09 0,33 3,22 1,65 - 1,20 56,12 - 100 1994{LFS94} 14,26 18,59 3,30 1,11 0,31 4,24 1,96 - 1,88 54,35 - 100 1995{LFS95} 13,43 18,86 3,67 1,71 0,35 4,75 1,75 - 1,69 53,78 - 100 1996{LFS96} 13,66 18,66 3,04 1,26 0,24 4,94 2,22 - 1,98 53,93 - 100 1997{LFS97} 13,88 18,90 3,14 1,63 0,23 5,13 2,11 - 2,10 52,89 - 100 1998{LFS98} 14,20 18,71 3,28 1,62 0,19 4,55 2,15 - 2,22 53,08 - 100 1999{LFS99} 13,14 18,47 2,81 1,78 0,09 3,83 1,62 1,47 1,74 55,05 - 100 2000{LFS00} 13,63 19,23 3,03 1,84 0,09 3,04 1,42 0,54 1,43 55,23 0,52 100 2001{LFS01} 12,50 19,30 2,88 1,91 0,05 3,50 1,52 0,95 1,52 55,46 0,42 100 2002{LFS02} 12,60 19,60 3,03 1,76 0,02 3,94 1,47 0,90 1,42 54,42 0,85 100 2003{LFS03} 11,89 19,57 3,17 1,69 0,07 4,58 1,57 0,78 1,53 53,80 1,34 100 2004{LFS04} 11,45 20,20 3,61 1,51 0,03 5,11 1,55 0,71 1,24 53,26 1,34 100 2005{LFS05} 10,27 20,25 3,74 1,53 0,02 5,01 1,78 0,80 1,41 54,05 1,16 100 2006{LFS06} 10,39 20,78 3,30 1,80 0,02 5,16 1,34 0,76 1,26 53,85 1,35 100 2007{LFS07} 9,54 20,99 3,48 1,64 0,08 4,42 1,54 0,78 1,19 55,02 1,33 100 2008{LFS08} 9,24 21,00 3,41 1,43 0,04 3,71 1,37 1,02 1,21 56,34 1,24 100 2009{LFS09} 8,87 21,07 3,60 1,31 0,02 3,95 1,37 0,94 1,31 56,3 1,24 100 2010{LFS10} 8,15 21,43 3,91 1,18 0,01 4,39 1,39 0,76 1,29 56,36 1,13 100 2011{LFS11} 8,85 21,44 3,70 1,20 0,03 3,16 1,41 1,03 1,71 56,47 0,99 100 2012{LFS12} 8,44 21,52 3,76 1,20 0,02 3,57 1,51 0,76 1,14 57,12 0,96 100 2013{LFS13} 7,99 21,84 3,92 1,42 0,02 4,03 1,21 0,49 0,98 56,62 1,46 100

SOEP Survey Papers 284 44 v30
Arbeitsmarktbeteiligung (Ostdeutschland) / Labor Force Status (East Germany)
Population: Alle Personen im Alter ab 17 Jahren / All persons (age 17 and older) Ostdeutschland / East Germany
Jahr / Year Nicht-erwerbs-tätig /
not em-ployed
Nicht-erwerbs-
tätig, älter 65 /
n. e., age >65
Nicht-erwerbstä-tig,
in Aus-bildung /
n. e., in training
Nicht-erwerbstätig, in
Erzieh-ungsurlaub /
n. e., maternity leave
Nicht-erwerbstätig, in
Wehr-Zivildienst /
n. e., civil/mili-tary service
Nicht-erwerbstätig, arbeitslos gemeldet
/
n. e., registered unemployed
Nicht-erwerbstätig, manchmal nebener-
werbstätig /n. e., occasional sideline
work
Nicht-erwerbstätig, aber letzte 7 Tage
erwerbs-tätig / n. e., employed in last 7
days
Nicht-erwerbstätig, regelmäßig
nebener-werbstätig/ n.e., regularly side-
line work
Er-werbs-tätig /
em-ployed
Erw.tätig aber letzte 7 Tage
nicht erw.tätig /employed but
not in last 7 days
Total
1990{LFS90} 6,84 14,73 1,89 2,07 0,21 - 1,54 - 1,22 71,49 - 100 1991{LFS91} 9,58 15,92 1,96 1,70 0,59 7,11 0,73 - 0,80 61,61 - 100 1992{LFS92} 11,65 16,15 2,71 1,04 0,30 12,08 1,01 - 0,71 54,36 - 100 1993{LFS93} 12,37 16,58 2,80 0,94 0,35 12,68 1,38 - 0,53 52,36 - 100 1994{LFS94} 11,02 17,83 2,33 1,19 0,60 12,64 1,50 - 1,36 51,54 - 100 1995{LFS95} 11,15 18,73 2,51 1,79 0,24 9,97 1,47 - 1,61 52,54 - 100 1996{LFS96} 11,54 18,35 2,61 1,67 0,39 10,16 2,57 - 1,69 51,02 - 100 1997{LFS97} 11,76 18,18 3,13 1,35 0,61 10,82 2,61 - 2,02 49,53 - 100 1998{LFS98} 11,58 18,81 2,86 2,00 0,41 11,42 2,30 - 1,56 49,07 - 100 1999{LFS99} 11,62 19,21 3,17 1,73 0,14 9,40 2,28 0,79 1,19 50,47 - 100 2000{LFS00} 10,72 21,25 3,10 1,43 0,16 8,99 1,90 1,16 1,22 49,65 0,40 100 2001{LFS01} 10,03 21,41 3,04 1,28 0,05 8,93 2,11 1,27 1,73 49,90 0,24 100 2002{LFS02} 10,26 22,04 3,41 1,51 0,05 9,85 2,17 0,98 1,64 47,27 0,81 100 2003{LFS03} 10,07 22,38 3,80 1,88 0,14 10,71 1,54 0,92 1,63 46,07 0,87 100 2004{LFS04} 9,23 22,99 3,55 1,79 0,02 11,11 1,44 1,06 1,28 46,15 1,38 100 2005{LFS05} 8,30 23,36 4,05 2,14 0,10 10,73 2,03 1,24 1,27 45,95 0,82 100 2006{LFS06} 8,11 23,75 4,00 2,25 0,06 10,44 1,12 1,16 1,25 46,67 1,20 100 2007{LFS07} 7,25 23,62 4,73 1,89 0,01 8,85 1,47 0,97 1,18 48,93 1,09 100 2008{LFS08} 6,74 23,99 3,82 1,56 0,01 9,00 1,33 0,99 1,00 50,85 0,70 100 2009{LFS09} 5,65 24,81 3,27 1,32 0,03 8,86 1,43 1,60 0,91 51,39 0,72 100 2010{LFS10} 5,89 23,81 3,76 1,21 0,08 6,94 1,39 1,33 1,03 53,77 0,80 100 2011{LFS11} 6,41 23,64 2,94 1,06 0,03 6,72 1,58 0,87 1,54 54,58 0,63 100 2012{LFS12} 7,01 23,69 2,62 1,26 0,00 7,29 1,27 1,22 0,97 54,01 0,66 100 2013{LFS13} 7,05 23,39 2,63 0,87 0,02 6,42 1,15 0,80 1,17 55,47 1,04 100

SOEP Survey Papers 284 45 v30
Erwerbslosigkeit nach ILO 2001 (EU-L228-19) (Westdeutschland)
Unemployment according to ILO 2001 (EU-L228-19) (West Germany) Population: Alle erwerbslosen Befragungspersonen im Alter ab 17 Jahren /
All unemployed persons (age 17 and older) Westdeutschland / West Germany
Jahr / Year älter als 74 Jahre /
Age>74
Nicht-Erwerbslos/ Not unem-
ployed
k. A. /
n.a.
Erwerbslos MZ, weich /
Unemployed MZ, soft
Erwerbslos-ILO /
Unem-ployed ILO
Erwerbs-tätig /
Em-ployed
Total
1994{LFS94} 8,44 - 88,56 - 3,00 - 100 1995{LFS95} 8,20 - 88,77 - 3,03 - 100 1996{LFS96} 8,53 - 88,52 - 2,95 - 100 1997{LFS97} 9,08 - 87,32 - 3,60 - 100 1998{LFS98} 8,75 - 87,81 - 3,44 - 100 1999{LFS99} 8,94 26,11 - 1,72 3,19 60,05 100 2000{LFS00} 8,91 26,85 - 1,61 3,07 59,56 100 2001{LFS01} 9,43 26,79 - 1,98 3,11 58,68 100 2002{LFS02} 9,60 26,67 - 2,17 4,13 57,43 100 2003{LFS03} 9,91 26,29 - 1,91 4,98 56,91 100 2004{LFS04} 10,04 26,53 - 2,07 5,37 55,99 100 2005{LFS05} 9,89 25,41 - 1,96 5,70 57,03 100 2006{LFS06} 9,85 25,19 1,00 2,06 5,75 56,16 100 2007{LFS07} 9,43 24,81 1,46 2,03 4,99 57,27 100 2008{LFS08} 9,51 24,10 1,38 1,77 3,99 59,25 100 2009{LFS09} 9,48 23,73 1,27 1,97 4,37 59,19 100 2010{LFS10} 9,87 23,19 1,14 2,16 4,68 58,95 100 2011{LFS11} 10,06 23,42 1,42 1,99 3,71 59,39 100 2012{LFS12} 10,49 22,54 1,27 2,36 4,28 59,06 100 2013{LFS13} 10,93 22,43 1,21 2,34 4,66 58,44 100

SOEP Survey Papers 284 46 v30
Erwerbslosigkeit nach ILO 2001 (EU-L228-19) (Ostdeutschland)
Unemployment according to ILO 2001 (EU-L228-19) (East Germany) Population: Alle erwerbslosen Befragungspersonen im Alter ab 17 Jahren /
All unemployed persons (age 17 and older) Ostdeutschland / East Germany
Jahr / Year älter als 74 Jahre /
Age>74
Nicht-Erwerbslos
/ Not unem-ployed
k. A. /
n.a.
Erwerbslos MZ, weich /
Unemployed MZ, soft
Erwerbslos-ILO /
Unem-ployed ILO
Erwerbs-tätig /
Em-ployed
Total
1994{LFS94} 7,95 - 83,98 - 8,07 - 100 1995{LFS95} 8,34 - 85,71 - 5,95 - 100 1996{LFS96} 8,30 - 85,54 - 6,16 - 100 1997{LFS97} 8,13 - 84,89 - 6,98 - 100 1998{LFS98} 8,12 - 83,50 - 8,38 - 100 1999{LFS99} 8,26 27,16 - 2,06 7,80 54,72 100 2000{LFS00} 9,16 26,78 - 1,99 7,95 54,12 100 2001{LFS01} 8,97 27,26 - 2,23 7,84 53,70 100 2002{LFS02} 8,94 28,41 - 2,37 9,42 50,86 100 2003{LFS03} 9,36 28,45 - 2,53 9,91 49,74 100 2004{LFS04} 9,64 27,92 - 1,90 10,63 49,91 100 2005{LFS05} 9,39 27,05 - 2,39 11,46 49,72 100 2006{LFS06} 9,29 26,24 1,51 2,39 10,02 50,56 100 2007{LFS07} 9,33 25,85 1,59 2,48 9,04 51,71 100 2008{LFS08} 8,81 26,43 0,79 2,21 8,31 53,45 100 2009{LFS09} 9,89 25,10 0,66 2,56 7,42 54,38 100 2010{LFS10} 9,47 23,73 0,63 2,72 6,79 56,66 100 2011{LFS11} 10,76 23,14 0,69 1,99 5,81 57,61 100 2012{LFS12} 11,70 21,59 0,56 2,40 7,24 56,51 100 2013{LFS13} 12,57 20,63 0,71 2,66 5,57 57,87 100

SOEP Survey Papers 284 47 v30
Erwerbstätigkeit nach Sektoren (Westdeutschland), in %
Employment by sectors (West Germany), in % Population: Alle erwerbstätigen Befragungspersonen ab 17 Jahren /
All employed persons (age 17 and older) Westdeutschland / West Germany
Jahr / Year Land, Forstwirt-
schaft /
agriculture and forestry
Produzieren-des Gewerbe
/
industry
Handel, Gastgewerbe,
Verkehr /
trade, hospitality,
traffic
Sonstige Dienst-
leistungen /
other services
Total
1984 {NACE84} 0,68 47,24 17,61 34,48 100 1985 {NACE85} 0,69 47,05 17,19 35,06 100 1986 {NACE86} 0,65 47,20 16,12 36,02 100 1987 {NACE87} 0,76 47,39 15,88 35,97 100 1988 {NACE88} 0,68 46,61 15,95 36,76 100 1989 {NACE89} 0,58 46,70 16,41 36,32 100 1990 {NACE90} 0,56 46,45 17,33 35,66 100 1991 {NACE91} 0,59 43,31 19,99 36,10 100 1992 {NACE92} 0,58 43,41 19,45 36,56 100 1993 {NACE93} 0,78 41,56 19,43 38,24 100 1994 {NACE94} 0,66 40,20 19,89 39,25 100 1995 {NACE95} 0,70 38,26 19,97 41,08 100 1996 {NACE96} 0,88 38,08 19,68 41,37 100 1997 {NACE97} 0,61 38,14 20,52 40,73 100 1998 {NACE98} 0,71 34,44 19,83 45,01 100 1999 {NACE99} 0,66 34,22 20,36 44,76 100 2000 {NACE00} 0,72 35,67 20,95 42,66 100 2001 {NACE01} 0,63 34,90 21,04 43,43 100 2002 {NACE02} 0,65 34,21 21,09 44,05 100 2003 {NACE03} 0,59 33,52 20,75 45,15 100 2004 {NACE04} 0,67 32,42 21,73 45,18 100 2005 {NACE05} 0,75 32,63 21,73 44,89 100 2006 {NACE06} 0,65 32,60 21,29 45,46 100 2007 {NACE07} 0,49 32,62 21,38 45,51 100 2008 {NACE08} 0,54 32,02 21,90 45,54 100 2009 {NACE09} 0,83 29,56 21,73 47,88 100 2010 {NACE10} 0,86 29,32 21,78 48,04 100 2011 {NACE11} 0,82 30,65 22,43 46,10 100 2012 {NACE12} 0,74 30,68 21,03 47,55 100 2013 {NACE13} 0,78 29,60 19,90 49,72 100

SOEP Survey Papers 284 48 v30
Erwerbstätigkeit nach Sektoren (Osteutschland), in %
Employment by sectors (East Germany), in % Population: Alle erwerbstätigen Befragungspersonen ab 17 Jahren /
All employed persons (age 17 and older) Ostdeutschland / East Germany
Jahr / Year Land, Forstwirt-
schaft / agriculture and forestry
Produzieren-des Gewerbe
/industry
Handel, Gastgewerbe,
Verkehr / trade,
hospitality, traffic
Sonstige Dienst-
leistungen /other
services
Total
1991 {NACE91} 8,05 40,76 20,48 30,71 100 1992 {NACE92} 5,01 36,47 21,14 37,37 100 1993 {NACE93} 4,35 35,69 21,11 38,85 100 1994 {NACE94} 3,45 35,84 20,94 39,77 100 1995 {NACE95} 3,73 35,21 20,28 40,78 100 1996 {NACE96} 3,29 34,70 20,85 41,16 100 1997 {NACE97} 2,75 33,70 19,11 44,44 100 1998 {NACE98} 3,42 31,10 18,08 47,40 100 1999 {NACE99} 3,01 32,39 17,74 46,86 100 2000 {NACE00} 2,98 33,16 19,66 44,21 100 2001 {NACE01} 2,79 31,69 19,72 45,80 100 2002 {NACE02} 2,77 29,77 20,34 47,12 100 2003 {NACE03} 3,00 29,36 20,42 47,22 100 2004 {NACE04} 2,49 27,16 21,52 48,83 100 2005 {NACE05} 2,40 26,31 20,52 50,78 100 2006 {NACE06} 1,78 24,70 19,87 53,64 100 2007 {NACE07} 1,80 25,22 22,24 50,74 100 2008 {NACE08} 1,90 27,36 22,89 47,85 100 2009 {NACE09} 2,56 27,51 19,93 49,99 100 2010 {NACE10} 2,55 27,38 20,41 49,65 100 2011 {NACE11} 3,18 27,23 21,34 48,24 100 2012 {NACE12} 2,65 26,42 21,34 49,59 100 2013 {NACE13} 3,08 25,58 21,99 49,35 100

SOEP Survey Papers 284 49 v30
Erwerbstätigkeit nach Wirtschaftsbereichen (Westdeutschland), in % Employment by economic sector (West Germany), in %
Population: Alle erwerbstätigen Befragungspersonen ab 17 Jahren / All employed persons (age 17 and older) Westdeutschland / West Germany
Jahr / Year Land, Forst und
Fischerei / Agriculture
forestry, fishing
Bergbau und verarbeiten-
des Gewerbe / Mining and
manufacturing sector
Energie und Wasser-
versorgung / Power- and
water-supply
Bauge-werbe /
Construc-tion
Handel und
Gewerbe / Trade
Verkehr und Nachrichten-übermittlung
/ Traffic
Kredit- und Versicherungs-
gewerbe / insurance and
financial business
Grundstücke, Vermietung,
unternehmerische Dienstleistungen /
estate, renting, corporate services
Öffentliche Verwal-tung / public
administra-tion
Öffentliche und private Dienst-
leistungen / public and
private services
Total
1984 {NACE84} 0,68 37,19 1,16 9,07 11,59 6,25 3,89 4,18 10,57 15,42 100 1985 {NACE85} 0,69 37,52 1,10 8,61 11,34 6,08 3,76 3,83 11,71 15,36 100 1986 {NACE86} 0,65 38,18 1,23 8,12 10,83 5,63 4,08 3,86 12,00 15,42 100 1987 {NACE87} 0,76 38,77 1,19 7,80 10,50 5,68 4,01 3,93 11,66 15,68 100 1988 {NACE88} 0,68 37,94 1,22 7,73 10,85 5,24 3,94 4,62 11,99 15,77 100 1989 {NACE89} 0,58 38,06 1,26 7,64 11,61 5,03 4,29 4,62 10,74 16,17 100 1990 {NACE90} 0,56 37,81 1,47 7,45 11,97 5,52 4,33 4,67 10,41 15,80 100 1991 {NACE91} 0,59 35,80 1,28 7,48 14,86 5,21 4,17 3,83 10,18 16,59 100 1992 {NACE92} 0,58 35,75 1,30 7,73 14,35 5,18 3,92 3,75 9,88 17,56 100 1993 {NACE93} 0,78 35,24 1,31 7,18 14,52 5,19 4,43 4,24 9,99 17,13 100 1994 {NACE94} 0,66 33,44 1,27 7,38 14,99 5,13 4,49 4,45 10,42 17,78 100 1995 {NACE95} 0,70 31,57 1,37 7,53 14,68 5,45 4,39 5,08 10,05 19,16 100 1996 {NACE96} 0,88 32,49 1,21 6,78 14,56 5,27 4,56 4,80 10,34 19,11 100 1997 {NACE97} 0,61 31,40 1,21 7,26 15,90 5,11 4,85 5,14 9,61 18,92 100 1998 {NACE98} 0,71 31,61 1,25 5,19 18,76 4,76 4,94 3,98 9,33 19,46 100 1999 {NACE99} 0,66 30,82 1,13 5,32 18,27 5,08 4,75 4,54 9,16 20,28 100 2000 {NACE00} 0,72 29,64 0,76 6,35 16,08 5,36 4,61 6,99 8,89 20,61 100 2001 {NACE01} 0,63 29,47 0,72 5,78 15,89 5,51 4,61 7,71 8,98 20,69 100 2002 {NACE02} 0,65 28,73 0,72 5,76 16,50 5,67 4,57 7,03 9,00 21,37 100 2003 {NACE03} 0,59 28,17 0,89 5,44 16,46 5,39 4,69 7,16 8,80 22,42 100 2004 {NACE04} 0,67 27,14 0,94 4,96 16,79 5,67 4,93 7,03 8,69 23,17 100 2005 {NACE05} 0,75 27,82 1,07 4,34 16,82 5,47 4,66 7,39 8,47 23,20 100 2006 {NACE06} 0,65 28,04 0,98 4,46 17,03 5,16 4,87 7,53 8,10 23,18 100 2007 {NACE07} 0,49 28,22 1,01 4,56 16,82 5,16 4,74 7,86 8,04 23,10 100 2008 {NACE08} 0,54 27,66 0,85 4,55 17,54 5,12 4,85 8,14 7,59 23,17 100
2009 {NACE09} 0,83 25,74 0,78 4,57 17,15 5,18 4,67 9,23 8,06 23,78 100
2010 {NACE10} 0,86 25,29 1,07 4,24 17,17 5,13 4,34 8,65 8,47 24,77 100 2011 {NACE11} 0,82 26,45 1,16 4,23 17,44 5,63 3,96 7,88 7,95 24,48 100 2012 {NACE12} 0,74 25,83 0,97 4,89 16,20 5,63 4,22 8,06 8,01 25,45 100 2013 {NACE13} 0,78 24,99 1,14 4,52 15,82 5,45 4,27 8,31 8,79 25,92 100

SOEP Survey Papers 284 50 v30
Erwerbstätigkeit nach Wirtschaftsbereichen (Ostdeutschland), in %
Employment by economic sector (East Germany), in % Population: Alle erwerbstätigen Befragungspersonen ab 17 Jahren / All employed persons (age 17 and older)
Ostdeutschland / East Germany Jahr / Year Land, Forst
und Fischerei / Agriculture
forestry, fishing
Bergbau und verarbeitendes
Gewerbe / Mining and
manufacturing sector
Energie und Wasserver-sorgung /
Power- and water-supply
Bauge-werbe / Construc-
tion
Handel und Gewerbe /
Trade
Verkehr und Nachrich-
tenübermitt-lung / Traffic
Kredit- und Versicherungs-
gewerbe / insurance and
financial business
Grundstücke, Vermietung,
unternehmerische Dienstleistungen /
estate, renting, corporate services
Öffentliche Verwaltung /
public administra-
tion
Öffentliche und private
Dienst-leistungen / public and
private services
Total
1991 {NACE91} 8,05 31,75 2,10 8,53 11,33 9,23 1,44 2,92 7,65 17,01 100 1992 {NACE92} 5,01 24,67 2,10 10,68 12,13 9,34 2,05 3,87 11,04 19,11 100 1993 {NACE93} 4,35 20,93 2,63 13,53 13,20 8,11 2,15 4,80 11,40 18,90 100 1994 {NACE94} 3,45 19,21 2,70 15,23 13,76 7,52 2,54 4,94 11,03 19,61 100 1995 {NACE95} 3,73 17,75 1,74 16,95 12,46 8,28 3,01 4,22 10,60 21,26 100 1996 {NACE96} 3,29 17,81 1,90 16,06 12,77 8,55 3,06 5,01 9,98 21,58 100 1997 {NACE97} 2,75 19,30 2,15 13,49 12,40 7,16 2,82 6,01 10,66 23,28 100 1998 {NACE98} 3,42 19,84 2,01 12,43 17,15 5,65 3,09 2,91 12,39 21,11 100 1999 {NACE99} 3,01 21,04 1,88 12,23 16,09 5,63 3,23 4,19 11,98 20,71 100 2000 {NACE00} 2,98 18,81 1,85 13,05 15,06 5,00 2,44 7,18 9,83 23,80 100 2001 {NACE01} 2,79 19,20 1,86 11,33 14,99 5,06 1,93 8,16 10,58 24,11 100 2002 {NACE02} 2,77 18,74 1,92 9,79 15,82 5,43 1,74 9,02 11,08 23,69 100 2003 {NACE03} 3,00 19,68 1,86 8,56 15,60 5,75 1,72 7,98 11,04 24,83 100 2004 {NACE04} 2,49 18,95 1,42 7,89 16,84 5,64 1,86 7,87 9,67 27,37 100 2005 {NACE05} 2,40 19,00 1,71 7,05 16,03 5,75 1,82 9,74 9,79 26,72 100 2006 {NACE06} 1,78 17,97 1,68 6,37 16,05 6,42 1,97 10,01 10,33 27,40 100 2007 {NACE07} 1,80 17,79 1,84 7,07 15,94 7,33 1,60 10,64 10,38 25,61 100 2008 {NACE08} 1,90 19,82 1,92 6,79 15,94 7,39 1,69 10,10 9,34 25,09 100 2009 {NACE09} 2,56 20,30 1,80 6,41 15,56 6,11 1,42 9,14 10,08 26,61 100 2010 {NACE10} 2,55 20,68 1,83 5,80 16,03 5,87 1,61 8,95 10,05 26,62 100 2011 {NACE11} 3,18 19,65 2,04 6,20 15,36 7,21 2,29 9,17 9,22 25,67 100 2012 {NACE12} 2,65 18,54 1,75 6,85 15,23 6,70 2,61 10,02 10,09 25,56 100 2013 {NACE13} 3,08 18,92 1,39 6,06 16,83 6,78 2,36 9,93 8,71 25,94 100

SOEP Survey Papers 284 51 v30
Zweittätigkeit von Arbeitnehmern, in % / Second jobs of employees, in % Population: Alle erwerbstätigen Personen im Alter ab 17 Jahren /
All employed persons (age 17 and older) Mit Zweittätigkeit / With second job
Jahr / Year Westdeutschland / West Germany
Ostdeutschland / East Germany
Total
1985 {BP0301-03} 8,67 - 8,67 1986 {CP0301-03} 8,14 - 8,14 1987 {DP0301-03} 5,98 - 5,98 1988 {EP0301-03} 6,44 - 6,44 1989 {FP0301-03} 6,95 - 6,95 1990 {GP0701-03} 8,85 - 8,85 1991 {HP0201-03} 6,76 7,44 6,91 1992 {IP0201-03} 6,73 5,92 6,57 1993 {JP0301-03} 7,33 5,19 6,93 1994 {KP0901-03} 8,56 5,64 8,01 1995 {LP0301-03} 9,11 6,36 8,59 1996 {MP5501-03} 9,13 6,65 8,68 1997 {NP5501-03} 8,91 6,58 8,50 1998 {OP4601-03} 8,99 5,90 8,44 1999 {PP6101-03} 8,14 7,18 7,98 2000 {QP5701-03} 7,01 4,82 6,63 2001 {RP5901-03} 7,50 5,94 7,23 2002 {SP5901-03} 6,16 5,14 5,99 2003 {TP7701-03} 6,04 4,57 5,80 2004 {UP6001-03} 5,43 4,15 5,22 2005 {VP7201-03} 6,46 3,64 6,02 2006 {WP6301-03} 6,44 3,85 5,98 2007 {XP7401-03} 7,11 5,09 6,74 2008 {YP7101-03} 7,01 3,93 6,46 2009 {ZP7301-03} 7,83 5,40 7,40 2010 {BAP6401-03} 7,16 3,96 6,59 2011 {BBP7401-03} 8,07 4,49 7,40 2012 {BCP6201-03} 7,89 4,36 7,24 2013 {BDP8001-03} 7,15 4,66 6,68

SOEP Survey Papers 284 52 v30
Abhängige Beschäftigung, in % / Dependent Employees, in %
Population: Alle erwerbstätigen Befragungspersonen ab 17 Jahren / All employed persons (age 17 and older)
Abhängig-Beschäftigte / Dependently employed
Jahr / Year Westdeutschland / West Germany
Ostdeutschland / East Germany Total
1984 {AP08, AP2801-05} 83,46 - 83,46 1985 {BP16, BP3801-05} 82,80 - 82,80 1986 {CP16, CP4601-05} 81,80 - 81,80 1987 {DP12, DP3801-05} 83,07 - 83,07 1988 {EP12, EP3801-05} 83,57 - 83,57 1989 {FP10, FP3801-05} 84,65 - 84,65 1990 {GP12, GP3701-05} 84,47 - 84,47 1991 {HP15, HP4801-05} 84,26 89,82 85,46 1992 {IP15, IP4801-05} 84,82 87,35 85,31 1993 {JP15, JP4801-05} 84,72 84,37 84,65 1994 {KP25, KP5101-05} 85,26 84,87 85,19 1995 {LP21, LP4301-05} 85,21 84,62 85,10 1996 {MP15, MP4101-05} 85,01 84,35 84,89 1997 {NP11, NP3501-05} 85,15 83,16 84,79 1998 {OP09, OP3501-05} 85,17 84,16 84,98 1999 {PP10, PP3801-05} 84,23 83,69 84,13 2000 {QP10, QP3601-05} 84,48 82,33 84,11 2001 {RP12, RP4001-05} 83,83 83,15 83,71 2002 {SP15, SP4001-05} 84,81 82,12 84,36 2003 {TP34, TP6601-05} 84,81 83,47 84,59 2004 {UP09, UP3701-05} 84,13 81,76 83,73 2005 {VP10, VP4301-05} 84,96 80,85 84,29 2006 {WP07, WP3601-05} 84,25 79,99 83,47 2007 {XP13, XP4701-05} 85,53 81,38 84,76 2008 {YP19, YP4601-05} 85,79 82,29 85,15 2009 {ZP09, ZP4201-05} 85,17 81,38 84,48 2010 {BAP09, BAP3801-05} 85,68 82,23 85,04 2011 {BBP09, BBP4201-05} 85,24 82,53 84,72 2012 {BCP11, BCP4001-05} 85,75 83,90 85,40 2013 {BDP18, BDP4601-05} 84,69 83,51 84,46

SOEP Survey Papers 284 53 v30
Im Öffentlichen Dienst beschäftigt, in % / Employed in public service, in %
Population: Alle abhängig erwerbstätigen Befragungspersonen im Alter ab 17 Jahren / All employed persons (age 17 and older)
Jahr / Year Westdeutschland / West Germany
Ostdeutschland / East Germany Total
1984 {OEFFD84} 27,49 - 27,49 1985 {OEFFD85} 28,84 - 28,84 1986 {OEFFD86} 29,26 - 29,26 1987 {OEFFD87} 28,74 - 28,74 1988 {OEFFD88} 28,43 - 28,43 1989 {OEFFD89} 27,66 - 27,66 1990 {OEFFD90} 27,44 - 27,44 1991 {OEFFD91} 27,81 33,72 29,15 1992 {OEFFD92} 28,48 38,88 30,59 1993 {OEFFD93} 27,93 36,98 29,63 1994 {OEFFD94} 28,48 36,09 29,92 1995 {OEFFD95} 29,08 34,78 30,15 1996 {OEFFD96} 29,28 34,77 30,27 1997 {OEFFD97} 28,51 35,01 29,66 1998 {OEFFD98} 28,60 35,03 29,74 1999 {OEFFD99} 28,27 34,76 29,41 2000 {OEFFD00} 26,03 30,61 26,81 2001 {OEFFD01} 26,01 30,57 26,80 2002 {OEFFD02} 25,82 29,61 26,44 2003 {OEFFD03} 26,91 30,71 27,52 2004 {OEFFD04} 26,74 29,42 27,18 2005 {OEFFD05} 26,52 31,40 27,28 2006 {OEFFD06} 26,58 32,15 27,53 2007 {OEFFD07} 25,48 29,30 26,16 2008 {OEFFD08} 24,82 28,68 25,50 2009 {OEFFD09} 25,12 28,21 25,67 2010 {OEFFD10} 26,00 27,46 26,26 2011 {OEFFD11} 26,17 26,52 26,24 2012 {OEFFD12} 26,21 27,58 26,47 2013 {OEFFD13} 25,11 25,10 25,11

SOEP Survey Papers 284 54 v30
Berufsklassifikation nach ISCO-88 (Westdeutschland), in %
Job classification according to ISCO-88 (West Germany), in % Population: Alle abhängig erwerbstätigen Befragungspersonen im Alter ab 17 Jahren / All dependently employed persons (age 17 and older)
Westdeutschland / West Germany Jahr / Year Leitende
Verwaltungs-bedienstete,
Führungskräfte /
Legislators, senior officials, managers
Wissen-schaftler /
Profes-sionals
Techniker, gleichrangige nicht-technische Berufe /
Technicians, associate
professionals
Bürokräfte, kauf-männische
Angestellte /
Clerks
Dienstleistungs-berufe, Verkäufer in Geschäften
und auf Märkten /
Service workers, shop/market sales
workers
Fachkräfte in Landwirtschaft und Fischerei /
Skilled agricul-tural/ fishery
workers
Handwerks- und verwandte Berufe
/
Craft/related trades workers
Anlagen- und Maschinen-bediener,
Montierer/
Plant/ machine operators and assemblers
Hilfs-arbeits-kräfte /
Elementary occupation
Total
1984 {IS8884} 4,19 10,72 18,26 15,40 9,90 0,62 21,12 11,30 8,49 100 1985 {IS8885} 4,32 11,49 18,89 15,79 9,61 0,47 20,41 11,01 8,02 100 1986 {IS8886} 4,16 11,80 19,53 15,92 8,94 0,54 20,53 11,00 7,59 100 1987 {IS8887} 4,06 11,76 19,10 15,66 9,26 0,51 19,84 11,65 8,17 100 1988 {IS8888} 4,36 12,40 19,56 15,29 8,96 0,57 19,87 10,82 8,18 100 1989 {IS8889} 4,85 11,75 19,24 15,17 9,43 0,54 20,21 10,33 8,47 100 1990 {IS8890} 5,06 11,70 19,86 15,04 9,59 0,35 19,47 10,68 8,26 100 1991 {IS8891} 4,95 11,45 19,73 15,76 9,77 0,41 19,83 9,91 8,19 100 1992 {IS8892} 4,48 12,34 20,04 15,92 10,51 0,34 19,32 9,79 7,25 100 1993 {IS8893} 4,91 12,76 19,77 14,71 11,15 0,46 18,79 9,58 7,87 100 1994 {IS8894} 4,57 14,08 19,82 15,47 10,84 0,61 18,39 8,86 7,36 100 1995 {IS8895} 4,62 14,13 20,57 14,91 10,64 0,48 17,52 8,62 8,50 100 1996 {IS8896} 4,48 14,36 21,20 15,35 10,43 0,56 16,50 8,70 8,42 100 1997 {IS8897} 4,84 14,63 22,59 14,12 10,40 0,62 15,80 8,61 8,39 100 1998 {IS8898} 5,45 15,15 22,10 14,83 10,19 0,65 15,67 8,27 7,70 100 1999 {IS8899} 5,38 14,97 22,33 14,50 10,04 0,60 15,28 8,61 8,29 100 2000 {IS8800} 4,89 14,30 21,95 13,70 10,64 0,82 15,25 9,50 8,95 100 2001 {IS8801} 4,75 14,53 22,50 13,74 10,59 0,80 15,18 9,40 8,52 100 2002 {IS8802} 5,15 13,64 21,96 14,25 11,08 0,76 14,08 8,89 10,19 100 2003 {IS8803} 5,27 14,02 22,44 14,00 11,54 0,60 14,03 8,53 9,58 100 2004 {IS8804} 5,02 13,91 23,35 13,32 12,00 0,83 13,80 8,70 9,08 100 2005 {IS8805} 4,95 14,24 22,97 13,14 12,22 0,88 13,71 8,86 9,03 100 2006 {IS8806} 4,68 15,16 22,86 12,95 12,03 0,75 13,51 8,60 9,47 100 2007 {IS8807} 4,99 15,95 22,00 13,72 11,22 0,72 13,64 7,82 9,94 100 2008 {IS8808} 5,40 16,95 21,56 13,68 11,35 0,53 12,84 7,74 9,95 100 2009 {IS8809} 5,03 16,79 22,80 12,56 12,73 0,64 12,31 7,78 9,36 100 2010 {IS8810} 4,97 17,03 23,71 12,91 13,13 0,57 11,39 7,46 8,82 100 2011 {IS8811} 5,67 16,77 24,34 12,54 13,30 0,50 11,31 6,81 8,75 100 2012 {IS8812} 5,29 17,33 24,20 12,73 12,93 0,63 11,95 6,66 8,27 100 2013 {IS8813} 5,11 18,40 23,57 11,79 12,89 0,70 11,83 6,69 9,02 100

SOEP Survey Papers 284 55 v30
Berufsklassifikation nach ISCO-88 (Ostdeutschland), in %
Job classification according to ISCO-88 (East Germany), in % Population: Alle abhängig erwerbstätigen Befragungspersonen im Alter ab 17 Jahren / All dependently employed persons (age 17 and older) Ostdeutschland / East Germany
Jahr / Year Leitende Verwaltungs-bedienstete,
Führungskräfte /
Legislators, senior officials, managers
Wissen-schaftler
/
Profes-sionals
Techniker, gleichrangige nicht-technische Berufe /
Technicians, associate professionals
Bürokräfte, kauf-
männische Angestellte /
Clerks
Dienstleistungs-berufe, Verkäufer in Geschäften und auf Märkten / Service
workers, shop/market sales
workers
Fachkräfte in Landwirtschaft und Fischerei /
Skilled agricul-tural/ fishery
workers
Handwerks- und verwandte
Berufe /
Craft/related trades workers
Anlagen- und Maschinen-bediener,
Montierer/
Plant/ machine operators and
assemblers
Hilfs-arbeits-kräfte /
Elementary occupation
Total
1991 {IS8891} 5,26 11,81 16,82 10,46 9,25 2,32 24,06 11,70 8,33 100 1992 {IS8892} 4,47 13,56 18,55 9,84 10,19 1,24 22,52 11,04 8,59 100 1993 {IS8893} 3,92 13,05 19,51 11,00 10,81 1,57 21,98 10,24 7,93 100 1994 {IS8894} 3,64 13,43 20,43 10,82 10,31 1,53 23,31 9,42 7,10 100 1995 {IS8895} 4,76 12,45 18,24 11,94 10,46 1,67 23,68 9,30 7,51 100 1996 {IS8896} 4,51 13,13 18,67 12,29 10,40 1,96 23,79 9,03 6,22 100 1997 {IS8897} 4,66 14,33 19,86 11,30 9,27 1,60 23,03 8,88 7,07 100 1998 {IS8898} 4,68 12,68 21,07 10,59 10,80 1,81 22,90 8,55 6,90 100 1999 {IS8899} 3,90 13,33 20,68 10,90 10,73 1,87 22,44 8,69 7,45 100 2000 {IS8800} 4,25 13,52 20,09 10,21 11,40 1,62 20,86 8,96 9,09 100 2001 {IS8801} 4,41 14,53 20,66 10,23 11,20 1,81 20,13 8,56 8,47 100 2002 {IS8802} 4,18 14,53 22,94 10,26 10,94 1,86 18,55 8,69 8,06 100 2003 {IS8803} 4,42 14,48 23,63 10,18 11,69 1,90 17,90 8,76 7,04 100 2004 {IS8804} 3,70 14,11 22,35 9,67 13,46 1,38 17,89 9,16 8,27 100 2005 {IS8805} 3,87 15,06 23,00 9,80 12,57 1,06 18,04 8,12 8,49 100 2006 {IS8806} 4,02 17,01 22,86 11,28 11,32 0,90 16,69 7,87 8,06 100 2007 {IS8807} 3,37 14,22 23,58 10,49 12,43 1,32 15,92 8,46 10,21 100 2008 {IS8808} 2,69 13,29 25,85 10,73 11,27 0,95 15,97 8,63 10,62 100 2009 {IS8809} 3,74 13,13 27,39 10,32 11,86 1,37 14,73 8,49 8,97 100 2010 {IS8810} 3,04 13,33 27,09 9,92 12,77 1,35 14,85 8,82 8,82 100 2011 {IS8811} 4,40 15,04 25,03 9,36 12,06 1,45 13,83 9,12 9,70 100 2012 {IS8812} 4,38 15,84 26,48 8,99 11,91 1,12 14,12 7,98 9,19 100 2013 {IS8813} 4,70 15,07 24,89 8,53 13,45 1,82 13,88 7,30 10,35 100

SOEP Survey Papers 284 56 v30
Unternehmensgröße (Westdeutschland), in % / Firm size (West Germany), in % Population: Alle abhängig erwerbstätigen Befragungspersonen im Alter ab 17 Jahren /
All dependently employed persons (age 17 and older) Westdeutschland / West Germany
Jahr / Year <20 Beschäftigte /
employees
20-<200 Beschäftigte / employees
200-<2000 Beschäftigte /
employees
>2000 Beschäftigte / employees
Total
1984 {ALLBET84} 20,83 28,31 22,26 28,60 100 1985 {ALLBET85} 19,10 28,03 23,51 29,36 100 1986 {ALLBET86} 18,29 27,37 24,23 30,12 100 1987 {ALLBET87} 18,32 27,49 23,97 30,22 100 1988 {ALLBET88} 18,22 28,24 23,91 29,63 100 1989 {ALLBET89} 20,35 28,03 23,72 27,91 100 1990 {ALLBET90} 20,38 27,08 23,73 28,81 100 1991 {ALLBET91} 21,96 24,90 25,10 28,04 100 1992 {ALLBET92} 20,78 25,45 25,27 28,49 100 1993 {ALLBET93} 20,92 27,14 23,45 28,50 100 1994 {ALLBET94} 21,41 27,21 22,86 28,53 100 1995 {ALLBET95} 22,56 26,96 22,94 27,54 100 1996 {ALLBET96} 21,49 26,65 23,72 28,14 100 1997 {ALLBET97} 22,01 27,29 24,44 26,26 100 1998 {ALLBET98} 22,96 28,07 24,05 24,92 100 1999 {ALLBET99} 22,58 28,85 24,02 24,55 100 2000 {ALLBET00} 23,87 29,39 23,21 23,53 100 2001 {ALLBET01} 22,70 30,00 23,48 23,82 100 2002 {ALLBET02} 24,44 29,80 23,58 22,18 100 2003 {ALLBET03} 23,70 29,96 23,70 22,65 100 2004 {ALLBET04} 24,97 29,58 22,88 22,57 100 2005 {ALLBET05} 24,54 29,88 22,73 22,84 100 2006 {ALLBET06} 24,57 29,26 23,37 22,80 100 2007 {ALLBET07} 24,33 29,05 22,27 24,35 100 2008 {ALLBET08} 23,75 29,20 22,49 24,56 100 2009 {ALLBET09} 24,61 29,04 21,58 24,77 100 2010 {ALLBET10} 24,51 28,54 22,52 24,43 100 2011 {ALLBET11} 24,00 28,44 21,71 25,85 100 2012 {ALLBET12} 21,43 26,88 22,94 28,75 100 2013 {ALLBET13} 23,28 26,98 21,66 28,08 100

SOEP Survey Papers 284 57 v30
Unternehmensgröße (Ostdeutschland), in % / Firm size (East Germany), in %
Population: Alle abhängig erwerbstätigen Befragungspersonen im Alter ab 17 Jahren / All dependently employed persons (age 17 and older)
Ostdeutschland / East Germany
Jahr / Year <20 Beschäftigte /
employees
20-<200 Beschäftigte / employees
200-<2000 Beschäftigte /
employees
>2000 Beschäftigte / employees
Total
1991 {ALLBET91} 14,66 34,23 30,46 20,66 100 1992 {ALLBET92} 21,02 35,96 25,01 18,01 100 1993 {ALLBET93} 24,78 34,72 21,75 18,76 100 1994 {ALLBET94} 25,51 34,59 21,60 18,30 100 1995 {ALLBET95} 27,42 35,86 20,20 16,52 100 1996 {ALLBET96} 25,96 35,85 20,19 18,00 100 1997 {ALLBET97} 27,78 36,71 17,90 17,62 100 1998 {ALLBET98} 29,89 34,87 18,31 16,93 100 1999 {ALLBET99} 29,26 34,29 19,79 16,66 100 2000 {ALLBET00} 29,45 37,83 17,88 14,84 100 2001 {ALLBET01} 29,07 36,82 18,80 15,31 100 2002 {ALLBET02} 31,48 34,15 18,74 15,63 100 2003 {ALLBET03} 29,54 35,17 19,50 15,78 100 2004 {ALLBET04} 29,22 35,79 18,55 16,44 100 2005 {ALLBET05} 27,59 35,87 18,05 18,49 100 2006 {ALLBET06} 25,70 35,55 18,86 19,90 100 2007 {ALLBET07} 28,05 32,72 19,53 19,70 100 2008 {ALLBET08} 26,55 33,37 20,46 19,62 100 2009 {ALLBET09} 27,14 33,88 19,67 19,32 100 2010 {ALLBET10} 25,97 33,56 21,48 18,99 100 2011 {ALLBET11} 24,60 32,97 20,69 21,74 100 2012 {ALLBET12} 23,01 32,19 21,20 23,60 100 2013 {ALLBET13} 24,99 32,27 21,46 21,27 100

SOEP Survey Papers 284 58 v30
Inzidenz von Überstunden (Westdeutschland), in % Incidence of overtime hours (West Germany), in %
Population: Alle abhängig erwerbstätigen Befragungspersonen im Alter ab 17 Jahren / All dependently employed persons (age 17 and older)
Westdeutschland / West Germany
Jahr / Year Ja / Yes Nein / No Trifft nicht zu (z.B. Selbständige) / Does not
apply (i.e. self-employed)
Total
1997 {NP51} 63,12 28,21 8,67 100 1998 {OP42} 61,26 29,17 9,57 100 1999 {PP57} 59,72 30,30 9,98 100 2000 {QP53} 59,92 29,39 10,70 100 2001 {RP54} 60,48 28,96 10,56 100 2002 {SP54} 58,72 31,48 9,80 100 2003 {TP72} 60,28 29,91 9,80 100 2004 {UP55} 59,46 29,95 10,59 100 2005 {VP67} 58,69 31,26 10,05 100 2006 {WP55} 62,08 27,32 10,60 100 2007 {XP69} 59,93 30,07 10,00 100 2008 {YP64} 62,69 27,99 9,32 100 2009 {ZP68} 60,70 29,74 9,56 100 2010 {BAP57} 62,13 28,74 9,14 100 2011 {BBP69} 62,72 27,63 9,64 100 2012 {BCP55} 64,31 25,98 9,71 100 2013 {BDP72} 60,84 29,09 10,07 100
Inzidenz von Überstunden (Ostdeutschland), in % Incidence of overtime hours (East Germany), in %
Population: Alle abhängig erwerbstätigen Befragungspersonen im Alter ab 17 Jahren / All dependently employed persons (age 17 and older)
Ostdeutschland / East Germany
Jahr / Year Ja / Yes Nein / No Trifft nicht zu (z.B. Selbständige)/Does not
apply (i.e. self-employed)
Total
1997 {NP51} 71,49 19,49 9,02 100 1998 {OP42} 71,90 19,78 8,32 100 1999 {PP57} 70,80 20,40 8,81 100 2000 {QP53} 65,16 24,65 10,18 100 2001 {RP54} 67,35 23,09 9,56 100 2002 {SP54} 66,06 24,17 9,77 100 2003 {TP72} 66,91 23,28 9,81 100 2004 {UP55} 64,06 25,38 10,57 100 2005 {VP67} 65,63 22,83 11,54 100 2006 {WP55} 66,81 19,54 13,64 100 2007 {XP69} 65,49 22,86 11,65 100 2008 {YP64} 68,47 20,09 11,44 100 2009 {ZP68} 64,48 22,62 12,90 100 2010 {BAP57} 65,21 22,55 12,23 100 2011 {BBP69} 65,58 21,82 12,60 100 2012 {BCP55} 66,28 21,82 11,91 100 2013 {BDP72} 63,07 24,73 12,20 100

SOEP Survey Papers 284 59 v30
Abgeltung von Überstunden (Westdeutschland), in % Compensation of overtime hours (West Germany), in %
Population: Alle abhängig erwerbstätigen Befragungspersonen im Alter ab 17 Jahren / All dependently employed persons (age 17 and older)
Westdeutschland / West Germany
Jahr / Year Freizeit-Ausgleich
(„Abfeiern“) /
Free time
Teils-Teils /
Both
Bezahlung /
Payment
Keine Abgeltung /
No compensation
Total
1984 {AP32} 28,19 11,08 35,84 24,89 100 1985 {BP42} 27,06 11,55 33,80 27,58 100 1986 {CP50} 30,66 11,95 36,67 20,72 100 1988 {EP42} 32,72 12,63 34,85 19,80 100 1989 {FP44} 31,48 14,82 35,48 18,22 100 1990 {GP42} 33,03 14,70 35,30 16,97 100 1991 {HP53} 32,15 14,87 36,79 16,19 100 1992 {IP53} 34,35 16,77 33,94 14,94 100 1993 {JP53} 33,72 16,28 33,23 16,76 100 1994 {KP63} 37,09 16,90 30,02 15,99 100 1995 {LP52} 36,75 17,37 29,47 16,41 100 1996 {MP46} 41,52 16,77 26,07 15,64 100 1997 {NP5201} 43,32 20,36 17,49 18,82 100 1998 {OP4301} 44,43 20,11 17,29 18,16 100 1999 {PP5801} 45,65 20,14 16,04 18,17 100 2000 {QP5401} 47,05 20,20 16,31 16,44 100 2001 {RP5501} 45,28 21,67 16,55 16,50 100 2002 {SP56} 47,46 20,39 14,05 18,10 100 2003 {TP74} 49,84 19,34 13,47 17,34 100 2004 {UP57} 49,11 18,26 12,93 19,70 100 2005 {VP69} 50,25 20,26 10,90 18,59 100 2006 {WP57} 49,53 18,12 12,31 20,03 100 2007 {XP71} 48,88 20,46 10,61 20,05 100 2008 {YP66} 48,55 20,51 11,05 19,89 100 2009 {ZP70} 47,59 21,15 11,35 19,91 100 2010 {BAP59} 51,97 18,68 10,38 18,98 100 2011 {BBP71} 48,74 19,96 12,28 19,02 100 2012 {BCP57} 49,98 21,16 12,12 16,74 100 2013 {BDP74} 50,03 21,57 11,72 16,69 100

SOEP Survey Papers 284 60 v30
Abgeltung von Überstunden (Ostdeutschland), in %
Compensation of overtime hours (East Germany), in % Population: Alle abhängig erwerbstätigen Befragungspersonen im Alter ab 17 Jahren /
All dependently employed persons (age 17 and older) Ostdeutschland / East Germany
Jahr / Year Freizeit-Ausgleich
(„Abfeiern“) /
Free time
Teils-Teils /
Both
Bezahlung /
Payment
Keine Abgeltung /
No compensation
Total
1991{HP53} 45,93 12,88 26,29 14,90 100 1992{IP53} 37,88 16,69 27,54 17,88 100 1993{JP53} 37,66 17,36 26,41 18,58 100 1994{KP63} 37,27 18,42 25,12 19,18 100 1995{LP52} 39,25 19,47 23,70 17,57 100 1996{MP46} 40,84 17,02 23,26 18,89 100 1997{NP5201} 42,06 21,93 15,33 20,67 100 1998{OP4301} 43,82 23,99 14,26 17,93 100 1999{PP5801} 44,80 24,79 12,83 17,59 100 2000{QP5401} 48,32 22,32 13,22 16,14 100 2001{RP5501} 48,17 23,08 14,05 14,70 100 2002{SP56} 51,10 21,92 11,08 15,90 100 2003{TP74} 55,34 19,77 10,94 13,95 100 2004{UP57} 52,42 22,18 9,86 15,55 100 2005{VP69} 53,37 20,45 11,93 14,25 100 2006{WP57} 50,38 22,06 10,48 17,08 100 2007{XP71} 52,19 24,15 8,08 15,58 100 2008 {YP66} 51,71 24,54 8,83 14,92 100 2009 {ZP70} 54,47 24,76 7,13 13,64 100 2010 {BAP59} 55,26 21,08 7,55 16,11 100 2011 {BBP71} 53,67 19,03 9,86 17,44 100 2012 {BCP57} 56,57 21,47 7,87 14,09 100 2013 {BDP74} 54,66 20,41 9,54 15,39 100

SOEP Survey Papers 284 61 v30
Vergleich von geleisteter und gewünschter Arbeitszeit (Westdeutschland), in %
Comparison of actual and desired working hours (West Germany), in % Population: Alle erwerbstätigen Befragungspersonen ab 17 Jahren /
All employed persons (age 17 and older) Westdeutschland / West Germany
Jahr / Year möchte weniger arbeiten /
Desires less work
gleichviel / Desires same
amount
möchte mehr arbeiten /
Desires more work
Total
1985 {BP36}{BP41} 54,85 31,89 13,26 100 1986 {CP41}{CP48} 57,92 29,70 12,38 100 1987 {DP47}{DP40} 54,11 34,87 11,02 100 1988 {EP47}{EP40} 56,17 30,21 13,63 100 1989 {FP46}{FP41} 59,14 30,29 10,57 100 1990 {GP61}{GP39} 65,01 20,68 14,31 100 1991 {HP55}{HP50} 65,92 22,05 12,03 100 1992 {IP55}{IP50} 65,20 21,76 13,04 100 1993 {JP55}{JP50} 63,01 22,78 14,21 100 1994 {KP66}{KP60} 61,09 21,51 17,39 100 1995 {LP65}{LP49} 61,52 19,51 18,98 100 1996 {19}{MP43} - - - - 1997 {NP49}{NP47} 57,81 24,42 17,77 100 1998 {OP38}{OP40} 61,84 20,60 17,56 100 1999 {PP54}{PP52} 57,75 26,24 16,01 100 2000{QP52}{QP50} 54,37 32,08 13,55 100 2001 {RP53}{RP50} 53,00 33,29 13,71 100 2002 {SP53}{SP52} 52,17 32,77 15,06 100 2003 {TP71}{TP7003} 51,03 32,84 16,13 100 2004 {UP54}{UP50} 51,24 30,74 18,02 100 2005 {VP66}{VP62} 50,07 31,00 18,93 100 2006 {WP46}{WP51} 56,88 24,50 18,62 100 2007 {XP68}{XP64} 52,81 29,10 18,09 100 2008 {YP55}{YP60} 56,77 22,81 20,42 100 2009 {ZP67}{ZP62} 54,14 25,47 20,39 100 2010 {BAP56}{BAP51} 52,46 28,24 19,30 100 2011 {BBP68}{BBP64} 54,37 28,68 16,95 100 2012 {BCP51}{BCP46} 55,16 27,47 17,37 100 2013 {BDP66}{BDP62} 58,32 24,21 17,46 100
19 Gewünschte Arbeitszeit wurde 1996 nicht erhoben.

SOEP Survey Papers 284 62 v30
Vergleich von geleisteter und gewünschter Arbeitszeit (Ostdeutschland), in %
Comparison of actual and desired working hours (East Germany), in % Population: Alle erwerbstätigen Befragungspersonen ab 17 Jahren / All employed persons
(age 17 and older) Ostdeutschland / East Germany
Jahr / Year möchte weniger arbeiten /
Desires less work
gleichviel / Desires same
amount
möchte mehr arbeiten /
Desires more work
Total
1991 {HP55}{HP50} 44,38 29,33 26,30 100 1992 {IP55}{IP50} - - - - 1993 {JP55}{JP50} 64,93 25,56 9,51 100 1994 {KP66}{KP60} 64,01 23,89 12,09 100 1995 {LP65}{LP49} 65,45 18,92 15,63 100 1996 {20}{MP43} - - - - 1997 {NP49}{NP47} 63,71 22,12 14,17 100 1998 {OP38}{OP40} 67,93 17,59 14,48 100 1999 {PP54}{PP52} 61,28 23,65 15,07 100 2000 {QP52}{QP50} 60,28 26,29 13,42 100 2001 {RP53}{RP50} 59,12 25,17 15,71 100 2002 {SP53}{SP52} 58,05 26,65 15,31 100 2003 {TP71}{TP7003} 56,44 27,03 16,53 100 2004 {UP54}{UP50} 56,60 23,63 19,77 100 2005 {VP66}{VP62} 55,84 26,72 17,44 100 2006 {WP46}{WP51} 58,82 20,54 20,64 100 2007 {XP68}{XP64} 55,32 24,62 20,05 100 2008 {YP55}{YP60} 55,96 23,98 20,06 100 2009 {ZP67}{ZP62} 56,84 26,15 17,01 100 2010 {BAP56}{BAP51} 55,80 26,99 17,21 100 2011 {BBP68}{BBP64} 60,89 24,21 14,90 100 2012 {BCP51}{BCP46} 58,27 26,29 15,44 100 2013 {BDP66}{BDP62} 59,25 23,51 17,24 100
20 Gewünschte Arbeitszeit wurde 1996 nicht erhoben.

SOEP Survey Papers 284 63 v30
IV. Gesundheit / Health
Zufriedenheit mit der Gesundheit (Mittelwert auf einer Skala von 0 bis 10)21 /
Satisfaction with health (mean on a scale from 0 to 10) Population: Alle Befragungspersonen ab 17 Jahren / All persons (age 17 and older) Jahr / Year Westdeutschland /
West Germany Ostdeutschland /
East Germany Total
1984 {AP0301} 6,81 - 6,81 1985 {BP0101} 6,76 - 6,76 1986 {CP0101} 6,71 - 6,71 1987 {DP0101} 6,66 - 6,66 1988 {EP0101} 6,56 - 6,56 1989 {FP0101} 6,53 - 6,53 1990 {GP0101} 6,57 - 6,57 1991 {HP1001} 6,56 6,53 6,55 1992 {IP9801} 6,66 6,50 6,63 1993 {JP0101} 6,52 6,40 6,50 1994 {KP0101} 6,44 6,23 6,40 1995 {LP0101} 6,49 6,28 6,45 1996 {MP0101} 6,47 6,28 6,43 1997 {NP0101} 6,48 6,18 6,43 1998 {OP0101} 6,60 6,27 6,54 1999 {PP0101} 6,55 6,22 6,49 2000 {QP0101} 6,76 6,37 6,69 2001 {RP0101} 6,77 6,36 6,69 2002 {SP0101} 6,66 6,30 6,59 2003 {TP0101} 6,66 6,27 6,59 2004 {UP0101} 6,53 6,08 6,44 2005 {VP0101} 6,55 6,23 6,49 2006 {WP0101} 6,57 6,20 6,50 2007 {XP0101} 6,54 6,24 6,48 2008 {YP0101} 6,51 6,27 6,46 2009 {ZP0101} 6,48 6,18 6,42 2010 {BAP0101} 6,51 6,17 6,44 2011 {BBP0101} 6,56 6,22 6,49 2012 {BCP0101} 6,69 6,25 6,60 2013 {BDP0101} 6,70 6,28 6,62
21 Zufriedenheit wird im SOEP gemessen auf einer Skala von 0 („ganz und gar unzufrieden“) bis 10
(„ganz und gar zufrieden“).

SOEP Survey Papers 284 64 v30
Gesundheitszustand gegenwärtig (Selbsteinschätzung) (Westdeutschland), in %
Current health status (self-evaluation) (West Germany), in % Population: Alle Befragungspersonen ab 17 Jahren / All persons (age 17 and older)
Westdeutschland / West Germany
Jahr / Year Sehr Gut / Very good
Gut / Good
Zufriedenstellend / Satisfactory
Weniger gut / Poor
Schlecht / Bad
Total
1992 {IP77} 13,58 37,99 30,69 12,83 4,90 100 1993 - - - - - - 1994 {KP83} 8,93 37,55 32,88 15,91 4,72 100 1995 {LP89} 8,44 38,35 33,27 15,62 4,33 100 1996 {MP75} 8,99 37,30 34,29 15,01 4,42 100 1997 {NP79} 8,84 37,81 34,22 14,77 4,36 100 1998 {OP66} 10,37 39,56 31,56 14,09 4,42 100 1999 {PP95} 9,61 38,58 32,83 14,56 4,42 100 2000 {QP95} 11,58 37,96 33,34 13,11 4,02 100 2001 {RP95} 11,77 37,74 32,92 13,61 3,96 100 2002 {SP86} 9,63 37,93 34,35 13,93 4,17 100 2003 {TP98} 9,67 39,25 32,78 14,21 4,09 100 2004 {UP83} 10,36 37,72 32,02 15,22 4,69 100 2005 {VP104} 9,29 37,34 33,61 15,30 4,46 100 2006 {WP87} 9,38 37,63 34,05 14,28 4,66 100 2007 {XP98} 8,42 37,75 34,49 15,18 4,16 100 2008 {YP99} 9,01 37,80 34,16 14,90 4,13 100 2009 {ZP95} 8,63 37,12 35,95 14,39 3,92 100 2010 {BAP87} 8,98 37,35 34,21 15,18 4,29 100 2011 {BBP97} 10,64 38,68 31,68 14,84 4,17 100 2012 {BCP91} 10,67 39,10 32,79 13,86 3,59 100 2013 {BDP110} 11,30 37,59 32,32 14,73 4,06 100

SOEP Survey Papers 284 65 v30
Gesundheitszustand gegenwärtig (Selbsteinschätzung) (Ostdeutschland), in %
Current health status (self-evaluation) (East Germany), in % Population: Alle Befragungspersonen ab 17 Jahren / All persons (age 17 and older)
Ostdeutschland / East Germany
Jahr / Year Sehr Gut /
Very good
Gut /
Good
Zufriedenstellend /
Satisfactory
Weniger gut /
Poor
Schlecht /
Bad
Total
1992 {IP77} 14,36 41,77 29,71 10,29 3,87 100 1993 - - - - - - 1994 {KP83} 7,99 37,96 37,06 12,98 4,02 100 1995 {LP89} 6,58 38,41 36,68 13,88 4,45 100 1996 {MP75} 5,62 38,06 39,25 13,35 3,72 100 1997 {NP79} 6,56 38,60 37,80 12,61 4,43 100 1998 {OP66} 7,68 39,70 36,10 12,24 4,28 100 1999 {PP95} 6,12 39,12 37,00 13,23 4,54 100 2000 {QP95} 8,14 37,79 35,96 13,74 4,37 100 2001 {RP95} 6,93 37,68 36,37 14,43 4,58 100 2002 {SP86} 7,43 37,65 35,97 14,85 4,10 100 2003 {TP98} 6,77 38,65 35,32 14,05 5,21 100 2004 {UP83} 6,64 37,78 34,79 15,96 4,83 100 2005 {VP104} 6,92 37,87 33,87 16,38 4,95 100 2006 {WP87} 7,76 37,07 33,76 15,61 5,80 100 2007 {XP98} 7,20 39,06 33,52 15,26 4,97 100 2008 {YP99} 7,89 38,61 33,42 15,75 4,33 100 2009 {ZP95} 6,37 38,20 34,93 15,92 4,58 100 2010 {BAP87} 7,27 38,68 33,63 15,93 4,50 100 2011 {BBP97} 8,51 35,59 36,55 15,12 4,23 100 2012 {BCP91} 7,19 37,93 35,81 14,75 4,31 100 2013 {BDP110} 7,79 36,06 36,21 14,94 5,00 100

SOEP Survey Papers 284 66 v30
Zahl der Arztbesuche in den letzten drei Monaten, Mittelwert / Number of doctor consultations in the last three months, mean
Population: Alle Befragungspersonen ab 17 Jahren / All persons (age 17 and older) Jahr / Year Westdeutschland /
West Germany Ostdeutschland /
East Germany Total
1984 - - - 1985 - - - 1986 - - - 1987 - - - 1988 {EP6801} 3,28 - 3,28 1989 {FP8401} 3,32 - 3,32 1990 - - - 1991 {HP7901} 3,34 2,09 3,09 1992 {IP7901} 3,26 2,33 3,07 1993 - - - 1994 - - - 1995 {LP9201} 3,34 2,85 3,24 1996 {MP7801} 3,23 2,78 3,14 1997 {NP8201} 3,06 2,77 3,00 1998 {OP7101} 2,88 2,57 2,82 1999 {PP9801} 2,92 2,68 2,87 2000 {QP9801} 2,77 2,54 2,73 2001 {RP9801} 2,85 2,65 2,81 2002 {SP9601} 2,72 2,53 2,68 2003 {TP10001} 2,74 2,71 2,73 2004 {UP9301} 2,53 2,42 2,51 2005 {VP10601} 2,70 2,56 2,67 2006 {WP9701} 2,60 2,34 2,54 2007 {XP10001} 2,71 2,49 2,66 2008 {YP11001} 2,60 2,29 2,54 2009 {ZP9701} 2,65 2,50 2,62 2010 {BAP9901} 2,47 2,29 2,43 2011 {BBP10201} 2,51 2,31 2,47 2012 {BCP10501} 2,45 2,33 2,43 2013 {BDP11601} 2,60 2,33 2,54

SOEP Survey Papers 284 67 v30
Zahl der Krankenhausaufenthalte (mind. eine Nacht) im letzten Jahr, Mittelwert /
Number of stays in the hospital (at least one night) in the last year, mean Population: Alle Befragungspersonen ab 17 Jahren / All persons (age 17 and older) Jahr / Year Westdeutschland /
West Germany Ostdeutschland /
East Germany Total
1984 {AP5103} 1,35 - 1,35 1985 {BP7203} 1,45 - 1,45 1986 {CP7203} 1,59 - 1,59 1987 {DP7203} 1,54 - 1,54 1988 {EP6903} 1,59 - 1,59 1989 {FP8503} 1,59 - 1,59 1990 - - - 1991 {HP8003} 1,59 - 1,59 1992 {IP8003} 1,46 1,58 1,48 1993 - - - 1994 {KP8703} 1,48 1,44 1,48 1995 {LP9303} 1,51 1,52 1,51 1996 {MP7903} 1,58 1,81 1,62 1997 {NP8303} 1,54 1,80 1,59 1998 {OP7203} 1,56 1,38 1,52 1999 {PP10102} 1,53 1,50 1,52 2000 {QP10002} 1,62 1,61 1,62 2001 {RP10002} 1,39 1,35 1,38 2002 {SP9901} 1,34 1,49 1,37 2003 {TP10201} 1,43 1,41 1,43 2004 {UP9502} 1,41 1,48 1,43 2005 {VP10802} 1,40 1,49 1,42 2006 {WP9902} 1,35 1,62 1,41 2007 {XP10202} 1,47 1,37 1,45 2008 {YP11202} 1,42 1,35 1,41 2009 {ZP9901} 1,48 1,40 1,46 2010 {BAP10102} 1,44 1,39 1,43 2011 {BBP10401} 1,43 1,38 1,42 2012 {BCP10702} 1,44 1,41 1,43 2013 {BDP11601} 1,39 1,50 1,41

SOEP Survey Papers 284 68 v30
Anteil der Personen mit Wechsel der Krankenkasse im letzten Jahr (Mittelwert) /
Share of persons with change of health insurance in the last year (mean) Population: Alle Befragungspersonen ab 17 Jahren / All persons (age 17 and older) Jahr / Year Westdeutschland /
West Germany Ostdeutschland /
East Germany Total
1999 {PP94} 4,25 5,97 4,57 2000 {QP94} 5,47 6,55 5,67 2001 {RP94} 5,56 6,87 5,81 2002 {SP10403} 4,29 3,95 4,22 2003 {TP10703} 5,02 6,04 5,22 2004 {UP101} 5,35 6,89 5,66 2005 {VP114} 5,05 6,07 5,25 2006 {WP103} 4,19 4,49 4,25 2007 {XP108} 4,94 5,58 5,08 2008 {YP116} 4,58 5,61 4,80 2009 {ZP106} 4,25 3,60 4,12 2010 {BAP106} 3,70 3,55 3,67 2011 {BBP1086} 4,76 5,38 4,89 2012 {BCP111} 4,01 3,93 3,99 2013 {BDP122} 2,31 2,48 2,35

SOEP Survey Papers 284 69 v30
Veränderung des Gesundheitszustandes gegenüber dem Vorjahr, in % /
Change in health status compared to previous year, in % Population: Alle Befragungspersonen ab 17 Jahren, Längsschnitt / All persons (age 17 and older), longitudinal
Westdeutschland / West Germany Ostdeutschland / East Germany
Jahr / Year Gesundheit stabil / Stable
Gesundheit verbessert / Improve-
ment
Gesundheit verschlechtert / Worsening
Gesundheit stabil / Stable
Gesundheit verbessert / Improve-
ment
Gesundheit verschlechtert / Worsening
1994/95 {KP83}{LP89} 65,83 16,31 17,21 66,09 15,74 17,91 1995/96 {LP89}{MP75} 66,60 15,54 17,03 65,92 15,89 17,72 1996/97 {MP75}{NP79} 66,45 16,09 16,77 66,63 16,22 17,00 1997/98 {NP79}{OP66} 66,89 15,82 16,73 66,57 16,04 17,11 1998/99 {OP66}{PP95} 68,04 14,04 17,19 67,74 13,50 18,34 1999/2000 {PP95}{QP95} 67,31 14,69 17,43 66,89 15,69 17,37 2000/01 {QP95}{RP95} 66,96 15,29 17,35 67,43 14,57 17,78 2001/02 {RP95}{SP86} 66,71 14,68 18,16 67,17 15,22 17,32 2002/03 {SP86}{TP98} 67,05 16,03 16,50 69,36 14,94 15,38 2003/04 {TP98}{UP83} 66,69 14,71 18,16 68,58 13,56 17,02 2004/05 {UP83}{VP104} 67,01 14,27 18,07 68,14 13,19 17,34 2005/06 {VP104}{WP87} 65,99 15,81 17,49 66,37 15,23 16,68 2006/07 {WP87}{XP98} 65,51 15,70 17,43 66,46 15,96 15,42 2007/08 {XP98}{YP99} 66,25 15,62 16,14 69,08 12,88 15,91 2008/09 {YP99}{ZP95} 65,15 15,32 17,47 66,09 14,93 17,98 2009/10 {ZP95}{BAP87} 66,51 14,91 16,81 66,98 15,94 16,14 2010/11 {BAP87}{BBP97} 66,54 15,06 17,01 66,43 14,45 18,46 2011/12 {BBP97}{BCP91} 65,80 15,57 16,80 67,60 15,80 15,98 2012/13 {BCP91}{BDP110} 65,78 14,56 18,02 67,23 14,07 17,97

SOEP Survey Papers 284 70 v30
V. Einkommen, Armut, Ungleichheit, Mobilität / Income, poverty,
inequality, mobility
Aktuelles monatl. Bruttoerwerbseinkommen, Mittelwert in Euro / Monthly gross income, mean in Euro
Population: Alle Personen in privaten Haushalten / All persons in private households Jahr / Year Westdeutschland /
West Germany Ostdeutschland /
East Germany Total
1984 {LABGRO84} 2 148 - 2 148 1985 {LABGRO85} 2 122 - 2 122 1986 {LABGRO86} 2 215 - 2 215 1987 {LABGRO87} 2 234 - 2 234 1988 {LABGRO88} 2 319 - 2 319 1989 {LABGRO89} 2 352 - 2 352 1990 {LABGRO90} 2 366 589 1 943 1991 {LABGRO91} 2 368 1 309 2 139 1992 {LABGRO92} 2 463 1 542 2 282 1993 {LABGRO93} 2 540 1 696 2 381 1994 {LABGRO94} 2 550 1 819 2 411 1995 {LABGRO95} 2 555 1 910 2 432 1996 {LABGRO96} 2 658 1 921 2 524 1997 {LABGRO97} 2 601 1 945 2 483 1998 {LABGRO98} 2 629 1 905 2 499 1999 {LABGRO99} 2 642 1 933 2 518 2000 {LABGRO00} 2 627 1 961 2 511 2001 {LABGRO01} 2 591 1 965 2 483 2002 {LABGRO02} 2 656 1 986 2 543 2003 {LABGRO03} 2 703 2 059 2 597 2004 {LABGRO04} 2 655 1 991 2 545 2005 {LABGRO05} 2 579 1 979 2 482 2006 {LABGRO06} 2 601 1 947 2 482 2007 {LABGRO07} 2 559 1 882 2 433 2008 {LABGRO08} 2 517 1 902 2 405 2009 {LABGRO09} 2 550 1 970 2 444 2010 {LABGRO10} 2 561 2 000 2 457 2011 {LABGRO11} 2 527 1 946 2 415 2012 {LABGRO12} 2 497 2 036 2 410 2013 {LABGRO13} 2 473 1 977 2 378

SOEP Survey Papers 284 71 v30
Decile Ratio auf Basis des gesamtdeutschen Bruttomonatseinkommens /
Decile Ratio based on monthly gross household income Population: Alle Personen in privaten Haushalten / All persons in private households Jahr / Year Deutschland /Germany
90:10 90:50 50:10 1984 {LABGRO84} 6,73 1,80 3,74 1985 {LABGRO85} 6,96 1,81 3,85 1986 {LABGRO86} 6,97 1,85 3,78 1987 {LABGRO87} 6,93 1,83 3,79 1988 {LABGRO88} 6,85 1,78 3,84 1989 {LABGRO89} 6,43 1,77 3,64 1990 {LABGRO90} 8,50 2,00 4,25 1991 {LABGRO91} 5,89 1,94 3,03 1992 {LABGRO92} 5,70 1,84 3,10 1993 {LABGRO93} 5,65 1,85 3,05 1994 {LABGRO94} 5,36 1,81 2,96 1995 {LABGRO95} 5,91 1,86 3,19 1996 {LABGRO96} 5,82 1,91 3,06 1997 {LABGRO97} 5,86 1,88 3,11 1998 {LABGRO98} 6,49 1,89 3,44 1999 {LABGRO99} 7,36 1,94 3,80 2000 {LABGRO00} 7,60 1,95 3,90 2001 {LABGRO01} 8,72 1,92 4,53 2002 {LABGRO02} 8,70 1,96 4,44 2003 {LABGRO03} 9,53 1,95 4,88 2004 {LABGRO04} 10,07 2,00 5,04 2005 {LABGRO05} 10,25 1,97 5,21 2006 {LABGRO06} 10,50 2,04 5,14 2007 {LABGRO07} 10,74 2,05 5,25 2008 {LABGRO08} 10,69 2,04 5,25 2009 {LABGRO09} 11,00 2,05 5,38 2010 {LABGRO10} 11,00 2,05 5,38 2011 {LABGRO11} 10,01 2,05 4,89 2012 {LABGRO12} 11,50 2,09 5,50 2013 {LABGRO13} 10,81 2,13 5,08

SOEP Survey Papers 284 72 v30
Äquivalenzgewichtetes Monats-Nettoeinkommen, Mittelwert in Euro /
Equivalent monthly net income, mean in Euro Population: Alle Personen in privaten Haushalten / All persons in private households Jahr / Year Westdeutschland /
West Germany Ostdeutschland /
East Germany Total
1984 {AH46} 1 238 - 1 238 1985 {BH39} 1 237 - 1 237 1986 {CH51} 1 313 - 1 313 1987 {DH51} 1 352 - 1 352 1988 {EH42} 1 377 - 1 377 1989 {FH42} 1 399 - 1 399 1990 {GH42} 1 453 - 1 453 1991 {HH48} 1 451 941 1 341 1992 {IH49} 1 455 1 012 1 363 1993 {JH49} 1 490 1 075 1 404 1994 {KH49} 1 476 1 137 1 407 1995 {I1HINC95} 1 496 1 187 1 437 1996 {I1HINC96} 1 506 1 217 1 451 1997 {I1HINC97} 1 467 1 208 1 418 1998 {I1HINC98} 1 476 1 221 1 427 1999 {I1HINC99} 1 520 1 258 1 472 2000 {I1HINC00} 1 569 1 268 1 512 2001 {I1HINC01} 1 544 1 291 1 498 2002 {I1HINC02} 1 529 1 275 1 483 2003 {I1HINC03} 1 576 1 295 1 525 2004 {I1HINC04} 1 555 1 267 1 504 2005 {I1HINC05} 1 540 1 248 1 488 2006 {I1HINC06} 1 551 1 248 1 492 2007 {I1HINC07} 1 549 1 244 1 489 2008 {I1HINC08} 1 539 1 231 1 480 2009 {I1HINC09} 1 584 1 274 1 524 2010 {I1HINC10} 1 613 1 310 1 556 2011 {I1HINC11} 1 618 1 332 1 561 2012 {I1HINC12} 1 622 1 341 1 567 2013 {I1HINC13} 1 628 1 347 1 574

SOEP Survey Papers 284 73 v30
Aktuelles Bruttoerwerbseinkommen im laufenden Monat, Mittelwert in Euro /
Current monthly gross income, mean in Euro Population: Alle aktuell erwerbstätigen Personen in privaten Haushalten /
All currently employed persons in private households Jahr / Year Westdeutschland
West Germany Ostdeutschland East Germany
Vollzeit / Full time
Teilzeit / Part time
Total Vollzeit / Full time
Teilzeit / Part time
Total
1984 {LABGRO84} 2525 934 2250 - - - 1985 {LABGRO85} 2471 893 2189 - - - 1986 {LABGRO86} 2579 1024 2313 - - - 1987 {LABGRO87} 2632 958 2342 - - - 1988 {LABGRO88} 2716 1047 2426 - - - 1989 {LABGRO89} 2758 1009 2455 - - - 1990 {LABGRO90} 2783 1015 2463 - - - 1991 {LABGRO91} 2808 1045 2466 1398 719 1336 1992 {LABGRO92} 2893 1119 2556 1645 998 1596 1993 {LABGRO93} 2997 1089 2632 1835 1059 1772 1994 {LABGRO94} 2991 1109 2629 1991 1104 1908 1995 {LABGRO95} 3028 1101 2640 2107 1134 1996 1996 {LABGRO96} 3160 1210 2738 2126 1162 2009 1997 {LABGRO97} 3097 1140 2683 2147 1216 2029 1998 {LABGRO98} 3140 1182 2720 2126 1151 1999 1999 {LABGRO99} 3213 1141 2736 2157 1258 2025 2000 {LABGRO00} 3214 1155 2708 2241 1141 2057 2001 {LABGRO01} 3214 1113 2684 2259 1160 2066 2002 {LABGRO02} 3334 1119 2757 2303 1207 2101 2003 {LABGRO03} 3410 1188 2815 2422 1183 2164 2004 {LABGRO04} 3353 1141 2755 2407 1162 2105 2005 {LABGRO05} 3294 1140 2679 2330 1211 2077 2006 {LABGRO06} 3322 1097 2685 2329 1129 2030 2007 {LABGRO07} 3294 1111 2642 2267 1072 1969 2008 {LABGRO08} 3259 1051 2597 2247 1057 1960 2009 {LABGRO09} 3278 1136 2633 2383 1042 2046 2010 {LABGRO10} 3332 1100 2644 2427 1060 2075 2011 {LABGRO11} 3212 1109 2600 2314 1061 2012 2012 {LABGRO12} 3213 1094 2574 2437 1088 2098 2013 {LABGRO13} 3231 1106 2556 2394 1117 2030

SOEP Survey Papers 284 74 v30
Aktuelles Nettoerwerbseinkommen im laufenden Monat, Mittelwert in Euro / Current monthly net income, mean in Euro
Population: Alle aktuell erwerbstätigen Personen in privaten Haushalten / All currently employed persons in private households
Jahr / Year Westdeutschland / West Germany
Ostdeutschland / East Germany
Vollzeit / Full time
Teilzeit / Part time
Total Vollzeit / Full time
Teilzeit / Part time
Total
1984 {LABNET84} 1 702 630 1 517 - - - 1985 {LABNET85} 1 670 590 1 477 - - - 1986 {LABNET86} 1 730 693 1 552 - - - 1987 {LABNET87} 1 768 636 1 571 - - - 1988 {LABNET88} 1 809 670 1 611 - - - 1989 {LABNET89} 1 838 663 1 634 - - - 1990 {LABNET90} 1 896 681 1 676 - - - 1991 {LABNET91} 1 920 690 1 681 1 037 547 993 1992 {LABNET92} 1 925 731 1 698 1 177 731 1 144 1993 {LABNET93} 2 009 713 1 761 1 295 750 1 250 1994 {LABNET94} 1 982 736 1 742 1 370 764 1 313 1995 {LABNET95} 1 997 712 1 738 1 422 780 1 349 1996 {LABNET96} 2 019 772 1 749 1 417 792 1 341 1997 {LABNET97} 1 988 723 1 720 1 410 796 1 333 1998 {LABNET98} 1 995 737 1 725 1 383 781 1 305 1999 {LABNET99} 2 020 722 1 721 1 399 803 1 311 2000 {LABNET00} 2 027 730 1 709 1 454 760 1 337 2001 {LABNET01} 2 037 715 1 703 1 494 769 1 367 2002 {LABNET02} 2 101 699 1 736 1 499 792 1 369 2003 {LABNET03} 2 098 737 1 733 1 542 772 1 381 2004 {LABNET04} 2 088 730 1 721 1 541 730 1 345 2005 {LABNET05} 2 086 751 1 704 1 507 778 1 342 2006 {LABNET06} 2 099 707 1 700 1 522 747 1 329 2007 {LABNET07} 2 068 712 1 663 1 487 696 1 290 2008 {LABNET08} 2 046 674 1 635 1 472 683 1 282 2009 {LABNET09} 2 066 725 1 662 1 553 711 1 341 2010 {LABNET10} 2 116 724 1 687 1 600 715 1 371 2011 {LABNET11} 2 070 745 1 684 1 533 730 1 340 2012 {LABNET12} 2 070 751 1 672 1 622 756 1 404 2013 {LABNET13} 2 085 764 1 665 1 592 771 1 359

SOEP Survey Papers 284 75 v30
60% des Median der gesamtdt. Nettomonatseinkommens (Armutsschwelle), in Euro /
60% of the median of the monthly net household income (Poverty line), in Euro Population: Alle Personen in privaten Haushalten / All persons in private households
Jahr / Year Deutschland / Germany 1984 {AH46} 658 1985 {BH39} 678 1986 {CH51} 713 1987 {DH51} 731 1988 {EH42} 751 1989 {FH42} 760 1990 {GH42} 792 1991 {HH48} 714 1992 {IH49} 741 1993 {JH49} 765 1994 {KH49} 775 1995 {I1HINC95} 762 1996 {I1HINC96} 783 1997 {I1HINC97} 761 1998 {I1HINC98} 775 1999 {I1HINC99} 800 2000 {I1HINC00} 816 2001 {I1HINC01} 816 2002 {I1HINC02} 809 2003 {I1HINC03} 804 2004 {I1HINC04} 791 2005 {I1HINC05} 793 2006 {I1HINC06} 783 2007 {I1HINC07} 780 2008 {I1HINC08} 782 2009 {I1HINC09} 809 2010 {I1HINC10} 825 2011 {I1HINC11} 823 2012 {I1HINC12} 823 2013 {I1HINC13} 833

SOEP Survey Papers 284 76 v30
Decile Ratio auf Basis des gesamtdeutschen Netto-Monatseinkommens /
Decile Ratio based on monthly net household income Population: Alle Personen in privaten Haushalten / All persons in private households
Jahr / Year Deutschland /Germany 90:10 90:50 50:10
1984 {AH46} 2,98 1,72 1,73 1985 {BH39} 2,98 1,67 1,79 1986 {CH51} 2,94 1,67 1,76 1987 {DH51} 2,87 1,68 1,71 1988 {EH42} 2,89 1,67 1,73 1989 {FH42} 2,80 1,68 1,67 1990 {GH42} 2,88 1,68 1,71 1991 {HH48} 3,06 1,80 1,70 1992 {IH49} 2,91 1,72 1,69 1993 {JH49} 3,03 1,73 1,75 1994 {KH49} 2,94 1,70 1,73 1995 {I1HINC95} 3,03 1,75 1,73 1996 {I1HINC96} 2,99 1,72 1,73 1997 {I1HINC97} 2,89 1,73 1,67 1998 {I1HINC98} 2,92 1,70 1,71 1999 {I1HINC99} 2,92 1,73 1,69 2000 {I1HINC00} 3,00 1,75 1,71 2001 {I1HINC01} 3,00 1,72 1,74 2002 {I1HINC02} 3,00 1,67 1,79 2003 {I1HINC03} 3,16 1,79 1,77 2004 {I1HINC04} 3,13 1,79 1,75 2005 {I1HINC05} 3,24 1,80 1,80 2006 {I1HINC06} 3,26 1,84 1,77 2007 {I1HINC07} 3,30 1,84 1,80 2008 {I1HINC08} 3,31 1,81 1,82 2009 {I1HINC09} 3,26 1,80 1,81 2010 {I1HINC10} 3,34 1,82 1,83 2011 {I1HINC11} 3,44 1,86 1,85 2012 {I1HINC12} 3,46 1,87 1,85 2013 {I1HINC13} 3,33 1,82 1,83

SOEP Survey Papers 284 77 v30
Äquivalenzgewichtetes Nettoeinkommen des Vorjahres22, Mittelwert in Euro /
Equivalent household net income of previous year, mean in Euro Population: Alle Personen in privaten Haushalten / All persons in private households Jahr / Year Westdeutschland /
West Germany Ostdeutschland /
East Germany Total
1984 {I1110284} 17 289 - 17 289 1985 {I1110285} 17 413 - 17 413 1986 {I1110286} 17 519 - 17 519 1987 {I1110287} 18 410 - 18 410 1988 {I1110288} 19 064 - 19 064 1989 {I1110289} 19 762 - 19 762 1990 {I1110290} 20 136 - 20 136 1991 {I1110291} 21 093 - 21 093 1992 {I1110292} 21 353 15 738 20 216 1993 {I1110293} 21 627 16 382 20 577 1994 {I1110294} 21 677 16 619 20 678 1995 {I1110295} 20 922 16 943 20 160 1996 {I1110296} 21 081 17 006 20 313 1997 {I1110297} 21 185 17 410 20 480 1998 {I1110298} 21 177 17 213 20 430 1999 {I1110299} 21 750 17 806 21 026 2000 {I1110200} 22 256 18 187 21 499 2001 {I1110201} 22 435 18 431 21 702 2002 {I1110202} 22 571 18 288 21 793 2003 {I1110203} 22 727 18 568 21 977 2004 {I1110204} 22 527 18 097 21 737 2005 {I1110205} 22 625 17 956 21 787 2006 {I1110206} 22 938 17 717 21 915 2007 {I1110207} 22 986 17 989 22 014 2008 {I1110208} 23 221 18 051 22 231 2009 {I1110209} 22 957 18 108 22 019 2010 {I1110210} 23 450 18 940 22 596 2011 {I1110211} 23 642 18 893 22 717 2012 {I1110212} 23 419 18 959 22 555 2013 {I1110213} 23 330 19 060 22 510
22 Inkl. Einkommensvorteilen aus selbstgenutztem Wohneigentum („Imputed Rent“, SOEP-Variable I11105$$)

SOEP Survey Papers 284 78 v30
60% des Median des gesamtdeutschen äquivalenzgewichteten (Vor-)
Jahreseinkommens23 (Armutsschwelle), in Euro / 60% of the median of equivalent household annual income (Poverty line), in Euro Population: Alle Personen in privaten Haushalten / All persons in private households
Jahr / Year Deutschland / Germany 1984 {I1110284} 9 446 1985 {I1110285} 9 488 1986 {I1110286} 9 672 1987 {I1110287} 10 113 1988 {I1110288} 10 431 1989 {I1110289} 10 894 1990 {I1110290} 10 924 1991 {I1110291} 11 361 1992 {I1110292} 10 946 1993 {I1110293} 11 167 1994 {I1110294} 11 113 1995 {I1110295} 10 875 1996 {I1110296} 10 905 1997 {I1110297} 11 043 1998 {I1110298} 11 008 1999 {I1110299} 11 196 2000 {I1110200} 11 614 2001 {I1110201} 11 665 2002 {I1110202} 11 505 2003 {I1110203} 11 698 2004 {I1110204} 11 614 2005 {I1110205} 11 557 2006 {I1110206} 11 417 2007 {I1110207} 11 479 2008 {I1110208} 11 627 2009 {I1110209} 11 588 2010 {I1110210} 12 018 2011 {I1110211} 12 027 2012 {I1110212} 11 749 2013 {I1110213} 11 858
23 Inkl. Einkommensvorteilen aus selbstgenutztem Wohneigentum („Imputed Rent“, SOEP-Variable I11105$$)
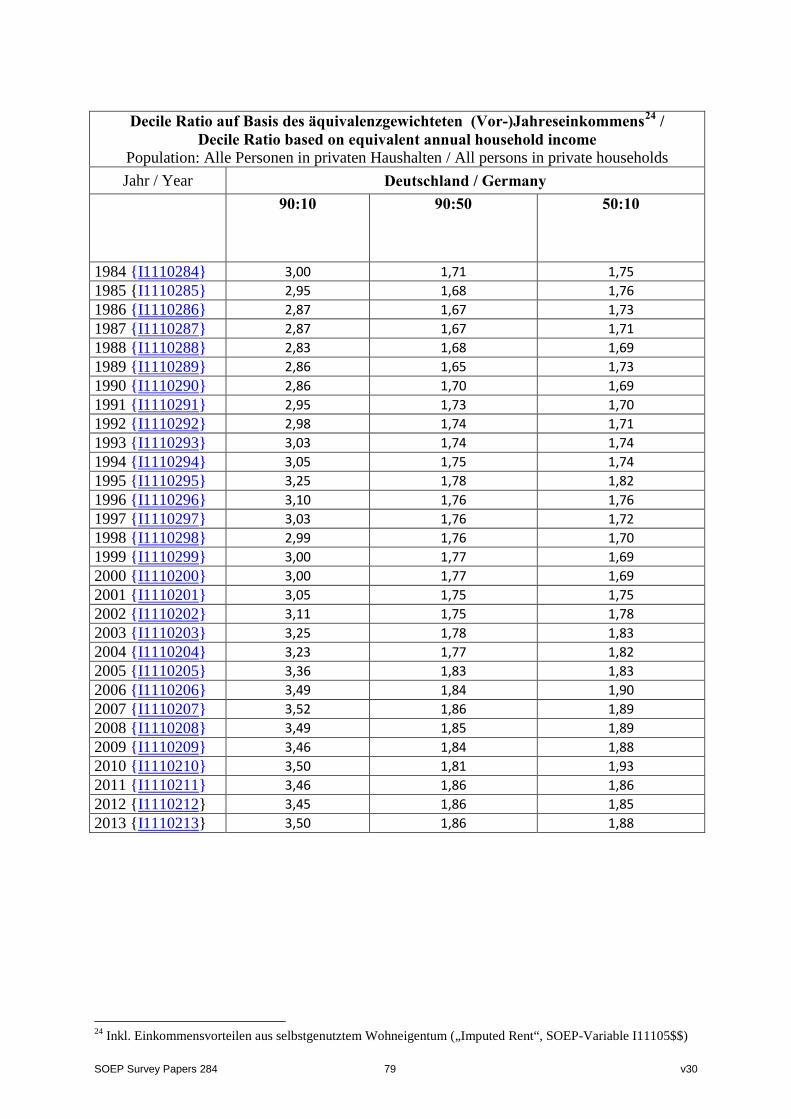
SOEP Survey Papers 284 79 v30
Decile Ratio auf Basis des äquivalenzgewichteten (Vor-)Jahreseinkommens24 /
Decile Ratio based on equivalent annual household income Population: Alle Personen in privaten Haushalten / All persons in private households Jahr / Year Deutschland / Germany
90:10 90:50 50:10
1984 {I1110284} 3,00 1,71 1,75 1985 {I1110285} 2,95 1,68 1,76 1986 {I1110286} 2,87 1,67 1,73 1987 {I1110287} 2,87 1,67 1,71 1988 {I1110288} 2,83 1,68 1,69 1989 {I1110289} 2,86 1,65 1,73 1990 {I1110290} 2,86 1,70 1,69 1991 {I1110291} 2,95 1,73 1,70 1992 {I1110292} 2,98 1,74 1,71 1993 {I1110293} 3,03 1,74 1,74 1994 {I1110294} 3,05 1,75 1,74 1995 {I1110295} 3,25 1,78 1,82 1996 {I1110296} 3,10 1,76 1,76 1997 {I1110297} 3,03 1,76 1,72 1998 {I1110298} 2,99 1,76 1,70 1999 {I1110299} 3,00 1,77 1,69 2000 {I1110200} 3,00 1,77 1,69 2001 {I1110201} 3,05 1,75 1,75 2002 {I1110202} 3,11 1,75 1,78 2003 {I1110203} 3,25 1,78 1,83 2004 {I1110204} 3,23 1,77 1,82 2005 {I1110205} 3,36 1,83 1,83 2006 {I1110206} 3,49 1,84 1,90 2007 {I1110207} 3,52 1,86 1,89 2008 {I1110208} 3,49 1,85 1,89 2009 {I1110209} 3,46 1,84 1,88 2010 {I1110210} 3,50 1,81 1,93 2011 {I1110211} 3,46 1,86 1,86 2012 {I1110212} 3,45 1,86 1,85 2013 {I1110213} 3,50 1,86 1,88
24 Inkl. Einkommensvorteilen aus selbstgenutztem Wohneigentum („Imputed Rent“, SOEP-Variable I11105$$)

SOEP Survey Papers 284 80 v30
Einkommensungleichheit Deutschland-Gesamt - Basis: Monatseinkommen /
Income inequality in Germany - Base: monthly income Population: Alle Personen in privaten Haushalten / All persons in private households
Deutschland / Germany
Jahr Gini MLD Theil 1984 {AH46} 0,262 0,124 0,150 1985 {BH39} 0,249 0,107 0,113 1986 {CH51} 0,255 0,116 0,143 1987 {DH51} 0,249 0,108 0,126 1988 {EH42} 0,250 0,109 0,123 1989 {FH42} 0,246 0,104 0,113 1990 {GH42} 0,246 0,104 0,114 1991 {HH48} 0,249 0,103 0,105 1992 {IH49} 0,243 0,099 0,102 1993 {JH49} 0,251 0,106 0,109 1994 {KH49} 0,247 0,103 0,107 1995 {I1HINC95} 0,256 0,111 0,124 1996 {I1HINC96} 0,249 0,106 0,112 1997 {I1HINC97} 0,241 0,098 0,103 1998 {I1HINC98} 0,240 0,096 0,099 1999 {I1HINC99} 0,240 0,096 0,100 2000 {I1HINC00} 0,245 0,102 0,107 2001 {I1HINC01} 0,245 0,101 0,106 2002 {I1HINC02} 0,253 0,109 0,113 2003 {I1HINC03} 0,264 0,117 0,128 2004 {I1HINC04} 0,265 0,120 0,132 2005 {I1HINC05} 0,264 0,118 0,124 2006 {I1HINC06} 0,272 0,125 0,135 2007 {I1HINC07} 0,272 0,125 0,139 2008 {I1HINC08} 0,271 0,125 0,135 2009 {I1HINC09} 0,268 0,121 0,128 2010 {I1HINC10} 0,273 0,125 0,133 2011 {I1HINC11} 0,277 0,129 0,134 2012 {I1HINC12} 0,273 0,124 0,131 2013 {I1HINC13} 0,273 0,125 0,132

SOEP Survey Papers 284 81 v30
Einkommensungleichheit in Westdeutschland - Basis: Monatseinkommen /
Income inequality in West Germany - Base: monthly income Population: Alle Personen in privaten Haushalten / All persons in private households
Westdeutschland / West Germany
Jahr Gini MLD Theil 1984 {AH46} 0,262 0,124 0,150 1985 {BH39} 0,249 0,107 0,113 1986 {CH51} 0,255 0,116 0,143 1987 {DH51} 0,249 0,108 0,126 1988 {EH42} 0,250 0,109 0,123 1989 {FH42} 0,246 0,104 0,113 1990 {GH42} 0,246 0,104 0,114 1991 {HH48} 0,239 0,096 0,096 1992 {IH49} 0,238 0,096 0,098 1993 {JH49} 0,248 0,105 0,107 1994 {KH49} 0,249 0,105 0,109 1995 {I1HINC95} 0,260 0,116 0,129 1996 {I1HINC96} 0,255 0,111 0,117 1997 {I1HINC97} 0,245 0,100 0,105 1998 {I1HINC98} 0,243 0,098 0,101 1999 {I1HINC99} 0,243 0,099 0,101 2000 {I1HINC00} 0,248 0,104 0,109 2001 {I1HINC01} 0,249 0,104 0,108 2002 {I1HINC02} 0,258 0,114 0,118 2003 {I1HINC03} 0,268 0,121 0,132 2004 {I1HINC04} 0,269 0,124 0,137 2005 {I1HINC05} 0,264 0,117 0,123 2006 {I1HINC06} 0,275 0,127 0,139 2007 {I1HINC07} 0,276 0,128 0,144 2008 {I1HINC08} 0,272 0,126 0,138 2009 {I1HINC09} 0,270 0,122 0,129 2010 {I1HINC10} 0,275 0,126 0,135 2011 {I1HINC11} 0,280 0,132 0,138 2012 {I1HINC12} 0,274 0,125 0,132 2013 {I1HINC13} 0,275 0,127 0,135

SOEP Survey Papers 284 82 v30
Einkommensungleichheit in Ostdeutschland - Basis: Monatseinkommen /
Income inequality in East Germany - Base: monthly income Population: Alle Personen in privaten Haushalten / All persons in private households
Ostdeutschland / East Germany
Jahr / Year Gini MLD Theil 1991 {HH48} 0,193 0,064 0,063 1992 {IH49} 0,191 0,062 0,061 1993 {JH49} 0,205 0,073 0,073 1994 {KH49} 0,202 0,071 0,069 1995 {I1HINC95} 0,205 0,073 0,074 1996 {I1HINC96} 0,194 0,065 0,064 1997 {I1HINC97} 0,203 0,073 0,076 1998 {I1HINC98} 0,204 0,071 0,074 1999 {I1HINC99} 0,203 0,073 0,080 2000 {I1HINC00} 0,208 0,073 0,075 2001 {I1HINC01} 0,208 0,074 0,078 2002 {I1HINC02} 0,209 0,075 0,074 2003 {I1HINC03} 0,224 0,085 0,087 2004 {I1HINC04} 0,226 0,085 0,085 2005 {I1HINC05} 0,244 0,101 0,106 2006 {I1HINC06} 0,239 0,097 0,097 2007 {I1HINC07} 0,234 0,092 0,093 2008 {I1HINC08} 0,240 0,098 0,096 2009 {I1HINC09} 0,239 0,097 0,100 2010 {I1HINC10} 0,246 0,103 0,106 2011 {I1HINC11} 0,244 0,101 0,099 2012 {I1HINC12} 0,250 0,108 0,109 2013 {I1HINC13} 0,248 0,103 0,101

SOEP Survey Papers 284 83 v30
Einkommensungleichheit Deutschland-Gesamt - Basis(Vor-)Jahreseinkommen25 /
Income inequality in Germany - Base: Annual Income Population: Alle Personen in privaten Haushalten / All persons in private households
Deutschland / Germany
Jahr Gini MLD Theil 1984 {I1110284} 0,247 0,108 0,110 1985 {I1110285} 0,252 0,114 0,117 1986 {I1110286} 0,240 0,101 0,101 1987 {I1110287} 0,239 0,100 0,099 1988 {I1110288} 0,236 0,097 0,096 1989 {I1110289} 0,242 0,101 0,103 1990 {I1110290} 0,245 0,104 0,108 1991 {I1110291} 0,248 0,106 0,108 1992 {I1110292} 0,248 0,104 0,106 1993 {I1110293} 0,252 0,108 0,110 1994 {I1110294} 0,253 0,108 0,111 1995 {I1110295} 0,260 0,119 0,118 1996 {I1110296} 0,255 0,113 0,115 1997 {I1110297} 0,250 0,107 0,108 1998 {I1110298} 0,250 0,109 0,110 1999 {I1110299} 0,250 0,107 0,107 2000 {I1110200} 0,249 0,104 0,106 2001 {I1110201} 0,255 0,112 0,115 2002 {I1110202} 0,257 0,114 0,118 2003 {I1110203} 0,268 0,123 0,129 2004 {I1110204} 0,269 0,126 0,137 2005 {I1110205} 0,274 0,129 0,142 2006 {I1110206} 0,288 0,144 0,166 2007 {I1110207} 0,285 0,139 0,153 2008 {I1110208} 0,286 0,140 0,156 2009 {I1110209} 0,283 0,137 0,148 2010 {I1110210} 0,283 0,138 0,150 2011 {I1110211} 0,280 0,135 0,140 2012 {I1110212} 0,286 0,139 0,156 2013 {I1110213} 0,288 0,141 0,158
25 Inkl. Einkommensvorteilen aus selbstgenutztem Wohneigentum („Imputed Rent“, SOEP-Variable I11105$$)

SOEP Survey Papers 284 84 v30
Einkommensungleichheit in Westdeutschland Basis: (Vor-)Jahreseinkommen26 /
Income inequality in West Germany - Base: Annual income Population: Alle Personen in privaten Haushalten / All persons in private households
Westdeutschland / West Germany
Jahr / Year Gini MLD Theil 1984 {I1110284} 0,247 0,108 0,110 1985 {I1110285} 0,252 0,114 0,117 1986 {I1110286} 0,240 0,101 0,101 1987 {I1110287} 0,239 0,100 0,099 1988 {I1110288} 0,236 0,097 0,096 1989 {I1110289} 0,242 0,101 0,103 1990 {I1110290} 0,245 0,104 0,108 1991 {I1110291} 0,248 0,106 0,108 1992 {I1110292} 0,246 0,104 0,105 1993 {I1110293} 0,253 0,110 0,110 1994 {I1110294} 0,253 0,109 0,111 1995 {I1110295} 0,264 0,124 0,121 1996 {I1110296} 0,260 0,118 0,119 1997 {I1110297} 0,253 0,111 0,110 1998 {I1110298} 0,253 0,113 0,113 1999 {I1110299} 0,254 0,111 0,110 2000 {I1110200} 0,251 0,106 0,107 2001 {I1110201} 0,259 0,117 0,119 2002 {I1110202} 0,261 0,118 0,122 2003 {I1110203} 0,273 0,127 0,133 2004 {I1110204} 0,273 0,129 0,142 2005 {I1110205} 0,276 0,133 0,146 2006 {I1110206} 0,292 0,148 0,172 2007 {I1110207} 0,289 0,143 0,159 2008 {I1110208} 0,290 0,144 0,161 2009 {I1110209} 0,286 0,140 0,152 2010 {I1110210} 0,286 0,141 0,152 2011 {I1110211} 0,282 0,136 0,143 2012 {I1110212} 0,288 0,142 0,160 2013 {I1110213} 0,291 0,144 0,163
26 Inkl. Einkommensvorteilen aus selbstgenutztem Wohneigentum („Imputed Rent“, SOEP-Variable I11105$$)

SOEP Survey Papers 284 85 v30
Einkommensungleichheit in Ostdeutschland - Basis: (Vor-)Jahreseinkommen27 /
Income inequality in East Germany - Base: Annual income Population: Alle Personen in privaten Haushalten / All persons in private households
Ostdeutschland / East Germany
Jahr / Year Gini MLD Theil 1992 {I1110292} 0,204 0,069 0,069 1993 {I1110293} 0,204 0,072 0,074 1994 {I1110294} 0,210 0,074 0,079 1995 {I1110295} 0,214 0,079 0,082 1996 {I1110296} 0,206 0,073 0,073 1997 {I1110297} 0,211 0,077 0,081 1998 {I1110298} 0,207 0,075 0,077 1999 {I1110299} 0,206 0,073 0,076 2000 {I1110200} 0,211 0,077 0,082 2001 {I1110201} 0,211 0,075 0,076 2002 {I1110202} 0,217 0,081 0,081 2003 {I1110203} 0,224 0,086 0,088 2004 {I1110204} 0,226 0,092 0,087 2005 {I1110205} 0,234 0,093 0,093 2006 {I1110206} 0,245 0,102 0,104 2007 {I1110207} 0,239 0,098 0,098 2008 {I1110208} 0,240 0,098 0,097 2009 {I1110209} 0,243 0,101 0,104 2010 {I1110210} 0,251 0,109 0,119 2011 {I1110211} 0,250 0,110 0,105 2012 {I1110212} 0,256 0,111 0,114 2013 {I1110213} 0,258 0,113 0,114
27 Inkl. Einkommensvorteilen aus selbstgenutztem Wohneigentum („Imputed Rent“, SOEP-Variable I11105$$)

SOEP Survey Papers 284 86 v30
Armutsmaße nach Foster, Greer, Thorbecke (1984) in Westdeutschland
- Basis: Monatseinkommen (gesamtdeutsch) Poverty measures (Foster, Greer, Thorbecke 1984) in West Germany
- Base: monthly income Population: Alle Personen in privaten Haushalten / All persons in private households
Westdeutschland / West Germany
Jahr / Year FGT=0 FGT=1 FGT=2 1984 {AH46} 12,249 2,534 0,971 1985 {BH39} 12,773 2,780 0,985 1986 {CH51} 11,924 2,553 0,900 1987 {DH51} 11,007 2,318 0,802 1988 {EH42} 11,291 2,521 0,881 1989 {FH42} 9,816 2,335 0,843 1990 {GH42} 11,437 2,348 0,848 1991 {HH48} 6,654 1,434 0,512 1992 {ICH49} 7,956 1,754 0,643 1993 {JH49} 9,656 2,133 0,807 1994 {KH49} 10,836 2,234 0,805 1995 {I1HINC95} 10,424 2,264 0,750 1996 {I1HINC96} 10,394 2,384 0,861 1997 {I1HINC97} 9,415 1,892 0,606 1998 {I1HINC98} 10,394 1,995 0,605 1999 {I1HINC99} 9,964 1,968 0,655 2000 {I1HINC00} 9,726 2,026 0,710 2001 {I1HINC01} 10,309 2,250 0,761 2002 {I1HINC02} 12,203 2,729 0,998 2003 {I1HINC03} 11,464 2,377 0,794 2004 {I1HINC04} 11,093 2,510 0,962 2005 {I1HINC05} 11,097 2,433 0,879 2006 {I1HINC06} 11,359 2,284 0,785 2007 {I1HINC07} 11,195 2,356 0,793 2008 {I1HINC08} 11,621 2,554 0,948 2009 {I1HINC09} 12,120 2,394 0,833 2010 {I1HINC10} 12,303 2,416 0,788 2011 {I1HINC11} 13,029 2,770 0,982 2012 {I1HINC12} 12,714 2,480 0,773 2013 {I1HINC13} 12,711 2,588 0,924

SOEP Survey Papers 284 87 v30
Armutsmaße nach Foster, Greer, Thorbecke (1984) in Ostdeutschland
- Basis: Monatseinkommen (gesamtdeutsch) / Poverty measures (Foster, Greer, Thorbecke 1984) in East Germany
- Base: monthly income Population: Alle Personen in privaten Haushalten / All persons in private households
Ostdeutschland / East Germany
Jahr / Year FGT=0 FGT=1 FGT=2 1991 {HH48} 24,501 5,099 1,706 1992 {ICH49} 19,853 4,310 1,417 1993 {JH49} 21,308 4,515 1,566 1994 {KH49} 17,350 3,965 1,403 1995 {I1HINC95} 15,435 3,078 0,988 1996 {I1HINC96} 13,902 2,606 0,843 1997 {I1HINC97} 12,946 2,806 0,988 1998 {I1HINC98} 14,146 2,568 0,812 1999 {I1HINC99} 13,381 2,477 0,777 2000 {I1HINC00} 15,590 3,048 0,961 2001 {I1HINC01} 13,999 2,665 0,831 2002 {I1HINC02} 15,737 3,252 1,076 2003 {I1HINC03} 16,011 3,235 1,038 2004 {I1HINC04} 17,077 3,365 1,064 2005 {I1HINC05} 20,694 4,409 1,501 2006 {I1HINC06} 19,915 4,291 1,485 2007 {I1HINC07} 18,255 3,960 1,251 2008 {I1HINC08} 20,312 4,758 1,684 2009 {I1HINC09} 20,245 4,268 1,441 2010 {I1HINC10} 20,560 4,612 1,630 2011 {I1HINC11} 20,211 4,574 1,642 2012 {I1HINC12} 19,945 4,710 1,698 2013 {I1HINC13} 20,190 4,591 1,548

SOEP Survey Papers 284 88 v30
Armutsmaße nach Foster, Greer, Thorbecke (1984) in Deutschland -
Basis: Monatseinkommen (gesamtdeutsch) / Poverty measures (Foster, Greer, Thorbecke 1984) in Germany
- Base: Monthly income Population: Alle Personen in privaten Haushalten / All persons in private households
Deutschland
Jahr / Year FGT=0 FGT=1 FGT=2 1984 {AH46} 12,249 2,534 0,971 1985 {BH39} 12,773 2,780 0,985 1986 {CH51} 11,924 2,553 0,900 1987 {DH51} 11,007 2,318 0,802 1988 {EH42} 11,291 2,521 0,881 1989 {FH42} 9,816 2,335 0,843 1990 {GH42} 11,437 2,348 0,848 1991 {HH48} 10,486 2,221 0,769 1992 {ICH49} 10,434 2,286 0,805 1993 {JH49} 12,056 2,623 0,963 1994 {KH49} 12,152 2,584 0,926 1995 {I1HINC95} 11,383 2,420 0,795 1996 {I1HINC96} 11,054 2,426 0,857 1997 {I1HINC97} 10,075 2,063 0,677 1998 {I1HINC98} 11,112 2,104 0,644 1999 {I1HINC99} 10,591 2,061 0,678 2000 {I1HINC00} 10,841 2,220 0,758 2001 {I1HINC01} 10,984 2,326 0,774 2002 {I1HINC02} 12,845 2,824 1,013 2003 {I1HINC03} 12,283 2,531 0,838 2004 {I1HINC04} 12,160 2,662 0,980 2005 {I1HINC05} 12,818 2,787 0,991 2006 {I1HINC06} 13,042 2,679 0,922 2007 {I1HINC07} 12,569 2,668 0,882 2008 {I1HINC08} 13,284 2,976 1,089 2009 {I1HINC09} 13,690 2,757 0,950 2010 {I1HINC10} 13,867 2,832 0,947 2011 {I1HINC11} 14,462 3,130 1,114 2012 {I1HINC12} 14,132 2,918 0,954 2013 {I1HINC13} 14,155 2,975 1,044

SOEP Survey Papers 284 89 v30
Armutsmaße nach Foster, Greer, Thorbecke (1984) in Westdeutschland -
Basis: (Vor-)Jahreseinkommen (gesamtdeutsch)/ Poverty measures (Foster, Greer, Thorbecke 1984) in West Germany
- Base: Annual income Population: Alle Personen in privaten Haushalten / All persons in private households
Westdeutschland / West Germany
Jahr / Year FGT=0 FGT=1 FGT=2 1984 {I1110284} 12,088 2,786 1,136 1985 {I1110285} 12,623 2,844 1,173 1986 {I1110286} 11,645 2,522 0,984 1987 {I1110287} 11,032 2,390 0,922 1988 {I1110288} 10,410 2,282 0,901 1989 {I1110289} 11,537 2,490 0,937 1990 {I1110290} 10,598 2,175 0,826 1991 {I1110291} 11,164 2,471 0,927 1992 {I1110292} 9,278 2,095 0,827 1993 {I1110293} 10,637 2,290 0,881 1994 {I1110294} 9,986 2,205 0,833 1995 {I1110295} 12,269 3,124 1,348 1996 {I1110296} 11,438 2,819 1,157 1997 {I1110297} 10,259 2,526 0,999 1998 {I1110298} 9,794 2,308 0,913 1999 {I1110299} 9,719 2,323 0,890 2000 {I1110200} 9,798 2,169 0,802 2001 {I1110201} 11,045 2,758 1,100 2002 {I1110202} 11,556 2,741 1,061 2003 {I1110203} 12,460 3,015 1,154 2004 {I1110204} 12,053 2,952 1,168 2005 {I1110205} 12,576 2,955 1,141 2006 {I1110206} 12,343 3,111 1,212 2007 {I1110207} 12,506 3,031 1,127 2008 {I1110208} 12,745 2,957 1,086 2009 {I1110209} 13,168 3,116 1,179 2010 {I1110210} 13,903 3,399 1,286 2011 {I1110211} 12,555 2,834 1,036 2012 {I1110212} 12,692 2,789 0,996 2013 {I1110213} 13,014 2,881 1,003

SOEP Survey Papers 284 90 v30
Armutsmaße nach Foster, Greer, Thorbecke (1984) in Ostdeutschland
- Basis: (Vor-)Jahreseinkommen (gesamtdeutsch) Poverty measure (Foster, Greer, Thorbecke 1984) in East Germany
- Base: Annual income Population: Alle Personen in privaten Haushalten / All persons in private households
Ostdeutschland / East Germany
Jahr / Year FGT=0 FGT=1 FGT=2 1992 {I1110292} 18,421 3,641 1,151 1993 {I1110293} 16,954 3,448 1,141 1994 {I1110294} 17,918 3,234 0,929 1995 {I1110295} 15,266 3,024 0,962 1996 {I1110296} 14,361 2,650 0,911 1997 {I1110297} 13,307 2,759 0,938 1998 {I1110298} 13,260 2,858 1,012 1999 {I1110299} 13,253 2,513 0,781 2000 {I1110200} 13,870 2,751 0,870 2001 {I1110201} 13,788 2,878 0,942 2002 {I1110202} 15,081 3,284 1,108 2003 {I1110203} 15,499 3,372 1,174 2004 {I1110204} 17,446 4,091 1,523 2005 {I1110205} 19,839 4,405 1,528 2006 {I1110206} 20,642 4,948 1,793 2007 {I1110207} 20,169 4,644 1,687 2008 {I1110208} 20,362 4,626 1,662 2009 {I1110209} 20,242 4,751 1,677 2010 {I1110210} 20,520 4,839 1,707 2011 {I1110211} 20,887 5,071 1,975 2012 {I1110212} 21,350 4,814 1,741 2013 {I1110213} 20,189 4,865 1,812

SOEP Survey Papers 284 91 v30
Armutsmaße nach Foster, Greer, Thorbecke (1984) in Deutschland
- Basis: (Vor-)Jahreseinkommen (gesamtdeutsch) / Poverty measures (Foster, Greer, Thorbecke 1984) in Germany - Base: Annual income
Population: Alle Personen in privaten Haushalten / All persons in private households Deutschland
Jahr / Year FGT=0 FGT=1 FGT=2 1984 {I1110284} 12,088 2,786 1,136 1985 {I1110285} 12,623 2,844 1,173 1986 {I1110286} 11,645 2,522 0,984 1987 {I1110287} 11,032 2,390 0,922 1988 {I1110288} 10,410 2,282 0,901 1989 {I1110289} 11,537 2,490 0,937 1990 {I1110290} 10,598 2,175 0,826 1991 {I1110291} 11,164 2,471 0,927 1992 {I1110292} 11,130 2,408 0,893 1993 {I1110293} 11,903 2,522 0,933 1994 {I1110294} 11,552 2,408 0,852 1995 {I1110295} 12,843 3,105 1,274 1996 {I1110296} 11,989 2,787 1,111 1997 {I1110297} 10,829 2,569 0,988 1998 {I1110298} 10,457 2,413 0,932 1999 {I1110299} 10,367 2,358 0,870 2000 {I1110200} 10,573 2,280 0,815 2001 {I1110201} 11,546 2,780 1,071 2002 {I1110202} 12,195 2,840 1,069 2003 {I1110203} 13,008 3,079 1,158 2004 {I1110204} 13,015 3,155 1,232 2005 {I1110205} 13,878 3,215 1,210 2006 {I1110206} 13,974 3,472 1,326 2007 {I1110207} 13,997 3,345 1,236 2008 {I1110208} 14,203 3,277 1,196 2009 {I1110209} 14,537 3,432 1,275 2010 {I1110210} 15,156 3,672 1,366 2011 {I1110211} 14,220 3,281 1,224 2012 {I1110212} 14,389 3,186 1,142 2013 {I1110213} 14,399 3,264 1,160

SOEP Survey Papers 284 92 v30
Entwicklung Armutspopulation: Stabil arm (in t0 und t1)
- Basis: Monatseinkommen (gesamtdeutsch) / Development poverty population: constantly poor (in t0 and t1) - Base: Monthly income
Population: Alle Personen in privaten Haushalten (Längsschnitt) / All persons in private households (longitudinal)
Jahr / Year Westdeutschland / West Germany
Ostdeutschland / East Germany
1984/85 {AH46}{BH39} 6,83 - 1985/86 {BH39}{CH51} 6,95 - 1986/87 {CH51}{DH51} 6,38 - 1987/88 {DH51}{EH42} 6,12 - 1988/89 {EH42}{FH42} 5,50 - 1989/90 {FH42}{GH42} 5,81 - 1990/91 {GH42}{HH48} 4,76 - 1991/92 {HH48}{ICH49} 4,33 11,33 1992/93 {ICH49}{JH49} 4,34 12,03 1993/94 {JH49}{KH49} 5,17 11,02 1994/95 {KH49}{I1HINC95} 5,66 8,96 1995/96 {I1HINC95}{I1HINC96} 5,53 8,25 1996/97 {I1HINC96}{I1HINC97} 5,51 6,71 1997/98 {I1HINC97}{I1HINC98} 5,28 8,07 1998/99 {I1HINC98}{I1HINC99} 5,32 7,80 1999/2000 {I1HINC99}{I1HINC00} 5,56 8,77 2000/01 {I1HINC00}{I1HINC01} 6,08 8,63 2001/02 {I1HINC01}{I1HINC02} 6,71 9,31 2002/03 {I1HINC02}{I1HINC03} 6,63 9,97 2003/04 {I1HINC03}{I1HINC04} 6,22 10,20 2004/05 {I1HINC04}{I1HINC05} 5,96 12,38 2005/06 {I1HINC05}{I1HINC06} 6,83 14,14 2006/07 {I1HINC06}{I1HINC07} 6,72 12,67 2007/08 {I1HINC07}{I1HINC08} 6,85 13,69 2008/09 {I1HINC08}{I1HINC09} 6,83 14,41 2009/10 {I1HINC09}{I1HINC10} 7,70 15,05 2010/11 {I1HINC10}{I1HINC11} 7,85 13,85 2011/12 {I1HINC11}{I1HINC12} 8,67 15,30 2012/13 {I1HINC12}{I1HINC13} 8,14 14,33
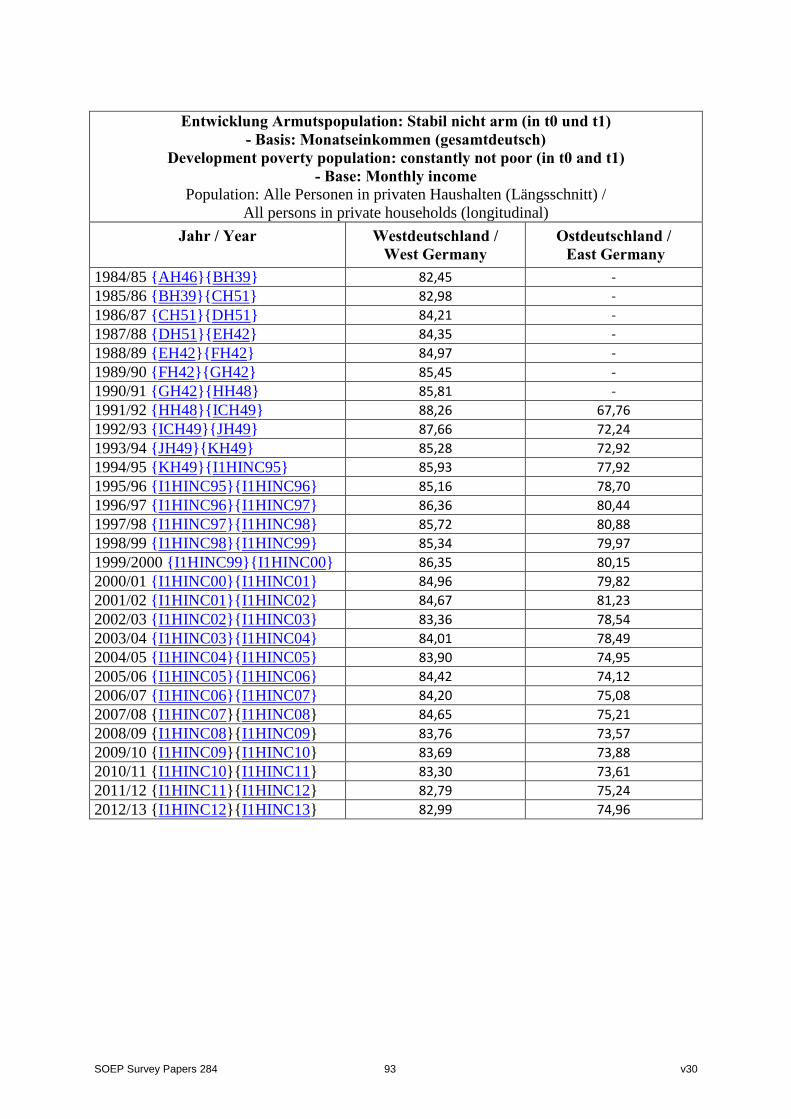
SOEP Survey Papers 284 93 v30
Entwicklung Armutspopulation: Stabil nicht arm (in t0 und t1)
- Basis: Monatseinkommen (gesamtdeutsch) Development poverty population: constantly not poor (in t0 and t1)
- Base: Monthly income Population: Alle Personen in privaten Haushalten (Längsschnitt) /
All persons in private households (longitudinal) Jahr / Year Westdeutschland /
West Germany Ostdeutschland / East Germany
1984/85 {AH46}{BH39} 82,45 - 1985/86 {BH39}{CH51} 82,98 - 1986/87 {CH51}{DH51} 84,21 - 1987/88 {DH51}{EH42} 84,35 - 1988/89 {EH42}{FH42} 84,97 - 1989/90 {FH42}{GH42} 85,45 - 1990/91 {GH42}{HH48} 85,81 - 1991/92 {HH48}{ICH49} 88,26 67,76 1992/93 {ICH49}{JH49} 87,66 72,24 1993/94 {JH49}{KH49} 85,28 72,92 1994/95 {KH49}{I1HINC95} 85,93 77,92 1995/96 {I1HINC95}{I1HINC96} 85,16 78,70 1996/97 {I1HINC96}{I1HINC97} 86,36 80,44 1997/98 {I1HINC97}{I1HINC98} 85,72 80,88 1998/99 {I1HINC98}{I1HINC99} 85,34 79,97 1999/2000 {I1HINC99}{I1HINC00} 86,35 80,15 2000/01 {I1HINC00}{I1HINC01} 84,96 79,82 2001/02 {I1HINC01}{I1HINC02} 84,67 81,23 2002/03 {I1HINC02}{I1HINC03} 83,36 78,54 2003/04 {I1HINC03}{I1HINC04} 84,01 78,49 2004/05 {I1HINC04}{I1HINC05} 83,90 74,95 2005/06 {I1HINC05}{I1HINC06} 84,42 74,12 2006/07 {I1HINC06}{I1HINC07} 84,20 75,08 2007/08 {I1HINC07}{I1HINC08} 84,65 75,21 2008/09 {I1HINC08}{I1HINC09} 83,76 73,57 2009/10 {I1HINC09}{I1HINC10} 83,69 73,88 2010/11 {I1HINC10}{I1HINC11} 83,30 73,61 2011/12 {I1HINC11}{I1HINC12} 82,79 75,24 2012/13 {I1HINC12}{I1HINC13} 82,99 74,96

SOEP Survey Papers 284 94 v30
Entwicklung Armutspopulation: in Armut (nicht arm in t0, arm in t1)
- Basis: Monatseinkommen (gesamtdeutsch) / Development poverty population: into poverty (not poor in t0, poor in t1)
- Base: Monthly income Population: Alle Personen in privaten Haushalten (Längsschnitt) /
All persons in private households (longitudinal) Jahr / Year Westdeutschland /
West Germany Ostdeutschland /
East Germany
1984/85 {AH46}{BH39} 5,49 - 1985/86 {BH39}{CH51} 4,64 - 1986/87 {CH51}{DH51} 3,97 - 1987/88 {DH51}{EH42} 4,74 - 1988/89 {EH42}{FH42} 3,69 - 1989/90 {FH42}{GH42} 4,83 - 1990/91 {GH42}{HH48} 2,84 - 1991/92 {HH48}{ICH49} 3,44 8,11 1992/93 {ICH49}{JH49} 4,50 8,55 1993/94 {JH49}{KH49} 5,20 6,10 1994/95 {KH49}{I1HINC95} 3,47 5,01 1995/96 {I1HINC95}{I1HINC96} 4,67 5,70 1996/97 {I1HINC96}{I1HINC97} 3,89 5,29 1997/98 {I1HINC97}{I1HINC98} 4,88 6,41 1998/99 {I1HINC98}{I1HINC99} 4,64 5,56 1999/2000 {I1HINC99}{I1HINC00} 4,24 6,60 2000/01 {I1HINC00}{I1HINC01} 4,27 5,34 2001/02 {I1HINC01}{I1HINC02} 4,70 5,16 2002/03 {I1HINC02}{I1HINC03} 4,58 5,85 2003/04 {I1HINC03}{I1HINC04} 4,67 5,60 2004/05 {I1HINC04}{I1HINC05} 5,19 8,19 2005/06 {I1HINC05}{I1HINC06} 4,44 5,12 2006/07 {I1HINC06}{I1HINC07} 4,63 5,26 2007/08 {I1HINC07}{I1HINC08} 4,61 6,51 2008/09 {I1HINC08}{I1HINC09} 4,94 5,96 2009/10 {I1HINC09}{I1HINC10} 4,72 5,33 2010/11 {I1HINC10}{I1HINC11} 4,92 6,45 2011/12 {I1HINC11}{I1HINC12} 3,69 4,27 2012/13 {I1HINC12}{I1HINC13} 4,30 5,83
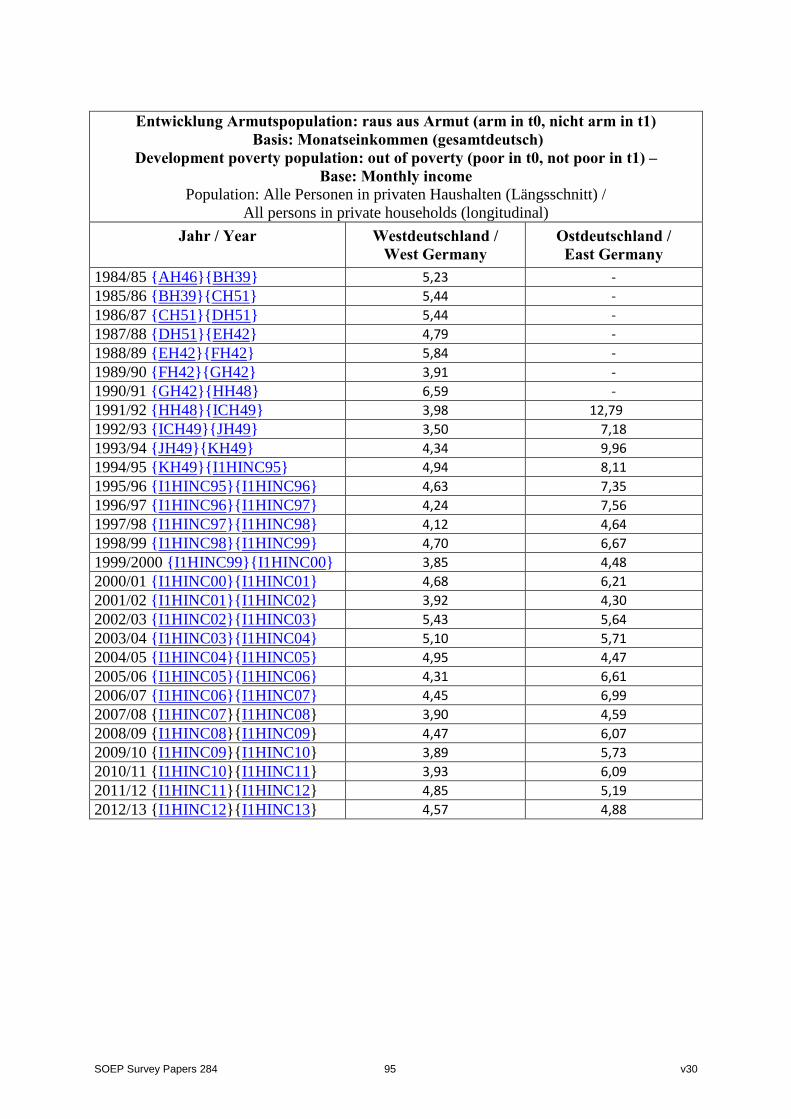
SOEP Survey Papers 284 95 v30
Entwicklung Armutspopulation: raus aus Armut (arm in t0, nicht arm in t1)
Basis: Monatseinkommen (gesamtdeutsch) Development poverty population: out of poverty (poor in t0, not poor in t1) –
Base: Monthly income Population: Alle Personen in privaten Haushalten (Längsschnitt) /
All persons in private households (longitudinal) Jahr / Year Westdeutschland /
West Germany Ostdeutschland /
East Germany 1984/85 {AH46}{BH39} 5,23 - 1985/86 {BH39}{CH51} 5,44 - 1986/87 {CH51}{DH51} 5,44 - 1987/88 {DH51}{EH42} 4,79 - 1988/89 {EH42}{FH42} 5,84 - 1989/90 {FH42}{GH42} 3,91 - 1990/91 {GH42}{HH48} 6,59 - 1991/92 {HH48}{ICH49} 3,98 12,79 1992/93 {ICH49}{JH49} 3,50 7,18 1993/94 {JH49}{KH49} 4,34 9,96 1994/95 {KH49}{I1HINC95} 4,94 8,11 1995/96 {I1HINC95}{I1HINC96} 4,63 7,35 1996/97 {I1HINC96}{I1HINC97} 4,24 7,56 1997/98 {I1HINC97}{I1HINC98} 4,12 4,64 1998/99 {I1HINC98}{I1HINC99} 4,70 6,67 1999/2000 {I1HINC99}{I1HINC00} 3,85 4,48 2000/01 {I1HINC00}{I1HINC01} 4,68 6,21 2001/02 {I1HINC01}{I1HINC02} 3,92 4,30 2002/03 {I1HINC02}{I1HINC03} 5,43 5,64 2003/04 {I1HINC03}{I1HINC04} 5,10 5,71 2004/05 {I1HINC04}{I1HINC05} 4,95 4,47 2005/06 {I1HINC05}{I1HINC06} 4,31 6,61 2006/07 {I1HINC06}{I1HINC07} 4,45 6,99 2007/08 {I1HINC07}{I1HINC08} 3,90 4,59 2008/09 {I1HINC08}{I1HINC09} 4,47 6,07 2009/10 {I1HINC09}{I1HINC10} 3,89 5,73 2010/11 {I1HINC10}{I1HINC11} 3,93 6,09 2011/12 {I1HINC11}{I1HINC12} 4,85 5,19 2012/13 {I1HINC12}{I1HINC13} 4,57 4,88

SOEP Survey Papers 284 96 v30
Entwicklung Armutspopulation: Stabil arm (in t0 und t1)
- Basis: (Vor-) Jahreseinkommen (gesamtdeutsch) Development poverty population: constantly poor (in t0 and t1) - Base: Annual income
Population: Alle Personen in privaten Haushalten (Längsschnitt)/ All persons in private households (longitudinal)
Jahr / Year Westdeutschland / West Germany
Ostdeutschland / East Germany
1984/85 {I1110284}{I1110285} 6,75 - 1985/86 {I1110285}{I1110286} 6,93 - 1986/87 {I1110286}{I1110287} 6,34 - 1987/88 {I1110287}{I1110288} 6,62 - 1988/89 {I1110288}{I1110289} 6,87 - 1989/90 {I1110289}{I1110290} 6,55 - 1990/91 {I1110290}{I1110291} 6,32 - 1991/92 {I1110291}{I1110292} 5,58 - 1992/93 {I1110292}{I1110293} 5,91 9,97 1993/94 {I1110293}{I1110294} 6,09 10,71 1994/95 {I1110294}{I1110295} 5,69 10,41 1995/96 {I1110295}{I1110296} 6,66 8,99 1996/97 {I1110296}{I1110297} 6,16 7,88 1997/98 {I1110297}{I1110298} 5,84 8,97 1998/99 {I1110298}{I1110299} 6,05 8,53 1999/00 {I1110299}{I1110200} 5,81 9,17 2000/01 {I1110200}{I1110201} 7,20 9,89 2001/02 {I1110201}{I1110202} 7,29 9,65 2002/03 {I1110202}{I1110203} 7,76 10,52 2003/04 {I1110203}{I1110204} 7,87 11,33 2004/05 {I1110204}{I1110205} 7,77 13,03 2005/06 {I1110205}{I1110206} 7,76 13,60 2006/07 {I1110206}{I1110207} 7,83 13,76 2007/08 {I1110207}{I1110208} 7,56 13,99 2008/09 {I1110208}{I1110209} 7,74 14,15 2009/10 {I1110209}{I1110210} 8,72 14,80 2010/11 {I1110210}{I1110211} 8,16 15,27 2011/12 {I1110211}{I1110212} 7,92 15,68 2012/13 {I1110212}{I1110213} 8,46 15,96

SOEP Survey Papers 284 97 v30
Entwicklung Armutspopulation: Stabil nicht arm (in t0 und t1)
- Basis: (Vor-) Jahreseinkommen (gesamtdeutsch) Development poverty population: constantly not poor (in t0 and t1)
- Base: Annual income Population: Alle Personen in privaten Haushalten (Längsschnitt) /
All persons in private households (longitduinal) Jahr / Year Westdeutschland /
West Germany Ostdeutschland /
East Germany 1984/85 {I1110284}{I1110285} 82,43 - 1985/86 {I1110285}{I1110286} 83,28 - 1986/87 {I1110286}{I1110287} 84,09 - 1987/88 {I1110287}{I1110288} 85,36 - 1988/89 {I1110288}{I1110289} 85,22 - 1989/90 {I1110289}{I1110290} 84,81 - 1990/91 {I1110290}{I1110291} 85,07 - 1991/92 {I1110291}{I1110292} 85,33 - 1992/93 {I1110292}{I1110293} 86,23 75,18 1993/94 {I1110293}{I1110294} 86,16 76,35 1994/95 {I1110294}{I1110295} 85,34 77,87 1995/96 {I1110295}{I1110296} 84,43 80,05 1996/97 {I1110296}{I1110297} 85,11 81,96 1997/98 {I1110297}{I1110298} 85,90 82,29 1998/99 {I1110298}{I1110299} 86,17 82,01 1999/00 {I1110299}{I1110200} 86,90 82,80 2000/01 {I1110200}{I1110201} 84,79 81,64 2001/02 {I1110201}{I1110202} 84,46 81,91 2002/03 {I1110202}{I1110203} 83,73 80,97 2003/04 {I1110203}{I1110204} 83,91 78,98 2004/05 {I1110204}{I1110205} 83,34 77,32 2005/06 {I1110205}{I1110206} 83,47 74,15 2006/07 {I1110206}{I1110207} 82,92 73,40 2007/08 {I1110207}{I1110208} 82,73 73,59 2008/09 {I1110208}{I1110209} 82,81 75,03 2009/10 {I1110209}{I1110210} 82,03 74,23 2010/11 {I1110210}{I1110211} 82,98 74,39 2011/12 {I1110211}{I1110212} 82,24 73,12 2012/13 {I1110212}{I1110213} 82,36 74,51

SOEP Survey Papers 284 98 v30
Entwicklung Armutspopulation: in Armut (nicht arm in t0, arm in t1)
- Basis: (Vor-) Jahreseinkommen (gesamtdeutsch) / Development poverty population: into poverty (not poor in t0, poor in t1)
- Base: Annual income Population: Alle Personen in privaten Haushalten (Längsschnitt) /
All persons in private households (longitudinal) Jahr / Year Westdeutschland /
West Germany Ostdeutschland /
East Germany 1984/85 {I1110284}{I1110285} 5,75 - 1985/86 {I1110285}{I1110286} 4,48 - 1986/87 {I1110286}{I1110287} 4,48 - 1987/88 {I1110287}{I1110288} 3,72 - 1988/89 {I1110288}{I1110289} 4,37 - 1989/90 {I1110289}{I1110290} 3,79 - 1990/91 {I1110290}{I1110291} 4,64 - 1991/92 {I1110291}{I1110292} 3,39 - 1992/93 {I1110292}{I1110293} 4,58 6,91 1993/94 {I1110293}{I1110294} 3,58 6,81 1994/95 {I1110294}{I1110295} 5,06 4,41 1995/96 {I1110295}{I1110296} 4,24 5,13 1996/97 {I1110296}{I1110297} 3,74 4,32 1997/98 {I1110297}{I1110298} 3,79 4,59 1998/99 {I1110298}{I1110299} 3,59 4,21 1999/2000 {I1110299}{I1110200} 4,03 4,05 2000/01 {I1110200}{I1110201} 3,44 3,86 2001/02 {I1110201}{I1110202} 3,89 4,30 2002/03 {I1110202}{I1110203} 4,59 4,38 2003/04 {I1110203}{I1110204} 3,86 5,50 2004/05 {I1110204}{I1110205} 4,53 5,31 2005/06 {I1110205}{I1110206} 4,25 6,26 2006/07 {I1110206}{I1110207} 4,54 5,59 2007/08 {I1110207}{I1110208} 5,06 6,11 2008/09 {I1110208}{I1110209} 5,39 5,75 2009/10 {I1110209}{I1110210} 5,17 5,90 2010/11 {I1110210}{I1110211} 4,05 5,46 2011/12 {I1110211}{I1110212} 4,54 5,24 2012/13 {I1110212}{I1110213} 4,52 4,28

SOEP Survey Papers 284 99 v30
Entwicklung Armutspopulation: raus aus Armut (arm in t0, nicht arm in t1) /
Basis: (Vor-) Jahreseinkommen (gesamtdeutsch) / Development poverty population: out of poverty (poor in t0, not poor in t1)
- Base: Annual income Population: Alle Personen in privaten Haushalten (Längsschnitt) /
All persons in private households (longitudinal) Jahr / Year Westdeutschland /
West Germany Ostdeutschland /
East Germany 1984/85 {I1110284}{I1110285} 5,07 - 1985/86 {I1110285}{I1110286} 5,30 - 1986/87 {I1110286}{I1110287} 5,09 - 1987/88 {I1110287}{I1110288} 4,31 - 1988/89 {I1110288}{I1110289} 3,53 - 1989/90 {I1110289}{I1110290} 4,85 - 1990/91 {I1110290}{I1110291} 3,97 - 1991/92 {I1110291}{I1110292} 5,70 - 1992/93 {I1110292}{I1110293} 3,29 7,93 1993/94 {I1110293}{I1110294} 4,17 6,12 1994/95 {I1110294}{I1110295} 3,91 7,30 1995/96 {I1110295}{I1110296} 4,67 5,84 1996/97 {I1110296}{I1110297} 4,99 5,84 1997/98 {I1110297}{I1110298} 4,47 4,16 1998/99 {I1110298}{I1110299} 4,18 5,26 1999/2000 {I1110299}{I1110200} 3,26 3,97 2000/01 {I1110200}{I1110201} 4,56 4,61 2001/02 {I1110201}{I1110202} 4,35 4,13 2002/03 {I1110202}{I1110203} 3,92 4,12 2003/04 {I1110203}{I1110204} 4,36 4,19 2004/05 {I1110204}{I1110205} 4,36 4,33 2005/06 {I1110205}{I1110206} 4,52 5,99 2006/07 {I1110206}{I1110207} 4,71 7,24 2007/08 {I1110207}{I1110208} 4,65 6,31 2008/09 {I1110208}{I1110209} 4,07 5,07 2009/10 {I1110209}{I1110210} 4,08 5,07 2010/11 {I1110210}{I1110211} 4,81 4,88 2011/12 {I1110211}{I1110212} 5,30 5,96 2012/13 {I1110212}{I1110213} 4,65 5,24

SOEP Survey Papers 284 100 v30
Einkommensmobilität nach Fields & Ok (1999)
- Basis: Äquivalenzgewichtetes Monats-Einkommen Income mobility (Fields & Ok 1999)
- Base: Equivalent monthly household income Population: Alle Personen in privaten Haushalten (Längsschnitt) /
All persons in private households (longitudinal) Westdeutschland /
West Germany Ostdeutschland /
East Germany
Jahr / Year „Relative“ Mobilität,
insgesamt / „relative“ mobility, overall
davon: Transfer- Kompo-nente /
thereof: transfer-compo-
nent
„Wachs-tums“-
Kompo-nente28 /
„Growth“-component
„Relative“ Mobilität,
insgesamt / „relative“ mobility, overall
davon: Transfer- Kompo-nente /
thereof: transfer-compo-
nent
„Wachs-tums“-
Kompo-nente29 /
„Growth“-component
1984/85 {AH46}{BH39} 0,216 0,208 0,008 - - - 1985/86 {BH39}{CH51} 0,206 0,152 0,053 - - - 1986/87 {CH51}{DH51} 0,191 0,154 0,037 - - - 1987/88 {DH51}{EH42} 0,193 0,175 0,018 - - - 1988/89 {EH42}{FH42} 0,193 0,171 0,021 - - - 1989/90 {FH42}{GH42} 0,187 0,144 0,043 - - - 1990/91 {GH42}{HH48} 0,184 0,169 0,014 - - - 1991/92 {HH48}{ICH49} 0,177 0,170 0,007 0,228 0,151 0,077 1992/93 {ICH49}{JH49} 0,188 0,171 0,017 0,198 0,150 0,048 1993/94 {JH49}{KH49} 0,186 0,173 -0,012 0,197 0,147 0,050 1994/95 {KH49}{I1HINC95} 0,181 0,162 0,019 0,181 0,138 0,043 1995/96 {I1HINC95}{I1HINC96} 0,205 0,194 0,012 0,186 0,151 0,035 1996/97 {I1HINC96}{I1HINC97} 0,190 0,174 -0,016 0,181 0,172 -0,009 1997/98 {I1HINC97}{I1HINC98} 0,184 0,176 0,008 0,166 0,162 0,004 1998/99 {I1HINC98}{I1HINC99} 0,187 0,159 0,027 0,172 0,136 0,035 1999/2000 {I1HINC99}{I1HINC00} 0,181 0,162 0,019 0,170 0,160 0,010 2000/01 {I1HINC00}{I1HINC01} 0,196 0,196 0,001 0,166 0,155 0,011 2001/02 {I1HINC01}{I1HINC02} 0,210 0,185 0,024 0,181 0,166 0,015 2002/03 {I1HINC02}{I1HINC03} 0,214 0,200 0,015 0,186 0,184 0,002 2003/04 {I1HINC03}{I1HINC04} 0,204 0,192 -0,012 0,174 0,159 -0,015 2004/05 {I1HINC04}{I1HINC05} 0,198 0,192 -0,006 0,188 0,154 -0,035 2005/06 {I1HINC05}{I1HINC06} 0,197 0,191 -0,006 0,182 0,177 0,005 2006/07 {I1HINC06}{I1HINC07} 0,188 0,183 -0,006 0,185 0,183 -0,002 2007/08 {I1HINC07}{I1HINC08} 0,175 0,164 -0,011 0,172 0,152 -0,019 2008/09 {I1HINC08}{I1HINC09} 0,182 0,154 0,028 0,169 0,134 0,036 2009/10 {I1HINC09}{I1HINC10} 0,179 0,172 0,007 0,162 0,140 0,022 2010/11 {I1HINC10}{I1HINC11} 0,185 0,178 -0,007 0,181 0,163 0,017 2011/12 {I1HINC11}{I1HINC12} 0,183 0,164 0,019 0,169 0,164 0,006 2012/13 {I1HINC12}{I1HINC13} 0,181 0,177 0,005 0,170 0,160 0,010
28 Negative Werte der Wachstumskomponente implizieren einen Realeinkommensrückgang. 29 Negative Werte der Wachstumskomponente implizieren einen Realeinkommensrückgang.

SOEP Survey Papers 284 101 v30
Einkommensmobilität nach Fields & Ok (1999) - Basis: Äquivalenzgewichtetes (Vor-)Jahres-Einkommen 30 /
Income mobility (Fields & Ok 1999)- Base: Equivalence-weighted annual income
Population: Alle Personen in privaten Haushalten (Längsschnitt) / All persons in private households (longitudinal)
Westdeutschland / West Germany
Ostdeutschland / East Germany
Jahr / Year „Relative“ Mobilität,
insgesamt / „relative“ mobility, overall
davon: Transfer- Kompo-nente /
thereof: transfer-compo-
nent
„Wachs-tums“-
Kompo-nente31 /
„Growth“-component
„Relative“ Mobilität,
insgesamt / „relative“ mobility, overall
davon: Transfer- Kompo-nente /
thereof: transfer-compo-
nent
„Wachs-tums“-
Kompo-nente32 /
„Growth“-component
1984/85 {I1110284}{I1110285} 0,230 0,229 -0,001 - - - 1985/86 {I1110285}{I1110286} 0,213 0,193 0,020 - - - 1986/87 {I1110286}{I1110287} 0,199 0,145 0,053 - - - 1987/88 {I1110287}{I1110288} 0,185 0,150 0,035 - - - 1988/89 {I1110288}{I1110289} 0,179 0,145 0,034 - - - 1989/90 {I1110289}{I1110290} 0,183 0,166 0,016 - - - 1990/91 {I1110290}{I1110291} 0,189 0,141 0,048 - - - 1991/92 {I1110291}{I1110292} 0,185 0,165 0,020 - - - 1992/93 {I1110292}{I1110293} 0,182 0,175 0,007 0,208 0,172 0,035 1993/94 {I1110293}{I1110294} 0,185 0,185 0,000 0,179 0,166 0,014 1994/95 {I1110294}{I1110295} 0,202 0,162 -0,041 0,175 0,163 0,012 1995/96 {I1110295}{I1110296} 0,203 0,193 0,010 0,181 0,171 0,011 1996/97 {I1110296}{I1110297} 0,199 0,185 0,013 0,170 0,147 0,023 1997/98 {I1110297}{I1110298} 0,191 0,188 0,003 0,171 0,169 0,002 1998/99 {I1110298}{I1110299} 0,185 0,158 0,027 0,163 0,125 0,038 1999/2000 {I1110299}{I1110200} 0,177 0,140 0,037 0,157 0,128 0,028 2000/01 {I1110200}{I1110201} 0,189 0,176 0,014 0,160 0,149 0,011 2001/02 {I1110201}{I1110202} 0,197 0,174 0,023 0,170 0,165 0,005 2002/03 {I1110202}{I1110203} 0,200 0,187 0,012 0,168 0,156 0,012 2003/04 {I1110203}{I1110204} 0,194 0,185 -0,009 0,165 0,142 -0,023 2004/05 {I1110204}{I1110205} 0,191 0,184 0,007 0,164 0,159 -0,005 2005/06 {I1110205}{I1110206} 0,194 0,189 -0,005 0,180 0,158 -0,022 2006/07 {I1110206}{I1110207} 0,198 0,192 0,006 0,187 0,159 0,029 2007/08 {I1110207}{I1110208} 0,197 0,189 0,009 0,186 0,180 0,005 2008/09 {I1110208}{I1110209} 0,197 0,177 -0,020 0,170 0,155 -0,014 2009/10 {I1110209}{I1110210} 0,191 0,176 0,016 0,174 0,146 0,028 2010/11 {I1110210}{I1110211} 0,183 0,169 0,014 0,170 0,170 -0,001 2011/12 {I1HINC11}{I1HINC12} 0,198 0,194 -0,003 0,175 0,173 -0,001 2012/13 {I1HINC12}{I1HINC13} 0,185 0,171 0,014 0,169 0,152 0,017
30 Inkl. Einkommensvorteilen aus selbstgenutztem Wohneigentum („Imputed Rent“, SOEP-Variable I11105$$) 31 Negative Werte der Wachstumskomponente implizieren einen Realeinkommensrückgang. 32 Negative Werte der Wachstumskomponente implizieren einen Realeinkommensrückgang.

SOEP Survey Papers 284 102 v30
VI. Subjektive Indikatoren zu Sozialer Exklusion/Inklusion / Subjective indicators on social exclusion/inclusion
Allgemeine Lebenszufriedenheit (Mittelwert auf einer Skala von 0 bis 10)33 / Life satisfaction in general (mean on a scale from 0 to 10)
Population: Alle Befragungspersonen ab 17 Jahren / All persons (age 17 and older) Westdeutschland /
West Germany Ostdeutschland /
East Germany
Jahr / Year Total
1984 {AP6801} 7,42 - 7,42 1985 {BP9301} 7,23 - 7,23 1986 {CP9601} 7,30 - 7,30 1987 {DP9801} 7,10 - 7,10 1988 {EP89} 7,01 - 7,01 1989 {FP108} 7,06 - 7,06 1990 {GP109} 7,24 - 7,24 1991 {HP10901} 7,33 6,04 7,07 1992 {IP10901} 7,24 6,08 7,01 1993 {JP10901} 7,15 6,20 6,96 1994 {KP10401} 7,04 6,28 6,89 1995 {LP10401} 6,98 6,40 6,86 1996 {MP11001} 7,02 6,42 6,90 1997 {NP11701} 6,89 6,34 6,78 1998 {OP12301} 7,06 6,50 6,95 1999 {PP13501} 7,10 6,56 7,00 2000 {QP14301} 7,22 6,60 7,10 2001 {RP13501} 7,23 6,61 7,11 2002 {SP13501} 7,03 6,42 6,92 2003 {TP14201} 7,00 6,33 6,87 2004 {UP14501} 6,79 6,13 6,67 2005 {VP154} 6,95 6,34 6,84 2006 {WP142} 6,90 6,26 6,77 2007 {XP149} 6,96 6,38 6,84 2008 {YP15501} 6,97 6,53 6,88 2009 {ZP15701} 6,90 6,47 6,81 2010 {BAP160} 7,06 6,70 6,99 2011 {BBP15201} 7,03 6,63 6,95 2012 {BCP151} 7,19 6,73 7,09 2013 {BDP15801} 7,25 6,80 7,16
33 Zufriedenheit wird im SOEP gemessen auf einer Skala von 0 („ganz und gar unzufrieden“) bis 10
(„ganz und gar zufrieden“).

SOEP Survey Papers 284 103 v30
Bereichs-Zufriedenheit Arbeit / Satisfaction with work
Population: Alle erwerbstätigen Befragungspersonen ab 17 Jahren / All employed persons (age 17 and older)
Westdeutschland / West Germany
Ostdeutschland / East Germany
Jahr / Year Total 1984 {AP0304} 7,70 - 7,70 1985 {BP0104} 7,52 - 7,52 1986 {CP0104} 7,41 - 7,41 1987 {DP0105} 7,41 - 7,41 1988 {EP0104} 7,26 - 7,26 1989 {FP0105} 7,27 - 7,27 1990 {GP0104} 7,23 - 7,23 1991 {HP1002} 7,20 6,33 7,02 1992 {IP9802} 7,41 6,76 7,29 1993 {JP0102} 7,13 6,83 7,07 1994 {KP0102} 7,01 6,74 6,96 1995 {LP0102} 6,91 6,64 6,85 1996 {MP0102} 6,88 6,61 6,83 1997 {NP0102} 6,86 6,63 6,82 1998 {OP0102} 6,97 6,50 6,88 1999 {PP0102} 6,91 6,55 6,84 2000 {QP0102} 7,13 6,74 7,06 2001 {RP0102} 7,12 6,75 7,05 2002 {SP0102} 6,95 6,61 6,89 2003 {TP0102} 6,94 6,47 6,86 2004 {UP0102} 6,83 6,38 6,76 2005 {VP0102} 6,78 6,37 6,71 2006 {WP0102} 6,80 6,57 6,76 2007 {XP0102} 6,81 6,49 6,75 2008 {YP0103} 6,80 6,66 6,78 2009 {ZP0103} 6,72 6,60 6,69 2010 {BAP0103} 6,79 6,63 6,76 2011 {BBP0103} 6,95 6,58 6,88 2012 {BCP0103} 7,05 6,79 7,00 2013 {BDP0103} 7,08 6,89 7,05

SOEP Survey Papers 284 104 v30
Bereichs-Zufriedenheit Einkommen / Satisfaction with income
Population: Alle Befragungspersonen ab 17 Jahren / All persons (age 17 and older) Westdeutschland /
West Germany Ostdeutschland /
East Germany
Jahr / Year Total 1984 {AP0302} 6,48 - 6,48 1985 {BP0102} 6,49 - 6,49 1986 {CP0102} 6,56 - 6,56 1987 {DP0102} 6,57 - 6,57 1988 {EP0102} 6,57 - 6,57 1989 {FP0102} 6,61 - 6,61 1990 {GP0102} 6,69 - 6,69 1991 {HP1004} 6,89 4,75 6,45 1992 {IP9804} 6,72 4,90 6,35 1993 {JP0104} 6,58 5,33 6,33 1994 {KP0104} 6,42 5,45 6,22 1995 {LP0104} 6,46 5,59 6,29 1996 {MP0104} 6,48 5,66 6,33 1997 {NP0104} 6,29 5,40 6,12 1998 {OP0104} 6,41 5,53 6,24 1999 {PP0104} 6,47 5,62 6,31 2000 {QP0104} 6,65 5,79 6,48 2001 {RP0104} 6,72 5,86 6,56 2002 {SP0104} 6,46 5,58 6,29 2003 {TP0104} 6,36 5,44 6,19 2004 {UP0104} 6,21 5,24 6,03 2005 {VP0104} 6,20 5,37 6,04 2006 {WP0104} 6,18 5,30 6,00 2007 {XP0104} 6,20 5,40 6,04 2008 {YP0105} 6,24 5,41 6,08 2009 {ZP0105} 6,30 5,53 6,15 2010 {BAP0105} 6,34 5,68 6,21 2011 {BBP0105} 6,57 5,81 6,41 2012 {BCP0105} 6,67 5,95 6,52 2013 {BDP0105} 6,71 6,09 6,59

SOEP Survey Papers 284 105 v30
Sorgen um die allgemeine wirtschaftliche Entwicklung (Westdeutschland), in %
Concerns about general economic development (West Germany), in % Population: Alle Befragungspersonen ab 17 Jahren / All persons (age 17 and older)
Westdeutschland / West Germany
Jahr / Year Groß / Great Einige / Some Keine / None Total 1984 {AP5401} 32,97 53,96 13,06 100 1985 {BP7701} 30,85 56,13 13,02 100 1986 {CP7701} 19,09 57,48 23,43 100 1987 {DP8901} 20,59 60,89 18,52 100 1988 {EP7801} 27,95 58,26 13,79 100 1989 {FP9401} 17,69 58,11 24,20 100 1990 {GP8601} 18,78 52,15 29,08 100 1991 {HP9101} 18,81 59,16 22,03 100 1992 {IP9101} 23,88 60,22 15,89 100 1993 {JP9101} 39,66 53,75 6,58 100 1994 {KP9301} 36,81 55,56 7,63 100 1995 {LP9901} 25,21 62,36 12,43 100 1996 {MP10901} 44,66 48,92 6,42 100 1997 {NP9501} 47,65 47,41 4,94 100 1998 {OP9801} 40,60 52,02 7,38 100 1999 - - - - 2000 {QP11801} 19,28 61,62 19,10 100 2001 {RP11401} 17,31 62,34 20,35 100 2002 {SP11301} 31,21 58,32 10,47 100 2003 {TP12001} 53,24 41,55 5,21 100 2004 {UP12501} 48,95 45,00 6,04 100 2005 {VP13101} 53,43 41,57 5,01 100 2006 {WP12101} 43,79 48,97 7,24 100 2007 {XP13001} 24,50 59,11 16,39 100 2008 {YP13201} 24,92 61,32 13,76 100 2009 {ZP12801} 44,64 49,37 5,99 100 2010 {BAP13001} 36,97 55,46 7,58 100 2011 {BBP13101} 20,79 61,89 17,33 100 2012 {BCP12701} 21,88 61,98 16,14 100 2013 {BDP13391} 18,02 63,83 18,14 100

SOEP Survey Papers 284 106 v30
Sorgen um die allgemeine wirtschaftliche Entwicklung (Ostdeutschland), in %
Concerns about general economic development (East Germany), in % Population: Alle Befragungspersonen ab 17 Jahren / All persons (age 17 and older)
Ostdeutschland / East Germany
Jahr / Year Groß / Great Einige / Some Keine / None Total 1991 {HP9101} 47,16 46,12 6,72 100 1992 {IP9101} 35,99 54,20 9,81 100 1993 {JP9101} 41,72 52,89 5,39 100 1994 {KP9301} 40,11 54,16 5,74 100 1995 {LP9901} 27,30 63,24 9,46 100 1996 {MP10901} 44,01 50,40 5,59 100 1997 {NP9501} 53,14 43,61 3,25 100 1998 {OP9801} 51,90 44,01 4,09 100 1999 - - - - 2000 {QP11801} 31,60 57,99 10,41 100 2001 {RP11401} 33,59 55,87 10,55 100 2002 {SP11301} 45,58 49,02 5,40 100 2003 {TP12001} 62,75 34,21 3,04 100 2004 {UP12501} 56,68 39,06 4,26 100 2005 {VP13101} 60,60 35,66 3,74 100 2006 {WP12101} 48,27 45,55 6,18 100 2007 {XP13001} 29,15 59,42 11,43 100 2008 {YP13201} 29,22 59,09 11,69 100 2009 {ZP12801} 44,92 48,46 6,62 100 2010 {BAP13001} 36,13 56,89 6,98 100 2011 {BBP13101} 25,39 59,91 14,70 100 2012 {BCP12701} 23,82 61,21 14,97 100 2013 {BDP13301} 20,36 62,93 16,71 100

SOEP Survey Papers 284 107 v30
Sorgen um die eigene wirtschaftliche Entwicklung (Westdeutschland), in % /
Concerns about own economic development (West Germany), in % Population: Alle Befragungspersonen ab 17 Jahren / All persons (age 17 and older)
Westdeutschland / West Germany
Jahr / Year Groß / Great Einige / Some Keine / None Total 1984 {AP5402} 18,39 42,30 39,32 100 1985 {BP7702} 18,73 43,49 37,78 100 1986 {CP7702} 15,56 40,39 44,06 100 1987 {DP8902} 15,25 44,33 40,42 100 1988 {EP7802} 15,38 44,34 40,28 100 1989 {FP9402} 12,63 42,62 44,75 100 1990 {GP8602} 12,59 41,30 46,11 100 1991 {HP9102} 10,73 42,74 46,53 100 1992 {IP9102} 13,39 47,25 39,36 100 1993 {JP9102} 14,30 49,22 36,48 100 1994 {KP9302} 17,42 49,37 33,22 100 1995 {LP9902} 15,87 47,62 36,50 100 1996 {MP10902} 15,33 51,92 32,75 100 1997 {NP9502} 18,38 53,47 28,15 100 1998 {OP9802} 21,33 50,15 28,52 100 1999 {PP10902} 15,99 48,57 35,44 100 2000 {QP11802} 14,99 45,57 39,44 100 2001 {RP11402} 14,51 45,61 39,88 100 2002 {SP11302} 17,19 49,98 32,83 100 2003 {TP12002} 22,32 49,96 27,72 100 2004 {UP12502} 24,87 50,87 24,26 100 2005 {VP13102} 25,50 50,65 23,85 100 2006 {WP12102} 26,27 48,23 25,50 100 2007 {XP13002} 23,49 48,91 27,60 100 2008 {YP13202} 20,29 50,11 29,60 100 2009 {ZP12802} 22,83 52,75 24,42 100 2010 {BAP13002} 22,88 49,29 27,82 100 2011 {BBP13102} 17,80 47,62 34,57 100 2012 {BCP12702} 18,55 47,20 34,25 100 2013 {BDP13302} 14,92 46,80 38,28 100

SOEP Survey Papers 284 108 v30
Sorgen um die eigene wirtschaftliche Entwicklung (Ostdeutschland), in % /
Concerns about own economic development (East Germany), in % Population: Alle Befragungspersonen ab 17 Jahren / All persons (age 17 and older)
Ostdeutschland / East Germany
Jahr / Year Groß / Great Einige / Some Keine / None Total 1991 {HP9102} 37,79 50,69 11,52 100 1992 {IP9102} 30,60 55,18 14,22 100 1993 {JP9102} 27,97 54,29 17,74 100 1994 {KP9302} 25,18 57,65 17,17 100 1995 {LP9902} 23,85 55,08 21,07 100 1996 {MP10902} 22,89 55,35 21,75 100 1997 {NP9502} 25,82 58,33 15,84 100 1998 {OP9802} 30,55 51,92 17,53 100 1999 {PP10902} 21,59 56,15 22,26 100 2000 {QP11802} 23,36 51,39 25,25 100 2001 {RP11402} 24,52 49,84 25,64 100 2002 {SP11302} 28,12 51,75 20,13 100 2003 {TP12002} 32,75 50,26 16,98 100 2004 {UP12502} 36,39 49,84 13,77 100 2005 {VP13102} 36,32 49,40 14,28 100 2006 {WP12102} 32,51 50,69 16,80 100 2007 {XP13002} 32,77 50,25 16,98 100 2008 {YP13202} 28,70 53,75 17,55 100 2009 {ZP12802} 30,11 53,96 15,93 100 2010 {BAP13002} 27,67 51,86 20,47 100 2011 {BBP13102} 26,84 49,78 23,38 100 2012 {BCP12702} 24,56 52,54 22,90 100 2013 {BDP13302} 21,81 51,15 27,05 100

SOEP Survey Papers 284 109 v30
Veränderung der Lebenszufriedenheit gegenüber dem Vorjahr (Westdeutschland)
Change in life satisfaction since previous year (West Germany) Population: Alle Befragungspersonen ab 17 Jahren (Längsschnitt ) /
All persons (age 17 and older) (longitudinal) Westdeutschland / West Germany
Jahr / Year gleich / similar
mehr / more satisfied
weniger / less
satisfied
Total
1984/85 {AP6801}{BP9301} 28,09 31,28 40,63 100 1985/86 {BP9301}{CP9601} 30,78 34,84 34,38 100 1986/87 {CP9601}{DP9801} 30,39 29,78 39,83 100 1987/88 {DP9801}{EP89} 31,86 31,20 36,94 100 1988/89 {EP89}{FP108} 31,32 35,27 33,41 100 1989/90 {FP108}{GP109} 34,37 36,05 29,58 100 1990/91 {GP109}{HP10901} 35,46 34,27 30,27 100 1991/92 {HP10901}{IP10901} 35,65 29,28 35,07 100 1992/93 {IP10901}{JP10901} 35,62 29,74 34,63 100 1993/94 {JP10901}{KP10401} 34,91 28,78 36,31 100 1994/95 {KP10401}{LP10401} 36,93 29,93 33,14 100 1995/96 {LP10401}{MP11001} 37,79 31,56 30,65 100 1996/97 {MP11001}{NP11701} 36,80 27,93 35,27 100 1997/98 {NP11701}{OP12301} 36,10 32,56 31,34 100 1998/99 {OP12301}{PP13501} 34,97 33,60 31,43 100 1999/2000 {PP13501}{QP14301} 37,11 29,55 33,33 100 2000/01 {QP14301}{RP13501} 35,50 32,53 31,97 100 2001/02 {RP13501}{SP13501} 36,08 25,58 38,34 100 2002/03 {SP13501}{TP14201} 37,89 29,71 32,40 100 2003/04 {TP14201}{UP14501} 35,24 27,36 37,40 100 2004/05 {UP14501}{VP154} 33,77 36,39 29,84 100 2005/06 {VP154}{WP142} 35,53 28,12 36,35 100 2006/07 {WP142}{XP149} 35,79 32,37 31,84 100 2007/08 {XP149}{YP15501} 37,38 30,81 31,80 100 2008/09 {YP15501}{ZP15701} 36,46 28,86 34,68 100 2009/10 {ZP15701}{BAP160} 35,92 35,73 28,35 100 2010/11 {BAP160}{BBP15201} 36,04 27,39 36,58 100 2011/12 {BBP15201}{BCP151} 36,80 32,76 30,44 100 2012/13 {BCP151}{BDP15801} 37,45 31,96 30,58 100

SOEP Survey Papers 284 110 v30
Veränderung der Lebenszufriedenheit gegenüber dem Vorjahr (Ostdeutschland)
Change in life satisfaction since previous year (East Germany) Population: Alle Befragungspersonen ab 17 Jahren (Längsschnitt ) /
All persons (age 17 and older) (longitudinal) Ostdeutschland / East Germany
Jahr / Year gleich / similar
mehr / more satisfied
weniger / less satisfied
Total
1991/92 {HP10901}{IP10901} 29,16 35,07 35,77 100 1992/93 {IP10901}{JP10901} 28,98 37,86 33,16 100 1993/94 {JP10901}{KP10401} 30,56 34,96 34,48 100 1994/95 {KP10401}{LP10401} 31,42 37,18 31,39 100 1995/96 {LP10401}{MP11001} 33,93 32,88 33,19 100 1996/97 {MP11001}{NP11701} 31,51 31,12 37,37 100 1997/98 {NP11701}{OP12301} 32,84 35,57 31,59 100 1998/99 {OP12301}{PP13501} 35,23 34,28 30,49 100 1999/2000 {PP13501}{QP14301} 34,39 29,94 35,67 100 2000/01 {QP14301}{RP13501} 32,51 33,28 34,21 100 2001/02 {RP13501}{SP13501} 35,25 27,28 37,47 100 2002/03 {SP13501}{TP14201} 35,54 29,84 34,61 100 2003/04 {TP14201}{UP14501} 35,08 26,92 38,01 100 2004/05 {UP14501}{VP154} 33,63 38,11 28,26 100 2005/06 {VP154}{WP142} 33,57 29,09 37,34 100 2006/07 {WP142}{XP149} 34,21 35,04 30,74 100 2007/08 {XP149}{YP15501} 35,17 34,52 30,31 100 2008/09 {YP15501}{ZP15701} 34,13 30,20 35,68 100 2009/10 {ZP15701}{BAP160} 36,28 36,18 27,54 100 2010/11 {BAP160}{BBP15201} 37,01 27,11 35,87 100 2011/12 {BBP15201}{BCP151} 36,32 30,95 32,73 100 2012/13 {BCP151}{BDP15801} 33,77 34,48 31,75 100

SOEP Survey Papers 284 111 v30
Veränderung der Arbeitszufriedenheit gegenüber dem Vorjahr (Westdeutschland)
Change in satisfaction with work since previous year (West Germany) Population: Alle Befragungspersonen ab 17 Jahren (Längsschnitt ) /
All persons (age 17 and older) (longitudinal) Westdeutschland / West Germany
Jahr / Year gleich / similar
mehr / more satisfied
weniger / less satisfied
Total
1984/85{AP0304}{BP0104} 28,47 31,29 40,25 100 1985/86{BP0104}{CP0104} 29,62 30,85 39,53 100 1986/87{CP0104}{DP0105} 30,42 34,31 35,27 100 1987/88{DP0105}{EP0104} 29,32 30,29 40,39 100 1988/89{EP0104}{FP0105} 31,20 32,32 36,49 100 1989/90{FP0105}{GP0105} 32,17 32,56 35,27 100 1990/91{GP0105}{HP1002} 30,95 32,59 36,47 100 1991/92{HP1002}{IP9802} 30,03 38,32 31,65 100 1992/93{IP9802}{JP0102} 30,35 27,77 41,89 100 1993/94{JP0102}{KP0102} 30,80 31,17 38,02 100 1994/95{KP0102}{LP0102} 31,19 32,78 36,03 100 1995/96{LP0102}{MP0102} 32,31 32,84 34,86 100 1996/97{MP0102}{NP0102} 31,84 31,32 36,84 100 1997/98{NP0102}{OP0102} 31,02 32,27 36,70 100 1998/99{OP0102}{PP0102} 30,26 32,91 36,82 100 1999/2000{PP0102}{QP0102} 29,81 34,87 35,31 100 2000/01{QP0102}{RP0102} 30,10 33,86 36,04 100 2001/02{RP0102}{SP0102} 32,91 28,69 38,40 100 2002/03{SP0102}{TP0102} 32,29 32,38 35,33 100 2003/04{TP0102}{UP0102} 31,00 30,84 38,16 100 2004/05{UP0102}{VP0102} 30,64 32,28 37,09 100 2005/06{VP0102}{WP0102} 29,34 32,04 38,62 100 2006/07{WP0102}{XP0102} 29,20 34,19 36,62 100 2007/08{XP0102}{YP0103} 29,89 32,90 37,21 100 2008/09{XP0103}{ZP0103} 29,78 32,98 37,24 100 2009/10{ZP0103}{BAP0103} 29,06 35,28 35,67 100 2010/11{BAP0103}{BBP0103} 30,86 34,20 34,94 100 2011/12{BBP0103}{BCP0103} 31,48 33,15 35,37 100 2012/13{BCP0103}{BDP0103} 31,20 32,16 36,64 100
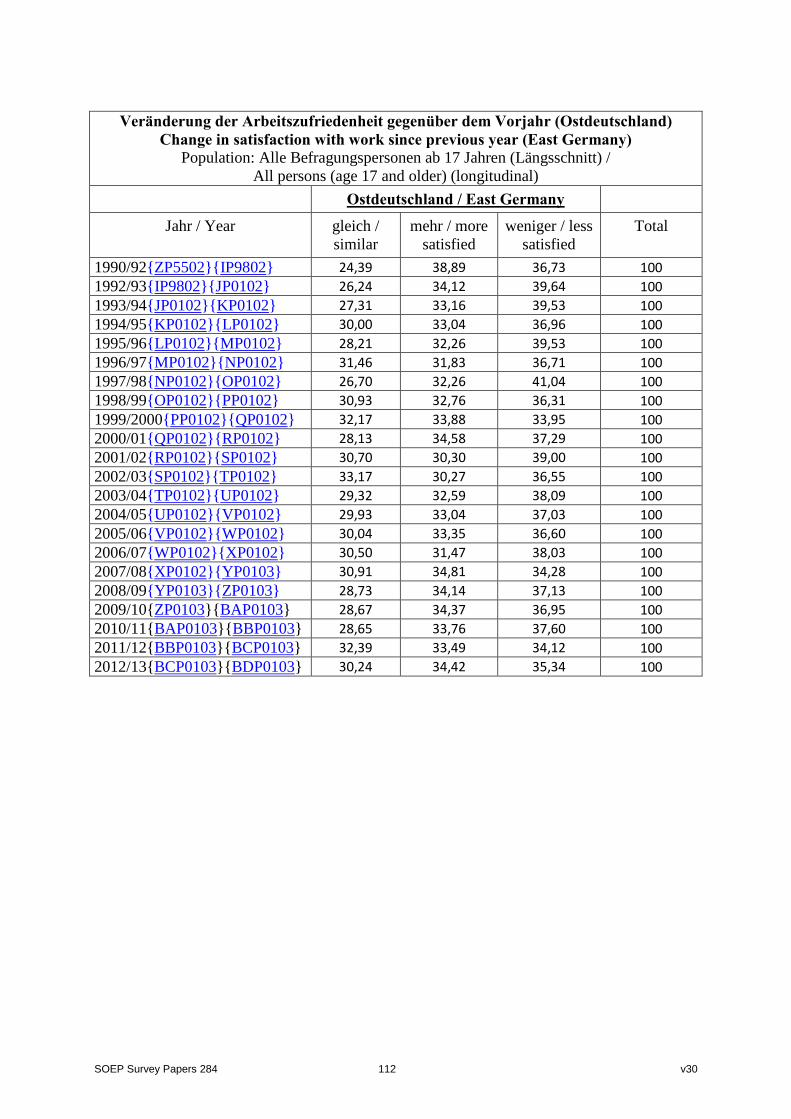
SOEP Survey Papers 284 112 v30
Veränderung der Arbeitszufriedenheit gegenüber dem Vorjahr (Ostdeutschland)
Change in satisfaction with work since previous year (East Germany) Population: Alle Befragungspersonen ab 17 Jahren (Längsschnitt) /
All persons (age 17 and older) (longitudinal) Ostdeutschland / East Germany
Jahr / Year gleich / similar
mehr / more satisfied
weniger / less satisfied
Total
1990/92{ZP5502}{IP9802} 24,39 38,89 36,73 100 1992/93{IP9802}{JP0102} 26,24 34,12 39,64 100 1993/94{JP0102}{KP0102} 27,31 33,16 39,53 100 1994/95{KP0102}{LP0102} 30,00 33,04 36,96 100 1995/96{LP0102}{MP0102} 28,21 32,26 39,53 100 1996/97{MP0102}{NP0102} 31,46 31,83 36,71 100 1997/98{NP0102}{OP0102} 26,70 32,26 41,04 100 1998/99{OP0102}{PP0102} 30,93 32,76 36,31 100 1999/2000{PP0102}{QP0102} 32,17 33,88 33,95 100 2000/01{QP0102}{RP0102} 28,13 34,58 37,29 100 2001/02{RP0102}{SP0102} 30,70 30,30 39,00 100 2002/03{SP0102}{TP0102} 33,17 30,27 36,55 100 2003/04{TP0102}{UP0102} 29,32 32,59 38,09 100 2004/05{UP0102}{VP0102} 29,93 33,04 37,03 100 2005/06{VP0102}{WP0102} 30,04 33,35 36,60 100 2006/07{WP0102}{XP0102} 30,50 31,47 38,03 100 2007/08{XP0102}{YP0103} 30,91 34,81 34,28 100 2008/09{YP0103}{ZP0103} 28,73 34,14 37,13 100 2009/10{ZP0103}{BAP0103} 28,67 34,37 36,95 100 2010/11{BAP0103}{BBP0103} 28,65 33,76 37,60 100 2011/12{BBP0103}{BCP0103} 32,39 33,49 34,12 100 2012/13{BCP0103}{BDP0103} 30,24 34,42 35,34 100

SOEP Survey Papers 284 113 v30
Veränderung der Einkommenszufriedenheit gegenüber Vorjahr (Westdeutschland)
Change in satisfaction with income since previous year (West Germany) Population: Alle Befragungspersonen ab 17 Jahren (Längsschnitt ) /
All persons (age 17 and older) (longitudinal) Westdeutschland / West Germany
Jahr / Year gleich / similar
mehr / more satisfied
weniger / less satisfied
Total
1984/85 {AP0302}{BP0102} 24,20 37,94 37,85 100 1985/86 {BP0102}{CP0102} 26,66 37,75 35,58 100 1986/87 {CP0102}{DP0102} 27,28 36,40 36,32 100 1987/88 {DP0102}{EP0102} 28,15 35,37 36,48 100 1988/89 {EP0102}{FP0102} 29,81 36,29 33,89 100 1989/90 {FP0102}{GP0102} 30,55 36,45 33,00 100 1990/91 {GP0102}{HP0104} 29,62 39,73 30,65 100 1991/92 {HP0104}{IP9804} 30,41 31,42 38,17 100 1992/93 {IP9804}{JP0104} 30,52 32,40 37,08 100 1993/94 {JP0104}{KP0104} 29,70 31,59 38,70 100 1994/95 {KP0104}{LP0104} 30,69 35,93 33,38 100 1995/96 {LP0104}{MP0104} 31,68 35,85 32,47 100 1996/97 {MP0104}{NP0104} 30,83 30,13 39,04 100 1997/98 {NP0104}{OP0104} 28,69 37,57 33,74 100 1998/99 {OP0104}{PP0104} 29,53 36,71 33,76 100 1999/2000 {PP0104}{QP0104} 32,15 36,79 31,05 100 2000/01 {QP0104}{RP0104} 30,42 36,22 33,35 100 2001/02 {RP0104}{SP0104} 30,95 29,99 39,06 100 2002/03 {SP0104}{TP0104} 31,93 32,36 35,72 100 2003/04 {TP0104}{UP0104} 31,40 30,75 37,85 100 2004/05 {UP0104}{VP0104} 30,70 34,32 34,98 100 2005/06 {VP0104}{WP0104} 31,07 32,82 36,11 100 2006/07 {WP0104}{XP0104} 30,62 35,19 34,19 100 2007/08 {XP0104}{YP0105} 32,42 33,69 33,89 100 2008/09 {YP0105}{ZP0105} 31,93 35,07 33,00 100 2009/10 {ZP0105}{BAP0105} 32,10 35,05 32,84 100 2010/11 {BAP0105}{BBP0105} 31,54 37,12 31,34 100 2011/12 {BBP0105}{BCP0105} 31,91 34,84 33,25 100 2012/13 {BCP0105}{BDP0105} 32,51 35,40 32,09 100

SOEP Survey Papers 284 114 v30
Veränderung der Einkommenszufriedenheit gegenüber Vorjahr (Ostdeutschland)
Change in satisfaction with income since previous year (East Germany) Population: Alle Befragungspersonen ab 17 Jahren (Längsschnitt ) /
All persons (age 17 and older) (longitudinal) Ostdeutschland / East Germany
Jahr / Year gleich / similar
mehr / more satisfied
weniger / less satisfied
Total
1990/92 {ZP5504}{IP9804} 21,75 41,66 36,59 100 1992/93 {IP9804}{JP0104} 22,17 46,55 31,27 100 1993/94 {JP0104}{KP0104} 23,32 39,30 37,38 100 1994/95 {KP0104}{LP0104} 24,11 40,22 35,67 100 1995/96 {LP0104}{MP0104} 27,59 38,04 34,37 100 1996/97 {MP0104}{NP0104} 26,64 31,81 41,56 100 1997/98 {NP0104}{OP0104} 27,68 39,14 33,17 100 1998/99 {OP0104}{PP0104} 29,88 37,18 32,94 100 1999/2000 {PP0104}{QP0104} 28,42 40,48 31,10 100 2000/01 {QP0104}{RP0104} 26,18 37,62 36,20 100 2001/02 {RP0104}{SP0104} 26,71 30,87 42,42 100 2002/03 {SP0104}{TP0104} 28,29 33,89 37,83 100 2003/04 {TP0104}{UP0104} 27,34 32,54 40,12 100 2004/05 {UP0104}{VP0104} 26,83 39,83 33,34 100 2005/06 {VP0104}{WP0104} 27,29 33,65 39,06 100 2006/07 {WP0104}{XP0104} 27,46 39,36 33,19 100 2007/08 {XP0104}{YP0105} 28,26 36,24 35,50 100 2008/09 {YP0105}{ZP0105} 27,89 38,62 33,49 100 2009/10 {ZP0105}{BAP0105} 28,80 38,95 32,24 100 2010/11 {BAP0105}{BBP0105} 27,56 38,86 33,58 100 2011/12 {BBP0105}{BCP0105} 31,14 36,07 32,79 100 2012/13 {BCP0105}{BDP0105} 29,96 38,16 31,87 100

SOEP Survey Papers 284 115 v30
VII. Bevölkerung in Privathaushalten - Population in private households
Lebensformtypologie (Westdeutschland) , in %34
Life status typology (West Germany), in % Population: Alle Personen in privaten Haushalten / All persons in private households
Westdeutschland / West Germany Jahr / Year
Kind bis 16 Jahre / Child (up to age 16)
Herkunfts-familie / Family
of origin
Allein-lebend / Single
Allein-erziehend / Single parent
Kohabi-tation / Cohabiting
Kern-familie / Nuclear family
Kohabitation post-familial / Post-
familial cohabiting
Allein-lebend post-familial /
Postfamilial Single
Sonstige / Other
Total
1984 16,81 11,18 5,61 2,62 6,89 29,91 13,45 9,00 4,53 100 1985 15,81 11,85 5,58 2,02 7,35 28,39 13,42 9,09 6,48 100 1986 15,69 11,85 6,40 2,64 7,43 28,26 13,20 9,56 4,97 100 1987 16,11 11,06 6,48 2,60 7,51 28,37 13,15 9,64 5,08 100 1988 16,03 11,23 6,61 2,60 7,73 27,90 13,35 9,68 4,88 100 1989 16,04 11,03 6,88 2,66 7,90 27,53 13,16 9,61 5,20 100 1990 16,38 10,54 6,91 2,88 7,53 27,46 13,48 9,55 5,29 100 1991 16,95 9,79 6,90 2,29 10,61 28,07 14,09 9,61 1,69 100 1992 17,20 9,22 6,85 2,22 10,66 28,07 14,38 9,74 1,65 100 1993 17,14 8,95 7,33 2,14 10,71 27,71 14,52 9,80 1,70 100 1994 17,51 8,36 7,29 2,07 10,75 27,29 14,93 10,11 1,70 100 1995 17,69 8,03 7,10 2,00 10,71 27,02 15,74 9,98 1,72 100 1996 17,63 7,94 7,61 2,18 10,39 26,54 16,48 9,85 1,38 100 1997 17,67 7,84 7,37 2,37 10,08 26,24 16,80 10,25 1,38 100 1998 17,42 7,98 7,32 2,51 9,99 26,17 17,49 9,96 1,17 100 1999 17,37 7,98 6,94 2,36 10,26 26,01 17,84 10,17 1,05 100 2000 17,24 7,62 7,99 2,19 9,97 25,91 18,55 9,36 1,19 100 2001 17,26 7,73 8,21 2,40 9,91 25,37 18,54 9,34 1,23 100 2002 17,33 7,55 8,12 2,65 9,73 25,00 18,85 9,50 1,26 100 2003 17,09 7,97 8,06 2,77 9,60 24,88 18,81 9,74 1,08 100 2004 16,83 8,09 8,14 2,62 9,67 24,46 19,20 9,85 1,14 100 2005 16,14 8,57 8,60 2,94 9,84 24,35 18,95 9,59 1,02 100 2006 16,12 8,42 8,96 2,76 9,83 23,89 18,98 9,97 1,08 100 2007 15,79 8,73 8,92 2,84 9,77 23,63 19,32 10,08 0,91 100 2008 15,26 9,25 9,03 2,83 9,85 23,06 19,40 10,52 0,80 100 2009 14,77 9,76 9,05 2,61 10,14 22,40 19,53 10,95 0,79 100 2010 14,78 9,85 9,11 2,63 10,11 21,68 19,95 11,08 0,83 100 2011 14,54 9,55 9,36 2,37 10,65 21,54 20,31 10,72 0,97 100 2012 14,56 9,34 9,24 2,63 10,26 20,08 18,55 10,68 4,66 100 2013 15,11 8,37 10,05 2,70 9,47 20,63 19,28 10,69 3,69 100
34 Der Bruch in der Zeitreihe ab 1991 ist auf die verbesserte Erhebung von Informationen zur Definition nicht-ehelicher Lebensgemeinschaften zurück zu führen.

SOEP Survey Papers 284 116 v30
Lebensformtypologie (Ostdeutschland) , in %35
Life status typology (East Germany), in % Population: Alle Personen in privaten Haushalten / All persons in private households
Ostdeutschland / East Germany Jahr / Year
Kind bis 16 Jahre / Child
(up to age 16)
Herkunfts-familie /
Family of origin
Allein-lebend / Single
Allein-erziehend /
Single parent
Kohabi-tation /
Cohabiting
Kern-familie / Nuclear
family
Kohabitation post-familial /
Postfamilial cohabiting
Allein-lebend post-familial / Postfamilial
Single
Sonstige / Other
Total
1990 21,83 7,86 3,14 2,23 7,38 28,95 12,72 6,80 9,07 100 1991 18,73 7,56 4,60 2,40 9,34 31,66 15,04 8,31 2,34 100 1992 18,04 7,36 5,20 2,60 8,93 30,87 16,80 8,53 1,68 100 1993 17,86 7,33 5,01 2,35 8,74 30,67 17,56 8,74 1,74 100 1994 17,33 7,17 5,62 2,31 9,13 29,32 18,35 9,11 1,66 100 1995 16,75 7,18 5,40 2,41 9,45 27,95 19,69 9,68 1,48 100 1996 16,51 7,29 6,04 2,48 8,88 27,62 19,94 9,69 1,54 100 1997 15,86 7,67 6,06 2,87 9,27 26,63 20,07 10,10 1,46 100 1998 15,70 7,55 6,47 2,99 8,68 27,10 20,66 9,84 1,01 100 1999 15,09 8,06 7,07 3,34 8,79 25,49 20,60 10,49 1,06 100 2000 14,72 8,55 7,23 2,99 8,05 24,92 21,54 10,91 1,08 100 2001 14,08 8,75 7,82 3,10 8,26 24,17 21,61 11,18 1,02 100 2002 13,45 9,25 8,48 3,28 8,06 23,34 22,11 11,04 1,00 100 2003 13,05 9,26 8,47 3,07 8,18 23,03 22,70 11,11 1,12 100 2004 12,59 9,73 8,96 3,46 8,27 22,42 22,81 10,78 0,98 100 2005 12,48 9,44 9,34 3,56 8,96 22,83 22,16 10,38 0,86 100 2006 11,77 9,01 10,78 3,28 9,64 21,91 22,08 10,73 0,79 100 2007 10,95 9,69 10,81 3,42 9,90 21,36 22,62 10,44 0,82 100 2008 11,65 9,28 11,21 3,69 10,52 19,90 22,80 10,27 0,67 100 2009 12,49 9,10 10,76 3,77 10,59 19,75 22,61 10,37 0,55 100 2010 12,98 8,44 11,77 3,50 9,96 19,18 23,45 10,13 0,59 100 2011 12,87 7,76 11,86 3,51 9,89 18,52 23,72 11,04 0,83 100 2012 12,46 6,91 12,16 3,60 9,09 16,95 23,43 11,51 3,88 100 2013 12,54 6,83 11,65 3,33 9,26 17,43 23,79 11,79 3,37 100
35 Der Bruch in der Zeitreihe ab 1991 ist auf die verbesserte Erhebung von Informationen zur Definition nicht-ehelicher Lebensgemeinschaften zurück zu führen.

SOEP Survey Papers 284 117 v30
Altersklasse im Befragungsjahr (Westdeutschland), in % {GEBJAHR}
Age classification (West Germany), in % Population: Alle Personen in privaten Haushalten / All persons in private households
Westdeutschland / West Germany
Jahr / Year 0 - 4 J 5 - 9 J 10 – 14 J 15 – 19 J 20 – 24 J 25 – 29 J 30 – 34 J 35 – 39 J 40 – 44 J 1984 6,29 6,50 7,78 9,48 7,96 7,77 7,21 7,21 8,17
1985 5,73 6,75 7,46 9,19 8,46 7,81 7,12 7,75 7,26
1986 5,58 6,93 6,95 9,10 9,02 7,63 7,50 7,77 6,96
1987 5,48 7,16 6,59 8,75 9,08 7,77 7,58 7,74 6,67
1988 5,63 7,01 6,54 8,33 9,24 7,87 7,61 7,31 6,87
1989 6,00 6,66 6,58 7,60 9,41 8,59 7,55 7,11 6,78
1990 6,15 6,58 6,69 7,18 8,84 9,04 7,65 7,07 7,30
1991 6,36 6,43 6,67 6,88 8,64 9,57 7,64 6,93 7,50
1992 6,60 6,32 6,88 6,41 8,33 9,88 7,70 7,22 7,23
1993 6,34 6,64 6,73 6,13 8,16 10,09 7,97 7,37 6,89
1994 6,42 7,29 6,67 5,90 7,44 10,33 8,99 7,42 6,47
1995 6,24 7,75 6,74 6,06 6,86 10,05 9,55 7,92 6,61
1996 6,28 7,58 6,70 6,12 6,46 9,36 10,31 8,02 6,73
1997 6,20 7,56 6,84 6,36 5,71 9,05 10,45 8,16 6,87
1998 6,16 7,08 6,74 6,12 5,54 8,07 10,21 8,43 7,15
1999 6,06 7,17 7,11 6,06 5,43 7,59 10,07 8,87 7,25
2000 5,61 6,88 7,17 6,09 5,03 5,95 8,64 8,94 8,03
2001 5,56 6,87 7,31 6,16 5,20 5,45 8,11 9,19 8,15
2002 4,82 6,55 7,43 6,47 5,34 4,67 7,01 8,93 8,43
2003 4,69 6,74 7,04 6,54 5,43 4,78 6,77 8,91 8,37
2004 4,33 6,46 7,05 6,52 5,42 4,94 6,32 8,64 8,55
2005 4,08 6,26 6,92 6,80 5,42 5,12 5,87 8,35 8,71
2006 4,11 6,13 6,67 6,56 5,26 5,04 5,29 7,82 8,82
2007 3,99 5,89 6,47 6,60 5,33 5,16 5,00 7,40 9,00
2008 3,82 5,47 6,56 6,26 5,28 5,20 4,83 6,92 8,77
2009 4,08 5,06 6,57 6,35 5,10 5,07 4,86 6,24 8,60
2010 3,78 4,97 6,33 6,08 5,12 4,82 4,94 5,68 8,21
2011 3,74 4,82 6,01 6,10 5,10 4,66 4,90 5,31 7,45
2012 3,70 4,82 5,99 6,01 5,17 4,54 4,87 5,09 7,17
2013 5,40 6,63 6,56 6,26 5,64 5,50 6,39 6,41 7,22

SOEP Survey Papers 284 118 v30
Altersklasse im Befragungsjahr (Westdeutschland), in % {GEBJAHR}
Age classification (West Germany), in % Population: Alle Personen in privaten Haushalten / All persons in private households
Westdeutschland / West Germany
Jahr / Year 45 – 49 J 50 – 54 J 55 – 59 J 60 – 64 J 65 – 69 J 70 – 74 J 75 – 79 J 80 u.m.J. Total 1984 7,87 5,84 5,39 4,21 2,19 2,69 1,93 1,52 100 1985 8,19 5,96 5,56 4,36 2,27 2,67 1,99 1,47 100 1986 8,58 6,00 5,59 4,02 2,66 2,37 1,93 1,43 100 1987 8,42 6,48 5,44 4,18 2,97 2,19 1,91 1,59 100 1988 7,88 7,06 5,41 4,43 3,28 2,01 1,88 1,63 100 1989 7,54 7,33 5,33 4,62 3,45 1,84 1,86 1,73 100 1990 6,50 7,62 5,18 4,86 3,67 1,94 1,88 1,84 100 1991 6,09 7,77 5,20 4,85 3,61 2,24 1,75 1,86 100 1992 5,99 7,43 5,67 4,70 3,68 2,53 1,52 1,91 100 1993 6,16 6,92 6,15 4,53 3,78 2,79 1,46 1,91 100 1994 6,20 6,45 6,30 4,26 3,76 2,93 1,25 1,93 100 1995 6,53 5,38 6,74 4,02 3,67 2,95 1,23 1,70 100 1996 6,74 5,15 6,63 4,20 3,75 2,87 1,57 1,54 100 1997 6,68 5,09 6,37 4,64 3,67 2,91 1,82 1,62 100 1998 6,44 5,35 6,47 5,43 3,89 3,17 2,09 1,66 100 1999 6,20 5,56 6,05 5,76 3,76 3,17 2,32 1,59 100 2000 6,62 6,27 5,61 6,66 4,19 3,74 2,67 1,88 100 2001 6,76 6,39 5,07 6,76 4,41 3,73 2,76 2,11 100 2002 7,76 7,13 5,66 6,85 4,79 3,54 2,64 2,00 100 2003 7,70 6,83 5,62 6,58 5,38 3,61 2,75 2,26 100 2004 7,84 6,83 5,82 6,52 5,82 3,66 2,84 2,44 100 2005 7,71 6,96 6,24 5,91 6,27 3,75 3,04 2,59 100 2006 7,77 6,96 6,90 5,59 6,90 4,07 3,13 2,97 100 2007 7,69 7,19 6,87 5,69 6,92 4,68 3,04 3,08 100 2008 8,13 7,33 6,90 5,79 7,02 5,26 3,18 3,28 100 2009 8,31 7,47 6,86 6,09 6,94 5,69 3,32 3,37 100 2010 8,43 7,65 7,20 6,71 6,53 6,29 3,58 3,68 100 2011 8,60 8,04 7,24 7,19 6,00 6,93 3,94 3,97 100 2012 8,56 8,03 7,35 7,09 6,08 7,04 4,51 3,97 100 2013 8,01 7,26 6,35 5,71 4,82 5,23 3,58 3,03 100

SOEP Survey Papers 284 119 v30
Altersklasse im Befragungsjahr (Ostdeutschland), in % {GEBJAHR}
Age classification (East Germany), in % Population: Alle Personen in privaten Haushalten / All persons in private households
Ostdeutschland / East Germany
Jahr / Year 0 - 4 J 5 - 9 J 10 – 14 J 15 – 19 J 20 – 24 J 25 – 29 J 30 – 34 J 35 – 39 J 40 – 44 J 1990 6,87 8,61 8,36 6,58 6,37 8,60 9,23 8,31 6,63 1991 6,15 8,21 8,91 6,41 6,70 7,38 9,52 8,55 7,56 1992 5,20 8,22 9,08 6,51 6,27 7,30 9,00 8,89 7,77 1993 4,38 8,14 9,16 6,86 6,51 6,74 9,06 8,96 7,88 1994 3,37 8,22 8,52 7,77 6,24 6,68 8,68 9,17 7,90 1995 2,94 7,50 8,62 8,10 6,26 6,85 8,29 8,96 8,02 1996 3,01 6,88 8,09 8,26 5,90 7,34 7,58 9,27 8,15 1997 2,97 5,78 8,40 8,01 6,06 7,46 7,24 8,79 8,55 1998 3,23 5,01 8,00 8,29 6,22 6,96 7,05 8,89 8,62 1999 3,20 4,08 8,31 7,99 6,60 6,47 7,26 8,61 8,97 2000 3,38 3,46 7,87 8,17 6,75 5,31 6,68 8,29 9,02 2001 3,43 3,31 7,25 7,90 6,80 5,43 6,54 7,80 8,92 2002 3,47 3,47 6,01 7,89 6,90 5,19 6,35 7,14 9,07 2003 3,48 3,57 5,11 7,73 7,03 5,57 6,12 6,75 8,72 2004 3,62 3,83 4,12 7,92 6,75 6,14 5,67 6,46 8,46 2005 4,15 3,89 3,49 7,74 6,42 6,30 5,61 6,20 8,34 2006 4,60 4,06 3,36 6,74 6,02 6,34 5,22 6,16 7,77 2007 4,42 4,22 3,44 5,84 6,30 5,98 5,54 6,23 7,35 2008 4,41 4,46 3,64 5,07 5,95 5,75 5,68 6,09 7,25 2009 4,48 4,73 4,07 3,82 6,23 5,20 5,61 5,61 6,91 2010 3,90 5,08 4,14 3,19 6,11 4,97 5,72 5,25 6,88 2011 4,22 5,36 3,97 3,13 5,70 4,71 5,68 5,13 6,11 2012 3,92 5,38 4,25 2,99 4,75 4,93 5,34 5,14 5,94 2013 3,92 5,50 4,94 3,82 3,84 4,94 5,50 5,81 5,85

SOEP Survey Papers 284 120 v30
Altersklasse im Befragungsjahr (Ostdeutschland), in % {GEBJAHR}
Age classification (East Germany), in % Population: Alle Personen in privaten Haushalten / All persons in private households
Ostdeutschland / East Germany
Jahr / Year 45 – 49 J 50 – 54 J 55 – 59 J 60 – 64 J 65 – 69 J 70 – 74 J 75 – 79 J 80 u.m.J. Total 1990 6,52 7,10 5,25 3,89 3,01 1,66 1,70 1,30 100 1991 5,86 7,23 5,63 4,28 2,90 2,05 1,46 1,19 100 1992 6,08 7,07 6,19 4,43 3,06 2,31 1,14 1,50 100 1993 5,82 6,70 6,47 4,99 3,18 2,56 1,02 1,55 100 1994 5,74 6,95 6,58 5,21 3,49 2,69 1,15 1,64 100 1995 6,31 6,47 6,89 5,37 3,68 2,71 1,42 1,61 100 1996 7,11 5,37 7,45 5,65 4,12 2,53 1,80 1,51 100 1997 7,29 5,98 6,92 6,22 4,23 2,66 2,03 1,42 100 1998 7,40 5,80 6,98 6,61 4,70 2,78 2,09 1,37 100 1999 7,50 5,70 7,01 6,73 5,06 2,97 2,01 1,52 100 2000 7,59 5,80 6,37 7,96 5,47 3,58 2,51 1,77 100 2001 7,90 6,48 5,90 7,95 6,22 4,03 2,11 2,05 100 2002 8,74 7,01 6,05 7,98 6,23 4,29 2,20 2,02 100 2003 9,00 7,27 5,81 7,71 7,03 4,33 2,42 2,33 100 2004 9,22 7,69 5,49 7,66 7,03 4,82 2,79 2,32 100 2005 9,29 7,64 5,95 6,89 7,74 5,04 2,85 2,46 100 2006 9,08 8,28 6,75 5,89 8,15 5,72 3,38 2,47 100 2007 8,77 8,76 7,00 5,89 8,20 5,81 3,59 2,66 100 2008 8,53 8,62 7,46 5,71 7,98 6,93 3,62 2,84 100 2009 8,33 9,00 8,33 5,51 7,87 7,16 3,92 3,23 100 2010 8,12 8,88 8,66 6,56 7,25 7,67 4,31 3,32 100 2011 7,88 8,93 8,98 7,45 6,23 7,90 4,86 3,74 100 2012 7,45 8,84 9,02 8,48 6,20 7,92 5,24 4,21 100 2013 7,71 8,39 8,72 8,63 5,47 7,31 5,49 4,16 100

SOEP Survey Papers 284 121 v30
VIII. Wohnsituation / Housing
Wohneigentümerquote (Anteil der Personen in selbstgenutztem Wohneigentum) / Rate of property (Share of persons living in owner-occupied property)
Population: Alle Personen in privaten Haushalten / All persons in private households
Jahr / Year Westdeutschland / West Germany
Ostdeutschland / East Germany
Total
1984 {OWNER84} 46,60 - 46,60 1985 {OWNER85} 46,91 - 46,91 1986 {OWNER86} 46,69 - 46,69 1987 {OWNER87} 46,45 - 46,45 1988 {OWNER88} 46,49 - 46,49 1989 {OWNER89} 46,93 - 46,93 1990 {OWNER90} 46,60 29,76 43,11 1991 {OWNER91} 46,54 29,61 43,04 1992 {OWNER92} 47,05 29,11 43,41 1993 {OWNER93} 47,35 30,93 44,06 1994 {OWNER94} 47,80 31,13 44,51 1995 {OWNER95} 48,12 32,67 45,17 1996 {OWNER96} 48,43 32,91 45,51 1997 {OWNER97} 49,10 34,13 46,30 1998 {OWNER98} 49,46 36,81 47,08 1999 {OWNER99} 50,26 36,98 47,82 2000 {OWNER00} 49,76 39,08 47,77 2001 {OWNER01} 49,77 40,05 47,99 2002 {OWNER02} 50,33 39,77 48,41 2003 {OWNER03} 49,61 40,60 47,98 2004 {OWNER04} 49,19 39,36 47,43 2005 {OWNER05} 48,13 38,92 46,48 2006 {OWNER06} 48,36 37,94 46,32 2007 {OWNER07} 49,10 38,49 47,03 2008 {OWNER08} 50,08 39,16 47,99 2009 {OWNER09} 50,57 40,58 48,64 2010 {OWNER10} 51,44 41,20 49,50 2011 {OWNER11} 52,56 39,71 50,06 2012 {OWNER12} 52,43 39,83 49,99 2012 {OWNER13} 51,89 42,01 50,00

SOEP Survey Papers 284 122 v30
Wohnfläche in qm pro Kopf / Housing space in square meter per capita
Population: Alle Personen in privaten Haushalten / All persons in private households
Jahr / Year Westdeutschland / West Germany
Ostdeutschland / East Germany
Total
1984 {SIZE84}{AHHGR} 35,73 - 35,73 1985 {SIZE85}{BHHGR} 36,25 - 36,25 1986 {SIZE86}{CHHGR} 36,76 - 36,76 1987 {SIZE87}{DHHGR} 37,08 - 37,08 1988 {SIZE88}{EHHGR} 37,79 - 37,79 1989 {SIZE89}{FHHGR} 38,27 - 38,27 1990 {SIZE90}{GHHGR} 38,24 26,68 35,84 1991 {SIZE91}{HHHGR} 38,63 27,61 36,36 1992 {SIZE92}{IHHGR} 38,76 28,53 36,69 1993 {SIZE93}{JHHGR} 39,34 29,28 37,32 1994 {SIZE94}{KHHGR} 39,88 29,58 37,84 1995 {SIZE95}{LHHGR} 40,07 30,62 38,26 1996 {SIZE96}{MHHGR} 40,78 31,74 39,08 1997 {SIZE97}{NHHGR} 41,04 32,36 39,42 1998 {SIZE98}{OHHGR} 41,89 34,66 40,53 1999 {SIZE99}{PHHGR} 42,18 35,63 40,98 2000 {SIZE00}{QHHGR} 43,04 35,99 41,72 2001 {SIZE01}{RHHGR} 43,31 36,99 42,15 2002 {SIZE02}{SHHGR} 43,28 36,81 42,10 2003 {SIZE03}{THHGR} 43,25 37,34 42,18 2004 {SIZE04}{UHHGR} 43,91 37,54 42,77 2005 {SIZE05}{VHHGR} 44,19 37,92 43,06 2006 {SIZE06}{WHHGR} 44,74 38,85 43,58 2007 {SIZE07}{XHHGR} 45,40 39,38 44,23 2008 {SIZE08}{YHHGR} 46,10 39,85 44,90 2009 {SIZE09}{ZHHGR} 46,92 39,80 45,55 2010 {SIZE10}{BAHHGR} 47,43 41,14 46,24 2011 {SIZE11}{BBHHGR} 47,46 41,45 46,29 2012 {SIZE12}{BCHHGR} 47,65 42,12 46,58 2013 {SIZE13}{BDHHGR} 47,51 42,15 46,48

SOEP Survey Papers 284 123 v30
Zahl der Wohnräume (> 6 qm) pro Kopf / Number of rooms (>6 sqm) per capita Population: Alle Personen in privaten Haushalten / All persons in private households
Jahr / Year Westdeutschland /
West Germany Ostdeutschland /
East Germany Total
1984 {SIZE84}{AHHGR} 1,46 - 1,46 1985 {SIZE85}{BHHGR} 1,50 - 1,50 1986 {SIZE86}{CHHGR} 1,51 - 1,51 1987 {SIZE87}{DHHGR} 1,53 - 1,53 1988 {SIZE88}{EHHGR} 1,55 - 1,55 1989 {SIZE89}{FHHGR} 1,56 - 1,56 1990 {SIZE90}{GHHGR} 1,56 1,23 1,49 1991 {SIZE91}{HHHGR} 1,56 1,27 1,50 1992 {SIZE92}{IHHGR} 1,56 1,31 1,51 1993 {SIZE93}{JHHGR} 1,58 1,32 1,53 1994 {SIZE94}{KHHGR} 1,59 1,34 1,54 1995 {SIZE95}{LHHGR} 1,59 1,37 1,55 1996 {SIZE96}{MHHGR} 1,62 1,41 1,58 1997 {SIZE97}{NHHGR} 1,62 1,42 1,58 1998 {SIZE98}{OHHGR} 1,65 1,48 1,62 1999 {SIZE99}{PHHGR} 1,66 1,51 1,63 2000 {SIZE00}{QHHGR} 1,71 1,54 1,68 2001 {SIZE01}{RHHGR} 1,72 1,57 1,70 2002 {SIZE02}{SHHGR} 1,73 1,56 1,70 2003 {SIZE03}{THHGR} 1,73 1,57 1,70 2004 {SIZE04}{UHHGR} 1,74 1,58 1,71 2005 {SIZE05}{VHHGR} 1,75 1,59 1,72 2006 {SIZE06}{WHHGR} 1,77 1,61 1,74 2007 {SIZE07}{XHHGR} 1,79 1,65 1,77 2008 {SIZE08}{YHHGR} 1,82 1,66 1,79 2009 {SIZE09}{ZHHGR} 1,85 1,68 1,81 2010 {SIZE10}{BAHHGR} 1,86 1,71 1,83 2011 {SIZE11}{BBHHGR} 1,85 1,71 1,82 2012 {SIZE12}{BCHHGR} 1,85 1,73 1,83 2013 {SIZE13}{BDHHGR} 1,85 1,72 1,83


![SOEP-Monitor Person 1984-2011 - DIW · 2021. 2. 12. · SOEP GROUP SOEP 2011 – SOEPMONITOR PERSON 1984‐2011 (SOEP V28) Berlin, 2013 DOI: 10.5684/soep.v28 h ] o î ì í ð Editors:](https://static.fdocuments.us/doc/165x107/6117f8678f8ea7140b3725a9/soep-monitor-person-1984-2011-diw-2021-2-12-soep-group-soep-2011-a-soepmonitor.jpg)