Socioeconomic Factors for Kenya By: Danielle Robertson.
15
Socioeconomic Factors for Kenya By: Danielle Robertson
-
Upload
erika-rose -
Category
Documents
-
view
218 -
download
0
Transcript of Socioeconomic Factors for Kenya By: Danielle Robertson.
Socioeconomic Factors for KenyaBy: Danielle Robertson

Population - 2009 Census
Central Province: 4,383,743
Nyeri District: 693,558
Male: 339,725
Female: 353,833
Othaya: 21,427
Urban population: 4,108

National GDP
$65.95 billion as of 2010
GDP per Capita - $1,600.00
Growth Rate of 4% (2010), 2.6% (2009), 1.7% (2008)
Kenya is a leader in the economy of Central and East Africa
Factors affecting GDP – 2005 drought, 2008 political and world market shocks

Breakdown of Industries
GDP CompositionAgriculture –
22%Industry – 16%Services – 62%
Labor ForceAgriculture –
75%Industry and
Services – 25%
The largest earning sector of GDP has the lowest percentage of the population
working in it

National Import/Export
Exports tea, horticultural
products, coffee, petroleum products, fish and cement
$5.141 Billion
Imports machinery and
transportation equipment, petroleum products, motor vehicles, iron and steel, resins and plastics
$10.4 Billion
There is a $5.259 Billion trade deficit

National Unemployment
40% Unemployment Rating (2008)
Wealth Gap (2005)Lowest 10% - earn 1.8% of household
incomeHighest 10% - earn 37.8% of
household income

HPI by Province
Human Poverty IndexNairobi –
29.9%Central –
32.3%North
Eastern – 50.5%

Employment by Province

Income Distribution by Province

Poverty Statistics
Lowest proportion of landless rural poor households = 15.8% (2004)
31% Poverty incidence (2005) – Central given the richest rating
Nairobi followed with 44%
19 of the top 23 districts in the richest category (less than 35%) are in Central Province

Gender Ratios
At birth: 1.02 male(s)/female
Under 15 years: 1.01 male(s)/female
15-64 years: 1.01 male(s)/female
65 years and over: 0.83 male(s)/female
Total population: 1.01 male(s)/female
Central Province – 49% males & 51% females
Nyeri – 48.78% males & 51.22% females

HDI and GDI
National HDI - .470 (2010)
Nairobi had the highest HDI with .773 in 2005
The Central province followed with .637 in 2005
The North Eastern province had the least HDI with .285
National GDI - .540 (2005)
The Central Province had the highest GDI with .626 in 2005
Followed by Nairobi with .620
The North Eastern Province had the lowest GDI with .401

Attitude Towards Gender Violence

Literacy in Kenya
Nairobi
Central
Coast
Eastern
N. Eastern
Nyanza
Rift Valley
Western
Kenya
0 20 40 60 80 100
Literacy for MalesLiteracy for Female
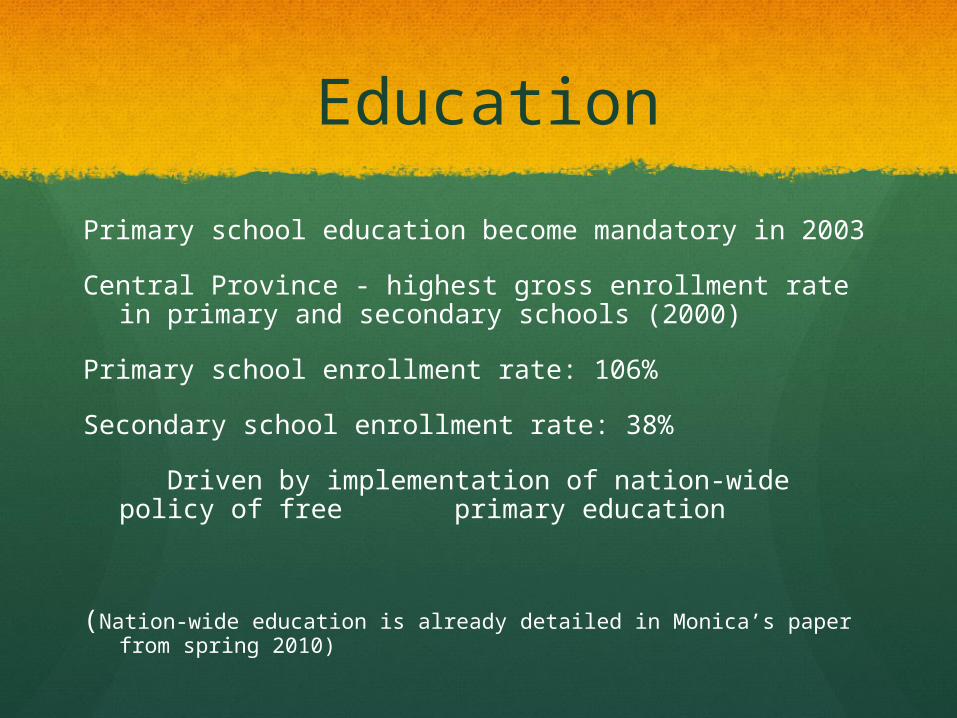
Education
Primary school education become mandatory in 2003
Central Province - highest gross enrollment rate in primary and secondary schools (2000)
Primary school enrollment rate: 106%
Secondary school enrollment rate: 38%
Driven by implementation of nation-wide policy of free primary education
(Nation-wide education is already detailed in Monica’s paper from spring 2010)