SOCIO - ECONOMIC PROFILE OF THE SAMPLE...
64
SOCIO - ECONOMIC PROFILE OF THE SAMPLE HOUSEHOLDS IN PALAKKAD DISTRICT OF KERALA Lilly. P. V. “Role of women in agriculture- A case study of female agricultural labourers in palakkad district of Kerala ” Thesis. Department of Economics, Dr. John Matthai Centre Thrissur , University of Calicut, 2000
Transcript of SOCIO - ECONOMIC PROFILE OF THE SAMPLE...
SOCIO - ECONOMIC PROFILE OF THE SAMPLE HOUSEHOLDS IN PALAKKAD
DISTRICT OF KERALA
Lilly. P. V. “Role of women in agriculture- A case study of female agricultural labourers in palakkad district of Kerala ” Thesis. Department of Economics, Dr. John Matthai Centre Thrissur , University of Calicut, 2000
CHAPTER V SOCIO - ECONOMIC PROFILE OF THE SAMPLE
HOUSEHOLDS IN PALAKKAD DISTRICT OF KERALA
Palghat or Palakkad is one of the fourteen
revenue districts of Kerala State with a n area of 4482
Sq.Kms, Palakkad is the fourth largest district in the state.
This district, situated almost in the centre of the state, has
no coastal line. The district opens the State to the rest of
the country through the Palakkad gap. This 32 to 40 Kms.
wide natural gap in the 960 Kms. long Western Ghats is
perhaps the most influential factor for the unique
characteristics of the district such as climate, commercial
as well as cultural exchanges between the state and the rest
of the country. This district witnessed invasions of
historical importance that have left indelible impressions on
the history of Kerala.
Based on the physical features, the district is
divided into two natural divisions - midland and highland.
The midland region consists of valleys and plains. It leads
up to the high land, which consists of high mountain peaks,
long spurs, dense forests and tangled jungles. While
Ottapalam taluk lies completely in the middle lznd region,

all other taluks in the district lie in the middle land and
high land regions. The road and rail links between Kerala
and Tamil Nadu pass through the Palakkad gap.
Palakkad district lies between north latitude 1 O0
46' and 100 59' and east longitude 760 28' and 760 39'. It is
bounded on the east by the Coimbatore district of Tamil
Nadu, on the north and north-west by Malappuram district
and on the south by Thrissur district. The climate of the
district is tropical. Palakkad district has uniform rainfall as
well. The soil of this district is mainly of four types,
namely, peaty, laterite, forest and black soil. Peaty soil is
found only in Thritala firka of Ottapalam taluk. Laterite is
seen in the major portions of all taluks. Minerals like low
grade iron ore, limestone and muscovita mica are found in
different parts of this district. Bharathapuzha, the largest
river in Kerala with her tributaries, flows through the entire
district.
The flora of Palakkad district is characteristically
tropical, owing to the seasonal rainfall, moderate
temperature and the mountainous eastern border. Major
portion of the district comes under the midland region and
is under cultivation. The Silent Valley area, 40 Kms from
Mannarghat town, has the distinction of being a rain forest,

very rare in the world. The forest region of Palakkad district
is notable for its tribal population. Attappady is an
important centre of tribal people.
Hinduism is the predominant religion in the
district. Nearly 76 per cent of the population belongs to the
Hindu community. All the sub castes of Hindu communiiy
are well represented in the district. The Muslim community
is the second largest, forming 21.2 per cent of the
population. The numerical strength of the Christian
community in the district, according to 1971 census, is
45426. All most all sections of the Christian community are
represented. The ceremonies connected with birth, marriage
and death differ from one community to another. The
restrictions based on caste and all communities observe
religions generally.
Palakkad district, as an administrative unit, was
formed on the first of January 1957, comprising of
Palakkad, Perinthalmanna, Ponnani, Ottapalam, Alathur
and Chittur. At present the Palakkad district consists of
two revenue divisions, five taluks, 90 panchayats and 163
villages. There are thirteen development blocks in the
district. The total population of the district according to
1991 census is 23,82,235 of which, the male population is
11,55,822 and female population is 12,26,413. The density
of population is 532 per Sq. Km. Ninety per cent of the total
population live in villages.
Palakkad district shows the growth rate of 5.8
per cent in 1996-97. The growth rate in the tertiary sectors
is 5.2. The secondary sector growth is a t 4.5 per cent.
However, the primary sector growth is 6.7 per cent, which is
higher than the other sector. The percapita income of
Palakkad district at constant prices (1980-8 1) went up from
Rs. 2032 in 1995-96 to Rs. 2121 in 1996-97. Palakkad
district is one of the most economically and socially
backward districts in Kerala. Most of the income derived
from the agriculture and allied activities (GOK, 1997).
The effective total literacy rate of the district
according to 1991 census i s 81.21 per cent. The male
literacy rate is 87.24 and female literacy rate i s a t 75.72
per cent. According to 1991 census, the proportion of
scheduled caste population to total district population is the
highest in Palakkad district (Ibid.). In .Palakkad, the
scheduled caste total literacy rate is 57.05 and male literacy
is 63.62 and female rate is 51.07. The scheduled tribe total
literacy rate is a t 29.75 per cent. However, the male literacy

rate is 34.31 and female literacy rate is 25.10 per cent
(Ibid.).
5.1 Agriculture Profile of Kerala and Palakkad District - A Comparative Study
In Kerala, 58 per cent of the geographical area
has been categorized as net sown area. The total cropped
area in 1995-96 has crossed 30.67 lakh tones (Ibid). The
share of primary sector has decreased from year to year.
During the sixth plan period (1980-85) the share was 33.79
per cent. At the same time, it has decreased to 30.86
per cent during the V111 plan period (1992-97). The main
agricultural crops of this area are paddy and coconut. One
to three crops of paddy are raised annually depending on
the availability of irrigation facilities.
The first crop or virippu is grown from May to
September, the second crop known as mundakan is
obtained between September and February and the third
crop called punja, which is an irrigated crop of
comparatively minor importance between February and May.
After harvesting the crop, the fields are prepared for the
mundakan, which is more intensively cultivated crop. This
second crop is gaining in importance as it provides great
scope for intensive cultivation wherever the land resources
are limited. The third is restricted to small lour-level areas
where water supply is abundant during the summer
seasons. The season-wise data on paddy cultivation reveals
the reduction in area was more during virippu season. The
area under virippu crop, which was 2.2 lakh hectares a t the
base year of V111 plan has declined to 1.6 lakh hectares in
1996-97. The area under mundakan decreased from 2.5
lakh to 2.1 lakh hectares and punja from 0.7 lakh to 0.6
lakh hectares.
District-wise analysis of the performance of the
paddy shows that the productivity is higher in the districts
of Palakkad (229 1 Kg/ hectare), Wynad (2 199 Kg/ ha),
Kuttanad, a part of Kottayam (2 165 Kg/ha), Pathanamthitta
(2 157 Kg/ha), Alappuzha (2055 Kg/ha) and Thrissur (2036
Kg/ha) than the state average (2023 Kg/ha). The districts
of Kottayam, Alappuzha, Ernakulam, Thrissur and
Palakkad, the traditional rice growing districts accounts for
about two-thirds of the area under the paddy cultivation in
Kerala. The most important reason for this is due to the
major irrigation projects in Kerala is located in these
districts.
5.2 Agricultural Profile of Palakkad District
Agriculture is the most essential and integral
part of the life of rural economy. Rural economy is based on
agriculture and allied activities and there fore, agriculture
affects every aspects of their life. Palakkad district deserves
an important place in the field of agriculture and production
of paddy. Agriculture engages more than 65 per cent of the
workers and 88.9 per cent of the district's population is
rural in nature. Palakkad is one of the main granaries of
Kerala and its economy is primarily agricultural for the
following reasons: Palakkad district has been fortunate in
having the greatest proportion of wet lands in which pad-
cultivation is foremost, Palakkad district that gives the
highest output of paddy when compared with the other
districts of Kerala because the midland plains of Palakkad
are so fertile and productive and though the rainfall is
comparatively little, the district has good number of water
resources and a good percentage of the population of the
district are involved in agricultural operations (GOI, 198 1 :
GOK, 1976: Zachariah, 1992: George, 1992).
Agriculture sector showed improved performance
in Palakkad district. The net cultivated area of the district
is 284 lakh hectares, that is 64 per cent of the geographical

area. Major portion of the cultivable land is used for raising
food crops. All food crops together account for about 80per
cent of the gross cropped area and paddy alone accounts for
about 60 per cent of it. Coconut, groundnut, cotton, sugar
cane, pepper, banana, rubber, arecanut and cashew are
some of the major cash crops raised (GOK, 1996; GOK,
1997).
Paddy is the principal crop. It is cultivated in
three seasons, namely Autumn (Kanni or Virippu), Winter
(Kumbham or Mudakam) and Summer (Punja). The summer
crop is also raised in some areas of the district (GOI, 1981).
The season for the first crop of paddy (Virippu) is from
April/ M a y to August/September. The second crop
(Mundakan) is from September/ October to December/
January. The third crop (Punja) is from December/January
to April/ May. The Table (5.1) shows the area of rice
cultivation in three seasons in Palakkad district and in
Kerala.
During 1998-99, the total area used in Kerala for
rice cultivation is 352631 hectares, of which Palakkad
accounts for 107467 hectares. In Kerala and Palakkad,
more area of land is used for the cultivation of second crop,
Mundakan.

Table 5.1 Area Under Rice Cultivation in Palakkad and
Kerala (1998 - 99)
Seasons
Virippu (Autumn)
Mundakan (Winter)
Punja (Summer)
Total l
P-
Area utilized for rice cultivation (In Hectares)
Kerala I Palakkad - Source: GOK, Economic Review, 1999. P. S.35.
5.3 Female Agricultural Labourers - A Taluk Wise Analysis
The taluk-wise figures indicate that 32 out of 58
taluks in different districts of Kerala have a higher
percentage of agricultural labourers than the state average.
Among these taluks, the major rice growing regions of
Palakkad district are included. Chittur taluk of Palakkad
district has the largest female participation rate a s
labourers with 29.76 per cent, followed by Devicolam
(29.63), Perumade (27.661, Alathur (27.46), Vythiri (22.33),

Ku ttanad (2 1 .2 5), S hertallai (2 1.23) and Palakkad talu k
(20.62).
At present, Palakkad district consists of two
revenue divisions, namely Palakkad and Ottapalam.
Palakkad, Alathur and Chittur taluks form the Palakkad
revenue division. The paddy cultivation in Palakkad district
is mainly concentrated in these taluks. The study of the
economic activities of female agricultural labourers is
significant and important in order to analyse the
socio-economic development of this district of Kerala.
5.3. lAZathur Taluk
The Census Report shows the total and rural
wise distribution of main female workers in Alathur taluk.
The report also shows that its major part of workers was
engaged in agriculture as labourers. The total number of
workers in this taluk is 143742, among them, 71390 are
agricultural labourers. The total number of rural female
workers is 54167. Out of this 41812 are agricultural
labourers. Alathur is the only taluk in the district without
urban population. The Table (5.2) shows the distribution of
main workers in Alathur Taluk.
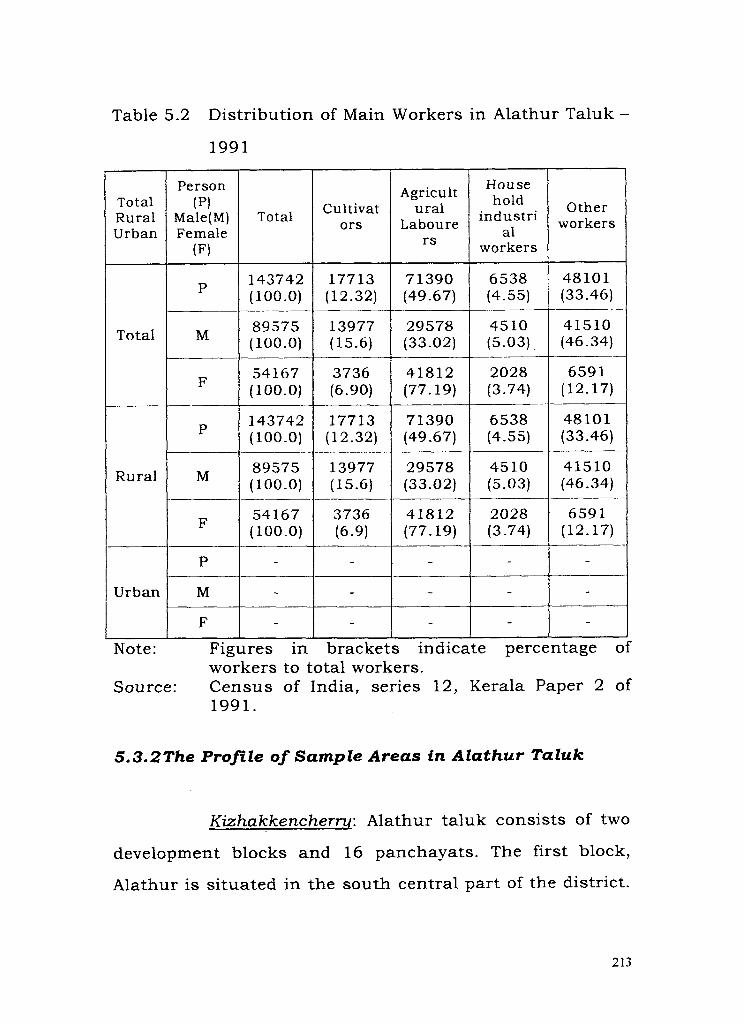
Table 5.2 Distribution of Main Workers in Alathur Taluk -
5.3 .2The Profile of S a m p l e Areas i n A la thur TaZuk
Kizhakkencherry: Alathur taluk consists of two
development blocks and 16 panchayats. The first block,
Alathur is situated in the south central part of the district.
Other workers
48101 (33.46)
41510 (46.34)
6591 (12.17)
48101 (33.46)
41510 (46.34)
6591 (12.17)
-
-
percentage of workers to total workers.
Source: Census of India, series 12, Kerala Paper 2 of 199 1.
Agricult ural
Laboure r S
71390 (49.67)
29578 (33.02)
41812 (77.19)
71390 (49.67)
29578 (33.02)
41812 (77.19)
-
-
-
indicate
Cultivat ors
17713 (12.32)
13977 (15.6)
3736 (6.90)
17713 (12.32)
13977 (15.6)
3736 (6.9)
-
-
-
brackets
House hold
industri a1
workers
6538 (4.55)
4510 (5.03)
2028 (3.74)
6538 (4.55)
4510 (5.03)
2028 (3.74)
-
-
-
Total
143742 (100.0)
89575 (100.0)
54167 (100.0)
143742 (100.0)
89575 (100.0)
--p.
54167 (100.0)
-
Figures in
Total Rural Urban
Total
Rural
Urban
Note:
Person (P)
Male(M) Female
(F)
P
M
F
P pp-
M
F
P
M
F
It covers an area of 3 12 sq.kms. The total population a s per
1991 census i s 261385. Paddy is, by far, the most
important crop. Canals irrigate a net area of 7470 hectares.
Kizhakkencherry, the sample area is situated in Alathur
block. I t covers a n area of 112.56 sq.kms. The total
population is 36215, of which the female population is
18294. According to the 199 1 census, total scheduled caste
population is 5873, among them 2853, were males. The
literacy rate of the females (72.78 per cent) is lower than
males (87.37per cent). Paddy is the most important crop in
this area.
Thenkurissi: The second block of Alathur taluk is
Kuzhalmannam, covers and area of 315 sq.kms. it contains
17 villages and eight panchayats. It has a population of
2 1575 1. Paddy is the most important crop covering a gross
area of 21500 hectors. The main source of irrigation is
canals and it accounts for 27600 hectares. Thenkurissi
panchayat has a n area of 29.92 sq.kms and it is situated in
Kuzhalmannam block. It has a population of 25307 of them
13046 are females. The scheduled caste population of the
panchayat according to 1991 census i s 7036, of which, the
female scheduled caste population is 3602. The literacy rate
of males is 84.66 per cent and females literacy rate is 67.27
per cent. The population primarily depends on agriculture
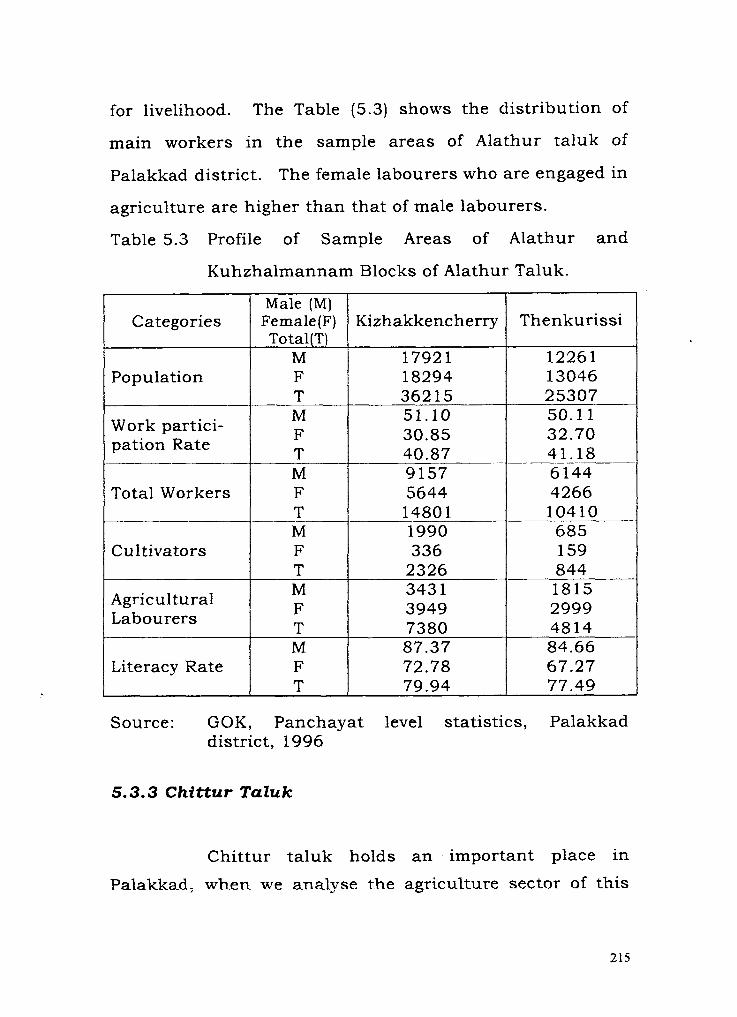
for livelihood. The Table (5.3) shows the distribution of
main workers in the sample areas of Alathur taluk of
Palakkad district. The female labourers who are engaged in
agriculture are higher than that of male labourers.
Table 5.3 Profile of Sample Areas of Alathur and
Kuhzhalmannam Blocks of Alathur Taluk.
Source: GOK, Panchayat level statistics, Palakkad district, 1996
5.3.3 Chittur TaZuk
Thenkurissi
12261 13046 25307 50.11 32.70 41.18 6144 4266 10410 685 159 844 1815 2999 4814 84.66 67.27 77.49
Chittur taluk holds a n important place in
Palakkad, when we analyse the agriculture sector of this
Kizhakkencherry
17921 18294 36215 51.10 30.85 40.87 .
9157 5644 1480 1 1990 336
2326 343 1 3949 7380 87.37 72.78 79.94
Categories
Population
Work partici- pation Rate
-
Total Workers
Cultivators
Agricultural Labourers
Literacy Rate
Male (M) Female(F) Total(T)
M F T M F T M F T .p--p. M F T M F T M F T

district. Most of the persons, especially the females in rural
and urban areas are engaged in agriculture sector as
labourers. The number of total workers is 163185, among
whom 83655 are engaged as agriculture labourers. The
total number of female agricultural labourers is 46533. The
rural and urban wise distribution also shows a high
proportion of females in agriculture as labourers. Out of
55406 rural female workers, 43083 are female agricultural
labourers. In urban areas the total female workers' number
is 6080, among which 3450 are agricultural labourers. The
Table (5.4) shows the distribution of main workers in
Chittur Taluk.
Table 5.4 Distribution of Main Workers in Chittur Taluk
Total Rural Urban
Total
Rural
Urban
Note: Figures in brackets indicate percentage of workers to total workers
Source: Census of India, Series 12, Kerala paper 2 of 199 1.
1991
Person (p) Male(M)
Female (F,
P
M
F
P
M
F
P
M
F
Total
163185 (100.0) 101699 (100.0) 61486 (100.0) 141763 (100.0) 86357 (100.0) 55406 (100.0) 21422 (100.0) 15342 (100.0) 6080
(100.0)
Cultiva- tors
20011 (12.26) 15649 (15.39) 4362 (7.09) 18892 (13.33) 14731 (17.06) 4161 (7.51) 11 19 (5.22) 918 (5.98) 201
(3.30)
Agricultur
Labourer
83655 (51.26) 37122 (36.50) 46533 (75.68) 77922 (54.97) 34839 (40.34) 43083 (77.76) 5733
(26.76) 2283
(14.88) 3450
(56.74)
House hold
industrial workers 6372 (3.90) 4383 (4.31) 1989 (3.23) 406 1 (2.86) 2865 (3.32) 1196 (2.16) 231 1
(10.79) 1518 (9.89) 793
(13.04)
Other workers
53147 (32.57) 44545 (43.80) 8602
(13.99) 40888 (28.84) 33922 (39.28) 6966
(12.57) 12259 (57.23) 10623
(69.24) 1636
(26.9 1)
5.3.4Profile of Sample Areas of Chittur Tatuk
Nallepally: Chittur taluk consists of three
development blocks and 16 panchayats. Chittur block of
Chittur taluk has an areas of 290 sq.kms and i s situated in
the south of the district. It has 19 villages, six pabrh.a.yath8
and one town. The population stands at 181869, The
density of population is above 560. About 75 per cent of the
population depends on agriculture for their livelihood.
Industry employs less than eight per cent and the remaining
find their employment in the tertiary sector. The block has
a geographical area of 29000 hectares. It is endowed with
good irrigation facility from the Chitturpuzha project.
Nallepally panchayath covers an area of 39.7 sq-kms and
has a population of 30032. The female population (15498)
is higher than the male population (14534). The literacy
level of females is 60.81 per cent, which is lower than that
of males (77.38per cent). The scheduled caste population of
this panchayat, according to the 1991 census is 4960
among them 2528 are females. Most of the workers are
employed in the primary sector.
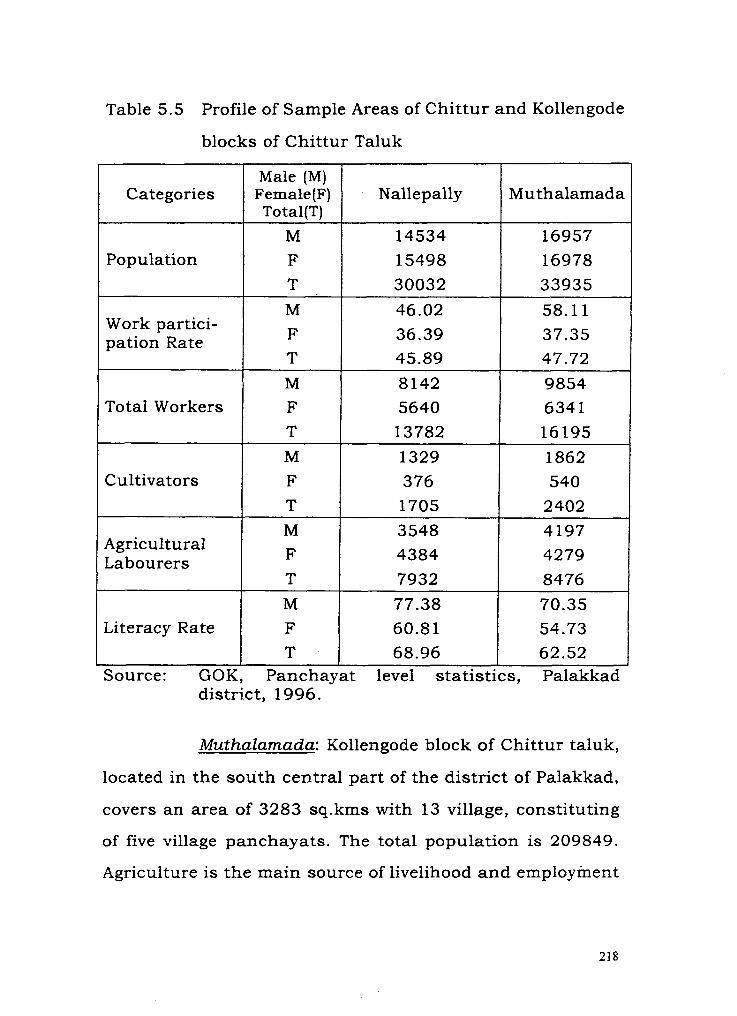
Table 5.5 Profile of Sample Areas of Chittur and Kollengode
blocks of Chittur Taluk
Population I F / 15498 1 16978
Categories
Total Workers 1 F I 5640 1 6341
Male (M) Female(F) Total(T)
Work partici- pation Rate
Cultivators I F I 376 l 540
Nallepally
M F T M
Literacy Rate I F I 60.8 1 1 54.73
Muthalamada
Agricultural Labourers
l I I I
Source: GOK, Panchayat level statistics, Palakkad district, 1996.
46.02
36.39
45.89
8142
Muthalamada: Kollengode block of Chittur taluk,
located in the south central part of the district of Palakkad,
covers an area of 3283 sq.kms with 13 village, constituting
of five village panchayats. The total population is 209849.
Agriculture is the main source of livelihood and employment
58.11
37.35
47.72
9854
M F
T M
3548
4384
7932
77.38
4197
4279
8476
70.35

for the majority. Paddy is the main crop, followed by
groundnut and coconut. Of the cropped area, 10725
hectares are irrigated. Canals account for 7200 hectares,
tanks 2600 hectares and other sources of irrigation 425
hectares. Nearly 70 per cent of the workers are engaged in
the primary sector, where as the secondary sector accounts
for 15 per cent. Dairying is a significant subsidiary
occupation. Muthalamada panchayath covers an area of
66.76 sq-kms. The population is 33935, among them 16978
are females and 16957 are males. The scheduled caste
population as per 1991 census is 5902. The female
scheduled caste population (3001) is higher than that of
male population (2901). In the case of the literacy level, the
male literacy rate (70.35) is higher than the females (54.73).
The Table (5.5) reveals the profile of the sample areas of
Chittur taluk of Palakkad district.
5.3.5 Palakkad Taluk
Palakkad Taluk consists of one municipality and
two Community Development Blocks. The main economic
activity of the people is related to the agriculture sector. The
total number of workers in this taluk is 174647 among them
63884 are agricultural labourers. The rural and urban wise
distribution of the workers is also shows a high proportion

of agricultural labourers, among them the female
agricultural labourers holds a prominent place. Their
number is 30010 in rural areas and 4492 in urban areas.
The Table (5.6) shows the distribution of main workers in
Palakkad taluk of Palakkad district.
Table 5.6 Distribution of Main Workers in Palakkad Taluk
5.3.6 Profile of Sample Areas of P a l a k k a d Taluk
Total Rural Urban
Total
Rural
Urban
Elappuly: Palakkad taluk consists of two
development blocks and 17 panchayaths. The newly created
Note: Figures in brackets indicate percentage of workers to total workers
Source: Census of India, Series 12, Kerala paper 2 of 1991.
Person (p) Male(M) Female (F)
P
M
F
P
M
F
P
M
F
~~~~l
174647 (100.0) 121807 (100.0) 52840 (100.0) 120409 (100.0) 79689 (100.0) 40720 (100.0) 54238 (100.0) 42118 (100.0) 12120 (100.0)
Cultiv- ators
15777 (9.03) 12048 (9.89) 3729 (7.06) 14130 (11.74) 10739 (13.48) 3391 (8.32) 1647 (3.04) -
1309 (3.11) 338
(2.79)
Agricultur a1
House ho ld Other
workers
87332 (50.00) -
74638 (61.28)
p-.
12694 (24.02) 44885 (37.28) 39132 (49.10) 5753
(14.13) 42447 (78.26) 35506 (84.30) 6941
(59.27)
industrial
63884 (36.58) 29382 (24.12) 34502 (65.30) 55805 (46.35) 25795 (32.37) 30010 (73.70) 8079
(14.90) 3587 (8.52) 4492
(37.06)
workers
7654 (4.38) 5739 (4.71) 19 15 (3.62) 5589 (4.64) 4023 (5.05) 1566 (3.85) 2065 (3.81) 1716 (4.09) 349
(2.88)
Malampuzha block is carved out of Kozhalmannam,
Palakkad and Kollengode blocks. It comprises of eight
panchayats and has a population of 168358. Most of the
people are agricultural labourers. Paddy is the major crop
of the block, which sustains the majority of the people.
Elappuly panchayat belongs to Malampuzha block and has
an area of 49.01 sq-kms. This is inhabited by 35509
persons, of them 18078 are women. Agriculture sector
continues to be the main source of employment and income
The total scheduled caste population as per 1991 census is
5664 among them 2859 are females. The literacy rate of
females (64.8 per cent) is lower than the males (82.79
per cent)
Parali: Palakkad ranks second only to Attappady
in area and covers 72.3 sq-kms. Palakkad block, with two
towns, 20 villages and constituting 1 2 panrtr.ay*tq, hat 8
population of 38791 1. The density of populztinn is 472
sq.kms, Economic activitjes are sustained by a labollr
force, which forms 34 per cent of the population.
Agriculture occupies the foremost position in providing
employment and a s a source of livelihood. The net area
sown is 17200 hectares, where as forests cover 4500
hectares and cultivable land (waste) 7500 hectares. Paddy
occupies the foremost place in the terms of cropped area,
accounting for 11,219 acres. Parli covers an area of 30.27

sq-kms. This situated in Palakkad block, has a population
of 29640 of which, 14525 are males and 151 15 are females.
The scheduled caste population is 6273. The number of
female population is 3189 and male population i s 3084.
Agriculture occupies an important position in providing
employment and income to the people.
5.4 Socio-Economic Condition of Sample Female Agricultural Labourers
Table 5.7 Profile of Sample Areas of Malampuzha and
The level of socio-economic conditions of women
in any society indicates their level of status. The female
Palakkad
Categories
Population
Work partici- pation Rate
Total Workers
Cultivators
Agricultural Labourers
Literacy Rate
Source: GOK, Panchayat level statistics, Palakkad district, 1996.
Blocks Male (M) Female(F) Total(T) M F T M F T M F T M F T M F T M F T
of Palakkad Taluk
Elappully
17431 18078 35509 53.69 3 1.03 42.15 9359 5609 14968
~-- 1369 36 1 1730 3622 3937 7559 82.79 64.81 73.62
Parli
14525 15115 29640 47.07 24.05 35.33 6837 3635 10472 798 267 1065 1963 2388 4351 88.17 73.72 80.76
agricultural wage earners are recognized to be perhaps the
most vulnerable and deprived section of the rural
population. With a meagre asset base and high dependence
on their own labour power for earning a livelihood,
agricultural labourers have fragile exchange entitlements.
Given their weak collective and bargaining strength, they
are often exploited by other socio-economic classes. In a
heterogeneous and complex society, the position,
dependence and disabilities of workers stem from their
occupational immobility (GOI, 1974).
The level of oppression and exploitation of
working class can generally measure the level of exploitation
of women in a society in general in the society. The
orientation of a society as a whole regarding the desirability
that women should play an equal role in country's
development was taken as a very important precondition for
the advancement not only women but the country as a
whole. The changes in the age of marriage, size of family,
level of literacy, health status, standard of living are
important indicators which have to be recognized and
analysed in order to understand the present status of
women in general and female agricultural labourers in
particular. Before analyzing the socio-economic situation of
the female labourers in the agricultural sector, the back
ground data of the women taken in samples has been given
to highlight the general trends noticed with regard to such
aspects as their age, caste, education, assets, marital
status, size of the family, income, consumption pattern,
indebtedness and saving pattern.
5.4.1 Age Composition
The agricultural labourers generally come into
their career a t a n early age and this is true in the case of all
the female agricultural labourers selected for the study.
The age composition of the respondents of the sample area
is presented in the Table (5.8).
From the table, we find that sample comprises
majority of the female agricultural labollrnrs in t h e eer
groups of 41-50 years. In all the three taluks, above 32 per
cent of the respondents are in the age group of 41-50 years,
dominate the entire sample. In the age group of 51-60
years, Chittur taluk constitute the highest in number.
However, in the age group of 20-30 years, constitute 18.33
per cent in the total sample, among them, Alathur taluk
holds the highest number in the sample female agricultural
labourers.
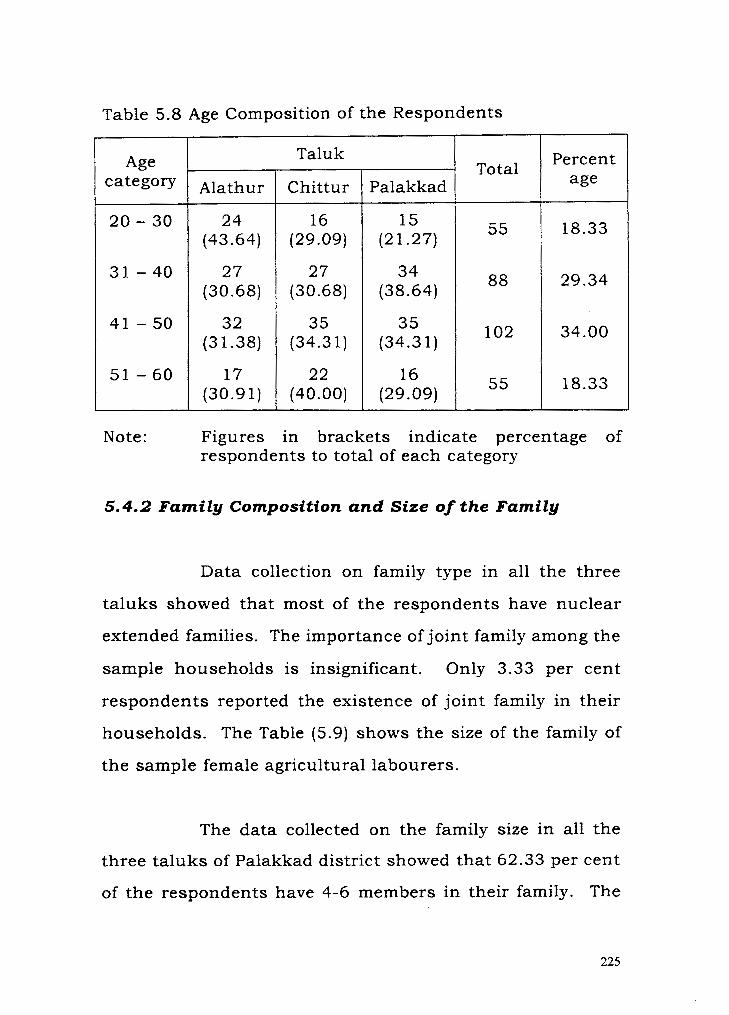
Table 5.8 Age Composition of the Respondents
Note: Figures in brackets indicate percentage of respondents to total of each category
5.4.2 Family Composition and Size of the Family
Percent age
18.33
29.34
34.00
18.33
Data collection on family type in all the three
taluks showed that most of the respondents have nuclear
extended families. The importance of joint family among the
sample households is insignificant. Only 3.33 per cent
respondents reported the existence of joint family in their
households. The Table (5.9) shows the size of the family of
the sample female agricultural labourers.
Total
55
88
102
55
Age
20 - 30
31 - 40
41 - 50
51 - 60
The data collected on the family size in all the
three taluks of Palakkad district showed that 62.33 per cent
of the respondents have 4-6 members in their family. The
Talu k
Palakkad
15 (2 1.27)
34 (38.64)
35 (34.3 1)
16 (29.09)
Alathur
24 (43.64)
27 (30.68)
32 (3 1.38)
17 (30.91)
Chittur
16 (29.09)
27 (30.68)
35 (34.3 1)
22 (40.00)
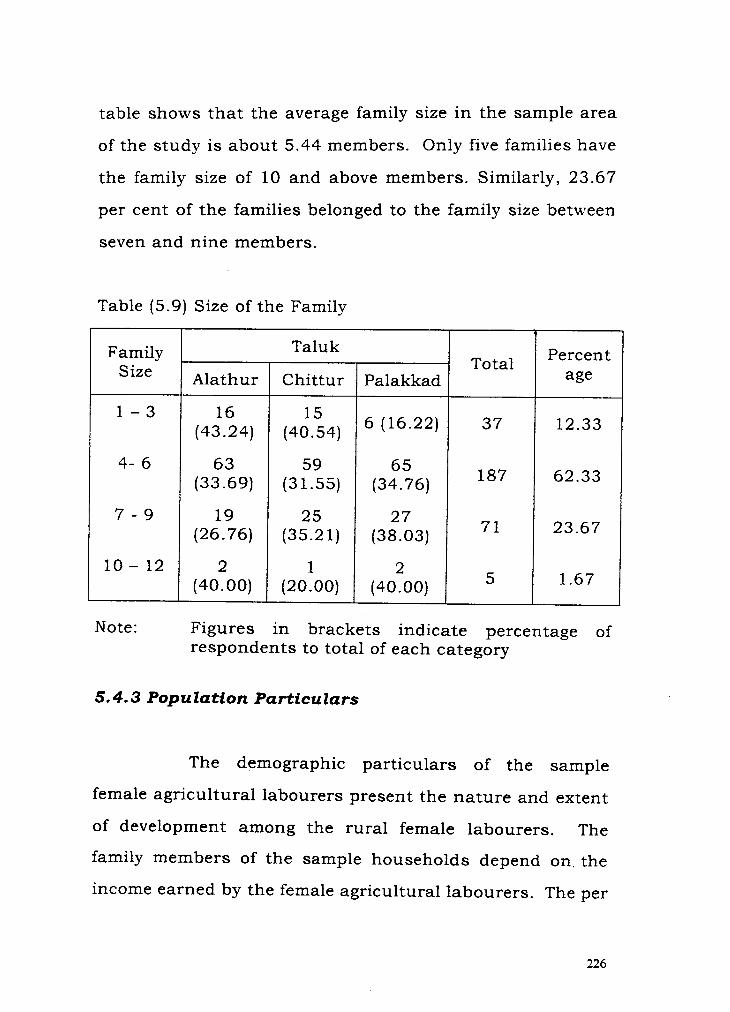
table shows that the average family size in the sample area
of the study is about 5.44 members. Only five families have
the family size of 10 and above members. Similarly, 23.67
per cent of the families belonged to the family size between
seven and nine members.
Table (5.9) Size of the Family
Note: Figures in brackets indicate percentage of respondents to total of each category
Family Size
1 - 3
4- 6
7 - 9
10 - 12
5.4.3 Population Particu lars
The demographic particulars of the sample
female agricultural labourers present the nature and extent
of development among the rural female labourers. The
family members of the sample households depend on. the
income earned by the female agricultural labourers. The per
Talu k Total
37
187
7 1
5
Alathur
16 (43.24)
63 (33.69)
19 (26.76)
2 (40.00)
Percent age
12.33
62.33
23.67
1.67
Chittur
l 5 (40.54)
59 (31.55)
25 (35.2 1)
1 (20.00)
Palakkad
6 (16.22)
65 (34.76)
27 (38.03)
2 (40.00)

capita income for consumption is also depends upon the
total number of the population of the sample households.
The Table (5.10) shows the population composition of the
sample households.
Table 5.10 Composition of Sex wise Population in Sample
Respondents' Families
The total population of the sample households is
1645. There are 720 males and 925 females. The number
of the females is higher than the males in all the taluks of
Palakkad district. The total number of population in
Palakkad taluk is higher than that of other two taluks. Of
the total population, 290 male children and 316 female
children is school going children. Females contribute more
than half of the population.
5.4.4 M a r i t a l Status
I
Marriage is an important factor that brings
change in the lives of men and women whether they are rich
Female
296
300
329
925
School going children Male
233
227
260
720
Talu k
Alathur
Chittur
Palakkad
Total
Male
92
98
100
290
Total
529
527
589
1645
Female
96
100
120
316
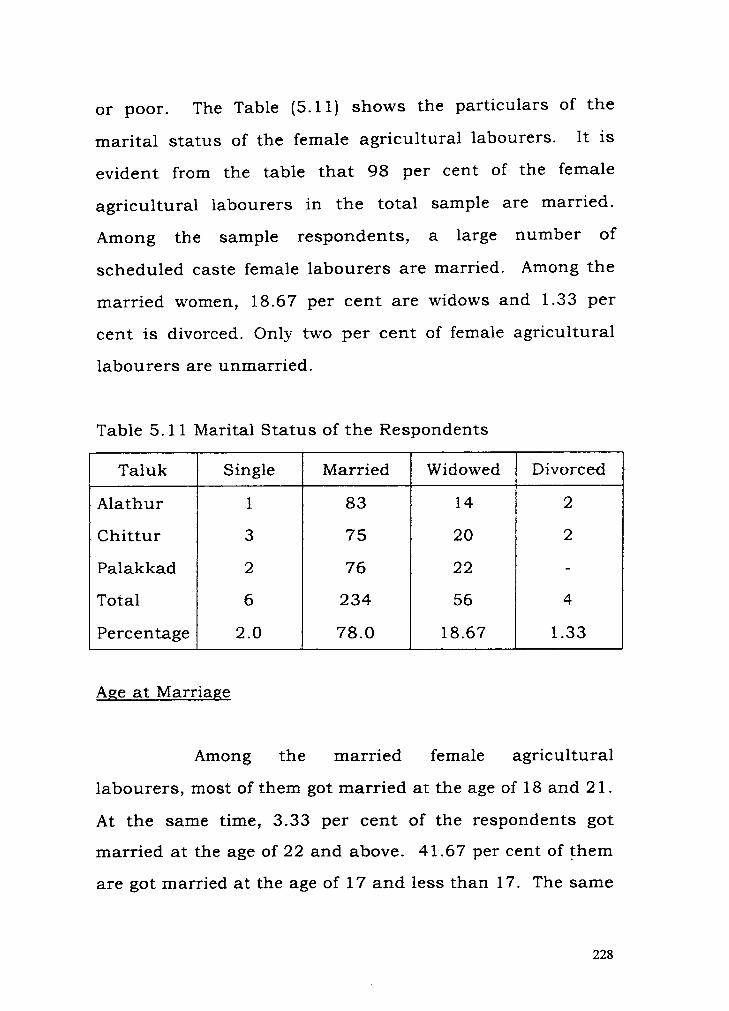
or poor. The Table (5.1 1) shows the particulars of the
marital s tatus of the female agricultural labourers. I t i s
evident from the table tha t 9 8 per cent of the female
agricultural labourers in the total sample are married.
Among the sample respondents, a large number of
scheduled caste female labourers are married. Among the
married women, 18.67 per cent are widows and 1.33 per
cent i s divorced. Only two per cent of female agricultural
labourers are unmarried.
Table 5.11 Marital Status of the Respondents
Age at Marriage
Among the married female agricultural
labourers, most of them got married a t the age of 18 and 2 1.
A t the same time, 3.33 per cent of the respondents got
married at the age of 22 and above. 41.67 per cent of them
are got married a t the age of 17 and less than 17. The same
Divorced
2
2
-
4
1.33
Talu k
Alathur
Chittur
Palakkad
Total
Percentage
Married
83
75
76
234
78.0
Single
1
3
2
6
2 .O
Widowed
14
20
22
56
18.67

trend also can be seen the case of taluk wise study of age a t
marriage. The Table (5.12) shows the particulars of age at
marriage of the respondents.
With regard to marriage relations, 1 1.67 per cent
of respondents opined that i t is good when marriage is on
the basis of own decisions. A t the same time, 88.33 per
cent of the respondents agreed with the decision of family
members and relatives in the marriage relations. There is
less chance for inter caste marriages in their society.
Table 5.1 2 Age at Marriage
Note: Figures in brackets indicate percentage of respondents to total of each category
Dowry Svstem
T
Percent age
4 1.67
53.00
3.33
The practice of dowry taking has spread like a n
epidemic even among the poor agricultural labour
Total
125
159
Age
Less than 17
l8 -
Chittur
45 (36.0)
49 (30.82)
Alathur
38 (30.4)
58 (36.48)
3 (30.0) 4 (40.0) I I 10
Palakkad
42 (33.6)
52 (32.70)
22 and above 3 (30.0)

household families. I t is significant to note that 65 per cent
of the female respondents opined that the dowry practice is
severe and rest of the respondents admitted the fact that
there is an increasing trend in the practice of dowry system.
The dowry system also hits hard a t the farm labourers.
Most of the labourers say that dowry is a necessary evil.
They are afraid of the dowry to be given a t the time of
marriage of their daughters and that is why they consider
their daughters as a liability and hence they do not welcome
the birth of a female baby. From the opinion of the female
respondents, it can be concluded that the prevalence of this
evil practice is also even among the backward agricultural
labour households whose meagre earnings are hardly
adequate to meet the minimum daily necessities. They
revealed that the dowry is given in a variety of ways
depending upon the traditions and customs of their
community.
:5.4.5 Caste Composition of the Sample Female Agricultural Labourers
The social condition of a person is related to
economic status. Palakkad is witnessing the growing trend
of the ferninisation in the agricultural labour force. The
status of female agricultural labourers is related to the
problems confronted by these labourers. The characteristics
of the economy of Palakkad district and the problems of the
female agricultural labourers indicate their low status in the
society. To many, their social backwardness is entirely a s a
result of their economic backwardness and caste system.
A man's caste has played a significant role in
determining his dignity, position and status in the society.
Palakkad, one of the granaries of Kerala, have a large
concentration of female agricultural labourers. These
labourers drawn mainly from the socially backward groups
(Buchanan, 1807) are not only subjected to economic
backwardness but have considerable difficulties in the
society due to their caste disabilities. These socially
disadvantaged labourers are the victims of the social
discrimination, low wages, poor housing conditions, lack of
education, options and opportunities. The agrarian sector
provides employment to these women and since it is
basically an unorganised sector, the nature of exploitation
of women in this sector is both acute and wide spread.
In scheduled caste community, women have been
working for centuries. There is a close relationship between
the caste and the work especially in traditional occupation
like agriculture as labourers. Their condition is far from
satisfactory. This reveals that with the overall category of
agricultural labourers, scheduled caste women do occupy a
subordinate position in Palakkad. The condition and s ta tus
enjoyed by this section of workers a s a person, family
member and a member of society is low. But there is a fact
that scheduled caste female agricultural labourers
constitute a significant proportion in the total agricultural
labour force in Palakkad a g r i c u l t ~ ~ r ~ sector I t is noticed
from Table (5.14) that female labour is prevalent in the
sample areas and more so among the scheduled caste
households. A s many as 76 per cent of the labourers are
drawn from scheduled caste households and they are
followed by Hindu Ezhava (2 1 per cent). The participation of
Muslim (2 per cent) and Christian (1 per cent) female
labourers in agriculture is insignificant. This confirms the
view that labourers are also engaged in work to eke out their
livelihood in all the sample village and especially labourers
from the lowest rungs of the social hierarchy.
5.4.6 Educational Status
Educational has contributed significantly to
raise the status of women in the family and that educated
women has more status in the society. The socio-economic
position is measured through the level of education,
occupation and income. I t was realized that women's
education is a necessary pre-condition for women's
improved position and status in the society. Rural women,
the majority of whom are illiterate or have low level of
education.
Even though there is a sharp increase in
women's literacy level in most of the districts of Kerala,
Palakkad shows a relatively less educational status. The
important fact for this is that the majority of them are poor.
Women's participation on social front could be assessed
mainly in terms of improvement in literacy level. In
Malabar, the progress of education was stalled by a n
oppressive system of land relations, poverty and misery to
which the large body of tenants and agricultural labourers
are subjected. W omen in particular and more specifically,
rural poor and illiterate women never get portrayed as
agents of change and whose dismal plight i s already well
known.
The literacy rate among the female agricultural
labourers is not high. Table (5.13) indicates that among the
sample female agricultural labourer respondents, about 32
per cent are illiterates who never attended any school
during their lifetime. About 47.33 per cent of the
respondents can be claimed a s literates as they attended

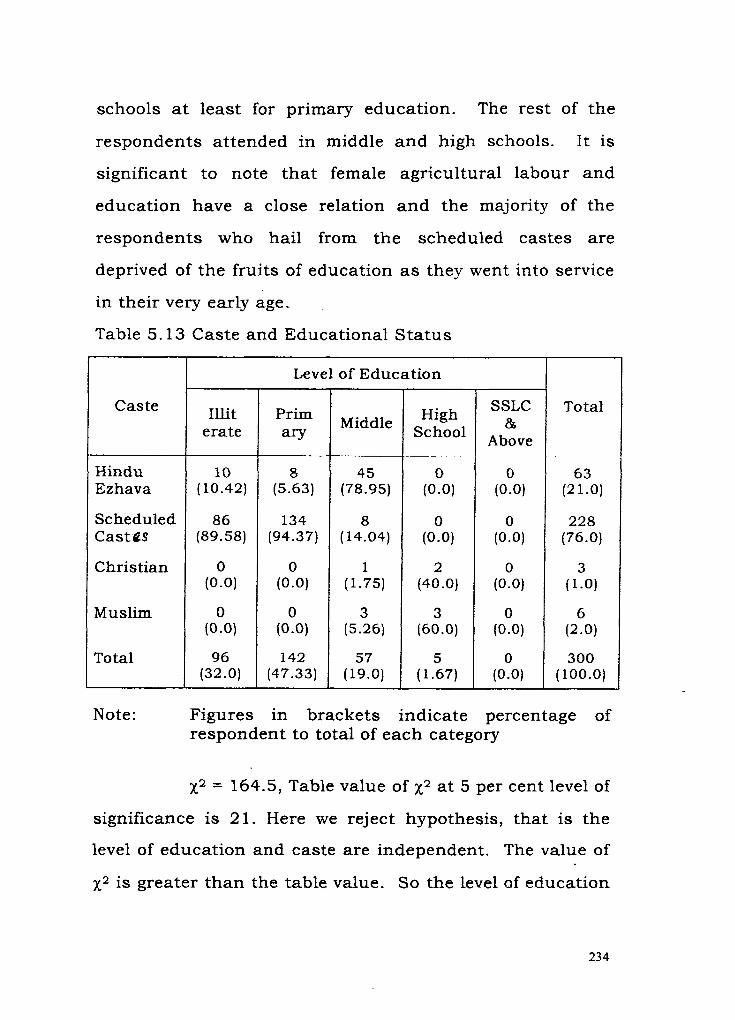
schools at least for primary education. The rest of the
respondents attended in middle and high schools. It is
significant to note that female agricultural labour and
education have a close relation and the majority of the
respondents who hail from the scheduled castes are
deprived of the fruits of education as they went into service
in their very early age.
Table 5.13 Caste and Educational Status
Note: Figures in brackets indicate percentage of respondent to total of each category
Caste
Hindu Ezhava
Scheduled Castes
Christian
Muslim
Total
~2 = 164.5, Table value of ~2 a t 5 per cent level of
significance is 21. Here we reject hypothesis, that is the
level of education and caste are independent. The value of
~2 is greater than the table value. So the level cif education
234
Total
63 (2 1 .O)
228 (76.0)
3 (1.0)
6 (2.0)
300 (100.0)
Level of Education
I lli t erate
1 0 (10.42)
86 (89.58)
0 (0.0)
0 (0.0)
96 (32.0)
Prim a1-Y
8 (5.63)
134 (94.37)
0 (0.0)
0 (0.0)
142 (47.33)
45 (78.95)
8 (14.04)
1 (1.75)
3 (5.26)
57 (19.0)
High School
. .- - . . .
0 (0.0)
0 (0.0)
2 (40.0)
3 (60.0)
5 (1.67)
SSLC 86
Above
0 (0.0)
0 (0.0)
0 (0.0)
0 (0.0)
0 (0.0)
schools at least for primary education. The rest of the
respondents attended in middle and high schools. It is
significant to note that female agricultural labour and
education have a close relation and the majority of the
respondents who hail from the scheduled castes are
deprived of the fruits of education as they went into service
in their very early age,
Table 5.13 Caste and Educational Status
Note: Figures in brackets indicate percentage of respondent to total of each category
Caste
Hindu Ezhava
Scheduled Cast BS
Christian
Muslim
Total
~2 = 164.5, Table value of ~2 a t 5 per cent level of
significance is 21. Here we reject hypothesis, that is the
level of education and caste are independent. The value of
x2 is greater than the table ualue. So the level of education
234
Total
63 (2 1 .O)
228 (76.0)
3 (1.0)
6 (2.0)
300 (100.0)
Level of Education
Illit erate
1 0 (10.42)
86 (89.58)
0 (0.0)
0 (0.0)
96 (32.0)
Prim arY
8 (5.63)
134 (94.37)
0 (0.0)
0 (0.0)
142 (47.33)
45 (78.95)
8 (14.04)
1 (1.75)
3 (5.26)
57 (19.0)
High School
0 (0.0)
0 (0.0)
2 (40.0)
3 (60.0)
5 (1.67)
SSLC &
Above
0 (0.0)
0 (0.0)
0 (0.0)
0 (0.0)
0 (0.0)
of sample female agricultural labourers and their caste
have a close relationship and they are dependent with each
other.
Another important fact to be noted here i s that
there are four important reasons for their illiteracy and low
level of education. Most of the respondents (50 per cent)
opined that due to their economic problems, they did not get
proper education. 18 per cent of the respondents say that
they did not feel the importance of education a t that time
and 12 per cent of thorn revealed the fact that education is
not necessary for their occupation. Rest of the respondents
(20 per cent) says that they are compelled to stay at home
instead of going to school to look after household work and
younger ones.
5.4.7 Educational Status of Female Agricultural Labourers in India and Kerala - A Comparative Study
While considering the educational status of the
sample female labour respondents, it is significant to
analyse and compare the educational s ta tus of female
agricultural labourers in India and Kerala, who are mainly
drawn from the scheduled castes and poor sections of the
society. Agricultural labourers are by and large illiterate. A

small section of the population of agricultural labourers has
been persuaded in the educational process. Household
work and compulsion to supplement family income and
poverty that discourage the agricultural labour households
in sending their children to schools. Poverty i s more closely
attached to rural areas and weaker sections of the society.
Agricultural labourers are characterized by a low
level of education in the Ladak region of Jammu and
Kashmir, Rajasthan, Western Gujarat, Madhya Pradesh,
Eastern Uttar Pradesh and parts of Bihar and Telangana
region of Andhra Pradesh. On the other hand, pockets of
districts with high level of education are to be found in
Punjab, Western Uttar Pradesh, deltaic West Bengal, coastal
Orissa and Andhra Pradesh, Tamil Nadu, Kerala and
Karnataka. The rural women are found at the lowest
stratum. The overall situation is formidable, a number of
districts in Punjab, the coastal region of Karnataka and
Kerala show a slight improvement (Aijazuddin and Nuna,
1990).
In India and Kerala, most of the female
agricultural labourers are from socially backward groups.
Their educational condition is lower than compared to the
general women. The socio-economic status i s related to

their education and employment. The Table (5.14) shows
the distribution of scheduled caste female agricultural
labourers and literates in India and Kerala.
Table 5.14 Distribution of total female scheduled caste Agricultural Labourers and Literates in India and Kerala (199 1).
Rural
INDIA*
Urban 1 188443 1 381435 1 1 ;:::.:9 / 4223617 (100.0) (28.73) (36.27)
Total Rural Urban
Total
Rural
Urban
Literates
12615880 (30.35)
Note: Figures in brackets indicate percentage to total agricultural labourers and literates
Persons
Agricultural Labourers
41562427 (100.0)
24470657 (100.0)
Source: * Census of India, 1991 series 1, paper I of 1993
Females Persons
8839053 (36.12)
"" Census of India, Union Primary census abstract for scheduled castes, 199 1.
Females
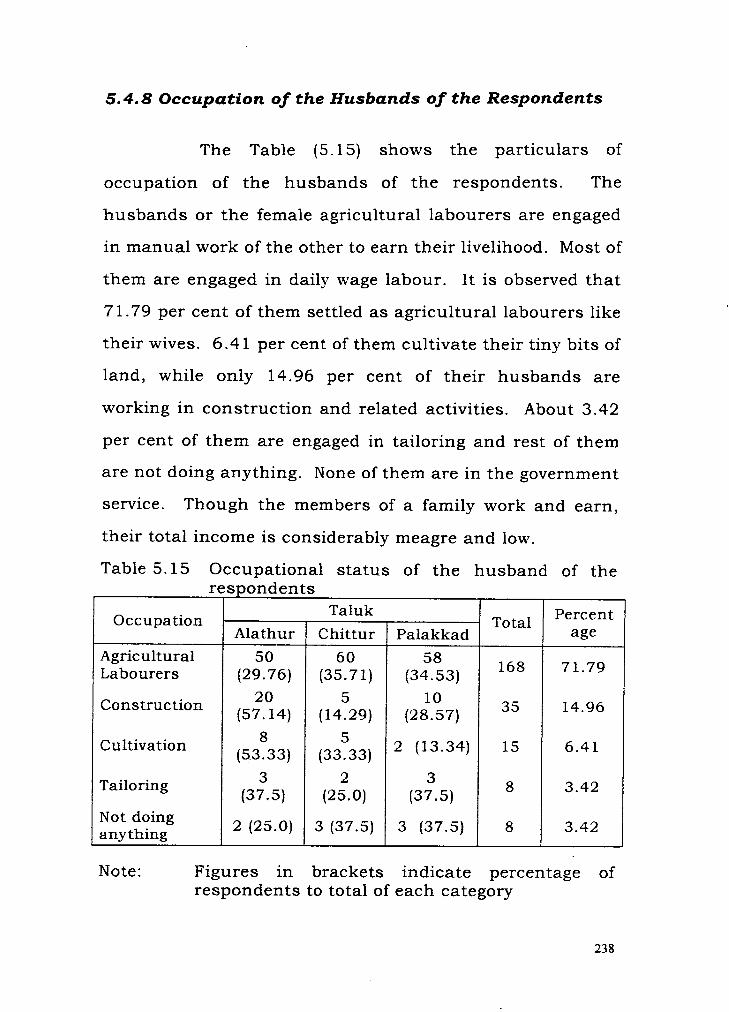
5.4.8 Occupation of the Husbands of the Respondents
The Table (5.15) shows the particulars of
occupation of the husbands of the respondents. The
husbands or the female agricultural labourers are engaged
in manual work of the other to earn their livelihood. Most of
them are engaged in daily wage labour. It is observed that
7 1.79 per cent of them settled a s agricultural labourers like
their wives. 6.41 per cent of them cultivate their tiny bits of
land, while only 14.96 per cent of their husbands are
working in construction and related activities. About 3.42
per cent of them are engaged in tailoring and rest of them
are not doing anything. None of them are in the government
service. Though the members of a family work and earn,
their total income is considerably meagre and low.
Note: Figures in brackets indicate percentage of respondents to total of each category
Table 5.15 Occupational status of the husband of the respondents
Occupation
Agricultural Labourers
Construction
Cultivation
Tailoring
Not doing anything
Taluk Total
168
35
15
8
8
Alathur
50 (29.76)
20 (57.14)
8 (53.33)
3 (37.5)
2 (25.0)
Percent age
71.79
14.96
6.41
3.42
3.42
Chittur
60 (35.71)
5 (14.29)
(33.33)
2 (25.0)
3 (37.5)
Palakkad
58 (34.53)
10 (28.57)
2 (13.34)
3 (37.5)
3 (37.5)
5.4.9 Income Pattern of the Respondents
The income through the employment is the major
source of earning for the majority of the people. The annual
income of the female agricultural labourers is basically
derived from wage income. The contribution of female
agricultural labourers to their family income is not only
significant but is of great value to their families and they
spend their entire income to increase the standard of living
and welfare of the family members. They contribute their
part with other sources to protect their family's real income.
Wage trend is the good index of income and
standard of living of the workers. Compared to other
districts of Kerala state, Palakkad records a low wage rate in
agriculture sector. Women agricultural labourers
concentrated in low income groups. A s a result, rural
households have often faced with impoverishment and
difficulty in meeting their basic needs. However, the less
economic resources and their labour are essential for
supporting their families.
The area under study reveals that the female
participation in agriculture as labourers in the total working
force was found to be higher than the male workers.
However, this does not mean that females' contribution
towards total income is higher. Palakkad is an agricultural
region and backward district in Kerala, which shows the
nature and condition of the workers. So economically and
socially these workers have occupied the lowest grade in the
working group. Income, therefore, constitutes one of the
main determinants of the status of women in the household
and in the society.
The most vulnerable section of agricultural
sector i s the women workers. A s a labourer they are
exploited and deprived section of the community. They are
poor because of lack of employment in agriculture sector,
lack of opportunities for self or non-agricultural employment
and they get low wages for their work. For a considerable
part of the year, they are out of work and earn nothing. At
the same time, they are employed they earn meager income.
Inadequate land holding in a n agrarian economy brings
inadequate income, which creates a negative impact on
consumption and economic status.
The contribution of female labourers is crucial
for family survival, even in households where there are
working males. The improvements in the level of income of
agricultural labourers also significantly contributed for
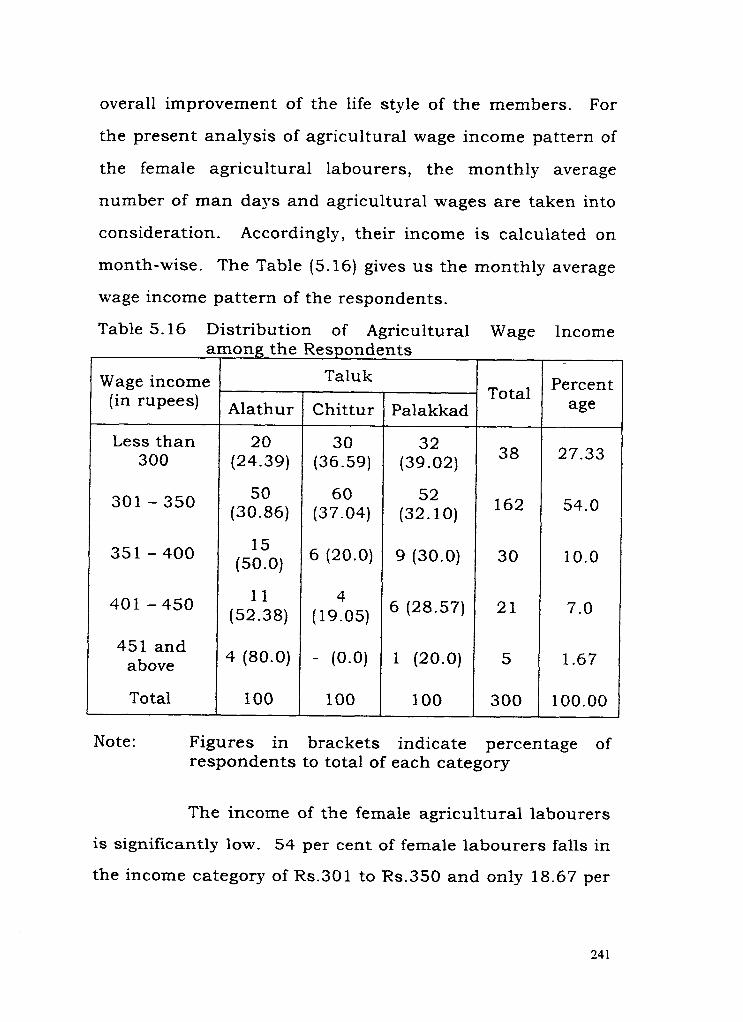
overall improvement of the life style of the members. For
the present analysis of agricultural wage income pattern of
the female agricultural labourers, the monthly average
number of man days and agricultural wages are taken into
consideration. Accordingly, their income i s calculated on
month-wise. The Table (5.16) gives u s the monthly average
wage income pattern of the respondents.
Table 5.16 Distribution of Agricultural Wage Income among the Respondents
I I
Note: Figures in brackets indicate percentage of respondents to total of each category
Wage income (in rupees)
Less than 300
301 - 350
351 - 400
401 - 450
451and above
Total
The income of the female agricultural labourers
is significantly low. 54 per cent of female labourers falls in
the income category of Rs.30 1 to Rs.350 and only 18.67 per
Talu k Total
38
162
30
21
5
300
Alathur
20 (24.39)
50 (30.86)
l 5 (50.0)
11 (52.38)
4(80.0)
100
Percent age
27.33
54.0
10.0
7.0
1.67
100.00
Chittur
30 (36.59)
60 (37.04)
6 (20.0)
(19.05)
- (0.0)
100
Palakkad
32 (39.02)
52 (32.10)
9 (30.0)
6 (28.57)
l ( 2 0 . 0 )
100

cent of the female workers earn Rs.351 and above Rs. 451
per month. And the rest of the respondents (27.33 per cent)
fall in the group less than Rs. 300. Lack of assets and the
size of the families force the females to work and contribute
towards family income. This shows the pathetic economic
situation of the agricultural labour class.
The existing wage rate and decline in the days of
work has reduced their income to a very low level. The
income, which is earned by the labourers is not adequate
enough to support their families even for bare subsistence.
The prosperity in agriculture has brought enormous benefit
to few big landlords while the lot of rural workers in this
prosperity has been only marginal. Responsibility of
managing on a very low income falls on women. The object
of poverty, which is largely the consequence of a meagre
income level, haunts every sphere of their living. This can
be quantified in terms of low consumption expenditure and
pattern of expenditure. The Table (5.17) gives the
particulars of income made through all the sources. Apart
from the meagre income from agricultural wages, the female
labourers forced to engaged in other works like construction
works, domestic servants and collecting fuels and from
animal husbandry. Thus the total income of female
agricultural labourers i s comprised of the wages and income
from other sources.

Table5.17 Total Average Monthly Income of the
Respondents
Note: Figures in brackets indicate percentage of total of each category.
Income (in
Less than 400
401 - 500
501 - 'O0
60 - 700
701 and above
Total
It is evident from the table that the majority of
the sample respondents' (53.67) income falls between
Rs. 501-600 per month. This is followed by 28.33 per cent
of the respondents whose total monthly income ranges
between R s . 401 and 500. The monthly income of about 13
per cent of the female agricultural labourers falls between
Rs. 601 and 700 and four per cent of them earn less than
Rs.400. Only one per cent of the respondents earn a higher
income of Rs. 701 and above per month. Some respondents
Talu k Total
12
85
161
39
3
300
Alathur
4 (33.33)
25 (29.41)
43 (26.71)
25 (64.10)
3 (100.0)
100
Percent age
4.00
28.33
53.67
13.00
1 .oo
100.00
Chittur
(16.67)
32 (37.65)
56 (34.78)
l0 (25.64)
- (0.0)
100
Palakkad
6 (50.0)
28 (32.94)
62 (38.51)
4 (10.26)
- (0.0)
100
do not take interest to find out some other works and they
still continue as agricultural labourers itself. At the same
time, most of the agricultural labourers are trying to get
employment other than agricultural labour. More than 50
per cent of the respondents earn more income from other
sources than agricultural wages.
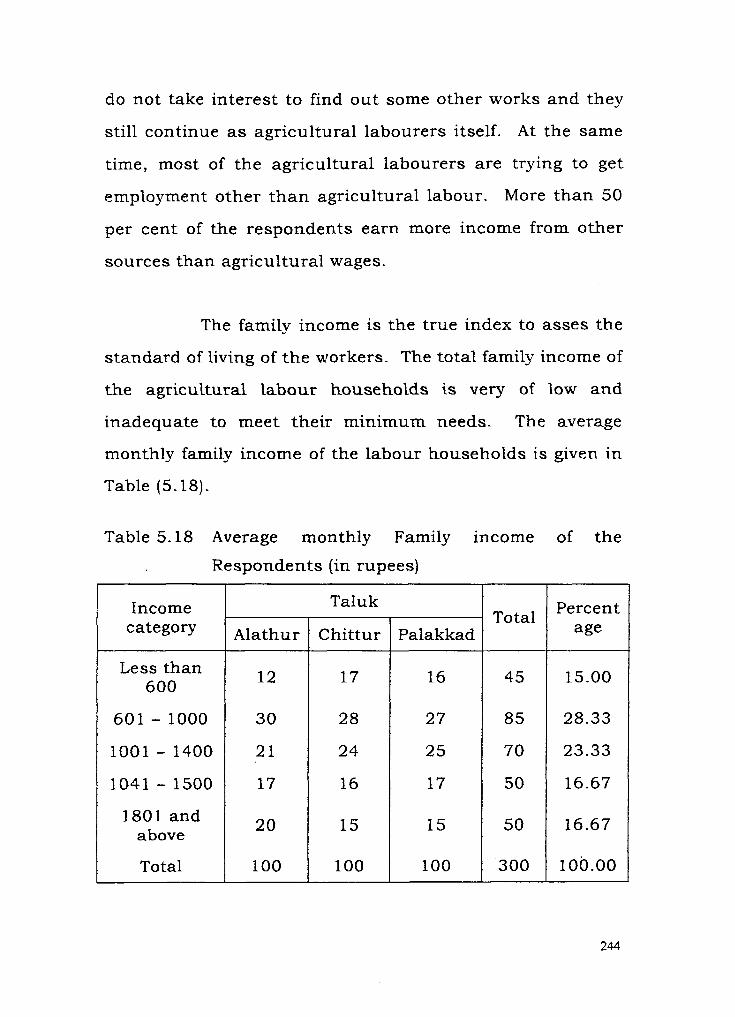
The family income is the true index to asses the
standard of living of the workers. The total family income of
the agricultural labour households is very of low and
inadequate to meet their minimum needs. The average
monthly family income of the labour households is given in
Table (5.18).
Table 5.18 Average monthly Family income of the
Respondents (in rupees) pp p - -
Income
Less than 600
601 - 1000
1001 - 1400
1041 - 1500
180 1 and above
Total
Talu k Total
45
85
70
50
50
300
Alathur
12
30
2 1
17
20
100
Percent age
15.00
28.33
23.33
16.67
16.67
100.00
Chittur
17
28
24
16
15
100
Palakkad
16
27
25
17
15
100
I t is significant to note that 16.67 per cent of
them falls in the income category of Rs . 1801 and above.
28.33 per cent of the sample respondents' family income
falls between Rs.601-1000 per month. A s a whole 83.33
per cent of the respondents' family income is low, which is
less than Rs.1800 per month.
5.4.10 Consumption Expenditure Pattern of Sample
AgricuZturaZ Labour Households
The economic development of a society cannot
only be measured through the technical and materialistic
improvements, but through the increase in the standard of
living of the people. The growth of a region depends on its
capacity to raise the lot of the poorest and weakest section
of its society. The capacity of a family to consume the goods
and services greatly depends upon the occupation and
source of revenue and expenses on other items such a s
housing, health, clothing and expenses on children's
schooling.
The level of living and diet depends upon the
income. Inadequate income that inevitably has a negative
impact on consumption and nutritional standards of the
people. Income, therefore, constitutes one of the most
important determinants of the standard of living and
nutritional s ta tus of a household. Female agricultural
labourers meagre income is used for the welfare of the
household. The resources targeted a t women are benefited
to the whole family. Men spend a significant portion on
personal goods but poor women use their meagre income
mostly on family needs.
5.4.10.1 Structure of Consumption Expenditure
There are considerable disparities in the level of
expenditure among the different groups in a society. The
size of distributed income is inadequate to the lowest
income groups especially to the agricultural labourers and
inequalities are existing in expenditure pattern in the
society. The female agricultural labourers and their family
is in a situation of great poverty, the level of annual income
influences the quality and quantity of food.
There are many factors that influence the food
habits of the local society. They are the soil fertility,
rainfall, density of population and commercialization of
agricultural products. Apart from these, the socio-economic
and cultural factors such a s the economic position of the
household, size of family, health conditions, local customs
and beliefs are also concerned with regard to the type of
food that i s taken to consume. The agricultural labourers
are the worst affected by the effects of rise in prices,
because of meagre earnings by way of wages. The cost of
living is higher than their economic resources. Due to this,
the household income and consumption expenditure of an
average agricultural labour household is precariously
balanced, and that too when it finds some additional work.
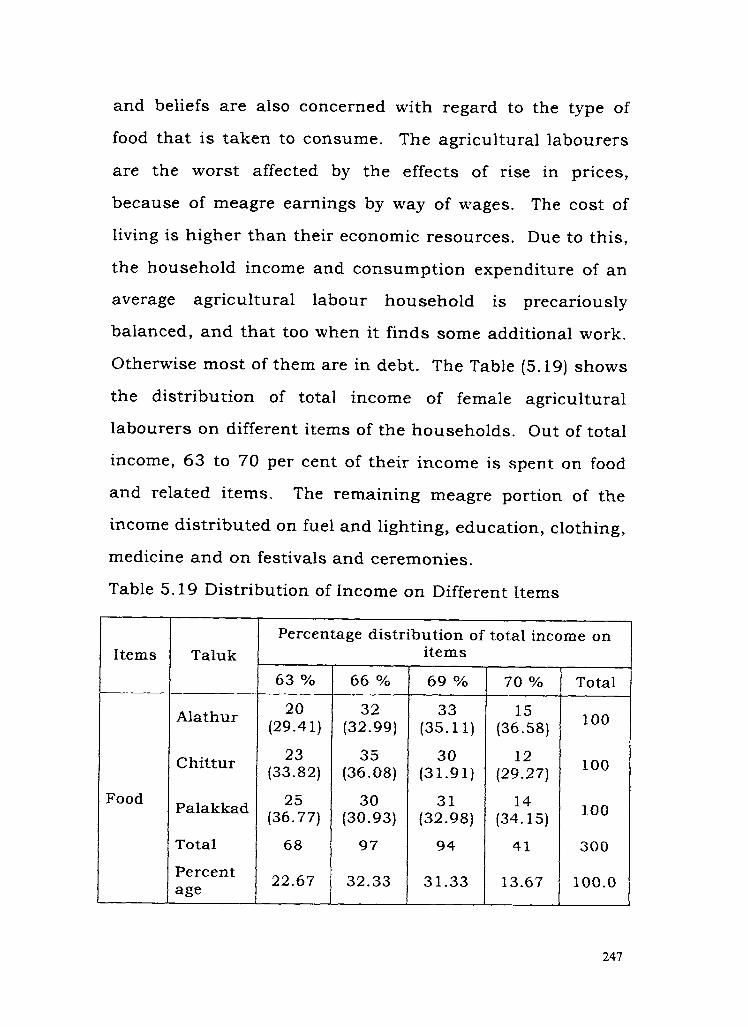
Otherwise most of them are in debt. The Table (5.19) shows
the distribution of total income of female agricultural
labourers on different items of the households. Out of total
income, 63 to 70 per cent of their income is spent on food
and related items. The remaining meagre portion of the
income distributed on fuel and lighting, education, clothing,
medicine and on festivals and ceremonies.
Table 5.19 Distribution of Income on Different Items
Items
Food
Taluk
Total
Percent age
Percentage distribution of total income on items
63 %
20 (29.41)
23 (33.82)
25 (36.77)
68
22.67
66 %
32 (32.99)
35 (36.08)
30 (30.93)
97
32.33
69 %
33 (35.1 1)
30 (31.91)
3 1 (32.98)
94
31.33
70 %
15 (36.58)
12 (29.27)
14 (34.15)
41
13.67
Total
100
100
100
300
100.0
Total
100
100
100
300
100.0
Total
100
100
100
300
100.0
Total
100
100
100
300
100.0
cent
10 (29.41)
13 (38.24)
11 (32.35)
34
11.33
9 %
12 (34.29)
9 (25.71)
14 (40.00)
35
11.67
6 %
25 (38.46)
20 (30.77)
20 (30.77)
65
21.66
5per cent
24 (28.58)
30 (35.71)
30 (35.71)
84
28.0
8 %
30 (34.09)
28 (31.82)
30 (34.09)
88
29.33
3 %
20 (33.90)
20 (33.90)
19 (32.20)
59
19.67
7 per cent
36 (34.29)
35 (33.33)
34 (32.38)
105
35.0
6 %
30 (31.25)
35 (36.46)
31 (32.29)
96
32.0
5 %
30 (28.85)
36 (34.62)
38 (36.53)
104
34.67
6 per cent
30 (38.96)
22 (28.57)
25 (32.47)
77
25.67
7 %
28 (34.57)
28 (34.57)
25 (30.86)
8 1
27.
4 %
25 (34.72)
24 (33.33)
23 (31.95)
72
24.
and Light
Clot hing
Educa tion
Taluk
Pala kkad
Total
Percent age
Taluk
Alathur
Chittur
Total
Percent age
Taluk
Chittur
Total
Percent age
Serv ices
~ ~ d i ~ i ne and Others
Miscel lane
OUS**
Note: of each category
X * In Miscellaneous item, includes the festivals and ceremonies
Taluk
Total
Percent age
Taluk
Chittur
Total
Percent age
Talu k
Chittur
Total
Percent age
Figures
3 %
32 (35.55)
28 (31.11)
30 (30.34)
90
30.00
12 %
25 (34.72)
24 (33.33)
23 (3 1.95)
72
24.
5 %
20 (31.75)
21 (33.33)
22 (34.92)
63
21.00
in
2 %
35 (33.98)
32 (31.07)
36 (34.95)
103
34.33
10 %
30 (28.85)
36 (34.62)
38 (36.53)
104
34.67
4 %
30 (30.61)
36 (36.73)
32 (32.66)
98
32.67
brackets
4 %
30 (36.14)
25 (30.12)
28 (33.74)
83
27.67
8 %
20 (33.90)
20 (33.90)
19 (32.20)
59
19.67
3 %
32 (33.68)
33 (34.74)
30 (3 1.58)
95
31.67
indicate
5 %
3 (12.50)
15 (62.50)
6 (25.00)
24
8.0
5 %
25 (38.46)
20 (30.77)
20 (30.77)
65
21.66
2%
18 (40.9 1)
10 (22.73)
16 (36.36)
44
14.66
percentage
Total
100
100
100
300
100.0
Total
100
100
100
300
100.0
Total
100
1000
100
300
100.0
to total
5.4.10.2 Expenditure on different items in sample areas
Food
Rice is the staple food of the majority of the
sample agricultural labour households. Even a small rise in
the price will affect the living standard of these workers.
The major items which they purchase for daily consumption
including rice, oil and vegetables. A s rice is the main food,
a major portion of their wages and the other income is spent
on rice alone. As a result, they are left with only little
money to purchase other food items. This is mainly due to
the lack of employment and meagre earnings of the family.
Generally the level of expenditure depends upon the level of
income. It is observed that adequate intake of calories was
not possible in these families. They spent the major part of
the income on purchase of food items that is 63 to 70 per
cent of their total income, of which 60 per cent is spent on
rice alone.
Further, in this study, it is very much
significance to take into account even tine smaller amounts
spent by the sample household in order to assess their
economic position and arrive a t an opinion. Hence, the
expenditure incurred by the families on various items is also
discussed in detail.
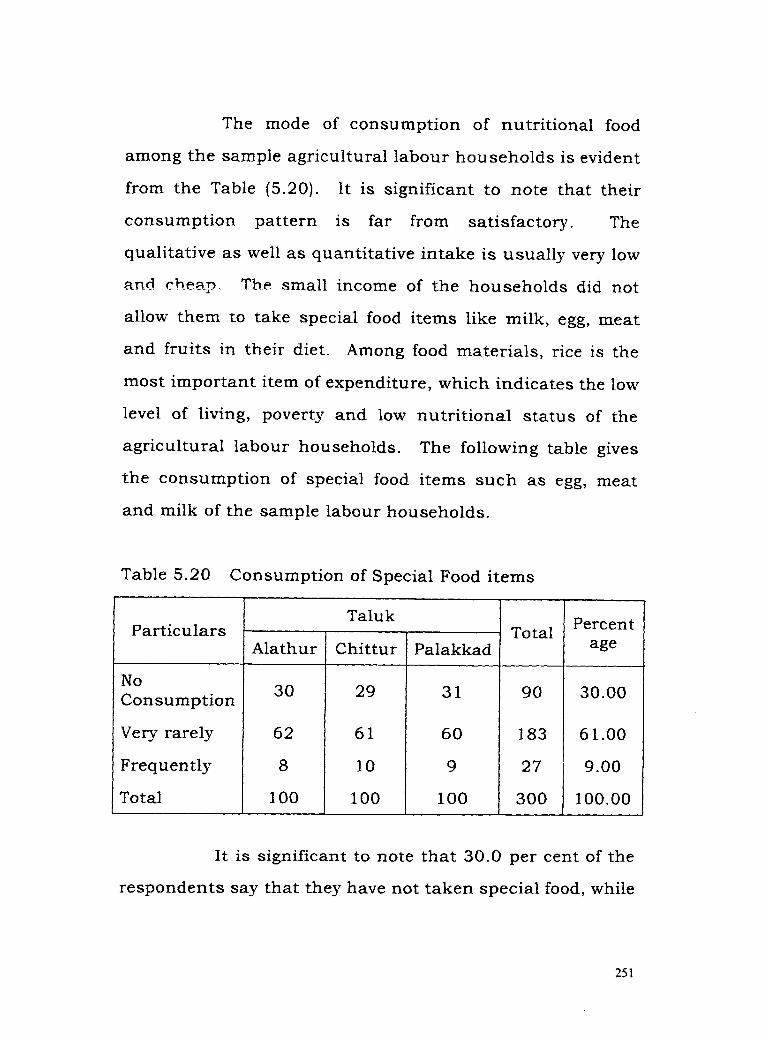
The mode of consumption of nutritional food
among the sample agricultural labour households is evident
from the Table (5.20). It is significant to note that their
consumption pattern is far from satisfactory. The
qualitative a s well as quantitative intake i s usually very low
a n d cl--eap The small income of the households did not
allow them to take special food items like milk, egg, meat
and fruits in their diet. Among food materials, rice is the
most important item of expenditure, which indicates the low
level of living, poverty and low nutritional status of the
agricultural labour households. The following table gives
the consumption of special food items such as egg, meat
and milk of the sample labour households.
Table 5.20 Consumption of Special Food items
I t is significant to note that 30.0 per cent of the
respondents say that they have not taken special food, while
Particulars
No Consumption
Very rarely
Frequently
Total
Talu k Total
90
183
27
300
Alathur
30
62
8
100
Percent age
30.00
61.00
9.00
100.00
Chittur
29
6 1
10
100
Palakkad
3 1
60
9
100
61 per cent consume it very rarely. About nine per cent of
the households frequently consume special food. I t is
evident from the above analysis that low income of the
labourers do not permit them to incur expenditure on
special food items and it is clearly seen in the case of the
scheduled caste labour households.
The sample agricultural labour households
spend the remaining income on different items such as fuel
and lighting, clothing, education, services, medicine and
festivals and ceremonies. Table (5.19) gives the details
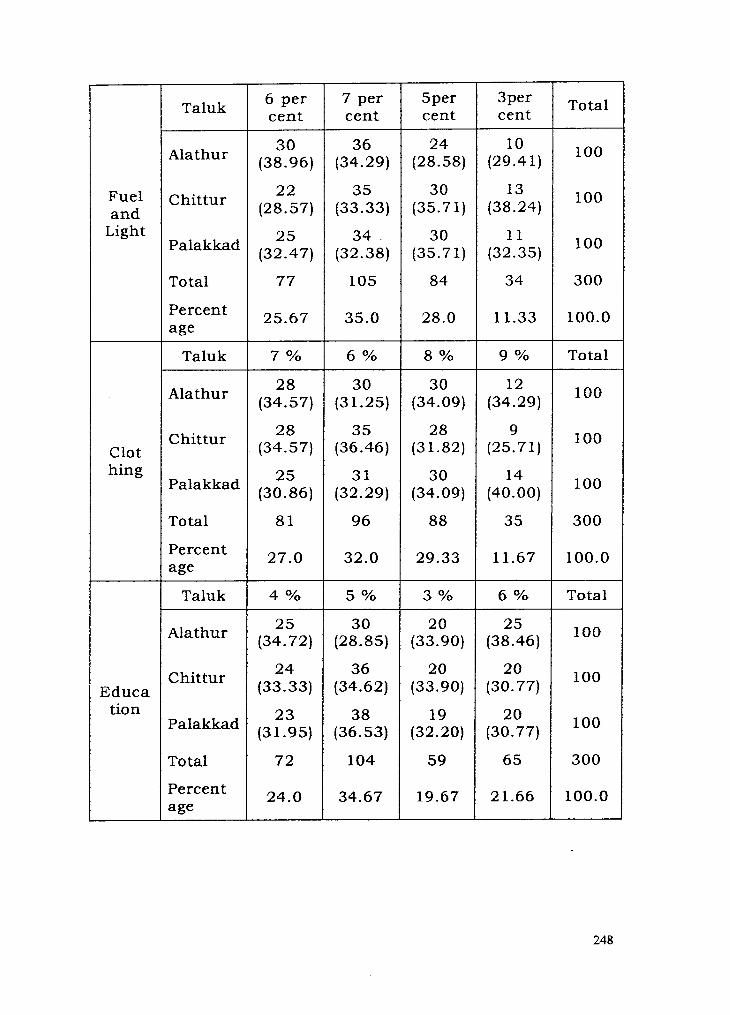
about the distribution of income on such items. ln the case
of fuel and lighting, they spend three to seven per cent of
their income. About 35 per cent of the respondents utilize
five per cent of their total income on this item. Besides, the
occasional expenditure in the family also includes the
money incurred on clothing. In fact, the labour households
spend small amount on clothing. The particulars are given
in the Table (5.19). They spend six to nine per cent of their
total income on clothing. The analysis of expenditure on
clothing reveals that the labour households cannot afford
adequate clothing for all the family members. The other
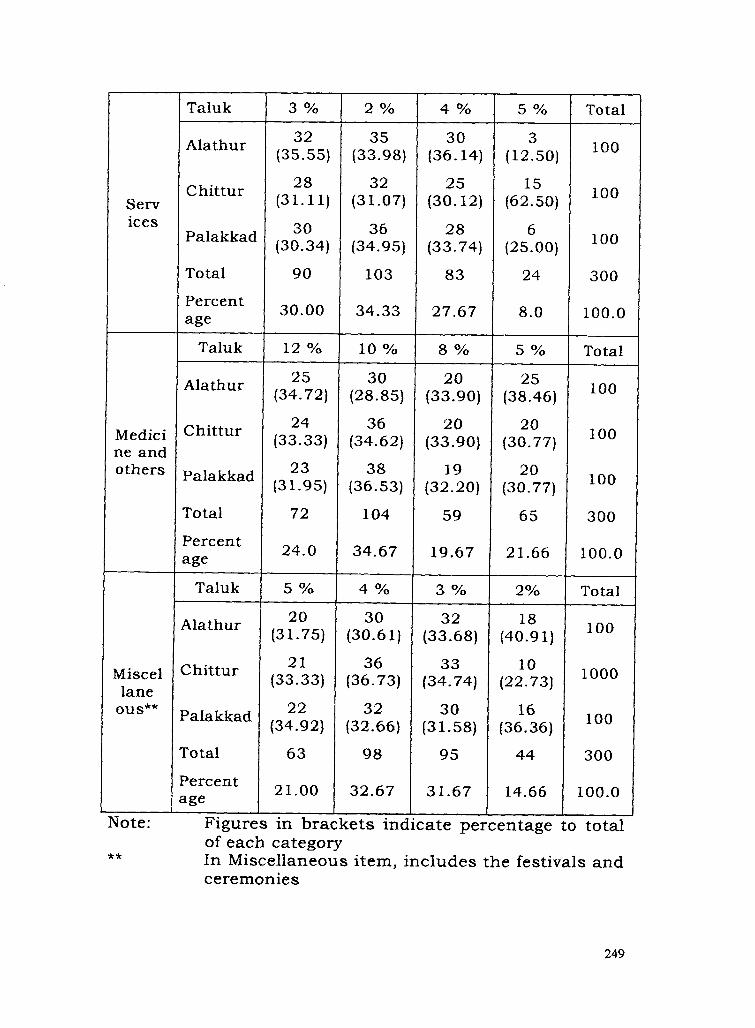
items such as medicine and other cover five to 12 per cent
for festivals and ceremonies utilize two to five per cent and
seven to 11 per cent on education and services.
On the other hand, the female labourers do not
spend money on liquor and other related articles a s the men
generally do. At the same time, about 40 per cent of the
respondents spend up to two per cent of their income every
day on chewing tobacco and 60 per cent of the households
are free from it. It is observed that the majority of the
husbands (69 per cent) spend their income on non-familial I
items slirh as liquor and on smoking and do not support the
family either by purchasing food materials or by attending
to any of the family needs. The husbands who spend their
earnings on alcohol, force the families into poverty ad
misery. Also male members bribe money of their wives and
sisters for the purposes like drinking, gambling and
conspicuous consumption. This explains that women
workers are exploited adversely. These habits not only
injurious to their health but also decreases the economic
level of the households. The husbands spend what they
earn a t the liquor shops than for the welfare of the
households. A s a consequence it will deteriorate the status
of agricultural labour households especially that of female
labourers.
Most of the respondents (78 per cent) firmly
expressed that women should have an income of their own.
Income in women's hands could benefit not only to women

but the whole family, in greater extent than income solely in
men's hands. There are systematic gender inequalities in
access to basic necessities with in households. There are
also notable gender differences in income spending patterns.
From the views expressed by the labour women, it is clear
that there is a correlation between the needs for which the
women's income is spent and the point a t which she
considers it as necessary. The female labourers spend their
income on absolute necessities and they consider it as
essential. This can be understood by their answers, which
included meeting the prim: needs of Life.
5.4.11 Saving Patterns of the Sample Agricultural Labourers
The size of distributed income of the respondents
is not adequate in order to meet the daily requirements.
They spend major part of their income on consumption and
therefore, only the groups higher in the scale would be able
to save. The chance for saving, among the agricultural
labourers is relatively low. The lower income during their
working days, seasonal employment, low wages, number of
family dependents, all force them to discourage from the
aspect of saving. Because of low wage and income, they are
not able to meet the basic necessities of life. .The
consumption pattern reveals that they are not in a position
fulfilling th-eir minimum facilities. In such a situation, there
is no question of saving either in the form of money or
consumer durables. In order to fulfil1 the traditional
ceremonies and customs in the society such a s marriage
and ceremonies, they often borrow from moneylenders or
land owners a t high rate of interest.
Agricultural labourers' savings are primarily on
property or land requirement, livestock and the reduction of
mortgages and other debt, relatively little is in LIC,
government bonds or bank deposits. I t is important to note
that though large number of the respondents is in debts,
few of them could save money to meet the incidental
expenses with their savings. But they have no regular
saving. It is also significant to note from the Table (5.21)
that 25 per cent of the respondents who have saving, have -
chosen kuries to keep their savings. The remaining persons
have not chosen either in kuries or in banks and keep their
savings with secretly. They interested the keep their own
savings with them secretly. The necessities rather
compelled them to give top priority such as payment of
debts and marriage of children rather than spending the
savings on productive purposes.
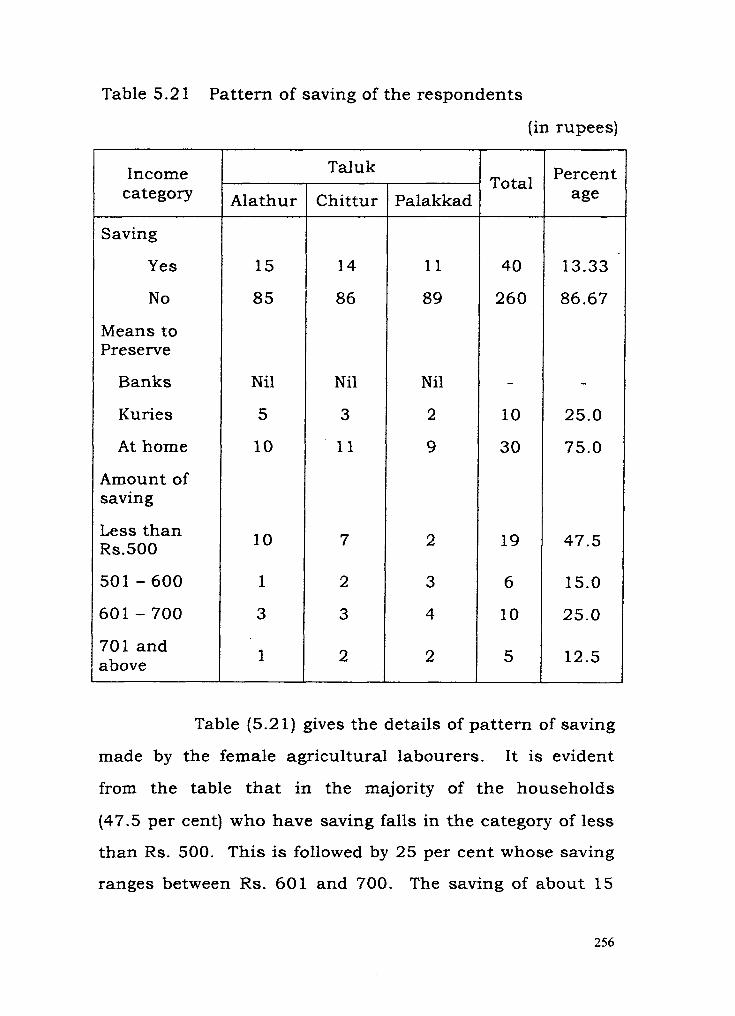
Table 5.21 Pattern of saving of the respondents
(in rupees)
Table (5.21) gives the details of pattern of saving
made by the female agricultural labourers. I t is evident
from the table that in the majority of the households
(47.5 per cent) who have saving falls in the category of less
than Rs. 500. This is followed by 25 per cent whose saving
ranges between Rs. 601 and 700. The saving of about 15
Income
Saving
Yes
No
Means to Preserve
Banks
Kuries
At home
Amount of saving
Less than Rs.500
501 - 600
601 - 700
701 and above
Alathur
15
85
Nil
5
10
10
1
3
1
Total
40
260
-
10
30
19
6
10
5
Percent age
13.33
86.67
25.0
75.0
47.5
15.0
25.0
12.5
Taluk
Chittur
14
86
Nil
3
11
7
2
3
2
Palakkad
1 1
89
Nil
2
9
2
3
4
2
per cent of the respondents falls between Rs. 501 and 600.
Only 12.5 per cent of them, who have saving falls in the
category of Rs. 70 1 and above.
5.4.12 Indebtedness of Sample Labour Households
Indebtedness is a growing problem and a malady
among the rural agricultural labour households. The plight
of agricultural labours in particular, is worse, primarily due
to their meagre earnings. The poverty creating wages,
seasonal nature of employment and the consequences of
inflation lead the rural agricultural labourers to a large
scale indebtedness. Their condition is extremely poor and
to fill the gap between the income and expenditure, they
depend mostly upon the landowners and village
moneylenders at an increased rate. This always increased
the incidence of indebtedness among these rural labourers.
The pattern of rural indebtedness and
accessibility to credit are other indicators of deterioration in
the condition of lower strata of rural labour households.
Rural female labourers did not get any chance to over come
the socio economic backwardness. A s a result, the over
crowding of these labourers in agriculture sector is still
continued. They remain indebted not only because of they
happen to be poor but also due to the tendency to spend
more than what they can afford on the social and personal
gratification including their husband's addiction and
gambling.
It is evident form Table (5.22) that 67.34 per cent
of the female agricultural labourers' households are in debt
and 32.66 per cent of the households are free from debts.
The majority of the agricultural labour households are
indebted and the amounts they owe range from less than
1000 to 7001 and above. It is significant to note that 43.56
per cent of the labourers owe amounts ranging from
Rs.300 1 to 5000. They are followed by 17.33 per cent of the
respondents who owe amounts in the range of less than
Rs. 1000 and 15.84 per cent of the respondents have debts
ranging between Rs. 1000 to Rs. 2000.
Table (5.22) also furnishes the details of various
source of loan available to the agricultural labour
households. It is significant to note from Table (5.22) that
57.92 per cent of the sample households took loans from the
moneylenders and landowners. About 30.20 per cent
borrowed from private institutions. Only 11.88 per cent of
the respondents approached banks to raise loans. The
above analysis reveals the fact that the majority of

households are in the clutches of the moneylenders and
landowners. The pressing needs compelled the sample
respondents to seek loans from the landlords at high rates
of interest.
Table 5.22 Particulars af Amount and Source of Laan
Among the Sample Labour Households
Items
Indebtedness
Yes
No
Amount (in rupees)
Less than 1000
100 1-3000
3001-5000
5001-7000
7001 and above
Total
Source of Loan
Banks
Private institutions
Money lenders and Landowners
Total
Alathur
66
34
7
10
30
15
4
66
8
20
38
66
Total
202
98
35
32
88
30
17
202
24
6 1
117
202
Tafuk
Chittur
67
33
13
10
30
7
7
67
6
2 1
40
67
Percent age
67.34
32.66
17.33
15.84
43.56
14.85
8.42
100
11.88
30.20
57.92
100.0
Palakkad
69
3 1
15
12
28
8
6
69
10
20
39
69
-l
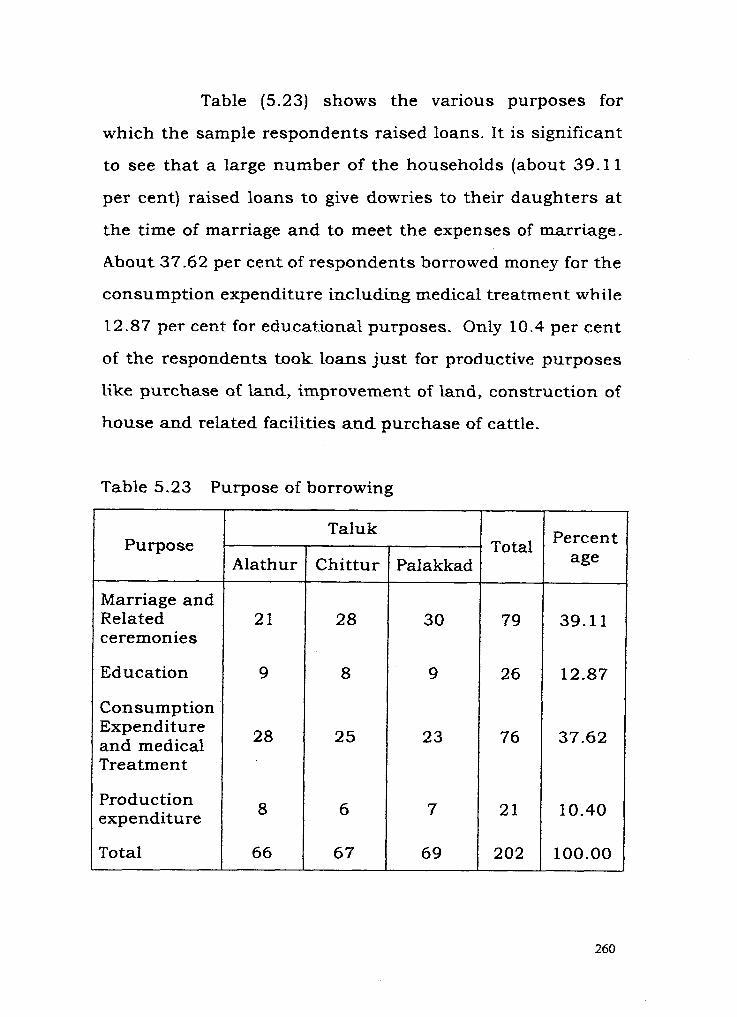
Table (5.23) shows the various purposes for
which the sample respondents raised loans. I t is significant
to see that a large number of the households (about 39.11
per cent) raised loans to give dowries to their daughters a t
the time of marriage and to meet the expenses of marriage.
About 37.62 per cent of respondents borrowed money for the
consumption expenditure including medical treatment while
12 -87 per cent for educational purposes. Only 10.4 per cent
of the respondents took loans just for productive purposes
like purchase a€ land, improvement of land, construction of
house and related facilities and purchase of cattle.
Table 5.23 Purpose of borrowing
Purpose
Marriage and Related ceremonies
Education
Consumption Expenditure and medical Treatment
Production expenditure
Total
Talu k Total
79
26
76
2 1
202
Alathur
2 1
9
28
8
66
Percent age
39.11
12.87
37.62
10.40
100.00
Chittur
28
8
25
6
67
Palakkad
30
9
23
7
69
Though there are innumerable reasons for
gender discrimination, the old tradition belief of the society
that men are masters and decision makers has been one of
the major reasons for the subordinate role of women.
Women from agricultural labour households do have some
say in the matter and they have access and control to some
resources. However, in absolute terms the condition is not ',
encouraging. Gender discrimination exists in almost all
fields. It is a n established fact that most women are often
conditioned into unquestioned submission to biases and
discrimination which they view as socially ordained and
therefore irrevocable.
The constitution of India bestows equal rights
and opportunities on all i ts citizens. A s can be made out
from the general situation, women are more unequal in the
patriarchal society of the world, more so with women in all
regions like Palakkad. In the process of development,
women have been marginalized and their male counter parts
have control over their lives, property, assets, productive
sources, power and decision making. In many cases she is
the custodian of her wages and salary till she arrives home.
Her income later becomes part of the total income of her
family. In a societal situation, men and women have
differential access to opportunities and services from times

immemorial. It is no exaggeration to infer that the same
situation continues to obtain even today, both in the
developed and developing regions with some degree of
variation.
The over all socio-economic status is a summary
index composed of measures of socio-economic condition - education, occupation, income and material possession. A
person who has a low status in the caste hierarchy also has
Low status in other hierarchies of the society such as
economic and political. A s reflected from various socio-
economic indicators Like income, wage rates, consumption
expenditure, asset holding, level of indebtedness, female
labourers constitutes a major part of the lowest strata of the
society. I t is a fact that agricultural labourers constitute a
significant proportion of the total female labour force in
Palakkad district of Kerala. Measured by all yard sticks by
which economic and social progress are being assessed, the
vast bulk of the female agricultural labour community
continues to remain in a low state even though some
individuals have reached significant heights. They are so
backward and poor that they are unable to fight against the
exploitation and gradually lost their social status leading to
the formation of the lowest stratum of the society.

References
Aijazuddin, Moonis Raza and Nuna, Ahmad Sheel. C.,
School Education in India, The Regional Dimension,
National Institute of Educational Planning and
Administration, New Delhi, 1990.
Baby, A.A., Trends in Agricultural Wages in Kerala, The Indian Journal of Labour Economics, Vol. 40, No.2,
April - June, 1997.
Buchanan, Francis., A Journey From Madras through the
Countries of Mysore, Canara and Malabar, Published
by J. Jetley for Asian Educational Services, Vol. 11,
New Delhi, 1807.
George, Jose., Unionisation and Politicisation of Peasants and Agricultural Labourers in India (with special
Reference to Kerala) Common Wealth Publishers, New
Delhi, 1992. \
India, Government of., Towards Equality : Report of the Committee on the Status of Women, Department of Social Welfare, Ministry of Education and Social
; Welfare, New Delhi, 1974.
p? Census of India, Series 10, Kerala, Palghat District, 1981.
Kareem, C. K,, Kerala Gazetteers, Kerala District Gazetteers
Palakkad, Trivandrum, 1976.

Kerala, Government of, Panchayat Levels Statistics,
Palakkad District, Department of Economics and
Statistics, 1996.
, Economic Review, State Planning Board,
Thiruvananthapuram, 1997.
Travancore and Cochin, Govt. of, Report of the Minimum
Wages Committee for Employment in Agriculture,
1956.
Veena, D.R., Education and Economic Growth, Ashish
Publishing House, New Delhi, 1987.
Zachariah, K.C., Demographic Transition in Kerala in the 1980s Results of a Survey in Three Districts, Gujarat
Institute of Area Planning, Ahmedbad, 1992.


![d1q42nthqku6ef.cloudfront.net...2015 New Items C] # 55931 Hattie's Market C] # 55950 Lubbock's BBQ a # 55951 Farmhouse # 55924 Snow Peak Lodge Sit-N-Stay Dog Training # 55934 Bonnie's](https://static.fdocuments.us/doc/165x107/5f027be57e708231d4047d7c/-2015-new-items-c-55931-hatties-market-c-55950-lubbocks-bbq-a-55951.jpg)