Socio-Economic Benefits of Austin’s Tree Canopy Final report presented by: Kyle Fuchshuber...
35
Socio-Economic Benefits of Austin’s Tree Canopy Final report presented by: Kyle Fuchshuber (Project Manager) Jerad Laxson (Asst. Project Manager) Megan Thomas (Editor & Researcher) Eric Tijerina (Graphic Designer & Researc Zachary Dye (GIS Specialist & Researcher
-
Upload
mabel-barker -
Category
Documents
-
view
215 -
download
0
Transcript of Socio-Economic Benefits of Austin’s Tree Canopy Final report presented by: Kyle Fuchshuber...

Socio-Economic Benefits of Austin’s Tree Canopy
Final report presented by:
Kyle Fuchshuber (Project Manager)
Jerad Laxson (Asst. Project Manager)
Megan Thomas (Editor & Researcher)
Eric Tijerina (Graphic Designer & Researcher)
Zachary Dye (GIS Specialist & Researcher)

IntroductionUrban Tree Canopy and Socio-Economic
Benefits:◦ Carbon sequestration◦ Reduce Storm Water Runoff◦ Energy Reduction◦ Higher Quality of Life◦ Less $$(United State Environmental Protection Agency)
Benefits of our study◦ COA legislative decisions◦ Green future that is economically feasible for Austin, TX

Primary Areas of StudyCrime rates
◦Lower crime = less costs and happy citizens
Property values◦Higher property value = higher
property taxes and affluent citizens

Property Values ResearchTwin Cities
◦Increasing tree cover w/in 250 meters = 60% gain in home sale prices
Comparison Model◦How do external factors relate?
(Sander 2010)
Kyle Fuchshuber
External variables rather than model

Crime Rates researchBaltimore
◦Strong negative relationship
Portland◦Moderately negative in old growth
forests(Donovan, Prestemon, 2010)

Methodology – Tree Canopy and Property Values
Single-family residences extracted from parcel data
Averages of tree canopy percentages and property market prices per square foot joined to relative census tract area

Apparent patterns…
• Census tracts are assigned average market price of single-family parcels within tract area
• Percent tree canopy is assigned to census tracts in same manner

◦Geographically Weighted Regression Explanatory variables:
Percentage of tree cover Texas Education Agency ranked schools Proximity to parks/natural attractions Proximity to Cultural Attractions (Theatres, Shopping, Nightlife)
Methodology – Tree Canopy and Property Values

= Property Value
Geographically Weighted Regression
𝛽1𝑇𝑟𝑒𝑒 𝑐𝑎𝑛𝑜𝑝𝑦+𝛽2 h𝑆𝑐 𝑜𝑜𝑙𝑠+𝛽3 𝑃𝑎𝑟𝑘𝑠+𝛽4𝐶𝑢𝑙𝑡𝑢𝑟𝑎𝑙 𝐴𝑡𝑡𝑟𝑎𝑐𝑡𝑖𝑜𝑛𝑠

Ranking of Parks/Natural Areas - Ranking census tracts
a. Rank parks by size b. Assign Value by Parks Number
Rangec. Rank Census
Tract by Value of Parks in
Individual Tract Parks Ranking
- Hot Spot Isolation a. CoA Data Used b. Bufferc. Clip with Study
Area d. Intersect Findings for Final

Ranking Schools Most Important Areas:
◦ Shopping Centers/Malls
◦ Cinemas/Theaters
◦ Nightlife
Each venue/area was then weighted:◦ No venues = 0◦ Theater, performing
arts center, or cinema = 1
◦ Nightlife area = 1◦ Regular shopping
center =1◦ Major shopping
center or mall = 2.
If more than one venue exists in a census tract, the values are added up, for a total of up to 5. Values ranged from 0 to 5.
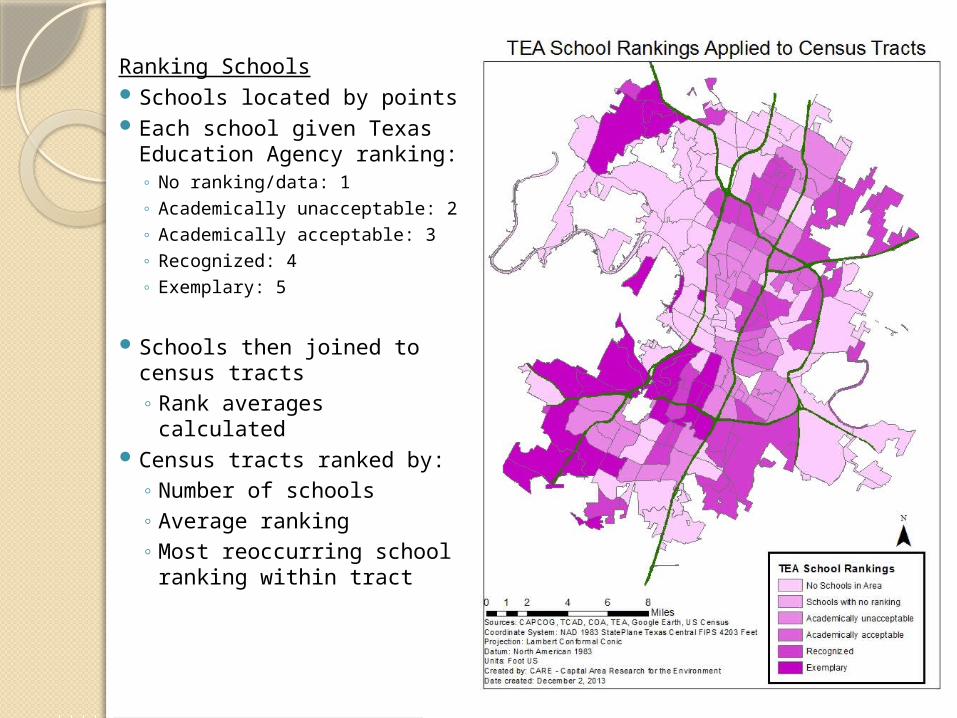
Ranking Schools Schools located by points Each school given Texas
Education Agency ranking:◦ No ranking/data: 1◦ Academically unacceptable:
2◦ Academically acceptable: 3◦ Recognized: 4◦ Exemplary: 5
Schools then joined to census tracts◦ Rank averages
calculated Census tracts ranked by:
◦ Number of schools ◦ Average ranking◦ Most reoccurring school
ranking within tract

Tree Canopy’s Effects upon Property Values:
Results

Prediction follows High Value = High Tree Coverage pattern• Tree Cover and Property
Value are directly correlated with no explanatory variables
• Prediction follows hypothesis: higher percentage of tree cover is associated with higher property values

Prediction with considerations• Property value is
correlated to tree cover as well as other explanatory variables
• Areas closer to central business districts and proximity to parks also have an influence on property values

Direct Correlation
• Tree Cover and Property Value are directly correlated with no explanatory variables
• Darker hues of red indicate that the area’s property values are more sensitive to tree cover

Explanatory Variables give closer look of reality• Property value’s
sensitivity to tree cover is correlated with tree cover as well as other explanatory variables
• Area of highest positive correlation represents 23% of Austin’s singe family homes.

Conclusions23% of all single-family parcels
will benefit greatly from tree coverage.
Tree canopy has a positive correlation to property values in the City of Austin

DataTCAD Parcels – Percent Tree
Canopy and Property Market Prices
US Census TractsTEA – School RankingsCAPCOG – City of Austin BorderGoogle Earth – Cultural
AttractionsCity of Austin - Parks
Tree Canopy’s Effects upon Crime Rates:
Results
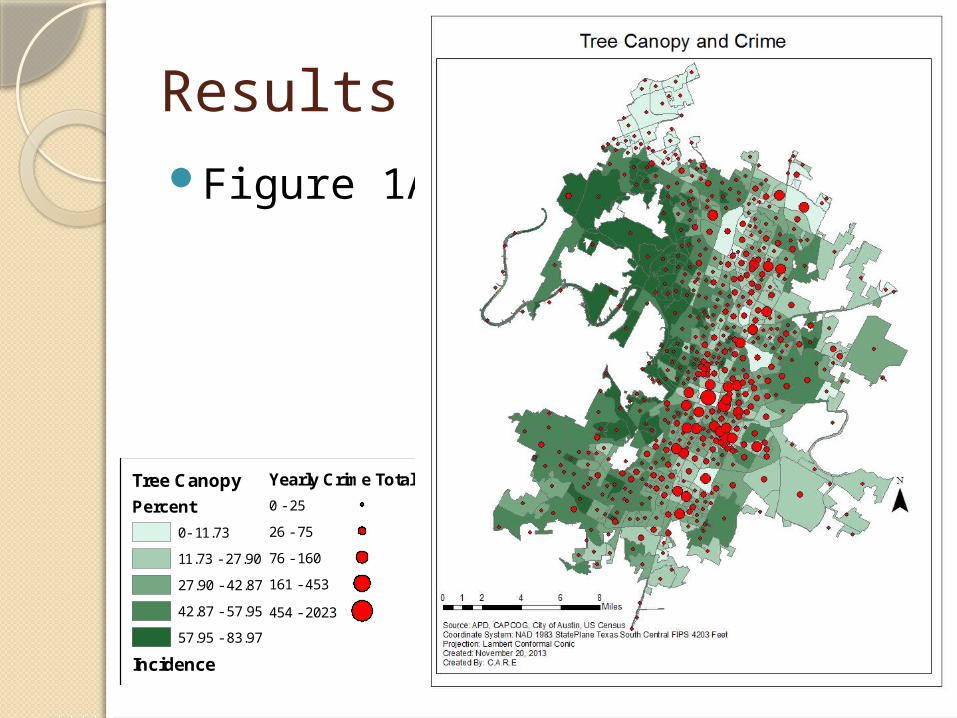
Results Figure 1A:
Tree Canopy
Percent
0- 11.73
11.73 - 27.90
27.90 - 42.87
42.87 - 57.95
57.95 - 83.97
Incidence
Yearly Crime Total
0 - 25
26 - 75
76 - 160
161 - 453
454 - 2023
Kyle Fuchshuber
Suitability model or COA

ResultsFigure 1B:
Violent Crimes
Yearly Total
0 - 12
13 - 35
36 - 67
68 - 317
318 - 1149
Tree Canopy
Percent
0- 11.73
11.73 - 27.90
27.90 - 42.87
42.87 - 57.95
57.95 - 83.97

Results Figure 2A:
Sensitivity to Tree Canopy
Crime
-2.85 - -2.52
-2.52 - -2.10
-2.10 - -1.67
-1.67 - -1.29
-1.29 - -0.95
-0.95 - -0.64
-0.64- -0.04
Kyle Fuchshuber
External variables rather than model

ResultsFigure 2B:
Confidence
R Squared
0 - 0.02
0.02 - 0.04
0.04 - 0.05
0.05 - 0.062
0.06 - 0.08
0.08 - 0.12
0.12 - 0.19

ResultsFigure 3A:
Sensitivity to Tree Canopy
Violent Crime
-5.25 - -4.23
-4.23 - -3.23
-3.23 - -2.08
-2.08 - -1.20
-1.20 - -0.65
-0.65 - -0.07
-0.07 - 0.89

Results◦Figure 3B:
Confidence
R Squared
0 - 0.04
0.04 - 0.08
0.08 - 0.11
0.11 - 0.15
0.15 - 0.20
0.20 - 0.30
0.30 - 0.47

ResultsFigure 4A:
Sensitivity to Tree Canopy
Violent Crime
-1.54 - -1.30
-1.30 - -1.05
-1.05 - -0.77
-0.77 - -0.55
-0.55 - -0.37
-0.37 - -0.22
-0.22 - 0.17
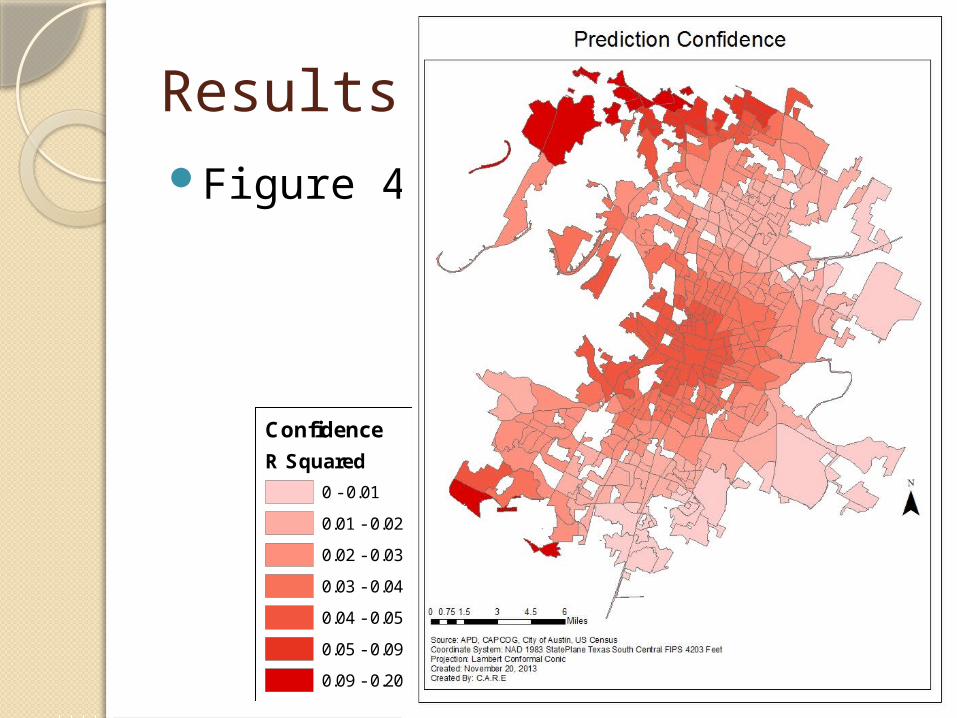
ResultsFigure 4B
Confidence
R Squared
0 - 0.01
0.01 - 0.02
0.02 - 0.03
0.03 - 0.04
0.04 - 0.05
0.05 - 0.09
0.09 - 0.20

ResultsFigure 5A
Sensitivity to Cree Canopy
Violent Crime
-3.05 - -2.40
-2.40 - -1.81
-1.81 - -1.27
-1.27 - -0.72
-0.72 - -0.29
-0.29 - 0.06
0.06 - 0.61

ResultsFigure 5B
Confidence
R Squared
0 - 0.03
0.03 - 0.07
0.07 - 0.10
0.10 - 0.14
0.14 - 0.19
0.19 - 0.24
0.24 - 0.35

Discussion Correlation is not particularly
significant.
More variables need to be considered.
Model could have been more confident in its prediction.

ConclusionIncrease in tree canopy
decreases crime.
Greater relationship near downtown.

DataTCAD Parcels – Percent Tree
Canopy and Property Market Prices
US Census TractsTEA – School RankingsCAPCOG – City of Austin BorderGoogle Earth – Cultural
AttractionsCity of Austin - Parks

GIS DATADescription File_Name Feature Type Source
Street Centerlines STREETS.zip Lineftp://ftp.ci.austin.tx.us/GIS-Data/Regional/coa_gis.html
City of Austin Parks coa_parks.zip Polygonftp://ftp.ci.austin.tx.us/GIS-Data/Regional/coa_gis.html
2010 Censuscensus2010_blocks_uscensus.zip Polygon http://txsdc.utsa.edu/
City Limit Boundary capcog_city_limits.zip Polygon CAPCOG
Crime Incident_Extract.csv Point Austin Police Department
Austin Tree and Tax Data TCAD_parcels_2010/zip Polygon
ftp://ftp.ci.austin.tx.us/GIS-Data/PARD/Regina/
Description Attributes Used 2010 Census Income data Tracts
Austin Tree and Tax DataPercent tree canopy/ Land use tax codes
Single family use and commercial use
Market value of parcels Acreage

Sources Donovan, Geoffrey H., Jeffrey P. Prestemon. (2012)The effect
of trees on crime in Portland, Oregon. Environment and Behavior. 44(1): 3-30.
Sander, H., Polasky, S. & Haight, R. G. (2010). The value of urban tree cover: A hedonic property price model in Ramsey and Dakota Counties, Minnesota, USA. Ecological Economics 69(2010), 1646-1656. http://www.nrs.fs.fed.us/ pubs/jrnl/2010/nrs_2010_sander_001.pdf
United States Environmental Protection Agency, (2008).Reducing urban heat islands: Compendium of strategies (Chapter 2: Trees and Vegetation). Retrieved from website: http://www.epa.gov/heatisland/resources/compendium.htm