SOCIO-CULTURAL AND WITHIN-SCHOOL FACTORS THAT …
45
SOCIO-CULTURAL AND WITHIN-SCHOOL FACTORS THAT AFFECT THE QUALITY OF IMPLEMENTATION OF SCHOOL-WIDE PROGRAMS Robert Cooper Johns Hopkins University Report No. 28 December 1998 Published by the Center for Research on the Education of Students Placed At Risk (CRESPAR), supported as a national research and development center by the Office of Educational Research and Improvement, U. S. Department of Education (R-117-D40005). The opinions expressed in this publication do not necessarily reflect the position or policy of OERI, and no official endorsement should be inferred.
Transcript of SOCIO-CULTURAL AND WITHIN-SCHOOL FACTORS THAT …

SOCIO-CULTURAL AND WITHIN-SCHOOL FACTORSTHAT AFFECT THE
QUALITY OF IMPLEMENTATION OF SCHOOL-WIDE PROGRAMS
Robert Cooper
Johns Hopkins University
Report No. 28
December 1998
Published by the Center for Research on the Education of Students Placed At Risk (CRESPAR),supported as a national research and development center by the Office of Educational Research andImprovement, U. S. Department of Education (R-117-D40005). The opinions expressed in thispublication do not necessarily reflect the position or policy of OERI, and no official endorsementshould be inferred.

iii
The Center
Every child has the capacity to succeed in school and in life. Yet far too many children,
especially those from poor and minority families, are placed at risk by school practices that
are based on a sorting paradigm in which some students receive high-expectations instruction
while the rest are relegated to lower quality education and lower quality futures. The sorting
perspective must be replaced by a “talent development” model that asserts that all children
are capable of succeeding in a rich and demanding curriculum with appropriate assistance and
support.
The mission of the Center for Research on the Education of Students Placed At Risk
(CRESPAR) is to conduct the research, development, evaluation, and dissemination needed
to transform schooling for students placed at risk. The work of the Center is guided by three
central themes — ensuring the success of all students at key development points, building on
students’ personal and cultural assets, and scaling up effective programs — and conducted
through seven research and development programs and a program of institutional activities.
CRESPAR is organized as a partnership of Johns Hopkins University and Howard
University, in collaboration with researchers at the University of California at Santa Barbara,
University of California at Los Angeles, University of Chicago, Manpower Demonstration
Research Corporation, University of Memphis, Haskell Indian Nations University, and
University of Houston-Clear Lake.
CRESPAR is supported by the National Institute on the Education of At-Risk
Students (At-Risk Institute), one of five institutes created by the Educational Research,
Development, Dissemination and Improvement Act of 1994 and located within the Office of
Educational Research and Improvement (OERI) at the U.S. Department of Education. The
At-Risk Institute supports a range of research and development activities designed to improve
the education of students at risk of educational failure because of limited English proficiency,
poverty, race, geographic location, or economic disadvantage.

v
Abstract
The Success for All school restructuring program is currently being implemented in
more than 1,100 elementary schools nationwide, primarily in urban locations. This study
conducted quantitative and qualitative analyses of the quality of implementation in a sample
of more than 350 of these schools, to examine how the Success for All program and other
school-wide restructuring programs can best maintain their integrity and quality as they
simultaneously adapt to local school and community contexts. The data collection strategies
included surveys, one-on-one interviews, group interviews, focus groups, and school site
observations. The goal of the analyses was to document the evolution of the implementation
process and identify factors that contribute to the successful replication of Success for All and
the scaling up process. The analyses examined factors related to quality of implementation in
schools where the implementation was identified as high quality, medium quality, and low
quality.
The quantitative analyses identified six within-school factors and three socio-cultural
factors that significantly influenced quality of implementation of the program. The within-
school factors that contributed to high quality implementation were the creation of a
supportive culture for institutional change, the overcoming of program resistance on the part
of a minority of teachers, a commitment to implementing the structures of the program, a
strong school-site facilitator, less concern among teachers for handling an increased
workload, and availability of program materials. The three socio-cultural factors that
contributed to high quality implementation were lower student mobility, higher school
attendance rate, and a greater percent of the student body being white.
Qualitative analyses based on case studies of 25 of the schools implementing the
program provided further elaboration on the influence of the racial composition of the student
body in the schools, the factors involved in program resistance, and the importance of each
school having a full-time school-site facilitator.

vii
Acknowledgments
Thanks to the many principals, school site facilitators, and teachers who made this
research possible. Also many thanks Bob Slavin and Nancy Madden for their continued
support and feedback on an earlier draft of this report.

1
Introduction
Over the last two decades, numerous national studies and reports have documented
both the struggles and failings of public education. The release of A Nation at Risk (1983)
shifted the focus and priority of existing national policy, moving the reform of public
education to the top of the public policy agenda (Lusi, 1997). Educators, policymakers, and
researchers alike concluded that a large number of schools, particularly in high poverty urban
centers, were ineffective at meeting the needs of diverse student populations. As a result, an
alarming number of U.S. students are placed at risk of school failure. The negative social,
political, and economic implications of an entire generation that is inadequately prepared to
compete in the international labor market resulted in a call for fundamental changes in
American public education.
In response to this call for change, a plethora of restructuring/reform projects have
emerged. In this era of abundant school reform options, a school’s decision to adopt and
champion an effective reform initiative is oftentimes very complex. Many of the recent
changes advocated by policymakers in curriculum, instructional delivery, organizational
structure, and school governance represent a fundamental shift in thinking about school
organization and operation, particularly in high poverty schools. Recent studies have
concluded that high poverty schools, as compared to low poverty schools, have less of an
academic focus (U.S. Department of Education, 1993); consequently, many of the new
reform efforts targeted at high poverty schools have an academic emphasis. The trend is
towards providing students with increased opportunities to be exposed to literature and
advanced mathematics, do creative writing, and work collaboratively with their peers.
Research suggests that high quality implementation is one of the greatest determinants
of success with school reform (Cooper & Slavin, 1998). Thus, understanding the factors that
affect the process of reform implementation has become increasingly important. The goal of
this study is to examine how socio-cultural and within-school factors can affect quality of
program implementation, based on the experience of implementing and evaluating the Success
for All program, one of the nation’s most successful school-wide restructuring efforts.
Although observational and interview studies (e.g., Stringfield et al., 1997; Cooper et al.,
1998) have suggested factors necessary to ensure effective implementation, particular
attention is given to how socio-cultural issues interact with those factors in this analysis.
Another goal is to provide insight on the implementation process of a comprehensive set of
changes in school organization, curriculum, and teaching.

2
Additionally, this research seeks to provide guidance to educators, policymakers, and
researchers, all of whom agree that change in our public education system is needed, but who
lack certainty on how best to lead, implement, and manage the process of change. The lessons
learned here can inform both local and national reform efforts.
Since the inception of Success for All in the 1980s, research has documented its
success in improving students’ reading achievement. If SFA is to fundamentally change the
schooling experience of America’s youth and assure that all students are equipped with basic
reading skills by age nine, it is imperative that educators understand the process by which this
can occur. This research illuminates the need for educators, policymakers, and researchers to
focus on the process of school reform.
Success for All (Slavin et al., 1992, 1994, 1996a) is a program designed to
comprehensively restructure elementary schools that serve children at risk of school failure.
Designed for students in grades pre-K to five, one of the primary goals of the program is to
prevent remediation and empower every student to become academically successful. Because
the elementary school’s definition of success, and usually the parent’s and child’s definition
as well, is overwhelmingly proficiency in reading, the program organizes resources to ensure
that virtually every student will perform at or near grade level in reading by the third grade,
maintain this status through the end of the elementary years, and avoid retention or special
education. Obviously, other subjects are important, but reading and language arts are at the
core of “school success” in the early grades (Slavin et al., 1995).
While none of the elements of Success for All are completely new or unique, what
makes Success for All most distinctive is that it is school-wide, coordinated, and pro-active.
The implementation of SFA requires substantial change not only in curriculum and
instruction, but also in the roles, relationships, and structures embedded within the schools.
This challenges the conventional wisdom of many school communities regarding how schools
should be organized and operated. In SFA, attention is focused on providing every student
with the support system he/she needs to be a successful reader by the end of the third grade.
Given that students learn to read in different ways and at different rates, SFA attempts to
institute a variety of support systems to increase the probability that all students will be
successful. Two basic principles guide the implementation of the Success for All program —
prevention and early intervention (Slavin et al., 1994). While a child who can read is not
guaranteed to be a success in elementary school, a child who cannot is guaranteed to be a
failure (Slavin et al., 1996).

3
Theoretical Framework
Using Multiple Conceptual Perspectives to Understand Urban School Reform
This analysis uses a conceptual framework which views school change from four
distinct, although overlapping, perspectives. Each perspective illuminates how factors are
institutionalized to ensure the quality and longevity of the program. Research suggests that
multiple conceptual perspectives provide a more comprehensive picture of the key elements
that determine how schools are organized and operate (Cooper et al., 1998). Exploring the
dimensions of the scaling up process of SFA illuminates important individual, yet
interconnected facets of school-wide change. Conceptual perspectives provide a more
comprehensive picture of the complexities of the structures, strategies, practices, and
relationships associated with school change. Using conceptual perspectives allows us to tap
into the various dimensions of the schooling process which are critical to understanding
school reform.
Four conceptual perspectives, presented in Figure 1, are particularly helpful in
understanding school reform. Three of these — the technical, normative, and political —
build upon the work of Jeannie Oakes (1992). Given the vastly diverse settings of Success for
All’s implementations, a fourth perspective was added (see Cooper et al., 1997). This
perspective focuses on the social, cultural, and environmental factors that affect school
reform, but are oftentimes given little attention. Adding this fourth dimension to the analysis
provides greater insight into the constraints and challenges faced by many urban school
communities. The socio-cultural factors are intricate components of the change process and
can greatly affect the level and quality of implementation of education innovations.
Of these four perspectives, the technical perspective taps into the dimension that is the
most pragmatic. This dimension involves changes in school structures, strategies, and
practices. Exploring SFA’s technical dimensions illuminates the program’s commitment to
integrate theory and practice. The second perspective that helps us better understand urban
school reform provides a normative perspective. This perspective exposes the values, ethos,
and attitudes that drive policy and practice within urban schools. Furthermore, this
perspective gives insight into the ideological barriers that schools encounter in the reform
process and that individuals encounter when asked to alter attitudes, behaviors, and practices.
The third perspective — the political perspective — focuses on the redistribution of decision-
making power, illuminating how, when, and which individuals participate in reform. This is
a particularly important aspect of SFA because the reform attempts to alter relationships
among educators, administrators, and parents. The important issue here is how the school

Urban School ReformTechnical, Normative, Political, & Socio-Cultural
Considerations
POLITICAL NORMATIVE
TECHNICAL
Values
Ethos
Attitudes
SchoolStructures,Strategies,
Policies,&
Practices
Who participates in reform
How schools & individualsparticipate in reform
When schools & individualparticipate in reform
Dimensionsof
Change
Social,Cultural,
& EnvironmentalFactors
SOCIO-CULTURAL
4
builds the capacity to make its political structures serve its normative and technical goals.
Given the vastly diverse settings of Success for All’s implementations, the fourth conceptual
perspective, the socio-cultural perspective, focuses on the social, cultural, and environmental
factors that affect school reform, but are seldom given attention. Adding this fourth dimension
gives us greater insight into the constraints and challenges faced by many urban school
communities because of their diverse populations.
School reform, of course, does not divide discreetly into four dimensions. But these
dimensions of schooling tap into the energy sources of most school communities and
therefore require serious consideration before fundamental change in schools can occur. As
Oakes argues, “Viewing schools from technical, normative, political, [and I would add, socio-
cultural] lenses allows traditional school practices to be examined in the context of the beliefs,
values, relationships, and power allocations that keep them in place” (Oakes, 1992).
Employing this conceptual framework gives insight into how effective school-wide
change models can be scaled up into widespread usage in our nation’s schools, especially in
the urban schools that need changing the most. The goal of this research is to provide insight

5
into the process of change in school organization, curriculum, and teaching. Additionally, this
research provides guidance to educators, policymakers, and researchers who all agree that
change in our public education system is needed but lack the certainty regarding how to best
lead, implement, and manage the process of change. The lessons learned here can inform
reform efforts, on both the local and national level.
Methods
Design
This study uses both quantitative and qualitative research methods, with data gathered
from a sample of over 350 SFA schools across the country. A variety of data collection
strategies were used: surveys, one-on-one interviews, group interviews, focus groups, and
school site observations. An in-depth description of the data collection strategies can be found
in Cooper and Slavin (1997).
Survey data were collected from approximately 500 educators involved in the
implementation of Success for All. Two survey instruments were developed — one for school
principals and one for school site facilitators. The questionnaires were designed to provide
a snapshot of the program’s implementation process in several school contexts. These survey
instruments helped identify patterns of behavior, activities, and attitudes that influence the
replicability and scaling-up efforts of the program across various contexts. Furthermore, this
data collection strategy attempted to capture information regarding the school norms and
politics that affect the technical implementation of the program. Survey questions focused on
how the school learned of SFA, who the key players were in its implementation, the obstacles
that schools faced in establishing SFA, and the difficulties in sustaining the reform.
The school site facilitator and principal surveys were sent out in June of 1997. That
and subsequent mailings yielded over 200 survey responses from site facilitators and over 350
responses from school principals. The 550 responses represent over 350 elementary schools
across the United States.
The quantitative data are augmented by qualitative data collected from intensive case
studies. A stratified sample of 25 schools was selected for closer observation. The sample was
stratified on three dimensions: quality of implementation, number of years implementing the
program, and racial/ethnic composition of the student body. The primary methodological
strategies used to gather information in these case studies were interviews and observations

6
conducted with site facilitators, principals, and appropriate district level officials. Although
scheduling conflicts necessitated some group interviews, most interviews were conducted
one-on-one. Each interview was recorded and transcribed. Additionally, interview notes were
taken, consisting primarily of words, ideas, and key phrases that captured the language and
emotions of the interviewee. These intensive case studies provided opportunities to examine
questions that were explored quantitatively but whose importance might have gone
undetected without closer examination. Additionally, because SFA is one of the most
extensively evaluated school-change programs, previous research efforts gave insight to the
current research questions.
Data Analysis
Survey data in this study were triangulated with data collected in interviews and
observations. Particular attention was paid to how well schools developed the desired
structures, engaged in the intended activities, and embodied the guiding principles. The goal
of this analysis was to document the evolution of the implementation process and provide
insight into the factors that contribute to SFA’s successful replication and scaling up efforts.
In the analyses reported here, I first identified four categories of factors that influence
implementation — non-school factors, within-school factors, SFA program factors, and
socio-cultural factors. I then conducted quantitative analyses of how the socio-cultural factors
and within-school factors influence implementation quality. I then examined the qualitative
data and focused on one aspect of socio-cultural factors (the racial composition of the student
body) and one aspect of the within-school factors (the politics of program resistance). Further
analyses of both the quantitative and qualitative data in all four categories of factors that
influence implementation will be presented in future reports.
For the purposes of these analyses, quality of implementation was determined by a
self-reported measure on the facilitators’ questionnaire. (Appendix A provides a copy of the
questionnaire.) Although externally assigned implementation quality scores were available for
many of the schools, too many schools would have been excluded if externally assigned
measures had been used. Additional external implementation data is currently being collected
and will be used in future analyses.
Based upon facilitators’ responses to the self-reported implementation quality
measure, schools were divided into three groups. Approximately 17% of the respondents (30
facilitators) reported that the implementation at their schools was thoughtful, creative, and

7
enthusiastic, which were characterized as high quality implementation. Forty-seven percent
of the respondents (83) indicated that implementation at their schools was complete, solid,
and routine, which were characterized as moderate quality implementation. Thirty-five
percent of the respondents (62 facilitators) reported that the implementation at their school
was mostly good but poor or incomplete in some areas; these schools were placed in the low
implementation category.
Questionnaire responses of principals and facilitators provided the variables associated
with the four categories of factors that support and/or hinder implementation — non-school
factors, within-school factors, SFA program factors, and socio-cultural factors. In the
quantitative analyses reported here, I used responses from the facilitators’ questionnaires to
examine the influence of socio-cultural and within-school factors on the quality of
implementation of Success for All in the schools. I then used the qualitative information from
the interviews conducted in the case studies to examine the findings of the quantitative
analyses in more depth and in the context of the technical, normative, political, and socio-
cultural perspectives on school change.
Results
Influence of Socio-Cultural Factors
Of the socio-cultural factors explored in this study, three were significantly related to
the reported quality of implementation. The correlations between quality of implementation
and student mobility, school attendance rate, and percent of the student body that is white
were statistically significant (+.23, p<.01, +.26, p<.001, and +.15, p<05, respectively). Thus,
schools that had lower student mobility rates, higher attendance rates, and a larger percent
of white students were more likely to achieve high quality implementation of Success for All.
Non-significant correlations between quality of implementation and other socio-
cultural factors were -.05 for years of implementation, +.07 for poverty level, + .03 size of
school, +.09 for urbanicity, +.04 for size of community. Thus, the quality of SFA
implementation was not influenced significantly by how many years the school had been
implementing SFA, how many students were receiving free or reduced lunch, whether the
school was small or large, whether the school was in an urban, suburban, or rural location,
or whether the school was located in a small or larger community.

8
Following is a discussion of the socio-cultural factors explored and the results of the
analyses conducted.
Poverty level: Reported levels of free and reduced lunch were used to determine the
school’s poverty level. To maximize comparability, the grouping levels used by the U.S.
Department of Education (1993) in Reinventing Chapter 1 were used as guidelines. The
schools were divided into four groups: low, medium, high, and extreme poverty. Low poverty
categorizes schools that reported a 1 to 19% free or reduced lunch count (0 schools).
Medium poverty was equal to 20% to 74% free or reduced lunch (64 schools). High poverty
level was equal to 75% to 95% free and reduced lunch (61 schools). Extreme poverty was
equal to a free and reduced lunch count greater than 95% (48 schools). The schools in the
sample ranged from 20% to 100% free/reduced lunch, with a mean of 74%. The poverty
levels of low- and moderate-quality implementation schools cluster around the means at 74%
and 77%, respectively. The mean poverty level of the high-implementation quality schools
was lower, at 66%, but not statistically significant.
Attendance rate: SFA expects schools to have at least a 95% attendance rate, and
the mean attendance rate for the respondents in the study was 94%. The standard deviation
for the attendance rate was 3.24 with a range of 75% to 98%. The attendance rate did not
differ significantly among the three levels of implementation. The average attendance rates
for all three groups clustered around the 95% level.
School size: School size was measured using student enrollment figures. The mean
number of students at the schools in the sample was 615, with a standard deviation of 272 and
a range of 213 to 1,515 students. School size for the three categories of implementation was
587, 640, and 533, from low to high respectively.
Community size: This measure reflects the community context in which the reform
is being implemented: inner city, big city, moderate size city, small town, or other. Fifty-two
percent of the sample indicated that they were located in big inner cities. Consistent with that,
the majority of schools in each implementation category also indicated that they were located
in big inner cities — 49%, 59%, and 40% respectively.
Student mobility rate: Mobility rate represents the number of students who transfer
from a school during the course of the year. Because many SFA schools are located in places
with a high migrant student population, the mobility rate for some schools can be as high as
70 or 80%. The mean rate for this sample was 21.5% with a standard deviation of 21.5. The
mobility rate differed between the three groups. Counter-intuitively, schools reporting low

9
program implementation had the lowest student mobility rates, with 70% of these schools
reporting mobility rates of less than 25%. The mean mobility rate for these schools was
15.5%. This was in contrast to the moderate and high implementation groups, which reported
mean mobility rates of 25.7% and 27% respectively.
Years of implementation: The mean number of years of implementation of SFA
among the schools in the sample was 2.4 years, with a standard deviation of 1.48 and a range
of 1 to 8 years. The average number of years of implementation for all three implementation
groups — low, moderate, and high — clustered around the mean.
Racial make-up of the student body: The collective group of schools represented
in the sample was very racially and ethnically diverse, but also racially segregated. Thirty-two
percent of the schools in the sample report serving a majority African-American student
population; 24% of the schools reported serving a majority white student population, and
20% reported serving a majority Hispanic student population. Fewer than 1% served a
majority Asian student population, and 20% reported that their schools were racially balanced
with no clear racial majority. This is one of the few socio-cultural factors on which schools
in the three categories of implementation differed. The average percentages of white students
in the low, moderate, and high implementation schools were 26%, 28%, and 35%,
respectively. Parallel percentages for African-American students in the three groups were
31%, 47%, and 27%, a statistically significant difference (F=5.21, p<.05). The percentages
of Hispanic/Latino and Asian students in the three groups of schools also differed significantly
— the percentages of Hispanic students were 30%, 18%, and 22%, respectively (F=3.24,
p<.05); and the percentages of Asian students were 0%, 1%, and 4%, respectively (F=7.12,
p<.001). These findings suggest that schools that have larger non-white student populations
tend to have lower-quality implementations.
Urbanicity: This variable captures the context in which the reform is being
implemented — urban, suburban, or rural. Urban schools made up 66% of the sample of
schools, and made up 72%, 66%, and 46% of the low-, moderate-, and high-quality
implementation groups, respectively. Suburban schools made up 11% of the sample, and
made up 4%, 9%, and 22% of the low-, moderate-, and high-quality implementation groups,
respectively. Rural schools made up 24% of the sample, and made up 30%, 17%, and 32%
of the low-, middle-, and high-quality implementation groups, respectively. These percentages
reflect tendencies for urban schools to be over-represented in the low implementation group
and under-represented in the high implementation group; for suburban

10
schools to be over-represented in the high-implementation group; and for rural schools to be
over-represented in both the low- and high-implementation groups. However, none of
differences between urban, suburban, or rural schools’ representation in the sample and their
representation in low-, moderate-, or high-quality implementation groups are significant.
Influence of Within-School Factors
Fifty-six variables that focused on within-school factors affecting quality
implementation were derived from the school-site facilitator questionnaire. (For a complete
list of the within-school variables, see Appendix B.) To reduce these into a small set of
internally consistent dimensions, both exploratory and confirmatory factor analyses were
conducted. Using a principal component analysis with a varimax rotation, nine composite
scales were extracted. Only those items that had relatively high loadings and intuitively made
sense were included in each scale. Table 1 presents the allocation of variables to each scale
with an example of a scale item.
Constructing these scales generally provides a stronger, more accurate measure than
using a single dichotomous variable (Jordan et al., 1996). Determining the number of
components to extract from the correlation matrix is a fundamental decision in many analyses
(Thompson & Borrello, 1986; Johnson et al., 1996). This study followed the recommendation
of Guttman (1954) and extracted components with eigenvalues greater than one. The scales
ranged in size from 2 to 13 items. Scale items with factor loadings less than 0.3 were excluded
from subsequent reliability analyses. Cronbach alpha internal consistency coefficients were
computed for each scale, and ranged between .39 and .82.
The within-school factors that were derived from the factor analysis were:
Supportive culture for institutional change: This construct captures the degree to
which educators feel that they have been able to generate knowledge, discussion, and
ownership of the reform process. Fundamental change in schools is a slow process that
requires all stakeholders to have a voice in the process. Research suggests that true change
occurs in the hearts and minds of educators long before the adoption of a reform project.
SFA, like any reform program, simply serves as a vehicle for school communities to carry out
the mission of providing high-quality educational experiences to their students.

11
Program resistance: This measure illuminates the fact that even with an 80% vote
from the faculty prior to the adoption of SFA, school communities are not always supportive
of the program at the time of implementation. Due to high staff turnover in many SFA schools
from year to year, schools often have some teachers who are opposed to the program’s
adoption or continuation.
Table 1Allocation of Items to Scales and a Sample Item for Each Scale
Scale Items Item Nos. Reliability Sample ItemNo. of Alpha
Supportive culture 13 1, 2, 6, 9, 10, .82 Staff commitmentfor institutional 12, 20, 24, 25, to change
change 26, 27, 28, 30
Program resistance 4 36, 49, 51, 52 .66 Lack of fidelity tothe model
Early success 2 15, 17 .56 Early success rate
Commitment to 4 7, 13, 21, 22 .60 Protected program structures 90-minute
reading block
High 3 31, 47, 50 .48 Insufficient numberstudent/teacher of personnel
ratio
Strong school site 2 19, 23 .60 Strong support offacilitator school site
facilitator
Teacher work load 3 42, 43, 55 .39 Lack ofpreparation time
Material 4 4, 8, 16, 18 .40 Materialavailability availability and
quality
Space issues 2 38, 54 .74 Space limitations

12
Early success: This measure captures a school’s ability to acknowledge and measure
the impact of SFA using multiple measures. SFA is a comprehensive reform effort that
influences not only curriculum and instruction, but also school organization, institutional
culture, and the overall operation of the school. Schools are at various stages of readiness for
reform and some schools must tackle issues such as attendance, resource availability, and
discipline before they can attack the issue of poor student performance.
Commitment to program structures: SFA is a comprehensive program that requires
many structural elements to be in place. This construct captures the degree to which
educators feel that the necessary arrangements have been made to accommodate the structural
elements of the program, including a 90-minute uninterrupted reading block, appropriately
regrouping students every eight weeks, having a Family Support Team in place, and providing
one-on-one tutoring to at least 30% of the first graders.
High student/teacher ratios: This measure reflects a school’s capacity for providing
students with small learning communities and providing the “safety net” needed to ensure the
academic success of all students.
Strong school site facilitator: School site facilitators are the linchpins that hold the
implementation effort together. Responsible for the day-to-day operation of the program, the
strength of the facilitator’s interpersonal, organizational, and communication skills greatly
affects the quality of implementation of the program.
Teacher workload: This measure gauges the impact of teacher perceptions of
increased teacher workload, preparation, and accountability on the implementation process.
Material quality and availability: For many SFA schools, the quality and availability
of materials has been problematic. In particular, schools that started SFA in September, 1996
received their materials very late due to a problem with a printer. This construct captures the
degree to which educators identify factors associated with the SFA curriculum materials as
a major barrier to the implementation of their program.
Space: Many urban schools are overcrowded, producing environments that are not
conducive to learning. This scale item measures the degree to which lack of space is a
hindrance to the implementation of SFA.
The relationship between quality of implementation and the nine composite scales of
school level factors was examined using analyses of covariance (ANCOVAs). The
ANCOVAs controlled for percent of student body that is white, school attendance rate, and
student mobility rate, the socio-cultural factors that were found to be significantly related to
quality of implementation. Multivariate F (Wilks’ lambda) for quality implementation was

13
2.69 (18,322): p<. 001, suggesting further investigation was warranted. Subsequent analyses
revealed six statistically significant univariate differences between reported levels of
implementation and within-school factors.
Table 2 contains the means, standard deviations, and univariate F values for the scale
items for within-school factors. Reported levels of program implementation reliably
differentiated each of these variables. The largest difference was between the high
implementation group and the low implementation group with respect to program resistance.
The univariate effect was strong, with the effect size (1.30) larger than one standard
deviation. Schools that reported high quality implementation appeared to do a better job of
creating school-wide buy-in and avoiding collective program resistance. Thus, the challenge
for many schools is not simply how to train the 80% of the faculty who voted for the adoption
of the program, but also how to manage and redirect the negative feedback and subversive
activities of the up to 20% of the faculty who do not support the reform effort or were not
present during the adoption process.
Other univariate results show that schools with high implementation were more
successful in creating a supportive culture for institutional change. When controlling for
socio-cultural factors, schools that were able to create a culture that recognized a need for
change and were able to document their progress in meeting that need experience a higher
quality program implementation (effect size =1.13). These data suggest that high quality
implementation is predicated upon change becoming an institutional norm. This factor speaks
to the importance of empowering educators in the change progress. Teachers and
administrators must take ownership of the program. The adoption of SFA must not be seen
as a top-down directive, but as a collective opportunity to improve the educational experience
of children. Educators must be empowered prior to adoption of the program, as well as
during the change process. Establishing a stable, committed cadre of teachers is the first step
to successful implementation of the program.
Schools that reported high quality implementations appeared to be more successful
in empowering educators to take collective ownership and responsibility for the reform
process. These schools also reported having a stronger sense of professionalism among their
faculties, thus giving way to the ongoing commitment to achieve high fidelity to the structures
of the program. Additionally, high-quality implementation schools reported having less
difficulty in establishing small reading groups and one-to-one tutoring, and teachers appeared
to be less concerned with the increased work load that they might initially experience.

14
Other results show the importance of the appointment of a school site facilitator.
Although these data are self-reported by school site facilitators, respondents were able to
distinguish the importance of a school site facilitator in the implementation process. Schools
that have high-quality implementations reported that they have a supportive and
knowledgeable school site facilitator. Qualitative data suggest that program implementation
is greatly enhanced with a full time facilitator who devotes 100% of his/her time to the
implementation of the program. In some schools full-time facilitators are in place, but they
are assigned a myriad of duties outside the scope of SFA. This compromises the integrity and
quality of the implementation at those schools. Often, a lack of commitment on the part of the
institution in regards to the SFA program is most evident in the non-SFA tasks assigned to
the facilitator.
Table 2
Within-School Factors Related to Quality Implementation: Adjusted Means by Reported Implementation Level
Scale Constructswith Number of
Covariates t F
Quality of Implementation Significan Size d
Planned
Contrasts Effect
Low Moderate High
Supportive culturefor institutionalchange .43 (.23) .61 (.27) .69 (.24) a, c 6.69*** 1.13
Program resistance .37 (.33) .21 (.26) .07 (.13) a, b, c 5.27*** 1.30
Early success .19 (.32) .27 (.38) .33 (.36) 2.02 .41
Commitment to 56 (.32) .74 (.28) .76 (.30) a, c 3.54** .66program structures
High student/teacherratio .33 (.33) .27 (.32) .18 (.26) a 1.23 .50
Strong school site .50 (.43) .69 (.37) .70 (.34) a, c 2.70* .51facilitator
Teacher work load .25 (.31) .17 (.23) .05 (.15) a, b 5.10*** .81
Material availability .36 (.26) .43 (.28) .48 (.28) a 2.89** .44
Space issues .20 (.34) .23 (.39) .20 (.36) .14 .08
Note: Three-covariate analyses controlled percent of student body that is white, school attendance rate and studentmobility rate. Low implementation level n= 62, moderate implementation level n=83, and high implementation leveln=30. Standard deviations are shown in parentheses. Effect size (d) is the difference between the high and low scalemeans, divided by the pooled standard deviation.
Planned contrast: a= (high implementation vs. low implementation) p<.05; b=(moderate implementation vs. highimplementation) p<.05; c= (low implementation vs. moderate implementation) p<.05.
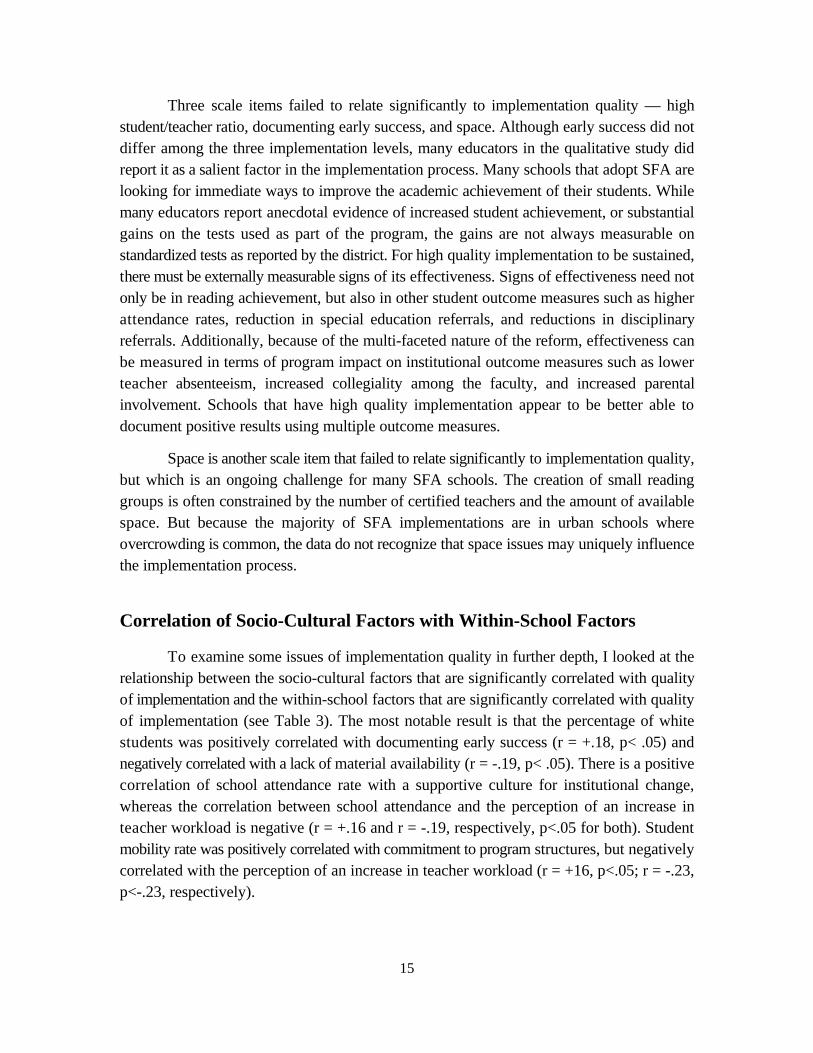
15
Three scale items failed to relate significantly to implementation quality — highstudent/teacher ratio, documenting early success, and space. Although early success did notdiffer among the three implementation levels, many educators in the qualitative study didreport it as a salient factor in the implementation process. Many schools that adopt SFA arelooking for immediate ways to improve the academic achievement of their students. Whilemany educators report anecdotal evidence of increased student achievement, or substantialgains on the tests used as part of the program, the gains are not always measurable onstandardized tests as reported by the district. For high quality implementation to be sustained,there must be externally measurable signs of its effectiveness. Signs of effectiveness need notonly be in reading achievement, but also in other student outcome measures such as higherattendance rates, reduction in special education referrals, and reductions in disciplinaryreferrals. Additionally, because of the multi-faceted nature of the reform, effectiveness canbe measured in terms of program impact on institutional outcome measures such as lowerteacher absenteeism, increased collegiality among the faculty, and increased parentalinvolvement. Schools that have high quality implementation appear to be better able todocument positive results using multiple outcome measures.
Space is another scale item that failed to relate significantly to implementation quality,but which is an ongoing challenge for many SFA schools. The creation of small readinggroups is often constrained by the number of certified teachers and the amount of availablespace. But because the majority of SFA implementations are in urban schools whereovercrowding is common, the data do not recognize that space issues may uniquely influencethe implementation process.
Correlation of Socio-Cultural Factors with Within-School Factors
To examine some issues of implementation quality in further depth, I looked at therelationship between the socio-cultural factors that are significantly correlated with qualityof implementation and the within-school factors that are significantly correlated with qualityof implementation (see Table 3). The most notable result is that the percentage of whitestudents was positively correlated with documenting early success (r = +.18, p< .05) andnegatively correlated with a lack of material availability (r = -.19, p< .05). There is a positivecorrelation of school attendance rate with a supportive culture for institutional change,whereas the correlation between school attendance and the perception of an increase inteacher workload is negative (r = +.16 and r = -.19, respectively, p<.05 for both). Studentmobility rate was positively correlated with commitment to program structures, but negativelycorrelated with the perception of an increase in teacher workload (r = +16, p<.05; r = -.23,p<-.23, respectively).

16
Table 3
Correlation between Salient Socio-Cultural Factors andSalient Within-School Factors
Percent School StudentWhite Attendance Mobility
Students Rate Rate
Supportive culture for +.16institutional change
Program resistance
Early success +.18*
Commitment to +.16*program structures
High student/teacherratio
Strong school sitefacilitator
Teacher workload -.19* -.23**
Material availability -.19*
Space issues
Note: * = p<.05; ** = p<.01
Elaboration of the Findings through Qualitative Data
Quantitative data analyses in this study suggest that there are aspects of the process
of implementing innovative programs in schools that can be positively influenced with
thoughtful consideration, increasing the probability of high-quality implementation. Six
within-school factors and three socio-cultural factors were identified as having a significant
impact on the quality and process of implementation. I will now examine qualitative data
gathered from interviews and observations in 25 schools to elaborate on these findings
regarding socio-cultural factors (focusing on racial composition of the student body) and
within-school factors (focusing on program resistence). The elaborations will examine these
findings within the context of the four perspectives on school change discussed earlier —
the technical, normative, political, and socio-cultural perspectives.
Racial Composition of the Student Body
One of the most salient socio-cultural factors in this investigation was race. Data
suggest that implementation quality was positively correlated with the proportion of white

17
students in the school. This finding highlights the unique challenges found in many poor,
inner-city schools, which is where most students of color receive their education. Taken at
face value, this finding might suggest that school reform is more difficult to implement in a
context that has a high percentage of minority children. However, qualitative data reveal and
support an alternative explanation.
Qualitative data suggest that the gap in quality of implementation is more a function
of teacher mobility in inner-city schools than something endemic to the culture of the schools
that serve minority children. In many of the schools I researched, educators spoke of the
difficulty of attracting qualified professionals to inner-city schools. Principals, in particular,
identified the abundance of new teachers who have little experience working with inner-city
youth as a major obstacle to providing quality education. Because the majority of individuals
preparing to be teachers are young, white, and female, it is difficult for inner-city schools to
attract educators to environments that are perceived as “tough” teaching assignments. Also,
teacher mobility, especially teachers moving from inner-city schools to neighboring middle-
class schools, affects not only the quality and consistency of instruction, but the
implementation of school-wide reform as well.
Because of a strong correlation between race and poverty, the relationship between
poverty and quality implementation was explored. The effects of poverty were summed up
eloquently by one principal we interviewed. He said:
The students don’t have school supplies. Some don’t have clothingappropriate for the weather. Some don’t have a place in their home that’swell-lit. Very few have their very own books. When it rains, if their sneakersget wet, they don’t have another pair of shoes to wear to school the next day.Poverty is the pits, I mean, it’s terrible.
Responses from teachers, principals, and district personnel in interviews, however,
produced unanticipated findings regarding the relationship of poverty and quality
implementation. The data suggest that despite the additional social and cultural barriers that
high poverty schools encounter in implementing school-wide reform, school poverty level
does not appear to hinder the implementation process. Although high levels of poverty do
create unique challenges to the successful replication and scaling up of programs in areas such
as parental involvement, student mobility, attendance rates, quality of instruction, and basic
resource availability, the majority of high poverty schools are successful in

18
implementing the program. One school site facilitator at a high poverty school in Florida
commented:
In high poverty schools, the challenges that many SFA students face are notalways academic ones. Students are confronted with obstacles to theirlearning that adults would have difficulty overcoming. The levels of drug use,crime, and violence in some of the SFA school neighborhoods require schoolofficials to respond to the physical, emotional, and psychological, as well asacademic, needs of children. Recognizing the realities of these conditions anddeveloping strategies that help students overcome them make the differencebetween success for some and success for all.
Recognizing that schools are em bedded in communities that, in many ways, dictate
the conditions and constraints of school reform, this study sought to understand the impact
of the community context upon the implementation process. In addition to the conditions
found in high poverty schools, these schools must combat deeply entrenched societal
perceptions. One of the prevailing attitudes about many high poverty communities is that the
adults who live and work there do not care about their children’s education. Many teachers
complain of the difficulty of getting parents involved in school activities. Moreover, parents
and other community members talk about the poor quality of instruction that urban teachers
provide and the lack of educational opportunities available to urban students. When asked
how prevailing community norms affect the school’s ability to implement school reform, one
Florida principal indicated that reform begins with a change in perception. She stated:
I want the entire perception to change to a positive perception. I want them[teachers, parents, and the larger community] to realize that there are hard-working teachers here, there are children here who are really learning. I wantthem to recognize that we are committed and that we are achieving.
The implementation of SFA challenges three of the most important norms that are
used to organize and operate schools: norms regarding which students can learn, what
students can learn, and how students should learn. As Oakes (1992) argues, school reform
that fails to pay attention to the normative dimensions of school change may result in reluctant
compliance at best. SFA forces new strategies into traditional policies and practices.
However, for SFA to be effective, entire school communities must “buy in” to the
norms of the program. One of the guiding philosophical principles of the SFA reform model
is that school communities must remain relentless until all children are academically
successful. The program has assembled instructional practices, curricular materials, and
organizational strategies that facilitate the learning of all students. However, because most

19
of the communities where the program is being implemented are comprised of poor minority
children, there is a danger that not all students will be expected to be successful. One Virginia
school principal indicated that the demographics of her school do not make a difference in the
effectiveness of the program. She stated:
I do not want to be labeled as saying that this program only works for thisparticular child. I like to say to parents, yes, it is good for the “at risk”student, but it is also good for the gifted and talented as well.... I do not carewhat color these kids are, where they are coming from, they are kids. I likeSuccess for All because it meets all children’s needs, regardless of race. Now,in my first year, I had a majority of minority students in the building, thatdidn’t phase me a bit because I had just as many of the others who needed thesame things as.... A lot of them needed the same thing, race really was notimportant. What was important to me was I have something here that’s goingto work for all these kids.
Embedded within the structure and organization of SFA is a set of norms for what
constitutes a strong reading program and a strong elementary school. The adoption of these
norms changes the way schools function. Schools are transformed into institutions of
collaboration and partnership and places where all children are given the opportunity to be
successful. Because of the traditions that have guided much previous policy and practice in
schools, many children are not thought of as capable of success. One facilitator stated that it
was difficult to change the norms in her school because of how some of the teachers view the
students. She said:
A lot of people believe that the kids are so far behind that they’ll never catchup. You know, they’ll never make any gains. They have a negative attitudeabout the kids. And that’s a tremendous barrier, you know, that will stop thekids in their tracks immediately. Right? Why bother? They say the kids arethree years behind, or they are two years behind, and what difference am Igoing to make?
As long as school norms maintain that some students are unable to achieve a high
degree of success, then students will remain unsuccessful. For this reason, SFA seeks to
establish a climate that fosters the success of all children.
The Politics of Program Resistance
Of the many within-school factors identified in this research, program resistance
emerged as having the greatest impact on implementation quality, with an effect size of 1.30

20
when urbanicity and racial composition of the student body were controlled. Given that an
effect size is defined as educationally significant at .25 (Slavin & Fashola, 1998) and large at
.80 (Cohen, 1969), the data are clear that high quality implementation of SFA will more likely
occur if there is unambiguous buy-in on the part of all staff at the school. SFA is not just a
reading program that requires teachers to use a specific curriculum and strategy, it is also a
restructuring effort that challenges educators to think differently about their relationships with
their students, colleagues, and work environment. To achieve a high quality implementation,
educators and administrators must be willing to embrace the philosophy and practices of SFA.
The entire school community must be willing to create the structures and learning
opportunities that serve as the infrastructure of the SFA program. These structures include
the 90-minute reading block, tutoring program, Family Support Team, and partnerships with
the larger community. Although effect sizes should be interpreted with caution (Slavin &
Fashola, 1998), an effect size of 1.30 suggests that when schools are able to experience
minimal program resistance they are able to increase the quality of their implementation over
one full point on the five-point implementation scale.
Although the design of the program calls for 80% faculty approval prior to the
adoption of SFA, schools still may experience resistance to the program and difficulty in
managing that resistance. Few schools have the luxury that one SFA school in Arizona had
when it was given a year to fully explore the program before deciding to use it. This
exploration allowed the faculty to resolve questions and concerns before they voted on the
program’s adoption. The facilitator stated:
We decided we were ready to vote. I decided not to take a yes/no vote. Idecided to do it on a contingency. We voted on a scale from one to five. Onebeing that you absolutely just love the program. You think that this is justwhat we have been waiting for. Let’s just go for it.... The middle there wouldbe, ‘I’m a little concerned about my role and how this is going to work, butI believe that we need to make a change and I will be supportive of theprogram.’ And five being, ‘I hate this. I will sabotage it if necessary to get myway.’ And do you know that we had somebody who voted a five? We had oneperson who voted five. Almost everybody else who voted realized that afterreally talking this through, that we needed a change. We had to do something.They felt like this might be what we should go for. And so, we ended up witha ninety-five percent vote.
Although 95% of the faculty gave their vote of approval for the program, the
facilitator herself expressed some concern about the program. She said, “for myself, when I
voted...I said, ‘I can’t vote a one.’ I can’t say, ‘I think this is it.’ Because I don’t know until

21
we try.” From the very inception of the program, this voting strategy empowered the teachers
with a voice in the reform process. Consequently, the educators at this school have taken full
ownership of the program and are working hard to make sure all of their students are
successful.
For this Arizona school, the voting process worked well. However, several school
officials talked about how the process did not ensure full participation of the faculty in the
reform effort at their school. At several schools, the perception was that SFA was a reform
initiative that came from the top down. Several school site facilitators stated candidly that
their teachers felt that the program was supported by someone at the district level or by their
principal and they did not feel like they really had a voice in the decision. A good example of
this can be seen in one Maryland elementary school. SFA was believed to be a political move
on the part of the principal to secure additional funding. Teachers felt as though they were
forced to adopt the program. This strategy, consequently, jeopardized the integrity of the
implementation process at the school. The principal stated:
We had a lot of teachers go in and do that whole big voting procedure...butthen the thing that we did that made it really work, is that I didn’t carewhether they liked it or not, they didn’t have to say they liked it, they had tovote to have it. Some people did not want to teach the Roots at all, they toldme they hated it, they couldn’t do it. And so I didn’t make them. Then theydid the Wings. And some of them didn’t really do the Wings, they did theirown thing. And then we had other people who were into it. We had teacherspushing from both ends. We had people who were not sold on it a hundredpercent, but gave it a fair shake.
We learn from this example that a “yes” vote for adoption does not always translateinto a “yes” vote for implementation. After adoption, the reality of the program becomesevident. In many schools, teachers find that the amount of work required of them isunprecedented. They are expected to provide continuous interactive instruction for 90minutes, and they are held accountable for the results of that instruction. One school sitefacilitator indicated that many teachers at her school resented the amount of work theprogram required. She said:
It’s a lot of work. Roots and Wings both, requires lots of preparation.... It isnot fluff, you have to be prepared, and you have to work. You just cannot goin and do it off the cuff … a lot of people resent that.
A school site facilitator from Maryland noted that it was not only the amount of workinvolved, but also the difficulty of adapting to a different philosophy:

22
There were a lot of obstacles [in implementing the program]. One wasrethinking the way we teach. That whole philosophy. Many of our teacherswere Whole Language teachers, it was very threatening to be forced into arigid time frame and schedule … that was all very difficult.
The data clearly show, however, that the vast majority of teachers who do buy intothe SFA model experience new degrees of success with their students. Positive results withstudents in the program was a constant theme in the case study interviews, supplementing thepositive findings of SFA’s quantitative studies. One principal in Virginia stated:
The teachers are very supportive of the program. They have seen theprogress that their students are making. They are constantly saying, ‘oh, Ijust love the program, have you something new that you would like to sharewith us so we can try it, because the children are doing so well.’ To give youan example, we have one teacher this week, all of her children just started toread, and she came running down the hall, ‘oh, this child is reading, it [SFA]is just excellent, it is excellent.’
Along with these successes, an added benefit to the program is that it begins to changethe culture of the school. Because teachers share students, they have to trust that not onlythey, but also all other teachers are doing a good job — they have to trust that qualityinstruction is taking place all over the building. One comment by a SFA principal in Californiaexemplifies this issue:
Teachers like the program, because they see the kids are reading.…The otherthing is that they [the teachers] have learned to trust each other. I had oneteacher that said, ‘oh, nobody can do a better job than I do in reading.’ Nowthat she sees her kids learning to read [when taught by other teachers andtutors] she feels that she doesn’t have to work so hard.
In the quantitative study, the role of the school site facilitator was found tosignificantly affect implementation quality of the reform effort. The qualitative data supportthe importance of the facilitator. The person in this position wears a variety of hats. He/sheserves as an instructional leader, mentor teacher, program cheerleader. He or she must beorganized, skilled, and committed to teaching children, stated one principal. One JHUconsultant indicated that she thought it took six months to a year for a school site facilitatorto really understand the depth and breadth of the job. In those schools where there is a strongimplementation of the program, there tended to be a full-time facilitator with 100% of his orher time devoted to the implementation of the program. Due to budget constraints in someinstitutions, part-time facilitators were permitted in the early development of the program.However, a full-time facilitator is now required.
Not only is a full-time facilitator required, but also limiting the duties outside thescope of SFA is highly encouraged. In many ways, when a school site facilitator is assigned

23
tasks outside the scope of the program it compromises the integrity of the implementationprocess. Often times a lack of commitment on the part of the institution in regards to theprogram is most evident in the tasks assigned to the facilitator. For example, in one schoolin Baltimore with an average level of implementation, the facilitator reluctantly admitted thatshe rarely gets into the classroom to help and model lessons for teachers because of so manyadditional responsibilities assigned to her by her principal. She stated,
Actually in the classroom? I haven’t done that much this year. More of thework is actually working with teachers. In the classroom...I have the leastamount of time for that. And the reason is, I’m involved in teams on Tuesdaymorning, Wednesday afternoon, all day Thursday, and I’m only here fourdays, and then I’m doing testing on the other days.... I will get in there, butit’s not consistent. I work with teachers before school, during lunch, and afterschool. And it can be very unplanned. It’s informal.
One school site facilitator in Florida who had the luxury of having two months in thesummer to pull together the materials for the program indicated that she buried herself in theprocedures and in setting up her room, trying to get a feel for what to expect when the staffreturned. As many school site facilitators reiterated, organizing the people, materials, and theprocess is a very complicated task, and time to plan for the implementation of the programis a luxury that many of them are never afforded. For the many school site facilitators whofind themselves over-worked and under-appreciated, institutional recognition that facilitatingthe program requires a full-time commitment is the first in a series of steps to ensure highquality implementation.
School site facilitators must not only be strong instructional leaders with a vastrepertoire of pedagogical and instructional strategies, but also be professional educators whodiplomatically create opportunities for collegiality and cooperation among their peers withinthe framework of the SFA model.
Policy Implications
Reforming Schools with Externally Developed Programs
In the school change debate, a variety of terms are used interchangeably to describe
the reform process within schools. However, the term “restructuring” has dominated the
discourse during the last two decades. Research suggests that restructuring initiatives
emerged in several waves (Lusi, 1997). The first wave focused on raising standards (Jacobson
& Berne, 1993). Schools were simply asked “to do more of the same, but just do it better”
(Petrie, 1990, p. 14). Petrie argues that asking schools to do more of the same failed to
recognize the systemic nature of the educational enterprise. This wave has been characterized

24
as piecemeal and disconnected (Cohen & Spillance, 1992; Smith & O’Day, 1990). Although
schools and educators were asked, and in many cases required, to make significant changes,
research suggests that this wave of reform left the fundamental nature of teaching and
learning unchanged (Cohen, 1988; Cuban, 1990; Firestone et al., 1989).
The second wave shifted the focus of reform to the redistribution of power (Murphy,
1992). Reformers sought to reallocate control of curriculum, budgets, and staffing to
principals, teachers, and parents (Clune & White, 1988). This wave called for school-by-
school, locally adapted change that was respectful and sensitive to the local context (Elmore
& McLaughlin, 1988). Reforms were designed to “capitalize on the energy and creativity of
individuals at the school level” (Murphy, 1992, p. 6). While this wave produced a number of
schools in which teaching and learning were qualitatively different, the number of schools that
experienced and sustained fundamental change was not widespread (Lusi, 1997).
The third wave of reform, which is currently underway, represents a fundamental shift
in how educators and policymakers view the purpose of education (Murphy, 1992). It seeks
to alter the traditional conceptions of schools. The goal of education is no longer viewed as
the maintenance of the organizational infrastructure, but rather the development of human
resources (Mojkowski & Fleming, 1988). Embedded within the policies and practices of many
of the current reform strategies is the belief that more students can be better served
educationally when traditional notions of teaching and learning are re-conceptualized. In this
era of burgeoning choice among school reform strategies and programs, fundamental change
occurs in schools when a comprehensive approach to reform is adopted. Such an approach
focuses on the multitude of factors that determine the schooling experience for students:
school organization, curriculum, delivery of instruction, and grouping practices.
Although there are several examples of programs that have been successful [e.g., the
Core Knowledge Project (Hirsch, 1993), Direct Instruction (Adams & Engelmann, 1996),
some of the New American Schools designs (Stringfield et al., 1996; Bodilly, 1998), Success
for All (Slavin et al., 1996), and others], the challenge for externally developed programs as
they scale up is to maintain the integrity and quality of the program regardless of the social,
political, and economic contexts in which they will be implemented. If school-wide projects
are to serve as a blueprint for urban school reform in the 21st century, we must be able to
document their impact on schools in various contexts on a national scale. Programs must also
be broad enough in scope to address the interconnected complexities of teaching and learning
and yet flexible enough to adapt to the local context in which the program is being
implemented. Reform efforts must not only prove effective in varying political and economic
contexts, but in varying cultural and social contexts as well.

25
Externally developed programs have to meet the challenge of ensuring high-quality
implementation. Shifting the focus of reform from context to implementation raises several
important questions. What is the relationship between implementation and outcome measures?
What are the factors that affect high-quality implementation? How can schools implement
reform in a way to ensure its longevity? This line of inquiry shifts the thinking about reform
from the technology of reform to the actual process of reform. As school-wide projects such
as Success for All continue to document success, it is important to replicate the process of
implementation if schools are to replicate the results.
Conclusion
Over the past decade much of the research on the Success for All program has
focused on the content (Slavin et al., 1996a) and outcomes of the program (Slavin et al.,
1996b). Exploring the process of SFA implementation fundamentally expands the research
on SFA. Investigating the factors that contribute to the high quality implementation of SFA
as a comprehensive school-wide change model pushes us to acknowledge the importance of
understanding the process of school reform. The program is experiencing rapid growth—
more than 1,100 schools are implementing SFA as of the Fall of 1998. After a decade of
research, the question for SFA is no longer whether the program works, but rather under
what conditions does it work best — what are the factors that contribute to successful
implementation? One of the most important lessons gleaned from early SFA research was that
the largest determinant of program success is quality implementation — fidelity to the model.
The research was clear that SFA is good practice, but it is the high quality implementation of
good practice that makes a difference.
Because SFA is one of the most extensive current comprehensive school-wide change
models, there is much to be learned from exploring its context, outcomes, and implementation
processes, not only to facilitate further use of the model itself but also to improve the
dissemination and implementation of other school reform efforts. The significance of this
study lies in its focus on better understanding the broader implications of school-wide reform.
As school communities adopt and implement school-wide reform efforts to improve student
achievement, dissemination of information regarding the factors that contribute to high quality
implementation is invaluable to school site administrators and district leaders (Johnson et al.,
1996). Better understanding these factors can help school communities better plan and
execute their SFA implementation process and the implementation process involved in
adopting other school-wide reform programs.

26
References
Adams, G.L., &. E.S. (1996). Research on Direct Instruction: 25 years beyond DISTAR.Seattle, WA: Educational Achievement Systems.
Bodilly, S.J. (1998). Lessons from the New American Schools Development Corporation’sdevelopment phase. Washington, DC: RAND.
Clune, W.H., & White, P.A. (1988). School-based management: Institutional variation,implementation, and issues for further research. New Brunswick, NJ: RutgersUniversity, Center for Policy Research in Education, Eagleton Institute of Politics.
Cohen, D., & Spillane, J. (1992). Policy and practice: The relations between governance andinstruction. In G. Grant (Ed.), The review of research in education (pp. 3-49).Washington, DC: American Educational Research Association.
Cohen, D.K. (1988). Teaching practice: Plus que ça change. In P.W. Jackson (Ed.),Contributing to educational change: Perspectives on research and practice (pp. 27-84). Berkeley, CA: McCutchan Publishing Corporation.
Cohen, J. (1969). Statistical power analysis for the behavioral science. New York: Wiley.
Cooper, R., Slavin, R.E., & Madden, N.A. (1998). Success for All: Improving the quality ofimplementation of whole-school change through the use of a national reformnetwork. Education and Urban Society, 30 (3), 385-408.
Cooper, R., & Slavin, R.E. (1997). Scaling up Success for All: Second year report to thePew Charitable Trust. Baltimore, MD: Johns Hopkins University, Center forResearch on the Education of Students Placed At Risk.
Cooper, R., Slavin, R.E., & Madden, N. (1997). Success for All: Exploring the technical,normative, political, and socio-cultural dimensions of scaling up (Report No. 16).Baltimore, MD: Johns Hopkins University, Center for Research on the Education ofStudents Placed At Risk.
Cuban, L. (1990). Reforming again, again, and again. Educational Researcher, 19 (1), 3-13.
Elmore, R.E., & McLaughlin, M.W. (1988). Steady work: Policy, practice and the reformof American education. Santa Monica, CA: RAND Corporation.
Firestone, W.A (1989). Educational policy as an ecology of games. Educational Researcher,18 (7), 18-23.
Hirsch, E.D. (1993). The Core Knowledge curriculum: What’s behind its success?Educational Leadership, 50 (8), 23-30.
Johnson, W., Snyder, K., Anderson, R., & Johnson, A. (1996). School work culture andproductivity. The Journal of Experimental Education, 64 (2), 139-156.
Jordan, W.J., Lara, J., & McPartland, J. (1996). Exploring the causes of early dropout amongrace-ethnic and gender groups. Youth and Society, 28 (1), 62-94.

27
Lusi, S. (1997). The role of State Departments of Education in complex school reform. NewYork: Teachers College Press.
Mojkowski, C., & Fleming, D. (1988). School-site management: Concepts and approaches.Andover, MA: Regional Laboratory for Educational Improvement of the Northeastand Islands.
Murphy, J. (1992). Restructuring America’s schools: An overview. In C. Finn and T.Rebarbert, Education reform in the 1990s. New York: MacMillan.
Oakes, J. (1992). Can tracking research inform practice? Technical, normative, and politicalconsiderations. Educational Researcher, 21, (4), 12-21.
Petri, H.G. (1990). Reflections on the second wave of reform: Restructuring the teachingprofession. In S.L. Jacobson and J.A. Conway (Eds.), Educational leadership in anera of reform. New York: Longman.
Slavin, R.E., & Fashola, O.S. (1998). Show me the evidence! Proven and promisingprograms for America’s schools. Thousand Oaks, CA: Corwin Press.
Slavin, R.E. (1995). Cooperative learning: Theory, research, and practice (2nd ed.).Boston: Allyn & Bacon.
Slavin, R.E., Madden, N.A., Dolan, L., & Wasik, B. (1992). Success for All: A relentlessapproach to prevention and early intervention in elementary schools. Arlington,VA: Educational Research Service.
Slavin, R.E., Madden, N.A., Dolan, L., & Wasik, B. (1996a). Every child, every school:Success for All. Thousand Oaks, CA: Corwin Press.
Slavin, R.E., Madden, N.A., Dolan, L., & Wasik, B. (1996b). Success for All: Summary ofresearch. Journal of Education for Students Placed At Risk, 1 (1), 41-76.
Slavin, R.E., Madden, N.A., Karweit, N., Dolan, L., Wasik, B., Ross, S.M., & Smith, L.J.(1994). Whenever and wherever we choose: The replication of Success for All. PhiDelta Kappan, 75, 639-647.
Smith, M.S., & O’Day, J. (1990). Systemic school reform. In Politics of EducationAssociation yearbook 1990 (pp. 233-267). New York: Taylor & Francis.
Stringfield., S., Millsap, M., Herman, R., Yoder, N., Brigham, N., Nesselrodt, P., Schaffer,E., Karweit, N., Levin, M., & Stevens, R. (1997). Special strategies studies: Finalreport. Washington, DC: U.S. Department of Education.
Stringfield, S., Ross, S., & Smith, L. (1996). Bold plans for school restructuring: The NewAmerican Schools designs. Mahwah, NJ: Erlbaum.
Thompson, B., & Borrello, G. (1986). Second-order factor structure of the MBTI: Aconstruct validity assessment. Measurement and Evaluation in Counseling andDevelopment, 18, 148-153.
U.S. Department of Education (1993). Reinventing Chapter 1. Washington, DC: Author.

28

A-1
APPENDIX A : School Site Facilitator’s Questionnaire
School ID:
(Leave blank)
1997SUCCESS FOR ALL SCHOOL SITE FACILITATOR SURVEY
Scaling-Up Survey
In our continued effort to deliver a quality program as we “scale up” to over 750 schools this fall, we areseeking feedback from SFA facilitators regarding the implementation of Success For All (SFA) at their school.The purpose of this evaluation is to better understand the factors which contribute to a strong implementationof the program across the various school contexts in which it is being implemented. Please base all responseson the 1996-1997 academic year. Please answer the questions honestly and thoroughly. Your response willbe kept confidential. Thank you for your help.
Name: ____________________________________ Number of years as a classroom teacher?________
Number of years as SFA facilitator?___________
Were you at this school at the inception of SFA?
School Name:_________________________________________________________________________
School Address:________________________________________________________________________
Phone:____________________________________Principal:___________________________________
Which academic year was SFA first implemented at your school? _____________________________
Number of years as a SFA School? __________________
How would you rate the overall quality of implementation of SFA during the 1996-1997 academic year atyour school? (Please circle one).
1. Program is 2. Program is 3. Mostly good 4. Complete, 5. Thoughtful,hardly being implementation, solid, routine creative,
evident, very implemented, but some areas implementation. enthusiasticpoorly many serious poorly or implementation.
implemented problems, some incompletely or not elements missing. implemented.
implemented.
Section I. School Demographics (Please approximate.)
1. Please circle the descriptors which most closely describe your school setting:
Urban Suburban Rural
Inner-city Big city Moderate size city Small Town Other __________

A-2
Please enter responsehere
Highest number of students enrolled during the 1996-1997 academicyear
Student racial and ethnic breakdown:
% African-American
% Asian
% Hispanic / Latino
% White
% Other (please specify_____________________________)
Grade Configuration
Percent free lunch
Percent LEP
Student attendance rate
Student mobility rate
Section II. Entrance into SFA
1. Are you serviced by: JHU West Ed Education Partners
2. Who are the main SFA consultants / trainers who worked with your school during the 1996-1997academic year?
1.___________________________________________________________________________________
2.___________________________________________________________________________________
3. Who or what was the initial source of information regarding SFA to your school?
Another SFA school District personnel Title I coordinator Principal
Parents or community member Teacher (s) Awareness presentation JHU facilitator
journal article Not sure Conference____________
Other_________
4. Who or what was most influential in causing the school to adopt SFA? (Please select only one.)
District personnel Title I coordinator Principal
Teacher(s) Parents or community member Court order
Visiting other SFA schools Not sure Other_______________________________

A-3
5. How would you characterize the position of each of the following groups with regards to adoptingSFA, both on the initial adoption of the program and currently.
Supportive and Against Adoption Don’tEnthusiastic Supportive Neutral Unsupportive Know
Initial Initial Initial Initial InitialAdoption Now Adoption Now Adoption Now Adoption Now Adoption Now
DistrictPersonnelTitle ICoordinatorPrincipalTeachersParentsThe largercommunity
6. What resources were used prior to your decision to adopt SFA? (Please circle as many as apply.)
SFA video Awareness presentation Research articles
Visits to SFA schools (How many visits? __________) Visits from other schools (How many?
_________)
7. What were the most important factors that went into your decision to adopt SFA? (Please circle asmany as apply.)
Research findings Teacher support District support
Success of other SFA schools in district Had available funding
Possible state take over Court mandate
Pressure due to low scores Need to implement a reading program
Desire to make a difference for children Poor student performance on state or districttest
SFA is part of a larger school-wide restructuring effort
8. What effective strategies did you use to create “buy-in” to school-wide change?_________________
____________________________________________________________________________________
____________________________________________________________________________________

A-4
Section III. Quality of Implementation
1A. Evaluate the level of implementation of each of the following strategies/components of SFA as usedat your school.
Not Poorly Adequately OutstandinglyImplemented Implemented Implemented Implemented
Partially or
Cross grade regrouping ( atleast grades 1 -3)8 or 9 week assessmentsFamily Support TeamRaising Readers (e.g., Booksand Breakfast)Attendance programParent involvement programFacilitator’s support to teachersGrade-level team meetingsBuilding Advisory teammeetingNinety minute reading period
1B. Evaluate the quality of implementation of each of the following strategies/components of SFA asused at your school.
Rate the Quality ofImplementation
Insufficient Meets ExceedsSeveral Expectations Expectations (N/A) (N/A)
teachers not Most teachers All teachers Don’t Notimplementing implementing implementing know Used
well as described in verytraining effectively
A. STaRB. Peabody LanguageDevelopmentC. Cooperative LearningD. PK/K Thematic unitsE. Writing from theHeartF. CIRC WritingG. Individual TutoringH. Beginning ReadingProgram (ReadingRoots)I. Beyond the Basics (Reading Wings)

A-5
2. What factors were most helpful in implementing SFA successfully at your school? (Please circle asmany as apply.)
Teacher support Support from JHU facilitators and staff Support of the principal
District level support Networking with other SFA Schools Staff commitment to the program
Effective tutoring Materials (availability and quality) Training prior to implementation
Continued training Family/Parent Support Structure of the program itself
Cross-grade grouping Reduced class size Cooperative learning components
Excellent test results Continual update of new materials Early success rates
Had available funding Strong support of school site facilitator Professionalism of teachers
8-week assessment Protected 90 minute reading block Outstanding facilitator
Conference participation Consistent implementation Consistent staff meetings
Monitoring of program Staff fidelity to the SFA model Volunteers
Monitoring of implementation changes suggested by JHU Other___________________
3. What factors were impediments to your efforts in implementing SFA at your school? (Please circleas many as apply.)
Insufficient number of personnel Inadequate funding
Lack of district, board or Title I support Having to manage materials
Late arrival of some materials Getting teachers to adhere to program structure
Lack of parental involvement Insufficient number of classrooms
Insufficient and/or inconsistent training Having to train new teachers
Poor JHU Facilitator Insufficient time for staff development
Overall scheduling problems Integrating transient students
Too much paper work for teachers Not having a full-time facilitator
Large class size Inconsistent updating of materials
Lack of commitment by teachers Insufficient number of tutors
Lack of fidelity to the model Resistant teachers
Lack of leadership Space limitations
Lack of preparation time Lack of materials in Spanish
Other_____________________________

A-6
4. Describe your tutoring program.
A. How many students are provided one to one tutoring five days a week by the following groups?
1. Certified teachers ______________ 2. Aide-level tutors __________________
3. Volunteer tutors _______________ 4. Older student tutors ________________
B. How many tutoring slots do you have at each grade level?
1st __________ 2nd ___________ 3rd __________ 4th __________ 5th __________
C. How often is tutorial instruction provided in groups (rather than 1 to 1)? (Please circle one.)
Always groups Usually groups, Usually one to Always one to No tutoringsometimes one to one, sometimes one provided
one groups
5. Describe your Family Support Program.
A. How many times a month does the Family Support Team meet?
1 2 3 4 More than 4 times a month Family Support Team not in place
B. What types of social services are integrated into the school through your Family Support Team?(Please circle as many as apply)
Medical Food bank Clothing Protective services
Eyeglasses Hearing testing GED Transportation
Parenting classes Other__________________________________________
6. How many Pre-Kindergarten classes do you have?
A. English Half day _________ B. Spanish Half day__________Full day _________ Full day __________
7. How many Kindergarten classes do you have?
A. English Half day _________ B. Spanish Half day__________Full day _________ Full day __________
8. What types of after school programs do you provide for your students, both academic and non-academic?
A. ___________________________________________________________________________________
B. ___________________________________________________________________________________

A-7
9. Has there been any change in principals since the adoption of the program? Yes No
A. If yes, did this change cause problems in the implementation of the program? Please describe:
_____________________________________________________________________________________
_____________________________________________________________________________________
_____________________________________________________________________________________
_____________________________________________________________________________________
10. Has there been any change in facilitators at your school since the adoption of the program? Yes No
A. If yes, did this change cause problems in the implementation of the program? Please describe:_____________________________________________________________________________________
_____________________________________________________________________________________
_____________________________________________________________________________________
_____________________________________________________________________________________
11. How many hours per week do you spend on the following activities?
ACTIVITY Hours per week
1. Observing teachers’ classes
2. Observing tutoring sessions
3. Attending grade level team meetings or other small group
meetings
4. Attending Family Support Team meetings
5. Meeting with individual teachers
6. Meeting with principal
7. Meeting with parents
8. Preparing materials
9. Dealing with eight-week assessments or regrouping
10. Assessing individual students
11. Record keeping for Title I or district
12. Lunch room duty, bus duty, or playground duty
13. Tutoring individual students
14. Substitute teaching
15. Other (Please specify)
16.
17.
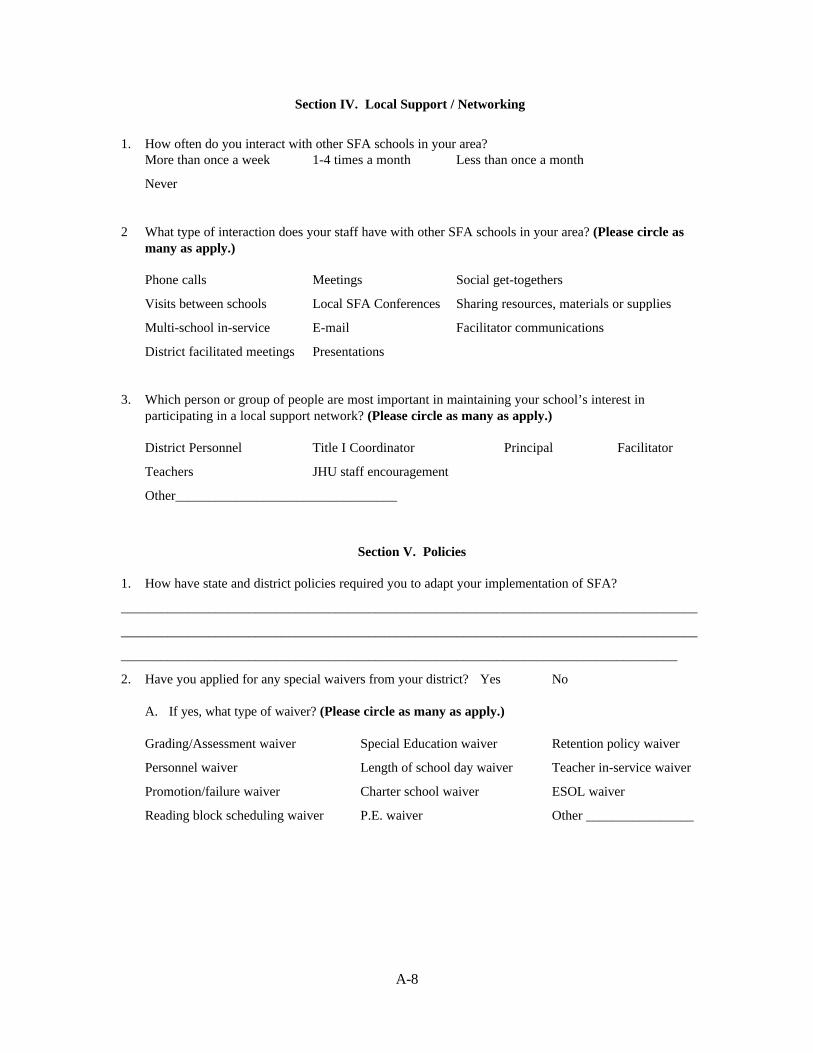
A-8
Section IV. Local Support / Networking
1. How often do you interact with other SFA schools in your area?More than once a week 1-4 times a month Less than once a month
Never
2 What type of interaction does your staff have with other SFA schools in your area? (Please circle asmany as apply.)
Phone calls Meetings Social get-togethers
Visits between schools Local SFA Conferences Sharing resources, materials or supplies
Multi-school in-service E-mail Facilitator communications
District facilitated meetings Presentations
3. Which person or group of people are most important in maintaining your school’s interest inparticipating in a local support network? (Please circle as many as apply.)
District Personnel Title I Coordinator Principal Facilitator
Teachers JHU staff encouragement
Other_________________________________
Section V. Policies
1. How have state and district policies required you to adapt your implementation of SFA?
______________________________________________________________________________________
______________________________________________________________________________________
___________________________________________________________________________________
2. Have you applied for any special waivers from your district? Yes No
A. If yes, what type of waiver? (Please circle as many as apply.)
Grading/Assessment waiver Special Education waiver Retention policy waiver
Personnel waiver Length of school day waiver Teacher in-service waiver
Promotion/failure waiver Charter school waiver ESOL waiver
Reading block scheduling waiver P.E. waiver Other ________________

A-9
Section VI. Training Issues
1. How many training and follow-up days did you have during the 1996-1997 academic year?__________
2. Please indicate your satisfaction with the training your staff received from JHU, West Ed, orEducational Partners facilitators.
Very Satisfied Satisfied UnsatisfiedModerately
A. How satisfied are you with theinitial training your staff receivedfrom your JHU, West Ed, orEducational Partners facilitators?
B. How satisfied are you with thefollow-up training your staffreceived from your JHU, West Ed,or Educational Partners facilitator.
3. How often do you speak to your JHU, West Ed, or Educational Partners facilitator by phone?
More than once a week 1-4 times a month Less than once a month
Section VII. Budget Issues
1. How would you describe your current level of funding? (Please circle.)
Fully Moderately ModeratelyAdequate Adequate Adequate Inadequate Inadequate
2. Have you had any major funding changes since the inception of the program? Yes No (Please circle any of these situations which apply to your school.)
Title I funds cut Title I funds increased
Grants allocated for SFA decreased Received additional grants for the implementation of SFA
Loss of school-wide Title I status Received approval as school-wide Title I school
School operating budget decreased School operating budget increased
State/local funds decreased State/local funds increased
Budget reorganization School reorganization

A-10
3. Has there been a change in your school’s population since the inception of the program? Yes No
(Please circle any of these situations which apply to your school.)
Population increased Population decreased Loss of free/reduced lunch studentsIncrease in free/reduced lunch students Reduction of identified Title I students
Increase in bilingual students Decrease of LEP students Increase of LEP students
School re-configured Influx of new students due to positive results of SFA
Section VIII. Views on School Reform and School Change
Part 1. Please read the following scenario, then respond to the questions which follow.
Highland Elementary School, a large racially mixed school in the Northeast section of the UnitedStates, is under consideration for state reconstitution. Over the last decade, Highland Elementary hasexperienced a steady and rapid decline in student performance on statewide assessment measures, teachermorale, and community support. Additionally, Highland Elementary suffers from high student mobilityand high teacher turnover. On July 7th, Dr. Tejeda, principal at Highland for the past 12 years, becameseriously ill and was forced to take early retirement. Although the untimely news of Dr. Tejeda’sretirement was unfortunate, many community leaders viewed it as an opportunity to make fundamentalchange at Highland Elementary School.
To the surprise of many community leaders, the district moved quickly and narrowed down thecandidate pool to two external candidates. Both candidates are currently vice principals at smaller schoolsin neighboring districts, and are believed to have the experience and vision necessary to inspire, lead, andmanage the type of reform efforts needed to withstand the threat of state reconstitution. What separatesthe two candidates most distinctly is their philosophy regarding school change.
Candidate A’s vision for Highland Elementary School focuses on systemic school reform specificallylooking to raise standards and accountability through shared governance. The main thrust of CandidateA’s plan calls for greater collaboration between teachers and parents in the decision making processes ofthe school. He proposes forming a Policy and Standards Committee, whose mission is to develop newacademic standards and general operating procedures for the school. Candidate A strongly believes thatpolicies and practices developed by teachers, in collaboration with parents, will yield the greatestimprovement in students achievement, as well as teacher job satisfaction. Teachers will be given theauthority and autonomy, within the guidelines of district policies, to engage in the practices which “bestmeet” the needs of their students. This approach allows individual teachers to use their creative andprofessional judgment to develop educational strategies and innovations that are tailored to the specificcontexts in which they teach.
Candidate B, on the other hand, is advocating for a more comprehensive reform approach. His visionfor Highland Elementary School calls for a relatively well-specified approach to curriculum, instruction,and school organization. He is advocating to implement an externally developed school reform modelwhich would provide curriculum materials, teachers’ manuals, and professional development. Thisapproach, which tends to be school-wide and highly prescriptive, will alter patterns of staffing, schoolgovernance, and other features of school organization. Candidate B believes that providing teachers withproven effective educational strategies and extensive training in how to use them is the best way toimprove student achievement.
The school community is very excited about both candidates. There is great hope and optimism that anew principal is the first of many steps in turning the school around.

A-11
Part 2. Using a 7 point scale ( where 1=strongly disagrees, 4=neutral, 7=strongly agree), indicatethe extent to which you agree or disagree with each of the following statements as theyrelate to school change. Please focus on your view regarding the approach to school change,not the specifics of the changes outlined in the scenario.
View of the Change Process Candidate A Candidate B
This type of change will benefit Highland Elementary School 1 2 3 4 5 6 1 2 3 4 5 6 7 7
I like this type of change 1 2 3 4 5 6 1 2 3 4 5 6 7 7
I would look forward to such changes if I were an educator atHighland
1 2 3 4 5 6 1 2 3 4 5 6 7 7
This type of change helps teachers perform better 1 2 3 4 5 6 1 2 3 4 5 6 7 7
Teachers look forward to such change 1 2 3 4 5 6 1 2 3 4 5 6 7 7
I would enjoy going through this change process 1 2 3 4 5 6 1 2 3 4 5 6 7 7
This type of change improves the work conditions of schools 1 2 3 4 5 6 1 2 3 4 5 6 7 7
I would be frustrated by this type of change 1 2 3 4 5 6 1 2 3 4 5 6 7 7
I would advocate for this type of change 1 2 3 4 5 6 1 2 3 4 5 6 7 7
I would resist this type of change 1 2 3 4 5 6 1 2 3 4 5 6 7 7
I would give this type of change a try 1 2 3 4 5 6 1 2 3 4 5 6 7 7
Teachers resist this type of change 1 2 3 4 5 6 1 2 3 4 5 6 7 7
My colleagues would think that I support this type of change 1 2 3 4 5 6 1 2 3 4 5 6 7 7
This type of change stifles teachers 1 2 3 4 5 6 1 2 3 4 5 6 7 7
This is an effective approach to school change 1 2 3 4 5 6 1 2 3 4 5 6 7 7
This is an effective approach to improving student achievement 1 2 3 4 5 6 1 2 3 4 5 6 7 7
Section IX. Conference Participation
1. Circle the year(s) you participated in the annual SFA conference in Baltimore or Southern California.
1994 1995 1996 1997 None
2. Circle the year(s) others from your staff participated in the annual SFA conference in Baltimore orSouthern California.
1994 1995 1996 1997 None

A-12
Section X. Program Effectiveness
1. Please indicate the degree to which you agree or disagree with the following statements regardingyour overall SFA program.
Strongly Strongly Disagree Disagree Neutral Agree Agree
1. SFA is having a positive impact onmy school.
2. SFA is having a positive impact onstudents’ interest in reading at myschool.
3. SFA is having a positive impact onstudents’ achievement in reading inthe classroom.
4. SFA is having a positive impact onstudents’ scores on the district’sstandardized tests.
5. SFA is reducing placement in specialeducation.
6. SFA is increasing attendance.
7. SFA is reducing discipline referrals.
8. Teachers have received adequatematerials and resources to implementSFA effectively
9. I have felt prepared to be a SFAfacilitator.
10. SFA is increasing parental involvement atmy school.
The next phase of our research involves making site visits and surveying classroom teachers. Canwe contact you regarding becoming a possible research site? Yes No
Thank you for your time and assistance.

B-1
APPENDIX B
Scale Items
1. Teacher support 30. Volunteers
2. Support from JHU facilitators and 31. Monitoring of implementation ofstaff changes suggested by JHU
3. Support of the principal 32. Insufficient number of
4. District level support
5. Networking with other SFA Schools
6. Staff commitment to the program
7. Effective tutoring
8. Materials (availability and quality)
9. Training prior to implementation
10. Continued training
11. Family/parent support
12. Structure of the program itself
13. Cross-grade grouping
14. Reduced class size
15. Cooperative learning components
16. Excellent test results
17. Continual update of new materials
18. Early success rates
19. Had available funding
20. Strong support of school site facilitator
21. Professionalism of teachers
22. Eight-week assessment
23. Protected 90-minute reading block
24. Outstanding facilitator
25. Conference participation
26. Consistent implementation
27. Consistent staff meetings
28. Monitoring of program
29. Staff fidelity to the SFA model
personnelInadequate funding
33. Lack of district, board, or Title Isupport
34. Having to manage materials
35. Late arrival of some materials
36. Getting teachers to adhere to programstructure
37. Lack of parental involvement
38. Insufficient number of classrooms
39. Insufficient and/or inconsistent training
40. Having to train new teachers
41. Poor JHU Facilitator
42. Insufficient time for staff development
43. Overall scheduling problems
44. Integrating transient students
45. Too much paper work for teachers
46. Not having a full-time facilitator
47. Large class size
48. Inconsistent updating of materials
49. Lack of commitment by teachers
50. Insufficient number of tutors
51. Lack of fidelity to the model
52. Resistant teachers
53. Lack of leadership
54. Space limitations
55. Lack of preparation time
56. Lack of materials in Spanish