Social Security: Who’s Counting on It? - AARP · PDF fileup a disproportionately large...
5
9 In 2011, nearly 55 million people received some sort of Social Security benefit. 9 In 2010, Social Security kept 35 percent of older Americans out of poverty. Social Security: Who’s Counting on It? 1 Selena Caldera AARP Public Policy Institute Social Security insures families against the loss of income caused by retirement, disability, or death, with nearly universal coverage. Social Security has been a success; however, the program has a long-term financial challenge. Over the next 75 years, Social Security’s actuarial deficit is projected to be 2.22 percent of taxable payroll. 2 This deficit needs to be addressed soon, without changing the fundamental structure of the program or eroding the protections it offers to almost all workers and their families. Here are some important facts to remember as the future of Social Security is discussed. Social Security Insurance Protects All Age Groups. Social Security not only provides retirement income for older Americans, it also protects workers of all ages and their families against the risks of death and disability (see figure 1). In 2011, 55 million people, including about 38 million under age 65, received some sort of Social Security benefit. 3 ■ Ninety-seven percent of people aged 20 to 49 in covered employment have earned survivorship protections for their family. 4 ■ Ninety-one percent of people aged 21 to 64 in covered employment can depend on a monthly cash benefit in the case of a severe and prolonged disability. 5 Social Security Benefits Are Fully Funded for Another 24 Years. The Social Security trust funds have accumulated more than $2.6 trillion in assets, and their value is estimated to peak at $3.7 trillion in 2022. After that year, the trust funds assets will begin to be drawn down in order to pay full benefits. Beginning in 2036, according to the Social Security trustees, the Social Security trust funds will be exhausted. Without any changes, Social Security Figure 1 Who Benefited from Social Security in 2011? Source: Social Security Administration, Beneficiary Data: Number of Social Security recipients at the end of Dec 2011. Accessed from http://www.ssa.gov/cgi-bin/currentpay.cgi. Disabled workers 15% Children 8% Spouses 4% Widows, Widowers, and Parents 8% Retired worker 64% Fact Sheet AARP Public Policy Institute
Transcript of Social Security: Who’s Counting on It? - AARP · PDF fileup a disproportionately large...

9 In 2011, nearly 55 million people received some sort of Social Security benefit.9 In 2010, Social Security kept 35 percent of older Americans out of poverty.
Social Security: Who’s Counting on It?1
Selena CalderaAARP Public Policy Institute
Social Security insures families against the loss of income caused by retirement, disability, or death, with nearly universal coverage. Social Security has been a success; however, the program has a long-term financial challenge. Over the next 75 years, Social Security’s actuarial deficit is projected to be 2.22 percent of taxable payroll.2 This deficit needs to be addressed soon, without changing the fundamental structure of the program or eroding the protections it offers to almost all workers and their families. Here are some important facts to remember as the future of Social Security is discussed.
Social Security Insurance Protects All Age Groups.
Social Security not only provides retirement income for older Americans, it also protects workers of all ages and their families against the risks of death and disability (see figure 1). In 2011, 55 million people, including about 38 million under age 65, received some sort of Social Security benefit.3
■ Ninety-seven percent of people aged 20 to 49 in covered employment have earned survivorship protections for their family.4
■ Ninety-one percent of people aged 21 to 64 in covered employment can depend on a monthly cash benefit in
the case of a severe and prolonged disability.5
Social Security Benefits Are Fully Funded for Another 24 Years.
The Social Security trust funds have accumulated more than $2.6 trillion in assets, and their value is estimated to peak at $3.7 trillion in 2022. After that year, the trust funds assets will begin to be drawn down in order to pay full benefits.
Beginning in 2036, according to the Social Security trustees, the Social Security trust funds will be exhausted. Without any changes, Social Security
Figure 1Who Benefited from Social Security in 2011?
Source: Social Security Administration, Beneficiary Data: Number of Social Security recipients at the end of Dec 2011. Accessed from http://www.ssa.gov/cgi-bin/currentpay.cgi.
Disabled workers
15%
Children8%
Spouses4%
Widows, Widowers,
and Parents
8%
Retired worker64%
Fact Sheet
AARP Public Policy Institute
Social Security: Who’s Counting on It?
2
taxes (primarily payroll taxes) still will be enough to pay 76 percent of scheduled benefits in 2037 and 74 percent of scheduled benefits in 2085.6
It is important that reforms to bring the program into solvency be made sooner rather than later. The sooner action is taken, the less severe the changes to the program must be. For example, an increase in the payroll tax of 2.15 percentage points or a 13.8 percent decrease in benefits now would close the shortfall in the Social Security trust funds, whereas waiting until after 2036 requires a 4 percentage point increase in the payroll tax or a23 percent reduction in benefits.
Just as important, the sooner changes are made, the more time there will be for future retirees to adjust their retirement plans.
Social Security Is the Principal Source of Family Income for Nearly Half of Older Americans.
Twenty-four percent of those aged 65 and over live in families that depend on Social Security benefits for 90 percent or more of their income. Another 26 percent receive at least half but less than 90 percent of their family income from Social Security (see table 1).7
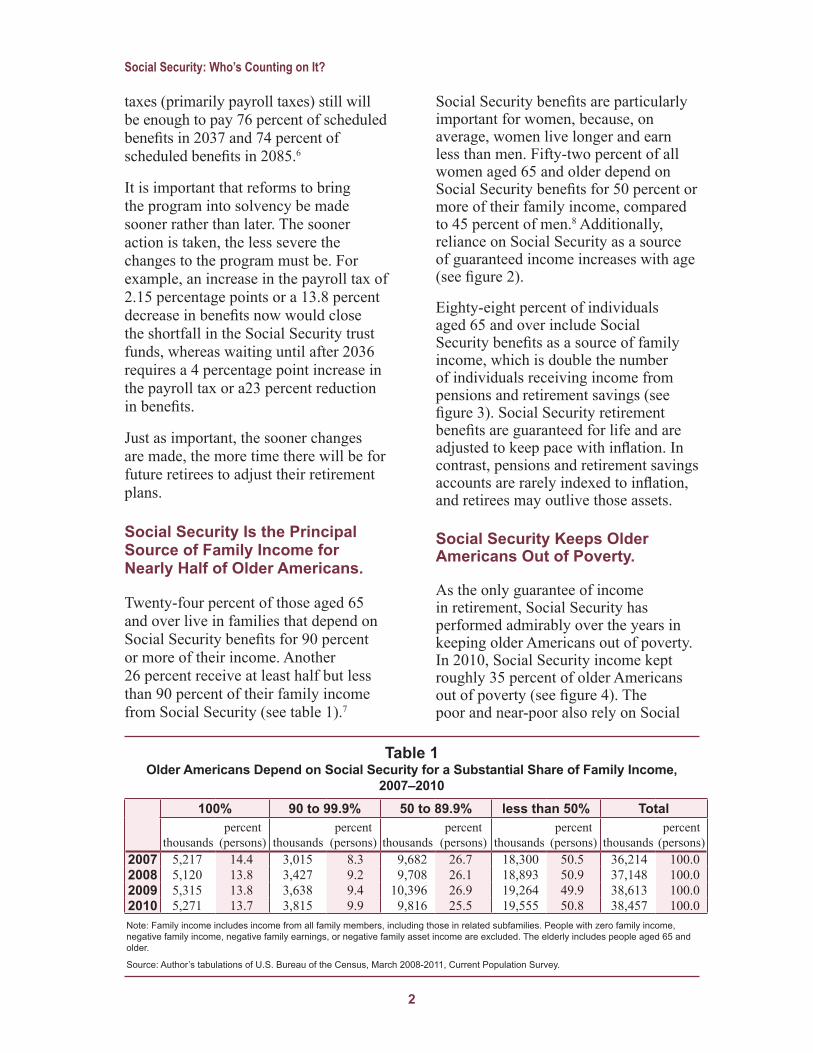
Social Security benefits are particularly important for women, because, on average, women live longer and earn less than men. Fifty-two percent of all women aged 65 and older depend on Social Security benefits for 50 percent or more of their family income, compared to 45 percent of men.8 Additionally, reliance on Social Security as a source of guaranteed income increases with age (see figure 2).
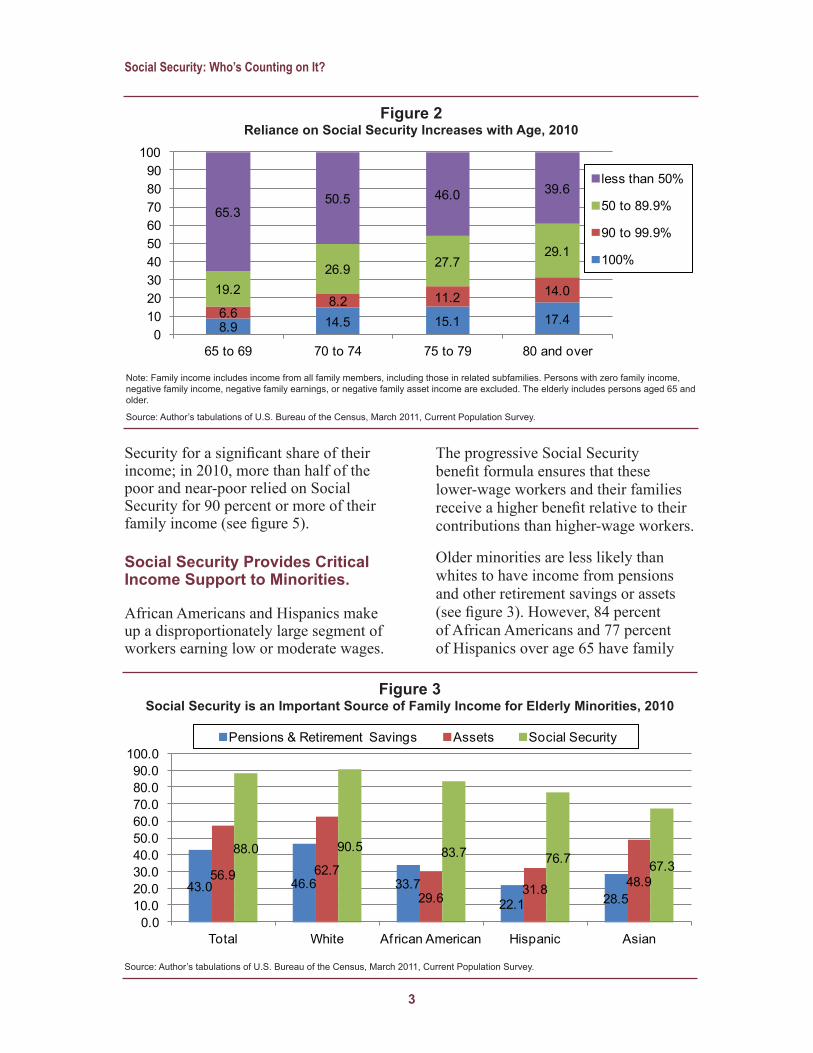
Eighty-eight percent of individuals aged 65 and over include Social Security benefits as a source of family income, which is double the number of individuals receiving income from pensions and retirement savings (see figure 3). Social Security retirement benefits are guaranteed for life and are adjusted to keep pace with inflation. In contrast, pensions and retirement savings accounts are rarely indexed to inflation, and retirees may outlive those assets.
Social Security Keeps Older Americans Out of Poverty.
As the only guarantee of income in retirement, Social Security has performed admirably over the years in keeping older Americans out of poverty. In 2010, Social Security income kept roughly 35 percent of older Americans out of poverty (see figure 4). The poor and near-poor also rely on Social
Table 1Older Americans Depend on Social Security for a Substantial Share of Family Income,
2007–2010100% 90 to 99.9% 50 to 89.9% less than 50% Total
thousandspercent
(persons) thousandspercent
(persons) thousandspercent
(persons) thousandspercent
(persons) thousandspercent
(persons)2007 5,217 14.4 3,015 8.3 9,682 26.7 18,300 50.5 36,214 100.02008 5,120 13.8 3,427 9.2 9,708 26.1 18,893 50.9 37,148 100.02009 5,315 13.8 3,638 9.4 10,396 26.9 19,264 49.9 38,613 100.02010 5,271 13.7 3,815 9.9 9,816 25.5 19,555 50.8 38,457 100.0Note: Family income includes income from all family members, including those in related subfamilies. People with zero family income, negative family income, negative family earnings, or negative family asset income are excluded. The elderly includes people aged 65 and older.
Source: Author’s tabulations of U.S. Bureau of the Census, March 2008-2011, Current Population Survey.
3
Social Security: Who’s Counting on It?
Security for a significant share of their income; in 2010, more than half of the poor and near-poor relied on Social Security for 90 percent or more of their family income (see figure 5).
Social Security Provides Critical Income Support to Minorities.
African Americans and Hispanics make up a disproportionately large segment of workers earning low or moderate wages.
The progressive Social Security benefit formula ensures that these lower-wage workers and their families receive a higher benefit relative to their contributions than higher-wage workers.
Older minorities are less likely than whites to have income from pensions and other retirement savings or assets (see figure 3). However, 84 percent of African Americans and 77 percent of Hispanics over age 65 have family
Figure 2Reliance on Social Security Increases with Age, 2010
Note: Family income includes income from all family members, including those in related subfamilies. Persons with zero family income, negative family income, negative family earnings, or negative family asset income are excluded. The elderly includes persons aged 65 and older.
Source: Author’s tabulations of U.S. Bureau of the Census, March 2011, Current Population Survey.
8.9 14.5 15.1 17.46.68.2 11.2 14.019.2
26.9 27.729.1
65.350.5 46.0 39.6
0102030405060708090
100
65 to 69 70 to 74 75 to 79 80 and over
less than 50%
50 to 89.9%
90 to 99.9%
100%
Figure 3Social Security is an Important Source of Family Income for Elderly Minorities, 2010
Source: Author’s tabulations of U.S. Bureau of the Census, March 2011, Current Population Survey.
43.0 46.6 33.722.1 28.5
56.9 62.7
29.6 31.8 48.9
88.0 90.5 83.7 76.7 67.3
0.010.020.030.040.050.060.070.080.090.0
100.0
Total White African American Hispanic Asian
Pensions & Retirement Savings Assets Social Security

4
Social Security: Who’s Counting on It?
income from Social Security. Older African Americans and Hispanics are more likely than older whites to depend on Social Security for 90 percent or more of their family income (figure 6).
Social Security Is the Foundation of Workers’ Retirement Security, But It Was Never Intended to Be the Only Source.
Social Security was intended to provide vital basic protections for workers and their families. However, savings and pensions are important components of overall retirement income security. For a comfortable retirement, many financial planners suggest that an individual’s total income from pensions, personal savings, and Social Security should replace at least 70 percent of preretirement income.9 On average, however, Social Security replaces only 41 percent of a medium earner’s wages.10
Figure 4Social Security Keeps Older Americans
Out of Poverty, 2010
Source: Author’s tabulations of U.S. Bureau of the Census, March 2011, Current Population Survey.
Above poverty because of Social Security
35.3
Below poverty
9.0
Above poverty
55.7
Figure 5Social Security is Vital to Poor and Low-Income Older Americans, 2010
Note: Family income includes income from all family members, including those in related subfamilies. Persons with zero family income, negative family income, negative family earnings, or negative family asset income are excluded. The elderly includes persons aged 65 and older.
Source: Author’s tabulations of U.S. Bureau of the Census, March 2011, Current Population Survey.
40.4 41.424.6
11.20.6
13.021.8
24.1
16.3
1.7
12.9
22.531.5
44.4
22.6
33.714.3 19.8 28.1
75.1
0%10%20%30%40%50%60%70%80%90%
100%
under 1.00 1.00 to 1.49 1.50 to 1.99 2.00 to 2.49 2.50 and above
Ratio of family income to federal poverty level
less than 50%50 to 89.9%90 to 99.9%100%
2010 Poverty Thresholds for Persons 65 and Older1 person family $10,458 2 person family $13,194

5
Social Security: Who’s Counting on It?
Figure 6Older Minorities Depend on Social Security to Provide a
Significant Share of Family Income, 2010
Note: Family income includes income from all family members, including those in related subfamilies. People with zero family income, negative family income, negative family earnings, or negative family asset income are excluded. The elderly includes people aged 65 and older.
Source: Author’s tabulations of U.S. Bureau of the Census, March 2011, Current Population Survey.
12.422.2 18.5 10.1
10.95.5 5.9
5.1
27.1 21.316.4
13.3
49.6 51.0 59.171.6
0%10%20%30%40%50%60%70%80%90%
100%
White African American Hispanic Asian
less than 50%50 to 89.9%90 to 99.9%100%
Endnotes1 This is an update of Social Security: Who’s Counting on It?, Fact Sheet 178, using 2011 administrative data and 2010 survey data.2 Board of Trustees, Federal Old-Age and Survivors Insurance and Federal Disability Insurance Trust Funds, The 2011 Annual Report of the Board of Trustees of the Federal Old-Age and Survivors Insurance and Disability Insurance Trust Funds. Washington, DC, May 2011, www. http://ssa.gov/OACT/TR/2011/tr2011.pdf.
The actuarial deficit is the difference between income (payroll tax contributions and income from the taxation of scheduled benefits) and scheduled benefits and administrative costs. A deficit of 2.22 percent of taxable payroll means that a payroll tax increase of 2.22 percentage points would close the deficit.3 Number of beneficiaries as of December 31, 2011. Social Security Administration, Social Security Beneficiary Statistics, www.ssa.gov/OACT/STATS/OASDIbenies.html; Social Security Administration, “Social Security Program Fact Sheet, December 31, 2011,” www.ssa.gov/OACT/FACTS/.4 Social Security Administration, “Social Security Program Fact Sheet, December 31, 2011,” www.ssa.gov/OACT/FACTS/. 5 Ibid.6 Op. cit., note 1.7 These tabulations take account of the income of the entire family in estimating the extent to which older individuals depend on Social Security. See http://assets.aarp.org/rgcenter/ppi/econ-sec/fs178-socsec- tables.pdf for estimates of dependence on Social Security by state.8 Selena Caldera, Social Security: A Key Retirement Resource for Women, AARP Public Policy Institute Fact Sheet No. 251, March 2012.9 Investopedia.com, “Mutual Fund Basics Tutorial,” www.investopedia.com/university/mutualfunds/. 10 Social Security Administration, “2012 Social Security/SSI/Medicare Information,” http://www.ssa.gov/legislation/2012factsheet.pdf.
Fact Sheet 252, March, 2012
AARP Public Policy Institute601 E Street, NW, Washington, DC 20049www.aarp.org/ppi202-434-3910, [email protected] © 2012, AARP.Reprinting with permission only.
Fact
She
et


![Directcalculationofbucklingandfatiguestrength oflargeRo ...journal16.magtechjournal.com/jwk_zgjcyj/fileup/PingShen/...ShipResearchFundingProject([2016]545) Author(s):HE Lisi, female,](https://static.fdocuments.us/doc/165x107/6086a4dff86c0e4be20f0189/directcalculationofbucklingandfatiguestrength-oflargero-shipresearchfundingproject2016545.jpg)


