Social Networks in the Aftermath of Drone Strikes...
9
Social Networks in the Aftermath of Drone Strikes in Yemen CS 224W Final Report Leon Yao ([email protected]) December 8, 2015 1 Introduction In 2011, the Yemen Revolution was one of many Arab Spring protests in the Middle East. The protests initially started in its capital, Sana’a, but was quickly felt throughout the nation. Because many riots were often organized using calls and texts, this made communication networks more important than ever. During the revolution, the number of phone users doubled to over 11 million people, which is approximately half of Yemen’s total population of 24 million. Because Yemen has only 15% internet penetration, this makes the mobile social network a good approximation of true information flow within the country. Since phones were relatively new in Yemen, the social network is incredibly sparse and was constantly changing during this volatile year. During this time period, there were also many U.S drone strikes that happened throughout Yemen. These strikes often happened in less populated areas of the country where terrorists were suspected to be hiding. Select drone strikes can be detectable from huge spikes in volume of calls. My research analyzes the social network of people affected by these drones strikes. We wish to find out whether people talk to the same people after the drone strike, or whether they change their call pattern. It would also be interesting to see if people with high centrality or page rank are contacted more often during the drone strike. Finally, we wish to see how information of a drone strike cascades throughout the network. 2 Literature Review 2.1 Structure and Tie Strengths in Mobile Communication Networks (Onnela et. al) Onnela et. al analyzes a social network of millions of users that captures 20% of the country’s population. They constructed a mobile call graph with 4.6 million nodes and 7 million edges, mostly all belonging to a single giant connected component. They discovered that the MCG has a skewed degree distribution with a fat tail, as well as a broad tie strength distribution. They also found that the network structure consisted of small local clusters grouped around high-degree individuals. These communities had strong ties within, but were connected by weak ties between communities. They also simulated the diffusion of information on this network given weighted ties. They found that information often flowed quickly within small communities, but would often not infect other communities through weak ties. This paper gives a good baseline for what properties of social networks I should expect for a mobile communication network of millions of users. 1
Transcript of Social Networks in the Aftermath of Drone Strikes...
Social Networks in the Aftermath of Drone Strikes in Yemen
CS 224W Final ReportLeon Yao ([email protected])
December 8, 2015
1 Introduction
In 2011, the Yemen Revolution was one of many Arab Spring protests in the Middle East. Theprotests initially started in its capital, Sana’a, but was quickly felt throughout the nation. Becausemany riots were often organized using calls and texts, this made communication networks moreimportant than ever. During the revolution, the number of phone users doubled to over 11 millionpeople, which is approximately half of Yemen’s total population of 24 million. Because Yemenhas only 15% internet penetration, this makes the mobile social network a good approximation oftrue information flow within the country. Since phones were relatively new in Yemen, the socialnetwork is incredibly sparse and was constantly changing during this volatile year. During this timeperiod, there were also many U.S drone strikes that happened throughout Yemen. These strikesoften happened in less populated areas of the country where terrorists were suspected to be hiding.Select drone strikes can be detectable from huge spikes in volume of calls. My research analyzes thesocial network of people affected by these drones strikes. We wish to find out whether people talkto the same people after the drone strike, or whether they change their call pattern. It would alsobe interesting to see if people with high centrality or page rank are contacted more often duringthe drone strike. Finally, we wish to see how information of a drone strike cascades throughout thenetwork.
2 Literature Review
2.1 Structure and Tie Strengths in Mobile Communication Networks (Onnelaet. al)
Onnela et. al analyzes a social network of millions of users that captures 20% of the country’spopulation. They constructed a mobile call graph with 4.6 million nodes and 7 million edges,mostly all belonging to a single giant connected component. They discovered that the MCG hasa skewed degree distribution with a fat tail, as well as a broad tie strength distribution. Theyalso found that the network structure consisted of small local clusters grouped around high-degreeindividuals. These communities had strong ties within, but were connected by weak ties betweencommunities. They also simulated the diffusion of information on this network given weighted ties.They found that information often flowed quickly within small communities, but would often notinfect other communities through weak ties. This paper gives a good baseline for what propertiesof social networks I should expect for a mobile communication network of millions of users.
1

2.2 Collective Response of Human Population to Large-Scale Emergencies (Bagrowet. al)
Bagrow et. al analyzes the effects and responses of emergencies and events on social networks. Inparticular, they found that in the time right after these emergencies, there is a spike in call volumethat gradually decreases. This shows that call activity is a good “sociometers” that capture societalperturbations. They also found that the call spike is found strongest at the epicenter and decaysexponentially with respect to distance from the event site. Bagrow et. al also characterized thecascade of information diffusion in the network. In particular, they distinguished the people at theevent site (G0), the friends of those people (G1), and the friends of the friends (G2), etc. Theyfound that for disasters like a plane crash and bombing, even the third cascading layer will have ananomalous call pattern. However for lesser events, such as a blackout and earthquake, there is littlepropagation past the initial layer. This paper gives good tools for analyzing emergency events likedrone strikes using call volume. They also describe methods for analyzing cascades of informationin the network.
2.3 Information Cascades in Social Media in Response to a Crisis (Hui et. al)
Hui et. al describes a model of diffusion of actionable information on Twitter after crisis events.They define each node in their twitter network as one of many states including Uninformed, andBelieved. They then define many events that may happen to change the states of each node.Finally they introduce the types of actions each node can take depending on their state. Forexample Believed node may choose to send direct messages to people or broadcast a tweet (whichmay infect others with a certain percentage). Hui et. al focused on the social network of users afterthe crisis and between official warnings broadcasted on news stations. They found that informationcascades originated from central users in the network. Most retweeted messages terminated aftera single sharing, and there were few long chains of retweets. This paper gives good expectationson what I should in my drone strike social networks. In particular, I should expect that cascadechains in my network will be very small.
2.4 Inferring Friendship Network Structure using Mobile Phone Data (Eagleet. al)
Eagle et. al analyze a mobile social network and compares these results to information givenby self-reported surveys regarding friendships. They found that if mobile activity is paired withproximity data (distance between users), then behavioral patterns could strongly predict friend-ships. For example, spending long hours in close proximity on Saturday night is very different fromWednesday afternoon. By using proximity in their predictive model, they found that 96 percentof reported non-friendships and 95 percent of reported friendships from the surveys could be ac-curately predicted. One of my project’s main questions is whether people will call their closestfriends/family in the aftermath of the drone strike. This paper tells us that by pairing proximityand mobile activity, we can have a pretty good indicator for how close two users are.
2

3 Data
The mobile data includes all call and text information within a telecommunications networkin Yemen from 1/1/10 - 10/31/12. This data includes anonymized numbers, type of call (cell,landline, international, automated), time of call, and cell towers. For people not within the network(foreigners or subscribers of another network), location information is not given. The network isone of largest in Yemen and covers over half of all communications in the country. The drone strikedata includes 76 drone strikes between 2010 - 2013. For each strike, there is additional informationon number of military and civilian casualties, village, geolocation, approximate time (as reportedby the news), and description of the event.
Acknoledgements: The data was collected by Prof. Fotini Christia of MIT and cleaned by theStanford Info Lab. This project is an extension of research under Prof. Jure Leskovec.
4 Definitions
G0: Given the geolocation and time of the drone strike, G0 is the set of people who’s associatedcell tower is within a 10 mile radius during the drone strike.
G1: The set of people that calls or is called by G0 during the drone strike, that is not already in G0.
G2: The set of people who calls or is called by G1 during the drone strike, that is not already inG0 or G1
Note: These sets are disjoint and are formed in chronological order of calls. For example ifg1 ∈ G1 calls a person, p, before g1 has been put into G1, then p will not be put into G2. Peoplewill be put into these sets based on the first relevant call they make. There are cases in which aperson can be put into multiple sets (for example if they started outside of the drone strike radius,but moves inside later), however, they remain in the set they are put into first.
5 Methods
5.1 Identifying the Drone Strike
Because the time of the drone strikes are only approximate and not realiable, it is important todevelop a method for identifying drone strikes through only the telecommunications data.
I use a method anomaly detection suggested by Bagrow et. al, to find the time periods of thedrone strikes. I first aggregate the volume of calls to cell towers within 10 miles of the drone strike,in 15 minute blocks. I use baseline call volumes from 4 previous weeks and compute the standarddeviation and average call volumes by time and day of week. Then for the day of the drone strike,I plot the absolute deviation between the drone strike call volume and the average of the baselinesdivided by the standard deviation of the baseline (Z value) to see when the event is. A peak in thegraph would refer to an abnormal amount of call volume as compared to the past, and accuratelyaccounts for variance in the baseline. Since drone strike location data is scraped from news sources,they often do not include a specific time period (morning, night, etc). This abnomaly detectionmethod is crucial to identifying the event period.
3
Although 76 drone strikes were given in the dataset, a large majority of them were in areaswithout nearby cell towers, or simply did not have a visible peak in calls. The approximate time ofthe drone strike, however, can be used to verify whether the anomaly detection algorithm works, ifit reports the same time.
Figure 1: Call Dist. of Drone Strike and Baselines Figure 2: Z Values of Drone Strike
I algorithmically find the peaks by finding the largest period of continuous time with deviationover 2 standard deviations over the mean of the baselines. This heuristic will allow me to findthe drone strike, without manually having to determine each one from the graphs. For dronestrikes that are less prominent, I will have to modify the number of standard deviations to use asa threshold.
Figure 1 and 2 show the call distribution and Z value of a drone strike on 2012-04-16. Thex-axis has the number of minutes after UTC+0, and the y-axis shows the number of calls.
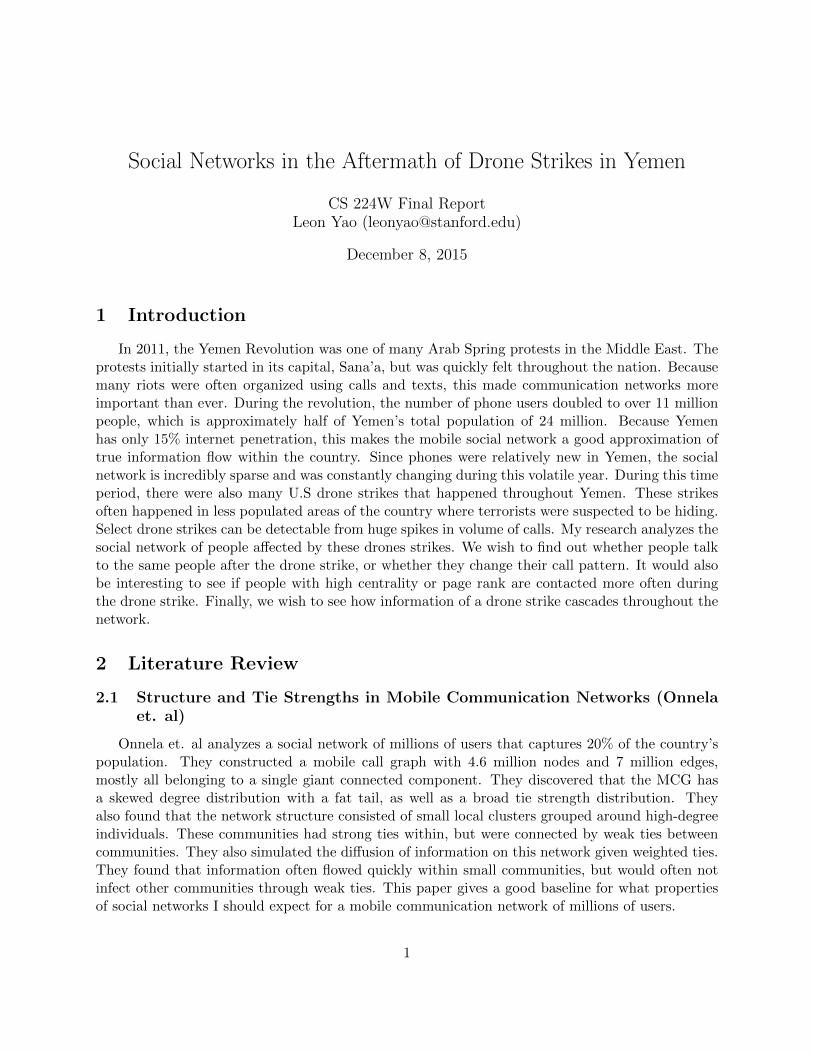
Figure 3: Locations of the three drone strikes
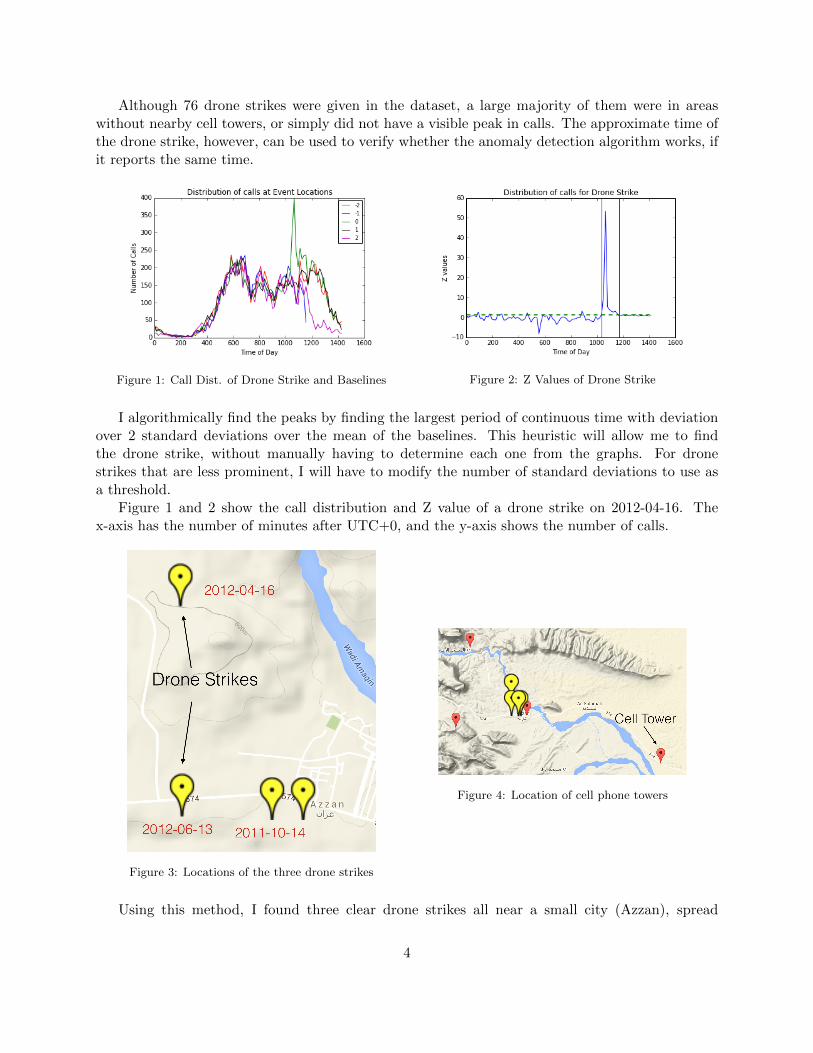
Figure 4: Location of cell phone towers
Using this method, I found three clear drone strikes all near a small city (Azzan), spread
4

throughout 2011 and 2012. I will refer to these drone strikes by their date (2011-10-14, 2012-04-16,2012-06-13). Figure 3 and 4 show the three drone strikes and 4 cell towers within 10 miles. Allthree drones strikes lasted about 150-200 minutes and matched the approximate times given in mydataset.
5.2 Finding G0, G1 and G2
G0, G1 and G2 are determined by chronologically looking through calls during the time of thedrone strike. A person cannot be put into more than one of the three sets and will remain in theset it is first assigned.
Note: While assigning users to each group, I noticed that G2 had upwards of 2 million users.Upon further digging, I found that many people use phone cards to make calls. This process hasusers call the number for the phone card, which then redirects them to their actual call destination.However, in the dataset, this is represented as two seperate calls. Because some phone card numberswere found in G1, these phone cards subsequently connected to millions of other people (that hadno relation to the drone strike). I set a threshold so that any number that made over 1,000 phonecalls in that day would be considered a phone card number and would be removed from the sets.
Figure 5: Location of G0 and G1
From the figure, we see that calls from G0 were spread across the country and were particularlydense in the majors cities / capital of Yemen. This shows that information about the drone strikespread nationally.
5.3 Social Networks of G0, G1 and G2
After G0 and G1 are found, I then scan through the calls during the drone strike to create thesocial network between these people. I find all edges between these sets and for each edge, I recordboth the number of calls, number of texts and the total call duration.
In addition, I also construct the social networks between these sets during baseline periods. Inorder to understand how much of an anomaly this event was, we must compare it to a similar dayand time. I create social networks for the 4 time periods from previous weeks with the same dayof the week and time of day. This comparison between the drone strike and the baselines allows
5

us to see if the network during this time period is more sparse/dense than usual and differences inother useful summary statistics.
We also wish to know more long term attributes about each person. Who are their most calledcontacts and how much/often do they call their friends. We can also find central people in theoverall network. I approximate the entire social network, by recording all calls in the entire countryfor the month before the drone strike.
5.4 Distribution of Calls sorted by Page Rank
One of our main research questions is to find out if people tend to call their friends/familymore during the drone strike or if they instead call the most important people (police, communityleaders, etc). We can compare this between the one month baseline and the drone strike. For thebaseline, I rank every person in the network by page rank score (on the x-axis) and plot their callvolume in the baseline with respect to this ordering. Using the same ordering as the baseline, Ithen plot the call volume of the drone strike. This will allow us to see if important people (highpage rank) get called more or less. I also use different centrality measures to measure importance,such as betweeness and degree (they yield similar results, so will not be shown).
5.5 Distribution of Calls sorted by Personal Importance
Another research question we want to answer is whether people change their call patterns duringthe drone strike. For every person in the network, I rank their neighbors with respect to their totalnumber of calls. I then average the number of calls for the ith ranked friend of everyone in thenetwork for i = 1 : 20. Using the same ordering of friends for each person, I then plot the averagethe number of calls for the ith ranked friend during the drone strike. If the distribution changesbetween these two plots, we know that people on average have changed their call pattern.
5.6 Information Cascades
Because we do not have any ground truth in our dataset, like the twitter dataset of Hui et.al, we do not know whether a call or text is transmitting the information about the drone strike.However, we can assume information is transmitted if someone from G0 directly calls someone fromG1 right after the drone strike. Similarly, we can reasonably assume that information is transmittedif G1 calls G2 right after G1 was called by G0. In order to maintain the certainty of our results, wewill only use these directed communications for our cascades.
In order to find whether information about the drone strike cascades, we wish to see after thedrone strike whether there is a clear peak of communications from G0 to G1 followed by a peakof communications from G1 to G2. To find these peaks, I plot, over time, the number of calls andtexts aggregated over 10 minutes blocks, for the 2 hours after the drone strike.
6 Results
Note: Although I have ran my code for multiple drone strike, I will only show results for adrone strike on 2012-04-16.
6

6.1 Network Results
For this drone strike I have found that G0 has 1027 people, G1 has 1098 people and G2 has 614people. There were 148 calls between people in G0, 83 calls between G1, and 21 calls between G2.There are also 973 calls from G0 to G1, and 880 calls from G1 to G2.
This makes sense because the drone strike was in a small rural town away from the major cities.The people are often very close in proximity, making calls between G0 unlikely. The communicationbetween G1 is also expected to be low because we expect G1 to be G0s immediate family and friends.Also, from Figure 5, we see that G1s are spread throughout the map, making communicationsunlikely.
We see that the size of G2 is much smaller than G0 and G1. This means that the cascade ofinformation is already slowing after a potential cascade chain of 2. These short chains are what weexpect from the results of Hui et. al. If we could reasonably find G3 with high certainty, we wouldexpect the calls from G2 to G3 to be significantly lower.
6.2 Analyzing Plots
Figure 6: Baseline Degree Histogram Figure 7: Drone Strike Degree Histrogram
Figure 6 and 7 show the degree histograms of the average of the 4 previous week baselines andthe drone strike. This graph shows that the connectivity of the graph during the drone strike isvery similar to the graph of the baseline.
Figure 8: Baseline Dist. of Calls sorted by Page Rank Figure 9: Dist. of Drone Strike calls sorted by P.R.
7

Figure 8 x-axis has every person in the baseline network sorted by page rank. The y-axis showsthe number of calls to each person. We see that generally the higher the page rank, the more callsthey have. Figure 9 uses the same x-axis ranking of people, but has the y-axis as the number ofcalls to each person during the drone strike. We see significant spikes of people with lower pagerank getting substantially higher number of calls. This suggests that people of lower importance /page rank get called more during the drone strike. I will look at specific cases of this to see whythis phenomenom occurs.
Figure 10: Baseline Dist. of Calls to Neighbors Figure 11: Dist. of Drone Strike calls to Neighbors
Figures 10 and 11 are the graphs described by section 5.4. We see that since these graphs arevery similar, for this particular drone strike, we can conclude that people do not change their callpattern very much. One way we can make this claim with more certainty, is to draw error bars of1 standard deviation for each bar in the plot. This will allow us to see how much variance is in ourdata.
6.3 Information Cascade
Figure 12: Cascade of calls after 2012-04-16 drone strike Figure 13: Cascade of calls after 2011-10-14 drone strike
Figure 12 and 13 show the cascade of information after each drone strike. The x axis showthe number of seconds after the initial drone strike (the beginning of the peak we found in section5.1). The y axis is the number of calls and texts in 10 minute aggregates. From the figures we seethat there is a cascading effect. The number of calls from G0 to G1 peaks first, then an increase
8

in calls from G1 to G2 follows. Since the anomaly detection algorithm only captures the period oftime with significant difference from baseline, the very beginning of the strike may not have beencaptured. Similarly, the last part of the cascade may have been more than 2 hours after the initialstrike, but is not captured in this graph. Thus, the initial build of the red curve and the endingdropoff of the blue curve is not captured.
These figures show that these cascading effects hold for multiple drone strikes and could be ageneral pattern in calls after crisis events.
7 Future Work
For my project, I have mostly finished all of the work regarding analysis for a single dronestrike. The next step in the project is to generalize the findings for all drone strikes in our dataset. We wish to see if other factors such as geographic location and time of day affect the socialnetwork of the drone strike. We can more formally quantify our results from 5.4 and 5.4 by tryingto summarize the difference between the baseline plot and the drone strike plot. We can do this bytreating each bar plot as a probability distribution. We can then use metric such as KL divergenceand Earth Mover’s Distance (Wasserstein metric) on these plots for every drone strike and see howthey compare.
9