Social Networking Data Analysis Tools & Challenges
38
Future Generation Computer Systems, 2016, ISSN: 0167-739X 1 Social Networking Data Analysis Tools & Challenges Androniki Sapountzi and Kostas E. Psannis University of Macedonia, Department of Applied Informatics, Thessaloniki, Greece [email protected] Abstract Online Social Network’s (OSN) considered a spark that burst the Big Data era. The unfolding of every event, breaking new or trend flows in real time inside OSN triggering a surge of opinionated networked content. An unprecedented scale of social relationships also diffuses across this vastly interconnected system affecting public behaviors and knowledge construction. Extracting intelligence from such data has becoming a quickly widening multidisciplinary area that demands the synergy of scientific tools and expertise. Key analysis practices include social network analysis, sentiment analysis, trend analysis and collaborative recommendation. Though, both their recent advent and the fact that science is still in the frontiers of processing human-generated data, provokes the need for an update and comprehensible taxonomy of the related research. In response to this chaotic emerging science of social data, this paper provides a sophisticated classification of state-of the-art frameworks considering the diversity of practices, methods and techniques. To the best of our knowledge, this is the first attempt that illustrated the entire spectrum of social data networking analysis and their associated frameworks. The survey demonstrates challenges and future directions with a focus on text mining and the promising avenue of computational intelligence. Keywords: Sentiment analysis, Topic detection, Social Network Analysis, Collaborative Recommendation Computational Intelligence, Online Social Networks 1. Introduction 1.1 Applications of Social Networks Our networked world, with the ubiquitous data creation, reveals that network concepts are widely found throughout a range of disciplines. Online Social Network (OSN) is a contemporary type of network whose history is relatively short but turbulent. The advent of mass adoption of online social networking sites (SNS) has caused a shift on how people communicate and share knowledge, how businesses operate and compete and how politicians contest and influence. In the research area, OSN analysis has almost replaced any conventional social science tool (surveys, interviews, questionnaires) announcing thus, the computational social science. In the businesses field, social network analysis is applied to gain insight into markets and communities [1], with the “social enterprise” being the new necessity in order to manage knowledge, improvement, change, cooperation and risk. For understanding connections like how people are connected together by the machines and how, as a whole, they create a financial market, a government, a company and other social structures Alex Pentland and Asu Ozdaglar [2] have recently created the MIT Center for Connection Science and Engineering. To illustrate the impact of the way that social big data has transformed our daily lives, look no further than how the movie rental experience has changed which is now a service that utilizes a vast array of data points to generate recommendations [3]. The impressive growth of SNS can be considered as a spark that burst the Big Data era. It makes available an unprecedented scale of personal data, data about events and social relationships, public sentiments and behaviors that when are mined and interpreted are of an enormous value. New kinds of
Transcript of Social Networking Data Analysis Tools & Challenges

Future Generation Computer Systems, 2016, ISSN: 0167-739X
1
Social Networking Data Analysis Tools & Challenges
Androniki Sapountzi and Kostas E. Psannis
University of Macedonia, Department of Applied Informatics, Thessaloniki, Greece
Abstract
Online Social Network’s (OSN) considered a spark that burst the Big Data era. The unfolding of
every event, breaking new or trend flows in real time inside OSN triggering a surge of opinionated
networked content. An unprecedented scale of social relationships also diffuses across this vastly
interconnected system affecting public behaviors and knowledge construction. Extracting intelligence
from such data has becoming a quickly widening multidisciplinary area that demands the synergy of
scientific tools and expertise. Key analysis practices include social network analysis, sentiment
analysis, trend analysis and collaborative recommendation. Though, both their recent advent and the
fact that science is still in the frontiers of processing human-generated data, provokes the need for an
update and comprehensible taxonomy of the related research. In response to this chaotic emerging
science of social data, this paper provides a sophisticated classification of state-of the-art frameworks
considering the diversity of practices, methods and techniques. To the best of our knowledge, this is
the first attempt that illustrated the entire spectrum of social data networking analysis and their
associated frameworks. The survey demonstrates challenges and future directions with a focus on text
mining and the promising avenue of computational intelligence.
Keywords: Sentiment analysis, Topic detection,
Social Network Analysis,
Collaborative Recommendation Computational Intelligence,
Online Social Networks
1. Introduction
1.1 Applications of Social Networks
Our networked world, with the ubiquitous data creation, reveals that network concepts are widely
found throughout a range of disciplines. Online Social Network (OSN) is a contemporary type of
network whose history is relatively short but turbulent. The advent of mass adoption of online social
networking sites (SNS) has caused a shift on how people communicate and share knowledge, how
businesses operate and compete and how politicians contest and influence. In the research area, OSN
analysis has almost replaced any conventional social science tool (surveys, interviews, questionnaires)
announcing thus, the computational social science. In the businesses field, social network analysis is
applied to gain insight into markets and communities [1], with the “social enterprise” being the new
necessity in order to manage knowledge, improvement, change, cooperation and risk. For
understanding connections like how people are connected together by the machines and how, as a
whole, they create a financial market, a government, a company and other social structures Alex
Pentland and Asu Ozdaglar [2] have recently created the MIT Center for Connection Science and
Engineering. To illustrate the impact of the way that social big data has transformed our daily lives,
look no further than how the movie rental experience has changed which is now a service that utilizes
a vast array of data points to generate recommendations [3].
The impressive growth of SNS can be considered as a spark that burst the Big Data era. It makes
available an unprecedented scale of personal data, data about events and social relationships, public
sentiments and behaviors that when are mined and interpreted are of an enormous value. New kinds of

Future Generation Computer Systems, 2016, ISSN: 0167-739X
2
application are arisen with the wise use of OSN data, hence introducing a new wave of productive
growth. OSN is a rich source of opinionated text and multimedia content that has recently gained huge
popularity, especially in the area of monitoring political or marketing campaigns. The diffusion of
breaking news, especially in Twitter, is considered to be disseminating much faster than in any
conventional news media. Therefore, early event detection and social network analysis play a
detrimental role in the management of natural disasters, epidemics and terrorism breakouts. Social
network information also has lately incorporated in recommendation systems. The latter are capable
of dealing with the problems of information overload and information filtering.
The term Social Network is used to describe web-based services that allow individuals to create a
public/semi-public profile within a domain such that they can communicatively connect with other
users within the network. In network theory, a social network is commonly modelled by a graph
which consists of users or groups called nodes connected by patterns of contacts or interactions called
edges or links. The unique element of social networked data is that they bring new opportunities to
understand individuals and society, provided the acceptance and trust, individuals have shown
towards them. Figure 1 highlights the statistics of Internet users among online communities[4].
However, social network data are voluminous, even from a single social network site, mostly
unstructured and their dynamic nature is evolving at an extremely fast pace that hinder the data
analysis and extraction of knowledge. Having shifted away from the analysis of single small graphs
and the properties of individual nodes to consideration of large-scale properties of graphs, the need for
new data analysis tools and techniques is inevitable. Although many scientific endeavors have been
done and made progress toward specific social network analytics subtasks, deriving knowledge from
social network-sourced data remains a great challenge, principally owing to two reasons.
Firstly, the social nature of nodes in social networks makes data subjective to many privacy
concerns. A distinct example is that users’ sensitive information may be used by the OSN admin and
by commercial companies to know the users preferences and to identify the audience for their
advertisement results in violation of users’ privacy and security [4] [6]. Actually, the biggest
challenge of Big Data is indeed privacy [2][5][6][7] and many researches about the trusted flow of
personal data are considered; and as social networks contain personal data and are greatly embedded
into the daily living, many researches about the privacy preserving in OSN [8], [9][4][10][11] are
conducted. An original endeavor in privacy preserving is an up-to-date and creative recommender
system tool [11] that developed in order to help users to protect their data in OSNs.
Secondly, science is still far from automatically analyzing unstructured human communication
data because machines are not yet able to understand human language; and therefore social big data
science is still developing. Additionally, the garbage input garbage output adage of yore is alive and
well. Due to the the informal language data exchange over OSN and the medium’s noisy nature,
conventional technologies of preprocessing are inadequate. To this extent, deficit to say that, when the
Figure 1: Popularity of OSN among online users

Future Generation Computer Systems, 2016, ISSN: 0167-739X
3
data source is social networks all challenges related to Big data become even more salient and
ensuring quality of the data including privacy preserving are still open research issues.
In response to this chaotic emerging science of social data and predictive knowledge, this research
is guided towards the second challenge and analyzes the social network data phenomenon from a
technical perspective. In particular, we surveyed up-to-date data analysis frameworks of the field,
considering the different kinds of analysis, the diversity of methods and the functionalities offered by
these. The rest of the paper is structured as follows. In Section 2, we discuss about the features of
data in OSNs and briefly introduce the categories of data analysis methods and approaches. The
survey’s motivations and research goals are also given here. Section 3 provides an overview of social
network analysis tools and a correlation between tools’ inherent metrics and graph-analysis methods.
Section 4 presents the various topic detection and tracking approaches, techniques and the
corresponding tools. Sentiment analysis and collaborative recommendation frameworks, including
their related algorithms and techniques, are investigated in Section 5 and 6, respectively. In section 7
we present analysis issues and the potential of Computing Intelligence paradigm. The conclusion and
the future directions are tackled in Section 8.
2. Data Analytics Methods in OSN
Given a very large data set, a major challenge is to figure out what data one has and how to
analyze it [12]. Social networks typically contain a tremendous amount of content and linkage data
which can be leveraged for analysis. These types can be further divided into unstructured and
structured data respectively, depending on whether they are organized in a pre-defined manner
(structured data) or not (unstructured data). To illustrate this with an example, time-based events are
structured, whereas event data based on tweets and “likes” are unstructured. Structured data in OSN
are usually graph-structured. In the most basic framework, they are modelled with a social network
which is represented as a graph G = (V, E) where V is a set of nodes or entities (e.g., people,
organizations, and products) and E is a set of edges or relationships that connects the nodes through
patterns of interactions. This kind of data is measured via social network analysis, an application of
graph analytics that focuses on extracting intelligence from such interconnected data. On the other
hand, unstructured data are the content data shared in OSN, also known as User Generated Content
(UGC). They are considered the lifeblood of SNS and include text, images, videos, tweets, product
reviews and other multimedia data that are typically studied with content-based analysis [13], [14]
whose techniques involve among others algorithms for structuring data. Figure 2 summarizes the
types of data and the corresponding analysis approaches and methods conducted in OSN.
Social network analytics and content mining approaches follow the interdisciplinary principles of
Artificial Intelligence (AI), Statistics and related areas. Decades before the advent of OSN AI
researches attempted to embed the controversial notion of ‘intelligence’ in machines so as to
comprehend, reason and learn about how the world works and hence acquire further capabilities from
mere logical computations [15][16]. OSN can be used as an environment of endowing machines with
the capacity of this common-sense knowledge. The last few years have seen rapid progress on long-
standing, difficult problems in AI and it is now rapidly reinventing so many of the Internet’s most
popular services [17]–[20]. Statistics on the other hand involve less intricate procedures that
emphasize to statistical models towards the better understanding of data generating process.
Content-based analysis in OSN is studied through big data analytics, and its focus is on extracting
intelligence from the content created and shared in the network. Audio or speech analysis follow the
Large-Vocabulary Continuous Speech Recognition or the phonetic-based approach to extract
information from unstructured audio data [14]; video content analysis involves a variety of techniques
to monitor, analyze, and extract meaningful information from video streams [14]; image analysis
methods varies from simple to sophisticated depending on the analysis task while methods for face
recognition [21] and for sentiment extraction [22] in social media data are attacking great attention.

Future Generation Computer Systems, 2016, ISSN: 0167-739X
4
Text mining extracts patterns from textual data via means of information retrieval, text
summarization and Natural Language Processing (NLP). It is often incorporated with the other
techniques. Image analysis and text mining have recognized huge applications in OSN since users
often post images either alone or in addition to text in their messages. Also video content analysis is
incorporated with text mining. For instance, it can deploy a bag-of-words representation of the video
transcripts to extract some hidden patterns. In general, analysis practices such as event detection [23],
[24] and sentiment analysis [22], [25] are commonly employed in video and image analysis . Provided
that most of the frameworks are oriented towards the textual content, we mostly focus on text mining
techniques, which are presented in section 2.2. Though, a few frameworks that extract information
from video, audio and image are also analyzed.
Content mining and SNA are not mutually exclusive approaches, far from it, should co-exist in an
analysis. Content information in different parts of the network is often closely related to its structure
[13] and therefore combining both two sources of information is being considered to perform better in
an analysis. For instance, sentiment analysis can use both linkage data and text. Previous sentiment
analysis methodologies often assumed that texts are independent; but in the context of Social
Networks, data are networked and this feature shouldn’t be overlooked [26][27]. In addition to that,
social relationships among users are recently considered as equally valuable information in
recommender systems as content patterns that are shared among users. The unique element of social
networked data is after all, that they reveal information about interactions between users-
communities-content.
Public Application Provider Interfaces (APIs) are the standard mean of retrieving social
networking data from cloud, and they are typically designed to encourage the development of third-
party software—for example, a plugin for WordPress. One alternative is to use commercial tools for
scrapping that collect data by protecting its raw form and have some extra filtering functionality.
Kaushik et.al [28] used Sysomos, a social monitoring tool, to detect specific events. Sysomos is also
one of the tools used at the BBC for monitoring social media and website activities [29]. Another
alternative is to use the combination of API and a crawler as researchers in [30] did. A crawler is built
to extract information that are not automated to be extracted with service API. Importantly, though,
each social platform has very specific rules around on how to use their respective data that can be
found in their Terms of Service. Although, most of SNS expose an API, which includes methods to
get a range of data including friends, events, groups, they limit the number of API transaction per day.
Noted that, the variety of data collected for analysis can be distinguished in explicit data, namely
information directly related to service usage (e.g. profile details, number of friends, etc.), and implicit
data, i.e., that are either information that is processed automatically in the system (e.g. browser data,
web sites visited, etc.) or can be discovered from user’s activities by analyzing extensive and repeated
interactions between users (voting, sharing, tagging, commenting items) [31], [32]. There is analysis
that employs implicit data [32], explicit [33] or both [26].
It is clear that analytics is a complex process that demands people with expertise in cleaning up
Figure 2: Data Types and Analysis

Future Generation Computer Systems, 2016, ISSN: 0167-739X
5
data, understanding and selecting proper methods and techniques and interpreting the analysis results.
Tools are fundamental to help people perform these tasks. However, the knowledge discovery process
has become even more tangled with the arrival of the big data era; where new tools are constantly
emerging to replace the conventional non effective ones and a hybrid of techniques [12] is now a
requirement to get value of the data. Regarding the area of social networking, there is much confusion
among data scientists due to the lack of (i) a clear definition-categorization of the plethora of
techniques and tools, (ii) a standardization of processes and (iii) analysis frameworks that preserve
data quality. Contributing to the above knowledge gap is the goal research of this survey. A big data
analytics approach into social networks through the perspective of tools, methods and techniques is
given. In particular, all frameworks are divided in terms of the most common analysis practices in
OSN, namely social network analysis, topic detection, sentiment analysis and collaborative
recommendation [14], [34], [35]. These practices are often approached through both big data analytics
such as text and multimedia mining and social network analytics such as link prediction, influence
analysis and community detection. This survey is significant for many reasons. First, it provides
sophisticated categorization of a large number of recent articles according to the data analysis
practices, tools and frameworks towards social networking data. This angle could benefit researchers
in the field to choose a specific analysis practice and study its variety of tools and techniques that can
be used for an analysis purpose. We also divide the techniques involved in each analysis framework
and their corresponding limitations if any; therefore, practitioners working in commercial applications
as well as researchers who are familiar with certain methods will be able to select, utilize and enhance
a number of techniques that most suit a certain application. This survey can be useful also for new
comer researchers to develop a panoramic view on the entire field of social networking data analysis
as it covers data analysis approaches, methods, techniques, algorithms, tools and practices.
2.1 Social Network Analysis
SNA [14], [36] is a term that encompasses descriptive and structure-based analysis, similar to
structural analysis [37]. It is important if one wants to understand the structure of the network so as to
gain insights about how the network “works” and make decisions upon it by either examining
node/link characteristics (e.g. centrality) or by looking metrics at the whole network cohesion (e.g.
density) [1], [37]. Comparing networks, tracking changes in a network over time, revealing
communities and important nodes, and determining the relative position of individuals and clusters
within a network are some of its common procedures [1]. These involve either a static or dynamic
analysis. The former presumes that a social network changes gradually over time and analysis on the
entire network can be done in batch mode. Conversely, dynamic analysis, which is more intricate,
encompasses streaming data that are evolving in time at high rate. Dynamic analysis is often in the
area of interactions between entities whereas static analysis deals with properties like connectivity,
density, degree, diameter and geodesic distance.
2.1.1. Influence Analysis
In the graph community, centrality metrics deal with the nodes’ positions in the network and are
typically used for measuring the dominance of nodes, quantifying the strength of connections and
uncovering the patterns of influence diffusion. In OSN a critical research topic is to identify
‘experienced’ or ‘trusted’ users that may be trendsetters since their opinionated posts are the ones that
can rapidly spread far and wide in the network enabling them to influence other users. An interesting
fact regarding trendsetting, is that, how much credence another person gives to a post may depend on
how many times they hear it from different sources (Flow) and not how soon they hear it (Geodesic
Distance) [38]. Identification of influential users and of whether individuals would still propagate
information in the absence of social signals about that information are two elements required to be
studied in order to study information flow in OSNs [39].
In the context of microblogs, several indicators have been discussed to measure the influence and
credibility of a user: mention influence, follow influence, and retweet influence are some distinct
examples. In opinion mining framework [40], [41] the degree centrality was one of the factors to
determine influential users in Twitter microblogging service, as shown in Figure 3. Moreover,

Future Generation Computer Systems, 2016, ISSN: 0167-739X
6
influence analysis has been considered in recommender systems since friends have a tendency to
select the same items and give similar ratings [33]. However, noted that, different definitions have
been given to what an influential user is [42].
Researchers in [43], while investigating trustiness in OSN, explained simply the centrality
measures. Closeness centrality CCu measure requires to consider the distance between two vertices u
and v, defined as the length SP (u, v) of the shortest path (geodesic distance) connecting them. It is
defined as the reciprocal of sum of all distances from v to all other vertices in the network:
Given any three distinct vertices v, u and w, let σuw be the number of shortest paths from u to w
and let σuw(v) be the number of the shortest paths from u to w passing through v. The Betweenness
Centrality BCv of v is defined as follows:
Other centrality indices are based on the computation of the eigenvectors (and eigenvalues) of the
matrix representation of G. The first case is the Eigenvector Centrality EC, which is defined by means
of the adjacency matrix A for G. Let x be a |V|-dimensional column vector that satisfies the following
equation:
2.1.2 Link Analysis
Link-analysis is used to evaluate connections between nodes. Understanding the formation and
evolution of such connections in social networks requires longitudinal data on both social interactions
and shared affiliations [44]. Link mining is usually associated with text mining and can be used for
classification, prediction, clustering or association-rules discovery. It is applicable in collaborative
recommendation systems to identify a group of friends with similar interests. PageRank, which
employs heuristic rules, is the famous link-analysis algorithm used by Google to order search engine
results. However, recently Google [17] has announced the replacement of PageRank with a more
efficient search algorithm called BrainRank which is based on Deep Learning Networks. PageRank
and HITS algorithms are also used in influence analysis. Both of the two were used in a sentiment-
analysis framework by [41] to evaluate the credibility of an opinion-expresser on Twitter. In [45]
HITS was used to rank the most experienced users in venue recommendation and in [42] PageRank
was employed to detect trendsetters users. Chen et.al [32] have evaluated the performance of
PageRank in personalized recommendations whose performance was substandard.
Figure 3: Simulation of an influencer node in
Twitter’s network directed graph

Future Generation Computer Systems, 2016, ISSN: 0167-739X
7
Path analytics usually approach optimization problems like finding the best possible path
(dependencies) between nodes (variables) in a network (set of variables). They are widely applied in
business intelligence as part of behavioral analytics. To illustrate this with an example, Google
Analytics uses path analysis functions to determine how many visitors reach a certain destination page.
Graphical models are powerful tools that can be used to model and estimate complex statistical
dependencies among variables. An example is the Bayesian network used in [46] to explore events
shared in the social network of Twitter.
Geodesic distance and path analysis is used to identify all the connections between a pair of
entities, useful in understanding risks and exposure of a network. Geodesic distance has been found to
be one of the most significant feature in link prediction [47]. Power law, a statistical metric like the
80-20 rule, is useful in checking whether a network follows a scale-free distribution of connections to
nodes which is utilized for defining popularity [48]. In a scale free network there are a very few nodes,
called 'hubs', which have connections that are much bigger than the average degree; while the network
grows, these nodes will continue to get a larger share of new connections. Twitter and Facebook are
distinct examples of such network structures [41].
Connected components is another interesting statistical metric. They allow for the study of
information dissemination in a social network. A connected component in a graph is referred to as a
set of nodes and edges where a path exists between any two nodes in the set (Aggarwal (2011)).
2.1.3. Community Detection
Communities constitute an important aspect of networks and they are important for both exploring
a network and predicting connections that are not yet observed [49]. Community detection is
essentially a data clustering problem, where the goal is to assign each node to a community or cluster
in some reasonable manner. The analysis can be categorized in terms of the time dimension in the
following:
static analysis: ‘what are the communities at time T?’,
temporal analysis: ‘how did this community form?’,
or predictive analysis: ‘how a community will grow?’.
One way to define a community is by structure, e.g. communities as cliques. Clique or complete
graph is a graph where every node is connected to every other node in the clique. Another pattern in
relationships is to discover the degree to which an actor exists in a tightly bound group or if they have
connections outside their own group. To explore such a notion of network clustering, dyad and triad
census have been utilized [50].A dyad is a sub graph that represents a pair of actors and the possible
edges between them whereas a triad consists of three nodes and the possible edges among them.
Wu et.al [51] have found as the most important measures for detecting communities to be Degree,
Betweenness centrality and Clustering coefficient. The latter assesses the tendency of vertices in a
graph to form close-knit groups [43] and it is defined as the ratio of the number of closed triplets in G
graph to the total number of triplets of G. To illustrate this, any three vertices u, v and w form a
triangle when (u, v), (v, w) and (w, u) are in E set of edges; when there are at least two edges among
the vertices, they form a closed triplet.
Lead-follower algorithm [52] is a community detection algorithm based upon identifying the
natural internal structure of the expected communities. It is used in [53] for clustering tweets with the
same content. Community detection has also been used to infer information about users from OSN
given a set of “seed” users [54].
2.2 Big Data Analytics & Text Mining
Content analysis studies unstructured content generated in OSNs by users. Recent developments in
technology such as cloud computing and big data analytics advocate the mining of insights. Social
media sites have a large number of users scattered across the globe which makes them ideal
candidates for cloud adaptation. Big data analytics are being applied in social networks to extract
meaningful insights through text mining and multimedia mining [14], [55]. An open issue in big data
analytics according to a recent survey [56] is the usage of soft computing algorithms since, although

Future Generation Computer Systems, 2016, ISSN: 0167-739X
8
they can analyze such complex nature of data, unfortunately, until now, not many studies are focused
on it. Soft computing is the basis of Computational Intelligence (CI) which in contrary to AI-based
systems, does not require the construction of precise models to deal with the imprecise, incomplete,
and uncertain information [15].
Generally, commonly used approaches in textual content analysis can be divided into linguistic,
semantic, statistical and hybrid, namely a combination of them. Syntax analysis is a linguistic
approach with Part of Speech (POS) to be the most widely used technique; cosine similarity metrics
belong to statistical approaches with Term Frequency-Inverse Document Frequency (TF-IDF) to be
the most favored technique; and the incorporation of the meaning of words indicate semantic
approaches that are mostly conducted through knowledge bases.
The most basic unit of linguistic structure appears to be the word; and fundamental to content
analysis operations ranging from training a machine learning model, scoring documents on a query,
content classification and clustering [57], [58], is the representation of a set of documents as vectors
of words, known as the vector space model. Language models are typically used to rank sentences and
to compute relevance based on content information. They are trained through a set of string features
such as phonemes, letters, or words. Language modelling is a function that puts a probability measure
over strings drawn from some vocabulary [57]. That is, for a language model M over an alphabet Σ:
N-gram language model is a contiguous sequence from a sequence of n strings of text or speech
and when it is of size 1 it is referred to as a "unigram", size 2 is a “bigram”, and so on, as depicted in
Table 1. The strings can be phonemes, syllables, letters, words or base pairs according to the
application. N-gram model (Bag of N grams), also known as Bag of Words (BoW), is associated with
the statistical measure of the TF-IDF.
However, according to Cambria and White [59], NLP systems will gradually stop relying too
much on word-based techniques such as BoW while starting to exploit semantics more consistently in
order to overcome problems such as word-sense disambiguation.
Semantic technologies have been widely used in many content-based analysis methods. To
incorporate semantic relationships among terms in a vector space model or to retrieve only the
relevant information, dictionaries with synonymous such as WordNet [60] have been found useful.
WordNet is the most common dictionary and covers semantic and lexical relations between terms and
their meaning such as synonymy, hyponymy and polysemy. In [40] researchers used it to find
synonyms to expand their manually built subjective set of words in order to analyze sentiments of
microblog posts. TwiCal recognizes events with the support of dictionaries of event terms gathered
from WordNet. Kontopoulos et.al. [61] used WordNet to augment the underlying semantics of the
taxonomy of concepts and attributes with synonyms and hyponyms. Also WordNet can be applied to
aggregation functions based on hierarchical models where the lower level (e.g. GPS coordinates)
features could be aggregated to the higher level (e.g. cities). Additionally, WordNet has been used in a
searchable encryption scheme to support personalized search through user interest models [62].
Syntax analysis extracts tokens and involves advanced analysis of sentences, terms and term order.
Table1: N-gram model explained through language units
Unit Sample Sequence Unigram BoW Bigram BoW
Word …As knowledge increases wonder…
…As, knowledge, increases, wonder,…
…As knowledge, increases wonder,…
Character …to_be_or_not_to_be… …, t, o, _, b, e, _, o, r, _, n, o, t, _, t, o, _, b, e, …
…, to, o_, _b, be, e_, _o, or, r_, _n, no, ot, t_, _t, to, o_, _b, be, …
Future Generation Computer Systems, 2016, ISSN: 0167-739X
9
It identifies POS and Named Entity Recognition (NER) to create dependency parse trees for each
sentence. POS and NER methods use sentence structure and language features learned from a large
corpus of annotated text. The goal of POS, tagging data with metadata and other preprocessing
techniques is to give unstructured data a structure, to create patterns and/or reduce ambiguity for
subsequent language analysis. Another linguistic NLP approach is to perform similarity measurement
between clustered noun phrases using a graph representation of named entities of the document sets
which are connected by dependency relations.
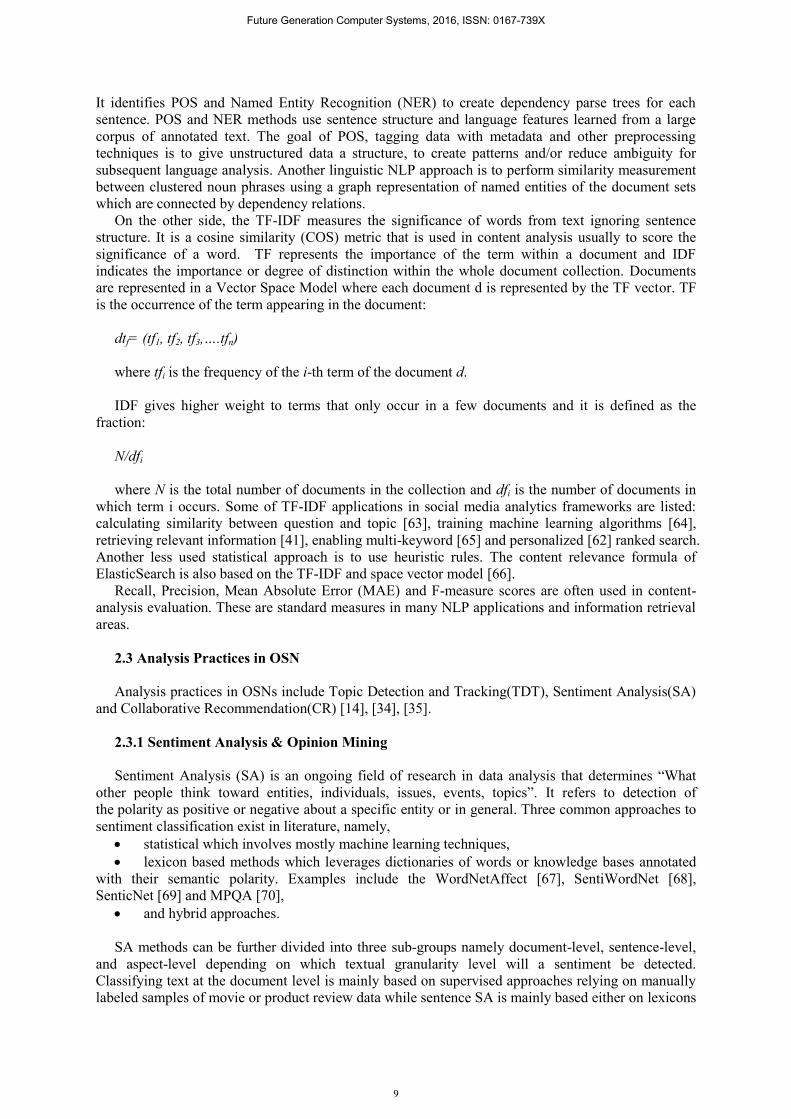
On the other side, the TF-IDF measures the significance of words from text ignoring sentence
structure. It is a cosine similarity (COS) metric that is used in content analysis usually to score the
significance of a word. TF represents the importance of the term within a document and IDF
indicates the importance or degree of distinction within the whole document collection. Documents
are represented in a Vector Space Model where each document d is represented by the TF vector. TF
is the occurrence of the term appearing in the document:
dtf= (tf1, tf2, tf3,….tfn)
where tfi is the frequency of the i-th term of the document d.
IDF gives higher weight to terms that only occur in a few documents and it is defined as the
fraction:
N/dfi
where N is the total number of documents in the collection and dfi is the number of documents in
which term i occurs. Some of TF-IDF applications in social media analytics frameworks are listed:
calculating similarity between question and topic [63], training machine learning algorithms [64],
retrieving relevant information [41], enabling multi-keyword [65] and personalized [62] ranked search.
Another less used statistical approach is to use heuristic rules. The content relevance formula of
ElasticSearch is also based on the TF-IDF and space vector model [66].
Recall, Precision, Mean Absolute Error (MAE) and F-measure scores are often used in content-
analysis evaluation. These are standard measures in many NLP applications and information retrieval
areas.
2.3 Analysis Practices in OSN
Analysis practices in OSNs include Topic Detection and Tracking(TDT), Sentiment Analysis(SA)
and Collaborative Recommendation(CR) [14], [34], [35].
2.3.1 Sentiment Analysis & Opinion Mining
Sentiment Analysis (SA) is an ongoing field of research in data analysis that determines “What
other people think toward entities, individuals, issues, events, topics”. It refers to detection of
the polarity as positive or negative about a specific entity or in general. Three common approaches to
sentiment classification exist in literature, namely,
statistical which involves mostly machine learning techniques,
lexicon based methods which leverages dictionaries of words or knowledge bases annotated
with their semantic polarity. Examples include the WordNetAffect [67], SentiWordNet [68],
SenticNet [69] and MPQA [70],
and hybrid approaches.
SA methods can be further divided into three sub-groups namely document-level, sentence-level,
and aspect-level depending on which textual granularity level will a sentiment be detected.
Classifying text at the document level is mainly based on supervised approaches relying on manually
labeled samples of movie or product review data while sentence SA is mainly based either on lexicons

Future Generation Computer Systems, 2016, ISSN: 0167-739X
10
by matching the presence of opinion-bearing lexical items (single words or n-grams) so as to detect
subjective sentences, or on association rule mining for a feature-based analysis of an entity. Both of
the two do not provide the necessary detailed opinions which are needed on all the aspects of the
entity. Therefore we need to go to the aspect level which classifies the sentiment with respect to the
specific aspects of entities by firstly identifying the entities via means of syntax analysis and then
their aspect [72]. Again, it is mostly based on supervised machine learning techniques to model the
language [73].
2.3.2 Trend Analysis & Topic Detection Tracking
Topic Detection Tracking (TDT) requires the automatic answering of “What, when, where and by
whom are the popular topics/events/trends set”. Until now, no method addressed all of these questions
[64] efficiently; and it is usually employed for detection of emergent or suspicious behavior in the
network and for a better understanding of societal concerns [53].
Detecting events relies mostly on machine learning techniques [54]. When unspecified events,
which may be trends, is the case, unsupervised learning is preferred; whereas detecting specific events
relies mostly on supervised learning. The two main approaches for event detection are classified into
the following, depending on whether they rely on temporal or document features [64], [74].
Feature-Pivot,
Document-Pivot,
and hybrid approaches.
The former determines trends as those that were previously unseen or growing rapidly and usually
focus on burst detection. Twitter presents local trends through term frequency, without providing any
additional context for the trending keywords [53]. Document-Pivot is based on textual similarity
functions between documents and streams with the support of lexical resources. Both of the two have
their limitations. The temporal distributions of features are very noisy and neither all bursts are
relevant events of interest [74] nor all documents are related to events (e.g. memes). Moreover
document-pivot approaches require often batch processing that is not scalable to large amounts of data
[64].
A new alternative unsupervised learning technique is to model normal user behavior and detect
any deviation from this baseline profile. It is similar to the anomaly detection method and has been
shown effective in detecting local festival events and fake reviews. Change detection is a common
element of TDT and trending topic detection; and indicators of events considered to be the deviation
in sentiments, messages’ content and the networks’ structure (e.g. an increasing number of new
connections in the social graph) [64].
Trend detection is a highly related task to event detection and is commonly applied to social
networks via the Feature Pivot technique and unsupervised machine learning [64]. A useful trend
analysis tool that has been used in different disciplines [75], [76] is Google Trends. However popular
GoogleTrends is, recently it was found that news topics emerged earlier in Twitter than in Google
Trends [77]. It is clear that Twitter has become the common place for TDT because it is considered an
information network besides a social one [78]. Trending topic detection can be conducted via content
analysis such as TF-IDF upon messages, network analysis such as influence of nodes and tracking
memes evolution [27]. The latter focuses on topics’ evolution in new subtopics or derivatives over
time, observing the spreading of news in an OSN. Information diffusion is a problem that shares many
similarities with event and trend detection. It examines the impact of the network structure relating on
which users are influential or why some content becomes viral [64]. A system that finds trendsetters
in information networks according to a specific topic of interest is proposed in [42] via combining
PageRank and temporal factors. TwitterMonitor [79], Cloud4Trends [53] Sociopedia [28] are systems
that perform trending topic detection via analyzing the frequency of words and word co-occurrences
in time fragments.
2.3.3 Collaborative Recommendation
Recently, social network data corporate as additional input for further improvement of

Future Generation Computer Systems, 2016, ISSN: 0167-739X
11
recommender systems’ accurate output. OSNs permit new forms of rating items, new forms of
trustiness and provide user information both at individual and social level. To illustrate this with an
example, user generated tags and social relations recently employed by [80] to augment collaborative
recommender systems and there are many other similar examples in literature. However, collecting
user interaction data to enhance recommendation accuracy is susceptible to many privacy issues [74].
Existing recommender schemes can be divided into three categories based on the approaches they
are built, namely:
content-based,
topology-based or collaborative filtering (CF),
and hybrid approaches that employ both content and topology methods.
The former exploits properties of an item or tracks content similarity on user past preferences to
predict a user’s interest towards the item; while the second leverages social relations such as user
influence and number of common friends and calculates similarities between user profiles to identify
users that have relevant interests [32][81]. Collaborative recommendation refers to CF approach that
determines “What is recommended for a user in relation to the network they belong” by mainly using
the feedback from each individual user.
CF has emerged as the most prominent approach and it is further classified into memory-based
(user-based) and model-based (item-based) methods. The main idea is that model-based approaches
use user-item ratings to learn a predictive model, in contrast, memory-based approaches use user-item
ratings stored in the system to directly predict ratings for new items [82]. Two of the most popular
similarity measurements in selecting potential neighbors that are the appropriate to form a
neighborhood with similar interests are the Pearson Correlation Coefficient (PCC) and COS. Though,
computing PCC or COS for each pair of users can be extremely time-consuming. Item-based method
first explores the relationships among items avoiding the bottleneck of having to search among a large
user population of potential neighbors [83]. Google recently made use of Machine Learning models to
provide an API in order to easily build recommendation systems that are item-based, user-based or
basket analysis-based (items frequently bought together).
Current recommender systems face a lot of issues except for scalability such as data scarcity and
the cold star problem that become even more noticeable in the context of OSN. Data scarcity is about
the user/item rating matrix being very sparse due to the limited number of users’ preferences. On the
other side, the cold star problem pertains to the initial membership of a user where no data about their
interests are available. The content relevance calculation is usually inaccurate due to the short text
posts and the relevance of a user is usually not provided in OSN by explicit features such as user-to-
user scores [32]. Another restriction of recommender systems, especially in those related to user-
based method, is that they are susceptible to privacy attacks and the violation of sensitive information
of users. Privacy-preserving collaborative filtering (PPCF) in social recommender systems is an
interesting direction for future work since not only privacy is an essential aspect of social networks
but also conventional PPCF techniques of computation-intensive cryptography or data perturbation
techniques are not appropriate in real online services. Zhu et al [8] proposed an algorithm for neighbor
based PPCF to protect neighbors and individuals’ ratings while Li et.al [9] presented an algorithm for
item based PPCF to protect individual privacy during recommendation.
3. Social Network Analysis Tools
Graph theory is the core prominent approach in social network analysis and graph mining tools are
important in investigating social structures both analytically and visually. Graph databases such as
Neo4j, graphical models such as deep learning and graph mining tools such as Networkit are being
developed in order to efficiently handle the need of knowledge extraction from networked data. Two
great limitations regarding SNA and data volume are (i) the restricted number of extracted data from
social networks because of the limited APIs transactions and (ii) the difficulty to process the data,
which are beyond a certain network size, with graph metrics and data visualizations [84].
Mining the content of OSN in conjunction with the network can be useful in efficiently answering

Future Generation Computer Systems, 2016, ISSN: 0167-739X
12
sub questions of an analysis such as “Do friends post similar content on Facebook?” or “Can we
understand a user’s interests by looking at those of their friends?”. Graph based mining tools are
required in order to easily model the structure of the social networks and perform the above tasks.
There is a great variety of software tools that analyze properties of nodes and edges in a network.
Some of the tools were originally developed for network visualization, and now contain analysis
procedures and other were specifically developed to integrate network analysis and visualization.
Though, a tight integration of social network statistics and visualization is necessary for effective
exploration of social networks [13]. Each tool has certain strengths and limitations thus opting the
appropriate one for a particular task is still a challenge. A comparative study of social network
analysis tools has already been done earlier [85]–[88] but not in a data-centric approach. We also
describe the tools in terms of platform, execution time and algorithms complexity, though what
differentiates the current research is that we didn’t focus on the visualization part and therefore
parameters such as graph types and visualization layouts are not included in the study. Instead, we add
comparative results in terms of data analysis features because it is an original thought to correlate
prevalent analysis method types used in OSN with algorithms supported by these tools. Moreover, the
categorization of metrics in the tables isn’t intended for the domain experts of graph analytics
community but mainly for data scientists that desire to utilize graph analytics in analyzing social
networked content and answering questions like the ones stated at the beginning of the paragraph. We
have also taken into account recent advancements of the tools, as shown in Tables 2 and 3. Both
commercial and freely available packages are considered; business or academic oriented tools are
examined, as well. Software applications with GUI packages (e.g. Pajek) are easier to learn, while
packages built for scripting/programming languages (e.g. Networkit) are more intricate, powerful and
extensible.
NodeXL [89] is a free, open-source template for Microsoft Excel that simplifies basic network
analysis and visualization tasks and supports analysis of social media networks for noncoding users.
It is similar to Pajek and Gephi with the difference that it can directly harvest data from social
networks [88]. Though, Gephi is more flexible in terms of visualization. However, network metrics
computation in NodeXL can be slow, so research efforts on improved algorithms, parallelization of
execution using multiple processors, and the use of specialized graphic co-processors to speed
computation are important. Two of the future plans include the following (i) cloud computing
techniques in order to compute network clusters efficiently and (ii) to improve centrality metrics for
directed or bipartite graphs and graphs with varying edge weights [90]. NodeXL supports sentiment
analysis of textual data by measuring the frequency of subjective words occurrences [84].
NetworKit [91], a Python module, is a generic toolkit for high-performance network analysis with
efficient graph algorithms many of which allow parallel execution to quickly process large-scale
networks. Its aim is to provide tools for the analysis of large networks in the size range from
thousands to billions of edges and intends to be much faster than the mainstream alternatives.
Usability and integration with Python libraries for working interactively for data is also provided. It is
a tool comparable to NetworkX and igraph Python packages which are examined in [85], [86], albeit
with a focus on massive networks, faster execution of algorithms, parallelism and scalability. Note
that, Networkit functionalities are not as comprehensive as NetworkX and igraph [27]. Pajek offers
similar data analysis capabilities and network visualization features to NetworKit [91].
Pajek [92] is a general graph analysis tool for analysis and visualization of large networks. It
provides an excellent range of metrics beyond social network analysis routines like various
partitioning schemes, cliques, clusters, components and many other features. This tool has been in the
market for 20 years and has enhanced its features justifying the extensive use both in academic
research and in well-known companies such as Deutsche Bundesbank and Volkswagen. However, it
only runs on the Windows platform and it is relatively weak on visualization. Pajek-XXL is a special
edition of Pajek for analysis of huge networks.
Statnet [93] is a suite of software packages like ergm and network for statistical network analysis
in R programming language that implements recent advances in the statistical modeling of random
networks. It depends on the set of these core packages to provide its basic functionality for static and
dynamic network modeling and is used from the R command line or the recent GUI for less
experienced users. What differs between statnet and the other tools is that its focus is on statistical
modeling of network data. It is utilized for model estimation, model evaluation and model-based

Future Generation Computer Systems, 2016, ISSN: 0167-739X
13
network simulation such as latent space and latent cluster models. All of the models are powered by a
central Markov chain Monte Carlo algorithm that can easily handle networks of several thousand
nodes or more.
Gephi [94] is a standalone software that studies the correlation of node properties and network
structure by using visual patterns and it supports classic data mining algorithms of Social Network
Analysis [95]. Gephi allows for very easy graphical representation of the ‘connectedness’ (degree),
‘influence’ (betweenness centrality) and community membership of individuals within a network.
Table 2 presents the comparison of the five network analysis tools based on platform
characteristics and the most primary analysis needs in response to user's skills. Table 2 indicates that
Networkit, Statnet and Pajek can be used for more sophisticated analysis and between the three easier
to learn is Pajek but more updated is Networkit. Statnet offers the capability of statistical network
model analysis. On the contrary, Gephi can be used when attractive and powerful visualizations of the
network is needed. Last but not least, NodeXL can be used for social media analysis supporting the
standard analytic and visualization features. Noted that when a cell contains two values such as “M-
L” means that the tools provides the concerned metric in a scale from medium to low. All the values
are based on the literature that is pointed in the first row of the table.
Table 3 presents a comparison of analytical capabilities according to criteria mentioned in Section
2.1. We opt for studying metrics and algorithms that utilized in prevalent OSN analysis methods that
have been analyzed in section 2. In Table 3 the different algorithms are differently colored depending
on which analysis method they belong. Centrality and descriptive analytical capabilities and the basic
algorithms of link mining are supported by all tools while content analysis is meager. This is
reasonable since these tools are used for manipulation and statistical analysis of graphs rather than for
multimedia networked content analysis.
Table 2 Comparison of SNA Tools
Program
Pajek
[86], [92],
[96]
Gephi
[86], [95],
[97]–[99]
NodeXL
[84], [89], [90], [100] NetworKit
[91], [101]
Statnet
[37], [87],
[93], [102],
[103]
Platform Windows
Windows,
Mac OS,
Linux
Windows Excel All
All
License
Free*
*for no-commercial
use
CDDL GNU Free
Microsoft, Free,
*commercial version available, http://www.smrfoundation.org/nodexl
/
MIT
GPL
Version 4.09 0.9.1 332 4.0.1
2016.9
Package GUI GUI GUI Python
R
Extensible L H M H
H
Expectable
Computing
Time
M M H L
M
Objective
“The
network calculator,
large data
exploration”
“An interactive
visualizatio
n tool; like Photoshop
but for
graph data”
“Simple Network Analysis
for social media”
“A high
performance large
scale
Network Analysis”
“An
integrated
set of tools
for the visualization
, analysis,
and
simulation of
network
data”
Easy to use M-L M-H M-H L
L
Quality
Graphics L H M L
M
Analysis
Capabilitie
s
H L M H
H

Future Generation Computer Systems, 2016, ISSN: 0167-739X
14
Large
Network H L-M L-M H
H
Orientation Business Academic
Academic Business Academic
Academic
Support
Books,
Manuals,
Articles
Online, Books
Online, Books, Manuals, Articles
Online
Online,
Manuals,
Articles
L: Low
M: Medium
H: High
Table 3 Comparison of SNA Tools Analytic Capabilities Descriptive Analysis | Centrality Analysis | Link Analysis | Content analysis
Program
Pajek
[86], [92], [96],
[104]
Gephi [86], [95], [97]–
[99]
NodeXL
[84], [89], [90],
[100]
NetworKit
[91], [101]
Statnet [37], [87], [93],
[102], [103]
Density YES YES YES YES YES
Clique YES YES YES YES YES
Flow YES NO NO YES YES
Network Diameter YES YES YES YES YES
Geodesic distance YES YES YES YES YES
Census Triad Triad Dyad
Triad Dyad
Triad Dyad
Triad Dyad
Power Law YES YES YES YES
YES
Connected
Components - YES YES YES
YES
Degree YES YES YES YES YES
Betweenness YES YES YES YES YES
Closeness YES YES YES YES YES
Eigenvector YES YES YES YES YES
Clustering
Coefficient YES YES YES YES
YES
PageRank NO YES YES YES YES
HITS YES YES YES YES NO
Community
Detection YES YES YES YES
YES
Text mining - Plugin Alchemy
API
Sentiment
Analysis
Python Libraries
(e.g. TextBlob)
R Packages (e.g.tm)
4. Topic Detection and Tracking Tools
Trends are typically driven by emerging events, breaking news and general topics that attract the
attention of a large fraction of social media users. Currently a large number of social media analytics
tools focus on detecting emerging topics. Some of the many differences between the tools are the
following: the audience of the tools is different since some tools aim to help data scientists (TweCom)
whereas other aim to inform the end user (TwitterStand); some return a set of documents
(TwitterStand) as trends and other a set of keywords (TwitterMonitor); some focus on detecting
specific-concept (TwiterStand) whereas other are open-domain tools (Cloud4Trends); some tools
support visualization (Politwi) whereas other provide extra analysis components (Sociopedia) and
lastly some perceive detection in real-time (Cloud4Trends) and other in batch (TweCom). Except for
the differences among the tools, it is difficult to compare them due to there is no widely accepted

Future Generation Computer Systems, 2016, ISSN: 0167-739X
15
benchmark or measure for the quality of trend detection [74], [79]. Though a comparative analysis is
not in the scope of this paper, we thought it is significant to study the techniques used in trend
analysis frameworks in the context of OSN, not with the pursuit of weighing up them but of
discovering the required expertise and the way the different analysis task is solved.
Tables 4 and 5 present a categorization of these tools according to the year they were created, the
type of detection service they offer, the detection approaches and techniques they employ, whether the
tools support real-time applications and other less substantial elements of interest, all of which are
described below:
1. “Year” refers to the year the tool was created.
2. “Trend Detection Service” demonstrates the service provided by the tool.
3. “Approach” is based on the theory described in 2.3.2. and indicates whether a tool follows
the feature based approach where TF-IDF method is usually used; or the document based where a
lexicon resource is utilized.
4. “Techniques” shows the specific analysis techniques used to develop the tool.
5. “Real-time” refers to whether the tool tackles the challenge of real-time topic detection. In
trend analysis this is a strongly desired requirement [64], [79], [105], [106].
6. “U.T.D.” and “S.T.D.” stands for unsupervised and supervised topic detection respectively
and they are inspired by the categorization done in [64], [74]. The assignment of each tool in
“U.T.D.” and “S.T.D.” indicates whether the detection process, involving clustering and noise
separation, occurred in a supervised way (labelled data), in an unsupervised way or in a hybrid way
combining both of the two.
7. The field “Additional Features” refers either to user experience or extra analysis services
provided by the tool.
8. “Similar to” points out other tools that they are similar to the concerned tool. This
information was extracted either by the creators of the tool or by researchers that described the tool.
9. “OSN” denotes the OSN each tool built for and tested on.
10. Last but not least, the “contribution field” is determined through the contribution that each
paper claim to make with developing the corresponding tool.
TweCom is the only tool presented here that can be used by analysts, after the trend is detected, for
further analysis.
TweCom [30] is a data mining framework for investigating the most relevant trends in terms of
content propagation. It extracts linked tweets with an ad-hoc crawler and provides relations/rules
about both content and context. To generate taxonomies from both post content and contextual
features (temporal and spatial) hierarchical clustering and aggregation functions were used. For each
cluster the keyword characterized by the highest TF-IDF value. The tool extracts the relationships
between tweets through generalized association rule mining. The latter is used when general
semantics are required. An association rule is an implication , where X and Y are item sets,
whereas in generalized association rule A and B are disjoint generalized item sets, namely having no
attributes in common. The extraction of generalized association rules is performed by means of a two-
step process: (i) frequent generalized item set extraction through Genio algorithm and (ii) rule
generation from the extracted frequent item sets through the RuleGen algorithm. The latter belongs to
CART algorithms and determine statistical relationships between many data layers in order to produce
a binary decision tree. Ranking and selecting the most valuable rules is constrained by either (i) the
rule schema (i.e., the attributes that have to appear in the rule body or head), or (i) some specific rule
items of interest. Analysts can then apply drill-down or roll-up queries to study the temporal evolution
and geographical distribution of specific terms. Note that, hierarchical clustering produces a set of
nested clusters organized as a tree, called dendrogram, over data and in this case it is employed to
discover hierarchical relationships among keywords. Researchers utilize the agglomerative approach
where each observation starts in its own cluster, and pairs of clusters are merged as one moves up the
hierarchy.
TwitterMonitor [79] is one of the earliest works in the field of detecting emerging topics on
Twitter. Researchers propose both bursting and clustering algorithms that are implemented in the core

Future Generation Computer Systems, 2016, ISSN: 0167-739X
16
application. Trend analysis is conducted by identifying bursty keywords (seeks bursts in the
popularity of single keywords) or keywords that are often encountered in the same tweets with the
bursty ones and group them into trends with keyword co-occurrences based clustering. Specifically,
given the grouped keywords into disjoint subsets {Kti}, a trend is identified by a single subset Kti,
where Kt represents a set of bursty keywords computed at every moment t and k ∈ Kt and Kti is the
subset of Kt.Regarding clustering, a few minutes’ history of tweets is retrieved for each bursty
keyword, and keywords that are found to co-occur in a relatively large number of recent tweets are
placed in the same group. The system applies contextual features of tweets for providing an accurate
description for each trend and an interactive UI, where a user can rank and submit their own
description, is also available.
Another interesting system for keyword-based event detection is presented in [106]. Apart from
keyword frequencies, it takes into account both the speed and number of participants that the
propagation of tweets follows. They extended TF-IDF to score term importance with a corpus of messages. Given a corpus that belongs in the i-th sample, collected at a window of time Tk , the
keyword score for a certain term w is defined as:
where Sw,cj is the particular score of the term w that is considered for the context feature cj.
Researchers consider three context features: (i) the degree to which keywords appear over a given
time; (ii)the diffusion-degree, and (iii) the diffusion-speed at which the information spreads from a
user to followers. Instead of using lexicon-based or machine learning techniques, they build a
semantic network whose nodes are tweets that include this meta-information and the edges between
tweets infer their closeness relationships calculated with cross-correlation function. They apply
density-based spatial clustering to the semantic network of tweets in order to determine the potential
clusters. To cluster similar tweets into clusters, they relate them in terms of time and keyword
occurrence frequencies between the groups of tweets.
Cloud4trends [53] also detects trends via exploiting keyword frequency TF-IDF and specifically
by assigning more weight to terms in titles and tags of posts. Clustering is similar to that employed in
TwitterStand. Though, instead of applying a fixed-threshold based method that sets as inactive
clusters after a predefined period of time, such as in TwitterStand, it dynamically observes the
clusters’ updating rate and can identify trends at their peak and detect the topics that are no more
trending. Also TwitterStand examines the geographical scope of the resulting clusters as a post-
analysis process whereas cloud4Trends separately collects and clusters tweets that pertain to a desired
geographical area and takes into account the respective user’s physical location. The concurrently
collection and processing of streams for the different geographic areas offers real fast analysis. In
particular, it collects data from three different sources namely tweets, blogs and extended tweets and
processes them in the cloud using the MapReduce paradigm.
TwitterStand [105] detects breaking news but it can be applied to other domains as well. Online
clustering is based on similarity functions upon the content through a modified version of Lead-
follower algorithm [52] which allows for clustering in both content and time. It aggregates tweets in
clusters according to the topic they referred to and the geographical area mentioned in tweets. In
particular, they represent news tweet t with i feature vector representation using TF-IDF and compute
the distance between t and a candidate cluster c using a variant of TF-IDF measure. They modified the
latter cosine distance by applying the Gaussian attenuator in order to involve the temporal dimension
on clustering. The difference in days between the cluster’s mean publication time of all the tweets Tc
and the tweet’s publication time Tt, are taken into account in the online clustering as defined below:
To distinguish relevant tweets from spam a naive Bayes classifier was trained with a manually
built lexicon of keywords extracted from news articles that published around the same period as

Future Generation Computer Systems, 2016, ISSN: 0167-739X
17
tweets. The system also provides a UI with the news ranked in an order of importance and a map
showing the geographic region of interest.
Table 4 Topic Detection and Tracking Tools
Tool TwitterStand
[105]
TwitterMonitor
[79]
Cloud4Trends
[53]
TwiCal
[107]
TweCom
[30]
Year 2009 2010 2012 2012 2013
Trend
Detection
Service
Breaking News General Topics Local Trends Events Spatial& Temporal
Propagation analysis
of trends
Approach Document & Feature
Based Feature Based
Feature &
Document Based Document Based
Feature-based
Techniques
-Online Clustering Lead Follower &
Gaussian
-Naive Bayes
Clustering based
on co-
occurrences
Online clustering
Gaussian
-Bayesian Model
-Sequence Label with
Conditional Random Field
-Semantic Ontologies
-Genio & RuleGen
-Hierarchical
Clustering
-Association Rule
Mining
Real-Time
YES YES
U.T.D. YES YES YES YES YES
S.T.D. YES
YES
Additional
Features
Interactive UI with the concepts aggregated
and geographically
presented
Interactive UI
with description for each trend
Capture user’s
trend history & geolocation
Group events into concepts including
time & location of
each event
Crawler to retrieve linked tweets and
most significant
trends
Similar to NewsStand Blogscope[53] TwitterStand
TwitterMonitor - CAS-Mine
OSN Twitter Twitter Twitter Twitter Twitter
Contribution
Field
Online Clustering
Geospatial Analysis
Burst detection
and clustering
algorithms
Cloud
Infrastructure
Open-domain event
extraction Data Mining & SNA
Zhou et.al [46] propose an end-to-end framework for filtering and categorizing events into
concepts that also provides the location and time for each event. They filter events with two
approaches: (i) a keyword based, through a lexicon which built manually in the same way as
TwitterStand [105], and (ii) a binary classification problem with features of frequently occurred
words and patterns in event-related tweets. For extraction and categorization of events, they propose a
simple Bayesian modeling (LECM) approach which is able to directly extract event-related keywords
from tweets without supervised learning. Events in the framework are represented as a 4-tuple <y, d, l,
k>, where y stands for non-location named entities, d for a date, l for a location, and k for event-
related keywords. It is assumed that in the model, each tweet message m is assigned to one event
instance e, while e is modeled as a joint distribution over y, d, l and k. Their work is similar to TwiCal
in the sense that they also focus on the extraction and categorization of structured representation of
events from Twitter. However, TwiCal relies on a supervised sequence label based on Conditional
Random Fields and trained on tweets annotated with event mentions for the identification of event-
related phrases. Whereas here all the methods are unsupervised and additionally an enhanced version
of filtering is implemented. Both tools use POS, NER and temporal resolution to process tweets.
Future work could be the use of cloud computing for reducing the error propagation that resulted from
the separate computation of the steps.
Wang et.al [108] study the problem of detecting events instead of fixed, in adjustable time
windows. For instance, their system gives data scientists the ability to know about how a hot event,
happened and developed in the last 120 minutes, and what happened during the past 60, 30 and 10
minutes. To detect events, they use unigrams as terms for each new tweet, claiming that unigrams out-
performs n-grams in both effectiveness and efficiency. They detect events through anomaly detection,
namely they process each new tweet and store their statistics (number of retweets, number of tweets
per minute, number of users and number of different retweeted users) and identify abnormal terms at
the end of each current time window. The clustering is based on co-occurrences and the selection is
based on the top-k ranked clusters. They design a data structure to support adjustable time window

Future Generation Computer Systems, 2016, ISSN: 0167-739X
18
based event detection. Their proposed technique outperformed TwiCal in accuracy.
Politwi [77] is a tool available on twitter, website and smartphone apps for detecting the top
political German discussions in tweets hourly and daily. The hashtags are the base for topic detection
and the emoticons contained in hashtags are the base for sentiment analysis. The basic idea of their
TDT approach is to compare the current number of tweets with hashtag to the number of tweets of the
previous period taking into account the standard deviation using the Gaussian distribution. To this
extent, a top topic is characterized by a significantly higher current appearance compared to a
previous time period. A graph is built with each hashtag (node) to be surrounded by links of the
connected words (node) used in the current context together with a predicted polarity for each one.
The relation graph contains the most frequently occurred words in specific time points and can be
used to extend the existing knowledge bases for answering questions like “Which polarity bears the
upcoming topic '#Merkel' in this political context?”.
Sociopedia [28] is a different system for analyzing social media topics. It constructs automatically
a semantic ontology based on a given keyword. The nodes in ontology are entities extracted from the
retrieved top tweets and the relationships are inferred through related-documents form Wikipedia and
DBpedia. POS and NER are implemented to construct the ontology as well. Since the researchers’
objective is to monitor a marketing campaign for a new product launch in Twitter landscape, the
system includes a query summarization analysis, a comparison detection and a sentiment analysis
component as well. The sentiment analysis conducted through the lexicon AFINN and the other two
components are built through their frequency distribution of word patterns. To illustrate the latter, the
presence of the word ‘versus’ may indicate a comparison and the presence of 5W1H (what-where-
who-why-whether-how) is an indicator of a query.
Table 5: TDT Tools 2
nd part
Tool Politwi [77] [46] Sociopedia [28] [108] [106]
Year 2014 2015 2015 2016 2016
Trend
Detection
Service
Political Topics in
German and their sentiment polarity
Events Specific Events Events in Adjustable
time windows Events
Approach -Feature Based -Document
Based -Feature Based -Feature Based
Techniques -Statistical Analysis
-SVM Classifier
-Bayesian Model
-Semantic
Ontologies -Statistical
Analysis
-Complexity Analysis
-Clustering based on co-occurrences
-Density-Based Spatial Clustering
-Online behavioral
analysis
Real-Time YES
YES YES
U.T.D. YES YES YES YES YES
S.T.D.
Additional
Features
Website, Smartphone app &Twitter
Representation
Group events
into concepts including time
& location of
each event
-Lexicon-based
Sentiment
analysis -Query detection
& Summarization
-Comparison Detection
Modify the segment
Tree Data Structure
-Diffusion Speed
-Participants Number
Similar To Google Trends TwiCal - TwiCal -
OSN Twitter Twitter Twitter Twitter Twitter
Contribution
Field Big Data Apps
Unsupervised categorization of
tweets
Business
Intelligence App
Not fixed time
windows
Online behavioral
analysis
5. Sentiment Analysis(SA) Frameworks
Sentiment analysis is the process of finding opinions which are present in the textual content and

Future Generation Computer Systems, 2016, ISSN: 0167-739X
19
both the context of the text and user preferences influence the analysis results. In a detailed survey
[109] which presents recent adapted approaches related to sentiment analysis, is shown that not only
meager sentiment analysis has been conducted in the context of social networks but also neither
artificial neural networks (ANN) nor fuzzy networks were utilized as analysis techniques. In this
research, SA frameworks that developed to derive sentiments from OSN are described and an
overview is given about the correlation among the methods used, the frameworks’ research purpose
and the text granularity they focus on. Our interest is also towards SA frameworks that include CI
techniques. Tables 6 and 7 present a categorization of these tools according to many parameters such
as the year they were created, the type of sentiment analysis service they offer, the SA approaches and
techniques they employ and whether the tools support concept level analysis. Specifically:
1. “Year” refers to the year the tool was created.
2. “Sentiment Analysis Service” demonstrates the service provided by the tool.
3. “Techniques” shows the specific analysis techniques used to develop the tool.
4. “U.M.L.” and “S.M.L.” stands for unsupervised and supervised machine learning methods
respectively. A tool assigned into these classes entails that a statistical approach is utilized. The
specific machine learning algorithms that used are mentioned into the “Techniques” class.
5. “Lexicon-based” indicates that the tool employed the lexicon based approach. The cell refers
to the knowledge base, dictionary or manually built corpus that was utilized. When a tool is both
assigned in “U.M.L.” and/or “S.M.L.” and “Lexicon-based” means that a hybrid approach is
employed.
6. “Document” and “Sentence” refer to whether the tool identifies a sentiment at the sentence or
document level.
7. “Concept” refers to concept-level sentiment analysis; which focuses on a semantic analysis
of text through the use of web ontologies or semantic networks, which allow the aggregation of
conceptual and affective information associated with natural language opinions [59].
8. “OSN” denotes the OSN each tool built for and tested on.
9. “Other Tools” points out the synergy of other tools within the framework in order to achieve
its analysis service.
All fields are determined via the theoretical baseline that we defined in section 2.2.
Sheela [110] proposes a development environment utilizing the Hadoop technology and a Naive
Bayes classifier for sentiment classification of tweets. Specifically, sentiment analysis was done in
MapReduce layer and the results were stored in MongoDB. She took into account the fact that
processing and analysis algorithms should be aligned with the strict constraints of storage and time
since UGC arrive at high frequency and volume.
Inspired by the coarse grained machine learning analysis that treat each tweet as one uniform
statement, Kontopoulos et.al [61] utilize ontology-based techniques. In particular, they broke down
each tweet into a set of features relevant to a pre-defined domain to give a more detailed analysis of
the posted opinions. They created an ontology with concepts and relations through the manual Formal
Concept Analysis (FCA) methodology combined with the semi-automatic ontology editor Onto-gen.
They enriched the domain ontology with synonyms using WordNet and they extracted tweets relevant
to the ontology concepts’. Lastly, they extracted sentiment from isolated sentences through a web
service called OpenDover. FCA is a mathematical data analysis theory to derive a hierarchy of
concepts where each concept represents the set of objects (iPhone) sharing the same values for a
certain set of attributes (camera). A formal context is defined as a triple of:
K= (G, M, I),
Where G is a set of objects, M is a set of attributes, and I ⊆ G × M is a binary relation that
expresses which objects have which attributes.
Poria et.al [71] also utilized ontology-related technologies for concept level analysis but instead of
creating a knowledge representation through mathematical logic, they applied semantic relationships
with the support of SenticNet [111] knowledge base. They focused on augmenting the sentic
computing framework with dependency-based rules that leverage syntactic properties of text for

Future Generation Computer Systems, 2016, ISSN: 0167-739X
20
sentence-level polarity detection. The sentic computing framework , introduced by Cambria et.al [69],
process natural language via common sense tools and affective-semantic ontologies, besides via
mathematical and social concepts. Poria et.al contributed in better understanding of the contextual role
of each concept within a sentence by allowing sentiments to flow from concept to concept based on
the dependency relation of the input sentence. Dependency relations refer to binary relations between
two words [112] and they are useful in finding links between subjective words and a topic. In
particular, natural language text is first deconstructed into concepts, through POS and syntax analysis,
to be later fed to a vector space of common-sense knowledge. The latter structures words in terms of
their affective valence. It is built to analyze the concepts by means of an emotion categorization
model (Hourglass model), which is inspired by human emotions and brain activity theories. The
model can potentially synthesize the full range of emotional experiences in terms of just four
emotions: Pleasantness, Attention, Sensitivity, and Aptitude and predict polarity of opinions,
according to the formula:
where ci is an input concept, N the total number of concepts, and 3 is the normalization factor since
the Hourglass dimensions are defined a float .
Analogical reasoning on the semantic and affective relatedness of natural language concepts
succeeded via ELM and SVM which cluster the vector space model with respect to the Hourglass
model. ELM are ANN with a single hidden layer whose first weight matrix need not to be tuned so it
“only learns the last layer”. It works for generalized single-hidden layer feedforward networks
(SLFNs).
The ELM learning problem settings require a training set, X, of N labeled pairs, where (xi, yi),
where is the i-th input vector and yi is the associate expected ‘target’ value. The input layer
has m neurons and connects to the ‘hidden’ layer (having Oh neurons) through a set of weights
. The j-th hidden neuron embeds a bias term, , and a nonlinear ‘activation’
function, φ(•); thus, the neuron’s response to an input stimulus, x, is:
The overall output of the network is:
Training an ELM involves the following steps:
1. Randomly set the input weights and bias for each hidden neuron;
2. Compute the activation matrix, H such that the entry {hij H; i=1,…,o; j=1,…,oh} is the
activation value of the j-th hidden neuron for the i-th input pattern. The H matrix is:
3. Compute the output weights by solving a pseudo-inverse problem as:
In addition to that, the ELM was trained to act as a reserve to detect the polarity of the sentence
when the concept wasn’t found in SenticNet or when no sentic patterns were found. In order to

Future Generation Computer Systems, 2016, ISSN: 0167-739X
21
compute polarity, sentic patterns leverage on the SenticNet framework and on the syntactic
dependency relations found in the input sentence.
Although, the proposed approach is tested on offline polarity-tagged datasets of movie reviews and
product reviews, we could say that it could be implemented on posts of OSN with some crucial
modifications. It is worth noting that, since the accuracy of the system crucially depends on the
quality of the output of the dependency parser, which relies on grammatical correctness of the input
sentence, the preprocessing part should be efficiently done so as not to penalize results; provided that
OSN do not have predictable discourse structure.
Due to the fact that the majority of such state-of- the-art frameworks rely on processing a single
modality, i.e., text, audio, or video, another work of Poria et.al [25] propose a system for multimodal
sentiment analysis from videos posted on YouTube. They extracted facial expressions features with
ELM, vocal intensity features from audio tracks and concepts from texts following the sentic
computing paradigm [16].
Also Yu et.al [22] analyzed sentiments based on multimodality content and specifically they
employed deep learning models to extract both textual and visual features to analyze the sentiment
expressed in Chinese microblogs. They adopted deep convolutional neural networks (DNNs), which
are really popular in image recognition, with DropConnect learning the visual features. Also they
trained another CNN using the short text of microblogging platform, and then, made sentiment
predictions by combining these two results. CNN is a feedforward network whose connectivity
pattern between its neurons follows the organization of the animal visual cortex. Here, it was trained
on the pre-trained word vector of Chinese characters resulted from the word2vec tool. The word2vec
[113] tool is a set of neural networks that takes a text corpus as input and produces the word vectors
as output. It first constructs a vocabulary from the training text data and then learns vector
representation of words.
Mithun [112] proposed a query-based opinion summarization framework called Blogsum that
given a query and a set of blogs generates a summary of opinions. To extract and select the initial
candidate sentences for the summary, BlogSum ranks each sentence using the features shown below:
where, question similarity and topic similarity are calculated using the traditional technique of TF-
IDF. The subjectivity score is calculated using a dictionary-based approach MPQA and is defined as:
They used heuristics rules to select the best possible sentences that would generate the summary
[63]. Similarly with Poria et.al [71], they took advantage of dependency rules in order to identify
whether the topic of the sentence is associated with any of the subjective words of the sentence.
Though, they used different methods and they included other discourse relations as well. For instance,
their system identifies comparison via Naive Bayes and class sequential rule classifiers.
Researchers [40] also included a summarization component in their opinion mining framework.
The framework is composed by two other analysis components: sentiment analysis and the influencer
analysis. The latter is done via measuring the degree centrality of the network. The out-degree is
defined as:
where i is the user and aij the relationship with another user, aij = 1 when a user follows someone
otherwise is equal to 0. Respectively at the in-degree defined below, aji =1 when the user is followed
by someone otherwise is equal to 0.
Future Generation Computer Systems, 2016, ISSN: 0167-739X
22
For the SA they define five corpora with syntactic features, positive and negative words to employ
a lexicon-based algorithm that iteratively matches sentiment keywords with the remaining corpuses.
The summarization analysis is created through sentence similarity calculation, sentence clustering and
last sentence selection. The sentence similarity score is defined with the usage of a predefined
similarity word-pair corpora and a vector space model. Each sentence is represented with a set of
words and the merge of two word sets of the two comparing sentences, supports two semantic vectors
(V1, V2) to be created. Each element of vector represents the similarity score between word pairs (r, s)
in similarity corpora, as illustrated in Figure 4. Finally, the similarity score between two sentences is
derived from a cosine similarity (COS) between V1, V2 as defined:
Then they minimize the dissimilarity between sentences in the clusters through a modified version
of CI's Genetic Algorithm so as to eventually select the underlying text from each cluster. The
modification is that they take into account the membership degree of a sentence in the cluster to boost
up the results.
Similarly, researchers [41] propose a keyword-based framework for numeric sentiment
summarization, accompanied also with influencer analysis to evaluate the credibility of a user. The
credibility score of user i in a social network SN in a time period TP, is obtained by:
where fiSN
is the credibility of an expresser and defined as:
N is the users in the social network SN. If user i follows user j then SNi,j=1, otherwise SNi,j=0
is the credibility of the content and defined as:
Features/topics were extracted via TF-IDF keyword frequency multiplied with meronym pattern
MPPq,t. MPPq,t, is defined as:
Figure 4: Similarity calculation between two sentences in vector space text representation

Future Generation Computer Systems, 2016, ISSN: 0167-739X
23
where P is a set of predefined meronym patterns, q is the given keyword, t is a distinct term in a set
of phrases/nouns and Oq is the set of tweets containing the term q.
To score subjectivity of opinions, a subjective word set, Φ, was built with WordNet and the
opinion subjectivity for a post o related to a topic t, OSo,t, formulated as:
where Sto
is the set of sentences in opinion o which is mentions topic t,
and Us is the set of unigrams pertained in sentence.
To classify the polarity of opinions, SVM approach, trained on emoticons, was utilized. The
semantic score of opinion o on a topic t is defined as SSo,t whose values range between 1 for positive
and -1 for negative sentiments.
SSo,t = Polarityo x OSo,t, where SSo,t [-1,1]
The final score for a topic t with respect to a query q is formulated as:
and Oq,t is the set of opinions mentioning topic t for a given query q and user i is the expresser of
an opinion o.
Table 6: Sentiment Analysis frameworks
Tool [61] [63][112] [41] [40] [114]
Year 2013 2012 2013 2014 2014
Sentiment
Analysis
Service
Feature-based
SA on
specific topic
Opinion
Summarization
given a
Query&Blogs
Keyword-based
Numeric Opinion
Summarization with
Influencer Analysis
Keyword-based
opinion mining in
Thai Language
accompanied with a
summary and
influence analysis
Sentiment
Classification and
quantitative
analysis of Spanish
Tweets
Techniques
Ontology-
Related FCA
-Syntax
Analysis
-TF-IDF &
Meronym patterns Genetic Algorithm Naive Bayes
-Heuristic
Rules -SVM on emoticons
-Naive Bayes
-Sequential
Rules TF-IDF
U.M.L.
S.M.L.
YES
YES
Lexicon-
based WordNet MPQA WordNet Manual Corpus Manual Corpus
Document
YES
YES
Sentence YES YES YES
Concept YES YES
OSN Twitter Blogging
Services Twitter
Twitter Facebook
Foursquare Twitter

Future Generation Computer Systems, 2016, ISSN: 0167-739X
24
Other
Tools
Ontogen
OpenDover
Spade Parser
Stanford POS Hits&Pagerank
MapReduce
MongoDB
MapReduce
Python
NLTK
NodeJs
The authors [114] propose a customizable and extensible framework to analyze sentiments of
Spanish tweets and generate reports as output. A language-agnostic sentiment analysis module
provides a set of tools to perform sentiment analysis. In particular, polarity classification, performed
manually through NLTK Python interface, in order to create a corpus for training data. The system
classifies texts given the Naive Bayes classifier and a set of n-grams, and the most probable category
is returned (either “positive” or “negative”) along with its probability.
Knime is an open platform for analytics that fits in the big data era. It is used together with Hadoop
and HBase to analyze sentiments regarding specific brands presented on online reviews and Twitter
[115]. Researchers analyze tweets at word level via the lexicon based approach MPQA and they count
the significance of each word via TF-IDF. Researchers showed that sentiment analysis of online
reviews is a less complicated process but more time and resource intensive whereas the vice versa
situation is observed in tweets sentiment analysis.
A different method from the above, presented in [26] which took advantage of the networked
posted messages through user connections, including both user-message and user-user following
relations. It employs the unigram model to construct the feature space and use term presence as the
feature weigh. Researchers transform user-centric social relations into sentiment relations between
tweets based on social theories of Sentiment Consistency and Emotional Contagion. The basic idea is
to build a latent connection, mathematically formulated, to make two messages as close as possible
whether they are posted by the same user (Sentiment Consistency) or they have a relationship
follower/friend with each other (Emotional Contagion). To retain original information in the texts and
discard the noise, instead of term filtering through dictionaries, they model the relations using a
Laplacian graph, which is employed as a regularization to a sparse formulation. After modelling the
above sentiments relations, the sentiment classification of microblogging data formulated as the
following optimization problem:
where T = [X, Y] : X is the content matrix, Y is the sentiment label matrix and T the given corpus
with messages. W is the desired classifier to automatically assign sentiment labels for unseen
messages (i.e., test data), α and β are positive regularization parameters, F is the user-user matrix and
is the Laplacian matrix for the different message-message relations.
Table 7 Sentiment Analysis Frameworks 2nd
part
Tool [110] [25] [26] [22] [71]
Year 2016 2015 2013 2016 2014
Sentiment
Analysis
Service
Development
Environment
for sentiment
classification
Generic Multi-
modal SA
system
Model social relationships
between tweets
Polarity detection
engine
combining both
images and
Chinese text
Sentence
Polarity
detection engine
using
dependency
rules & Sentic
Computing
Techniques Naive Bayes ELM Social Theories
Least Square CNN DNN
ELM SVM
Ontology related
and semantic
Technologies
U.M.L. YES YES YES
S.M.L. YES
YES

Future Generation Computer Systems, 2016, ISSN: 0167-739X
25
Lexicon-
based
SenticNet
WordNet
SenticNet
EmoSenticNet
SenticNet
AffectNet
Document
YES
Sentence YES YES YES YES
Concept
YES
YES
OSN Twitter YouTube Publicly Available Twitter
Datasets SinaWeibo
Movie Review
& Blitzer
datasets
Other
Tools
Hadoop
MapReduce
MongoDB
Matlab Luxand
FSDK 1.7
GAVAM
OpenEAR
Sentic
Computing
Stanford Twitter
SentimenT&ObamaMcCain
Debate Social Theories
Laplacian Matrix
Word2vec
Python jieba
DropConnect
Sentic
Computing
Logistic
Regression
Stanford
Chunker
Hourglass
Model
Analogical
Reasoning AI
U.M.L.: Unsupervised Machine Learning
S.M.L.: Supervised Machine Learning
6. Collaborative Recommendation (CR) Frameworks
Collaborative recommendation is effective at representing a user’s overall interests and predicting
accurate recommendations to users according to their preferences. Computing Intelligence techniques
have exhibited significant potentials to make recommender systems more robust, effective, and
context-aware. Recent recommender systems based on CI have been studied in [116]. We study CR
frameworks that are used in OSNs and combine a variety of techniques. Table 8 presents a
categorization of these tools according to the CR method used, namely model or/and memory based,
whether they incorporated the content based method, the specific analysis techniques that are
employed, the recommendation service they provide and the OSN they built on. All these fields are in
detail described in section 2.3.3.
Hsu et.al [117] proposed a personalized auxiliary learning material recommendation system using
Facebook searching queries. The system recommends to learners appropriate learning items that are
both best match to the query and are among the people’s most likeable ones. It also takes into account
the degree of difficulty of the auxiliary materials, individual learning styles and the specific course
topics. Authors implement the population-based optimization algorithm called the Artificial Bee
Colony (ABC) to optimize the results of recommendation.
Authors in [45] presented a cloud-based framework for context-sensitive venue recommendations
in social networks for a single user or a group of friends with similar interests. The system uses the
opinion of experienced users to recommend items. It combines CF with the group satisfaction
principle of social computing. After ranking users and venues in a geographic location via HITS
mechanism (item-based), they created a similarity graph among a set of experienced users (called
hubs) who share the similar preferences for various venues (user-based). Then, they apply a variant of
the ant-colony algorithm to generate an optimal venues selection that best matches user’s preferences.
To deal with the scalability problem, they use cloud infrastructure.
Chen et.al [32] propose a recommendation scheme to make followee recommendation in Twitter
leveraging implicit information. They compute similarity between users via a modified latent factor
model with top-k ranking optimization criterion in reasons that conventional similarity functions face
high scalability issues. After computing all the preference pairs of followee candidates for a given
target user u and the rank order of a followee candidate i in u’s preference list, latent features of tweet
content factors and social relationship factors (frequency of retweeting or placing comments to
another user) are incorporated to recommendation system. To combine tweets that are posted by users,
the factorization model is defined as:

Future Generation Computer Systems, 2016, ISSN: 0167-739X
26
where bias is used to indicate any form of possible bias to simplify the equation; Ti is the term set
of tweets posted by user i; β is the normalization term for features and tw corresponds to a certain
term vector mentioned by user i.
To incorporate social relations a model is defined as:
where si is the latent factor of the followee candidate i. He and Chu [33] leverage OSNs explicit social interactions to design a probabilistic model which
makes recommendations based on user's own preferences, the general acceptance of the target item,
and the opinions from social friends. Specifically, they use influence analysis and select an
appropriate set of friends according to the type of target items (semantic filtering). They incorporate
the influences from both distant friends and immediate friends inference that are calculated through a
Naïve Bayes; Immediate friends are considered those who are just one hop away from each other in a
social network graph and distant friends are those who are multiple hops away. The core of the
recommender system is to predict the probability distribution of the target user U's rating on the target
item I given the attribute values of item I, the attribute values of user U, and the ratings on item I rated
by U's immediate friends as defined:
Pr(RUI = k | A’=a'I, A=aU, {RVI = rVI : ∀V∈U(I)∩N(U)})
Sun et.al [118] propose a matrix factorization framework that combines both friendships and
ratings records as social regularization terms. Researchers combine the friendships (immediate)
among users by selecting the most ‘suitable set of friends’ with a biclustering algorithm’. They
calculate similarity between users taking into account the tags they share as defined below:
where wut denotes the weight of tag t labeled by user u, Mui is the tag list that user u gave to item i,
and |Mui| is the number of tags. Then they compute the correlation between users and items via
mapping them in the tag space model as defined:
where wjt denotes the weight of tag t of item j, Muj is the tags list and |Muj| is the number of tags
that user u gave to item j.
The similarity calculation for both of the two algorithms is measured with the cosine similarity.
The general idea of matrix factorization (MF) is to model the user-item interactions with factors
representing latent characteristics of the users and items in the system. The model is trained using data
from Del.icio.us, and later used to predict ratings of users for new items.
A different approach presented by Sieg et.al [83] who incorporate semantic knowledge from
ontologies to enhance a context-sensitive collaborative recommendation. The centric idea is to create
ontological user profiles that are learned and incrementally updated with the support of an underling
ontology of concepts in a particular domain of interest. After calculating the users’ level of interest for
each concept, the system compares the ontological user profiles for each user and forms semantic
neighborhoods in order to compute the similarity among user profiles. The prediction of a user’s
rating for an item calculated with a variation Resnick’s standard prediction formula. The ontology
relies on existing hierarchical taxonomies such as Amazon.com’s Book Taxonomy.
Although researchers’ proposal in [119] is not evaluated on social networks, it is interesting since
it aims to recommend previously unseen news items, by semantically expanding user profiles using
ontology-related technologies. They compute similarity relations both between concepts related to the

Future Generation Computer Systems, 2016, ISSN: 0167-739X
27
user profile and between concepts per se. The quality of the knowledge base they use, influence
directly the accuracy of recommendation results. However, there are many future directions that
should be checked and/or solved such as the matter of the manual maintenance of the knowledge base.
Table 8 Tools for Collaborative Recommendation
Article Content-
Based
Model-
based
Memory-
based Techniques Task OSN
[32] YES YES
Latent factor model
Top-k
Tf-idf
Followee
recommendation SinaWeibo
[118] Matrix factorization based on social
regularization Rating Prediction De.li.cio.us
[33] YES Influence
Analysis Naïve Bayes
Personalized
Recommendation Yelp
[117] YES Artificial Bee Colony
Personalized
Learning
Material
Recommendation
[45] YES YES Top-k Cloud
Hits -
Influence
Analysis
Ant-
Colony
Group and
Personalized
Venue
Recommendation
Mobile
Social
Networks
[83] YES YES Ontology Related and semantic
Technologies
Personalized
Book
Recommendation
Book-
crossing
Community
[119]
YES
Ontology
Related and
Semantic
Technologies
Knowledge-base
Personalized
Recommendation
of News
-
7. Open Issues and Potentials
7.1. Limitations of Machine Learning techniques
Machine learning is a subset of CI methods that mimics the learning process. Most event detection
and sentiment analysis algorithms tackle the problem, at least in a first stage, as a clustering task
either with supervised classifiers trained on textual (e.g. n-grams) and structural features (e.g. number
of followers) or via unsupervised learning based on a scoring function to classify clusters. Semi-
supervised learning exploits a small amount of labeled data together with the large amount of
unlabeled data to build classifiers, however this approach is sensitive to classification efficiency and
threshold settings [74].
In SA area most of the existing approaches, as entailed both from the above tables and literature,
rely on supervised learning models trained from labeled corpora and it has been showed that they tend
to overcome unsupervised ones [120] [121]. There are massive amounts of reviews that can be used
as labelled data and classifiers automatically “learn” the task based on historical cases in a cost-
effective manner. Though, reviews differ substantially from online social networking data whose
short text doesn’t help to gather sufficient statistics [26]. Only three papers, that all come through
multimodal SA extracted the sentiment from text analysis in an unsupervised way using sentic
computing paradigm and specifically by combining feedforward ANN’s and SenticNet knowledge
base. Generally, the better results come from cleansing and filtering out the noise from the dataset.

Future Generation Computer Systems, 2016, ISSN: 0167-739X
28
Since filtering out irrelevant content highly improves the analysis result accuracy [46], [105], [121],
however it is a time-demanding process. Researchers in [46] compared the lexicon based approach
with a manually built dictionary and SVM-based approach and concluded that the former gives higher
accuracy in the filtering task. Regarding sentiment analysis task, researchers in [71] shown that sentic
paradigm with SenticNet and ELM outperforms the machine learning based SA which conducted via
ELM and SVM classifiers.
Bayesian modelling, Naïve Bayes and SVM are the common ML methods used in the analysis
frameworks and a few papers regarding only the multimodal sentiment analysis utilize ELM, CNN
and DNN feedforward neural networks. Despite the low computational cost of the Naive Bayes
technique, it has not been competitive in terms of sentiment classification accuracy when compared to
SVM [122][41]. A comparison between SVM and Artificial neural networks (ANN’s) is presented by
[122] regarding document-level sentiment analysis and bag-of-words(unigrams) approach. In general
researchers conclude that the winner is determined in relation with the underlying learning problem;
since SVM tend to be more stable than ANN in dealing with noisy terms in an unbalanced data
context; whereas ANN outperformed SVM significantly in a balanced data context. Researchers [25]
compared SVM, ANN and ELM classifiers and ELM provided the best performance in terms of both
accuracy and training time. The training time of ANN is usually much higher than that of SVM [122]
but the ELM outperformed both SVM and ANN by a huge margin in [25].
However interesting machine learning techniques are, they have a lot of limitations. Classifiers do
not work well at sentence level analysis since they require large text input. Moreover, they presuppose
a training data set which isn’t always available; especially in the case of OSNs there are many reasons
such as privacy that restrict datasets to be public. Another significant issue is the biases that are
created owing to the sampled training dataset. Unsupervised techniques, need scalability and
optimization on setting the thresholds. Effectiveness of both machine learning techniques rely on
feature engineering, a time-consuming, labor-intensive and domain-dependent task that usually rely
on static features assuming OSN as a static environment. Deep Learning algorithms are one promising
avenue of research into the automated extraction of complex data features at high levels of abstraction
[123].
7.2. Limitations of Lexicon-based techniques
While lexicon-based approach has become dominant within the field of text mining, it does have
its problems. Lexicon-based techniques either rely on an online dictionary, a knowledge base or a
manually labelled corpus. The latter is infeasible considering large-scale data and it is also subjective
to biases. Validity of lexicon resources depends heavily on comprehensive knowledge base and the
knowledge representation [22]. Besides that, knowledge bases and online dictionaries are still too
limited to efficiently process text at sentence-level [109] and involve mostly English words which
forces researchers to manually build lexicon as occurred in [40], [114]. Furthermore, they lack sets of
words and concepts that also leads to delusive results. A distinct example is observed in BlogSum
which tagged positive or negative sentences as neutral because of missing words in the MPQA
lexicon [63][112]. An interesting comparative analysis among the most widespread available lexical
resources: WordNet Affect , SentiWordNet , SenticNet and MPQA has been made by [120]
regarding the task of sentiment classification of microblog posts.
As pointed from the above tables of SA and literature, there is a movement towards concept-level
sentiment analysis. Sentic computing [16][69] is a new paradigm to this analysis that combines deep
learning techniques with lexicon based ones to infer polarity from the text. Generally, it uses artificial
intelligence and Semantic Web techniques, for knowledge representation and inference; mathematics,
for carrying out tasks such as graph mining and multi-dimensionality reduction; linguistics, for
discourse analysis and pragmatics; psychology, for cognitive and affective modeling; sociology, for
understanding social network dynamics and social influence; and finally ethics, for understanding
related issues about the nature of mind and the creation of emotional machines [71]. Still, the
framework leverages SenticNet knowledge base and besides other issues related to lexical based
techniques, adopting them to other languages apart from English is considered also a challenge.
This is a result from the move from traditional word-based approaches, towards semantically rich
concept-centric [124] approaches combining both computer and social sciences concepts together

Future Generation Computer Systems, 2016, ISSN: 0167-739X
29
with AI research fields such as Common Sense Computing and Affective Computing to endow
machines the ability to learn things we know about the world so as to better process natural language
text [18].
A major problem related to both machine learning and lexicon techniques including sentic
computing [77], is that the text can get another meaning in a new context. Unable to find opinion
words with domain and context specific orientations, lexicon resources usually are used together with
the corpus-based approach which relies on syntactic or co-occurrence patterns of discourse structure
[109]. In the big data analytics framework [40] the corpus based approach is utilized with syntactic
patterns in order to distinguish different types of opinion and appraisal [125]. Dependency rules are
also incorporated in the two analysis frameworks [63], [71] to determine whether subjective words
referred to the topics of interest and to reduce errors occurred owing to domain specific orientations .
A significant restriction regarding this approach, though, is that texts shared in informal OSNs like
Twitter and Facebook do not comply with the norms of syntactic language structure.
7.3. Computational Intelligence in Social Networking Data Analysis
Evidently, data analysis borrows concepts and tools mostly from graph theory, text mining,
semantic technologies and conventional machine learning techniques. However, less attention has
been attracted the Computational Intelligence paradigm. CI encompasses algorithms like artificial
neural networks (ANN), fuzzy systems (FS), evolutionary algorithms (EA), swarm intelligence (SI)
and artificial immune systems (AIS) and all mimic procedures observed in nature. Owing to their
promising property to adapt in a changing environment [15], they can be used in sentiment analysis
systems that with a few changes at their core program they could work well in any language, not just
in English. Other significant attributes CI poses is generalization, discovering, reasoning and
association [126].
In contrast to more conventional machine learning and feature engineering algorithms, Deep
Learning ANN has an advantage of potentially providing a solution to address the data analysis and
learning problems [123] since they go beyond mimic the learning process and linear logic to imitate
neural activation of human mind. The program is made of tangled layers of interconnected nodes and
learns by rearranging connections between nodes after each new experience.
Most previous research takes text analysis problems as a ranking task and employs learning-to-
rank algorithms based on constructing novel features (e.g., lexical features, syntactic features, and
semantic features), which needs a time-consuming and labor-consuming problem which needs priori
knowledge and usually a big dataset. Deep learning methods learn sentiment representations from a
large corpus of labeled and unlabeled text for sentiment analysis of short texts. One of the promises of
deep learning is replacing handcrafted features with efficient algorithms for unsupervised or semi
supervised learning and hierarchical feature extraction [127]. ANN are usually used to address
classification and regression problems and actually apart from sentiment classification is used for
social network classification as well [128]. Noted also that, CNN has recently shown promising
results in capturing word relations of varying size and achieves high performance on question and
sentiment classification without requiring external features as provided by parsers or other resources
[129].
EA’s Genetic Algorithm inspired by the Darwinian struggle for existence, where only the fittest
individuals can survive in nature. It has found application in generating summaries from posts where
only the fittest sentences should be selected. Genetic Algorithm and Swarm Intelligence algorithms
like Ant Colony Algorithms and Artificial Bee Colony are all population-based optimization
algorithms. Ant Colony Algorithm imitates the ants’ network of paths that connects their nests with
the sources of food and Artificial Bee Colony(ABC) is inspired by the behavior of honey bees when
seeking a quality food source. Both of the two have been used in personalized recommender systems
using social media [117][45]. ABC also has recently shown promising results in clustering natural
language morphemes [130].
Understanding that the complex nature of human language isn't a machine understandable one,
researchers should attempt to apply these techniques in the OSNs. We summarize the meager social
media analysis which is done through these techniques in Table 9. Specifically, the table describes:
1. The tools that use CI in social networking data analysis.

Future Generation Computer Systems, 2016, ISSN: 0167-739X
30
2. Specific analysis techniques, their general analysis objective, their algorithms’ inspiration and
the category they belong to.
3. The analysis tasks that the technique handles.
Though, to the best of our knowledge, in TDT weren’t any application of CI.
Table 9 Computational Intelligence in OSN Analysis
Article Technique CI Category Inspiration Analysis Task Objective
[22] Convolutional
Neural Networks
ANN-Deep
Learning
Animal
Visual Cortex
Learn Textual
features Classification
[22]
Deep
Convolutional
Neural Networks
ANN-Deep
Learning
Animal
Visual Cortex
Learn Visual
features Classification
[25] Extreme Learning
Machine
ANN-Single
Hidden Layer
Feedforward NN
Human Mind Learn Facial
Features Classification
[71] Extreme Learning
Machine
ANN-Single
Hidden Layer
Feedforward NN
Human Mind Classify polarity Classification
[71] Extreme Learning
Machine
ANN-Single
Hidden Layer
Feedforward NN
Human Mind
Relate semantic
and affective
features of
concepts
Regression
[40] Genetic
Algorithm EA-Optimization
Evolution
Process
Minimize
dissimilarity
between sentences
Clustering
[45] Ant Colony
Algorithm SI-Optimization
Ant’s Food
and Nests
Network
Minimize
dissimilarity
between venues
that best match to
user preferences
Clustering
[117]
Artificial Bee
Colony
Algorithm
SI-Optimization
Honey Bees
searching
quality food
Minimize
dissimilarity
between learning
materials that best
match to user
query
Clustering
8. Conclusions and Discussions
The emerging paradigm of social networking and big data provides enormous research challenges.
In this paper, we made an effort to organize the most important research lines in social networking
data analysis practices and tools. Recommending items or followees, summarizing opinions and
detecting trends, sentiments and ‘experienced’ users are the common applications offered by these
tools in OSNs. Furthermore, we focused on the analysis approaches and techniques employed to
develop such systems. A synergy of different methods ranging from machine learning, computing
intelligence and centrality analytics to knowledge based and syntax analysis are utilized to achieve a
specific analysis objective; and all overviewed in the context of each framework.
Arguably, processing text at word level, as applied in some of the frameworks, is not a reliable
option. In general, current NLP methods are considered insufficient because they mostly focus on
word co-occurrences frequencies neglecting the complex nature of human language which is certainly
not a set of mere words. Challenges such as the cascade of the semantically related concepts, emotion
like sarcasm, previously unseen words, word ambiguities and syntactic complexities are some
indicators showing that the problem of interpreting human language cannot be translated into binary
language for computers to process it, and a deep understanding of natural language by machines is
needed. Sentic computing, concept level analysis and semantic technologies are new avenues in text
analysis that provide some possible solutions to these problems. The recent and sophisticated

Future Generation Computer Systems, 2016, ISSN: 0167-739X
31
representation of bag of concept model shows favorable results in sentiment analysis because it
integrates the importance of semantic and subjective information in the text.
Adaptability to a changing environment, collective intelligence and dealing with imprecise
information are significant requirements in social networking data analysis. Deep learning and
Computing Intelligence have such inherent characteristics and have shown potential as the basis for
software that could extract the emotions or events described in text even if they aren’t explicitly
referenced, recognize objects in photos, and make sophisticated predictions about people’s likely
future behavior. Feed forward neural networks, evolutionary and swarm intelligence algorithms have
just begun to gain ground in the area.
More robust solutions to all these methods would be provided by integrating many social network
sources; since social networks connect people who expose similar interests, patterns in the content
they share or the relationships they form are differentiated across OSNs. Among them, the Twitter is
by far the most analyzed platform due to its API flexibility. However, a research area that depends on
a single data source, as interesting as it is, entails many risks. A distinct evidence is that, the majority
of the tools and frameworks are based on Twitter; this partially forces future studies to utilize Twitter
as well. Since results and datasets built from and for analysis follow Twitter structure, research is
perpetuating a vicious cycle. The lack of public and open-source datasets, resources, tools and
frameworks restricts the research to step forward. On the one hand, this is quite reasonable since
social networks contains data mostly about people and privacy preserving is yet to be accomplished.
On the other hand, in the rapidly-evolving data economy such data has become the new currency that
only governments and enterprises have the privilege to explore them, provoking in this way the “Data
Democracy” struggling.
Another reason that hinders data analysis in OSN, is the unique discourse structure and data
quality of OSN data. Most researchers have faced enormous difficulties in dealing with the noise of
OSNs and resources that could alleviate this issue (e.g. a large corpus of posted messages to be
publicly available in order to find patterns in informal discourse language) is not yet built. Available
resources are normally trained on corpora of full text documents such as news wire articles, which are
very different from tweets in terms of length and content. For instance, dependency parsers, like the
Stanford Parser, doesn't handle ungrammatical text very well because it is trained on Wall Street
Journal.
Last but not least, considering the data analysis development environment, near real time analysis
via online algorithms scalable in memory and computational resources, is required. Cloud is widely
utilized in data analytics because cloud-oriented processing techniques can meet computational needs
and the performance required in fast extraction of data from social networking sites.
Therefore, extracting insights from social networked data is still far from perfect. After reporting
on the most recent efforts in the area, it is clear that there is a lot of space for improvement towards
this direction. The broader issue is broken into possible high impact research trends for future work
that are given below:
A great challenge that has to be addressed is the lack of public datasets and API’s usability;
social data networking analysis practices and tools that integrate data from different OSN are missing.
Developing resources towards the data scope of social networks that can handle informal text
better is also a current need.
Context-aware analysis methods that identify ambiguous terms which vary in meaning
depending on the context they are expressed, is a compelling research path.
Analysis and results that utilize CI and concept analysis, which are promising but not mature
enough, is another challenging area.
Incorporating topological network structure with content mining is also still in demand.
In the field of TDT, an interest is shaped towards two fields: discovering efficient methods in
detecting fake reviews or detecting conflicts within posts.
A new trend is utilizing cross collaborative recommendation with information across multiple
recommender systems.
Privacy- preserving collaborative filtering (PPCF) in social recommender systems is a recent
challenging topic.

Future Generation Computer Systems, 2016, ISSN: 0167-739X
32
Another recent interest in SA, as in “SemEval 2016” [131] is reported, is moving from a
categorical two/three-point (positive-negative-neutral) scale to an ordered five-point scale, namely
adding highly positive and highly negative as values, which is now ubiquitous in the corporate world
where human ratings are involved like in Amazon, Trip Advisor, and Yelp.
A sub-field of sentiment analysis that is becoming increasingly popular is multimodal
sentiment analysis.
An opinion tagger/classifier that detects opinionated text and no-opinionated isn’t closely
studied.
Opinion evolution and propagation in the OSN and the correlation of edges update [44]
between internal (their friends) and external (public events) factors [64] is also an interesting research
topic.
A considerable effort in analysis techniques and methods is still required to develop efficient and
reliable analysis systems that exploit this rich and continuous flow of user-generated content and
social relations. Social network data collection, preprocessing and analysis still demands a remarkable
collection of tools and skills. It is expected that as social networks sources emerge, social network
analysis and content mining will remain significant and challenging.
References
[1] D. Hansen, B. Shneiderman, and M. A. Smith, Analyzing Social Media Networks with
NodeXL: Insights from a Connected World. Morgan Kaufmann, 2010.
[2] A. (Sandy) Pentland, “REINVENTING SOCIETY IN THE WAKE OF BIG DATA,”
Edge.org, 2016. [Online]. Available: https://www.edge.org/conversation/alex_sandy_pentland-
reinventing-society-in-the-wake-of-big-data. [Accessed: 15-Mar-2016].
[3] EY, “Big data-Changing the way businesses compete and operate,” 2014.
[4] P. Chaudhary, S. Gupta, B. B. Gupta, V. S. Chandra, S. Selvakumar, M. Fire, R.
Goldschmidt, Y. Elovici, B. B. Gupta, S. Gupta, S. Gangwar, M. Kumar, P. K. Meena, S. Gupta, B. B.
Gupta, S. Gupta, and L. Sharma, “Auditing Defense against XSS Worms in Online Social Network-
Based Web Applications,” in Handbook of Research on Modern Cryptographic Solutions for
Computer and Cyber Security, vol. 36, no. 5, IGI Global, 1AD, pp. 216–245.
[5] Z. Mo and Y. Li, “Research of Big Data Based on the Views of Technology and
Application,” Am. J. Ind. Bus. Manag., vol. 05, no. 04, pp. 192–197, Apr. 2015.
[6] P.-W. TAM, “The Government Answers Apple in the iPhone Case - The New York Times,”
The New York Times, 2016. [Online]. Available: http://www.nytimes.com/2016/03/12/technology/the-
government-answers-apple-in-the-iphone-case.html?ribbon-ad-
idx=4&rref=technology&module=Ribbon&version=origin®ion=Header&action=click&contentCo
llection=Technology&pgtype=articleover&_r=0. [Accessed: 15-Mar-2016].
[7] O. Bowcott, “UK-US surveillance regime was unlawful ‘for seven years’ | UK news | The
Guardian,” The Guardian, 2015. [Online]. Available: http://www.theguardian.com/uk-
news/2015/feb/06/gchq-mass-internet-surveillance-unlawful-court-nsa. [Accessed: 15-Mar-2016].
[8] T. Zhu, Y. Ren, W. Zhou, J. Rong, and P. Xiong, “An effective privacy preserving algorithm
for neighborhood-based collaborative filtering,” Futur. Gener. Comput. Syst., vol. 36, pp. 142–155,
2014.
[9] D. Li, C. Chen, Q. Lv, L. Shang, Y. Zhao, T. Lu, and N. Gu, “An algorithm for efficient
privacy-preserving item-based collaborative filtering,” Futur. Gener. Comput. Syst., vol. 55, pp. 311–
320, 2016.
[10] W. Chang, J. Wu, L. M. Aiello, A. Barrat, R. Schifanella, C. Cattuto, B. Markines, F.
Menczer, A. Blum, K. Ligett, A. Roth, C. Dwork, S. Kisilevich, L. Rokach, Y. Elovici, B. Shapira, Y.
Li, M. Chen, Q. Li, W. Zhang, J. Lin, A. Machanavajjhala, D. Kifer, J. Gehrke, M.
Venkitasubramaniam, P. Samarati, L. Sweeney, and L. Sweeney, “A New View of Privacy in Social
Networks:,” in Handbook of Research on Modern Cryptographic Solutions for Computer and Cyber
Security, vol. 6, no. 2, IGI Global, 1AD, pp. 28–51.
[11] K. Ghazinour, S. Matwin, and M. Sokolova, “YOURPRIVACYPROTECTOR, A
recommender system for privacy settings in social networks,” Int. J. Secur. Priv. Trust Manag., vol. 2,
Future Generation Computer Systems, 2016, ISSN: 0167-739X
33
no. 4, 2016.
[12] S. Kaisler, F. Armour, J. A. Espinosa, and W. Money, “Big Data: Issues and Challenges
Moving Forward,” in 2013 46th Hawaii International Conference on System Sciences, 2013, pp. 995–
1004.
[13] C. C. Aggarwal, Ed., Social Network Data Analytics. Boston, MA: Springer US, 2011.
[14] A. Gandomi and M. Haider, “Beyond the hype: Big data concepts, methods, and analytics,”
Int. J. Inf. Manage., vol. 35, no. 2, pp. 137–144, Apr. 2015.
[15] N. Siddique and H. Adeli, “Introduction to Computational Intelligence,” in Computational
Intelligence: Synergies of Fuzzy Logic, Neural Networks and Evolutionary Computing, Oxford, UK:
John Wiley & Sons Ltd, 2013, pp. 1–17.
[16] E. Cambria and A. Hussain, “Introduction,” in Sentic Computing, Cham: Springer
International Publishing, 2015, pp. 1–21.
[17] C. Metz, “AI is transforming Google search. The rest of the web is next.,” WIRED, 2016.
[18] E. Davis and G. Marcus, “Commonsense reasoning and commonsense knowledge in artificial
intelligence,” Commun. ACM, vol. 58, no. 9, pp. 92–103, Aug. 2015.
[19] J. Clark, “Google Sprints Ahead in AI Building Blocks, Leaving Rivals Wary - Bloomberg,”
Bloomberg, 2016. [Online]. Available: http://www.bloomberg.com/news/articles/2016-07-21/google-
sprints-ahead-in-ai-building-blocks-leaving-rivals-wary.
[20] D. Amodei, C. Olah, J. Steinhardt, P. Christiano, J. Schulman, and D. Mané, “Concrete
Problems in AI Safety,” Jun. 2016.
[21] F. Jiang, S. Rho, B.-W. Chen, X. Du, and D. Zhao, “Face hallucination and recognition in
social network services,” J. Supercomput., vol. 71, no. 6, pp. 2035–2049, Jun. 2015.
[22] Y. Yu, H. Lin, J. Meng, and Z. Zhao, “Visual and Textual Sentiment Analysis of a Microblog
Using Deep Convolutional Neural Networks,” Algorithms, vol. 9, no. 2, p. 41, Jun. 2016.
[23] K. N. Vavliakis, F. A. Tzima, and P. A. Mitkas, “Event Detection via LDA for the
MediaEval2012 SED Task.” MediaEval 2012 Workshop, 2012.
[24] S. Papadopoulos, R. Troncy, V. Mezaris, B. Huet, and I. Kompatsiaris, “Social Event
Detection at MediaEval 2011: Challenges, Dataset and Evaluation.” MediaEval 2011 Workshop,
2011.
[25] S. Poria, E. Cambria, N. Howard, G.-B. Huang, and A. Hussain, “Fusing audio, visual and
textual clues for sentiment analysis from multimodal content,” Neurocomputing, vol. 174, pp. 50–59,
2016.
[26] X. Hu, L. Tang, J. Tang, and H. Liu, “Exploiting social relations for sentiment analysis in
microblogging,” in Proceedings of the sixth ACM international conference on Web search and data
mining - WSDM ’13, 2013, p. 537.
[27] D. B. Kurka, A. Godoy, and F. J. Von Zuben, “Online Social Network Analysis: A Survey of
Research Applications in Computer Science,” Apr. 2015.
[28] R. Kaushik, S. Apoorva Chandra, D. Mallya, J. N. V. K. Chaitanya, and S. S. Kamath,
“Sociopedia: An Interactive System for Event Detection and Trend Analysis for Twitter Data,”
Springer India, 2016, pp. 63–70.
[29] H. Mackay, “Information and the transformation of sociology: interactivity and social media
monitoring,” Commun. Capital. Crit., vol. 11, no. 1, pp. 117–126, 2013.
[30] L. Cagliero and A. Fiori, “TweCoM: Topic and Context Mining from Twitter,” Springer
Vienna, 2013, pp. 75–100.
[31] F. Bonchi, C. Castillo, A. Gionis, and A. Jaimes, “Social Network Analysis and Mining for
Business Applications,” ACM Trans. Intell. Syst. Technol. Artic., vol. 2, no. 22, 2011.
[32] H. Chen, X. Cui, and H. Jin, “Top-k followee recommendation over microblogging systems
by exploiting diverse information sources,” Futur. Gener. Comput. Syst., vol. 55, pp. 534–543, 2016.
[33] J. He and W. W. Chu, “A Social Network-Based Recommender System (SNRS),” Springer
US, 2010, pp. 47–74.
[34] M. Adedoyin-Olowe, M. M. Gaber, and F. Stahl, “A Survey of Data Mining Techniques for
Social Network Analysis,” J. Data Min. Digit. Humanit., 2014.
[35] K. Thiel, T. Kötter, B. Michael, R. Silipo, and P. Winters, “Creating Usable Customer
Intelligence from Social Media Data: Network Analytics meets Text Mining,” 2012.
[36] M. E. J. Newman, “The Structure and Function of Complex Networks,” SIAM Rev., vol. 45,

Future Generation Computer Systems, 2016, ISSN: 0167-739X
34
no. 2, pp. 167–256, Jan. 2003.
[37] E. D. Kolaczyk and G. Csárdi, Statistical Analysis of Network Data with R. Springer, 2014.
[38] R. A. Hanneman and M. Riddle, Introduction to Social Network Methods. 2005.
[39] E. Bakshy, I. Rosenn, C. Marlow, and L. Adamic, “The role of social networks in information
diffusion,” in Proceedings of the 21st international conference on World Wide Web - WWW ’12,
2012, p. 519.
[40] S. Prom-on, S. N. Ranong, P. Jenviriyakul, T. Wongkaew, N. Saetiew, and T. Achalakul,
“DOM: A big data analytics framework for mining Thai public opinions,” in Big Data: Principles and
Paradigms, R. Buyya, Ed. Morgan Kaufmann, 2016, pp. 339–355.
[41] Y.-M. Li and T.-Y. Li, “Deriving market intelligence from microblogs,” Decis. Support Syst.,
vol. 55, no. 1, pp. 206–217, 2013.
[42] D. Saez-Trumper, G. Comarela, V. Almeida, R. Baeza-Yates, and F. Benevenuto, “Finding
trendsetters in information networks,” in Proceedings of the 18th ACM SIGKDD international
conference on Knowledge discovery and data mining - KDD ’12, 2012, p. 1014.
[43] S. Agreste, P. De Meo, E. Ferrara, S. Piccolo, and A. Provetti, “Trust Networks: Topology,
Dynamics, and Measurements,” IEEE Internet Comput., vol. 19, no. 6, pp. 26–35, Nov. 2015.
[44] G. Kossinets and D. J. Watts, “Empirical Analysis of an Evolving Social Network,” Science
(80-. )., vol. 311, no. 5757, pp. 88–90, 2006.
[45] O. Khalid, M. U. S. Khan, S. U. Khan, and A. Y. Zomaya, “OmniSuggest: A Ubiquitous
Cloud-Based Context-Aware Recommendation System for Mobile Social Networks,” IEEE Trans.
Serv. Comput., vol. 7, no. 3, 2014.
[46] D. Zhou, L. Chen, and Y. He, “An unsupervised framework of exploring events on twitter:
filtering, extraction and categorization,” in Proceedings of the Twenty-Ninth AAAI Conference on
Artificial Intelligence, 2015.
[47] M. Fire, L. Tenenboim-Chekina, R. Puzis, O. Lesser, L. Rokach, and Y. Elovici,
“Computationally efficient link prediction in a variety of social networks,” ACM Trans. Intell. Syst.
Technol., vol. 5, no. 1, pp. 1–25, Dec. 2013.
[48] E. David and K. Jon, “Networks, Crowds, and Markets: Reasoning About a Highly
Connected World,” Jul. 2010.
[49] R. Alhajj and J. Rokne, Eds., Encyclopedia of Social Network Analysis and Mining. New
York, NY: Springer New York, 2014.
[50] A. McCranie, “Dyads and Triads, Reciprocity and Transitivity,” Interuniversity Consortium
for Political and Social Research (ICPSR) University of Michigan, 2015. .
[51] D. Wu, D. Schaefer, and D. W. Rosen, “Cloud-based design and manufacturing systems: A
social network analysis,” in ICED13: 19th International Conference on Engineering Design, 2013.
[52] D. Shah and T. Zaman, “Community Detection in Networks: The Leader-Follower
Algorithm,” Nov. 2010.
[53] A. Vakali, M. Giatsoglou, and S. Antaris, “Social networking trends and dynamics detection
via a cloud-based framework design,” in Proceedings of the 21st international conference companion
on World Wide Web - WWW ’12 Companion, 2012, p. 1213.
[54] A. Mislove, B. Viswanath, K. P. Gummadi, and P. Druschel, “You are who you know,” in
Proceedings of the third ACM international conference on Web search and data mining - WSDM ’10,
2010, p. 251.
[55] M. Tanwar, R. Duggal, and S. K. Khatri, “Unravelling unstructured data: A wealth of
information in big data,” in 2015 4th International Conference on Reliability, Infocom Technologies
and Optimization (ICRITO) (Trends and Future Directions), 2015, pp. 1–6.
[56] C.-W. Tsai, C.-F. Lai, H.-C. Chao, and A. V. Vasilakos, “Big data analytics: a survey,” J. Big
Data, vol. 2, no. 1, p. 21, Oct. 2015.
[57] C. D. Manning, P. Raghavan, and H. Schütze, “Scoring, term weighting and the vector space
model,” in Introduction to Information Retrieval, Cambridge University Press, 2009.
[58] O. Peled, M. Fire, L. Rokach, and Y. Elovici, “Matching Entities Across Online Social
Networks,” Oct. 2014.
[59] E. Cambria and B. White, “Jumping NLP Curves: A Review of Natural Language Processing
Research [Review Article],” IEEE Comput. Intell. Mag., vol. 9, no. 2, pp. 48–57, May 2014.
[60] “WordNet.” 2005.

Future Generation Computer Systems, 2016, ISSN: 0167-739X
35
[61] E. Kontopoulos, C. Berberidis, T. Dergiades, and N. Bassiliades, “Ontology-based sentiment
analysis of twitter posts,” Expert Syst. Appl., vol. 40, no. 10, pp. 4065–4074, 2013.
[62] Z. Fu, K. Ren, J. Shu, X. Sun, and F. Huang, “Enabling Personalized Search over Encrypted
Outsourced Data with Efficiency Improvement,” IEEE Trans. Parallel Distrib. Syst., vol. 27, no. 9,
pp. 2546–2559, Sep. 2016.
[63] S. Mithun, C. Mulligan, G. Lapalme, N. Bouguila, S. Bergler, G. Butler, and L. Kosseim,
“EXPLOITING RHETORICAL RELATIONS IN BLOG SUMMARIZATION,” Concordia
University, 2012.
[64] N. Panagiotou, I. Katakis, and D. Gunopulos, Detecting Events in Online Social Networks:
Definitions, Trends and Challenges. 2016.
[65] Z. FU, X. SUN, Q. LIU, L. ZHOU, and J. SHU, “Achieving Efficient Cloud Search Services:
Multi-Keyword Ranked Search over Encrypted Cloud Data Supporting Parallel Computing,” IEICE
Trans. Commun., vol. E98-B, no. 1, pp. 190–200, 2015.
[66] “Elasticsearch Theory Behind Relevance Scoring,” 2016. [Online]. Available:
https://www.elastic.co/guide/en/elasticsearch/guide/current/scoring-theory.html.
[67] “WordNet Affect.” 2009.
[68] “SentiWordNet.” 2010.
[69] E. Cambria, A. Hussain, C. Havasi, and C. Eckl, “Sentic Computing: Exploitation of
Common Sense for the Development of Emotion-Sensitive Systems,” in Proceedings of the Second
international conference on Development of Multimodal Interfaces: active Listening and Synchrony,
Springer-Verlag, 2010, pp. 148–156.
[70] “MPQA.” 2005.
[71] S. Poria, E. Cambria, G. Winterstein, and G.-B. Huang, “Sentic patterns: Dependency-based
rules for concept-level sentiment analysis,” Knowledge-Based Syst., vol. 69, pp. 45–63, 2014.
[72] B. Liu and L. Zhang, “A Survey of Opinion Mining and Sentiment Analysis,” in Mining Text
Data, Boston, MA: Springer US, 2012, pp. 415–463.
[73] K. Schouten and F. Frasincar, “Survey on Aspect-Level Sentiment Analysis,” IEEE Trans.
Knowl. Data Eng., vol. 28, no. 3, pp. 813–830, Mar. 2016.
[74] F. Atefeh and W. Khreich, “A Survey of Techniques for Event Detection in Twitter,”
Comput. Intell., vol. 31, no. 1, pp. 132–164, Feb. 2015.
[75] X. Yang, B. Pan, J. A. Evans, and B. Lv, “Forecasting Chinese tourist volume with search
engine data,” Tour. Manag., vol. 46, pp. 386–397, 2015.
[76] X. Zou, W. Zhu, L. Yang, and Y. Shu, “[Google Flu Trends--the initial application of big data
in public health].,” Zhonghua Yu Fang Yi Xue Za Zhi, vol. 49, no. 6, pp. 581–4, Jun. 2015.
[77] S. Rill, D. Reinel, J. Scheidt, and R. V. Zicari, “PoliTwi: Early detection of emerging political
topics on twitter and the impact on concept-level sentiment analysis,” Knowledge-Based Syst., vol. 69,
pp. 24–33, 2014.
[78] S. A. Myers, A. Sharma, P. Gupta, and J. Lin, “Information network or social network?,” in
Proceedings of the 23rd International Conference on World Wide Web - WWW ’14 Companion, 2014,
pp. 493–498.
[79] M. Mathioudakis and N. Koudas, “TwitterMonitor,” in Proceedings of the 2010 international
conference on Management of data - SIGMOD ’10, 2010, p. 1155.
[80] T. MA, J. ZHOU, M. TANG, Y. TIAN, A. AL-DHELAAN, M. AL-RODHAAN, and S.
LEE, “Social Network and Tag Sources Based Augmenting Collaborative Recommender System,”
IEICE Trans. Inf. Syst., vol. E98-D, no. 4, pp. 902–910, 2015.
[81] F. Ricci, L. Rokach, and B. Shapira, “Introduction to Recommender Systems Handbook,” in
Recommender Systems Handbook, Boston, MA: Springer US, 2011, pp. 1–35.
[82] X. Yang, Y. Guo, Y. Liu, and H. Steck, “A survey of collaborative filtering based social
recommender systems,” Comput. Commun., vol. 41, pp. 1–10, 2014.
[83] A. Sieg, B. Mobasher, and R. Burke, “Improving the effectiveness of collaborative
recommendation with ontology-based user profiles,” in Proceedings of the 1st International
Workshop on Information Heterogeneity and Fusion in Recommender Systems - HetRec ’10, 2010,
pp. 39–46.
[84] “Querying Social Media with NodeXL.” [Online]. Available:
http://scalar.usc.edu/works/querying-social-media-with-nodexl/what-is-social-media?path=index.

Future Generation Computer Systems, 2016, ISSN: 0167-739X
36
[Accessed: 30-Apr-2016].
[85] H. Agrawal, A. Thakur, and R. Slathia, “A Comparative Analysis of Social Networking
Analysis Tools,” J. Inf. Technol. Softw. Eng., vol. 05, no. 03, Oct. 2015.
[86] N. Akhtar, “Social Network Analysis Tools,” in 2014 Fourth International Conference on
Communication Systems and Network Technologies, 2014, pp. 388–392.
[87] M. Huisman and M. A. Van Duijn, “Software for Social Network Analysis,” in Models and
Methods in Social Network Analysis, Cambridge University Press, 2005, pp. 270–316.
[88] H. Kennedy, G. Moss, C. Birchall, and S. Moshonas, “Digital Data Analysis: Guide to tools
for social media & web analytics and insights,” 2013.
[89] M. A. Smith, “NodeXL: Simple network analysis for social media,” in 2013 International
Conference on Collaboration Technologies and Systems (CTS), 2013, pp. 89–93.
[90] M. A. Smith, B. Shneiderman, N. Milic-Frayling, E. Mendes Rodrigues, V. Barash, C.
Dunne, T. Capone, A. Perer, and E. Gleave, “Analyzing (social media) networks with NodeXL,” in
Proceedings of the fourth international conference on Communities and technologies - C&T ’09,
2009, p. 255.
[91] C. L. Staudt, A. Sazonovs, and H. Meyerhenke, “NetworKit: A Tool Suite for Large-scale
Complex Network Analysis,” p. 21, Mar. 2014.
[92] A. Mrvar and V. Batagelj, “Analysis and visualization of large networks with program
package Pajek,” Complex Adapt. Syst. Model., vol. 4, no. 1, p. 6, Apr. 2016.
[93] M. S. Handcock, D. R. Hunter, C. T. Butts, S. M. Goodreau, and M. Morris, “statnet:
Software Tools for the Representation, Visualization, Analysis and Simulation of Network Data.,” J.
Stat. Softw., vol. 24, no. 1, pp. 1548–7660, 2008.
[94] “Gephi Network Statistics.” [Online]. Available: http://web.ecs.syr.edu/~pjmcswee/gephi.pdf.
[Accessed: 25-Apr-2016].
[95] S. Heymann and B. Le Grand, “Visual Analysis of Complex Networks for Business
Intelligence with Gephi,” in 2013 17th International Conference on Information Visualisation, 2013,
pp. 307–312.
[96] B. W. Wambeke, M. Liu, and S. M. Hsiang, “Using Pajek and Centrality Analysis to Identify
a Social Network of Construction Trades,” J. Constr. Eng. Manag., vol. 138, no. 10, pp. 1192–1201,
Oct. 2012.
[97] “Semantic plugin: AlchemyAPI | Gephi blog on WordPress.com.” [Online]. Available:
https://gephi.wordpress.com/2010/08/10/semantic-plugin-alchemyapi/. [Accessed: 01-May-2016].
[98] K. Cherven, Network Graph Analysis and Visualization with Gephi. Packt Publishing Ltd,
2013.
[99] “Gephi Toolkit.” [Online]. Available: https://gephi.org/toolkit/. [Accessed: 09-May-2016].
[100] “NodeXL: Network Overview, Discovery and Exploration for Excel - Download:
NodeXL Basic Excel Template 2014.” .
[101] “ NetworKit.” [Online]. Available: https://networkit.iti.kit.edu/features/. [Accessed:
02-May-2016].
[102] B. Grün, “Mixture Models in Text Mining— Tools in R Bag-of-Words Models.”
Joannes Kepler University Linz, 2012.
[103] C. T. Butts, “Package ‘sna.’” 2016.
[104] “Pajek and Pajek-XXL Programs for Analysis and Visualization of Very Large
Networks.” [Online]. Available: http://mrvar.fdv.uni-lj.si/pajek/pajekman.pdf. [Accessed: 23-Apr-
2016].
[105] J. Sankaranarayanan, H. Samet, B. E. Teitler, M. D. Lieberman, and J. Sperling,
“TwitterStand,” in Proceedings of the 17th ACM SIGSPATIAL International Conference on Advances
in Geographic Information Systems - GIS ’09, 2009, p. 42.
[106] D. T. Nguyen and J. E. Jung, “Real-time event detection for online behavioral
analysis of big social data,” Futur. Gener. Comput. Syst., 2016.
[107] A. Ritter, Mausam, O. Etzioni, and S. Clark, “Open domain event extraction from
twitter,” in Proceedings of the 18th ACM SIGKDD international conference on Knowledge discovery
and data mining - KDD ’12, 2012, p. 1104.
[108] Q. Wang, J. She, T. Song, Y. Tong, L. Chen, and K. Xu, “Adjustable Time-Window-
Based Event Detection on Twitter,” Springer International Publishing, 2016, pp. 265–278.

Future Generation Computer Systems, 2016, ISSN: 0167-739X
37
[109] W. Medhat, A. Hassan, and H. Korashy, “Sentiment analysis algorithms and
applications: A survey,” Ain Shams Eng. J., vol. 5, no. 4, pp. 1093–1113, 2014.
[110] Lj. Sheela, “A Review of Sentiment Analysis in Twitter Data Using Hadoop,” Int. J.
Database Theory Appl., vol. 9, no. 1, pp. 77–86, 2016.
[111] “SenticNet.” 2009.
[112] S. Mithun, “Exploiting Rhetorical Relations in Blog Summarization,” in Advances in
Artificial Intelligence, Springer Berlin Heidelberg, 2010, pp. 388–392.
[113] “word2vec.” 2013.
[114] Á. Cuesta, D. F. . Barrero, and M. D. R-Moreno, “A FRAMEWORK FOR
MASSIVE TWITTER DATA EXTRACTION AND ANALYSIS,” Malaysian J. Comput. Sci., vol.
27, no. 1, p. 50, 2014.
[115] A. Minanovic, H. Gabelica, and Z. Krstic, “Big data and sentiment analysis using
KNIME: Online reviews vs. social media,” in 2014 37th International Convention on Information and
Communication Technology, Electronics and Microelectronics (MIPRO), 2014, pp. 1464–1468.
[116] A. Abbas, L. Zhang, and S. U. Khan, “A survey on context-aware recommender
systems based on computational intelligence techniques,” Computing, vol. 97, no. 7, pp. 667–690, Jul.
2015.
[117] C.-C. Hsu, H.-C. Chen, K.-K. Huang, and Y.-M. Huang, “A personalized auxiliary
material recommendation system based on learning style on Facebook applying an artificial bee
colony algorithm,” Comput. Math. with Appl., vol. 64, no. 5, pp. 1506–1513, 2012.
[118] Z. Sun, L. Han, W. Huang, X. Wang, X. Zeng, M. Wang, and H. Yan,
“Recommender systems based on social networks,” J. Syst. Softw., vol. 99, pp. 109–119, 2015.
[119] F. Frasincar, W. IJntema, F. Goossen, F. Hogenboom, G. Adomavicius, A. Tuzhilin,
D. W. Aha, D. Kibler, M. K. Albert, C. Buckley, J. Allan, G. Salton, C. C. Chen, M. C. Chen, F.
Frasincar, J. Borsje, L. Levering, P. Jaccard, H. P. Luhn, S. E. Middleton, N. R. Shadbolt, D. C. De
Roure, B. Pang, L. Lee, G. Salton, C. Buckley, A. Singhal, G. Salton, M. Mitra, and C. Buckley, “A
Semantic Approach for News Recommendation,” in Business Intelligence Applications and the Web,
vol. 17, no. 6, IGI Global, 1AD, pp. 102–121.
[120] C. Musto, G. Semeraro, and M. Polignano, “A comparison of Lexicon-based
approaches for Sentiment Analysis of microblog posts,” in Proceedings of the 8th International
Workshop on Information Filtering and Retrieval Workshop of the XIII AI*IA Symposium on Artificial
Intelligence, 2014, pp. 59–68.
[121] C. Lin and Y. He, “Joint sentiment/topic model for sentiment analysis,” in
Proceeding of the 18th ACM conference on Information and knowledge management - CIKM ’09,
2009, p. 375.
[122] R. Moraes, J. F. Valiati, and W. P. Gavião Neto, “Document-level sentiment
classification: An empirical comparison between SVM and ANN,” Expert Syst. Appl., vol. 40, no. 2,
pp. 621–633, 2013.
[123] M. M. Najafabadi, F. Villanustre, T. M. Khoshgoftaar, N. Seliya, R. Wald, and E.
Muharemagic, “Deep learning applications and challenges in big data analytics,” J. Big Data, vol. 2,
no. 1, p. 1, Dec. 2015.
[124] E. Cambria, B. Schuller, Y. Xia, and C. Havasi, “New Avenues in Opinion Mining
and Sentiment Analysis,” IEEE Intell. Syst., vol. 28, no. 2, pp. 15–21, Mar. 2013.
[125] M. Taboada, J. Brooke, M. Tofiloski, K. Voll, and M. Stede, “Lexicon-Based
Methods for Sentiment Analysis,” Comput. Linguist., vol. 37, no. 2, pp. 267–307, Jun. 2011.
[126] T. Rambharose and A. Nikov, “Computational intelligence-based personalization of
interactive web systems,” WSEAS Trans. Inf. Sci. Appl., vol. 7, no. 4, pp. 484–497, 2010.
[127] H. Fu, Z. Niu, C. Zhang, J. Ma, and J. Chen, “Visual Cortex Inspired CNN Model for
Feature Construction in Text Analysis,” Front. Comput. Neurosci., vol. 10, p. 64, Jul. 2016.
[128] B. Perozzi, R. Al-Rfou, and S. Skiena, “DeepWalk,” in Proceedings of the 20th ACM
SIGKDD international conference on Knowledge discovery and data mining - KDD ’14, 2014, pp.
701–710.
[129] N. Kalchbrenner, E. Grefenstette, and P. Blunsom, “A Convolutional Neural Network
for Modelling Sentences,” in Proceedings of the 52nd Annual Meeting of the Association for
Computational Linguistics, 2014, pp. 655–665.

Future Generation Computer Systems, 2016, ISSN: 0167-739X
38
[130] S. Sulaiman, S. A. Yahya, N. S. M. Shukor, A. R. Ismail, Q. Zaahirah, H. Yaacob, A.
W. A. Rahman, and M. A. Dzulkifli, “Clustering Natural Language Morphemes from EEG Signals
Using the Artificial Bee Colony Algorithm,” Springer International Publishing, 2015, pp. 51–60.
[131] P. Nakov, A. Ritter, S. Rosenthal, F. Sebastiani, and V. Stoyanov, “SemEval-2016
Task 4: Sentiment Analysis in Twitter,” 2016.
Androniki Sapountzi is currently a postgraduate student in Information Systems at the University of Macedonia, Thessaloniki,
Greece.. Her research interests include natural language processing, machine learning, sentiment analysis and big data analytics.
Email: [email protected]
Kostas E. Psannis was born in Thessaloniki, Greece. Kostas received a degree in Physics from Aristotle University of Thessaloniki
(Greece), and the Ph.D. degree from the Department of Electronic and Computer Engineering of Brunel University (UK). From 2001 to
2002 he was awarded the British Chevening scholarship sponsored by the Foreign & Commonwealth Office (FCO), British Government. He
was awarded, in the year 2006, a research grant by IISF (Grant No. 2006.1.3.916). Since 2004 he has been a (Visiting) Assistant Professor in
the Department of Applied Informatics, University of Macedonia, Greece, where currently he is Assistant Professor (& Departmental
LLP/Erasmus-Exchange Students Coordinator and Higher Education Mentor) in the Department of Applied Informatics, School of
Information Sciences. He is also joint Researcher in the Department of Scientific and Engineering Simulation, Graduate School of
Engineering, Nagoya Institute of Technology, Japan. He has extensive research, development, and consulting experience in the area of
telecommunications technologies. Since 1999 he has participated in several R&D funded projects in the area of ICT (EU and JAPAN).
Kostas Psannis was invited to speak on the EU-Japan Co-ordinated Call Preparatory meeting, Green & Content Centric Networking (CCN),
organized by European Commission (EC) and National Institute of Information and Communications Technology (NICT)/ Ministry of
Internal Affairs and Communications (MIC), Japan (in the context of the upcoming ICT Work Programme 2013) and International
Telecommunication Union (ITU) SG13 meeting on DAN/CCN, July 2012, amongst other invited speakers. He has several publications in
international Conferences, books chapters and peer reviewed journals. His professional interests are: Multimodal Data Communications
Systems, Haptic Communication between Humans and Robots, Cloud Transmission/Streaming/Synchronization, Future Media- Internet of
Things, Experiments on International Connections (E-ICONS) over TEIN3 (Pan-Asian), Science Information Network (SINET, Japan),
GRNET (Greece)-Okeanos Cloud, and GEANT (European Union) dedicated high capacity connectivity. He is Guest Editor for the Special
Issue on Architectures and Algorithms of High Efficiency Video Coding (HEVC) Standard for Real‐ Time Video Applications (2014),
Journal of Real Time Image Processing (Special Issue). He is Guest Editor for the Special Issue on Emerging Multimedia Technology for
Smart Surveillance System with IoT Environment (2016), The Journal of Supercomputing (Special Issue). He is Guest Editor for the Special
Issue on Emerging Multimedia Technology for Multimedia-centric Internet of Things (mm-IoT) (2016), Multimedia Tools and Applications
(Special Issue). He is currently GOLD member committee of IEEE Broadcast Technology Society (BTS) and a member of the IEEE
Industrial Electronics Society (IES). He is also a member of the European Commission (EC) EURAXESS Links JAPAN and member of the
EU-JAPAN Centre for Industrial Cooperation.
Email: [email protected] Phone: +30 2310 891737,
Mobility2Net - EU-JAPAN LAB
http://users.uom.gr/~kpsannis/