Social Network Analysis - Psychnology
34
PsychNology Journal, 2006 Volume 4, Number 1, pp. 53 – 86 Social Network Analysis: A brief theoretical review and further perspectives in the study of Information Technology Francesco Martino ♦♣ Andrea Spoto ♦ ♦ HTLAB, Dept. of General Psychology, University of Padova (Italy) ABSTRACT Social Network Analysis is a widely used approach in psychology, as in social science, economics and other fields. The peculiarity of this perspective is that it focuses not on individuals or other social units, but on the relationship between them. In this paper, our aim is to give a general review of this perspective, giving a description of resources and principal topics covered by Social Network Analysis. In the first section, we will concentrate on methodological and formal perspectives of analysis. In the last section, we will introduce some recent studies about Social Network and its relationship with Information Technologies, in particular on the Internet. Lastly, we will show how this approach can be useful to study some aspects of the web. Keywords: Social Network Analysis, Social Web, blogosphere, social network indexes, social quantitative indexes, hyperlinking networks, roles algebra, Computer Mediated Communication. Paper Received 15/04/2006; received in revised form 28/05/2006; accepted 31/05/2006 1. Introduction Every kind of social aggregation can be represented in terms of units composing this aggregation and relations between these units. This kind of representation of a social structure is called “Social Network”. In a social network, every unit, usually called “social actor” (a person, a group, an organization, a nation, a blog and so on), is represented as a node. A relation is represented as a linkage or a flow between these units. The set of possible relations is potentially infinite; the term relation can have many different meaning: acquaintance, kinship, evaluation of another person, the need ♣ Corresponding author: Francesco Martino HTLab, Dip. di Psicologia Generale, Università di Padova. Via Venezia 8, 35131 Padova (Italy) E-mail: [email protected] 53
Transcript of Social Network Analysis - Psychnology

PsychNology Journal, 2006 Volume 4, Number 1, pp. 53 – 86
Social Network Analysis: A brief theoretical review and further perspectives in the
study of Information Technology
Francesco Martino ♦♣ Andrea Spoto ♦
♦HTLAB, Dept. of General Psychology,
University of Padova (Italy)
ABSTRACT
Social Network Analysis is a widely used approach in psychology, as in social science, economics and other fields. The peculiarity of this perspective is that it focuses not on individuals or other social units, but on the relationship between them. In this paper, our aim is to give a general review of this perspective, giving a description of resources and principal topics covered by Social Network Analysis. In the first section, we will concentrate on methodological and formal perspectives of analysis. In the last section, we will introduce some recent studies about Social Network and its relationship with Information Technologies, in particular on the Internet. Lastly, we will show how this approach can be useful to study some aspects of the web. Keywords: Social Network Analysis, Social Web, blogosphere, social network indexes, social quantitative indexes, hyperlinking networks, roles algebra, Computer Mediated Communication. Paper Received 15/04/2006; received in revised form 28/05/2006; accepted 31/05/2006
1. Introduction
Every kind of social aggregation can be represented in terms of units composing this
aggregation and relations between these units. This kind of representation of a social
structure is called “Social Network”. In a social network, every unit, usually called
“social actor” (a person, a group, an organization, a nation, a blog and so on), is
represented as a node. A relation is represented as a linkage or a flow between these
units. The set of possible relations is potentially infinite; the term relation can have
many different meaning: acquaintance, kinship, evaluation of another person, the need
♣ Corresponding author: Francesco Martino HTLab, Dip. di Psicologia Generale, Università di Padova. Via Venezia 8, 35131 Padova (Italy) E-mail: [email protected]
53

F. Martino, A. Spoto
of a commercial exchange, physical connections, the presence in a web-page of a link
to another page and so on.
Therefore, the objects under observation are not individuals and their attributes, but
the relationships between individuals and their structure. The advantage of such a
representation is that it permits the analysis of social processes as a product of the
relationships among social entities.
In Social Network Analysis we can study two different kinds of variables: structural
and composition. Variables of the first type are the most important in this field because
they represent the different kinds of ties between social actors (friendship, trust and so
on). The composition variables can be seen as actors’ attributes. To make a deeper
attribute analysis we suggest the use of more sophisticated formal theories, like Formal
Concept Analysis (Wille, 1982).
2. Main characteristics
2.1. Social Network Analysis history According to Scott (1991), there are three main research lines about Social Network
Analysis, lead respectively by:
• Sociometric Analysts, who mainly used and developed graph theory;
• Harvard researchers, who in a first moment studied models of interpersonal
relationship and cliques formation, and after 1970 developed algebraic models of
SNA;
• The anthropologist part of the school of Manchester, who studied relational
structures characterizing tribal society community.
There is a general agreement about the origins of the Social Network Analysis: the
first studies were realized by Jacob Moreno (1889-1974) on “sociometric” (1934) and
by Fritz Heider (1896-1988) on the triad equilibrium analysis (1946). In recent times,
some authors have criticized this idea, marking how the concept of Social Network was
developed before the famous Moreno study (Freeman, 1992).
These ideas were first developed by Frank Harary (1921-2005) and Dorwin
Cartwright (-1988) which, using methods from the newborn graph theory (König, 1936),
found a powerful formal tool for social structures analysis (Cartwright & Harary, 1956;
Harary, Norman & Cartwright, 1965). According mainly to Heider theories, Harary and
54
Social Network Analysis and IT
coll. studied an extension to a more complex case of structural balancing (i.e. an
application of the notion of equilibrium to groups with more than three elements). The
base theory was to decompose a graph (a group) in different subgraphs (subgroups),
in order to analyze relationships and balancing between and within groups: every
balanced graph can be divided in subgroups with positive internal relations and
negative external relations.
Around the Thirties and Forties, some Harvard researchers dedicated their attention
mainly to the search for decomposition and exploration methods of blocks or structures
composing a graph, and their informal relations. In particular, the two leaders of the
movement were W. Lloyd Warner (1898-1970) and Eltan Mayo (1880-1949), who
started several researches about Chicago’s central plant “Hawthorne”, employed
working conditions and about New England’s communities. The originality of their
studies consisted of the large usage of sociograms (Mayo, 1945), and the introduction
of the concept of “clique” as “intimal not-parental group” (Warner, Lunt, 1941). We must
say that this notion of clique is different from the sociometric meaning typical of graph
theory, which we will discuss in section 3.2: Warner described a clique as some kind of
“social set” (Scott, 1991).
Moreno’s sociometry and Warner and Mayo’s theories were unified by a Harvard
professor, George Homans (1910-1989), who thought sociometry to be a good and
valid foundation for social analysis (Homans, 1951).
A new and fundamental development in SNA was due to researchers from
Manchester University Department of Social Anthropology. Manchester researchers
pointed their attention at the effective configuration of relationships deriving from power
and conflict between individuals, instead of set up norms and institutions of a society
(Scott, 1993). John Barnes (1918- ), who first introduced the term “Social network”
(Barnes, 1954), gave life to a remarkable formal development of the analysis of social
structures. Developing Barnes and colleagues’ ideas, Siegfried Nadel (1903-1956)
began his fundamental works, underlying the importance of a structural analysis rather
than a contents analysis (Nadel, 1957). The main topic of his works, unfortunately
interrupted by his premature death, was the notion of “role”, considered as the
foundation of social life, and defined by the interrelation of independent networks.
Nadel also suggested the utility of algebraic tools for role analysis; although he had no
opportunities to develop such a proposal, we must say that this kind of approach is
central and of great influence in current studies (Pattison, 1993).
55

F. Martino, A. Spoto
Nadel’s ideas were pursued by Clyde Mitchell (1918-1995), which introduced the
difference between total network and ego-centred or local network (see section 2).
Mitchell’s analysis is important because of the reflection about some social indexes
(as density, see section 3.2) and their meaning in the description of a network too.
In the following years, new important theoretical and formal acquisitions were
developed in Harvard: in the setting of a continual development of algebraic models,
the idea of “block model” was introduced (see section 4).
As suggested by Nadel (1957), the concept of role began to take a central part in
Social Network Analysis: many ideas were developed by Harrison C. White and his
colleagues.
White’s group focused on the analysis of mathematical-formal aspects of Social
Network, giving new directions to graph theory and introducing some new important
characteristics coming from semigroup algebra (see section 4), with the aim to
formalize different structural relations inside a group (White, 1963).
As we said, they introduced the concept of block model, which was intended as
corresponding to the role of a group of components of a social network (Lorrain &
White, 1971; White, Boorman & Breiger, 1976). The central idea of White is that the
search of structures in a network should not be based on a-priori defined and well-
known categories, but on the real relations among the network nodes and on how
these relations structures it, with the aim to describe the concrete and emergent role
structures.
In this context, a study by Mark Granovetter on the importance of weak ties is really
interesting (Granovetter, 1973). His idea was shown to be useful in many researches,
as in his analysis of looking for a job mechanisms (Granovetter, 1974).
From the Harvard group, a former student of White’s, Barry Wellman (1978), created
an international group aimed to get SNA researchers together. This group was called
INSNA (an acronym for International Network Society of Social Network Analysts); its
web page is available at the following URL: http://www.insna.org/INSNA/insna_inf.html.
Among the different kinds of analysis, an original theory, known as “small world
phenomenon” and proposed by Stanley Milgram (1933-1984), revealed to be rich of
cues. His approach concerns the empirical effort to determine how many steps (or ties)
are necessary, in a well-defined population, so that two different individuals can meet
each other. For instance, given a source individual that we call a, the number of
individuals tied by a relation of acquaintance so that a chain that links a to a different
target individual b is calculated. Notwithstanding the large number of methodological
56
Social Network Analysis and IT
criticisms posed to the original experimental paradigm, the problem turned out to be of
remarkable general interest, and the “Small world phenomenon” has became a large
studied issue; in particular, many studies have been carried out in order to explore
which factors determine the shortest path search in a network between two individuals,
and how a defined system could be defined a “small world” or not. An empirical
approach of this phenomenon has been studied in relation to the construction of virtual
network on the web, giving birth to system like Friendster, or to explore the functioning
of Instant Messaging software (Adamic & Eydar, 2005).
We want to end this section pointing out Social Network Analysis interdisciplinary
endeavour: it was born from the joint activity of social psychologists, anthropologists,
sociologists, mathematicians, physicians and economists, and can be used with profit
for research in behavioral, social, economical or political discipline. In the following
sections we will show how mathematics (in particular, algebraic methods and graph
theory) has also a strong tie with SNA. We want to point out that this tie is not
monodirectional: empirical applications of graph theory had been proven to be a benefit
for the graph theory itself, because this application gave the possibility to give life to
some new ideas and to develop some aspects of this branch of the mathematic (Harary
was a mathematician, and his innovative ideas were often used to get the graph theory
richer).
A critique seldom posed to Social Network Analysis concerns the possible triviality of
the results: Boissevain (1979) pointed out how SNA is mainly focused on technical
issues, rather than empirical research about social topics. On the contrary, Barnes and
Harary (1983) answer to this critique arguing how graph theory is a powerful and not
still used at its full capability perspective. Researchers have made too little a use of this
theory and its full potentiality:
Graph theory uses two primitive, undefined terms, point and line; these two terms are mentioned in a small
number of axioms, unproved statements assumed to be true. […] Its theorem consists of statements each of
which can be derived logically either directly from the axiom system or indirectly by making use of theorems
already proved. […] (A theorem) can be used with reference to any appropriate mathematical model of the real
world that has been constructed with material from its axiom system. It than reveals real world implications of
the model that might otherwise have not been noticed or utilized by the designer of the model. (p.239)
With this statement, the two authors try to underline how this potentiality is not limited
to the use of a precise terminology, but the use of mathematical theories in this field
can give new ideas, can “enable to move ahead faster”, while these methods are
57
F. Martino, A. Spoto
generally neglected. In Barnes and Harary’s article, some examples are shown, and
some ideas from near topics are described.
2.2. Types of studies According to Pattison (1993), the range of use of the idea of social network is very
comprehensive, but there is a general agreement about the presence of two main
classes of conceptions about the role of social networks. The main idea in the first
class of studies is based on the link between properties and behaviors of an individual
and the environment in which he is located. In a first kind of research, SNA has been
used as a tool to explain individual behavior (Wellman, 1988; Granovetter, 1985;
Anderson & Jay, 1985). In a second kind of studies of this kind, it has been proposed to
use the structure of the relationship of the member of a group in order to understand
the social (collective) behavior of a group (Laumann & Pappi, 1976).
The second class of conceptions is based on the idea that an understanding of
network structure allows the understanding of social processes occurring on that
network: “social networks define paths for the flow of social traffic” (Pattison, 1993,
p.4). In a first kind of studies, the nature of social networks has been studied as a
function of social variables (occupation, gender, urbanizations and so on) (Blau, 1977;
Coates, 1987). A similar idea is the study of the relationship between large populations
parameters (for example, those connected to job finding), and some network
characteristics (Granovetter, 1974), in order to explain macro-behaviors as the result of
aggregations of micro-interactions among individuals (Skog, 1986).
2.3. Resources The growing significance of Social Network Analysis research, since 1970, is well
attested by the great number of papers and books connected to it. One of the main
resources is the “Social Networks” journal, published by Elsevier Science, and edited
by Linton Freeman and Ron Breiger, two of the most important researchers on this
topic. The journal deals with theoretical, methodological and substantive themes, and is
characterized by a multidisciplinary approach. Another journal dedicated to SNA is
“REDES”. It can be consulted online at URL: http://revista-redes.rediris.es, as “The
Journal of Social Structure”, available online at http://www.cmu.edu/joss. Also available
online is “Connections”, the official journal of INSNA.
58
Social Network Analysis and IT
INSNA also provided to create a mailing list for discussion on issues related to SNA;
free subscription and information about it are available at the following url:
http://www.insna.org/INSNA/socnet.html.
Many other journals often deal with Social Network Analysis: methodological
problems are often approached in “Journal of Mathematical Psychology” (Pattison &
Bartlett, 1982; Pattison & Wasserman, 1995; Pattison, et al., 2000, etc.), “Journal of
Mathematical Sociology” (Cartwright & Harary, 1977; Doreian, 1987, etc.) and many
others. A great interest is generated by the “small world” problem, as one can see by
the great number of papers approaching broad themes as those published in “Nature”
(e.g., Watts & Strogatz, 1998) and “Scientific American” (e.g., Watts et al., 2002).
Some manuals have been made to introduce SNA: “Social Network Analysis.
Handbook”, written by John Scott (1991), offers a simple and empirical introduction to
this topic. Methodological and analytical issues, with a particular attention to graph
theory, role algebra and statistical tools are described in Wasserman and Faust’s
manual, “Social Network Analysis: Methods and application”, written in 1994, and his
complement “Models and Methods in Social Network Analysis”, written in 2005 by
Carrington, Scott and Wasserman. An introduction to algebraic methods of analysis is
provided by “Algebraic Models for Social Networks”, by P. Pattison (1993). Another
interesting book, by S. Bornholdt and H. G. Schuster, is “Handbook of Graphs and
Networks: From the Genome to the Internet” (2003); it shows the large potentialities of
the approach we are talking about. A large number of brief introductions to SNA books
are available online at http://www.insna.org/INSNA/books_inf.html.
2.4. Sampling and boundary specification: types of network A network necessarily consists of a finite set of actors; this is due to two reasons: on
one hand, this could be due to some restriction on the object under observation (for
example, the interest of a researcher is the survey of the social structure of a small
village or a classroom). On the other hand, this is mainly due to analytical
requirements: so the problem is how to sample a group representative of the
population, and how to set the constraints of this sample.
One proposal is to define unit set boundaries using the frequency of interaction, or
intensity of ties among actors (Wasserman & Faust, 1994). According to Laumann et
al. (1983; 1989), two different approaches can be used to specify boundaries in social
network studies: the first one is called realist approach, the second one nominalist
59
F. Martino, A. Spoto
approach. In the realist approach, subjects have some kind of shared knowledge of the
network as a social entity. In the nominalist approach, boundaries are defined by
research aim, so actors can be separated by attributes of potential members of the
network, relational properties between potential members, and activities in which actors
are involved into.
Sometimes, when boundaries can not be defined at the very beginning, researchers
use sampling techniques like snowball sampling (Goodman, 1961; Erickson, 1978) or
random nets (Fararo & Skorovetz, 1984). A general review of Social Network sampling
can be found in Frank (1988).
Frank (1979) categorizes snowball sampling like a “chain method”, designed to trace
ties from a source to an end: an actor, or a little number of actors, is chosen among the
set of potential actors. After this first step, every chosen actor reports on the actors to
whom he has a link according to the relation under examination. The first actor is called
ego, while actors chosen from him constitute the “first-order zone” of the network.
Actors of the first order zone are now taken for reporting on the actor to whom every
one of them as a tie, and so on. For every k step, k = 1, 2, 3..., we have a new order
zone, called “k-th order zone”.
The main problem with sampling is that any procedures can alter or loose relations
inside the considered group.
In literature, a distinction is often made between “Complete networks” and “ego-
centered networks”. An ego-centered network (or local network) consists of a network
built on the basis of a focal person, ego, like in snowball sampling. So, the entire
network is referred to this focal person, and every relation is reported by the ego. The
situation can be more complicated, if we consider every new link as an ego (this is the
case of snowball sampling), or if we start from more than one ego to build a sample of
a population. A complete network is built upon every node (or a sample of nodes) from
a population, but any relation is considered for every node composing the network. The
last distinction is fundamental in algebraic modelling, because it leads to different
algebraic models (see section 4).
3. Methods of Social Network Analysis
Sections 3, 4 and 5 will provide a brief description of mathematical perspective from
which Social Networks has been studied. We will first introduce the concept of set-
60
Social Network Analysis and IT
theoretic relation, which is the basis of Social Network Relations. Later, we will
describe the main ideas coming from graph theory and algebraic semigroup theory, to
give a short description of methodological issues about Social Network Analysis. In
section 5 we will describe some of the most recent developments in SNA: statistical
models issues and Dynamic Network Analysis.
3.1.0. The concept of relation The formal analysis of a social network can be dealt with different tools, every one of
them with its own peculiarity, with its different operation. Also, every one of them can
give different outcomes, and have different purposes.
There are two different, but not independent, perspectives from which Social Network
Analysis has been observed in its short but rich history: on one hand there is the graph
theory, on the other hand there is Algebraic Theory of Semi-Groups. Before starting to
give a short description of these two kinds of approach, we will pinpoint their common
base: the fundamental concept they share is the notion of relation, as it is considered
from a set-theoretical point of view.
Definition 1: let’s consider two sets, labeled X and Y; a relation between X and Y is
every set of ordered couples where the first element belongs to X, and the second
element belongs to Y.
3.1.1. Network description For the sake of simplicity, we will now consider only the simplest form of network, a
binary network (so, every relation involves only couples of units), on the set of units X.
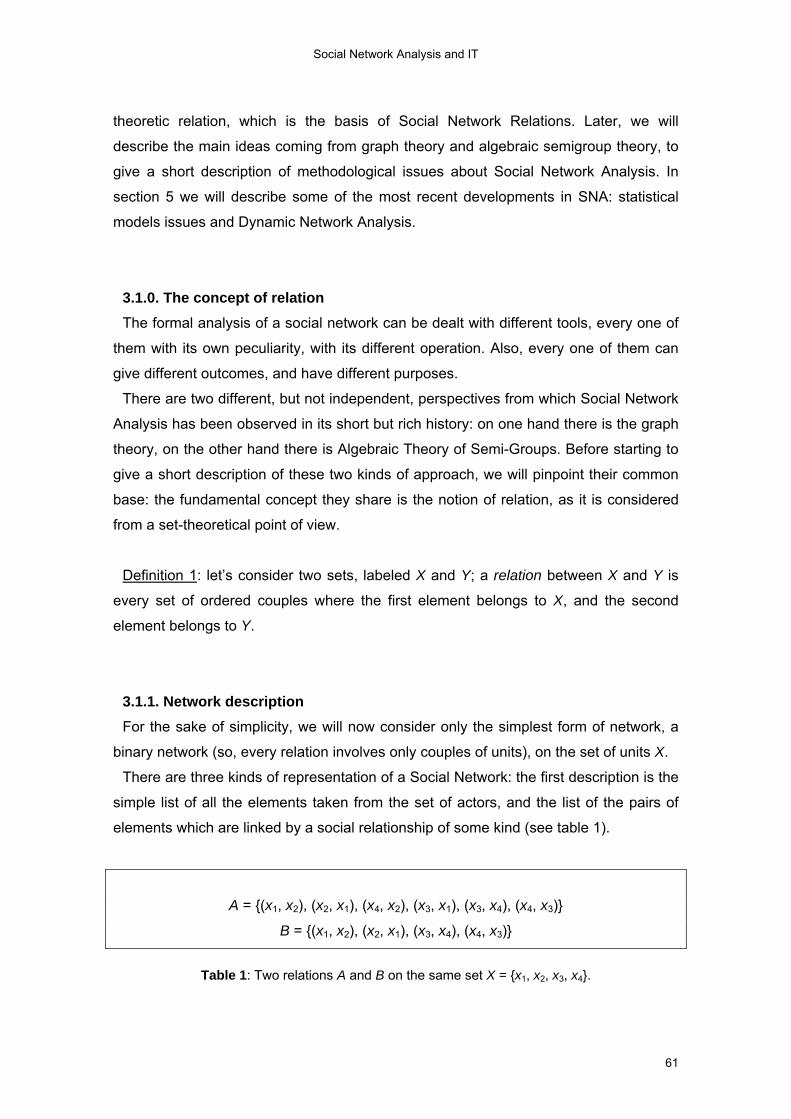
There are three kinds of representation of a Social Network: the first description is the
simple list of all the elements taken from the set of actors, and the list of the pairs of
elements which are linked by a social relationship of some kind (see table 1).
A = {(x1, x2), (x2, x1), (x4, x2), (x3, x1), (x3, x4), (x4, x3)}
B = {(x1, x2), (x2, x1), (x3, x4), (x4, x3)}
Table 1: Two relations A and B on the same set X = {x1, x2, x3, x4}.
61

F. Martino, A. Spoto
The second description comes from the Graph Theory: every actor is represented by
a point, called vertex or node of the graph; the links defined by pairs of individuals,
represented by lines between two linked points, are called edges of the graph (see fig.
1).
x1 x2
x3 x4
x1 x2
x3 x4
A B
Figure 1: The corresponding graph for the relations A and B (see table 1) on the set
X = {x1, x2, x3, x4}.
The third description has the form a matrix (see table 2).
x1 x2 x3
x4
x1 x2 x3
x4
x1 x2 x3 x4 x1 x2 x3 x4
0 1 0 0 1 0 0 0 1 0 0 1 0 1 1 0
0 1 0 0 1 0 0 0 0 0 0 1 0 0 1 0
Table 2: Corresponding Boolean matrix for A and B (see table 1) relations on the set
X = {x1, x2, x3, x4}.
There are other kinds of networks: for example, there can be more than one relation,
so we consider a set of different relations R = {R1, ..., Rt}. Another kind of network is
62

Social Network Analysis and IT
called “valued networks”, when a relation Rv can assume possible values different from
0 and 1). The most general binary case is that of a multiple valued network.
Definition 2: Let X represent a set of n social units, and let vk(i, j) the value of the Rk
relation from unit i to unit j in X. Rk can be considered as:
23 a valued, directed graph where nodes are the elements of X and edges are the
edges of type k, with value vk(i, j), directed from node i to node j;
24 a valued relation, assigning the value vk(i, j) to the ordered pair (i, j);
25 an n × n matrix, where entry (i, j) assumes the value vk(i, j).
The collection R = {R1,..., Rp} is termed a (multiple) valued network.
Is it also possible to use relation with arity more than 2 (for example, ternary
relations); this approach is not very common in Social Network Analysis: “[binary
relational representations] include the vast majority of the models that have been
proposed and applied in the social network literature to date” (Pattison, 1993, p. 12).
3.2. Graph Theory Graph Theory has been used in several different scientific fields like anthropology
(Hage, 1973; Zachary, 1977; Mitchell, 1980), social psychology (Heider, 1946; 1958;
Leavitt, 1951; Freeman, 1977; 1979; Freeman, Reoder & Mulholland, 1980),
communication (Herring et al., 2005), on-line business (Dellarocas, 2003), geography
(Pitts 1965; 1979), and many others. In Social Network Analysis, Graph Theory
assumes a crucial role because it has been used first of all to denote the structural
properties of a network. Graph Theory works as a theoretical frame in which we can
formally analyze different characteristics and properties of a network. Graph Theory is
essentially a mathematical theory. For this reason it provides to Social Network
Analysis a tool to quantify and measure some properties of the network. The ability to
prove theorems about graphs and network structure is just a consequence of working
in such a formal context. There are a lot of advantages in the use of Graph Theory in
Social Network Analysis but, as it happens for many formal theories introduced in a
psychological frame, often researchers prefer not to refer their studies to this formal
background, so they “make too little use of the theory of graphs” (Barnes & Harary,
1983, p.235). Graph Theory, and more generally a graph, is one of the best and
clearest way to represent and detect the structure defined by the way a relation (or
some relations) connects different individuals of a social group. The evident advantage
63

F. Martino, A. Spoto
of the graph representation is that it provides an immediate interface through which it’s
possible to find, and also easily to understand, the way individuals in the network are
connected.
In the following pages we’ll introduce first some basic concepts of Graph Theory
trying to evidence how these concepts are easily exportable to a social context. In the
second part of this paragraph we’ll briefly speak about some indexes we can calculate
on a network using Graph Theory concepts.
3.2.1. Graphs and Di-graphs As we have seen, the aim of Social Network Analysis is to detect and to understand
the structure identified by a set of relations defined on a set of individuals. Graph
Theory is an important tool for this aim. First of all we have to consider an important
question: what kind of relation are we interested in to study?
We have said above that we’ll investigate binary relations, so we look at only a couple
of individuals a time. We have also specified that the relation is not reflexive (we don’t
have the relation between x and itself: x¬Rx). But it doesn’t suffice: we need to know if
we are analysing a directed or an undirected relation. If the relation we analyse is
undirected (relations like “to be married to…” or “to be neighbour of…” are undirected
relations) we’ll use a graph to represent it; otherwise (relations like “to be parent of…”
or “to be subordinate to” are directed relations) we’ll represent the relation using a di-
graph (directed graph).
In any graph we have g nodes and L lines. We can easily find the parallelism between
this formal notation and a social network: the “actors” of the network become the
“nodes” of the graph, and the “ties” between actors in the network become “lines”
between nodes in the graph. As we just mentioned, a graph can be used to represent
an undirected relation: we can express this assumption by saying that there mustn’t be
any difference between a line lk= (ni, ni) and a line lh= (nj, ni) between two nodes ni and
nj. From this sentence it derives that any undirected relation is also a symmetric
relation: if ni is married to nj, nj is married to ni too.
Let us now consider the case in which we have to study a directed relation, i.e. the
case in which the tie between two actors is oriented from one to the other. This
condition implies that the two ties lk= (ni, nj) and lh= (nj, ni) are different. In order to
represent such a relation we need to use a directed graph (di-graph). We define a di-
graph as a set of nodes (the actors of the network) and a set of direct lines (the ties of
64

Social Network Analysis and IT
the social network) between nodes. Every couple of nodes connected by a direct line is
an ordered couple: formally lk= <ni, nj > means that the arc lk is directed from the node
ni to the node nj, and the order of this relation is not invertible (so the formula lk= <ni,
nj> differs from the formula lh= <nj, ni >) . The first node is called the “sender” while the
second node is called the “receiver”.
Now we introduce the important notion of subgraph, which is fundamental for several
operations and indexes which we can obtain in a social network. A graph Gs is a
subgraph of a graph G if the nodes of Gs are a subset of the nodes of G and the lines of
Gs represent a subset of the lines of G.
There are some basic units of any graph that are also subgraphs: the dyad and the
triad. A dyad consists of a pair of nodes and the lines (arcs) between them: in a graph
we can have adjacent or not- adjacent pairs of nodes, that is to say 0 lines or 1 line; in
a di-graph the situation is more composite because between any two nodes we can
have 0 (null), 1 (asymmetric) or 2 (mutual) direct lines. Similarly a triad is composed by
three nodes and the lines between them: in a graph we can have from 0 to 3 lines; in a
di-graph we can have from 0 to 6 lines. Triads have been largely studied in a
theoretical and practical way (e.g. Granovetter, 1973). Dyads and triads are a part of a
special kind of subgraphs called node-generated that we are going to analyse in the
next pages, together with the line-generated subgraph and the cliques.
Another useful concept is clique, the maximal complete subgraph composed by at
least three nodes. What does maximal and complete subgraph mean? A clique is
complete because each node in it is adjacent to any other node in the clique. A clique
is maximal because there are no nodes not included in the clique which are also
adjacent to all the nodes in the clique (Luce & Perry, 1949; Harary, Norman &
Cartwright, 1965). The concept of clique introduces the larger concept of cohesive
subgroup. A clique is the example of the most restrictive cohesive subgroup (Festinger,
1949) using graph theory. In the subsequent years several different kinds of cohesive
subgroups for graphs but also for di-graphs have been investigated. Considering
graphs, some of them are: complete mutuality based subgraphs (like cliques),
reachability and diameter based subgroups (like n-cliques, see Luce, 1950; Alba, 1973;
or n-clans and n-clubs, see Mokken, 1979), nodal degree based subgroups (like k-
plexes, see Seidman & Foster, 1978a; or like k-cores, see Seidman, 1983b).
Considering di-graphs some of them are reciprocated ties based cliques (see again
Festinger, 1949; Luce & Perry, 1949) and n-cliques for directional relations (Peay,
1975a; 1975b; 1980).
65

F. Martino, A. Spoto
We have presented some of the main properties of graphs relating them to Social
Networks.
3.2.2. Main quantitative indexes We will now introduce the main quantitative indexes which we can find in a network
using Graph Theory. Since the beginning of Social Network Analysis, Graph Theory has been a very
important tool both to represent social structure and to calculate some indexes, which
are useful to understand several aspects of the social context under analysis. In this
section we present the main indexes usually associated with graphs and di-graphs.
The first and simplest index is nodal-degree. We define the degree of a node in a
graph as the number of lines incident with that node. We can calculate the mean nodal
degree of a graph with the following formula gLd /2= : we have to consider twice the
total number of lines in the graph (L) because each line has to be considered both for
the first and the second node. Dividing this product by the number g of nodes in the
graph, we obtain exactly the mean number of lines incident with each node. Also in this
case, di-graphs present a more complicated situation. There are two kinds of degree
for each node: the in-degree, the number of direct lines adjacent to a node, and the
out-degree, the number of direct lines adjacent from a node. It’s a simple task to
demonstrate that the mean in-degree and out-degree values are equivalent:
gLdd oi /== . Nodal degree gives information of how many ties each social actor
has; also, we can see for every actor if the relation is direct from each one of them to
the other members or the other way round (from this difference we can calculate
different centrality indexes: centrality and prestige). In a social context, the degree
indexes can indicate for example the number of friendship ties among a class: if there
is a high mean degree we can suppose that in such a class there are many friends; for
each subject we can say if his/her friendship is either reciprocated or not (in-degree,
out-degree). It might be clear that the meaning of “degree” is different in different
contexts of research. Degree in general seen as an index for centrality: in this sense, it
can tell us about an actor’s prominence in the network (Knoke & Burt, 1983) or his/her
prestige (Bonacich, 1987). Furthermore, the mean degree value can be read as a first
index of connectivity in our network.
Closely tied to the concept of nodal degree is the second index we’re going to
present: density. When we look at a graph, we observe a set of nodes and a number of
66
Social Network Analysis and IT
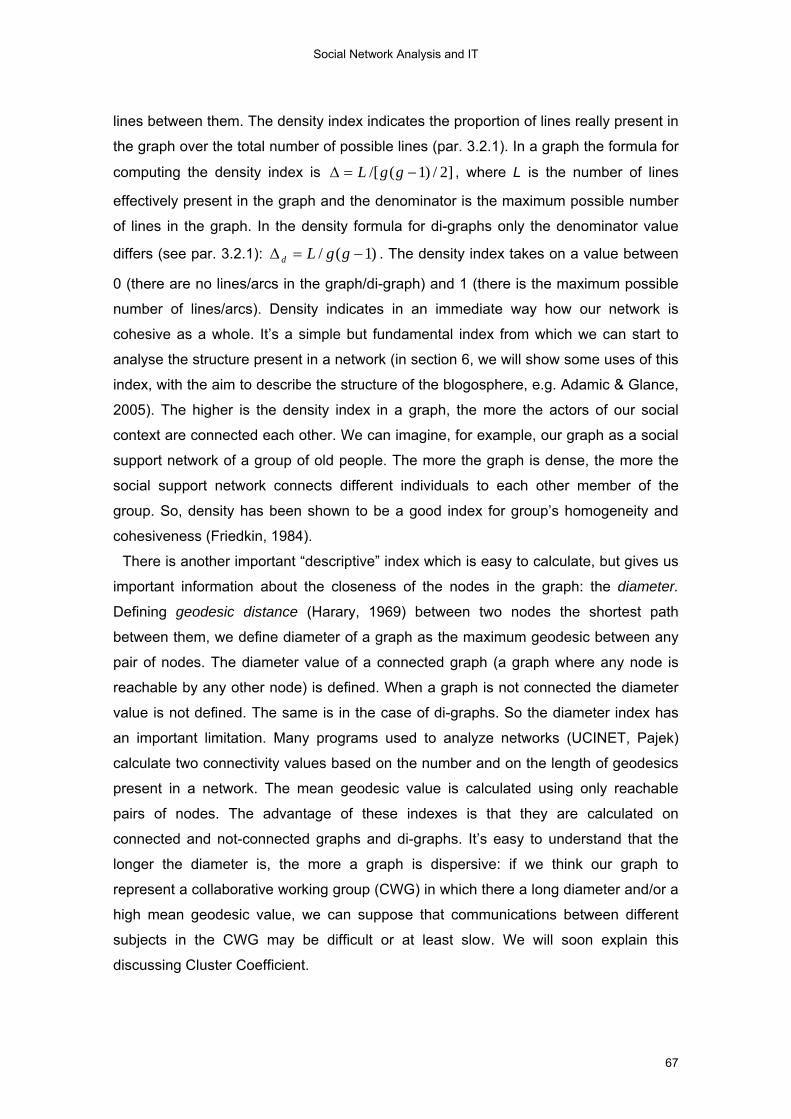
lines between them. The density index indicates the proportion of lines really present in
the graph over the total number of possible lines (par. 3.2.1). In a graph the formula for
computing the density index is ]2/)1(/[ −=Δ ggL , where L is the number of lines
effectively present in the graph and the denominator is the maximum possible number
of lines in the graph. In the density formula for di-graphs only the denominator value
differs (see par. 3.2.1): )1(/ −=Δ ggLd . The density index takes on a value between
0 (there are no lines/arcs in the graph/di-graph) and 1 (there is the maximum possible
number of lines/arcs). Density indicates in an immediate way how our network is
cohesive as a whole. It’s a simple but fundamental index from which we can start to
analyse the structure present in a network (in section 6, we will show some uses of this
index, with the aim to describe the structure of the blogosphere, e.g. Adamic & Glance,
2005). The higher is the density index in a graph, the more the actors of our social
context are connected each other. We can imagine, for example, our graph as a social
support network of a group of old people. The more the graph is dense, the more the
social support network connects different individuals to each other member of the
group. So, density has been shown to be a good index for group’s homogeneity and
cohesiveness (Friedkin, 1984).
There is another important “descriptive” index which is easy to calculate, but gives us
important information about the closeness of the nodes in the graph: the diameter.
Defining geodesic distance (Harary, 1969) between two nodes the shortest path
between them, we define diameter of a graph as the maximum geodesic between any
pair of nodes. The diameter value of a connected graph (a graph where any node is
reachable by any other node) is defined. When a graph is not connected the diameter
value is not defined. The same is in the case of di-graphs. So the diameter index has
an important limitation. Many programs used to analyze networks (UCINET, Pajek)
calculate two connectivity values based on the number and on the length of geodesics
present in a network. The mean geodesic value is calculated using only reachable
pairs of nodes. The advantage of these indexes is that they are calculated on
connected and not-connected graphs and di-graphs. It’s easy to understand that the
longer the diameter is, the more a graph is dispersive: if we think our graph to
represent a collaborative working group (CWG) in which there a long diameter and/or a
high mean geodesic value, we can suppose that communications between different
subjects in the CWG may be difficult or at least slow. We will soon explain this
discussing Cluster Coefficient.
67
F. Martino, A. Spoto
Heider’s (1946) gave the first definition of balance, as this notion involves ties among
individual’s attitude, opinions or people; he considered direct signed ties.
Harary (1953) introduces the notion of structural balance: let’s consider two generic
social actors, ni and nj, for gji ≤≠≤1 ; a group is structurally balanced when, if ni and
nj like each other, then they both like and dislike the same other people, or if ni and nj
dislike each other, then they disagree in every evaluation of all other people.
In a un-equilibrated graph, we could look for some equilibrated subgraphs (that
represents, under SNA perspective, equilibrated social actor’s sub-networks in a wider
social network). The operation that led us to derive the balanced components is called
clusterability,and every balanced subgraph is called a cluster (Davis, 1967).
Holland and Leinhardt (1970) suggested an extension of clusterability to unsigned
direct relations: transitivity is the central framework behind their work. They focused on
the analysis of triples, and relations (symmetrical, asymmetrical or anti-symmetrical)
among any two of them.
A different, and maybe more pertinent to our discussion, use of the term “cluster” is
provided by Watts and Strogatts (1998). “Clustering coefficient”, as in their definition,
gives a good measure if a given network can be considered as a “small world” or not.
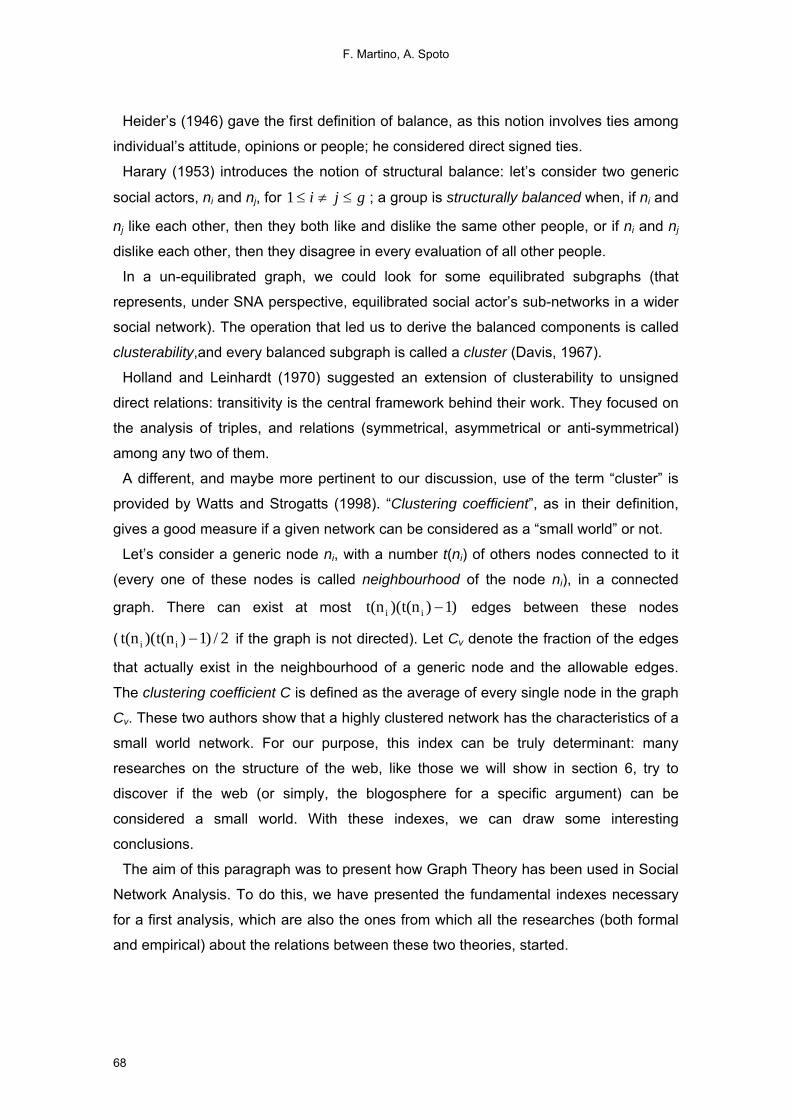
Let’s consider a generic node ni, with a number t(ni) of others nodes connected to it
(every one of these nodes is called neighbourhood of the node ni), in a connected
graph. There can exist at most )1)t(n)(t(n ii − edges between these nodes
( if the graph is not directed). Let C2/)1)t(n)(t(n ii − v denote the fraction of the edges
that actually exist in the neighbourhood of a generic node and the allowable edges.
The clustering coefficient C is defined as the average of every single node in the graph
Cv. These two authors show that a highly clustered network has the characteristics of a
small world network. For our purpose, this index can be truly determinant: many
researches on the structure of the web, like those we will show in section 6, try to
discover if the web (or simply, the blogosphere for a specific argument) can be
considered a small world. With these indexes, we can draw some interesting
conclusions.
The aim of this paragraph was to present how Graph Theory has been used in Social
Network Analysis. To do this, we have presented the fundamental indexes necessary
for a first analysis, which are also the ones from which all the researches (both formal
and empirical) about the relations between these two theories, started.
68
Social Network Analysis and IT
4. Algebraic models Another class of models for analysing social networks comes from an algebraic
perspective, in particular from algebra of semigroups and order theory. The rationales
for this approach are two: the first one is the opportunity of using profitable models “that
will enable the analysis of network data in a number of different forms”. A second
theme is the possibility to develop “data models attuned to variety of theoretical claims
about the nature of the role of social networks in the development of social and
psychological relations” (Pattison, 1993, XIX).
Lorrain and White (1971) emphasize the primary importance of the concept of role in
a group: role of an individual in a social system “has often been described as consisting
of sets of relations of various types linking this person as ego to sets of others” (p.350).
So, the role of an individual is identified by the incoming and outcoming ties this
individual has with other members of the group. Tools proposed to identify and
describe a role, different roles in a social network, and a way to compare social
structure considering different role structures, come from semigroup algebra, as
proposed by White.
The starting point is the notion of Structural Equivalence:
Definition 3: Let R = {R1, ..., Rp} be the set of relations in a network W. Two individuals
x and y are said to be Structurally Equivalent if, for all nodes k = 1, …, t (k ≠ x,y), xRk iff
yRk, and kRx iff kRy.
That is, two nodes are structurally equivalents if and only if they share the same set of
ingoing and outgoing ties with a defined individual. If two actors are structurally
equivalent, they are said to hold the same position in the network (White et al., 1976).
Individuals sharing the same position can jointly form a partition of a group: this kind of
partition is said to be a “blockmodel”, and it is representative of the social position that
each block member holds. A blockmodel may be viewed as a new Social network, in
the sense that it can be represented as a set of multiple binary relations defined among
blocks.
Some criteria for determining a fit to a blockmodel of a set of data with a weaker
condition than structural equivalence has been proposed. One, called lean-fit, is a
weaker condition of the fat-fit, in the sense that at least one individual in a block has a
relation to every individual in the second (Breiger et al., 1975). Another, called α–
69
F. Martino, A. Spoto
blockmodel fit, is a condition where only a limited number of relations (the number of
total relation multiplied by α, called criterion) is considered (Arabie et al., 1978).
One of the most remarkable consequences of the use of a blockmodel is that roles
(and role structures) are not a-priori defined, but are seen as emergent and elastic
structures to describe a social group: a role is completely defined by the set of relations
composing it; furthermore, an individual could be unaware of his role.
We will now describe, with the aid of an example, how to build an algebra for a social
network. This description is given for two main reasons: one is to illustrate how it is
possible to compare different networks, and to have some further information about
network structure. The other is that we want to describe, at a very simple level, how an
algebraic analysis is made, in order to give an introduction to this complex topic.
We will limit our example to a complete network (we mean complete in the sense
described in section 2.4); although building an algebra for an ego-centred network is
similar to the construction of a complete network, there are still some differences and
difficulties, which are not in our interest to explore in this paper. For further details, a
complete description of a local role algebra construction, that is the algebra made from
an ego-centred network, is provided in Pattison (1993).
The basic notion of algebraic modelling is composition (among binary relations):
according to Lorrain and White (1971), composition represents “the basic logic of
interlock in the system of relationship”((Lorrain & White, 1971, in Pattison, 1993, p. 40).
Pattison writes that “compound relations are claimed to define the paths where social
processes flow”. Lorrain (1972) says that “any concatenation of social relationship is
itself a social relationship, whether perceived or not” (Lorrain, 1972, in Pattison, 1993,
p. 41). By composing two (or more) primitive relations, we may produce a collection of
compounds relations.
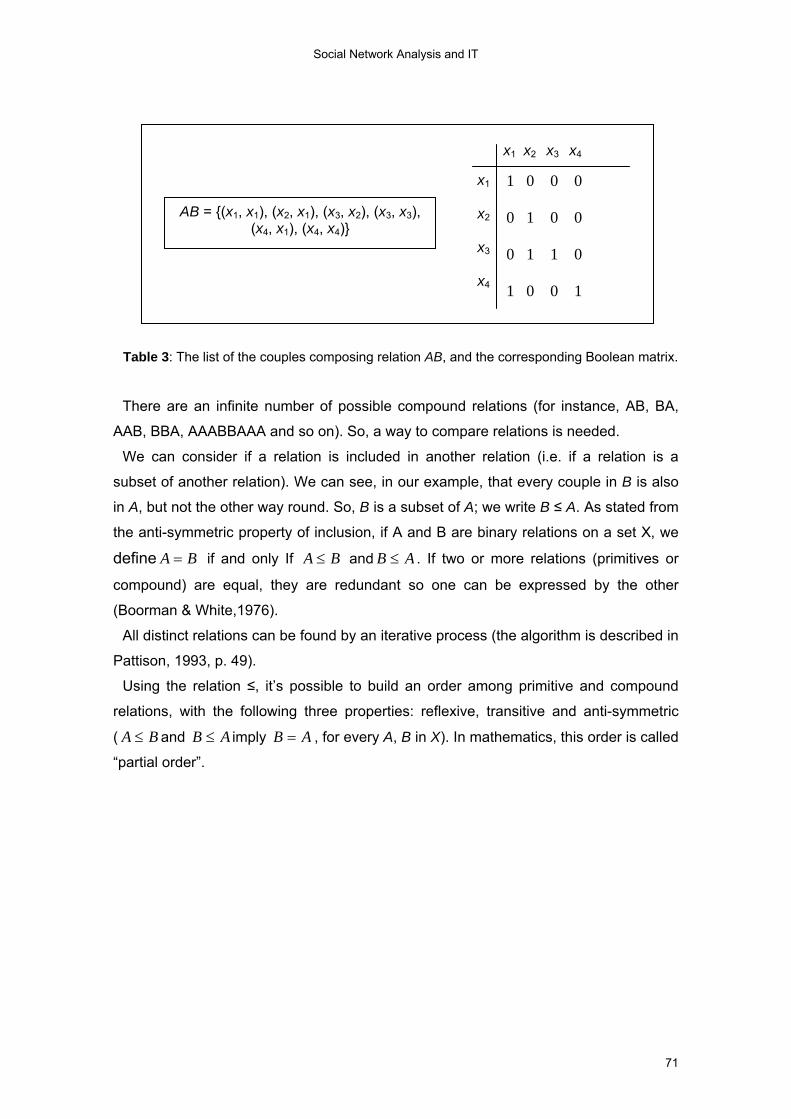
Let’s consider the two relations already discussed in section 3.2. If we compose a
relation A with a relation B, say AB, we will have a new kind of relation (see table. 3)
(the operation of composition is not commutative, i.e. AB is not necessarily the same
as BA).
70
Social Network Analysis and IT
x1 x2 x3
x4
x1 x2 x3 x4
1 0 0 0 0 1 0 0 0 1 1 0 1 0 0 1
AB = {(x1, x1), (x2, x1), (x3, x2), (x3, x3), (x4, x1), (x4, x4)}
Table 3: The list of the couples composing relation AB, and the corresponding Boolean matrix.
There are an infinite number of possible compound relations (for instance, AB, BA,
AAB, BBA, AAABBAAA and so on). So, a way to compare relations is needed.
We can consider if a relation is included in another relation (i.e. if a relation is a
subset of another relation). We can see, in our example, that every couple in B is also
in A, but not the other way round. So, B is a subset of A; we write B ≤ A. As stated from
the anti-symmetric property of inclusion, if A and B are binary relations on a set X, we
define BA = if and only If BA ≤ and AB ≤ . If two or more relations (primitives or
compound) are equal, they are redundant so one can be expressed by the other
(Boorman & White,1976).
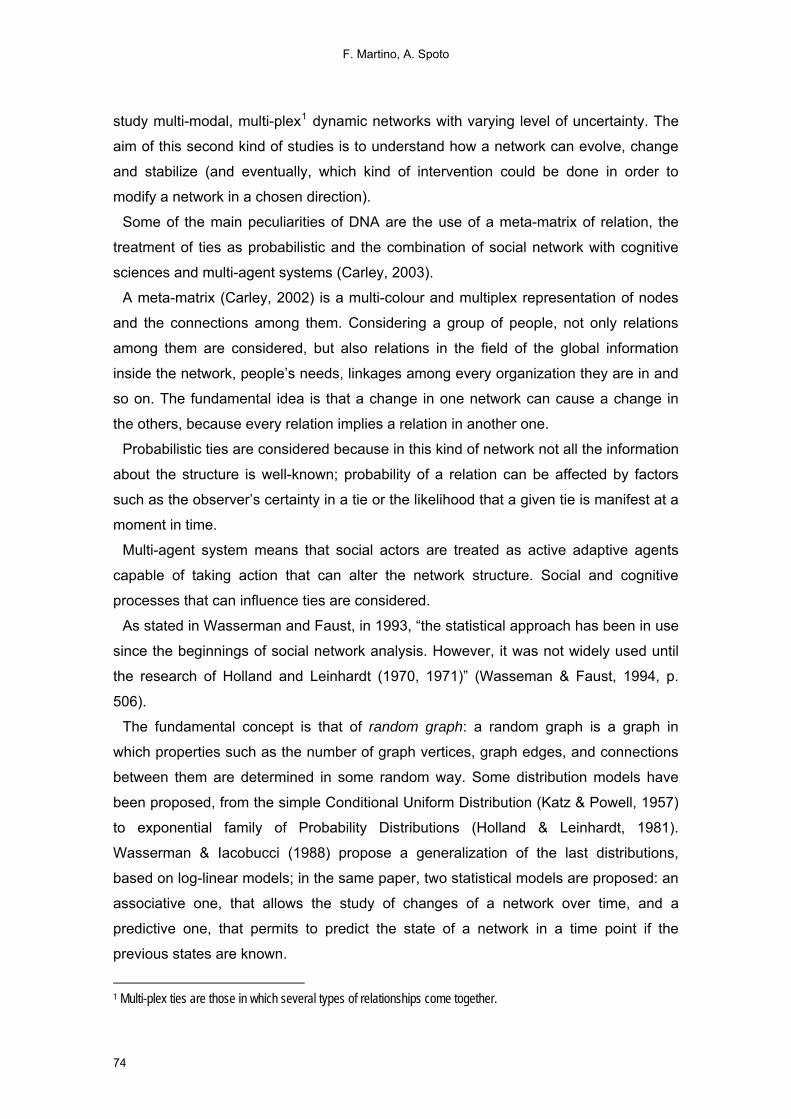
All distinct relations can be found by an iterative process (the algorithm is described in
Pattison, 1993, p. 49).
Using the relation ≤, it’s possible to build an order among primitive and compound
relations, with the following three properties: reflexive, transitive and anti-symmetric
( BA ≤ and AB ≤ imply AB = , for every A, B in X). In mathematics, this order is called
“partial order”.
71

F. Martino, A. Spoto
0 1 0 0 1 0 0 0 1 0 0 1 0 1 1 0
A
0 1 0 0 1 0 0 0 0 0 0 1 0 0 1 0
B AA
1 0 0 0 0 1 0 0 0 1 1 0 1 0 0 1
AB
1 0 0 0 0 1 0 0 0 1 1 0 1 0 0 1
BB
BA
1 0 0 0 0 1 0 0 0 1 1 0 1 0 0 1
1 0 0 0 0 1 0 0 0 0 1 0 0 0 0 1
BBA BBB BBAA BBBB
1 0 0 0 0 1 0 0 0 1 1 0 1 0 0 1
1 0 0 0 0 1 0 0 0 1 1 0 1 0 0 1
1 0 0 0 0 1 0 0 0 1 1 0 1 0 0 1
0 1 0 0 1 0 0 0 0 0 0 1 0 0 1 0
Table 4: Some of the compound relations of A and B. As one can see, A = BBA ≤ B =
BBB, BB ≤ AA = AB = BA = BBAA = BBBB. So, to describe the possible relations on
the network is sufficient to use relation A, B, AA, and BB (every other relation is
congruent with one of these). The partial order is A ≤ B, BB ≤ AA, A and BB, A and
AA, B and AA, B and BB are not comparable.
We will now describe the main concept, the partially ordered semigroup. A semigroup
is an algebraic structure defined by a domain X and a characteristic binary operation O
among members of X, so that O is internal in X and is associative.
If we consider every relation (primitive and compound) in the network as an element,
and the composition operation as the characteristic operation of the structure, a
semigroup is obtained. Now we can create a representation of the network as a
“partially ordered semigroup” (see table 5). Why is it so useful to build a semigroup?
Because it gives an abstract representation of a network, which is possible to compare
with other abstract representations (i.e. another semigroup), in order to find differences
and similarities between different networks. Let’s consider the two partially ordered
semigroups of networks N1 and N2, respectively S(N1) and S(N2). If there exist some
mappings so that every element of S(N1) can be transformed into an element S(N2), the
entire structure of S(N1) can be replaced by the structure of S(N2). The two structures
are said to be structurally equivalent, and that they share the same skeleton. A network
and its blockmodel share the same skeleton.
72

Social Network Analysis and IT
Element
Partial order Composition
A B AA BB
A B AA BB
AA AB A A AA BB A B A A AA AA A AB AA AA
A B AA BB
1 1 0 0 1 0 0 0 0 1 0 0 1 1 0 0
Table 5: This table shows the semigroup obtained from the network in table 1, and the partial
order on it. The composition section must be read in this way: if we compose the element in the
row with the correspondent element in the column, result is the relation in the correspondent
cell. The partial order section must be read in this way: if there is the relation ≤ from the element
in the row to the correspondent element in the column, value is 1, otherwise is 0.
It’s possible to operate more complex comparisons among semigroups, but it’s not
our aim to describe that. For every detail, a global description of methods of analysis of
semigroups is provided by Pattison, 1993, Pattison & Bartlett, 1982, Pattison &
Wasserman, 1995, Pattison et al., 2000.
5. Dynamic Network Analysis (DNA) and statistical issues In this section two fundamental aspects of SNA will be exposed: the first represents a
new development of the complexity of the theory (DNA), while the second is a topic
always present in SNA, that in the last years has become one of the most interesting
fields of research in SNA (statistical issues).
One of the most recent developments in SNA considers network as an ever-changing
and dynamic structure: this approach is called Dynamic Network Analysis (DNA).
While SNA concentrates mainly on small, bounded networks, on a limited and
sometimes small number of relations, observed only at one point in time, DNA tries to
73
F. Martino, A. Spoto
study multi-modal, multi-plex1 dynamic networks with varying level of uncertainty. The
aim of this second kind of studies is to understand how a network can evolve, change
and stabilize (and eventually, which kind of intervention could be done in order to
modify a network in a chosen direction).
Some of the main peculiarities of DNA are the use of a meta-matrix of relation, the
treatment of ties as probabilistic and the combination of social network with cognitive
sciences and multi-agent systems (Carley, 2003).
A meta-matrix (Carley, 2002) is a multi-colour and multiplex representation of nodes
and the connections among them. Considering a group of people, not only relations
among them are considered, but also relations in the field of the global information
inside the network, people’s needs, linkages among every organization they are in and
so on. The fundamental idea is that a change in one network can cause a change in
the others, because every relation implies a relation in another one.
Probabilistic ties are considered because in this kind of network not all the information
about the structure is well-known; probability of a relation can be affected by factors
such as the observer’s certainty in a tie or the likelihood that a given tie is manifest at a
moment in time.
Multi-agent system means that social actors are treated as active adaptive agents
capable of taking action that can alter the network structure. Social and cognitive
processes that can influence ties are considered.
As stated in Wasserman and Faust, in 1993, “the statistical approach has been in use
since the beginnings of social network analysis. However, it was not widely used until
the research of Holland and Leinhardt (1970, 1971)” (Wasseman & Faust, 1994, p.
506).
The fundamental concept is that of random graph: a random graph is a graph in
which properties such as the number of graph vertices, graph edges, and connections
between them are determined in some random way. Some distribution models have
been proposed, from the simple Conditional Uniform Distribution (Katz & Powell, 1957)
to exponential family of Probability Distributions (Holland & Leinhardt, 1981).
Wasserman & Iacobucci (1988) propose a generalization of the last distributions,
based on log-linear models; in the same paper, two statistical models are proposed: an
associative one, that allows the study of changes of a network over time, and a
predictive one, that permits to predict the state of a network in a time point if the
previous states are known.
1 Multi-plex ties are those in which several types of relationships come together.
74

Social Network Analysis and IT
A dependence graph considers the statistical dependencies among the elements of
random variables based on the relational ties in a network: it is a graph in which nodes
are the set of all possible ties, and edges, specifying the pairs of ties, are conditionally
independent (Wasserman & Robins, 2005)
Some random graph models for multiple relations networks are described by Koelhy
and Pattison, 2005:
Statistical analysis has been used in order to build algebraic models (Pattison &
Wasserman, 1995), to know the tendency over reciprocation of choice, or mutuality
(Katz & Powell, 1955), to study network evolution over time (Snijders, 2005), to
compare sociometric relations recorded in distinct sociomatrices (Wasserman, 1987),
and so on. Statistical approach now represents one of the most productive and ongoing
fields in SNA.
6. Social Networks and ICT (Information and Communication Technology). It’s quite simple to understand SNA potentialities in the study of social aspects of the
web. Maybe the first study on Computer Mediated Communication (CMC) was made
by Freeman (1986): he used a dataset consisting of measurements of computer mail
interaction, in order to study how this computer network modified acquaintenships and
friendship. Park (2003) distinguishes among various types of networks: a social
network is defined as a set of people connected by a set of relationships, where
relationships are any kind of social relation; a communication network is composed by
interconnected individuals linked by patterned flows of information. This classification
proceeds presenting three other kinds of networks that are more related to the content
of this section: computer mediated network, a kind of communication network where all
the relations are mediated by computer; internet network is a computer mediated
network which uses internet as channel of information flow; hyperlink network is an
internet network that uses hyperlinks as channel of information flow. As we can see,
among any kind of network there is a relation of inclusion (a kind of network is included
in another one, where SNA is the most general case).
In the last years, researches in this field have looked with increasing interest to the
blogosphere phenomenon using the hyperlink networks. Herring et al. (2005) have
investigated the structure subtended by a sample of 5517 blogs about religion. They
have looked at some SNA indexes taken from Graph Theory like in-degree, out-
75

F. Martino, A. Spoto
degree, reciprocity and so on. Their findings were that some blogs are overrepresented
and central in the network, although other blogs are more densely interconnected.
Majority of blogs link sparsely or not at all to other blogs in the sample, suggesting that
the blogosphere is partially interconnected and sporadically conversational. Adamic &
Glance (2005) analyzed a list of 40 political blogs (conservative or liberal) for a 2 month
period and a sample of 1000 political blogs for a day in the period of USA presidential
election in 2004. They tried to investigate the relations between the two groups of blogs
and to discover the structure subtended by the two groups and possible differences
between them. They used some measures of SNA like in-degree and out-degree and
they found that liberals and conservatives link primarily within their separate
communities, with far fewer cross-links exchanged with the other party. Conservative
bloggers more likely link to other blogs: primarily other conservative blogs, but also
some liberal ones. The conservative blogosphere is more densely linked. Starting from
these results, Ackland (2005) proposes an interesting distinction between 2 types of
blogs: authorities are highly-referenced pages on a particular topic, while hubs are
pages that point to the authorities (and thus confer authority). There is a mutually
reinforcing relationship between authorities and hubs: a good hub points to many good
authorities, and a good authority is pointed to by many good hubs.
On one hand we can see how SNA is a very suitable tool to analyze the structure (if
there is any) of the blogosphere; on the other hand the analysis of blogosphere, thanks
to its peculiarities, provides many interesting cues for the theory evolution. Such a kind
of topological analysis of linkage structure underneath websites, the characteristics of
this structure and the comparison between different sets of web entities are only
possible using the tools provided by SNA.
Sometimes when SNA is used to study social structures in the web and the
investigated relation is only hyperlinking, we refer to it as Hyperlink Network Analysis
(HNA). HNA has been used in several different fields of research, like e-commerce
(Park et al., 2001; Palmer et al., 2000; Krebs, 2000) or international communication
(Barnett et al., 2001; Hargittai, E., 1999).
An interesting example is provided by Adamic and Adar (2003): they considered
home pages and mailing lists of MIT and Stanford University students to investigate the
presence of any factors which indicate social connections between individuals.
Classical SNA indexes like in and out-degree are here employed in addiction to some
peculiar indexes like clustering coefficient (ratio between couples of individuals linking
each other and the total possible couples, where a high value of this index indicates the
76

Social Network Analysis and IT
presence of a small world) and cohesiveness of subgroups associated with a data item,
obtained by the ratio between total and within-group density.
From a larger perspective, if we consider internet network (as defined in the
beginning of this section), Paolillo (1999) analyzed the modifications of common
language in a virtual speech community trying to identify a correlation between roles in
the network and the language modifications used. In other words, the aim of this paper
is to demonstrate that the more a node (a group of subjects in the community in this
case) is central and have strength ties with the others, the more some language
modifications, typical in a IRC, are concentrated around this group.
Some studies have explored the behaviour of users inside networks, and not only the
structure: Adamic and Adar (2005) has tried to investigate how people are able to
select among hundred of acquaintances the correct person to form the link in the chain.
Two different kinds of network have been examined: one is that of email mutual
contacts inside an Information Technology group, and one is built upon some buddy list
of Stanford students. As one could expect, it’s easier to reach a person in a network
when the network is hierarchically organized and well defined and its structure is well
known to each member of the network.
Licoppe and Smoreda (2005), starting from some previous data, advanced some
reflections on the relation between social networks and Technology (in the larger sense
of this term). These reflections were inserted in a broader analysis context of how
technologies can influence communication finalities and modalities. It seems very
interesting over all the finding that the most recent media (like SMS or Instant
Messaging Softwares) are often centred on the phatic function of communication (as
intended by Jakobson, 1960). The discursive content of the communication gestures
results less important than the message itself, and how, instead of the play between
absence and co-presence (as in traditional phone mediated communications), we
would have a play between lack of attention and absorption, between safety and
interactional vulnerability. “The risk is that ties with friends will become institutionalised
in the form of expectations and mutual obligations to be constantly available
electronically” (Licoppe & Smoreda, 2005).
In the last years CMC has become a fundamental tool for several different fields of
research and knowledge. SNA is a useful tool to understand how subjects interact with
one another through CMC. The application field of CMC is really huge but there are
some areas in which it seems to be particularly advanced: Cho, Stefanone and Gay
(2002) try to clarify how SNA can be very useful in order to analyse the development of
77
F. Martino, A. Spoto
a Computer Supported Collaborative Learning (CSCL) group; in a similar framework,
the research of Palonen and Hakkarainen (2000) aimed to investigate, using SNA,
patterns of elementary school students’ peer interaction in a CSCL environment, which
in this case was a computer supported classroom; a very interesting work has been
made by Martinez et al.(2003), using CSCL, the authors propose a mixed approach
combining traditional data sources with computer logs and integrating quantitative
statistics, qualitative data analysis and SNA to provide an overall interpretative
approach to the explanation of classroom social interactions.
In section 5, we briefly introduced the concept of Dynamic Network Analysis. DNA
has shown to have a wide range of applications in Information Technology related
fields: for example, it has been usedin the analysis of factors affecting team successes
and failures in videogames (Carley et al., 2005).
A very common problem in studying Social Networks on the web is that of data
retrieval. As Park (2003) pointed out, there are two ways to measure hyperlinks as
relations: observation and computer-assisted measurement. We find that direct
observation has been the most employed measurement technique for gathering this
kind of data (Herring, 2005). The problems associated with this method are in the
possibility of coding errors and the high labor cost (the researcher has to surf among a
huge number of sites). On the other side, the computer assisted tools up to now
developed are “idiosyncratic answering only the research question being investigated”
(Park, 2003).
7. Conclusions As we have just pointed out at the end of section 2.1, SNA has been seldom criticized
for concentrating more on methodological issue than on the empirical one (Barnes &
Harary, 1983). In this paper, we have tried to show how the formal aspects of this topic
are complex and advanced, basing on strong and consolidated mathematical theories,
such as graph theory and semi-groups algebra, and what the potentialities and the
benefits of this approach are. Many methodological problems, if concerning the
possibility to study social aspects of the web, are still to be solved, mainly in sampling.
For example, in Herring (2005), a snowball procedure has been used: in a wide and
complex relation network, constituted by a huge number of nodes (as in blogosphere, a
growing, complex and with not well defined boundaries domain), sometimes this
78
Social Network Analysis and IT
procedure could hide the real structure beneath the network, because it considers only
a limited number of links and composes a map that not necessarily corresponds to the
real one.
Also, the real meaning of a hyperlink as a communication relation, and what the
meaning of social network indexes when applied to web is, have to be investigated.
Notwithstanding these problems, Social Network Analysis could be a powerful and
useful tool for examining the social aspects on the web. As we have shown in section
6, in the last years we have seen a growing number of studies on this topic. Many
aspects should be still examined: for example, SNA indexes would be suitable for
examining online gaming communities and their behaviour. Such a community would
be easier to examine, because of a simpler sampling procedure, and the possibility to
study relations also different form hyperlinking. Another field with many potentialities is
that of Instant Messaging Software: previous research, as that shown in section 4,
describes this network as a spare and chaotic network. Some constraints could be
applied to the modalities of Instant Messaging, to give a more defined structure (for
example, to help with the search of an individual as described in Adamic & Adar, 2005).
Potentially, these new ways of communication could offer the possibility to measure
relations in a dynamic way, with the possibility given from SNA to offer some
description of how networks work and evolve. If a group communicates by computer-
mediated instruments, the analysis of role structures (as described in section 3.3) could
permit the study of complex structures, that define the group and have not been yet
studied (for example, how computer mediated communication can change the role
structure of a group). To our knowledge, there are no studies using Social Network
Analysis perspective to explore Internet or Computer Mediated Communication with the
aim to study the social structure of a group as described in section four. This is maybe
due to the fact that this kind of tools are significant only in the case of a multi-relational
network, while we know, for example, that a hyperlink network is constructed only on
the basis of one relation. We think, for example, that role algebra could be a powerful
tool to explore the difference and the structures of networks where actors use different
communication instruments to relate to each other. A relation would be constructed on
the basis of the used instrument.
As outlined in the famous paper by Barnes and Harary (1983), possibilities also arise
from a mutual exchange between SNA and ICT: new fields of applications imply the
possibility for SNA to improve the empirical applications of the theoretical findings (for
79
F. Martino, A. Spoto
example, the sampling problem described in these conclusions), with the aim to study
different and more common (in the literature) kinds of networks.
8. Acknowledgments
The authors wish to thank the anonymous reviewers for their insightful comments,
Luca Mammi and Giovanni Petrucci for their linguistic support, the HTLab people for
their availability, and prof. Luigi Burigana for his valuable advices and comments. Every
mistake has exclusively to be attributed to the two authors.
9. References
Ackland, R. (2005). Mapping the U.S. Political Blogosphere: Are Conservative Bloggers
More Prominent? mimeo. Camberra: The Australian National University.
Adamic, L. A., & Adar, E. (2003). Friend and neighbours on the web. Social Networks,
25, 211-230.
Adamic, L. A., & Adar, E. (2005). How to search a social network. Social Networks, 27,
187-203.
Adamic L. A., & Glance N. (2005). The Political Blogosphere and the 2004 U.S.
Election: Divided They Blog. 2nd Annual Workshop on the Weblogging Ecosystem:
Aggregation, Analysis and Dynamics, WWW2005. Japan.
Alba, R. D. (1973). A graph-theoretic definition of a sociometric clique. Journal of
Mathematical Sociology, 3, 113-126.
Anderson, J. G., & Jay, S. J. (1985). Computers and clinical judgement: The role of
physician networks. Social Networks, 14, 137-161.
Arabie, P., Boorman, S. A., & Levitt, P. R. (1978). Constructing blockmodels: How and
Why. Journal of Mathematical Psychology, 17, 21-63.
Barnes, J. A. (1954). Class and committee in a Norwegian island parish. Human
Relations, 7, 39-58.
Barnes, J. A., & Harary, F. (1983). Graph theory in network analysis. Social Network, 5,
235-244.
Barnett, G. A., Chon, B. S., Park, & H. W., Rosen, D. (2001). Network analysis of
international internet flows. Paper Presented to the International Sunbelt Social
Network Conference. Budapest, Hungary.
Blau, P. M. (1977). Inequality and Heterogeneity. New York: Free Press.
80

Social Network Analysis and IT
Bonacich, P. (1987). Power and centrality: A family of measures. American Journal of
Sociology, 92, 1170-1182.
Boorman, S. A., & White, H. C. (1976). Social structures from multiple networks: II.
Role structures. American Journal of Sociology, 81, 1384-1446.
Bornholdt, S., & Schuster, H. G., (2003). Handbook of Graphs and Networks: From the
Genome to the Internet. Berlin: Wiley.
Breiger, R. L., Boorman, S. A., & Arabie, P. (1975). An algorithm for clustering
relational data with applications to social network analysis and comparisons with
multidimensional scaling. Journal of Mathematical Psychology, 12, 21-57.
Carley, K.M. (2002). Group stability: A socio-cognitive approach. In E., Lawler, B.,
Markowsky, C., Ridgeway, & H., Walker, (eds.). Advances in Group Processes.
Greenwich, CN, JAI PRESS.
Carley, K.M. (2003). Dynamic Network Analysis. In R. Breiger, K. Carley & P.,Pattison,
(eds.), Dynamic Social Network Modelling and Analysis: Workshop Summary and
Papers. Washington, D.C.: The National Academies Press.
Carley, K.M., Moon, I.C., Schneider, M., & Shigiltchoff, O. (2005). Detailed Analysis of
Factors Affecting Team Success and Failure in the America's Army Game.
Retrieved May 21, 2006 from
http://www.casos.cs.cmu.edu/projects/americas_army/TR-AA10.doc
Carrington, P. J., Scott, J., & Wasserman, S. (2005). Models and Methods in Social
Network Analysis. Cambridge: Cambridge University Press.
Cartwright, D., & Harary, F. (1956). Structural Balance: a Generalisation of Heider’s
Theory. Psychological Review, 63, 277-293.
Cartwright, D. & Harary, F. (1977). A graph-theoretic approach to the investigation of
system-environment relationship. Journal of Mathematical Sociology, 5, 87-111.
Cho, H., Stefanone, M., & Gay, G. (2002). Social Information Sharing in a CSCL
Community. Proceedings of CSCL 2002, Boulder (CO), 43-50.
Coates, D. L. (1987). Gender differences in the structure and support characteristics of
black adolescents’ social network. Sex Roles, 63, 277-293.
Davis, J. A. (1967). Clustering and structural balance in graph. Human Relations, 20,
181-187.
Dellarocas, C. (2003). The Digitization of Word of Mouth: Promise and Challenges of
Online Feedback Mechanisms. Management Science, 49 (10), 1407-1424.
Doreian, P. (1987). Measuring regular equivalence in symmetric structures. Social
Networks, 9, 89-107.
81

F. Martino, A. Spoto
Erickson, B. (1978). Some problems of inference from chain data. In K. F. Schuessler,
Sociological Methodology. San Francisco: Jossey Bass.
Fararo, T. J. & Skorovetz, J. (1984). Biased networks and social structure theorems.
Part II. Social Networks, 6, 223-258.
Festinger, L. (1949). The analysis of sociograms using matrix algebra. Human
Relations, 7, 117-140.
Frank, O. (1979). Estimation of population totals by use of snowball samples. In P. W.
Holland, & S. Leinhardt, Perspective on Social Network Research, (pp. 319-348).
New York: Academic Press.
Frank, O. (1988). Random sampling and Social Networks: A Survey of Various
Approaches. Mathématiques, Informatique et Sciences Humaines, 104, 19-33.
Frank, O., Hallinan, M., & Nowicki, K. (1985). Clustering of dyad distributions as a tool
in network modelling. Journal of Mathematical Sociology, 11, 47-64.
Freeman, L. C. (1977). A set of measures of centrality based on betweenness.
Sociometry, 40, 35-41.
Freeman, L. C. (1979). Centrality in social networks: I. Conceptual clarification. Social
Networks, 1, 215-239.
Freeman, L. C., 1986. The impact of computer based communication on the social
structure of an emerging scientific speciality. Social network, 6, 201-221.
Freeman, L. (1996). Some antecedents of Social Network Analysis. Connections, 19,
39-42.
Freeman, L. C., Roeder, D., & Mulholland, R. R. (1980). Centrality in social networks:
II. Experimental results. Social Networks, 2,119-141.
Friedkin, N. E. (1984). Structural cohesion and equivalence explanation of social
homogeneity. Social Methods and Research, 12, 235-261.
Goodman, L. A. (1961). Snowball sampling. Annals of Mathematical Statistics, 32, 148-
170.
Granovetter, M. (1973). The strength of weak ties. American Journal of Sociology, 78,
1360-1380.
Granovetter, M. (1974). Getting a job. Cambridge (MA): Harvard University Press.
Granovetter, M. (1985). Economic Action and Social structure: The problem of
Embeddedness. American Journal of Sociology, 91, 481-510.
Hage, P. (1973). A graph theoretic approach to the analysis of alliance structure and
local grouping in Highland New Guinea. Anthropological Forum, 3, 280-294.
Harary, F., Norman, R. Z., & Cartwright, D., 1965. Structural models. New York: Wiley.
82
Social Network Analysis and IT
Harary, F. (1969). Graph Theory. Reading, MA: Addison-Wesley.
Hargittai, E. (1999). Weaving the western web: Explaining differences in Internet
connectivity among OECD countries. Telecommunications Policy, 23, 701-718.
Heider, F. (1946). Attitudes and Cognitive Orientation. Journal of Psychology, 21, 107-
112.
Heider, F. (1958). The Psychology of Interpersonal Relations. New York: John Wiley
and Sons.
Herring, S. C., Kouper, I., Paolillo, J. C., Scheidt, L. A., Tyworth, M., Welsch, P.,
Wright, E., & Yu, N. (2005). Conversations in the Blogosphere: An Analysis "From
the Bottom Up". Proceedings of the 38th Hawaii International Conference on
System Sciences. Waikoloa, Big Island, Hawaii.
Holland, P. W., & Leinhardt, S. (1970). A method for detecting structure in sociometric
data. American Journal of Sociology, 70, 492-513.
Holland, P. W., & Leinhardt, S. (1971). Transitivity in structural models of small groups.
Comparative Group Studies, 2, 107-124.
Holland, P. W., & Leinhardt, S. (1981). An exponential family of probability distributions
for direct graphs. Journal of the American Statistical Association, 76, 33-65.
Homans, G. (1951). The Human Group, London: Routledge and Kegan Paul.
Jakobson, R. (1960). Linguistics and poetics. In Sebeok, T. A., Style in language. New
York: Wiley.
Katz, L., & Powell, J. H. (1955). Measurement of the tendency toward reciprocation of
choice. Sociometry, 18, 659-665.
Knoke, D., & Burt, R.S., (1983). Prominence. In R. S., Burt, & M. J. Minor,. (eds.),
Applied Network Analysis, 195-222. Newbury Park, CA: Sage.
Koehly, L. M., & Pattison, P. (2005). Random graph models for social networks:
multiple relations or multiple raters. In P. J., Carrington, J., Scott, & S. Wasserman,.
(eds.). Models and Methods in Social Network Analysis. Cambridge: Cambridge
University Press.
König, D. (1936). Theorie der endlichen und enendlichen Graphen. New York:
Chelsea.
Krebs, V. (2000). Working in the connected world book network. International
Association for Human Resource Management Journal, 4 (1), 87-90.
Laumann, E. O., & Pappi, F., (1976). Networks of Collective Action: A Perspective on
Community Influence Systems. New York: Academic Press.
83

F. Martino, A. Spoto
Leavitt, H. J. (1951). Some effects of communication patterns on group performance.
Journal of Abnormal and Social Psychology, 46, 38-50.
Licoppe, C., & Smoreda, Z., (2005). Are social networks technologically embedded?
How networks are changing today with changes in communication technology.
Social networks, 27, 317-335.
Lorrain, F. (1972). The network-organisation of social-systems and cultural modes of
classification. Doctoral dissertation. Department of Sociology, Harvard.
Lorrain, F., & White, H. C., (1971). Structural Equivalence of Individuals in Social
Networks. Journal of Mathematical Sociology, 1, 49-80.
Luce, R. D., & Perry, A. D. (1949). A method of matrix analysis of group structure.
Psychometrika, 14, 95-116.
Luce, R. D. (1950). Connectivity and generalized cliques in sociometric group structure.
Psychometrika, 15, 159-190.
Martinez, A., Dimitriadis, Y., Rubia, B., Gomez, E., & de la Fuente, P. (2003).
Combining qualitative evaluation and social network analysis for the study of
classroom social interactions. Computers & Education, 41, 353-368.
Mayo, E. (1945). The Social Problems of an Industrial Civilization. London: Routledge
and Kegan Paul.
Milgram, S. (1967). The small world problem. Psychology Today, 22, 61-67.
Mitchell, J. C. (1969). Social Networks in urban Situations. Manchester: Manchester
University Press.
Mitchell. J. C. (ed.) (1980). Numerical Techniques in Social Anthropology. Philadelphia:
Institute for the Study of Human Issues.
Mokken, R. J. (1979). Cliques, clubs and clans. Quality and Quantity, 13, 161-173.
Moreno, J. (1934). Who shall survive? New York: Beacon Press.
Nadel, S. F. (1957). The theory of Social Structure. London: Cohen and West.
Palmer, J. W., Bailey, J. P. & Faraj, S. (2000). The role of intermediaries in the
development of trust on the WWW: the use and prominence of trusted third parties
and privacy statements. Journal of Computer-Mediated Communication, 5 (3).
Retrieved May 5, 2006 from http://www.jcmc.indiana.edu.
Palonen, T., & Hakkarainen, K. (2000). Patterns of Interaction in Computer-Supported
Learning: A Social Network Analysis. In Fourth International Conference of the
Learning Sciences . Mahwah, NJ; Erlbaum.
84

Social Network Analysis and IT
Paolillo, J. C., (1999). The Virtual Speech Community: Social Network and Language
Variation on IRC. Proceedings of the 32nd Hawaii International Conference on
System Sciences. Waiokola, Big Island, Hawaii.
Park, H. W., Barnett, G. A., & Nam, Y. I. (2001). Affiliation network structure of top
websites: examining affiliates with hyperlink in Korea. Paper presented to the
International Sunbelt Social Network Conference. Budapest, Hungary.
Park, H. W. (2003). Hyperlink network analysis: a new method for the study of social
structures on the web. Connections, 25, 1, 49-61.
Pattison, P. (1993). Algebraic Model for Social networks. Cambridge (MA): Cambridge
University Press.
Pattison, P., & Bartlett, W. K. (1982). The Analysis of Semi-groups of Multirelational
Systems. Journal of Mathematical psychology, 25, 87-118.
Pattison, P., Wasserman, S. (1995). Constructing Algebraic Models for Local Social
networks Using Statistical Methods. Journal of Mathematical Psychology, 39, 57-
72.
Pattison, P., Wasserman, S., Robins, G., & Kanfer, A. M. (2000). Statistical evaluation
of Algebraic Constraints for Social Networks. Journal of Mathematical Psychology,
44, 536-568.
Peay, E. R. (1975a). Nonmetric grouping: clusters and cliques. Psychometrika, 40,
297-313.
Peay, E. R. (1975b). Grouping by cliques for directed relationships. Psychometrika, 40,
573-574.
Peay, E. R. (1980). Connectedness in general model for valued networks. Social
Networks, 2, 385-410.
Pitts, F.R. (1965). A graph theoretic approach to historical geography. The Professional
Geographer, 17, 15-20.
Pitts, F.R. (1979). The medieval river trade network of Russia revisited. Social
Networks, 1, 285-292.
Scott, J. (1991). Social Network Analysis. Handbook. London: Sage Publication Ltd.
Seidman, S. B. (1983b). Network structure and minimum degree. Social Networks. 5,
97-107.
Seidman, S. B., & Foster, B. L. (1978a). A graph-theoretic generalization of the clique
concept. Journal of Mathematical Sociology, 6, 139-154.
Skog, O. J. (1986). The long ways of alcohol consumption: A Social Network
perspective on cultural change. Social networks, 8, 1-32.
85
F. Martino, A. Spoto
Snijders, T. A. B. (2005). Models for longitudinal network data. In P. J. Carrington, J.
Scott, & S. Wasserman, (eds). Models and Methods in Social Network Analysis.
Cambridge: Cambridge University Press.
Warner, W. L., & Lunt, P. S. (1941). The social life of a Modern Community. New
Haven: Yale University Press.
Wasserman, S. (1987). Conformity of two sociometric relations. Psychometrika, 52(1),
3-18.
Wasserman, S & Iacobucci, D. (1988). Sequential social network data. Psychometrika,
53(2), 261-282.
Wasserman, S. & Faust, K. (1994). Social Network Analysis. Methods and
Applications. Cambridge (MA): Cambridge University Press.
Wasserman, S., & Robbins, G. (2005). An introduction to random graphs, dependence
graphs, and p*. In P. J. Carrington, J. Scott, & S. Wasserman, (eds.). Models and
Methods in Social Network Analysis. Cambridge: Cambridge University Press.
Watts, D. J., Dodds, P. S., Newman, & M. E. J. (2002). Identity and search in social
networks. Science, 296, 1302-1305.
Watts, D. J., & Strogatz, S. H. (1998). Collective dynamics of ‘small world’ networks.
Nature, 393, 440-442.
Wellman, B. (1988). Structural Analysis: From Method and Metaphor to Theory and
Substance. In B. Wellman, & S. D. Berkowitz, Social structures: A network
Approach. New York: Cambridge University Press.
White, H. C. (1963). An anatomy of Kinship, Englewood Cliffs (NJ): Prentice-Hall.
White, H. C., Boorman, S. A., & Breiger, R. L. (1976). Social structure from multiple
networks: I. Blockmodel of roles and positions. American Journal of Sociology, 81,
730-780.
Wille, R. (1982). Restructuring lattice theory: An approach based on hierarchies of
concepts. In I. Rival (Ed.). Ordered Sets. pp. 445-470. Dordrecht: Reidel.
Zachary, W. W. (1977). An Information flow model for conflict and fission in small
groups. Journal of Anthropological Research, 13, 452-473.
86