Social Network Analysis as an Intelligence Technique: the ... · Providers and Seekers . ... A Case...
23
by Graham Durant-Law CSC Social Network Analysis as an Intelligence Technique: the Iranian Nuclear Weapons Program Revisited. (Sometimes a Picture is Only Worth a Couple of Words!) Copyright © 2011 – HyperEdge Pty Ltd
Transcript of Social Network Analysis as an Intelligence Technique: the ... · Providers and Seekers . ... A Case...

by Graham Durant-Law CSC
Social Network Analysis as an Intelligence Technique: the Iranian Nuclear Weapons Program Revisited.
(Sometimes a Picture is Only Worth a Couple of Words!)
Copyright © 2011 – HyperEdge Pty Ltd

Presentation Outline
A Quick Network Analysis Lesson – What is the lexicon of network analysis? – Typical measures. – Network analysis nirvana.
A Case Study: Iranian Nuclear Physicists
– The network. – The same network. – Discrete network.
Concluding Comments
Copyright © 2011 – HyperEdge Pty Ltd 2

A Quick Network Analysis Lesson.
‘Science is built with facts, as a house is with stones. But a collection of facts is no more a science than a heap of stones is a house’.
Henri Poincare, Mathematician, 1901.
Copyright © 2011 – HyperEdge Pty Ltd

What is Network Analysis?
Network analysis is based on an assumption of the importance of relationships among interacting nodes.
A methodology that provides the ability to examine quantitatively, qualitatively, and graphically macro and micro linkages between nodes.
A connection between two or more nodes means there is some sort of relationship.
Unit of data is the dyad – pairs of nodes.
4 Copyright © 2011 – HyperEdge Pty Ltd

What is the Lexicon of Network Analysis?
A node is the smallest unit in the network. It is also known as a vertex or entity.
A tie is a line between two nodes indicating there is a relationship between them. It is also known as an edge or link.
A graph is a set of nodes and a set of ties between pairs of nodes.
A network consists of a graph and additional information on the nodes or the ties of the graph. It is also known as a map.
5 Copyright © 2011 – HyperEdge Pty Ltd

Social and Organisational Network Analysis How work really gets done – the formal versus shadow organisation
Enterprise
Portfolio 1
Program A Program B
Portfolio 2
Program C Program D
Portfolio 3
Program E
• How does your organisation really work?
• What is the gap between the formal and shadow organisation?
• What is the optimum structure? • How do people interact across
portfolios, and between programs?
• Who are the informal leaders? • Who must be engaged to effect
change?
6 Copyright © 2011 – HyperEdge Pty Ltd

Typical Measures
Copyright © 2011: HyperEdge Pty Ltd 7
Degree (ties or links): in ties and out ties represent the number of connections to and from a node.
Density: the percentage of connections that exist out of the total possible that could exist.
Distance: degrees of separation or the diameter of a network.
Reciprocity: the number of bi-directional links expressed as a percentage.
Centrality: the extent to which a network is organised around one or more central nodes.

Organisation Dynamics
Reveals how much activity is going on and who are the most active members by counting the number of direct links each person has to others in the network. Does not necessarily describe power or influence.
People at the centre of the network: • are the connector or hub of
the network, • may be in an advantaged
position in the network. • are usually less dependent
on other individuals. • are often a deal maker or
broker.
Highlights people with the shortest paths to other people, thus allowing them to directly pass on and receive communications quicker than others in the organisation. Is strongly correlated with organisational influence if the individual is a skilled communicator. These individuals are often network brokers. They are often the ‘pulse-takers’ of the organisation.
Providers and Seekers degree centrality
Transmitters and Receivers closeness centrality
8 Copyright © 2011 – HyperEdge Pty Ltd

Organisation Dynamics (continued)
Reveals individuals who: • connect disparate groups
within the network. • hold a favoured or
powerful position in the network.
• have great influence over what is communicated through the network.
• act as intermediaries
Identifies the bridges within the network. They may act as the true gatekeeper deciding what does or does not get passed through the network, or as the “third who benefits” by passing information to others to secure advantage. .
Measures how well connected a person is and how much direct influence they may have over the most active people in the network Measures how close a person is to other highly connected people in terms of the global or overall makeup of the network Is a reasonable measure of “network positional advantage” and/or perceived power.
Brokers and Gatekeepers betweenness centrality
Influencers eigenvector centrality
9 Copyright © 2011 – HyperEdge Pty Ltd

Network Analysis Nirvana
Every node is visible.
Every node’s degree is countable: that is the number and direction of ties.
Every tie can be followed from source to destination.
Clusters and outliers are identifiable.
10 Copyright © 2011 – HyperEdge Pty Ltd

A Case Study: Iranian Nuclear Physicists
‘Simply because your data links people and you can visualise that, it does not mean you have performed network analysis. This is akin to displaying a line plot of some stock's price over a quarter and claiming you have performed statistical analysis – all you have done is report data!’
Drew Conway, Political Scientist, 2009.
Copyright © 2011 – HyperEdge Pty Ltd 11

The Network? (network analysis nirvana?)
12 Copyright © 2011 – HyperEdge Pty Ltd

Cut-Points (people holding the network together)
13 Copyright © 2011 – HyperEdge Pty Ltd

Nodes Sized by Degree (in and out links)
14 Copyright © 2011 – HyperEdge Pty Ltd

Nodes Sized by Betweenness (ability to get to others)
15 Copyright © 2011 – HyperEdge Pty Ltd

The Same Network! (closer to network analysis nirvana)
16 Copyright © 2011 – HyperEdge Pty Ltd

Discrete Network
17 Copyright © 2011 – HyperEdge Pty Ltd

Degree Centrality (Providers and Seekers)
18 Copyright © 2011 – HyperEdge Pty Ltd

Betweenness Centrality (ability to get to others - brokers and gatekeepers)
19 Copyright © 2011 – HyperEdge Pty Ltd
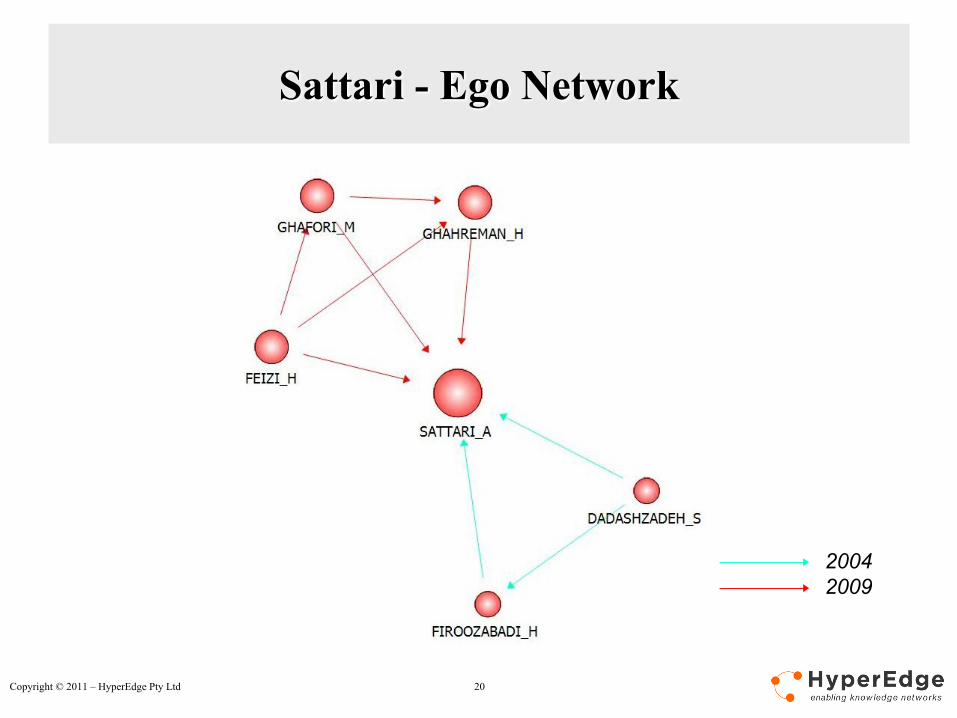
Sattari - Ego Network
2004 2009
20 Copyright © 2011 – HyperEdge Pty Ltd

Concluding Comments
‘The real questions refuse to be placated… They are the questions asked most frequently and answered most inadequately, the ones that reveal their true natures slowly, reluctantly, most often against your will’.
Ingrid Bengis, Author, 1973
Copyright © 2011 – HyperEdge Pty Ltd 21

Some Issues and Cautions
Must clearly define the ‘unit of analysis’ – that is what are nodes, what are ties, and what are attributes.
Observations are usually regarded as the population of interest rather than a sample of some larger population of possible observations.
Must define the population, and then cover the whole population to get meaningful network statistics.
The mathematical algorithms in the software treat the data as ‘deterministic’. That is, measurements are viewed as an accurate reflection of the ‘real’ or ‘final’ or ‘equilibrium’ state of the network. Clearly they are not!
Use the right tool and presentation for the job! Visualisation is not analysis.
Seek network analysis nirvana.
Above all else you must understand your organisation, the data, the resultant network and the assumptions you are making!
Copyright © 2011 – HyperEdge Pty Ltd 22

For more details please visit our website at: www.hyperedge.com.au Alternatively contact: Graham Durant-Law CSC +61 (0) 408 975 795 [email protected] Lyn Goldsworthy AM + 61 (0) 412 300 642 [email protected] HyperEdge Pty Ltd Post Office Box 3076 Manuka ACT 2603 Australia
Copyright © 2011 – HyperEdge Pty Ltd