SOCIAL MEDIA TRENDS - fipp.s3.amazonaws.comfipp.s3.amazonaws.com/media/documents/FIPP World Media...
39
TRENDS SPECIAL REPORT VIDEO SOCIAL MEDIA MOBILE BIG DATA CONTENT MAGAZINE MEDIA REVENUE SOCIAL MEDIA TRENDS
-
Upload
trinhduong -
Category
Documents
-
view
228 -
download
2
Transcript of SOCIAL MEDIA TRENDS - fipp.s3.amazonaws.comfipp.s3.amazonaws.com/media/documents/FIPP World Media...
TRENDS SPECIAL REPORTVIDEO
SOCIAL MEDIAMOBILE
BIG DATACONTENT
MAGAZINE MEDIAREVENUE
SOCIALMEDIATRENDS
2
GLOBAL SOCIAL MEDIA TRENDS 2015
Welcome to our second FIPP World Media Trendsspecial report.The second FIPP Insight and World Newsmedia Network in-depth special World Media Trends report focuses on social media opportunities and strategies.
Each report is packed with data charts, commentary on trends and practical, usable case studies.
Through 2015, FIPP Insight and WNMN will release six such special reports (alongside other FIPP Insight reports), all of them free to FIPP.com users.
Contact André Glazier at FIPP ([email protected]) for unique commercial opportunities in the FIPP Insight reports.
Topics for the year are:1. Video2. Social media and messaging apps3. Mobile (smartphones, tablets and feature phones)4. Content5. Revenue6. Magazine media (i.e. multi-platform brands)
To compile the reports, WNMN sources evidence-based data from sources around the world, analyses the data and provides commen-tary on top trends identified, trends you should be considering in your business today.
This report, on video, includes case studies from Meredith Corpora-tion in the USA and Burda Media in Germany. We also look at what is happening elsewhere with for example BBC.co.uk, Kyoda News in Japan and a look at what newspapers are doing in this field, given lines have become so blurred and media brands today have to com-pete 24/7 for the attention of the audience.
There will be much more to come this year.Visit FIPP.com/Insight for news on upcoming reports and for any queries about this report and ones to follow. Contact FIPP’s Head of Insight, Helen Bland at [email protected] or +44 7404 4169.
AUTHOR and PUBLISHERMartha L StoneWorld Newsmedia [email protected]
EDITORIAL DIRECTORLeah McBride Mensching
DESIGNERJohn Moreno
REPORT LICENSEE
FIPPwww.fipp.com
PROJECT MANAGERHelen [email protected]
COMMERCIAL MANAGERAndré Glazier
COVER DESIGNIan Crawford
FIPP – the worldwide magazine media association represents compa-nies and individuals involved in the creation, publishing or distribu-tion of quality content, in whatever form, by whatever channel, and in the most appropriate frequency, to defined audiences of interest.
FIPP exists so that its members develop better strategies and build better media businesses by identifying and communicating emerging trends, sharing knowledge, and improving skills worldwide.
Further FIPP Insight special reports and other resources at www.fipp.com/Insight
© World Newsmedia Network 2015
All rights reserved, except by prior written permission of FIPP, the worldwide magazine media association, no partof this work may be copied or publicly distributed, displayed or disseminated by any means of publication or communication now known or developed hereafter, including in or by any:
1. i) directory or compilation or other printed publication; 2. ii) information storage and retrieval system 3. iii) electronic device, including any analogue or digital visual or audio visual device or product
Data is provided with thanks to contributors of this book. Every effort has been made in the preparation of this report to ensure ac-curacy of the content, but FiPP, the publishers and WNMN, the copy-right owners, cannot accept liability in respect of errors or omissions. Readers will appreciate that the data is only as up to date as publica-tion schedules and contributors will allow, and is subject to change.
WNMNWORLD NEWSMEDIA NETWORK
WNMNWORLD NEWSMEDIA NETWORK
GLOBAL SOCIAL MEDIA TRENDS2015
Video usage and revenues are growing exponentially around the world. Publishers should drive strategies and tactics to leverage this inexorable trend
WNMNWORLD NEWSMEDIA NETWORK
WNMNWORLD NEWSMEDIA NETWORK
3
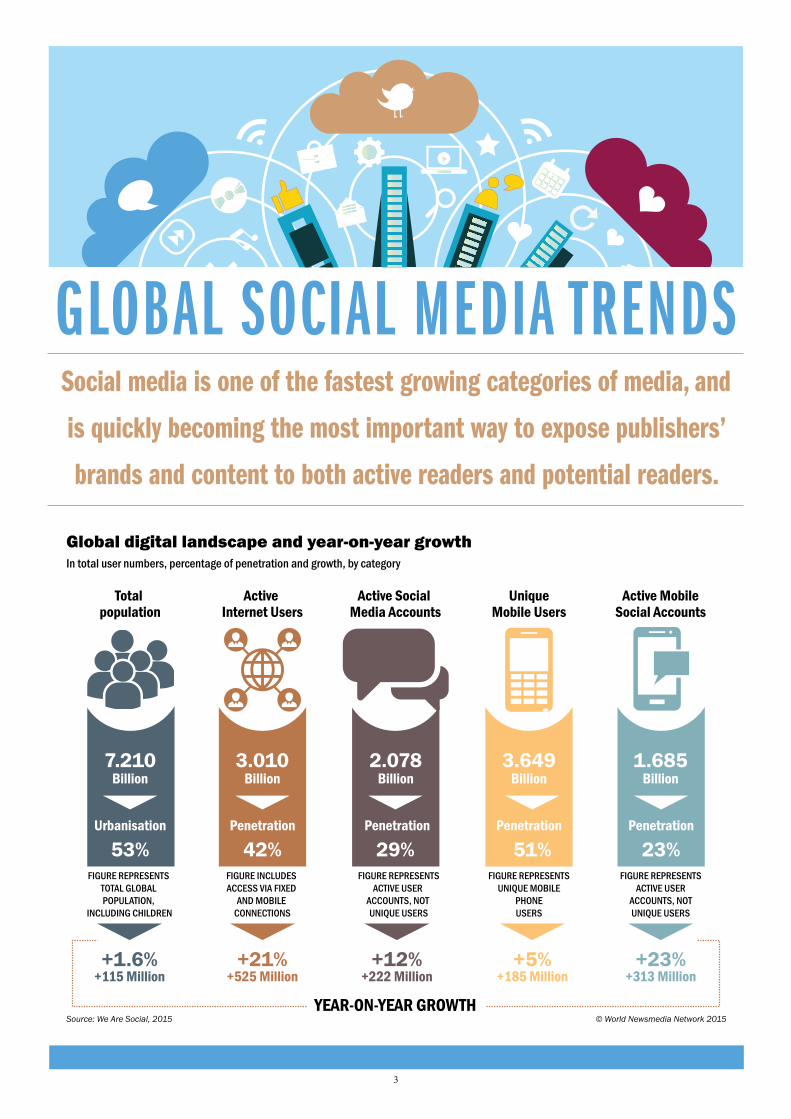
GLOBAL SOCIAL MEDIA TRENDSSocial media is one of the fastest growing categories of media, and
is quickly becoming the most important way to expose publishers’
brands and content to both active readers and potential readers.
Global digital landscape and year-on-year growthIn total user numbers, percentage of penetration and growth, by category
Source: We Are Social, 2015 © World Newsmedia Network 2015
FIGURE REPRESENTS TOTAL GLOBAL POPULATION,
INCLUDING CHILDREN
FIGURE INCLUDES ACCESS VIA FIXED
AND MOBILE CONNECTIONS
FIGURE REPRESENTSACTIVE USER
ACCOUNTS, NOT UNIQUE USERS
FIGURE REPRESENTSUNIQUE MOBILE
PHONEUSERS
FIGURE REPRESENTSACTIVE USER
ACCOUNTS, NOTUNIQUE USERS
Total population
YEAR-ON-YEAR GROWTH
Active Internet Users
Active Social Media Accounts
UniqueMobile Users
Active MobileSocial Accounts
7.210Billion
53%
+1.6% +21% +12% +5% +23%
42% 29% 51% 23%Urbanisation
+115 Million +525 Million +222 Million +185 Million +313 Million
Penetration Penetration Penetration Penetration
3.010Billion
2.078Billion
3.649Billion
1.685Billion
4
GLOBAL SOCIAL MEDIA TRENDS 2015
Connecting with audiences through social media is impera-tive, as 2.078 billion user accounts exist across all social media platforms, according to We Are Social’s annual report on the state of social media around the world. These user accounts represent 29 percent of the world’s total population of 7.21 bil-lion, as well as two-thirds of all Internet users globally. Social media penetration grew by 222 million from 2014 to 2015 – a 12 percent year-over-year increase, according to the report, published in Jan. 2015.
Publishers of magazines and newspapers are tapping into this unbridled growth and, in turn, are experiencing double-digit growth in social media referral traffic to their websites.
The significant growth of social media referral traffic is a result of two overarching trends:
• Profound changes in the way social media users in-teract with content on social media sites, particularly their greater likelihood to share content they trust or are interested in
• More aggressive actions on the part of publishers to share content on social media platforms and to opti-mise this content for sharing by preparing headlines, photos, video and body copy specifically tailored for each social media network, including Facebook, Twit-ter, Instagram, Snapchat, Reddit and more.
Publishers are recognising it is no longer enough for them to simply maintain Facebook pages, Twitter handles and Insta-gram accounts. Media companies must actively invest in social media strategies to drive traffic to their content and brands, in order to drive growing revenues.
Referral traffic studies and individual publisher reports cor-roborate that publisher content referrals from social media are outpacing the incumbent leader in referrals – search engines.
For publishers, social media optimisation (SMO) is a powerful and necessary marketing strategy for the future. Further, part-nerships with global social networks to achieve greater expo-sure and revenue share may be a smart option for publishers in the short term, however, proceed with caution. Partnerships with the likes of Facebook and Snapchat may be riddled with potential competitive dangers for the future.
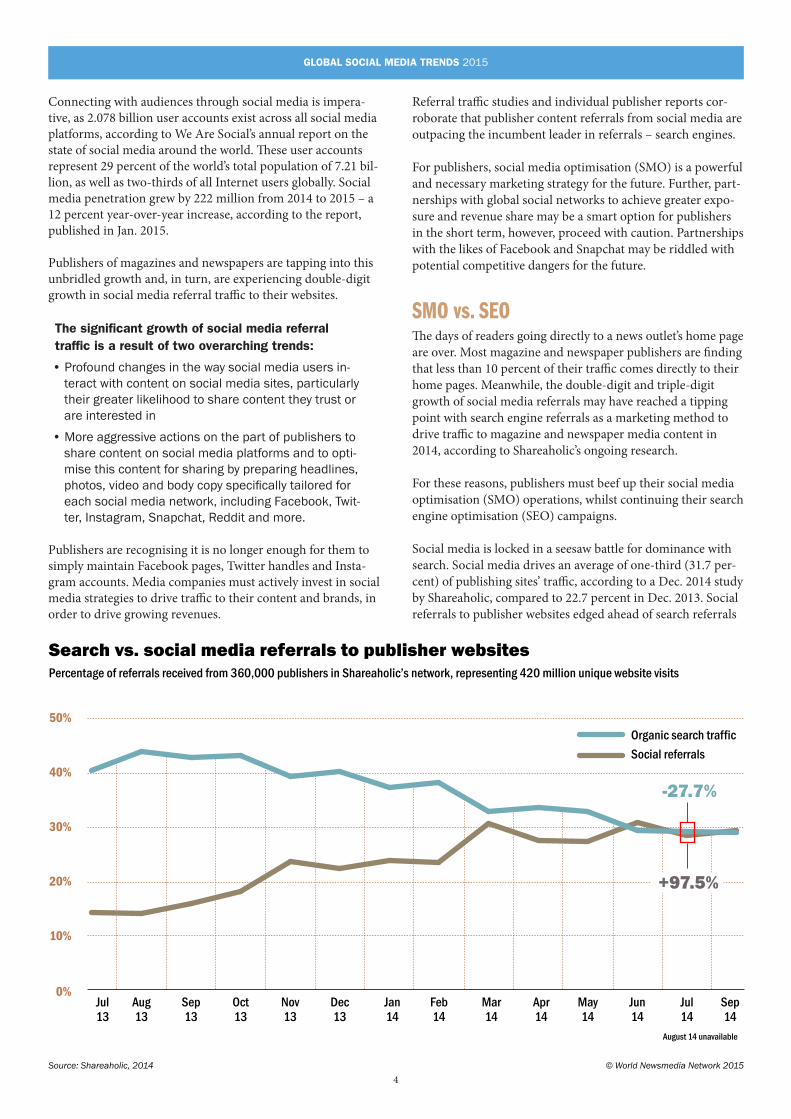
SMO vs. SEOThe days of readers going directly to a news outlet’s home page are over. Most magazine and newspaper publishers are finding that less than 10 percent of their traffic comes directly to their home pages. Meanwhile, the double-digit and triple-digit growth of social media referrals may have reached a tipping point with search engine referrals as a marketing method to drive traffic to magazine and newspaper media content in 2014, according to Shareaholic’s ongoing research.
For these reasons, publishers must beef up their social media optimisation (SMO) operations, whilst continuing their search engine optimisation (SEO) campaigns.
Social media is locked in a seesaw battle for dominance with search. Social media drives an average of one-third (31.7 per-cent) of publishing sites’ traffic, according to a Dec. 2014 study by Shareaholic, compared to 22.7 percent in Dec. 2013. Social referrals to publisher websites edged ahead of search referrals
Search vs. social media referrals to publisher websitesPercentage of referrals received from 360,000 publishers in Shareaholic’s network, representing 420 million unique website visits
3.global.shareaholic.searchvssocialreferrals
Source: Shareaholic, 2014 © World Newsmedia Network 2015
Jul13
Aug13
Sep13
Oct13
Nov13
Dec13
Jan14
Feb14
Mar14
Apr14
May14
Jun14
Jul14
Sep14
August 14 unavailable
10%
0%
20%
30%
40%
50%Organic search traffic
Social referrals
-27.7%
+97.5%
5
GLOBAL SOCIAL MEDIA TRENDS 2015
in June 2014 (30.9 percent vs. 29.4 percent) and Sept. 2014 (29.4 percent vs. 29.1 percent), with referrals drawn from 360,000 websites and 420 million unique website visits.
Anecdotally, publishers are reporting that the percentage of referral traffic from social networks is much higher: BuzzFeed reports 80 percent of its Web traffic is driven by social media, while Quartz reports 70 percent is “side door” (non-home page) traffic from social. Facebook alone accounts for more than half of Hearst magazines’ referral traffic.
Meanwhile De Persgroep, a newspaper and magazine publisher in Belgium, the Netherlands and Denmark, reports that 30 percent of its traffic came from social media referrals in 2014, while 22 percent came from search, 23 percent directly to apps and 14 percent directly to the site. Social media referrals are up 179 percent from 2013, leapfrogging search-driven referrals.
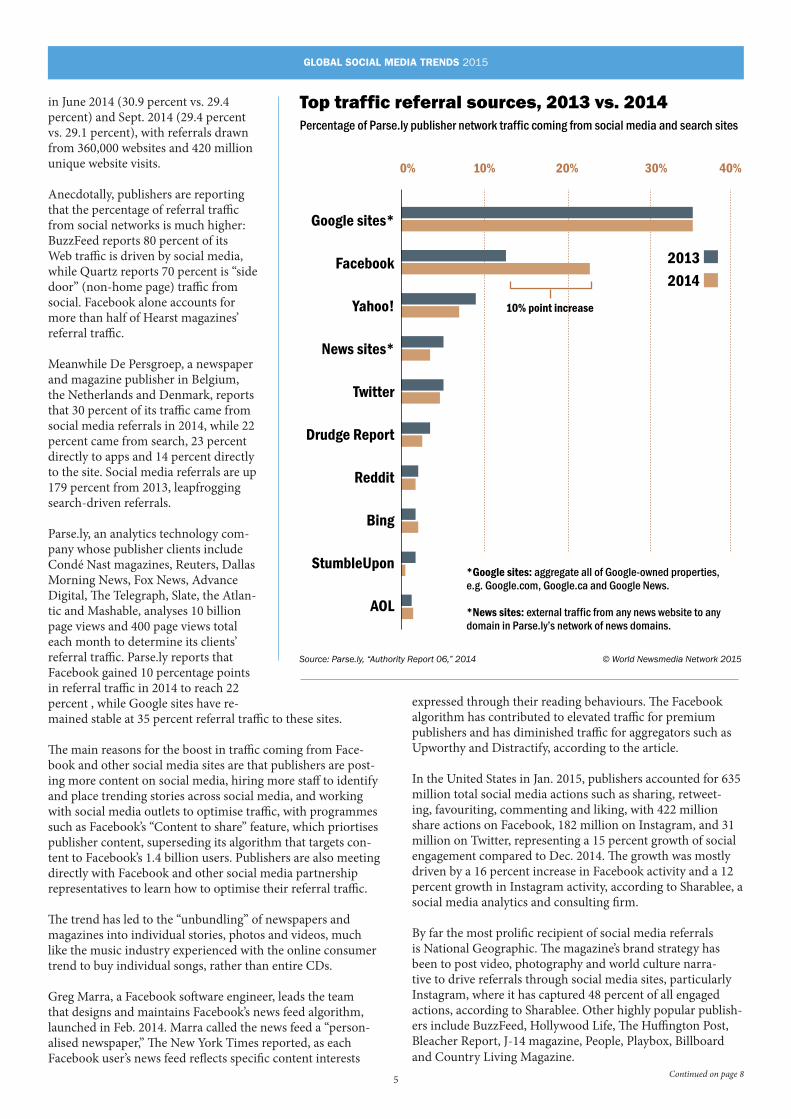
Parse.ly, an analytics technology com-pany whose publisher clients include Condé Nast magazines, Reuters, Dallas Morning News, Fox News, Advance Digital, The Telegraph, Slate, the Atlan-tic and Mashable, analyses 10 billion page views and 400 page views total each month to determine its clients’ referral traffic. Parse.ly reports that Facebook gained 10 percentage points in referral traffic in 2014 to reach 22 percent , while Google sites have re-mained stable at 35 percent referral traffic to these sites.
The main reasons for the boost in traffic coming from Face-book and other social media sites are that publishers are post-ing more content on social media, hiring more staff to identify and place trending stories across social media, and working with social media outlets to optimise traffic, with programmes such as Facebook’s “Content to share” feature, which priortises publisher content, superseding its algorithm that targets con-tent to Facebook’s 1.4 billion users. Publishers are also meeting directly with Facebook and other social media partnership representatives to learn how to optimise their referral traffic.
The trend has led to the “unbundling” of newspapers and magazines into individual stories, photos and videos, much like the music industry experienced with the online consumer trend to buy individual songs, rather than entire CDs.
Greg Marra, a Facebook software engineer, leads the team that designs and maintains Facebook’s news feed algorithm, launched in Feb. 2014. Marra called the news feed a “person-alised newspaper,” The New York Times reported, as each Facebook user’s news feed reflects specific content interests
expressed through their reading behaviours. The Facebook algorithm has contributed to elevated traffic for premium publishers and has diminished traffic for aggregators such as Upworthy and Distractify, according to the article.
In the United States in Jan. 2015, publishers accounted for 635 million total social media actions such as sharing, retweet-ing, favouriting, commenting and liking, with 422 million share actions on Facebook, 182 million on Instagram, and 31 million on Twitter, representing a 15 percent growth of social engagement compared to Dec. 2014. The growth was mostly driven by a 16 percent increase in Facebook activity and a 12 percent growth in Instagram activity, according to Sharablee, a social media analytics and consulting firm.
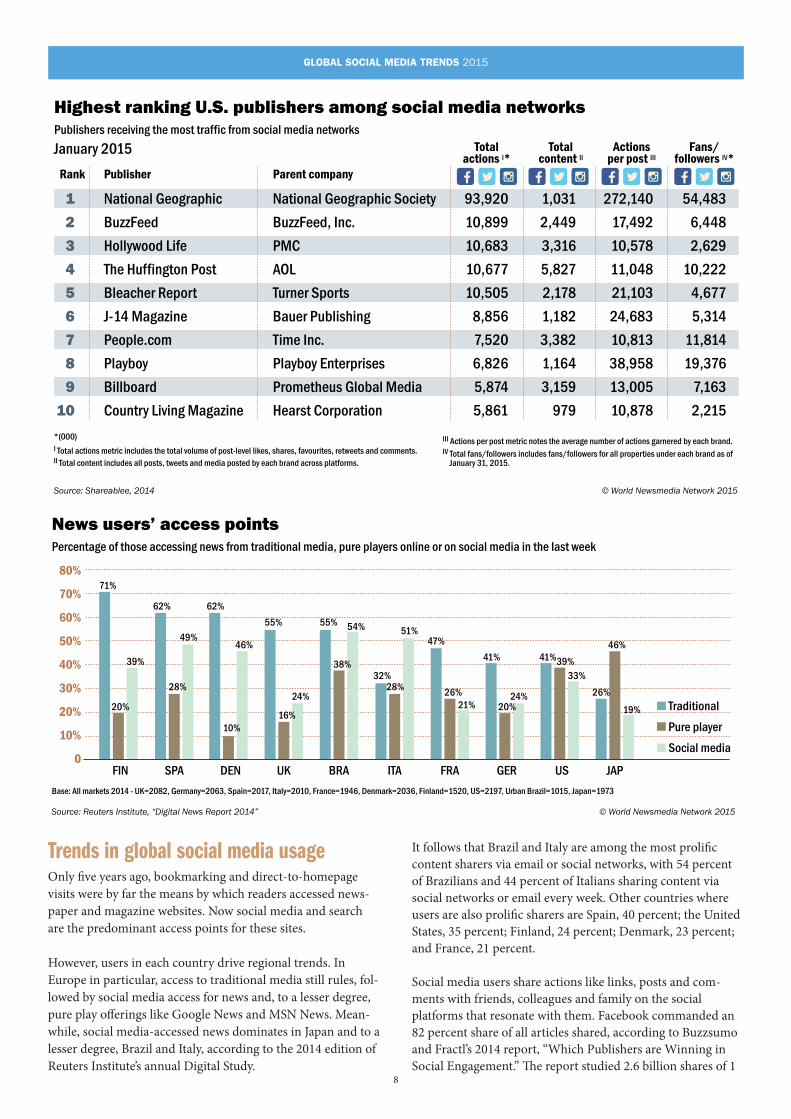
By far the most prolific recipient of social media referrals is National Geographic. The magazine’s brand strategy has been to post video, photography and world culture narra-tive to drive referrals through social media sites, particularly Instagram, where it has captured 48 percent of all engaged actions, according to Sharablee. Other highly popular publish-ers include BuzzFeed, Hollywood Life, The Huffington Post, Bleacher Report, J-14 magazine, People, Playbox, Billboard and Country Living Magazine.
Top traffic referral sources, 2013 vs. 2014Percentage of Parse.ly publisher network traffic coming from social media and search sites
Source: Parse.ly, “Authority Report 06,” 2014
0% 10% 20% 30% 40%
© World Newsmedia Network 2015
Google sites*
Yahoo!
News sites*
Drudge Report
Bing
StumbleUpon
AOL
*Google sites: aggregate all of Google-owned properties, e.g. Google.com, Google.ca and Google News.
*News sites: external traffic from any news website to any domain in Parse.ly’s network of news domains.
10% point increase
2013
2014
Continued on page 8
6
GLOBAL SOCIAL MEDIA TRENDS 2015
2015 is the year of media companies partnering with social media networks.
This seismic change in the media landscape began in 2014, the year media companies started to produce native content for each social media platform and to leverage audience metrics in order to understand how social media is driving referral traffic to publishers’ websites.
“The social media marketplace saw huge shifts in 2014, with many brands moving towards measuring audience impressions, clicks, and thinking cross-plat-form,” Shareablee CEO and founder Tania Yuki said. “Video is the biggest opportunity, growing 147 percent in 2014, with Twitter Video in particular showing mas-sive engagement growth at 963 percent. We also saw huge enthusiasm for social click-throughs this past year with some social native publishers seeing up to 425 percent growth in referral traffic.”
In an effort to capitalise on these game-changing usage patterns, social media networks Facebook and Snapchat are reaching out to media companies for content and revenue-share partnerships. It is a matter of time before other social media networks do the same. The networks have a lot to gain: Good content drives the lion’s share of traffic to the social platforms.
What do media companies have to gain, and what do they risk losing?
In 2015, Facebook has been ex-ploring partnership deals with doz-ens of media companies including The New York Times, BuzzFeed, Quartz, National Geographic, the Guardian and the Huffington Post. The discussions are reportedly
about improving the visibility of the publishers’ content to Facebook’s 1.4 billion users in exchange for content that drives more traffic to Facebook. There are also re-portedly talks on revenue sharing with publishers. One example of revenue sharing with Facebook is with the hugely popular U.S. National Football League sharing 50-50 profits for a Verizon telecom company advertis-ing campaign featuring NFL video clips.
While revenue sharing is desirable, analysts specu-late future deals will not include Facebook sharing its usage data on publishers’ content. The usage data is a gold mine for publishers, and not having access to these data is akin to the infamous deal between
Apple’s iTunes and publishers. This deal left publishers with a small revenue share on their own content, sold via Apple’s content marketplace, and no user data to understand who was accessing their content, at what time, from which device or for how long.
“I have one bit of advice: Don’t do it without the data, people. It’s a damned fine idea to go to the readers rather than make them come to you — BuzzFeed does it; so does Vox; so does Reported.ly. It’s wonderful to get more audience and branding on Facebook. It’d be super peachy to get a share of revenue from Facebook at last. All that is great,” said Jeff Jarvis, media analyst and blogger on Buzzmachine.com.
“But keep in mind where the real value is: in the relationship, in knowing what people — individuals and communities, not a faceless, anonymous mass — need and want and know so you can give them relevance and value and so they will give you greater usage, engagement, attention, loyalty and advertising value in return.”
Snapchat’s Discover Meanwhile, mobile-social app Snapchat is luring publishers to become partners with the promise of advertising revenue share and increased traffic in its “Discover” programme. Snapchat, a fast growing social media messaging
app with more than 100 million monthly, mostly young, users, is partnering with CNN, National Geographic, Cosmopolitan, Daily Mail, Vice and others.
Discover resembles a TV channel on mobile. Publish-ers are creating exclusive text, photos, videos and interactive content exclusively for the app, in hopes of reaching Millennials and teens with their quality content from well-known TV, newspaper and magazine brands. The content is immersive, featuring videos and interactive graphics in short- and long-form, and in the vertical format for mobile viewing.
“CNN’s Discover channel lives natively within the app—built from the ground up, exclusively for Snapchat,” Samantha Barry, CNN’s head of social news, told the Columbia Journalism Review in January. Other publish-ers are echoing this sentiment; they, too, are devel-oping “native” content specifically for Facebook and Snapchat in order to reach and engage with individual audiences.
Facebook and Snapchat deals with publishers
7
GLOBAL SOCIAL MEDIA TRENDS 2015
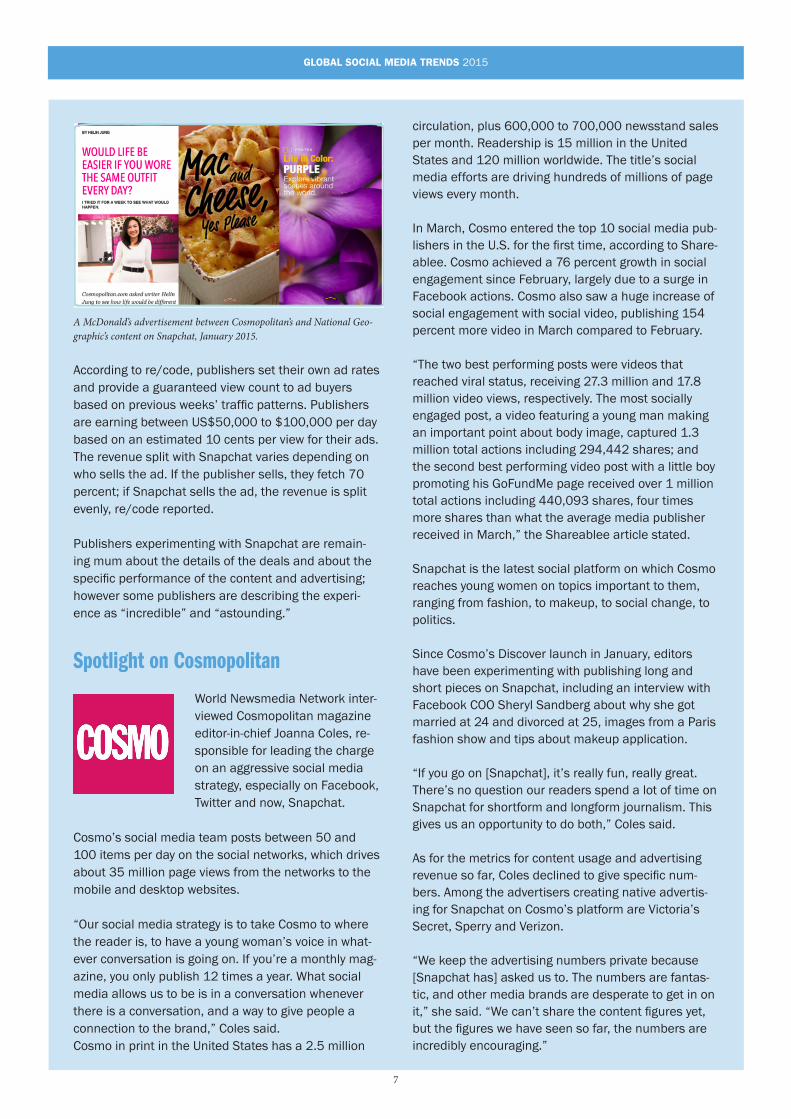
A McDonald’s advertisement between Cosmopolitan’s and National Geo-graphic’s content on Snapchat, January 2015.
According to re/code, publishers set their own ad rates and provide a guaranteed view count to ad buyers based on previous weeks’ traffic patterns. Publishers are earning between US$50,000 to $100,000 per day based on an estimated 10 cents per view for their ads. The revenue split with Snapchat varies depending on who sells the ad. If the publisher sells, they fetch 70 percent; if Snapchat sells the ad, the revenue is split evenly, re/code reported.
Publishers experimenting with Snapchat are remain-ing mum about the details of the deals and about the specific performance of the content and advertising; however some publishers are describing the experi-ence as “incredible” and “astounding.”
Spotlight on Cosmopolitan
World Newsmedia Network inter-viewed Cosmopolitan magazine editor-in-chief Joanna Coles, re-sponsible for leading the charge on an aggressive social media strategy, especially on Facebook, Twitter and now, Snapchat.
Cosmo’s social media team posts between 50 and 100 items per day on the social networks, which drives about 35 million page views from the networks to the mobile and desktop websites.
“Our social media strategy is to take Cosmo to where the reader is, to have a young woman’s voice in what-ever conversation is going on. If you’re a monthly mag-azine, you only publish 12 times a year. What social media allows us to be is in a conversation whenever there is a conversation, and a way to give people a connection to the brand,” Coles said.Cosmo in print in the United States has a 2.5 million
circulation, plus 600,000 to 700,000 newsstand sales per month. Readership is 15 million in the United States and 120 million worldwide. The title’s social media efforts are driving hundreds of millions of page views every month.
In March, Cosmo entered the top 10 social media pub-lishers in the U.S. for the first time, according to Share-ablee. Cosmo achieved a 76 percent growth in social engagement since February, largely due to a surge in Facebook actions. Cosmo also saw a huge increase of social engagement with social video, publishing 154 percent more video in March compared to February.
“The two best performing posts were videos that reached viral status, receiving 27.3 million and 17.8 million video views, respectively. The most socially engaged post, a video featuring a young man making an important point about body image, captured 1.3 million total actions including 294,442 shares; and the second best performing video post with a little boy promoting his GoFundMe page received over 1 million total actions including 440,093 shares, four times more shares than what the average media publisher received in March,” the Shareablee article stated.
Snapchat is the latest social platform on which Cosmo reaches young women on topics important to them, ranging from fashion, to makeup, to social change, to politics.
Since Cosmo’s Discover launch in January, editors have been experimenting with publishing long and short pieces on Snapchat, including an interview with Facebook COO Sheryl Sandberg about why she got married at 24 and divorced at 25, images from a Paris fashion show and tips about makeup application.
“If you go on [Snapchat], it’s really fun, really great. There’s no question our readers spend a lot of time on Snapchat for shortform and longform journalism. This gives us an opportunity to do both,” Coles said.
As for the metrics for content usage and advertising revenue so far, Coles declined to give specific num-bers. Among the advertisers creating native advertis-ing for Snapchat on Cosmo’s platform are Victoria’s Secret, Sperry and Verizon.
“We keep the advertising numbers private because [Snapchat has] asked us to. The numbers are fantas-tic, and other media brands are desperate to get in on it,” she said. “We can’t share the content figures yet, but the figures we have seen so far, the numbers are incredibly encouraging.”
8
GLOBAL SOCIAL MEDIA TRENDS 2015
Trends in global social media usageOnly five years ago, bookmarking and direct-to-homepage visits were by far the means by which readers accessed news-paper and magazine websites. Now social media and search are the predominant access points for these sites.
However, users in each country drive regional trends. In Europe in particular, access to traditional media still rules, fol-lowed by social media access for news and, to a lesser degree, pure play offerings like Google News and MSN News. Mean-while, social media-accessed news dominates in Japan and to a lesser degree, Brazil and Italy, according to the 2014 edition of Reuters Institute’s annual Digital Study.
It follows that Brazil and Italy are among the most prolific content sharers via email or social networks, with 54 percent of Brazilians and 44 percent of Italians sharing content via social networks or email every week. Other countries where users are also prolific sharers are Spain, 40 percent; the United States, 35 percent; Finland, 24 percent; Denmark, 23 percent; and France, 21 percent.
Social media users share actions like links, posts and com-ments with friends, colleagues and family on the social platforms that resonate with them. Facebook commanded an 82 percent share of all articles shared, according to Buzzsumo and Fractl’s 2014 report, “Which Publishers are Winning in Social Engagement.” The report studied 2.6 billion shares of 1
Highest ranking U.S. publishers among social media networksPublishers receiving the most traffic from social media networks
Source: Shareablee, 2014
National Geographic
BuzzFeed
Hollywood Life
The Huffington Post
Bleacher Report
J-14 Magazine
People.com
Playboy
Billboard
Country Living Magazine
National Geographic Society
BuzzFeed, Inc.
PMC
AOL
Turner Sports
Bauer Publishing
Time Inc.
Playboy Enterprises
Prometheus Global Media
Hearst Corporation
93,920
10,899
10,683
10,677
10,505
8,856
7,520
6,826
5,874
5,861
1,031
2,449
3,316
5,827
2,178
1,182
3,382
1,164
3,159
979
272,140
17,492
10,578
11,048
21,103
24,683
10,813
38,958
13,005
10,878
54,483
6,448
2,629
10,222
4,677
5,314
11,814
19,376
7,163
2,215
1
2
3
4
5
6
7
8
9
10
Rank Publisher Parent company
Totalactions I*
Totalcontent II
Actionsper post III
Fans/followers IV*
© World Newsmedia Network 2015
I Total actions metric includes the total volume of post-level likes, shares, favourites, retweets and comments.
*(000)
II Total content includes all posts, tweets and media posted by each brand across platforms.
III Actions per post metric notes the average number of actions garnered by each brand.IV Total fans/followers includes fans/followers for all properties under each brand as of January 31, 2015.
January 2015
32%
News users’ access pointsPercentage of those accessing news from traditional media, pure players online or on social media in the last week
3.global.reuters.newsaccess
Source: Reuters Institute, “Digital News Report 2014” © World Newsmedia Network 2015
FIN SPA DEN UK BRA ITA FRA GER US JAP
Base: All markets 2014 - UK=2082, Germany=2063, Spain=2017, Italy=2010, France=1946, Denmark=2036, Finland=1520, US=2197, Urban Brazil=1015, Japan=1973
80%
70%
60%
50%
40%
30%
20%
10%
0
Traditional
Pure player
Social media
71%
20%
39%
62%
28%
49%
10%
46%
62%
55%
16%
24%
38%
54% 51%47%
26%
41% 41%
20%24%
39%33%
26%
46%
19%21%
28%
55%
9
GLOBAL SOCIAL MEDIA TRENDS 2015
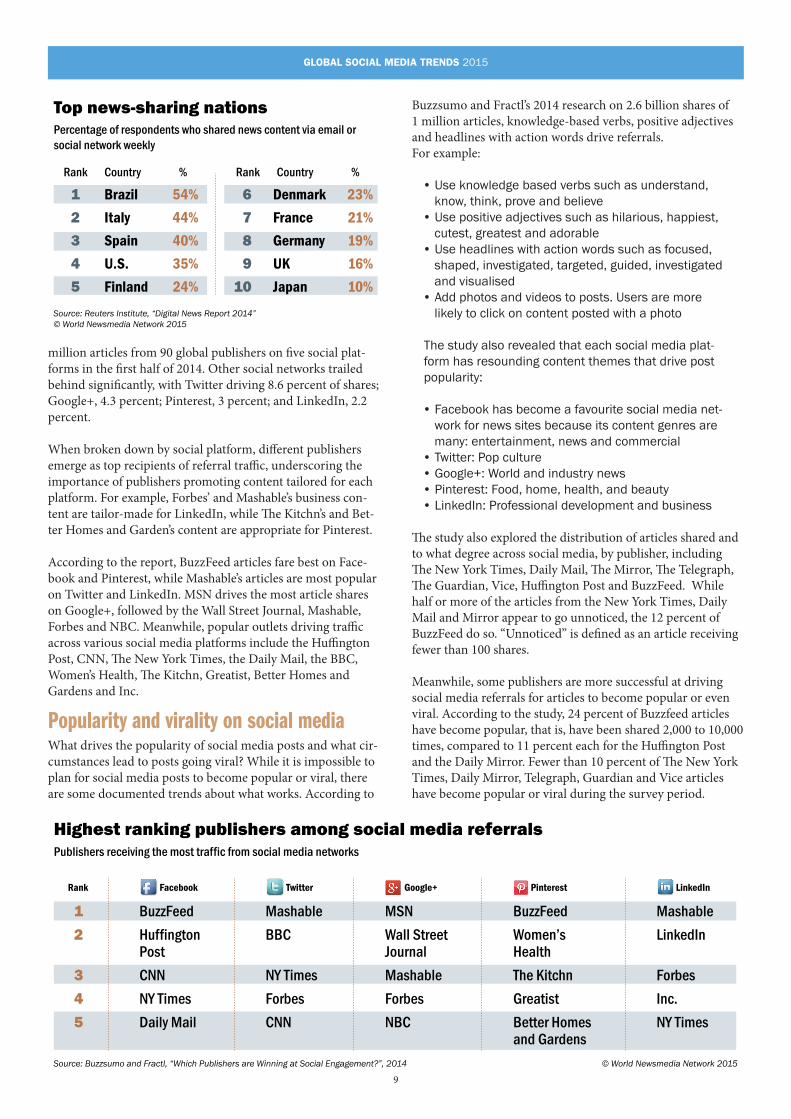
million articles from 90 global publishers on five social plat-forms in the first half of 2014. Other social networks trailed behind significantly, with Twitter driving 8.6 percent of shares; Google+, 4.3 percent; Pinterest, 3 percent; and LinkedIn, 2.2 percent.
When broken down by social platform, different publishers emerge as top recipients of referral traffic, underscoring the importance of publishers promoting content tailored for each platform. For example, Forbes’ and Mashable’s business con-tent are tailor-made for LinkedIn, while The Kitchn’s and Bet-ter Homes and Garden’s content are appropriate for Pinterest.
According to the report, BuzzFeed articles fare best on Face-book and Pinterest, while Mashable’s articles are most popular on Twitter and LinkedIn. MSN drives the most article shares on Google+, followed by the Wall Street Journal, Mashable, Forbes and NBC. Meanwhile, popular outlets driving traffic across various social media platforms include the Huffington Post, CNN, The New York Times, the Daily Mail, the BBC, Women’s Health, The Kitchn, Greatist, Better Homes and Gardens and Inc.
Popularity and virality on social mediaWhat drives the popularity of social media posts and what cir-cumstances lead to posts going viral? While it is impossible to plan for social media posts to become popular or viral, there are some documented trends about what works. According to
Buzzsumo and Fractl’s 2014 research on 2.6 billion shares of 1 million articles, knowledge-based verbs, positive adjectives and headlines with action words drive referrals. For example:
• Use knowledge based verbs such as understand, know, think, prove and believe
• Use positive adjectives such as hilarious, happiest, cutest, greatest and adorable
• Use headlines with action words such as focused, shaped, investigated, targeted, guided, investigated and visualised
• Add photos and videos to posts. Users are more likely to click on content posted with a photo
The study also revealed that each social media plat-form has resounding content themes that drive post popularity:
• Facebook has become a favourite social media net-work for news sites because its content genres are many: entertainment, news and commercial
• Twitter: Pop culture• Google+: World and industry news• Pinterest: Food, home, health, and beauty• LinkedIn: Professional development and business
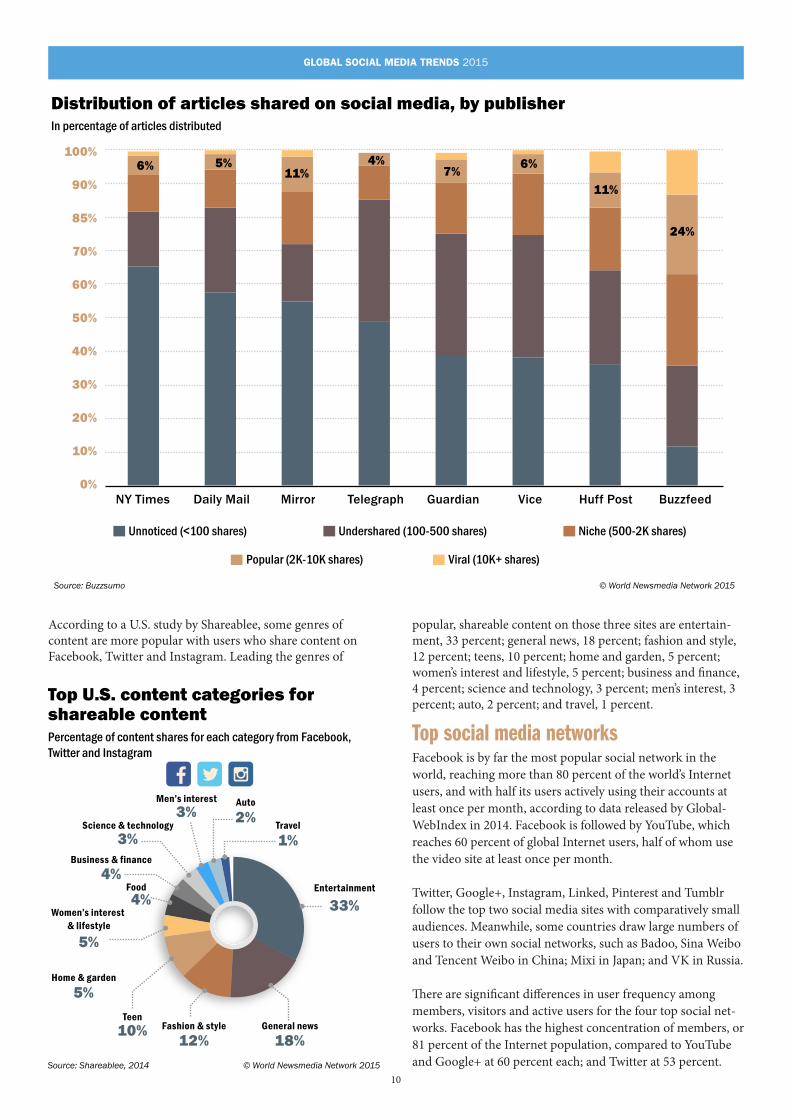
The study also explored the distribution of articles shared and to what degree across social media, by publisher, including The New York Times, Daily Mail, The Mirror, The Telegraph, The Guardian, Vice, Huffington Post and BuzzFeed. While half or more of the articles from the New York Times, Daily Mail and Mirror appear to go unnoticed, the 12 percent of BuzzFeed do so. “Unnoticed” is defined as an article receiving fewer than 100 shares.
Meanwhile, some publishers are more successful at driving social media referrals for articles to become popular or even viral. According to the study, 24 percent of Buzzfeed articles have become popular, that is, have been shared 2,000 to 10,000 times, compared to 11 percent each for the Huffington Post and the Daily Mirror. Fewer than 10 percent of The New York Times, Daily Mirror, Telegraph, Guardian and Vice articles have become popular or viral during the survey period.
Top news-sharing nationsPercentage of respondents who shared news content via email or social network weekly
3.global.reuters.topsharingnations
Source: Reuters Institute, “Digital News Report 2014”© World Newsmedia Network 2015
54%
44%
40%
35%
24%
23%
21%
19%
16%
10%
Denmark
France
Germany
UK
Japan
Brazil
Italy
Spain
U.S.
Finland
1
2
3
4
5
6
7
8
9
10
Rank Country % Rank Country %
Highest ranking publishers among social media referralsPublishers receiving the most traffic from social media networks
3.global.buzzsumo.topsocialpublishers
Source: Buzzsumo and Fractl, “Which Publishers are Winning at Social Engagement?”, 2014
1
2
3
4
5
BuzzFeed
Huffington Post
CNN
NY Times
Daily Mail
FacebookRank
Mashable
BBC
NY Times
Forbes
CNN
MSN
Wall Street Journal
Mashable
Forbes
NBC
Google+
BuzzFeed
Women’s Health
The Kitchn
Greatist
Better Homes and Gardens
Mashable
Forbes
Inc.
NY Times
© World Newsmedia Network 2015
10
GLOBAL SOCIAL MEDIA TRENDS 2015
According to a U.S. study by Shareablee, some genres of content are more popular with users who share content on Facebook, Twitter and Instagram. Leading the genres of
popular, shareable content on those three sites are entertain-ment, 33 percent; general news, 18 percent; fashion and style, 12 percent; teens, 10 percent; home and garden, 5 percent; women’s interest and lifestyle, 5 percent; business and finance, 4 percent; science and technology, 3 percent; men’s interest, 3 percent; auto, 2 percent; and travel, 1 percent.
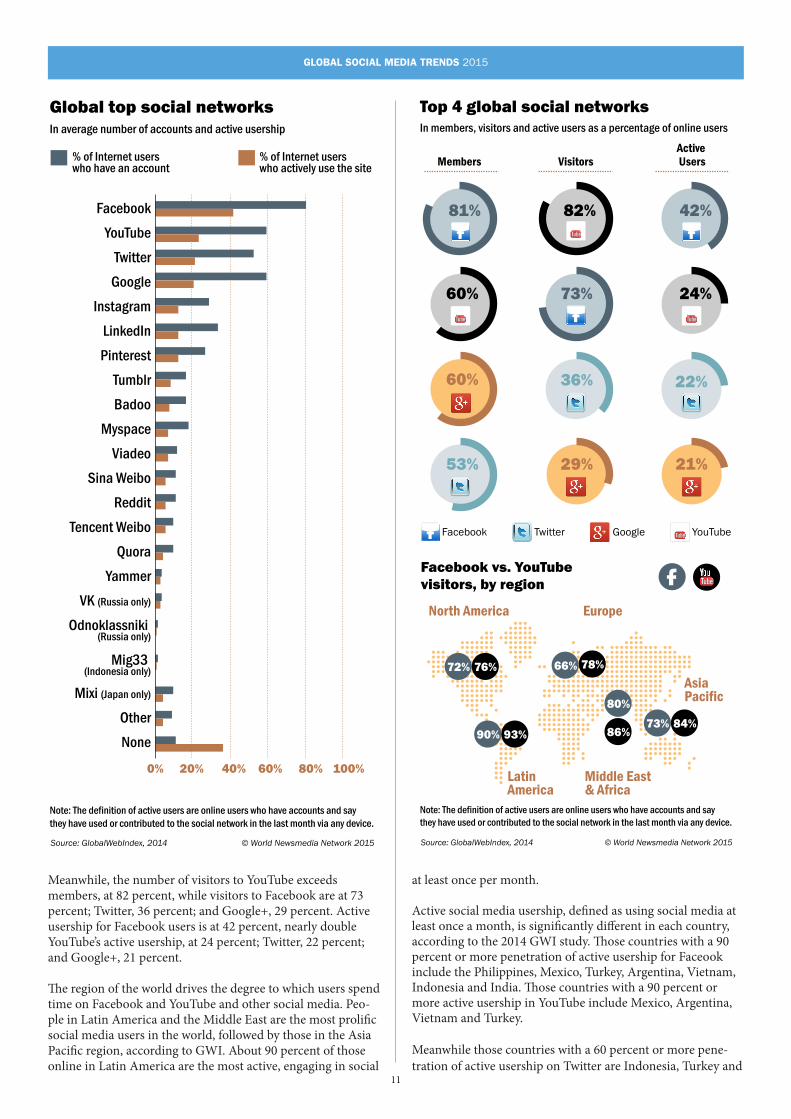
Top social media networksFacebook is by far the most popular social network in the world, reaching more than 80 percent of the world’s Internet users, and with half its users actively using their accounts at least once per month, according to data released by Global-WebIndex in 2014. Facebook is followed by YouTube, which reaches 60 percent of global Internet users, half of whom use the video site at least once per month.
Twitter, Google+, Instagram, Linked, Pinterest and Tumblr follow the top two social media sites with comparatively small audiences. Meanwhile, some countries draw large numbers of users to their own social networks, such as Badoo, Sina Weibo and Tencent Weibo in China; Mixi in Japan; and VK in Russia.
There are significant differences in user frequency among members, visitors and active users for the four top social net-works. Facebook has the highest concentration of members, or 81 percent of the Internet population, compared to YouTube and Google+ at 60 percent each; and Twitter at 53 percent.
Distribution of articles shared on social media, by publisherIn percentage of articles distributed
Source: Buzzsumo
Unnoticed (<100 shares) Undershared (100-500 shares) Niche (500-2K shares)
Popular (2K-10K shares) Viral (10K+ shares)
© World Newsmedia Network 2015
100%
90%
85%
70%
60%
50%
40%
30%
20%
10%
0%NY Times Daily Mail Mirror Telegraph Guardian Vice Huff Post Buzzfeed
SLUG: 3.Buzzsumo.global.articlesharingsocialmedia
6% 5%11%
4%7%
6%
11%
24%
Top U.S. content categories for shareable contentPercentage of content shares for each category from Facebook, Twitter and Instagram
Source: Shareablee, 2014 © World Newsmedia Network 2015
33%Entertainment
18%General news
12%Fashion & style10%
Teen
5%Home & garden
5%
Women’s interest & lifestyle
4%Business & finance
3%Science & technology
3%Men’s interest
1%Travel
2%Auto
4%Food
11
GLOBAL SOCIAL MEDIA TRENDS 2015
Meanwhile, the number of visitors to YouTube exceeds members, at 82 percent, while visitors to Facebook are at 73 percent; Twitter, 36 percent; and Google+, 29 percent. Active usership for Facebook users is at 42 percent, nearly double YouTube’s active usership, at 24 percent; Twitter, 22 percent; and Google+, 21 percent.
The region of the world drives the degree to which users spend time on Facebook and YouTube and other social media. Peo-ple in Latin America and the Middle East are the most prolific social media users in the world, followed by those in the Asia Pacific region, according to GWI. About 90 percent of those online in Latin America are the most active, engaging in social
at least once per month.
Active social media usership, defined as using social media at least once a month, is significantly different in each country, according to the 2014 GWI study. Those countries with a 90 percent or more penetration of active usership for Faceook include the Philippines, Mexico, Turkey, Argentina, Vietnam, Indonesia and India. Those countries with a 90 percent or more active usership in YouTube include Mexico, Argentina, Vietnam and Turkey.
Meanwhile those countries with a 60 percent or more pene-tration of active usership on Twitter are Indonesia, Turkey and
Global top social networksIn average number of accounts and active usership
Source: GlobalWebIndex, 2014
Note: The definition of active users are online users who have accounts and say they have used or contributed to the social network in the last month via any device.
© World Newsmedia Network 2015
YouTube
Tumblr
Badoo
Myspace
Viadeo
Sina Weibo
Tencent Weibo
Quora
Yammer
VK (Russia only)
Odnoklassniki (Russia only)
Mig33 (Indonesia only)
Mixi (Japan only)
Other
None
% of Internet users who have an account
% of Internet users who actively use the site
0% 20% 40% 60% 80% 100%
Top 4 global social networksIn members, visitors and active users as a percentage of online users
Source: GlobalWebIndex, 2014
Note: The definition of active users are online users who have accounts and say they have used or contributed to the social network in the last month via any device.
© World Newsmedia Network 2015
81%
60%
60%
53%
73%
36%
29%
24%
22%
21%
82% 42%
72% 76% 78%
93% 86%84%73%
80%
90%
66%
North America Europe
AsiaPacific
LatinAmerica
Middle East& Africa
Members
Facebook vs. YouTube visitors, by region
VisitorsActive Users
Facebook Twitter Google YouTube
12
GLOBAL SOCIAL MEDIA TRENDS 2015
Top social network platforms, by countryPercentage of online users who have visited each network last month
Facebook Twitter GoogleYouTube
PhilippinesMexicoTurkey
ArgentinaVietnam
IndonesiaIndia
BrazilThailandMalaysia
South AfricaUAE
TaiwanSingapore
SpainItaly
Hong KongCanadaIrelandPoland
USASweden
Saudi ArabiaUK
NetherlandsAustralia
FranceGermany
South KoreaRussiaChinaJapan
0% 20% 40% 60% 80% 100%
MexicoArgentina
VietnamTurkey
PhilippinesThailand
BrazilIndia
MalaysiaIndonesia
UAESaudi Arabia
TaiwanSingapore
ItalyRussia
SpainSouth Africa
Hong KongIreland
SwedenCanadaPoland
USASouth Korea
AustraliaUK
GermanyJapan
NetherlandsFrance
China
0% 20% 40% 60% 80% 100%
IndonesiaTurkey
Saudi ArabiaIndia
PhilippinesMexico
UAESouth Africa
MalaysiaBrazilSpain
ArgentinaThailandVietnam
ItalyCanada
South KoreaUSA
IrelandUK
SingaporeSweden
RussiaAustralia
JapanChina
Hong KongNetherlands
TaiwanPolandFrance
Germany
0% 20% 40% 60% 80% 100%
IndonesiaIndia
VietnamPhilippines
MexicoSaudi Arabia
ThailandBrazil
TurkeyArgentina
UAESouth Africa
TaiwanMalaysia
ItalySpain
RussiaPoland
Hong KongSweden
SingaporeChina
USAIreland
CanadaFrance
GermanySouth Korea
AustraliaUK
NetherlandsJapan
0% 20% 40% 60% 80% 100%
Top Twitter activitiesPercentage of active Twitter users who did the following last month
Source: GlobalWebIndex, 2014
42%36%35%34%33%31%30%29%27%27%26%26%24%24%22%22%21%21%21%20%19%15%14%
© World Newsmedia Network 2015
Read a news story
Looked at the trending topics
Logged in to see what’s happening without posting/commenting
Tweeted a friend
Retweeted a friend
Favourited a tweet
Visited a celebrity’s Twitter feed
Followed a link inside a tweet
Tweeted comment about my daily life
Used a hashtag
Tweeted a photo or video link
Visited a product, brand or company’s Twitter feed
Started following a product, brand or company
Retweeted a celebrity
Retweeted a product, brand or company
Tweeted about a TV show I’m watching
Tweeted a company, brand or product
Tweeted a celebrity
Tweeted a positive comment about a product or brand
Tweeted about an event I’m at
Tweeted a question about a company, brand or porduct
Stopped following a product, brand or company
Tweeted a negative comment about a product or brand
Top Google+ activitiesPercentage of active Google+ users who did the following last month
Source: GlobalWebIndex, 2014
45%42%33%33%30%29%28%27%27%26%26%22%21%21%20%20%20%19%19%18%13%13%12%
© World Newsmedia Network 2015
Read an article
Read a news story
Clicked the “+1” button
Logged in to see what’s happening without posting/commenting
Visited a company, brand or product’s Google+ page
Researched a product I’m interested in buying
Uploaded and shared my own photos
Commented on a friend’s status
Messaged a friend on a 1-to-1 basis
Commented on a friend’s photo or video
Joined or set up a new circle
Asked a question about a product I’m interested in buying
Uploaded and shared my own videos
Posted a comment about what I’m doing
Started following a new product or brand
Shared a post or article from company or brand
Shared your location
Shared a photo or video from a company or brand
Posted a positive comment about a product or brand
Posted a question or comment on a company, brand or product
Stopped following a product or brand
Posted a negative comment about a product or brand
Organised an event
13
GLOBAL SOCIAL MEDIA TRENDS 2015
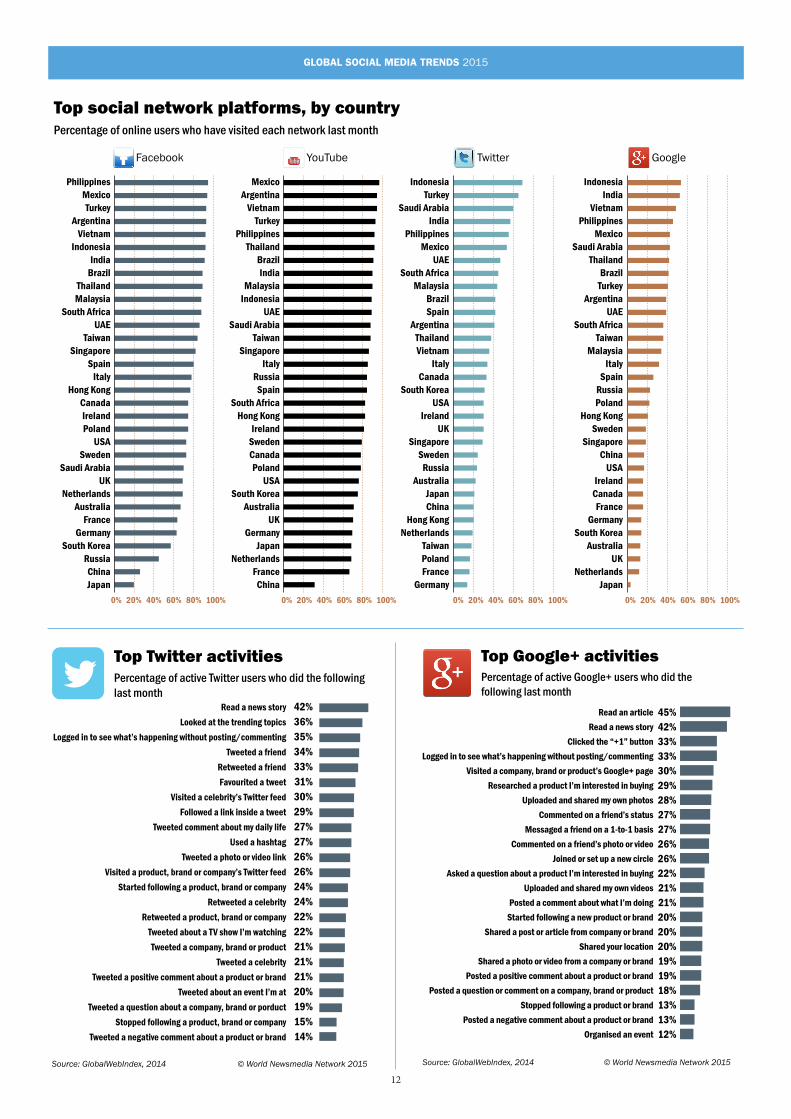
Saudi Arabia; while those countries with a 40 percent or more penetration of Google+ are Indonesia, India, Vietnam, the Philippines, Mexico, Saudi Arabia, Thailand and Brazil.
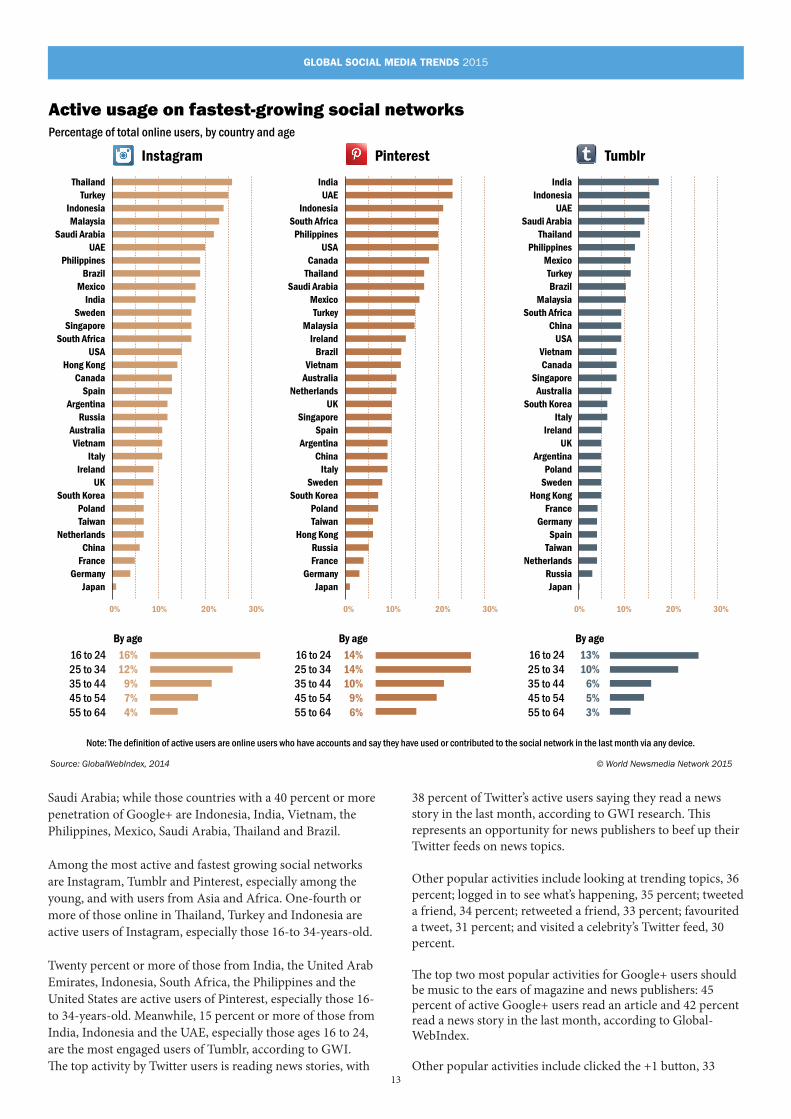
Among the most active and fastest growing social networks are Instagram, Tumblr and Pinterest, especially among the young, and with users from Asia and Africa. One-fourth or more of those online in Thailand, Turkey and Indonesia are active users of Instagram, especially those 16-to 34-years-old.
Twenty percent or more of those from India, the United Arab Emirates, Indonesia, South Africa, the Philippines and the United States are active users of Pinterest, especially those 16-to 34-years-old. Meanwhile, 15 percent or more of those from India, Indonesia and the UAE, especially those ages 16 to 24, are the most engaged users of Tumblr, according to GWI.The top activity by Twitter users is reading news stories, with
38 percent of Twitter’s active users saying they read a news story in the last month, according to GWI research. This represents an opportunity for news publishers to beef up their Twitter feeds on news topics.
Other popular activities include looking at trending topics, 36 percent; logged in to see what’s happening, 35 percent; tweeted a friend, 34 percent; retweeted a friend, 33 percent; favourited a tweet, 31 percent; and visited a celebrity’s Twitter feed, 30 percent.
The top two most popular activities for Google+ users should be music to the ears of magazine and news publishers: 45 percent of active Google+ users read an article and 42 percent read a news story in the last month, according to Global-WebIndex.
Other popular activities include clicked the +1 button, 33
Active usage on fastest-growing social networksPercentage of total online users, by country and age
Source: GlobalWebIndex, 2014 © World Newsmedia Network 2015
ThailandTurkey
IndonesiaMalaysia
Saudi ArabiaUAE
PhilippinesBrazil
MexicoIndia
SwedenSingapore
South AfricaUSA
Hong KongCanada
SpainArgentina
RussiaAustraliaVietnam
ItalyIreland
UKSouth Korea
PolandTaiwan
NetherlandsChina
FranceGermany
Japan
0% 10% 20% 30%
IndiaUAE
IndonesiaSouth Africa
PhilippinesUSA
CanadaThailand
Saudi ArabiaMexicoTurkey
MalaysiaIreland
BrazilVietnam
AustraliaNetherlands
UKSingapore
SpainArgentina
ChinaItaly
SwedenSouth Korea
PolandTaiwan
Hong KongRussiaFrance
GermanyJapan
0% 10% 20% 30%
Tumblr
IndiaIndonesia
UAESaudi Arabia
ThailandPhilippines
MexicoTurkeyBrazil
MalaysiaSouth Africa
ChinaUSA
VietnamCanada
SingaporeAustralia
South KoreaItaly
IrelandUK
ArgentinaPoland
SwedenHong Kong
FranceGermany
SpainTaiwan
NetherlandsRussiaJapan
0% 10% 20% 30%
16 to 2425 to 3435 to 4445 to 5455 to 64
16 to 2425 to 3435 to 4445 to 5455 to 64
16 to 2425 to 3435 to 4445 to 5455 to 64
16%12%
9%7%4%
14%14%10%
9%6%
13%10%
6%5%3%
By age By age By age
Note: The definition of active users are online users who have accounts and say they have used or contributed to the social network in the last month via any device.
14
GLOBAL SOCIAL MEDIA TRENDS 2015
Facebook-based video postsNumber of video posts on Facebook from major publishing, broadcast and online sites
Source: Socialbakers, February 2015 © World Newsmedia Network 2015
Jan2014
120,000
100,000
80,000
60,000
40,000
20,000
0Feb
2014Mar
2014Apr
2014May
2014Jun
2014Jul
2014Aug
2014Sep
2014Oct
2014Nov
2014Dec
2014
YouTube Facebook Other Vimeo Instagram
percent; logged in to see what’s happening, 33 percent; visited a brand’s page, 30 percent; researched a product, 29 percent; uploaded or shared photos, 28 percent; commented on a friend’s status, 27 percent; and messaged a friend one-to-one, 27 percent.
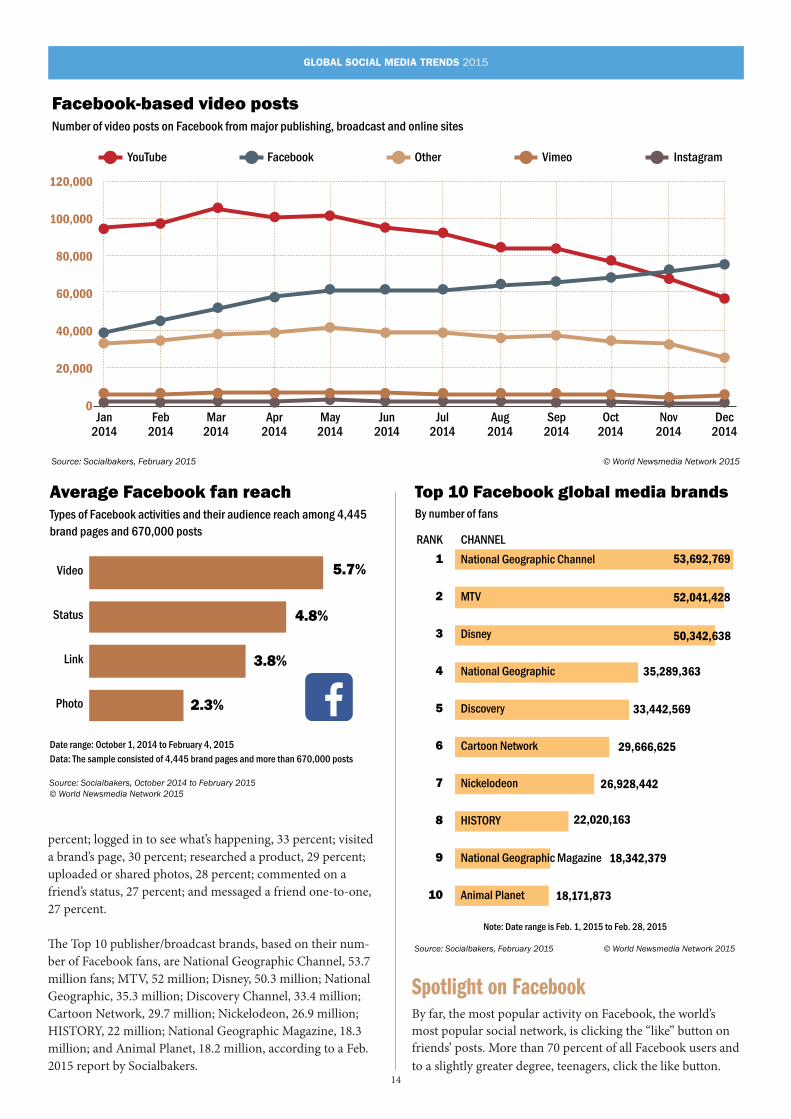
The Top 10 publisher/broadcast brands, based on their num-ber of Facebook fans, are National Geographic Channel, 53.7 million fans; MTV, 52 million; Disney, 50.3 million; National Geographic, 35.3 million; Discovery Channel, 33.4 million; Cartoon Network, 29.7 million; Nickelodeon, 26.9 million; HISTORY, 22 million; National Geographic Magazine, 18.3 million; and Animal Planet, 18.2 million, according to a Feb. 2015 report by Socialbakers.
Spotlight on Facebook By far, the most popular activity on Facebook, the world’s most popular social network, is clicking the “like” button on friends’ posts. More than 70 percent of all Facebook users and to a slightly greater degree, teenagers, click the like button.
Top 10 Facebook global media brandsBy number of fans
Source: Socialbakers, February 2015 © World Newsmedia Network 2015
53,692,7691
2
3
4
5
6
7
8
9
10
National Geographic Channel
MTV
Disney
National Geographic
Discovery
Cartoon Network
Nickelodeon
HISTORY
National Geographic Magazine
Animal Planet
52,041,428
50,342,638
35,289,363
33,442,569
29,666,625
26,928,442
22,020,163
18,342,379
18,171,873
RANK CHANNEL
Note: Date range is Feb. 1, 2015 to Feb. 28, 2015
Average Facebook fan reachTypes of Facebook activities and their audience reach among 4,445 brand pages and 670,000 posts
Source: Socialbakers, October 2014 to February 2015© World Newsmedia Network 2015
Video
Status
Link
Photo
5.7%
4.8%
3.8%
2.3%
Date range: October 1, 2014 to February 4, 2015Data: The sample consisted of 4,445 brand pages and more than 670,000 posts
15
GLOBAL SOCIAL MEDIA TRENDS 2015
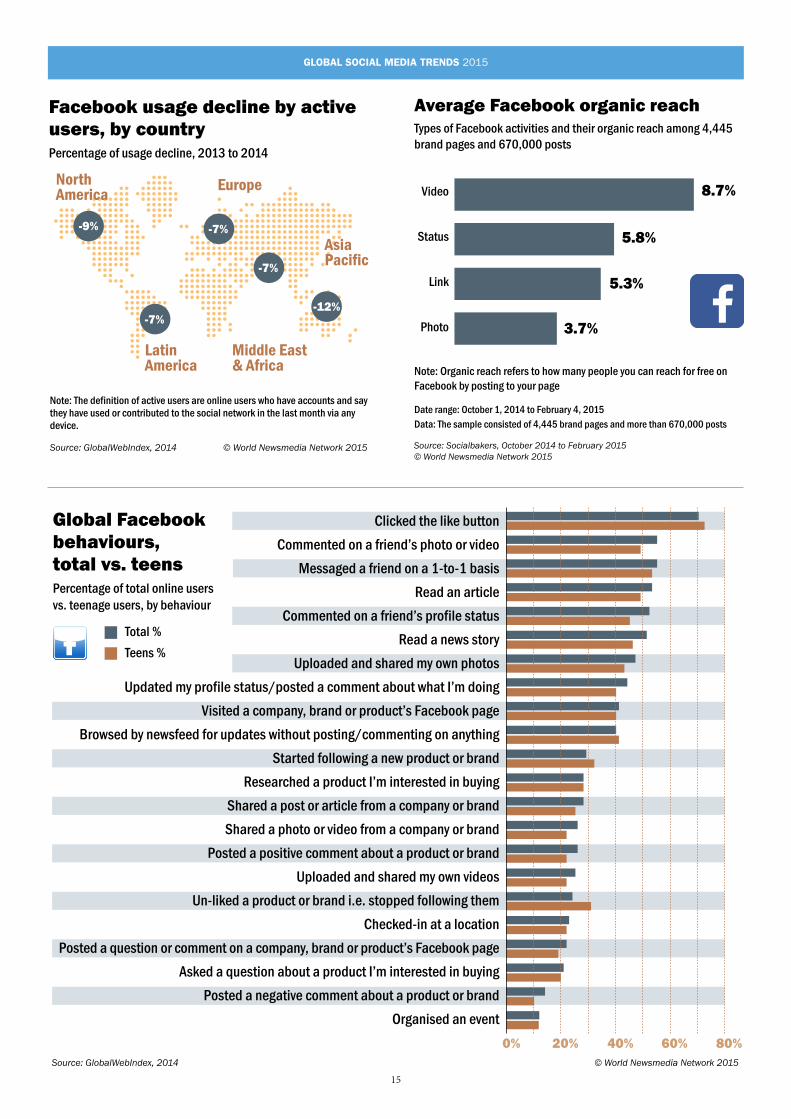
Average Facebook organic reachTypes of Facebook activities and their organic reach among 4,445 brand pages and 670,000 posts
Source: Socialbakers, October 2014 to February 2015© World Newsmedia Network 2015
Video
Status
Link
Photo
8.7%
5.8%
5.3%
3.7%
Date range: October 1, 2014 to February 4, 2015Data: The sample consisted of 4,445 brand pages and more than 670,000 posts
Note: Organic reach refers to how many people you can reach for free on Facebook by posting to your page
Facebook usage decline by active users, by countryPercentage of usage decline, 2013 to 2014
Source: GlobalWebIndex, 2014 © World Newsmedia Network 2015
Note: The definition of active users are online users who have accounts and say they have used or contributed to the social network in the last month via any device.
-9%
-12%
-7%
-7%
-7%
North America
Europe
AsiaPacific
LatinAmerica
Middle East& Africa
Global Facebook behaviours, total vs. teensPercentage of total online users vs. teenage users, by behaviour
Source: GlobalWebIndex, 2014
Clicked the like button
Commented on a friend’s photo or video
Messaged a friend on a 1-to-1 basis
Read an article
Commented on a friend’s profile status
Read a news story
Uploaded and shared my own photos
Updated my profile status/posted a comment about what I’m doing
Visited a company, brand or product’s Facebook page
Browsed by newsfeed for updates without posting/commenting on anything
Started following a new product or brand
Researched a product I’m interested in buying
Shared a post or article from a company or brand
Shared a photo or video from a company or brand
Posted a positive comment about a product or brand
Uploaded and shared my own videos
Un-liked a product or brand i.e. stopped following them
Checked-in at a location
Posted a question or comment on a company, brand or product’s Facebook page
Asked a question about a product I’m interested in buying
Posted a negative comment about a product or brand
Organised an event
Total %
Teens %
0% 60% 80%40%20%© World Newsmedia Network 2015
16
GLOBAL SOCIAL MEDIA TRENDS 2015
Other important activities on Facebook include commenting on a friend’s photo or video, messaging a friend on Facebook Messenger, reading an article, commenting on a friend’s post, reading a news story, uploading and sharing photos, updating a profile status, visiting a brand’s Facebook page and browsing the news feed for updates. All of these activities were done by 40 percent of active users, according to GlobalWebIndex.
Despite Facebook’s reign as the No. 1 social network in the world, the percentage of usage by active users declined in each region of the world from 2013 to 2014. The decline in active usage was greatest in the Asia Pacific, down 12 percent; followed by North America, down 9 percent; and Europe, Latin America and the Middle East and Africa, each down 7 percent, according to GWI.
The introduction of Facebook’s video autoplay feature for ads in Dec. 2013 and for user content in May 2014 has doubled the number of video posts on the social media site from Jan. 2014 to Dec. 2014, according to Socialbakers. The technology,which enables the automatic play of videos in the news feed without users clicking on it, has been the catalyst for Facebook video views surpassing the incumbent, YouTube, in Nov. 2014.
Video also is the No. 1 activity on Facebook fan pages com-pared to other activities. Video on brands’ Facebook pages draw a 5.7 percent audience reach of each fan base, while status updates draw 4.8 percent reach; links, 3.8 percent; and 2.3 percent for photos.
Average Facebook fan reach on brand pages, based on 4,445 brand pages and 670,000 posts, found that video drove 8.7 percent reach; status updates, 5.8 percent; links, 5.3 percent; and photos, 3.7 percent.
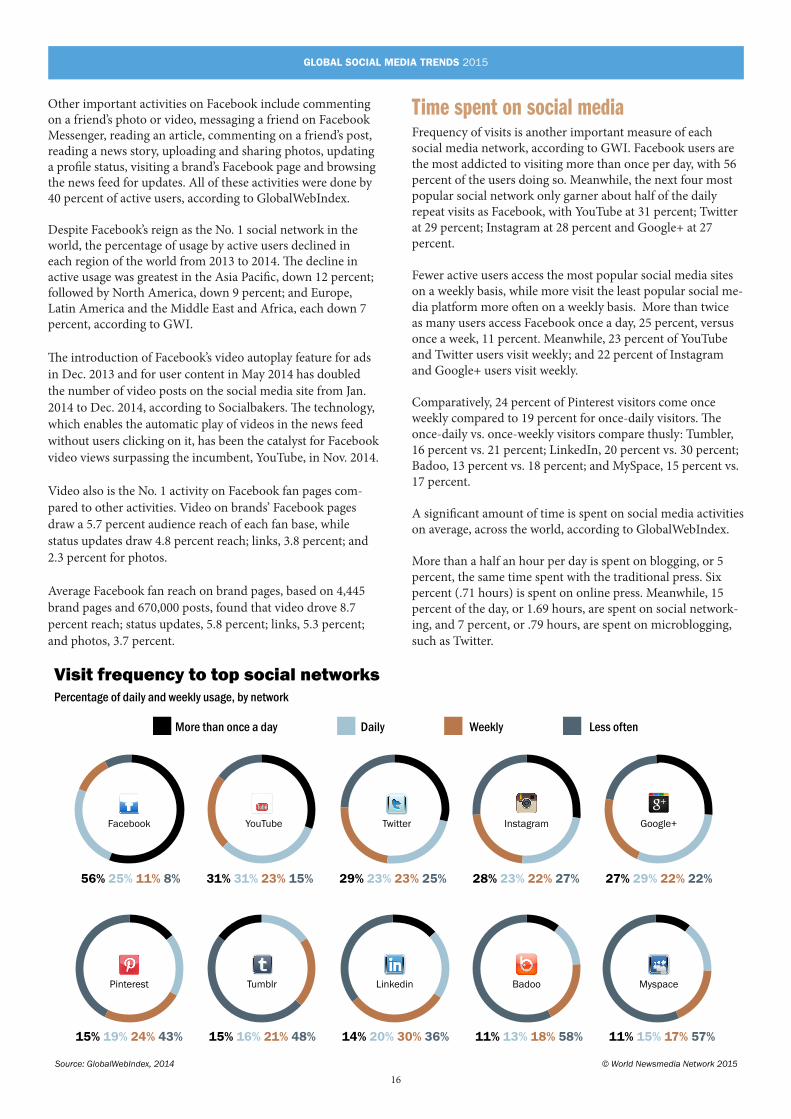
Time spent on social mediaFrequency of visits is another important measure of each social media network, according to GWI. Facebook users are the most addicted to visiting more than once per day, with 56 percent of the users doing so. Meanwhile, the next four most popular social network only garner about half of the daily repeat visits as Facebook, with YouTube at 31 percent; Twitter at 29 percent; Instagram at 28 percent and Google+ at 27 percent. Fewer active users access the most popular social media sites on a weekly basis, while more visit the least popular social me-dia platform more often on a weekly basis. More than twice as many users access Facebook once a day, 25 percent, versus once a week, 11 percent. Meanwhile, 23 percent of YouTube and Twitter users visit weekly; and 22 percent of Instagram and Google+ users visit weekly.
Comparatively, 24 percent of Pinterest visitors come once weekly compared to 19 percent for once-daily visitors. The once-daily vs. once-weekly visitors compare thusly: Tumbler, 16 percent vs. 21 percent; LinkedIn, 20 percent vs. 30 percent; Badoo, 13 percent vs. 18 percent; and MySpace, 15 percent vs. 17 percent.
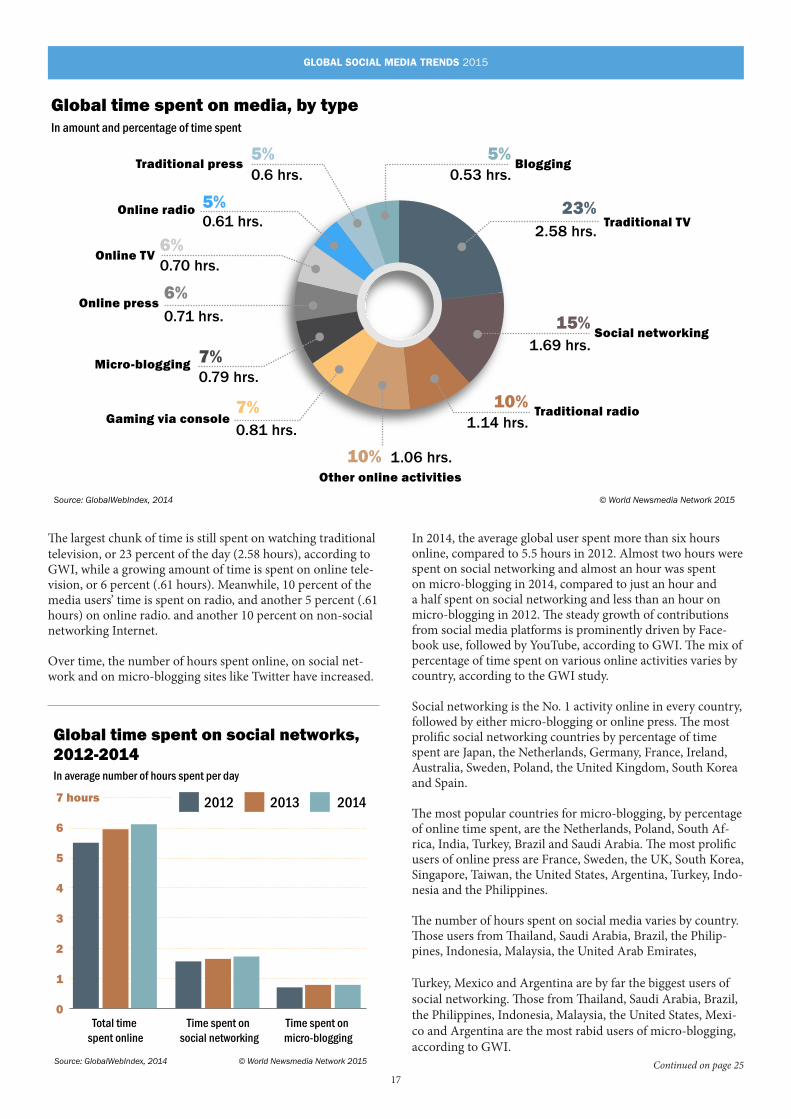
A significant amount of time is spent on social media activities on average, across the world, according to GlobalWebIndex.
More than a half an hour per day is spent on blogging, or 5 percent, the same time spent with the traditional press. Six percent (.71 hours) is spent on online press. Meanwhile, 15 percent of the day, or 1.69 hours, are spent on social network-ing, and 7 percent, or .79 hours, are spent on microblogging, such as Twitter.
Visit frequency to top social networksPercentage of daily and weekly usage, by network
Source: GlobalWebIndex, 2014 © World Newsmedia Network 2015
More than once a day Daily Weekly Less often
Pinterest Tumblr Linkedin Badoo Myspace
Twitter Instagram Google+YouTube
56% 25% 11% 8% 31% 31% 23% 15% 29% 23% 23% 25% 28% 23% 22% 27% 27% 29% 22% 22%
15% 19% 24% 43% 15% 16% 21% 48% 14% 20% 30% 36% 11% 13% 18% 58% 11% 15% 17% 57%
17
GLOBAL SOCIAL MEDIA TRENDS 2015
The largest chunk of time is still spent on watching traditional television, or 23 percent of the day (2.58 hours), according to GWI, while a growing amount of time is spent on online tele-vision, or 6 percent (.61 hours). Meanwhile, 10 percent of the media users’ time is spent on radio, and another 5 percent (.61 hours) on online radio. and another 10 percent on non-social networking Internet.
Over time, the number of hours spent online, on social net-work and on micro-blogging sites like Twitter have increased.
In 2014, the average global user spent more than six hours online, compared to 5.5 hours in 2012. Almost two hours were spent on social networking and almost an hour was spent on micro-blogging in 2014, compared to just an hour and a half spent on social networking and less than an hour on micro-blogging in 2012. The steady growth of contributions from social media platforms is prominently driven by Face-book use, followed by YouTube, according to GWI. The mix of percentage of time spent on various online activities varies by country, according to the GWI study.
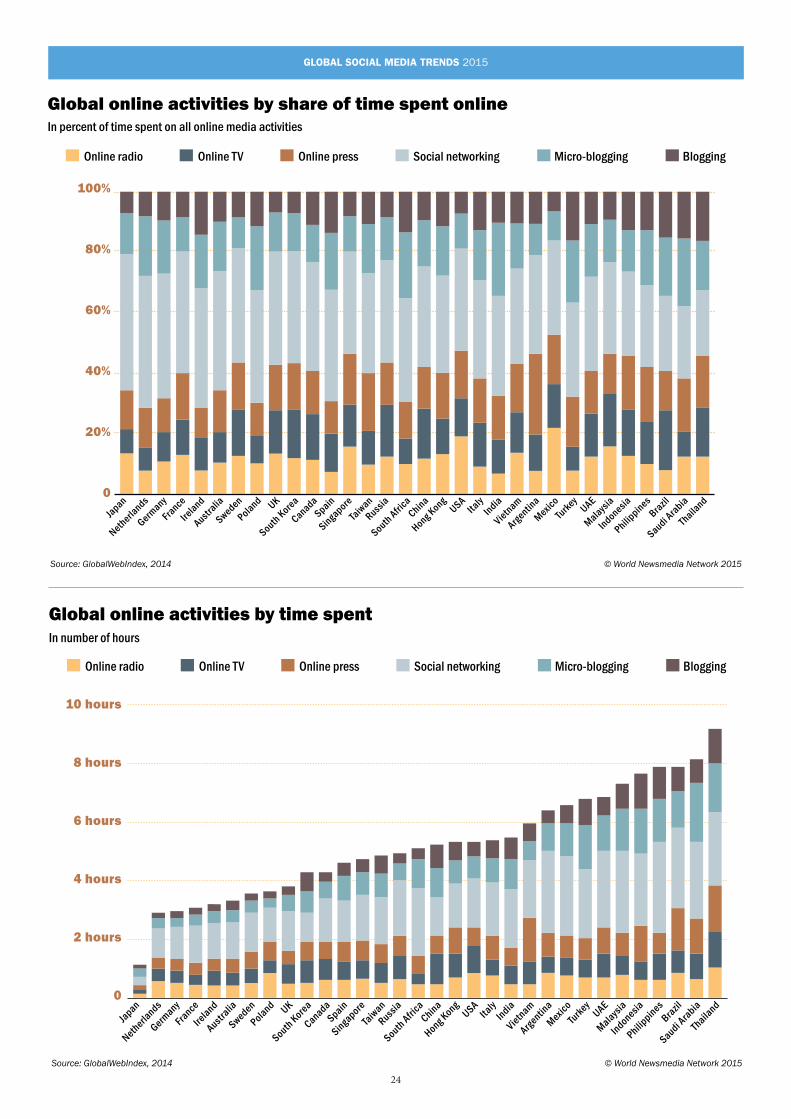
Social networking is the No. 1 activity online in every country, followed by either micro-blogging or online press. The most prolific social networking countries by percentage of time spent are Japan, the Netherlands, Germany, France, Ireland, Australia, Sweden, Poland, the United Kingdom, South Korea and Spain.
The most popular countries for micro-blogging, by percentage of online time spent, are the Netherlands, Poland, South Af-rica, India, Turkey, Brazil and Saudi Arabia. The most prolific users of online press are France, Sweden, the UK, South Korea, Singapore, Taiwan, the United States, Argentina, Turkey, Indo-nesia and the Philippines.
The number of hours spent on social media varies by country. Those users from Thailand, Saudi Arabia, Brazil, the Philip-pines, Indonesia, Malaysia, the United Arab Emirates,
Turkey, Mexico and Argentina are by far the biggest users of social networking. Those from Thailand, Saudi Arabia, Brazil, the Philippines, Indonesia, Malaysia, the United States, Mexi-co and Argentina are the most rabid users of micro-blogging, according to GWI.
Traditional press5%0.6 hrs.
1.06 hrs.
1.14 hrs.
1.69 hrs.
2.58 hrs.
0.53 hrs.
0.61 hrs.
0.70 hrs.
0.71 hrs.
0.79 hrs.
0.81 hrs.
5%
6%
6%
7%
7%
10%
10%
15%
5%
23%Online radio
Online TV
Online press
Micro-blogging
Gaming via console
Blogging
Traditional TV
Social networking
Traditional radio
Other online activities
Global time spent on media, by typeIn amount and percentage of time spent
Source: GlobalWebIndex, 2014 © World Newsmedia Network 2015
Global time spent on social networks, 2012-2014In average number of hours spent per day
Source: GlobalWebIndex, 2014 © World Newsmedia Network 2015
Total time spent online
Time spent on social networking
Time spent on micro-blogging
7 hours
6
5
4
3
2
1
0
2012 2013 2014
Continued on page 25
18
GLOBAL SOCIAL MEDIA TRENDS 2015
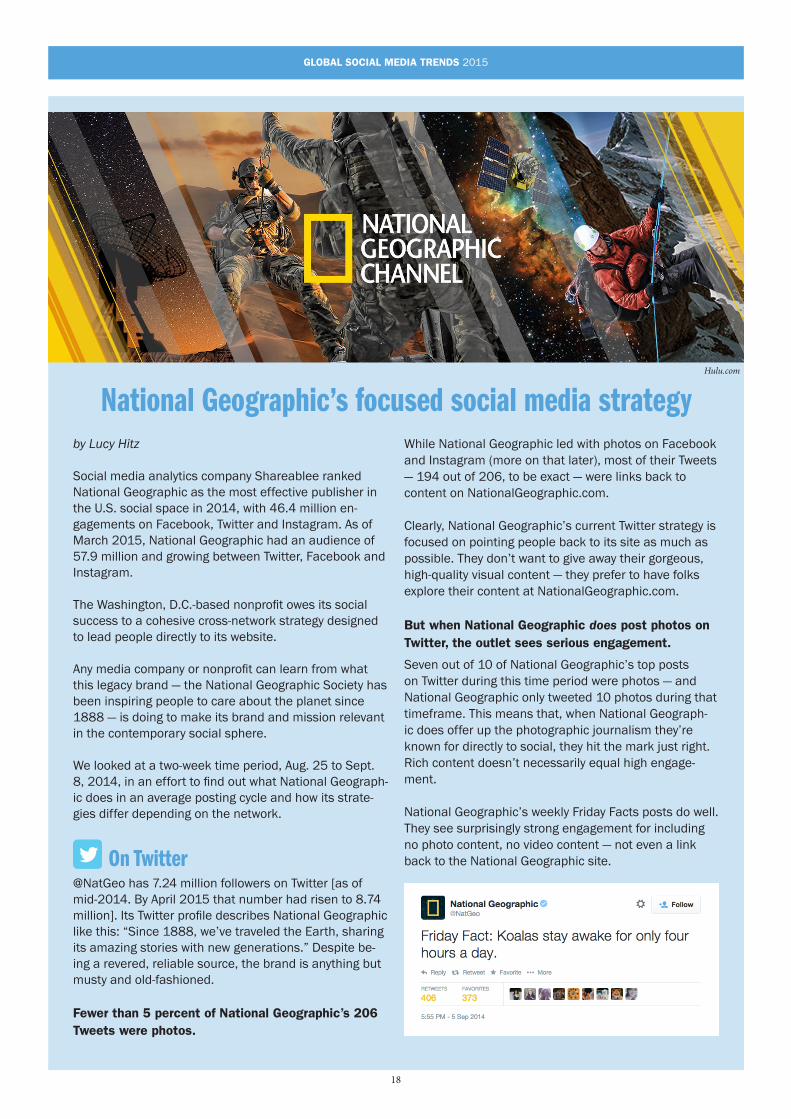
National Geographic’s focused social media strategyby Lucy Hitz
Social media analytics company Shareablee ranked National Geographic as the most effective publisher in the U.S. social space in 2014, with 46.4 million en-gagements on Facebook, Twitter and Instagram. As of March 2015, National Geographic had an audience of 57.9 million and growing between Twitter, Facebook and Instagram.
The Washington, D.C.-based nonprofit owes its social success to a cohesive cross-network strategy designed to lead people directly to its website.
Any media company or nonprofit can learn from what this legacy brand — the National Geographic Society has been inspiring people to care about the planet since 1888 — is doing to make its brand and mission relevant in the contemporary social sphere.
We looked at a two-week time period, Aug. 25 to Sept. 8, 2014, in an effort to find out what National Geograph-ic does in an average posting cycle and how its strate-gies differ depending on the network.
On Twitter@NatGeo has 7.24 million followers on Twitter [as of mid-2014. By April 2015 that number had risen to 8.74 million]. Its Twitter profile describes National Geographic like this: “Since 1888, we’ve traveled the Earth, sharing its amazing stories with new generations.” Despite be-ing a revered, reliable source, the brand is anything but musty and old-fashioned.
Fewer than 5 percent of National Geographic’s 206 Tweets were photos.
While National Geographic led with photos on Facebook and Instagram (more on that later), most of their Tweets — 194 out of 206, to be exact — were links back to content on NationalGeographic.com.
Clearly, National Geographic’s current Twitter strategy is focused on pointing people back to its site as much as possible. They don’t want to give away their gorgeous, high-quality visual content — they prefer to have folks explore their content at NationalGeographic.com.
But when National Geographic does post photos on Twitter, the outlet sees serious engagement.
Seven out of 10 of National Geographic’s top posts on Twitter during this time period were photos — and National Geographic only tweeted 10 photos during that timeframe. This means that, when National Geograph-ic does offer up the photographic journalism they’re known for directly to social, they hit the mark just right.Rich content doesn’t necessarily equal high engage-ment.
National Geographic’s weekly Friday Facts posts do well. They see surprisingly strong engagement for including no photo content, no video content — not even a link back to the National Geographic site.
Hulu.com
19
GLOBAL SOCIAL MEDIA TRENDS 2015
The learning here is twofold. Because National Geo-graphic is a known, respected news source, they have the public’s trust. This makes a factoid post like the one above uber successful, while a greener brand with a less solid reputation might not see the same response.
The second lesson here is that a brand’s tweet doesn’t need a lot of glitz and glam to be successful. It just needs to offer some new and surprising value to followers.
On FacebookNational Geographic has 30.9 million fans on Face-book. During my two-week sample time period, they posted roughly half (57 percent) the amount that they posted on Twitter — but retained over four times the audience. Similar to its activity on Twitter, National Geographic used Facebook almost entirely for links. The brand drove the most engagement from photos, but only posted four photos out of the 117 posts during this time period.
One-hundred percent of link posts feature images or video integration. This gave National Geographic the high engagement levels of a photo or video post, while also driving traf-fic to their website.
It’s a one-two punch, and a powerful posting strategy for any media company looking to drive site traffic while simultaneously seeing in-network engagement.
On Twitter, National Geographic’s strategy is posting few images and videos, while on Facebook most links have image or videos. This tells us that National Geographic sees Twitter as less of a visual network and more of a place to attract folks with informational tidbits and news items, while it sees Facebook as a more “magazine-like” network with which to give us-ers a feel and preview for what their website offers.
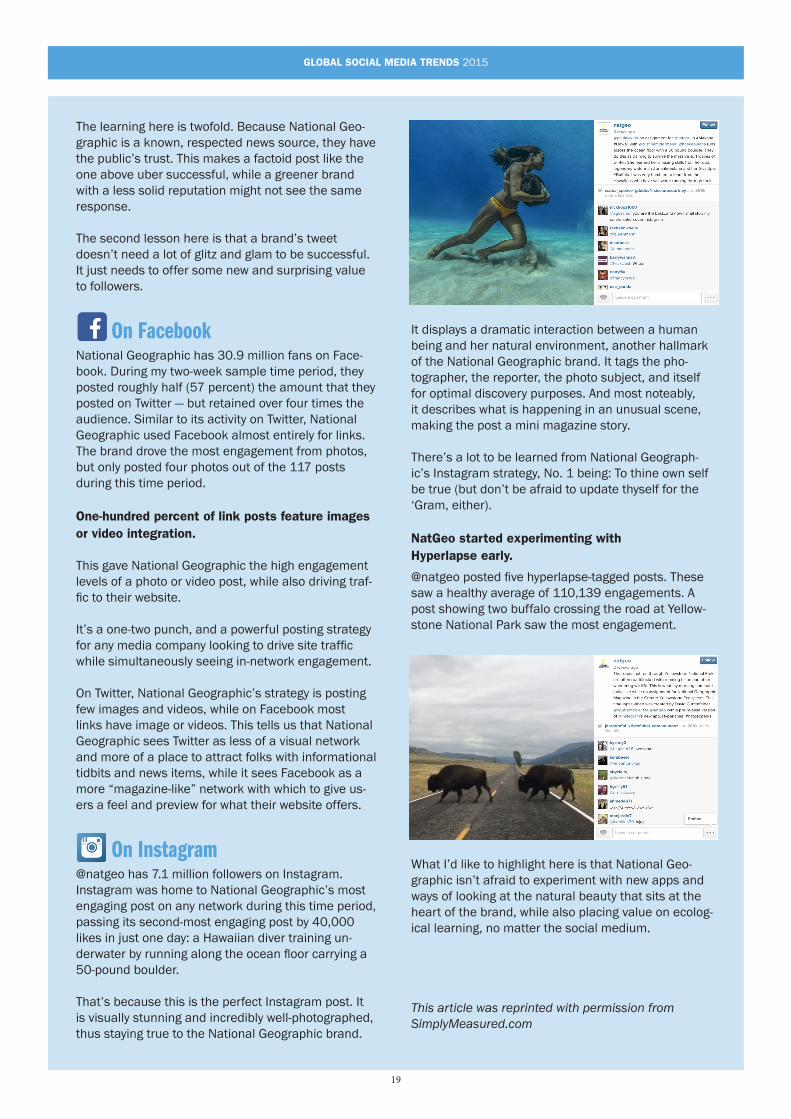
On Instagram @natgeo has 7.1 million followers on Instagram. Instagram was home to National Geographic’s most engaging post on any network during this time period, passing its second-most engaging post by 40,000 likes in just one day: a Hawaiian diver training un-derwater by running along the ocean floor carrying a 50-pound boulder.
That’s because this is the perfect Instagram post. It is visually stunning and incredibly well-photographed, thus staying true to the National Geographic brand.
It displays a dramatic interaction between a human being and her natural environment, another hallmark of the National Geographic brand. It tags the pho-tographer, the reporter, the photo subject, and itself for optimal discovery purposes. And most noteably, it describes what is happening in an unusual scene, making the post a mini magazine story.
There’s a lot to be learned from National Geograph-ic’s Instagram strategy, No. 1 being: To thine own self be true (but don’t be afraid to update thyself for the ‘Gram, either).
NatGeo started experimenting with Hyperlapse early.
@natgeo posted five hyperlapse-tagged posts. These saw a healthy average of 110,139 engagements. A post showing two buffalo crossing the road at Yellow-stone National Park saw the most engagement.
What I’d like to highlight here is that National Geo-graphic isn’t afraid to experiment with new apps and ways of looking at the natural beauty that sits at the heart of the brand, while also placing value on ecolog-ical learning, no matter the social medium.
This article was reprinted with permission from SimplyMeasured.com
20
GLOBAL SOCIAL MEDIA TRENDS 2015
Don’t try too hard to please Twitter — and other lessons from The New York Times’ social media desk
by Michael Roston, senior staff editor for social media at The New York Times
The team that runs The Times’ Twitter accounts looked back on what they learned — what worked, what didn’t — from running @NYTimes in 2014.
The past year brought major changes to The New York Times. The social media desk’s editors joined a new de-partment, Audience Development. Our team gained new resources as we combined efforts with colleagues who previously ran The Times’ Facebook page on the business side of the company, formalising a relationship that had been more casual. Our desk now works alongside teams focused on search engine optimisation, community man-agement, newsroom analytics, and growth. We focus on setting standards for the distribution of Times journalism to broader audiences.
As much as we did last year, we paused at the end of 2014 to take a look back at some of the lessons we learned as well as the principles that helped guide how we ran @NYTimes on Twitter, which is nearing 15 million followers. We hope to share some ideas about what guides our use of Facebook in the near future.
Don’t try too hard to please TwitterOn The Times’ social media desk, we work to maximise the impact of our journalism on Twitter. But we aren’t alone in this work. Our colleagues on copy desks around the newsroom are excellent wordsmiths. And we can often rely on their judgments that what makes good headlines in print or on NYTimes.com will also be power-ful on Twitter.
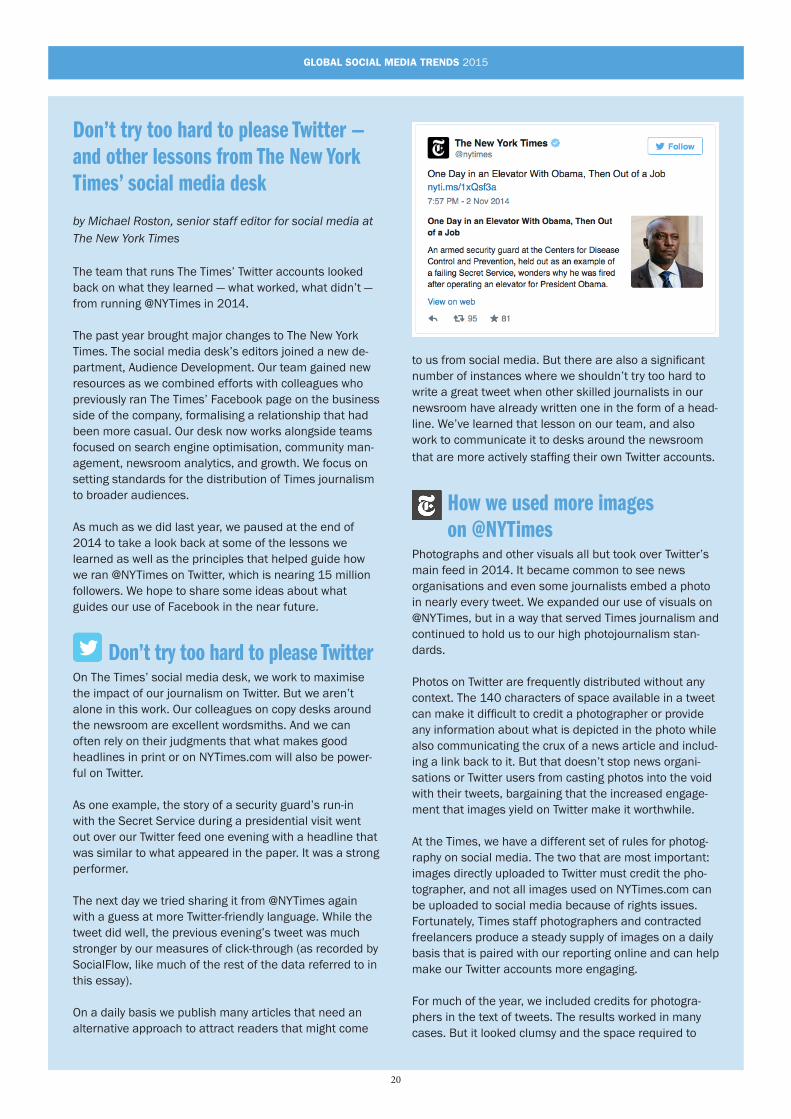
As one example, the story of a security guard’s run-in with the Secret Service during a presidential visit went out over our Twitter feed one evening with a headline that was similar to what appeared in the paper. It was a strong performer.
The next day we tried sharing it from @NYTimes again with a guess at more Twitter-friendly language. While the tweet did well, the previous evening’s tweet was much stronger by our measures of click-through (as recorded by SocialFlow, like much of the rest of the data referred to in this essay).
On a daily basis we publish many articles that need an alternative approach to attract readers that might come
to us from social media. But there are also a significant number of instances where we shouldn’t try too hard to write a great tweet when other skilled journalists in our newsroom have already written one in the form of a head-line. We’ve learned that lesson on our team, and also work to communicate it to desks around the newsroom that are more actively staffing their own Twitter accounts.
How we used more images on @NYTimesPhotographs and other visuals all but took over Twitter’s main feed in 2014. It became common to see news organisations and even some journalists embed a photo in nearly every tweet. We expanded our use of visuals on @NYTimes, but in a way that served Times journalism and continued to hold us to our high photojournalism stan-dards.
Photos on Twitter are frequently distributed without any context. The 140 characters of space available in a tweet can make it difficult to credit a photographer or provide any information about what is depicted in the photo while also communicating the crux of a news article and includ-ing a link back to it. But that doesn’t stop news organi-sations or Twitter users from casting photos into the void with their tweets, bargaining that the increased engage-ment that images yield on Twitter make it worthwhile.
At the Times, we have a different set of rules for photog-raphy on social media. The two that are most important: images directly uploaded to Twitter must credit the pho-tographer, and not all images used on NYTimes.com can be uploaded to social media because of rights issues. Fortunately, Times staff photographers and contracted freelancers produce a steady supply of images on a daily basis that is paired with our reporting online and can help make our Twitter accounts more engaging.
For much of the year, we included credits for photogra-phers in the text of tweets. The results worked in many cases. But it looked clumsy and the space required to
21
GLOBAL SOCIAL MEDIA TRENDS 2015
make room for the credit often made it difficult to write a better tweet. Moreover, the photos could be removed from the context of the tweet in which they were sent, and the source of the photo would thus be obscured:
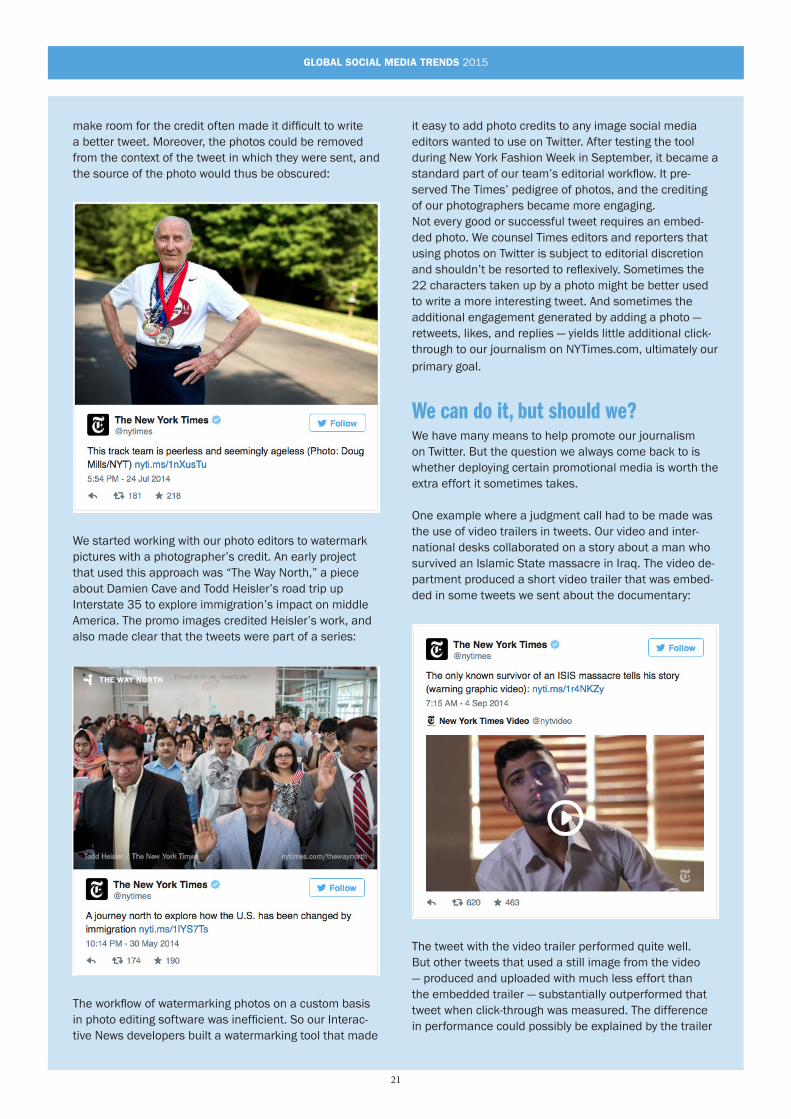
We started working with our photo editors to watermark pictures with a photographer’s credit. An early project that used this approach was “The Way North,” a piece about Damien Cave and Todd Heisler’s road trip up Interstate 35 to explore immigration’s impact on middle America. The promo images credited Heisler’s work, and also made clear that the tweets were part of a series:
The workflow of watermarking photos on a custom basis in photo editing software was inefficient. So our Interac-tive News developers built a watermarking tool that made
it easy to add photo credits to any image social media editors wanted to use on Twitter. After testing the tool during New York Fashion Week in September, it became a standard part of our team’s editorial workflow. It pre-served The Times’ pedigree of photos, and the crediting of our photographers became more engaging.Not every good or successful tweet requires an embed-ded photo. We counsel Times editors and reporters that using photos on Twitter is subject to editorial discretion and shouldn’t be resorted to reflexively. Sometimes the 22 characters taken up by a photo might be better used to write a more interesting tweet. And sometimes the additional engagement generated by adding a photo — retweets, likes, and replies — yields little additional click-through to our journalism on NYTimes.com, ultimately our primary goal.
We can do it, but should we?We have many means to help promote our journalism on Twitter. But the question we always come back to is whether deploying certain promotional media is worth the extra effort it sometimes takes.
One example where a judgment call had to be made was the use of video trailers in tweets. Our video and inter-national desks collaborated on a story about a man who survived an Islamic State massacre in Iraq. The video de-partment produced a short video trailer that was embed-ded in some tweets we sent about the documentary:
The tweet with the video trailer performed quite well. But other tweets that used a still image from the video — produced and uploaded with much less effort than the embedded trailer — substantially outperformed that tweet when click-through was measured. The difference in performance could possibly be explained by the trailer
22
GLOBAL SOCIAL MEDIA TRENDS 2015
dissuading potential viewers to click through to the full video.
There could be important journalistic reasons to use a video trailer, an animated gif, a specially produced image card, or other multimedia to promote a story on Twitter. Some of these methods may also be useful on other social media platforms like Facebook or Instagram. But sometimes a simpler, less labor-intensive approach yields a strong — or stronger — performance.
Avoiding the urge to “peacock” our workTimes journalists take great pride in the work that they do to report the news and tell stories. In addition to the skilled journalism that goes into the work, there’s a prodi-gious vocabulary that goes into describing what is special and unique about the finished product. And sometimes all the effort to describe our hustle can get in the way of telling potential readers about the great story they’re about to be exposed to.
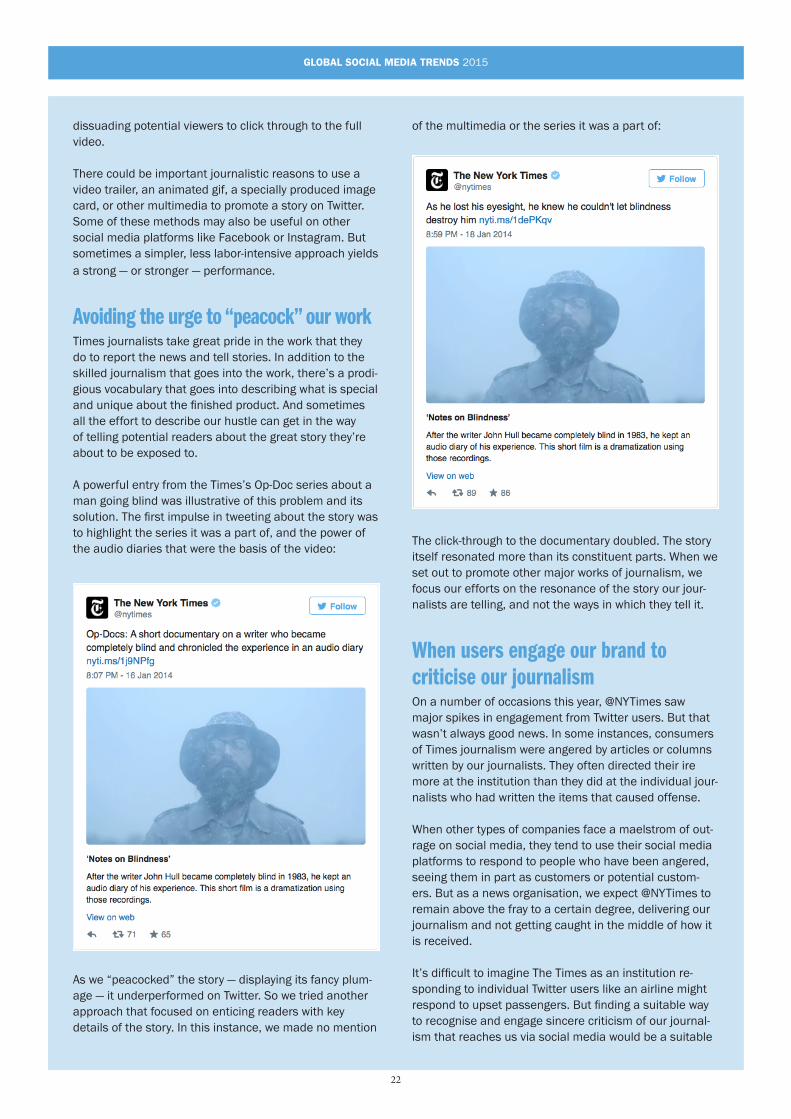
A powerful entry from the Times’s Op-Doc series about a man going blind was illustrative of this problem and its solution. The first impulse in tweeting about the story was to highlight the series it was a part of, and the power of the audio diaries that were the basis of the video:
As we “peacocked” the story — displaying its fancy plum-age — it underperformed on Twitter. So we tried another approach that focused on enticing readers with key details of the story. In this instance, we made no mention
of the multimedia or the series it was a part of:
The click-through to the documentary doubled. The story itself resonated more than its constituent parts. When we set out to promote other major works of journalism, we focus our efforts on the resonance of the story our jour-nalists are telling, and not the ways in which they tell it.
When users engage our brand to criticise our journalismOn a number of occasions this year, @NYTimes saw major spikes in engagement from Twitter users. But that wasn’t always good news. In some instances, consumers of Times journalism were angered by articles or columns written by our journalists. They often directed their ire more at the institution than they did at the individual jour-nalists who had written the items that caused offense.
When other types of companies face a maelstrom of out-rage on social media, they tend to use their social media platforms to respond to people who have been angered, seeing them in part as customers or potential custom-ers. But as a news organisation, we expect @NYTimes to remain above the fray to a certain degree, delivering our journalism and not getting caught in the middle of how it is received.
It’s difficult to imagine The Times as an institution re-sponding to individual Twitter users like an airline might respond to upset passengers. But finding a suitable way to recognise and engage sincere criticism of our journal-ism that reaches us via social media would be a suitable
23
GLOBAL SOCIAL MEDIA TRENDS 2015
use of such platforms. In 2015, we need to spend more time thinking about ways to be responsive to readership that comes to us from social media.
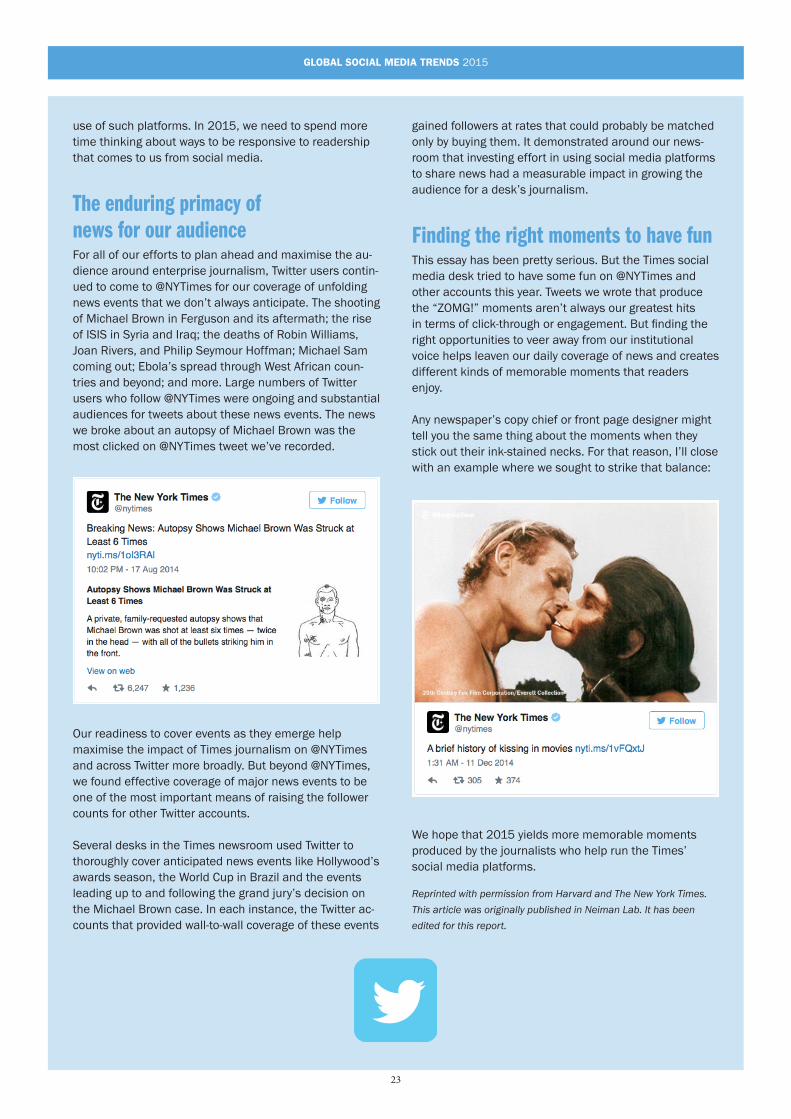
The enduring primacy of news for our audienceFor all of our efforts to plan ahead and maximise the au-dience around enterprise journalism, Twitter users contin-ued to come to @NYTimes for our coverage of unfolding news events that we don’t always anticipate. The shooting of Michael Brown in Ferguson and its aftermath; the rise of ISIS in Syria and Iraq; the deaths of Robin Williams, Joan Rivers, and Philip Seymour Hoffman; Michael Sam coming out; Ebola’s spread through West African coun-tries and beyond; and more. Large numbers of Twitter users who follow @NYTimes were ongoing and substantial audiences for tweets about these news events. The news we broke about an autopsy of Michael Brown was the most clicked on @NYTimes tweet we’ve recorded.
Our readiness to cover events as they emerge help maximise the impact of Times journalism on @NYTimes and across Twitter more broadly. But beyond @NYTimes, we found effective coverage of major news events to be one of the most important means of raising the follower counts for other Twitter accounts.
Several desks in the Times newsroom used Twitter to thoroughly cover anticipated news events like Hollywood’s awards season, the World Cup in Brazil and the events leading up to and following the grand jury’s decision on the Michael Brown case. In each instance, the Twitter ac-counts that provided wall-to-wall coverage of these events
gained followers at rates that could probably be matched only by buying them. It demonstrated around our news-room that investing effort in using social media platforms to share news had a measurable impact in growing the audience for a desk’s journalism.
Finding the right moments to have funThis essay has been pretty serious. But the Times social media desk tried to have some fun on @NYTimes and other accounts this year. Tweets we wrote that produce the “ZOMG!” moments aren’t always our greatest hits in terms of click-through or engagement. But finding the right opportunities to veer away from our institutional voice helps leaven our daily coverage of news and creates different kinds of memorable moments that readers enjoy.
Any newspaper’s copy chief or front page designer might tell you the same thing about the moments when they stick out their ink-stained necks. For that reason, I’ll close with an example where we sought to strike that balance:
We hope that 2015 yields more memorable moments produced by the journalists who help run the Times’ social media platforms.
Reprinted with permission from Harvard and The New York Times. This article was originally published in Neiman Lab. It has been edited for this report.
24
GLOBAL SOCIAL MEDIA TRENDS 2015
Global online activities by share of time spent onlineIn percent of time spent on all online media activities
Source: GlobalWebIndex, 2014 © World Newsmedia Network 2015
Online radio Online TV Online press Social networking Micro-blogging Blogging
100%
80%
60%
40%
20%
0
Japan
Netherla
nds
Germany
France
Ireland
Australia
Sweden
Poland UK
South Korea
CanadaSpain
Singapore
Taiw
an
Russia
South Africa
China
Hong KongUSA
Italy
India
Vietnam
Argentina
Mexico
Turkey
UAE
Malaysia
Indonesia
Philippines
Brazil
Saudi Ara
bia
Thailand
Global online activities by time spentIn number of hours
Source: GlobalWebIndex, 2014 © World Newsmedia Network 2015
Online radio Online TV Online press Social networking Micro-blogging Blogging
10 hours
8 hours
6 hours
4 hours
2 hours
0
Japan
Netherla
nds
Germany
France
Ireland
Australia
Sweden
Poland UK
South Kore
a
CanadaSpain
Singapore
Taiw
an
Russia
South Afri
caChina
Hong KongUSA
Italy
India
Vietnam
Argentin
a
Mexico
Turkey
UAE
Malaysia
Indonesia
Philippines
Brazil
Saudi Ara
bia
Thailand
25
GLOBAL SOCIAL MEDIA TRENDS 2015
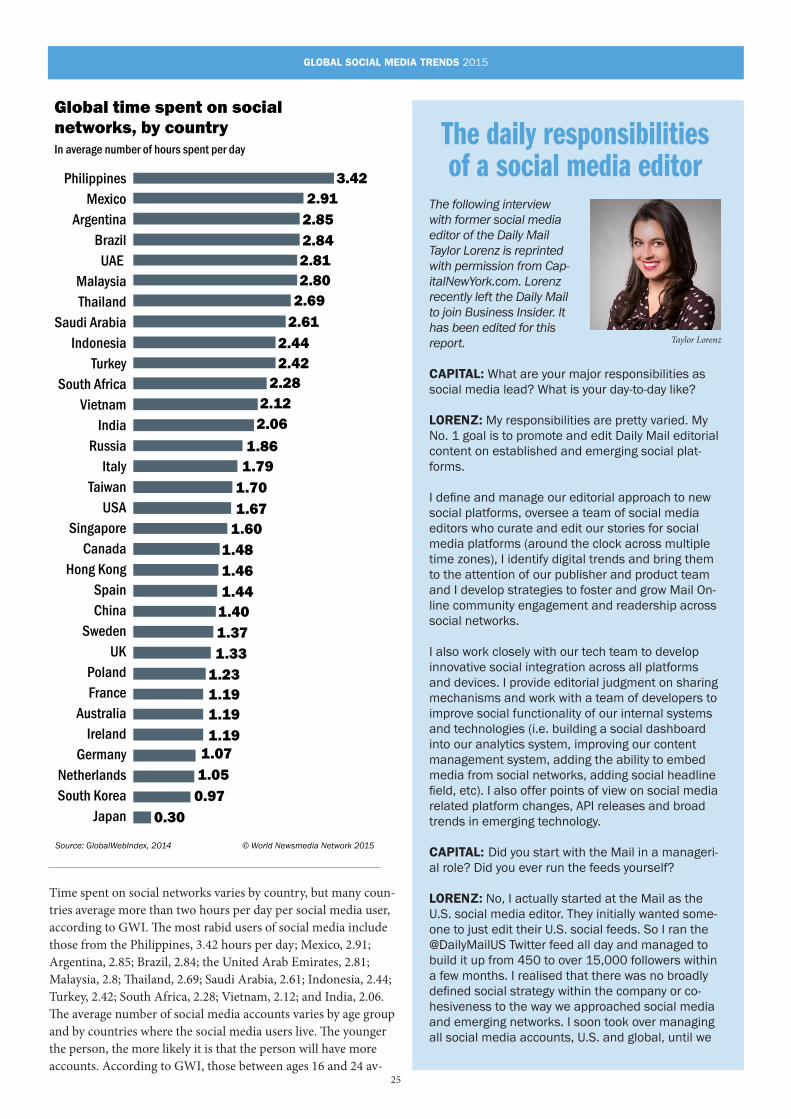
Global time spent on social networks, by countryIn average number of hours spent per day
Source: GlobalWebIndex, 2014 © World Newsmedia Network 2015
PhilippinesMexico
ArgentinaBrazil
UAE MalaysiaThailand
Saudi ArabiaIndonesia
TurkeySouth Africa
VietnamIndia
RussiaItaly
TaiwanUSA
SingaporeCanada
Hong KongSpainChina
SwedenUK
PolandFrance
AustraliaIreland
GermanyNetherlandsSouth Korea
Japan
3.422.91
2.852.842.812.80
2.692.61
2.442.42
2.282.122.06
1.861.79
1.701.67
1.601.481.461.441.401.371.33
1.231.191.191.19
1.071.050.97
0.30
The following interview with former social media editor of the Daily Mail Taylor Lorenz is reprinted with permission from Cap-italNewYork.com. Lorenz recently left the Daily Mail to join Business Insider. It has been edited for this report.
CAPITAL: What are your major responsibilities as social media lead? What is your day-to-day like?
LORENZ: My responsibilities are pretty varied. My No. 1 goal is to promote and edit Daily Mail editorial content on established and emerging social plat-forms.
I define and manage our editorial approach to new social platforms, oversee a team of social media editors who curate and edit our stories for social media platforms (around the clock across multiple time zones), I identify digital trends and bring them to the attention of our publisher and product team and I develop strategies to foster and grow Mail On-line community engagement and readership across social networks.
I also work closely with our tech team to develop innovative social integration across all platforms and devices. I provide editorial judgment on sharing mechanisms and work with a team of developers to improve social functionality of our internal systems and technologies (i.e. building a social dashboard into our analytics system, improving our content management system, adding the ability to embed media from social networks, adding social headline field, etc). I also offer points of view on social media related platform changes, API releases and broad trends in emerging technology.
CAPITAL: Did you start with the Mail in a manageri-al role? Did you ever run the feeds yourself?
LORENZ: No, I actually started at the Mail as the U.S. social media editor. They initially wanted some-one to just edit their U.S. social feeds. So I ran the @DailyMailUS Twitter feed all day and managed to build it up from 450 to over 15,000 followers within a few months. I realised that there was no broadly defined social strategy within the company or co-hesiveness to the way we approached social media and emerging networks. I soon took over managing all social media accounts, U.S. and global, until we
Taylor Lorenz
The daily responsibilities of a social media editor
Time spent on social networks varies by country, but many coun-tries average more than two hours per day per social media user, according to GWI. The most rabid users of social media include those from the Philippines, 3.42 hours per day; Mexico, 2.91; Argentina, 2.85; Brazil, 2.84; the United Arab Emirates, 2.81; Malaysia, 2.8; Thailand, 2.69; Saudi Arabia, 2.61; Indonesia, 2.44; Turkey, 2.42; South Africa, 2.28; Vietnam, 2.12; and India, 2.06.The average number of social media accounts varies by age group and by countries where the social media users live. The younger the person, the more likely it is that the person will have more accounts. According to GWI, those between ages 16 and 24 av-
26
GLOBAL SOCIAL MEDIA TRENDS 2015
brought on some social media editors to help.I still cover shifts and oversee the feeds very closely, but our team of social media editors does the majority of publishing (so I can sleep). I do dictate the majority of what goes out on our Facebook pages though. We have shared Google docs that I populate every morn-ing with stories I think will do well on the platform and I manage it closely.
As my role grew I started to work on more tech and product stuff since it’s where my interests lie. It’s also important that there’s someone thinking about every-thing as a whole. Social media isn’t a silo; it affects every area of the site. You can’t just hire a bunch of people to tweet in a corner and expect your social traffic to rise.
CAPITAL: When you ran the feeds, was it difficult to get into the voice of the Mail? Did you ever edit out American pop culture references that an English audi-ence might not get?
LORENZ: The global nature of our audience is some-thing we definitely think about regularly. The Daily Mail is the largest English-language newspaper site in the world, and we didn’t get there by appealing only to a UK audience and no one else. I think it’s important to maintain some of our British heritage on our global social channels (we spell things with ‘U’s on our main Facebook page), but we also try to tailor the stories to fit our audience depending on the platform and chan-nel. We constantly sell the same stories four different ways depending on the channel we’re publishing to and the audience there.
It’s not as hard as you think though, most of the stories on Daily Mail are just great stories you may not have seen anywhere else, they appeal to anyone any-where. I’ve found that people love good stories above all else, even if there are some weird/geo-specific pop culture references in there.
CAPITAL: Mail Online is obviously hugely popular around the world. Do you get the sense that a lot of Americans know what it is? Do you feel like there’s an opportunity to shape that perception?
LORENZ: The thing is, the Daily Mail is huge in Ameri-ca. We’re the second biggest news site in the U.S. We recorded 32.3 million visits in the U.S. in April 2014,
more than ABC News, USA Today, the Washington Post, the LA Times and the Wall Street Journal. That being said, there is huge opportunity for growth in the States. We opened New York and LA offices in the past couple years and currently there are over 100 editorial staff members in our [New York City] newsroom.
I don’t get the sense that a lot of Americans don’t know what the Daily Mail is, but I do think there’s an opportunity to shape their perception, especially with a younger audience. This is something I’m heavily fo-cused on. I try to find out what networks and platforms younger readers are using, research how they’re using technology and social media, and try to introduce them to the Daily Mail.
CAPITAL: You’ve previously worked in corporate public relations and marketing, as well as social media strategy. Did you always intend to get into journalism eventually?
LORENZ: I’ve had a lot of jobs: I dressed Kanye West as a public relations assistant at Ferragamo, I helped manage communications for John Kerry’s presidential campaign, I’ve tweeted for a condiment brand, sold window replacements door-to-door and wrote copy on brochures for a chemotherapy drug. I believe all of these jobs have helped me in my job today. There are a lot of thirsty NYU journalism majors out there who have resumés stacked with media internships (I was an editorial intern at Harper’s Bazaar, so I’m sort of guilty), but these internships don’t give you perspective on the world. I think that—especially in journalism—the more people you can relate to and understand the better.
I’ve always been really passionate about the news and fascinated with the way people consume it. If I had had more confidence in my writing early on I would have tried to become a reporter. And to be honest, I’ve started writing more articles for the site recently and I really, really love it. I was scared to put my name on things for a while because I thought everything I wrote was awful. I think that’s why I gravitated toward strat-egy and copywriting earlier in my career. Eventually I realised everyone is awful starting out, 90 percent of the Internet is awful, and the only way to get better is to try. I feel like I’ve found a home in journalism/news now and I can’t imagine ever leaving it.
erage more than six accounts, while those between 35 and 54 average four or five accounts. Those 55 and over average about three accounts.
Internet users in China, India and Indonesia average more than seven accounts, while those from the United Arab Emir-ates, the Philippines, Thailand, Saudi Arabia, Mexico, Turkey, and South Africa average six or more accounts, according to GWI.
Users in East Asia, including China, Japan and South Korea, represent the highest number active social media accounts, by region, according to a We Are Social report, published in Jan. 2015. East Asia accounts for 690 million active social media accounts, compared to North America, 206 million; South-east Asia, 199 million; South America, 197 million; Western Europe, 197 million; Eastern Europe, 190 million; South Asia, 157 million; and Africa, 103 million.
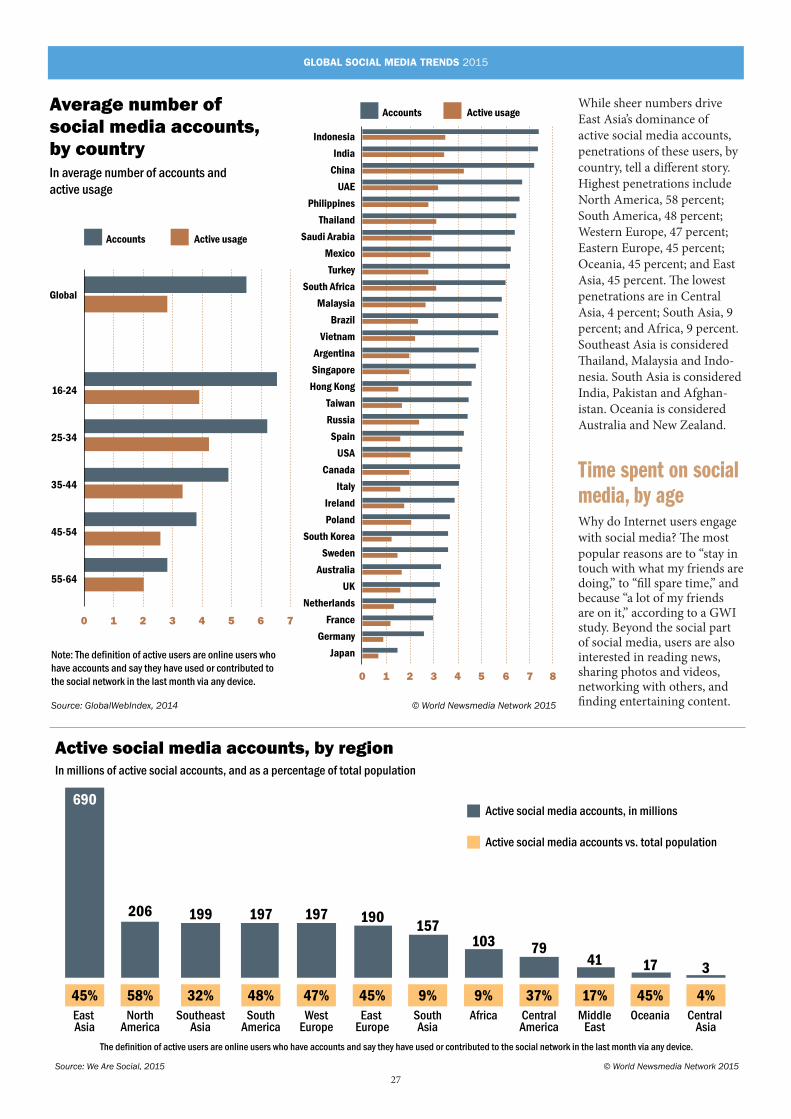
27
GLOBAL SOCIAL MEDIA TRENDS 2015
Average number of social media accounts, by countryIn average number of accounts and active usage
Source: GlobalWebIndex, 2014
Note: The definition of active users are online users who have accounts and say they have used or contributed to the social network in the last month via any device.
© World Newsmedia Network 2015
Indonesia
India
China
UAE
Philippines
Thailand
Saudi Arabia
Mexico
Turkey
South Africa
Malaysia
Brazil
Vietnam
Argentina
Singapore
Hong Kong
Taiwan
Russia
Spain
USA
Canada
Italy
Ireland
Poland
South Korea
Sweden
Australia
UK
Netherlands
France
Germany
Japan
16-24
25-34
35-44
45-54
55-64
Global
Accounts Active usage
Accounts Active usage
0 1 2 3 4 5 6 7 8
0 1 2 3 4 5 6 7
Active social media accounts, by regionIn millions of active social accounts, and as a percentage of total population
The definition of active users are online users who have accounts and say they have used or contributed to the social network in the last month via any device.
690
45%East Asia
206
58%North
America
199
32%Southeast
Asia
197
48%South
America
197
47%West
Europe
190
45%East
Europe
157
9%SouthAsia
103
9%Africa
79
37%CentralAmerica
41
17%Middle
East
17
45%Oceania
3
4%Central
Asia
Source: We Are Social, 2015 © World Newsmedia Network 2015
Active social media accounts, in millions
Active social media accounts vs. total population
While sheer numbers drive East Asia’s dominance of active social media accounts, penetrations of these users, by country, tell a different story. Highest penetrations include North America, 58 percent; South America, 48 percent; Western Europe, 47 percent; Eastern Europe, 45 percent; Oceania, 45 percent; and East Asia, 45 percent. The lowest penetrations are in Central Asia, 4 percent; South Asia, 9 percent; and Africa, 9 percent.Southeast Asia is considered Thailand, Malaysia and Indo-nesia. South Asia is considered India, Pakistan and Afghan-istan. Oceania is considered Australia and New Zealand.
Time spent on socialmedia, by ageWhy do Internet users engage with social media? The most popular reasons are to “stay in touch with what my friends are doing,” to “fill spare time,” and because “a lot of my friends are on it,” according to a GWI study. Beyond the social part of social media, users are also interested in reading news, sharing photos and videos, networking with others, and finding entertaining content.
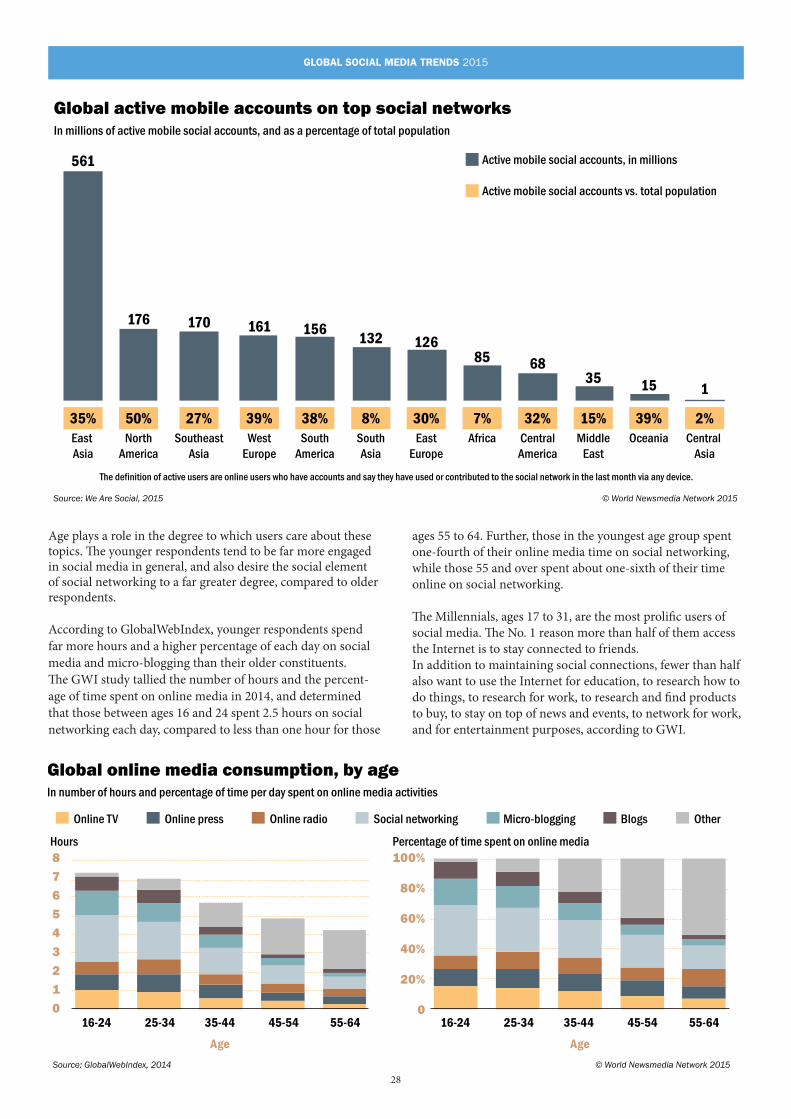
28
GLOBAL SOCIAL MEDIA TRENDS 2015
Global active mobile accounts on top social networksIn millions of active mobile social accounts, and as a percentage of total population
The definition of active users are online users who have accounts and say they have used or contributed to the social network in the last month via any device.
561
35%East Asia
176
50%North
America
170
27%Southeast
Asia
161
39%West
Europe
156
38%South
America
132
8%SouthAsia
126
30%East
Europe
85
7%Africa
68
32%CentralAmerica
35
15%Middle
East
15
39%Oceania
1
2%Central
Asia
Source: We Are Social, 2015 © World Newsmedia Network 2015
Active mobile social accounts, in millions
Active mobile social accounts vs. total population
Global online media consumption, by ageIn number of hours and percentage of time per day spent on online media activities
Source: GlobalWebIndex, 2014 © World Newsmedia Network 2015
Online TV Online press Online radio Social networking Micro-blogging Blogs Other
100%
80%
60%
40%
20%
0
Percentage of time spent on online media8
7
6
5
4
3
2
1
016-24 25-34 35-44
Age Age
45-54 55-64 16-24 25-34 35-44 45-54 55-64
Hours
Age plays a role in the degree to which users care about these topics. The younger respondents tend to be far more engaged in social media in general, and also desire the social element of social networking to a far greater degree, compared to older respondents.
According to GlobalWebIndex, younger respondents spend far more hours and a higher percentage of each day on social media and micro-blogging than their older constituents. The GWI study tallied the number of hours and the percent-age of time spent on online media in 2014, and determined that those between ages 16 and 24 spent 2.5 hours on social networking each day, compared to less than one hour for those
ages 55 to 64. Further, those in the youngest age group spent one-fourth of their online media time on social networking, while those 55 and over spent about one-sixth of their time online on social networking.
The Millennials, ages 17 to 31, are the most prolific users of social media. The No. 1 reason more than half of them access the Internet is to stay connected to friends. In addition to maintaining social connections, fewer than half also want to use the Internet for education, to research how to do things, to research for work, to research and find products to buy, to stay on top of news and events, to network for work, and for entertainment purposes, according to GWI.
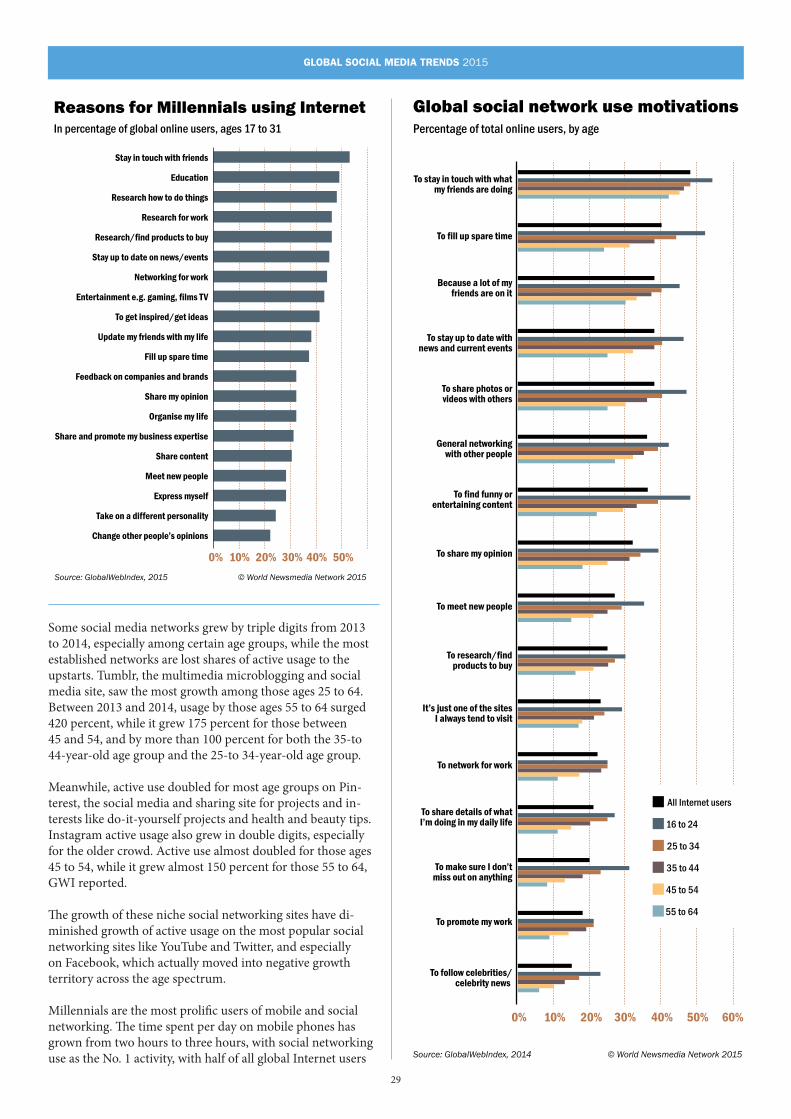
29
GLOBAL SOCIAL MEDIA TRENDS 2015
Global social network use motivationsPercentage of total online users, by age
Source: GlobalWebIndex, 2014 © World Newsmedia Network 2015
0% 10% 20% 30% 40% 50% 60%
To stay in touch with whatmy friends are doing
To fill up spare time
Because a lot of myfriends are on it
To stay up to date withnews and current events
To share photos orvideos with others
General networkingwith other people
All Internet users
16 to 24
25 to 34
35 to 44
45 to 54
55 to 64
To find funny orentertaining content
To share my opinion
To meet new people
To research/findproducts to buy
It’s just one of the sitesI always tend to visit
To network for work
To share details of whatI’m doing in my daily life
To make sure I don’tmiss out on anything
To promote my work
To follow celebrities/celebrity news
Reasons for Millennials using InternetIn percentage of global online users, ages 17 to 31
Source: GlobalWebIndex, 2015 © World Newsmedia Network 2015
Stay in touch with friends
Education
Research how to do things
Research for work
Research/find products to buy
Stay up to date on news/events
Networking for work
Entertainment e.g. gaming, films TV
To get inspired/get ideas
Update my friends with my life
Fill up spare time
Feedback on companies and brands
Share my opinion
Organise my life
Share and promote my business expertise
Share content
Meet new people
Express myself
Take on a different personality
Change other people’s opinions
0% 10% 30%20% 40% 50%
Some social media networks grew by triple digits from 2013 to 2014, especially among certain age groups, while the most established networks are lost shares of active usage to the upstarts. Tumblr, the multimedia microblogging and social media site, saw the most growth among those ages 25 to 64. Between 2013 and 2014, usage by those ages 55 to 64 surged 420 percent, while it grew 175 percent for those between 45 and 54, and by more than 100 percent for both the 35-to 44-year-old age group and the 25-to 34-year-old age group.
Meanwhile, active use doubled for most age groups on Pin-terest, the social media and sharing site for projects and in-terests like do-it-yourself projects and health and beauty tips. Instagram active usage also grew in double digits, especially for the older crowd. Active use almost doubled for those ages 45 to 54, while it grew almost 150 percent for those 55 to 64, GWI reported.
The growth of these niche social networking sites have di-minished growth of active usage on the most popular social networking sites like YouTube and Twitter, and especially on Facebook, which actually moved into negative growth territory across the age spectrum.
Millennials are the most prolific users of mobile and social networking. The time spent per day on mobile phones has grown from two hours to three hours, with social networking use as the No. 1 activity, with half of all global Internet users
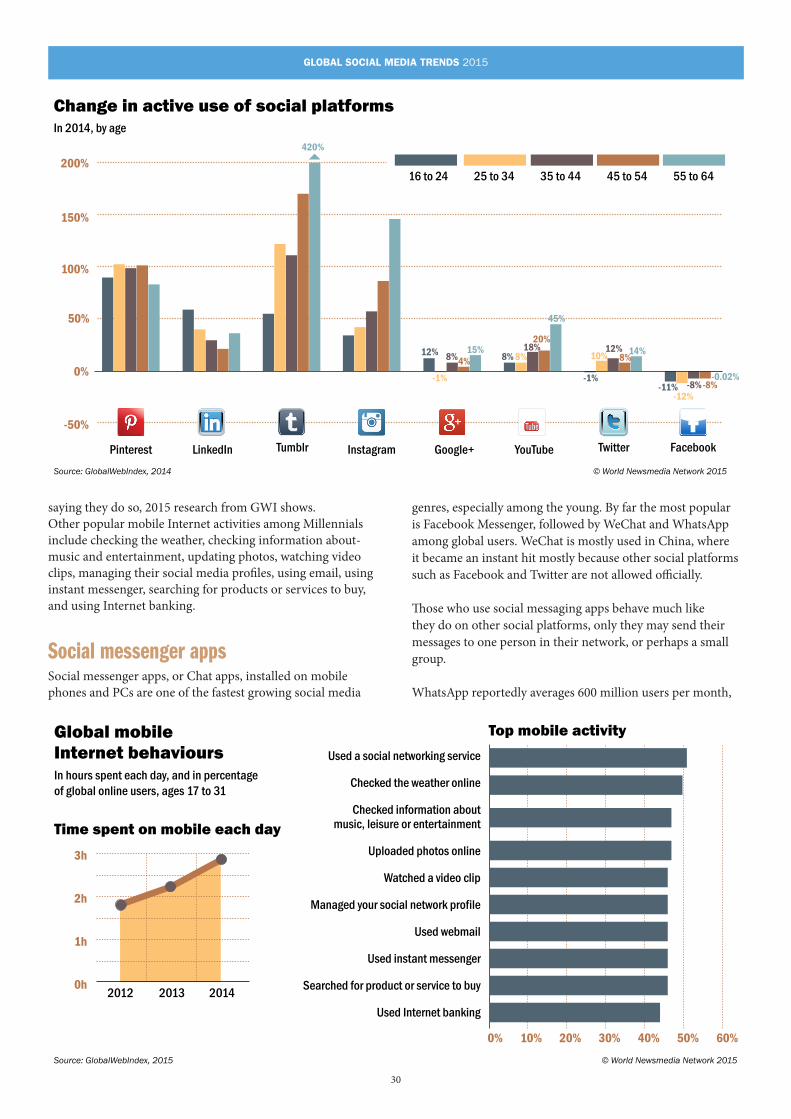
30
GLOBAL SOCIAL MEDIA TRENDS 2015
Change in active use of social platformsIn 2014, by age
Source: GlobalWebIndex, 2014 © World Newsmedia Network 2015
Instagram Google+LinkedInPinterest YouTube Twitter FacebookTumblr
50%
-50%
0%
100%
150%
200%16 to 24 25 to 34 35 to 44 45 to 54 55 to 64
-1%
8%4%15%
420%
8% 8%18%
20%
45%
-1%
10%12%
8%14%
-12%-8%-8%
-0.02%-11%
12%
Global mobile Internet behavioursIn hours spent each day, and in percentage of global online users, ages 17 to 31
Source: GlobalWebIndex, 2015 © World Newsmedia Network 2015
0% 10% 30%20% 40% 50% 60%
Used a social networking service
Checked the weather online
Checked information aboutmusic, leisure or entertainment
Uploaded photos online
Watched a video clip
Managed your social network profile
Used webmail
Used instant messenger
Searched for product or service to buy
Used Internet banking
2012 2013 2014
3h
2h
1h
0h
Time spent on mobile each day
Top mobile activity
saying they do so, 2015 research from GWI shows.Other popular mobile Internet activities among Millennials include checking the weather, checking information about-music and entertainment, updating photos, watching video clips, managing their social media profiles, using email, using instant messenger, searching for products or services to buy, and using Internet banking.
Social messenger appsSocial messenger apps, or Chat apps, installed on mobile phones and PCs are one of the fastest growing social media
genres, especially among the young. By far the most popular is Facebook Messenger, followed by WeChat and WhatsApp among global users. WeChat is mostly used in China, where it became an instant hit mostly because other social platforms such as Facebook and Twitter are not allowed officially.
Those who use social messaging apps behave much like they do on other social platforms, only they may send their messages to one person in their network, or perhaps a small group.
WhatsApp reportedly averages 600 million users per month,
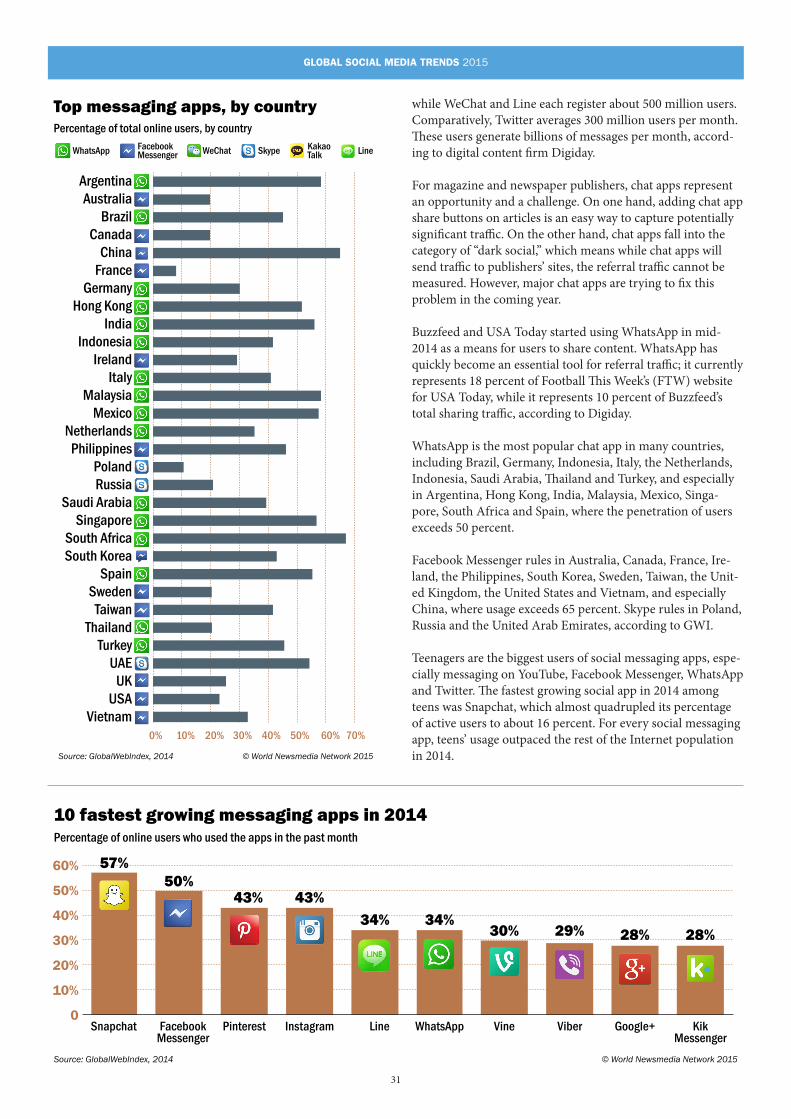
31
GLOBAL SOCIAL MEDIA TRENDS 2015
Top messaging apps, by countryPercentage of total online users, by country
Source: GlobalWebIndex, 2014 © World Newsmedia Network 2015
ArgentinaAustralia
BrazilCanada
ChinaFrance
GermanyHong Kong
IndiaIndonesia
IrelandItaly
MalaysiaMexico
NetherlandsPhilippines
PolandRussia
Saudi ArabiaSingapore
South AfricaSouth Korea
SpainSweden
TaiwanThailand
TurkeyUAE
UKUSA
Vietnam0% 10% 20% 30% 40% 50% 60% 70%
WhatsApp FacebookMessenger WeChat Skype LineKakao
Talk
10 fastest growing messaging apps in 2014Percentage of online users who used the apps in the past month
Source: GlobalWebIndex, 2014 © World Newsmedia Network 2015
0
10%
20%
30%
40%
50%
60%
Snapchat FacebookMessenger
Pinterest Instagram Line WhatsApp Vine Viber Google+ KikMessenger
57%50%
43% 43%
34% 34%30% 29% 28% 28%
while WeChat and Line each register about 500 million users. Comparatively, Twitter averages 300 million users per month. These users generate billions of messages per month, accord-ing to digital content firm Digiday.
For magazine and newspaper publishers, chat apps represent an opportunity and a challenge. On one hand, adding chat app share buttons on articles is an easy way to capture potentially significant traffic. On the other hand, chat apps fall into the category of “dark social,” which means while chat apps will send traffic to publishers’ sites, the referral traffic cannot be measured. However, major chat apps are trying to fix this problem in the coming year.
Buzzfeed and USA Today started using WhatsApp in mid-2014 as a means for users to share content. WhatsApp has quickly become an essential tool for referral traffic; it currently represents 18 percent of Football This Week’s (FTW) website for USA Today, while it represents 10 percent of Buzzfeed’s total sharing traffic, according to Digiday.
WhatsApp is the most popular chat app in many countries, including Brazil, Germany, Indonesia, Italy, the Netherlands, Indonesia, Saudi Arabia, Thailand and Turkey, and especially in Argentina, Hong Kong, India, Malaysia, Mexico, Singa-pore, South Africa and Spain, where the penetration of users exceeds 50 percent.
Facebook Messenger rules in Australia, Canada, France, Ire-land, the Philippines, South Korea, Sweden, Taiwan, the Unit-ed Kingdom, the United States and Vietnam, and especially China, where usage exceeds 65 percent. Skype rules in Poland, Russia and the United Arab Emirates, according to GWI.
Teenagers are the biggest users of social messaging apps, espe-cially messaging on YouTube, Facebook Messenger, WhatsApp and Twitter. The fastest growing social app in 2014 among teens was Snapchat, which almost quadrupled its percentage of active users to about 16 percent. For every social messaging app, teens’ usage outpaced the rest of the Internet population in 2014.
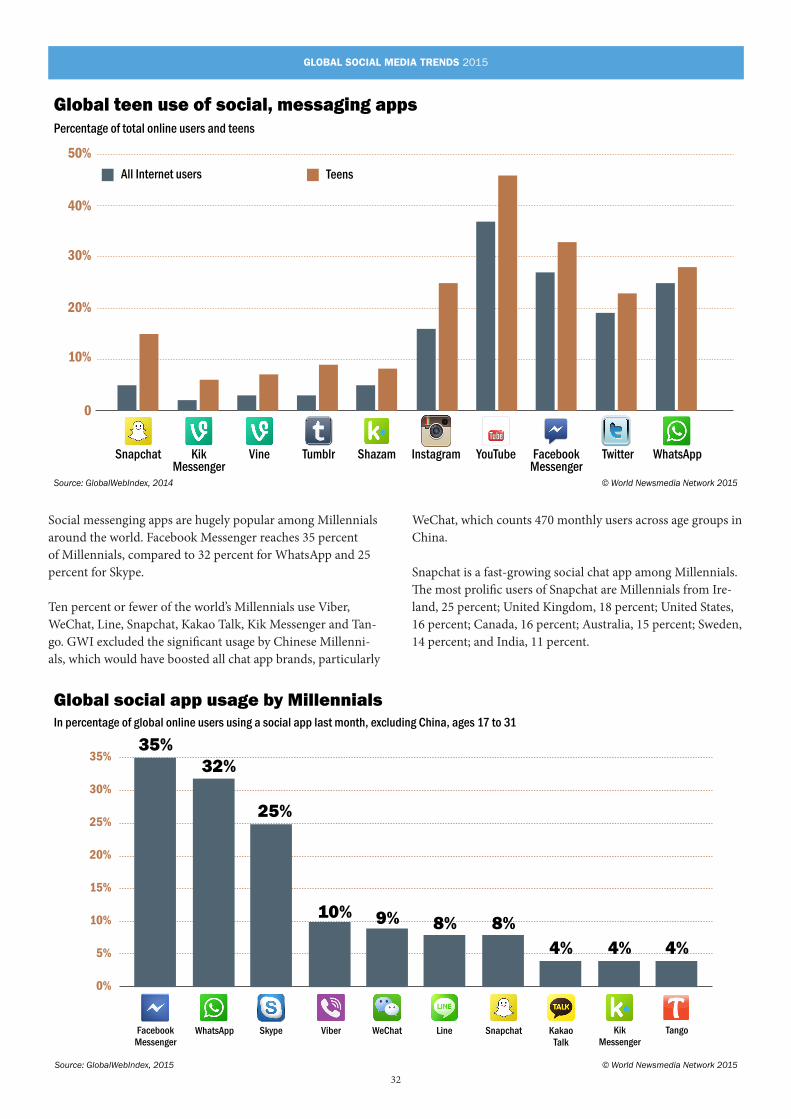
32
GLOBAL SOCIAL MEDIA TRENDS 2015
Global teen use of social, messaging appsPercentage of total online users and teens
Source: GlobalWebIndex, 2014
All Internet users Teens
© World Newsmedia Network 2015
Snapchat FacebookMessenger
Instagram YouTube Twitter WhatsAppVine Tumblr ShazamKikMessenger
0
10%
20%
30%
40%
50%
Global social app usage by MillennialsIn percentage of global online users using a social app last month, excluding China, ages 17 to 31
Source: GlobalWebIndex, 2015 © World Newsmedia Network 2015
0%
5%
10%
15%
20%
25%
30%
35%35%
32%
25%
10% 9% 8% 8%4% 4% 4%
SnapchatFacebookMessenger
WhatsApp Skype Viber WeChat Line KakaoTalk
KikMessenger
Tango
Social messenging apps are hugely popular among Millennials around the world. Facebook Messenger reaches 35 percent of Millennials, compared to 32 percent for WhatsApp and 25 percent for Skype.
Ten percent or fewer of the world’s Millennials use Viber, WeChat, Line, Snapchat, Kakao Talk, Kik Messenger and Tan-go. GWI excluded the significant usage by Chinese Millenni-als, which would have boosted all chat app brands, particularly
WeChat, which counts 470 monthly users across age groups in China.
Snapchat is a fast-growing social chat app among Millennials. The most prolific users of Snapchat are Millennials from Ire-land, 25 percent; United Kingdom, 18 percent; United States, 16 percent; Canada, 16 percent; Australia, 15 percent; Sweden, 14 percent; and India, 11 percent.
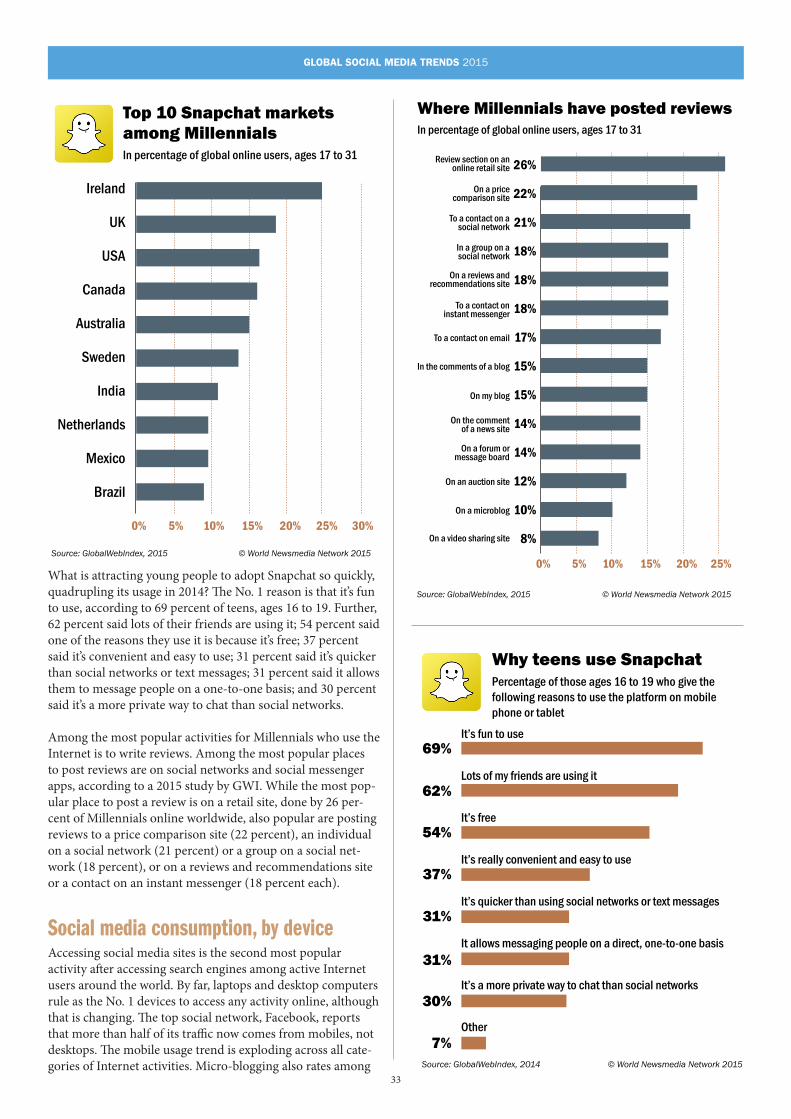
33
GLOBAL SOCIAL MEDIA TRENDS 2015
What is attracting young people to adopt Snapchat so quickly, quadrupling its usage in 2014? The No. 1 reason is that it’s fun to use, according to 69 percent of teens, ages 16 to 19. Further, 62 percent said lots of their friends are using it; 54 percent said one of the reasons they use it is because it’s free; 37 percent said it’s convenient and easy to use; 31 percent said it’s quicker than social networks or text messages; 31 percent said it allows them to message people on a one-to-one basis; and 30 percent said it’s a more private way to chat than social networks. Among the most popular activities for Millennials who use the Internet is to write reviews. Among the most popular places to post reviews are on social networks and social messenger apps, according to a 2015 study by GWI. While the most pop-ular place to post a review is on a retail site, done by 26 per-cent of Millennials online worldwide, also popular are posting reviews to a price comparison site (22 percent), an individual on a social network (21 percent) or a group on a social net-work (18 percent), or on a reviews and recommendations site or a contact on an instant messenger (18 percent each).
Social media consumption, by deviceAccessing social media sites is the second most popular activity after accessing search engines among active Internet users around the world. By far, laptops and desktop computers rule as the No. 1 devices to access any activity online, although that is changing. The top social network, Facebook, reports that more than half of its traffic now comes from mobiles, not desktops. The mobile usage trend is exploding across all cate-gories of Internet activities. Micro-blogging also rates among
Top 10 Snapchat markets among MillennialsIn percentage of global online users, ages 17 to 31
Source: GlobalWebIndex, 2015 © World Newsmedia Network 2015
Ireland
UK
USA
Canada
Australia
Sweden
India
Netherlands
Mexico
Brazil
0% 5% 10% 15% 20% 25% 30%
Why teens use SnapchatPercentage of those ages 16 to 19 who give the following reasons to use the platform on mobile phone or tablet
Source: GlobalWebIndex, 2014
69%
62%
54%
37%
31%
31%
30%
7%© World Newsmedia Network 2015
It’s fun to use
Lots of my friends are using it
It’s free
It’s really convenient and easy to use
It’s quicker than using social networks or text messages
It allows messaging people on a direct, one-to-one basis
It’s a more private way to chat than social networks
Other
Where Millennials have posted reviewsIn percentage of global online users, ages 17 to 31
Source: GlobalWebIndex, 2015 © World Newsmedia Network 2015
0%
26%
22%
21%
18%
18%
18%
17%
15%
15%
14%
14%
12%
10%
8%
5% 10% 15% 20% 25%
Review section on anonline retail site
On a pricecomparison site
To a contact on asocial network
In a group on asocial network
On a reviews andrecommendations site
To a contact oninstant messenger
To a contact on email
In the comments of a blog
On my blog
On the commentof a news site
On a forum ormessage board
On an auction site
On a microblog
On a video sharing site
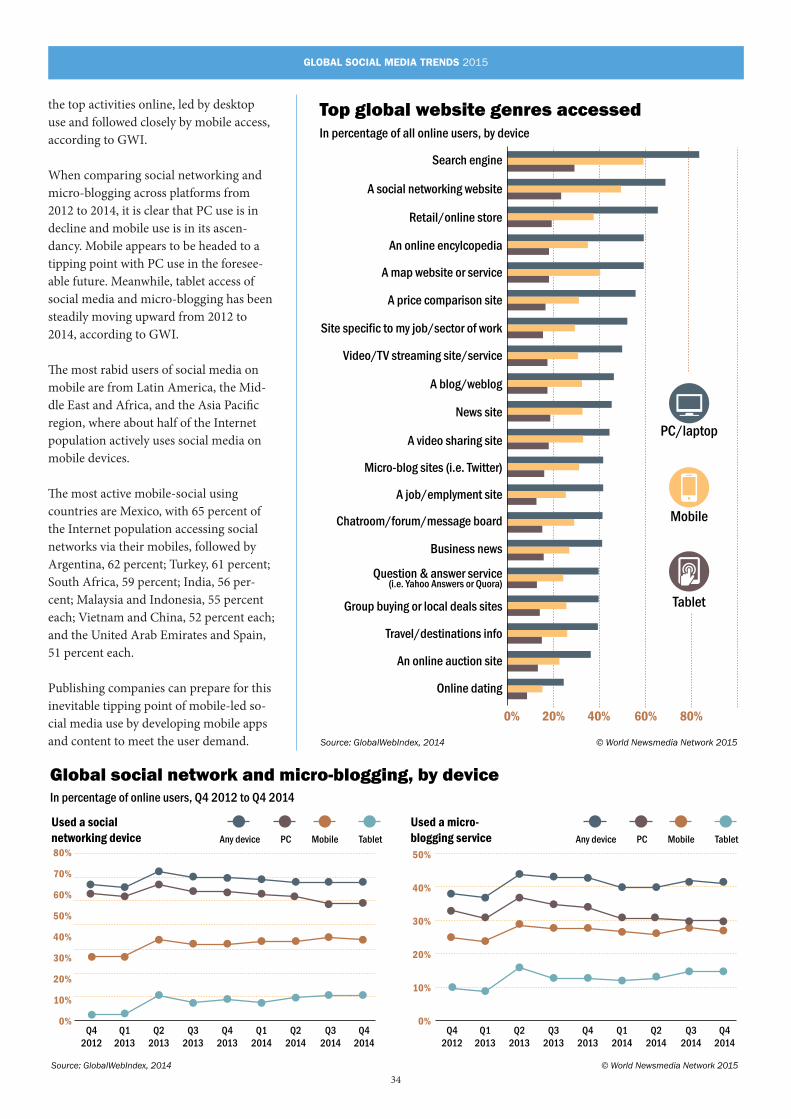
34
GLOBAL SOCIAL MEDIA TRENDS 2015
the top activities online, led by desktop use and followed closely by mobile access, according to GWI.
When comparing social networking and micro-blogging across platforms from 2012 to 2014, it is clear that PC use is in decline and mobile use is in its ascen-dancy. Mobile appears to be headed to a tipping point with PC use in the foresee-able future. Meanwhile, tablet access of social media and micro-blogging has been steadily moving upward from 2012 to 2014, according to GWI.
The most rabid users of social media on mobile are from Latin America, the Mid-dle East and Africa, and the Asia Pacific region, where about half of the Internet population actively uses social media on mobile devices.
The most active mobile-social using countries are Mexico, with 65 percent of the Internet population accessing social networks via their mobiles, followed by Argentina, 62 percent; Turkey, 61 percent; South Africa, 59 percent; India, 56 per-cent; Malaysia and Indonesia, 55 percent each; Vietnam and China, 52 percent each; and the United Arab Emirates and Spain, 51 percent each.
Publishing companies can prepare for this inevitable tipping point of mobile-led so-cial media use by developing mobile apps and content to meet the user demand.
Top global website genres accessedIn percentage of all online users, by device
Source: GlobalWebIndex, 2014 © World Newsmedia Network 2015
Search engine
A social networking website
Retail/online store
An online encylcopedia
A map website or service
A price comparison site
Site specific to my job/sector of work
Video/TV streaming site/service
A blog/weblog
News site
PC/laptop
Mobile
Tablet
A video sharing site
Micro-blog sites (i.e. Twitter)
A job/emplyment site
Chatroom/forum/message board
Business news
Question & answer service(i.e. Yahoo Answers or Quora)
Group buying or local deals sites
Travel/destinations info
An online auction site
Online dating
0% 20% 40% 60% 80%
Global social network and micro-blogging, by deviceIn percentage of online users, Q4 2012 to Q4 2014
Source: GlobalWebIndex, 2014
Used a social networking device
Used a micro-blogging service
© World Newsmedia Network 2015
3.global.GWI.socialnetworkingbydevice
80%
70%
60%
50%
40%
30%
20%
10%
0%Q4
2012Q1
2013Q2
2013Q3
2013Q4
2013Q1
2014Q2
2014Q3
2014Q4
2014
50%
40%
30%
20%
10%
0%Q4
2012Q1
2013Q2
2013Q3
2013Q4
2013Q1
2014Q2
2014Q3
2014Q4
2014
Any device PC Mobile Tablet Any device PC Mobile Tablet
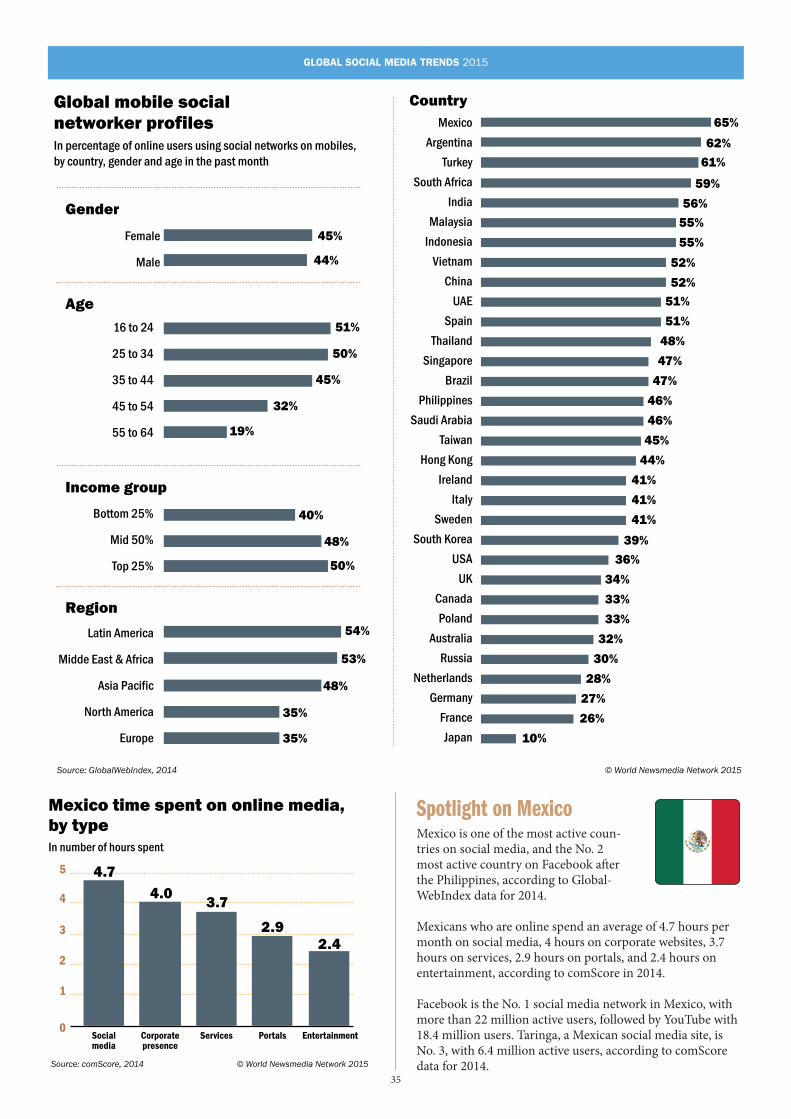
35
GLOBAL SOCIAL MEDIA TRENDS 2015
Spotlight on MexicoMexico is one of the most active coun-tries on social media, and the No. 2 most active country on Facebook after the Philippines, according to Global-WebIndex data for 2014.
Mexicans who are online spend an average of 4.7 hours per month on social media, 4 hours on corporate websites, 3.7 hours on services, 2.9 hours on portals, and 2.4 hours on entertainment, according to comScore in 2014.
Facebook is the No. 1 social media network in Mexico, with more than 22 million active users, followed by YouTube with 18.4 million users. Taringa, a Mexican social media site, is No. 3, with 6.4 million active users, according to comScore data for 2014.
Global mobile social networker profilesIn percentage of online users using social networks on mobiles, by country, gender and age in the past month
Source: GlobalWebIndex, 2014
Mexico
Argentina
Turkey
South Africa
India
Malaysia
Indonesia
Vietnam
China
UAE
Spain
Thailand
Singapore
Brazil
Philippines
Saudi Arabia
Taiwan
Hong Kong
Ireland
Italy
Sweden
South Korea
USA
UK
Canada
Poland
Australia
Russia
Netherlands
Germany
France
Japan
Country65%
62%
61%
59%
56%
55%
55%
52%
52%
51%
51%
48%
47%
47%
46%
46%
45%
44%
41%
41%
41%
39%
36%
34%
33%
33%
32%
30%
28%
27%
26%
10%
© World Newsmedia Network 2015
Female
Male
Gender
45%
44%
16 to 24
25 to 34
35 to 44
45 to 54
55 to 64
Age
51%
50%
45%
32%
19%
Bottom 25%
Mid 50%
Top 25%
Income group
40%
48%
50%
Latin America
Midde East & Africa
Asia Pacific
North America
Europe
Region
54%
53%
48%
35%
35%
Socialmedia
Corporatepresence
Services Portals Entertainment
Mexico time spent on online media, by typeIn number of hours spent
Source: comScore, 2014 © World Newsmedia Network 2015
0
1
2
3
4
5 4.7
4.03.7
2.92.4
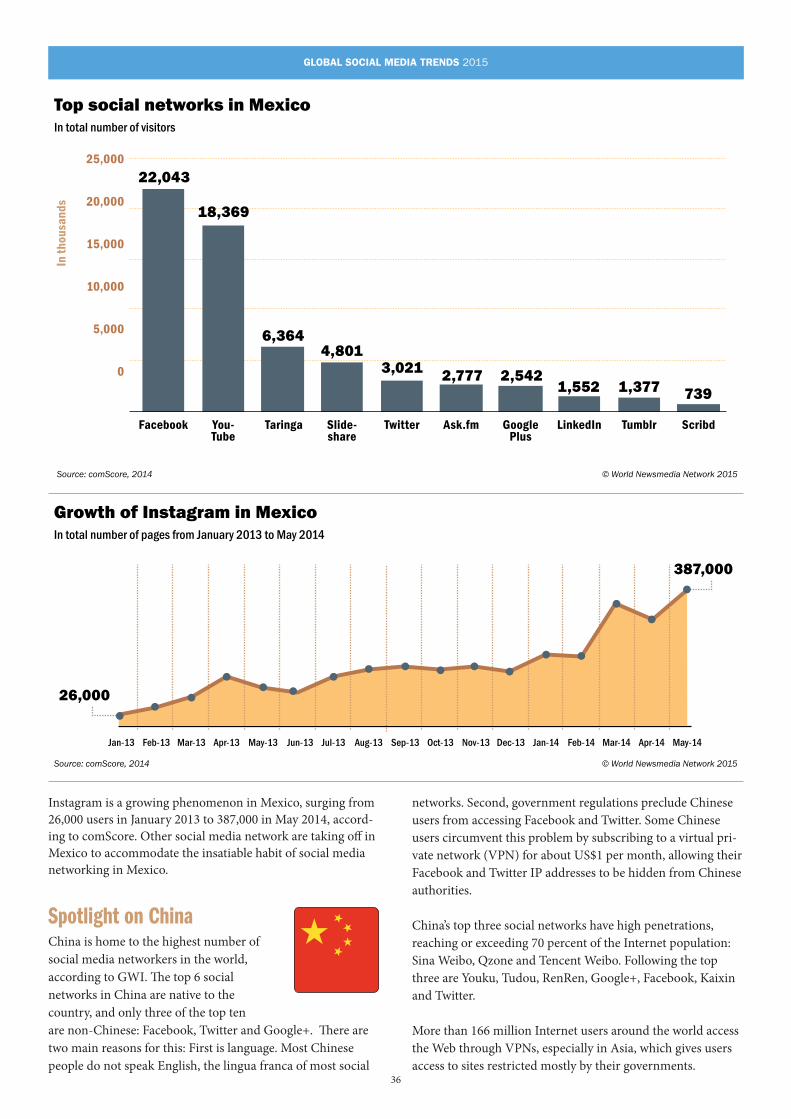
36
GLOBAL SOCIAL MEDIA TRENDS 2015
Instagram is a growing phenomenon in Mexico, surging from 26,000 users in January 2013 to 387,000 in May 2014, accord-ing to comScore. Other social media network are taking off in Mexico to accommodate the insatiable habit of social media networking in Mexico.
Spotlight on ChinaChina is home to the highest number of social media networkers in the world, according to GWI. The top 6 social networks in China are native to the country, and only three of the top ten are non-Chinese: Facebook, Twitter and Google+. There are two main reasons for this: First is language. Most Chinese people do not speak English, the lingua franca of most social
networks. Second, government regulations preclude Chinese users from accessing Facebook and Twitter. Some Chinese users circumvent this problem by subscribing to a virtual pri-vate network (VPN) for about US$1 per month, allowing their Facebook and Twitter IP addresses to be hidden from Chinese authorities.
China’s top three social networks have high penetrations, reaching or exceeding 70 percent of the Internet population: Sina Weibo, Qzone and Tencent Weibo. Following the top three are Youku, Tudou, RenRen, Google+, Facebook, Kaixin and Twitter.
More than 166 million Internet users around the world access the Web through VPNs, especially in Asia, which gives users access to sites restricted mostly by their governments.
Facebook You-Tube
Taringa Slide-share
Twitter Ask.fm GooglePlus
LinkedIn Tumblr Scribd
In th
ousa
nds
Top social networks in MexicoIn total number of visitors
Source: comScore, 2014 © World Newsmedia Network 2015
0
5,000
10,000
15,000
20,000
25,000
22,043
18,369
6,3644,801
3,021 2,777 2,5421,552 1,377 739
Growth of Instagram in MexicoIn total number of pages from January 2013 to May 2014
Source: comScore, 2014
Jan-13 Feb-13 Mar-13 Apr-13 May-13 Jun-13 Jul-13 Aug-13 Sep-13 Oct-13 Nov-13 Dec-13 Jan-14 Feb-14 Mar-14 Apr-14 May-14
© World Newsmedia Network 2015
26,000
387,000
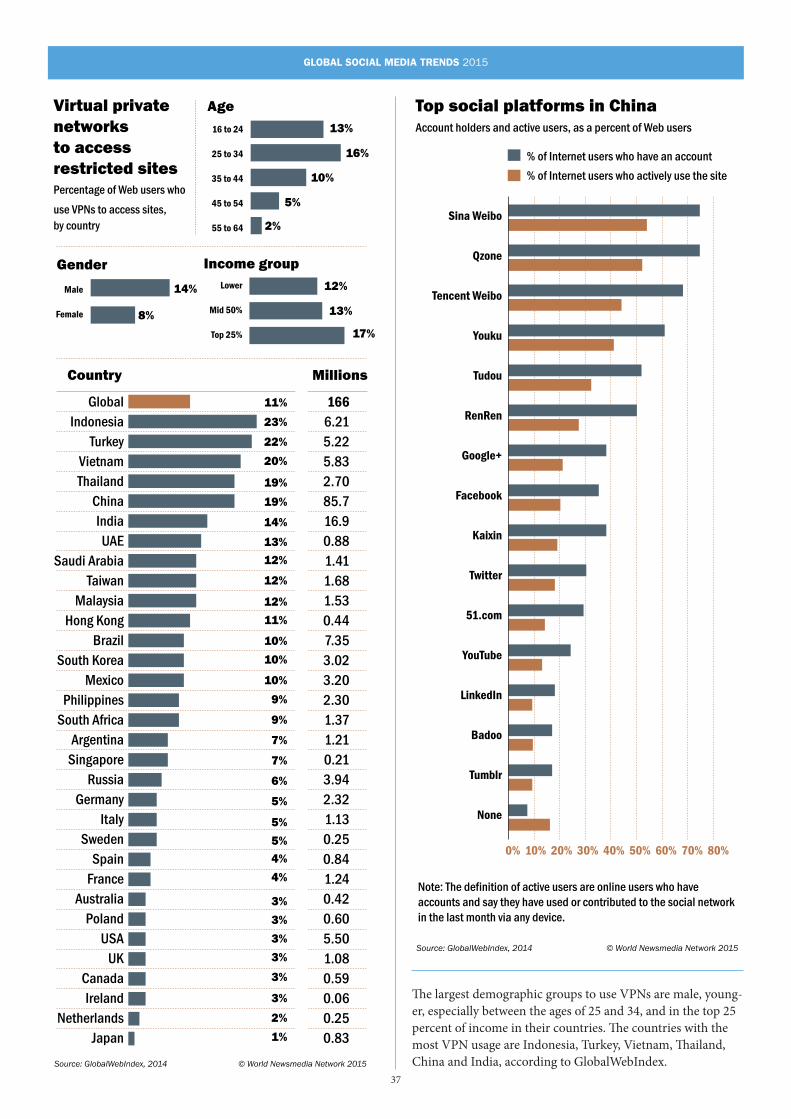
37
GLOBAL SOCIAL MEDIA TRENDS 2015
Top social platforms in ChinaAccount holders and active users, as a percent of Web users
Source: GlobalWebIndex, 2014 © World Newsmedia Network 2015
% of Internet users who have an account
% of Internet users who actively use the site
Note: The definition of active users are online users who have accounts and say they have used or contributed to the social network in the last month via any device.
Sina Weibo
Qzone
Tencent Weibo
Youku
Tudou
RenRen
Google+
Kaixin
51.com
YouTube
Badoo
Tumblr
None
0% 10% 20% 30% 40% 50% 60% 70% 80%
Virtual private networks to access restricted sitesPercentage of Web users who
use VPNs to access sites, by country
Source: GlobalWebIndex, 2014
GlobalIndonesia
TurkeyVietnamThailand
ChinaIndiaUAE
Saudi ArabiaTaiwan
MalaysiaHong Kong
BrazilSouth Korea
MexicoPhilippines
South AfricaArgentina
SingaporeRussia
GermanyItaly
SwedenSpain
FranceAustralia
PolandUSA
UKCanadaIreland
NetherlandsJapan
1666.215.225.832.7085.716.90.881.411.681.530.447.353.023.202.301.371.210.213.942.321.130.250.841.240.420.605.501.080.590.060.250.83
Country Millions
11%
23%
22%
20%
19%
19%
14%
13%
12%
12%
12%
11%
10%
10%
10%
9%
9%
7%
7%
6%
5%
5%
5%
4%
4%
3%
3%
3%
3%
3%
3%
2%
1%
© World Newsmedia Network 2015
Male
Female
Gender
14%
8%
16 to 24
25 to 34
35 to 44
45 to 54
55 to 64
Age
13%
16%
10%
5%
2%
Lower
Mid 50%
Top 25%
Income group
12%
13%
17%
The largest demographic groups to use VPNs are male, young-er, especially between the ages of 25 and 34, and in the top 25 percent of income in their countries. The countries with the most VPN usage are Indonesia, Turkey, Vietnam, Thailand, China and India, according to GlobalWebIndex.
38
GLOBAL SOCIAL MEDIA TRENDS 2015
• Create a social media strategy that includes short-term and long-term objectives with partnership, technology, staffing, training, workflow, data analytics, audience development and leadership components
• Take note of what works and what doesn’t. Commu-nicate wins to colleagues and perpetuate successes. Communicate challenges to colleagues and find work-arounds to avoid obstacles in the future
• Build a social media team with the purpose of leverag-ing each social network for its unique content propo-sitions
• Enable strong working relationships among social me-dia, audience development, newsroom and technology teams
• Publish more compelling video and photos on social networks, as they drive infinitely more referral traffic
than just text
• Include linkbacks to social media posts, as much as possible
• Work directly with social media network executives to ensure greater success with their individual algo-rithms
• Proceed with caution on partnerships with social media networks. Don’t be dazzled by the immediate
gain of revenue. Look at the long-term picture. Make sure the deal also includes access and ownership of audience data
• A/B test headlines and copy of social media posts to drive the most referral traffic possible
• Experiment, fail, succeed, repeat
Planbook for social media strategiesRecommendations for media companies as they execute their social media strategies:
39
GLOBAL SOCIAL MEDIA TRENDS 2015
the worldwide magazine media associationwww.fipp.com/Insight
Contact André Glazier at FIPP ([email protected]) for unique commercial opportunities in the FIPP Insight reports.