Social Media in the City Dec 2012
38
Web: www.sociagility.com | Email: [email protected] | Twitter: @sociagility | +44 (0)20 7193 6793 Social Media in The City Benchmarking the corporate social media performance of the FTSE 100 In association with the PRCA December 2012
-
Upload
sertac-doganay -
Category
Documents
-
view
520 -
download
5
description
Social Media Performance Index by Sociagility
Transcript of Social Media in the City Dec 2012

Web: www.sociagility.com | Email: [email protected] | Twitter: @sociagility | +44 (0)20 7193 6793
Social Media in The City Benchmarking the corporate social media performance of the FTSE 100
In association with the PRCA
December 2012

© 2012 Sociagility Ltd Page 2
Social Media in The City
Contents
Foreword 3
Introduction 4
Summary 5
Why corporate social media performance matters 7
Study scope and methodology 11
Leaders and laggards 13
The FTSE 100 Social Performance Index 2012 16
Sector benchmarks 20
Engagement platforms 24
LinkedIn – an ideal corporate social media platform? 26
Social media performance and financial performance 28
Return on social – the need for social KPIs 30
Conclusions and recommendations 31
Appendix I: About the authors 33
Appendix II: Sociagility – social media performance consultants 34
Appendix III: About the PRCA 35
Appendix IV: The PRINT™ Methodology 36

© 2012 Sociagility Ltd Page 3
Social Media in The City
Foreword
By Francis Ingham, Director-‐General of the
Public Relations Consultants Association
Like the PRCA, Sociagility believes that effective social communications creates competitive
advantage for brands and organisations.
I am therefore very pleased to introduce their first ever purely quantitative and
comparative study of the social media performance of the FTSE 100. I hope
viewing these fascinating results will encourage many more communications
departments to take a much closer look at their social media strategies.
We have now reached a point where social media engagement should be
embraced not avoided. However, a recent PRCA study found that at a senior
level 17% of organisations still do not understand social media. This compares to
66% of board members who saw social media as an opportunity, 2% that saw it
as a threat, and 2% that feel social media is not relevant.
To consider social media as irrelevant, or to continue to misunderstand it,
places organisations at a competitive disadvantage to their rivals. We must all
now recognise that proactive, strategic social media communications can work
to enhance our brands and protect our reputations. Particularly in a crisis, our
first response is increasingly made via ‘the thin social line’.
Yes, social communication comes with a risk – we must be very careful to put
the right strategies and resources in place. However, it would be a far greater
risk to let our social media policy simply stagnate.
Business now operates in an online and connected world and we should view
social media as a fact of everyday communications and engagement. Senior
management and their communications teams must make it their duty not to
be left behind.
Francis Ingham

© 2012 Sociagility Ltd Page 4
Social Media in The City
Introduction
It is still early days in the ‘social media revolution’. As companies absorb its
implications, the default position is that it is a matter mainly for the marketing
or communications department. In creating this study, we hope to focus attention on what we believe to be true: that social media performance really
matters for corporate brands; that it is a competitive issue; and this should be
of concern to the whole C-‐suite.
The research methods we have used are completely quantitative and
objectively measure the comparative performance of the FTSE 100. We have
assessed performance on the web, Twitter, Facebook and YouTube using our
established PRINT™ methodology (already used for a variety of previous
reports). Separately, we have taken a similar quantitative approach to LinkedIn
-‐ a first, we believe. Together, we think they provide a potential KPI for social
media communications.
As with any ranking there are winners and losers. Some of these are
predictable but there are some big surprises too – from individual companies
and from whole sectors.
We have made no attempt to investigate or understand individual company
strategies for corporate social media communication. Nevertheless, major
differences in performance do emerge purely from the data. In some cases these are clearly driven by a deliberate strategy – in others, apparently, by the
absence of one.
Specific company plans to improve social media performance must of course
depend on an individual approach, taking into account a host of factors we
cannot know about. However, we hope that the general trends we have
observed will be of general use – to the FTSE 100 and beyond – and focus
attention on the neglected area of the ‘social corporate’.

© 2012 Sociagility Ltd Page 5
Social Media in The City
Summary
The Social Media in the City study suggests that the majority of the FTSE 100
may be at a competitive disadvantage by failing to engage effectively with
social media networks like LinkedIn, Twitter, Facebook and YouTube.
While there are some high performers, including some companies from
surprising sectors, the research indicates that most companies do not regard
social media and networks as important for corporate communications.
However, social media are used by a variety of stakeholders, by commentators
and by mainstream media.
Report highlights
• Two-‐thirds of FTSE 100 companies perform below the group average on main social media networks
• Shell, AstraZeneca and Sainsbury’s lead the ranking of the best-‐performing companies
• Some top performers come from surprising sectors. For example, the mining firm Vedanta and computer chip-‐manufacturer ARM Holdings both appear in the top 10
• The highest performing FTSE sector is pharmaceuticals and biotechnology, followed by oil and gas producers and retailers
• Only one-‐fifth of FTSE 100 companies have an active company page on LinkedIn
• Statistically significant correlations found between social media performance and subsequent daily share price movement; higher social media performance scores associated with positive changes in share price
The research was conducted in November this year. It used Sociagility’s
quantitative PRINT™ performance measurement system to assess the
corporate social media profiles of all FTSE 100 listed companies. Performance
scores were derived for each social media network and combined to create an
overall Social Performance Index (SPI).
The SPI leadership group is unexpectedly diverse. While the top 20 includes
four of the FTSE 100’s six retail companies, this group also includes non-‐
consumer facing brands like mining firm Vedanta, computer chip-‐manufacturer
ARM Holdings and BAE Systems. Only one bank, Barclays, makes the top 20
group.
There are some surprising sector laggards. The Insurance sector as a whole, for
example, scores well below the FTSE 100 average and only one company, Aviva,
even makes the SPI top 30.

© 2012 Sociagility Ltd Page 6
Social Media in The City
While most companies (95%) have a LinkedIn presence, frequently as a result of
employee activity, only one-‐fifth have an actively managed company page and
just 12% saw any kind of audience engagement over the course of a week. A
separate quantitative analysis ranks the FTSE100 based on three attributes:
Popularity; Activity; and Engagement. Shell leads this LinkedIn ranking.
The report’s authors argue that under-‐performing companies may be incurring
a reputational disadvantage internationally compared with competitor
companies that engage with social media successfully. Previous Sociagility studies have shown a close correlation between PRINT™ rankings and
measures for brand strength and growth and sales.

© 2012 Sociagility Ltd Page 7
Social Media in The City
Why corporate social media performance matters
The emergence of fast-‐growing platforms that facilitate connection and
sharing (Facebook, Twitter, YouTube et al) is transforming the way that people
discover and consume information. The highly personal way that people engage with each other via these ‘social’ media has redefined their
expectations of how organisations engage with them – and vice versa.
While brands are first and foremost about genuine performance, they are also
about peoples’ perceptions, created both by what brands say about
themselves as well as ‘what people say about you when you’ve left the room’.
As audience communication preferences migrate from traditional to social
media, so too must the company’s communications attention.
This is hardly a novel observation for the world’s leading brands. Most
sophisticated brands and companies recognize that, in an increasingly
competitive online environment, accentuated by current economic
circumstances, social media and networks are becoming critically important.
But does a good social media performance actually matter for corporate
audiences?
We would not be in business if we didn’t think so, and it is reassuring that a
majority of FTSE 100 companies apparently agree… or at least enough to have
a social media presence of some kind. But not everyone’s equally keen – or capable. Two-‐thirds perform below average for the group.
Who’s on what?
First, by ‘corporate’, we mean the overall business, rather than its constituent
companies or brands. For some ‘company brands’, of course, this is the same
brand name. Specifically, for the purposes of this study we have looked at the
online profiles of the entity actually listed on the London Stock Exchange, the
PLC.
The breakdown for FTSE 100 usage of the four most common public platforms
measured by PRINT™ is as follows:
• 100% of the FTSE 100 have a website aimed at corporate audiences • 72% have created some kind of corporate Twitter account
• 65% have a corporate YouTube channel • Only 56% have a corporate Facebook page, perhaps indicative of a platform
being perceived as more consumer-‐focused
© 2012 Sociagility Ltd Page 8
Social Media in The City
For this study, we also looked at usage of LinkedIn amongst the FTSE 100 group
using a quantitative framework based on PRINT™. Nearly 100% of companies
have a dedicated company page -‐ but this can be an almost totally passive act,
as LinkedIn creates these automatically for the most well-‐known companies.
Only 20% of FTSE100 companies have what we would consider to be an active
LinkedIn presence – i.e. the company has used it to engage in the previous 30
days. Worse still, only 12% saw any kind of audience engagement over a 7-‐day
period.
It is hardly surprising that all the companies have a corporate website – even if
some are pretty basic. But the numbers drop off after that. So which audiences
are the companies that do have a corporate social media presence trying to
reach and why is that not relevant for the others?
Corporate and financial stakeholders
Of course there are a whole host of potential ‘corporate’ stakeholders:
employees, trades unions, suppliers, local communities as well as regulators,
and legislators. Most have their associated interest groups and commentators
plus a broad spectrum of ‘traditional’ media -‐ trade, business, specialist and
broadcast. All these groups include many important individuals who are active
users of social media. For them, it is just another way to have a relationship with a brand or company – or simply to keep track of what they are doing.
But what about investors? Do they really care about tweets and Facebook
likes… they are just interested in facts and figures, right? In any case, surely it is
more controllable for listed companies to avoid the risk of engaging via these
informal forums and channels and stick with the safe formalities of the annual
report, face-‐to-‐face presentations, earnings statements – and the traditional
mediated route of the financial press.
We believe that this view is short-‐sighted for a variety of reasons.
• Shareholders and potential investors are people too – and, just like customers, likely to be participating in social media, especially in the UK and USA.
• Investors use social media – private investors and the ‘wholesale’ City institutions like insurance companies, banks and brokers, routinely use social media as one input for their buy/sell/hold decisions.
• Traditional media use social media – City commentators, not least the financial press, use social media to track news and opinion – and themselves engage in creating social media content.

© 2012 Sociagility Ltd Page 9
Social Media in The City
Fragmented responsibility = fractured response
The Internet in all its forms is a public mirror (sometimes distorted) for brands
and companies, showing the good and the bad, highlighting successful strategies and exposing corporate fault-‐lines. And social media is by no means
the only part of corporate communications that can suffer from a less than
holistic approach.
Yet some FTSE 100 companies still seem to be adopting a traditional, pre-‐
Internet (let alone pre Web 2.0) approach to managing their social media
presence. Specific audiences are assigned specific channels leading to a
dangerous potential for gaps, contradictions and confused or incoherent
messaging.
A typical example is Twitter. Many companies just use Twitter corporately as a
broadcast channel devoted to journalists, with content consisting almost
entirely of references to news releases. Why is this happening? Well, it could be
a well thought out strategy but it is more likely to be because someone in the
Press Office was seen to ‘get’ Twitter… so he/she got it forever. But while
Twitter may undoubtedly be useful to the press office, it can also be a great
tool for many other departments/functions such as CRM, HR etc.
There is similar issue with Facebook. The perception – aided and abetted by Facebook and some agencies – is that it is purely a consumer platform and the
only role for companies is product advertising. Yet many organisations use it
successfully to reach out to local communities, job seekers and even business
partners.
Perhaps most confused of all is LinkedIn. Lots of reports say this is a highly
rated channel and nearly all (95%) of FTSE100 companies have a presence. But
only one-‐fifth have an active company page and fewer still see any audience
engagement. So it looks like this one is falling through the cracks: LinkedIn is
getting left out.
When things go bang
It is the nature of the social media universe to abhor a vacuum – whatever the opinion, someone is bound to have it. And, unlike formal news brands, citizen
publishers do not need to fact-‐check. So even positive stories about a company
can get wildly distorted, while negative rumours can spread quickly – and in a
crisis, almost instantaneously. Any company which lacks a listening presence
and a means to respond is very vulnerable. And companies that have not built
up a solid body of positive content and a history of engagement will likely do

© 2012 Sociagility Ltd Page 10
Social Media in The City
less well managing negative episodes than those which have already created
some kind of positive social media context.
The tendency for corporate communications departments to want to ‘control
the message’ is understandable – for many that is seen as part of the job spec.
But the reality is that old-‐style control is no longer possible and a balanced,
hands-‐on approach to social media engagement is the best way to help a brand
achieve the reputation it desires and deserves.
A competitive issue
Unsurprisingly, Sociagility’s point of view is that social media have a large and
increasing important part to play in corporate communications – including the
daily struggle for stakeholders’ confidence and support. We believe that how
well a company engages corporately through social media is a competitive
issue internationally – both as a risk to be managed properly and an
opportunity to gain advantage. Furthermore, as we show later in this report,
statistical analysis of our research data indicates that social media performance
correlates significantly with share price movement.
It is therefore important not just for corporate communicators and marketing
directors but also for company chairmen, CEOs and their boards.

© 2012 Sociagility Ltd Page 11
Social Media in The City
Study scope and methodology
This study compared the social media performance of the companies that
made up the FTSE 100 as at 1 November 2012.
The scores and rankings have been calculated using Sociagility’s PRINT™ methodology, assessing the available websites, Twitter accounts, Facebook
pages and YouTube channels which have been clearly designated as ‘corporate’
(as opposed to directly customer-‐facing) by each organisation.
Each firm was given the opportunity to contribute to the channel selection
before data was collected, in order to ensure the most accurate representation
of their activities. Where some organisations are not using a channel this is
indicated in the rankings, however overall scores have been calculated based
on all four platforms.
The data for this study was gathered from 1–7 November 2012.
Corporate profiles
Because our focus with this research is on corporate social communications we
have used corporate profiles for our comparisons. As described earlier, this means the websites and accounts associated with the entity actually listed on
the London Stock Exchange. In some cases this will simply be the holding
company. In others, where the company and product or service brand names
are the same, it will be the same website, Twitter account etc. However, where
it is not, i.e. where companies themselves have created specific online profiles
for their PLC entity quite separate from the constituent brands, we have
selected these profiles to compare, reflecting the chosen approach of the
company. We felt this was the best way to create a level ‘corporate’ playing
field.
A full list of the profiles analysed can be found at
http://www.sociagility.com/ftse100.
Unused channels
Some companies do not use all the channels that PRINT™ measures. This may
be a matter of choice or simply inaction. Regardless, because we are looking at
overall performance, for the purpose of the overall Social Performance Index
(SPI) ranking, all scores are included.
However, to allow a comparison based on the efficiency solely of the channels
used, we have also analysed these separately. It is debatable how valid such a

© 2012 Sociagility Ltd Page 12
Social Media in The City
comparison is across the whole group. At its extreme, this could mean that a
company that is effective just on one channel (e.g. Twitter) could outscore a
company that is marginally less effective on that channel but better on all
others. Nevertheless, as we say elsewhere in this report, channel strategy is an
important part of social media performance and, for an individual company,
one channel may be much more important than another.
The PRINT™ methodology
Sociagility’s PRINT™ methodology compares organisations’ performance
across multiple social media platforms, against five key contributors to social
brand performance (the PRINT™ attributes):
• Popularity – being well known or having a high status
• Receptiveness – willingness to listen and engage, not just broadcast • Interaction – communities that engage regularly and consistently with the
brand • Network reach – actual and potential audience size • Trust – influence and authority within the community
Scores for each attribute and channel combination are calculated using over 50
publicly available metrics. Some of these are raw measures (e.g. friends,
followers, fans, subscribers, etc.) and others are ratios that have been
specifically chosen in order to ensure a fair comparison (e.g. engagement per
thousand followers, subscriptions per day, etc.).
In addition to an overall score (the Social Performance Index or SPI), the
‘popularity’ and ‘network reach’ attributes are combined to provide the
Awareness Quotient (AQ) and the remaining attributes made up the
Engagement Quotient (EQ).
LinkedIn performance
A separate study was undertaken into the performance of FTSE 100 company
pages on LinkedIn. The results of this analysis appear on page 26. A single score
was calculated using Sociagility’s proprietary LinkedIn performance algorithm,
which looks at metrics including follower and employee numbers, product and
service recommendations, and company updates, likes and comments. The
data for this study was gathered on 9 November 2012.

© 2012 Sociagility Ltd Page 13
Social Media in The City
Leaders and laggards
The companies compared in this report are by definition already highly
successful in terms of at least one dimension of financial performance, ie
capital value. But not all FTSE 100 companies show a corporate social media performance commensurate with their status. This may be because they have
not participated in social media, because they are holding companies for other
more ‘social’ organisations, or simply because they are not very good at it.
All organisations in this study are being compared against the full group, not
some theoretical perfect score. So any description of ‘winners’ and ‘losers’ is
comparative, not absolute. For many such a broad comparison will be
unrealistic, as they do not actually compete with each other in the same
category. So, as well as the sector highlights in subsequent sections, a bespoke
company/sector report can be requested at http://www.sociagility.com/ftse100.
Top 20
Rank Company FTSE Sector Mkt Cap* SPI
1 Royal Dutch Shell Oil & Gas Producers £58,743m 996
2 AstraZeneca Pharma & Biotech £36,011m 859
3 J Sainsbury Food & Drug Retailers £6,700m 446
4 M&S Group General Retailers £6,238m 415
5 Next General Retailers £5,885m 362
6 Vedanta Resources Mining £2,972m 322
7 ITV Media £3,417m 313
8 ARM Holdings Technology Hardware £9,587m 311
9 Unilever Food Producers £29,969m 258
10 Wm Morrison Food & Drug Retailers £6,329m 206
11 BAE Systems Aerospace & Defence £10,316m 200
12 BT Group Fixed Line Telecoms £17,828m 188
13 InterContinental Hotels Travel & Leisure £4,149m 177
14 GlaxoSmithKline Pharma & Biotech £68,171m 166
15 G4S Support Services £3,679m 152
16 Barclays Banks £29,072m 147
17 BSkyB Group Media £12,390m 139
18 Reckitt Benckiser Group Household Goods £27,172m 137
19 Pearson Media £10,131m 136
20 Vodafone Group Mobile Telecoms £82,353m 132
* Market Capitalisation as at 8 November 2012
© 2012 Sociagility Ltd Page 14
Social Media in The City
Shell, AstraZeneca and J Sainsbury lead the overall ranking of corporate social
media performance, with the latter punching well above its market
capitalisation. Indeed, only seven of the 20 largest companies in the FTSE 100
appear in this ranking, making way for a number of smaller cap organisations
including Vedanta Resources, ITV, G4s and InterContinental Hotels Group (all
sub-‐£5,000m market capitalisation).
Some companies do not use all the channels that PRINT™ measures. The re-‐
weighted ranking below therefore compares performance based on the efficiency solely of the channels used. However, at its extreme, this could mean
that a company that is effective just on one channel (e.g. Twitter) could
outscore a company that is marginally less effective on that channel but better
on all others.
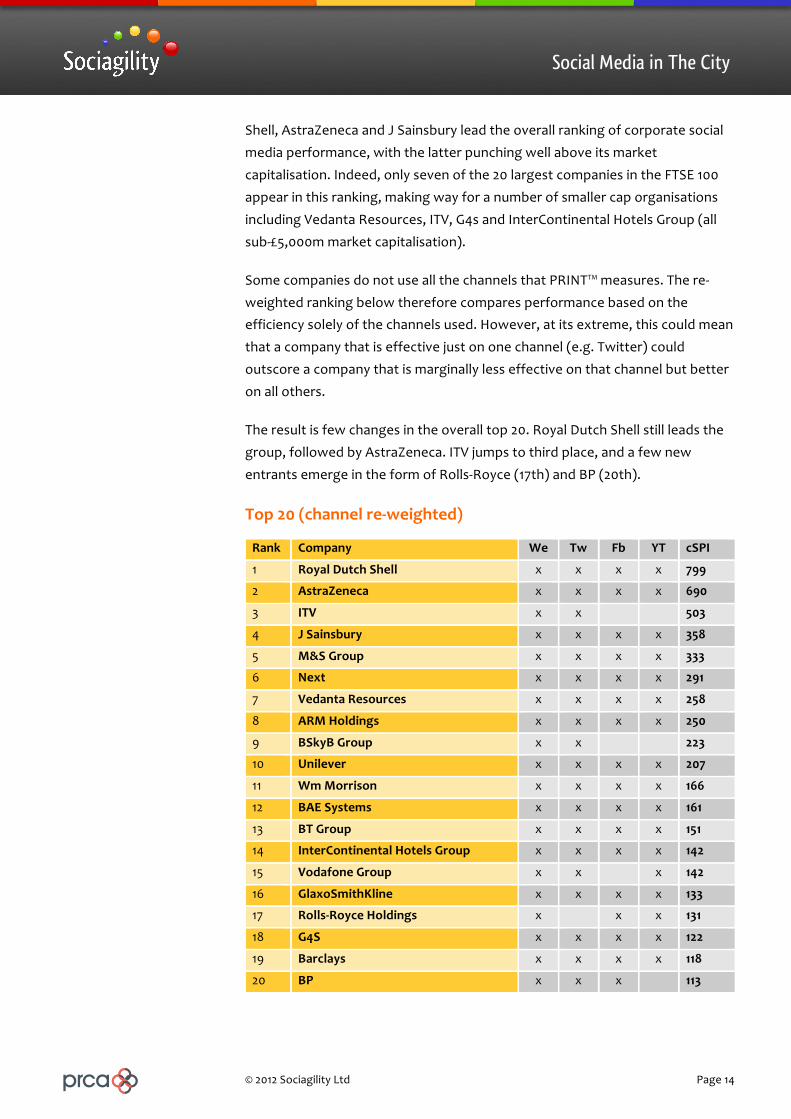
The result is few changes in the overall top 20. Royal Dutch Shell still leads the
group, followed by AstraZeneca. ITV jumps to third place, and a few new
entrants emerge in the form of Rolls-‐Royce (17th) and BP (20th).
Top 20 (channel re-‐weighted)
Rank Company We Tw Fb YT cSPI
1 Royal Dutch Shell x x x x 799
2 AstraZeneca x x x x 690
3 ITV x x 503
4 J Sainsbury x x x x 358
5 M&S Group x x x x 333
6 Next x x x x 291
7 Vedanta Resources x x x x 258
8 ARM Holdings x x x x 250
9 BSkyB Group x x 223
10 Unilever x x x x 207
11 Wm Morrison x x x x 166
12 BAE Systems x x x x 161
13 BT Group x x x x 151
14 InterContinental Hotels Group x x x x 142
15 Vodafone Group x x x 142
16 GlaxoSmithKline x x x x 133
17 Rolls-‐Royce Holdings x x x 131
18 G4S x x x x 122
19 Barclays x x x x 118
20 BP x x x 113

© 2012 Sociagility Ltd Page 15
Social Media in The City
Bottom 10
At the bottom of the table, it is perhaps not unusual to find FTSE 100
constituents that are not household names. Primarily in business-‐to-‐business or industrialised sectors, these kinds of company scores are to be expected when
comparing to a group that includes much more familiar brand names.
Still, there are one or two surprises in the form of Prudential (90th), Tate & Lyle
(73rd) and Admiral Group (67th). The full ranking can be found on pages 18–19.
Rank Company FTSE Sector SPI
91 Croda International Chemicals 13
92 Meggitt Aerospace & Defence 13
93 CRH Construction 12
94 Weir Group Industrial Engineering 12
95 Associated British Foods Food Producers 12
96 Polymetal International Mining 11
97 Evraz Industrial Metals 10
98 Kazakhmys Mining 10
99 Capital Shopping Centres Group REITs 10
100 Babcock International Group Support Services 8

© 2012 Sociagility Ltd Page 16
Social Media in The City
The FTSE 100 Social Performance Index 2012
A full ranking of social media performance of all FTSE 100 companies appears
on the following pages, along with their respective PRINT™, attribute and
channel scores. For an interactive version of this table, or to request a bespoke company/sector analysis, please visit http://www.sociagility.com/ftse100.
PRINT™ Scores
Over 50 different measures make up the PRINT™ methodology, based on
different attributes of corporate social media performance across multiple
platforms. The scores that appear in the table on the following pages – and
elsewhere in this document – provide a variety of different indicators.
SPI: Social Performance Index
The SPI is an overall indicator of social media performance, from which all the
scores below are derived.
AQ: Awareness Quotient
AQ isolates the impact of a company’s status on the SPI by combining the
Popularity and Network Reach attribute scores.
EQ: Engagement Quotient
EQ isolates the impact of a company’s participation in and engagement with
social media on the SPI by combining the Receptiveness, Interaction and Trust
attribute scores.
Attribute Scores
The five attribute scores are calculated across all four channels, comparing
each company’s performance against the mean of the comparison group using
over 50 publicly available metrics.
Pop: Popularity
Popularity measures how well known or popular each company is, based on
metrics such as page ranking, followers/fans, references, engagement levels and traffic data.
Rec: Receptiveness
Receptiveness measures each company's willingness to actively listen and
participate on each platform, using metrics including linking, generosity,
responsiveness to questions, and reciprocation.

© 2012 Sociagility Ltd Page 17
Social Media in The City
Int: Interaction
Interaction measures the extent to which people engage regularly with the
company, using metrics such as shares, activity and engagement levels, and
conversation volume.
Net: Network Reach
Network Reach measures the actual and potential audience size of each
company’s social media activity, based on metrics that include linking, reach,
audience size and subscriber growth.
Tru: Trust
Trust measures the influence and authority of each company’s social media
output, using metrics such as influence, authority, favourability, likes and
ratings.
How these scores can be used
When used as part of a formal social media performance benchmarking
exercise for a brand or company versus focal competitors, these scores provide
key performance indicators that should be tracked over time. They can also be
used as the basis for comprehensive, evidence-‐based planning which identifies
the channels and behaviours that offer a company the greatest competitive
advantage, provide priority areas for action (and examples of best practice) and can even be linked to other measures of business success in order to better
quantify the financial impact of improvements in performance.

© 2012 Sociagility Ltd Page 18
Social Media in The City
PRINT™ Scores Attribute Scores Channel Scores
Rank Company SPI AQ EQ Pop Rec Int Net Tru Web Tw Fb YT 1 Royal Dutch Shell 996 1092 932 772 184 1529 1412 1082 49 385 3160 390 2 AstraZeneca 859 1086 708 846 335 758 1326 1031 118 3047 225 46 3 J Sainsbury 446 462 436 466 288 525 458 494 75 184 1113 413 4 M&S Group 415 508 352 357 252 208 658 598 119 70 1145 324 5 Next 362 358 366 430 287 653 285 157 496 256 495 203 6 Vedanta Resources 322 128 451 117 53 477 139 824 62 39 30 1157 7 ITV 313 245 359 225 191 825 265 61 853 401 0 0 8 ARM Holdings 311 407 247 321 482 135 493 125 178 145 106 816 9 Unilever 258 354 193 364 236 190 344 154 167 136 503 224 10 Morrison (Wm)
Supermarkets
206 229 191 189 246 195 270 131 91 58 560 116 11 BAE Systems 200 217 189 286 165 244 148 159 196 69 113 422 12 BT Group 188 212 171 354 354 76 70 84 73 368 24 286 13 InterContinental Hotels
Group
177 103 226 118 440 115 88 124 78 85 86 460 14 GlaxoSmithKline 166 185 153 162 156 145 209 160 270 117 114 165 15 G4S 152 150 154 229 145 150 71 167 108 55 376 71 16 Barclays 147 127 159 182 258 83 72 137 116 107 227 136 17 British Sky Broadcasting
Group
139 252 64 31 106 30 473 55 485 71 0 0 18 Reckitt Benckiser Group 137 116 151 117 305 65 116 84 170 113 105 162 19 Pearson 136 85 170 70 334 88 100 90 131 93 35 287 20 Vodafone Group 132 133 132 135 36 259 130 102 143 51 0 336 21 National Grid 131 172 104 200 116 79 145 116 65 95 293 71 22 Aviva 123 122 123 174 223 58 69 90 75 115 60 241 23 Rolls-‐Royce Holdings 123 253 36 105 15 33 400 60 100 0 0 391 24 United Utilities Group 122 58 164 94 76 327 23 90 63 101 9 315 25 Sage Group 120 150 100 58 173 56 242 72 192 149 114 25 26 WPP 118 169 84 277 122 54 60 75 106 279 68 18 27 Standard Chartered 116 100 127 93 157 118 107 106 113 138 131 83 28 Royal Bank Of Scotland
Group
112 59 148 66 253 105 52 86 92 95 67 196 29 Rio Tinto 109 104 112 152 39 204 56 93 98 114 0 223 30 Anglo American 107 89 119 133 152 81 44 124 82 90 184 71 31 BP 106 110 103 59 65 115 161 129 255 87 81 0 32 Johnson Matthey 95 144 62 262 61 46 26 78 54 73 196 56 33 Hargreaves Lansdown 88 46 116 74 231 39 18 77 44 58 0 250 34 Smith & Nephew 83 89 79 59 60 64 119 111 79 187 9 56 35 HSBC Hldgs 81 131 47 112 57 36 150 47 159 53 0 110 36 Tesco 76 83 72 66 71 69 100 76 50 61 0 194 37 Whitbread 75 45 95 71 116 97 19 72 47 59 80 113 38 SABMiller 72 57 82 93 82 80 21 85 59 112 21 97 39 British American Tobacco 72 66 75 72 43 130 60 54 146 42 0 98 40 Severn Trent 71 47 86 72 64 118 23 77 64 61 0 157 41 Standard Life 67 26 94 40 179 32 13 70 75 61 72 59 42 Centrica 63 36 82 53 111 53 18 83 54 89 0 110 43 Intertek Group 62 78 52 36 43 64 119 50 119 117 0 14 44 Experian 59 59 60 35 49 62 83 68 70 125 0 43 45 RSA Insurance Group 57 38 70 63 133 29 13 49 58 65 107 0 46 SSE 57 51 62 78 58 45 23 83 60 99 0 70 47 Aggreko 57 48 63 33 47 78 63 65 62 107 0 60 48 Diageo 57 47 64 54 84 43 40 64 91 63 0 73 49 Lloyds Banking Group 56 58 55 31 79 47 85 39 98 126 0 0 50 Legal & General Group 53 25 73 34 121 37 15 59 120 45 11 38

© 2012 Sociagility Ltd Page 19
Social Media in The City
PRINT™ Scores Attribute Scores Channel Scores Rank Company SPI AQ EQ Pop Rec Int Net Tru Web Tw Fb YT
51 Amec 53 42 60 49 79 39 35 63 97 69 0 46 52 Schroders 50 38 59 60 56 40 16 81 57 87 25 32 53 Reed Elsevier 49 39 56 39 69 35 39 62 108 88 0 0 54 BHP Billiton 48 51 46 29 35 65 73 40 91 101 0 0 55 BG Group 45 42 47 43 42 37 42 63 59 51 0 70 56 Aberdeen Asset
Management
45 44 46 76 66 17 12 54 74 0 37 69 57 Imperial Tobacco Group 41 48 37 29 27 43 67 40 50 115 1 0 58 Tullow Oil 41 37 44 46 53 25 28 55 48 60 1 56 59 British Land Co 39 28 47 47 29 48 9 63 46 55 7 48 60 John Wood Group 38 20 49 32 74 20 7 54 85 37 0 27 61 Land Securities Group 36 28 42 45 38 33 11 55 47 88 0 10 62 Capita 36 25 44 35 72 17 14 43 77 37 1 30 63 Kingfisher 36 17 48 29 37 42 5 66 43 58 0 42 64 Hammerson 35 20 45 29 36 45 10 54 43 43 2 50 65 Burberry Group 33 14 46 24 114 2 4 23 134 0 0 0 66 Resolution 33 10 49 19 126 0 0 21 133 0 0 0 67 Admiral Group 33 16 45 28 41 35 4 58 44 45 0 43 68 Eurasian Natural Resources
Corporation
32 12 45 22 110 2 2 23 127 0 0 0 69 Old Mutual 31 16 40 26 69 4 6 49 50 0 1 72 70 Carnival 30 13 42 23 102 0 3 23 121 0 0 0 71 Serco Group 29 20 35 30 40 31 10 33 75 40 0 0 72 Compass Group 28 21 33 37 30 18 5 52 40 64 0 9 73 Tate & Lyle 27 16 35 26 57 15 6 32 70 39 0 0 74 Rexam 26 18 31 27 4 47 9 43 45 0 0 59 75 Glencore International 25 16 31 30 54 15 3 25 97 0 4 0 76 Randgold Resources 25 19 29 36 8 33 3 47 46 0 0 56 77 Xstrata 25 20 28 29 37 19 12 28 67 34 0 0 78 Smiths Group 25 15 32 24 70 0 7 25 100 0 0 0 79 Petrofac 25 13 33 23 25 47 2 27 63 35 0 0 80 GKN 24 18 28 25 27 6 11 49 61 0 0 33 81 Wolseley 24 15 29 26 43 14 4 30 57 35 0 2 82 IMI 22 14 27 25 56 0 3 25 87 0 0 0 83 Melrose 22 10 29 20 66 0 0 21 86 0 0 0 84 Pennon Group 21 12 27 23 39 13 1 28 50 34 0 0 85 Bunzl 20 13 24 24 49 1 3 22 79 0 0 0 86 ICAG 19 12 24 24 33 14 1 25 45 32 0 0 87 Antofagasta 18 11 22 21 42 0 1 24 71 0 0 0 88 Fresnillo 17 11 21 22 26 14 1 24 37 32 0 0 89 Shire 15 18 13 26 8 3 10 26 59 0 0 0 90 Prudential 14 16 13 25 10 3 6 25 54 0 0 1 91 Croda International 13 15 12 25 11 0 5 25 53 0 0 0 92 Meggitt 13 13 12 24 11 1 3 24 50 0 0 0 93 CRH 12 14 11 26 5 4 3 24 49 0 0 0 94 Weir Group 12 12 12 23 12 1 2 23 48 0 0 0 95 Associated British Foods 12 14 11 25 5 3 2 24 47 0 0 0 96 Polymetal International 11 9 11 18 14 0 0 20 42 0 0 0 97 Evraz 10 13 9 21 4 1 4 21 41 0 0 0 98 Kazakhmys 10 12 9 23 1 0 1 25 40 0 0 0 99 Capital Shopping Centres
Group
10 12 9 23 1 0 1 25 40 0 0 0 100 Babcock International
Group
8 10 7 20 0 1 0 21 34 0 0 0

© 2012 Sociagility Ltd Page 20
Social Media in The City
Sector benchmarks
As the FTSE is based on capital value, its sector spread is uneven, reflecting the
relative success of different parts of the national and global economy at
different periods, as well as the success of the companies concerned. Many
FTSE companies are therefore in a group of one… or two. For the purposes of
this analysis, we have omitted sectors with less than three FTSE 100
constituents. By so doing we can see:
• how average sector performances compare; and • any major variations within sector
In the table below, seven sectors score above average (100) and they are not
necessarily the most obvious, consumer-‐facing candidates. Both Shell’s and
AstraZeneca’s strong performances are replicated across their respective
sector groups, with companies in the Pharmaceuticals & Biotechnology and Oil
& Gas producers sectors commanding the highest average SPI scores.
Sector performance
Rank FTSE Sector Companies SPI (avg)
1 Pharmaceuticals & Biotechnology 3 347
2 Oil & Gas Producers 4 297
3 General Retailers 3 271
4 Food & Drug Retailers 3 243
5 Media 5 151
6 Aerospace & Defence 3 112
7 Banks 5 102
8 Food Producers 3 99
10 Gas, Water & Multiutilities 5 82
11 Travel & Leisure 5 66
12 Mining 12 62
13 Financial Services 3 61
14 Life Insurance 6 53
15 Support Services 9 50
16 Oil Equipment & Services 3 38
17 Real Estate Investment Trusts 4 30
18 Industrial Engineering 3 18
As well as looking at the overall SPI score, we have isolated two general factors
that contribute towards this performance – the Awareness Quotient (a
measure of status) and the Engagement Quotient (a measure of participation
© 2012 Sociagility Ltd Page 21
Social Media in The City
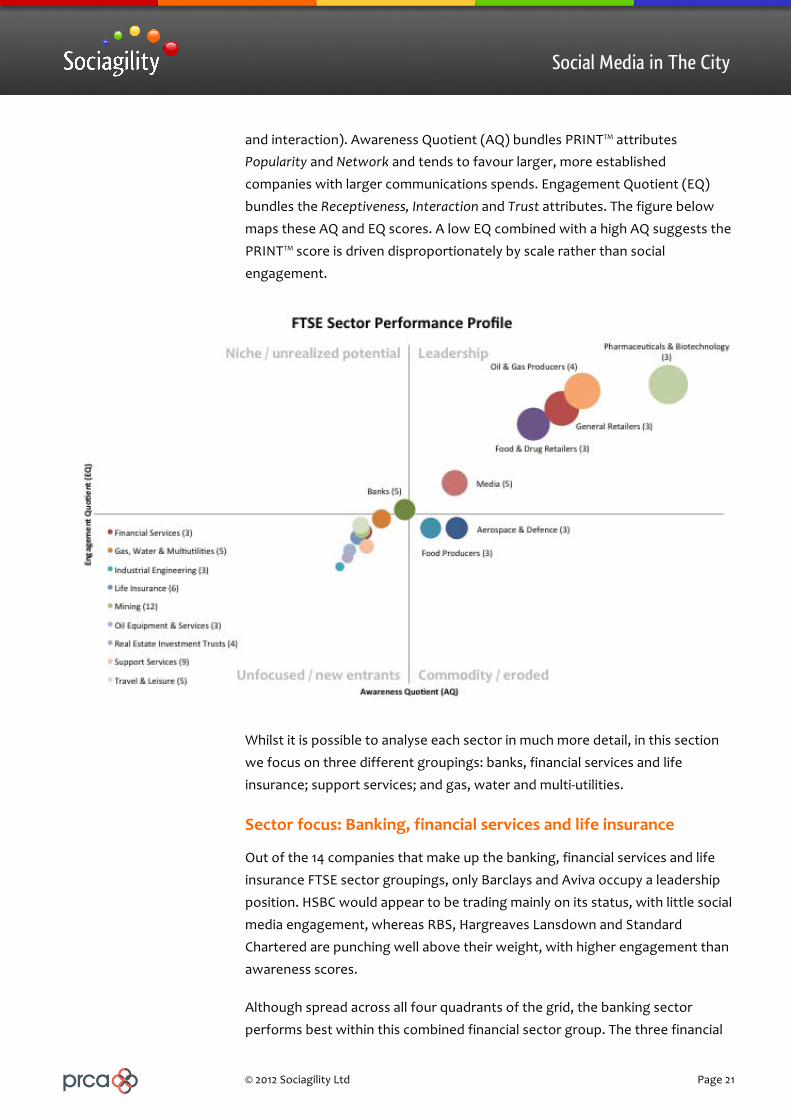
and interaction). Awareness Quotient (AQ) bundles PRINT™ attributes Popularity and Network and tends to favour larger, more established
companies with larger communications spends. Engagement Quotient (EQ)
bundles the Receptiveness, Interaction and Trust attributes. The figure below
maps these AQ and EQ scores. A low EQ combined with a high AQ suggests the
PRINT™ score is driven disproportionately by scale rather than social
engagement.
Whilst it is possible to analyse each sector in much more detail, in this section
we focus on three different groupings: banks, financial services and life
insurance; support services; and gas, water and multi-‐utilities.
Sector focus: Banking, financial services and life insurance
Out of the 14 companies that make up the banking, financial services and life
insurance FTSE sector groupings, only Barclays and Aviva occupy a leadership
position. HSBC would appear to be trading mainly on its status, with little social
media engagement, whereas RBS, Hargreaves Lansdown and Standard
Chartered are punching well above their weight, with higher engagement than
awareness scores.
Although spread across all four quadrants of the grid, the banking sector
performs best within this combined financial sector group. The three financial

© 2012 Sociagility Ltd Page 22
Social Media in The City
services companies trail slightly behind and, with the exception of Aviva, life insurance companies lag the rest of the financial sector. This is the biggest
surprise within this group, given that almost all are well-‐known, consumer-‐
facing household names.
Sector focus: Support services
Rank Company Pop Rec Int Net Tru
1 G4s 229 145 150 71 167
2 Intertek Group 36 43 64 119 50
3 Experian 35 49 62 83 68
4 Aggreko 33 47 78 63 65
5 Capita 35 72 17 14 43
6 Serco Group 30 40 31 10 33
7 Wolseley 26 43 14 4 30
8 Bunzl 24 49 1 3 22
9 Babock International Group 20 0 1 0 21
With nine companies represented in the FTSE 100, yet an average of only 50 on
the SPI scale, the support services sector is one of the worst performers in our
analysis. Indeed, without a strong showing from security solutions group G4S,
the SPI for this sector would drop to below 40.
© 2012 Sociagility Ltd Page 23
Social Media in The City
It is unclear as to why this might be. It is true that only two of the nine use all the platforms that PRINT™ analyses – none of the other seven are using
Facebook, an odd decision perhaps considering that they all need to recruit and
most will have active community relations programmes – but almost all are
using social media of some kind.
It would seem then that what they are doing – or not – is the issue. For instance,
only G4S and Intertek Group record any above average attribute scores,
despite all (with the exception of Babcock International Group) demonstrating
reasonable if not outstanding levels of receptiveness.
Sector focus: Gas, water and multiutilities
One of the sectors that delivers average scores across the board is gas, water &
utilities, made up of just five FTSE 100 companies, with a combined market capitalisation of over £5o billion. National Grid leads this small sector group,
although United Utilities Group records the highest Interaction score and
comes a very close second.
Rank Company Pop Rec Int Net Tru SPI
1 National Grid 200 116 79 145 116 131
2 United Utilities Group 94 76 327 23 90 122
3 Severn Trent 72 64 118 23 77 71
4 Centrica 53 111 53 18 83 64
5 Pennon Group 23 39 13 1 28 21
For any of the companies performing below the FTSE100 average, like Severn
Trent or Centrica, a bespoke analysis would be necessary to explain exactly
where the most improvement could be made. But it is also possible to identify
examples of best practice in those areas where the sector itself is weakest. The
table below shows both the gap (red equals larger) between sector
performance and the entire FTSE 100 average and the companies that record the highest scores for that attribute/platform combination within the sector.
Popularity Receptiveness Interaction Network Reach Trust
Website National Grid Severn Trent National Grid National Grid National Grid
Twitter Centrica United Utilities National Grid United Utilities National Grid
Facebook National Grid National Grid National Grid National Grid National Grid
YouTube United Utilities Centrica United Utilities National Grid Severn Trent

© 2012 Sociagility Ltd Page 24
Social Media in The City
Engagement platforms
As well as identifying how companies are performing comparatively in terms of
social media behaviours, the PRINT™ methodology allows us to isolate the
contribution each social platform makes towards those scores. The result is a
set of rankings for each platform, which often shows a diverse group of leading
companies and sectors.
Website
Rank Company FTSE Sector Score
1 ITV Media 853
2 Next General Retailers 496
3 British Sky Broadcasting Group Media 485
4 GlaxoSmithKline Pharma & Biotech 270
5 BP Oil & Gas Producers 256
6 BAE Systems Aerospace & Defence 196
7 Sage Group Software 192
8 ARM Holdings Technology Hardware 178
9 Reckitt Benckiser Group Household Goods 170
10 Unilever Food Producers 167
The websites of media companies ITV and BskyB attract widespread public
interest, so it is little surprise that both feature highly in this ranking. Next also
has great consumer appeal. The success of most of the other top 10 can
perhaps be linked to the resources these large companies can deploy but
special praise must go to the much smaller Sage and ARM Holdings.
Rank Company FTSE Sector Score
1 AstraZeneca Pharma & Biotech 3047
2 ITV Media 401
3 Royal Dutch Shell Oil & Gas Producers 385
4 BT Group Fixed Line Telecomms 368
5 WPP Media 279
6 Next General Retailers 256
7 Smith & Nephew Health Care Equipment 188
8 J Sainsbury Food & Drug Retailers 184
9 Sage Group Software 149
10 ARM Holdings Technology Hardware 145

© 2012 Sociagility Ltd Page 25
Social Media in The City
Twitter is the most widely used amongst the FTSE 100 and AstraZeneca’s top score is outstanding, more than seven times the second placed ITV. Overall, the
Twitter top 10 is as diverse as the overall SPI index but with some new faces on
the list, including marketing services holding company WPP and Barclays bank.
Shell once again leads the pack but retailers dominate the Facebook rankings,
led by Marks & Spencer and J Sainsbury.
Rank Company FTSE Sector Score
1 Royal Dutch Shell Oil & Gas Producers 3160
2 Marks & Spencer Group General Retailers 1145
3 J Sainsbury Food & Drug Retailers 1113
4 Morrison (Wm) Supermarkets Food & Drug Retailers 560
5 Unilever Food Producers 503
6 Next General Retailers 495
7 G4S Support Services 376
8 National Grid Gas, Water & Utilities 293
9 Barclays Banks 227
10 AstraZeneca Pharma & Biotech 225
YouTube
Vedanta’s very high YouTube score contributes largely to its overall SPI. It
seems to use YouTube primarily as a CSR channel and its films recording
community outreach attract large audiences and engagement. Another top
performer is ARM Holdings, which uses films about applications of its chips to
good effect. However, despite these high performances a full one-‐third of the
FTSE 100 make no corporate use of YouTube at all.
Rank Company FTSE Sector Score
1 Vedanta Resources Mining 1157
2 ARM Holdings Technology Hardware 816
3 InterContinental Hotels Group Travel & Leisure 460
4 BAE Systems Aerospace & Defence 422
5 J Sainsbury Food & Drug Retailers 413
6 Rolls-‐Royce Holdings Aerospace & Defence 391
7 Royal Dutch Shell Oil & Gas Producers 390
8 Vodafone Group Mobile Telecomms 336
9 Marks & Spencer Group General Retailers 324
10 United Utilities Group Gas, Water & Utilities 315

© 2012 Sociagility Ltd Page 26
Social Media in The City
LinkedIn – an ideal corporate social media platform?
In many ways LinkedIn could be considered an ideal corporate platform –
business-‐orientated, structured, largely controllable and already much used by
business people to network and for recruitment. It is strange that it should be
so inactively used by the FTSE 100.
The lack of public metrics makes it impossible to analyse LinkedIn simply using
the PRINT™ methodology itself but we have used a similar quantitative
approach to analyse desirable corporate behaviours. It is based on a new
proprietary Sociagility performance algorithm that we believe to be unique.
Readings from each FTSE 100 company’s official LinkedIn page were taken in
three areas:
• Popularity – a combination of followers and follower-‐to-‐employee ratios • Activity – an assessment of the company’s usage of its page to promote
products/services and provide updates • Engagement – a measure of audience engagement with the company’s
LinkedIn page
Using PRINT™ principles, a variety of metrics contribute to each score,
including the quantity and frequency of updates made by the company and the
liking, commenting and recommending behaviours of the wider LinkedIn community. Every company is then benchmarked against the average across
the group (which equates to a score of 100).
Rank Company Pop Act Eng Score
1 Royal Dutch Shell 481 289 2157 976
2 AMEC 111 517 1504 711
3 Unilever 676 70 1308 685
4 InterContinental Hotels Group 131 603 748 494
5 Rolls-‐Royce Holdings 127 729 554 470
6 Experian 61 891 106 352
7 Serco Group 70 766 130 322
8 Aggreko 66 300 593 319
9 Burberry Group 216 372 368 319
10 BP 411 140 343 298
Once again, Shell tops the table (driven by a very strong engagement score)
but beyond that the leaders are very different from the overall SPI ranking and
from those for other platforms.

© 2012 Sociagility Ltd Page 27
Social Media in The City
The obvious question is why more companies do not make more active use of LinkedIn. The underlying usage statistics from our study make interesting
reading:
• 95 of the FTSE 100 have LinkedIn company pages, and these attracted a combined 2.6 million followers
• According to LinkedIn, these same companies have 978,000 employee LinkedIn accounts
• Less than a quarter of the companies have listed any of their products or services on their company page
• Of those that have listed a product or service, almost all received at least one product/service recommendation
• Only 13% posted a status update in the 7 days prior to our analysis (20% in the prior 30 days)
• Of those that posted status updates in the 30 days prior to our analysis, almost all received at least one ‘like’ or comment
It is clear from the ranking and this data that companies are seeing active
engagement with their LinkedIn pages, but only when they themselves invest
the time and effort in actively managing the page by listing products and services and posting regular status updates – something that a full three-‐
quarters of FTSE 100 companies are apparently failing to do.

© 2012 Sociagility Ltd Page 28
Social Media in The City
Social media performance and financial performance
It is the ultimate question asked of social media: can it really have any impact
on share price?
There is certainly anecdotal evidence to suggest that crises originating on
Facebook or Twitter can have a short-‐term effect on market value, if left
unaddressed, but very little to link strong social media performance with
strong financial performance.
In one sense, it is a Quixotic quest. So many factors contribute towards
something as volatile as share price and attempts to isolate the effect of a
single, albeit increasingly important, communication channel are unlikely to
yield any directly actionable insights, certainly not without a very large number
of data-‐points.
That said, in the course of this limited study we have tested for correlations
between our PRINT™ measures of social media performance and recognized measures of financial success. In previous studies we have found links between
the SPI score and brand value and growth, market share, and even
independent rankings of reputation.
Size matters
By testing the presence and strength of correlation between these social media
performance rankings and market fundamentals, it is possible – statistically at
least – to suggest a link between the two.
With this in mind, we have taken the social media performance scores for all
the FTSE 100 companies and compared them to different aspects of market
performance, such as share price changes, capitalisation and dividends.
What we found was both surprising and reassuring. Firstly, almost all the statistically significant correlations occurred when comparing social media
performance to market capitalisation. In particular, we saw the strongest
correlations (r = 0.271, N = 100, p < 0.01 – indicating at least a 99% probability
that the correlation is not happening by chance) between our Awareness
Quotient (AQ) measure combining Popularity and Network Reach for the period
1–7 November and market capitalisation values at the end of that period. This
suggests that the most valuable companies are also the most effective when it
comes to using social media. The reverse would also be true.

© 2012 Sociagility Ltd Page 29
Social Media in The City
The overall Social Performance Index or SPI, which includes measures of how well companies are participating in and interacting with social media, also
correlates strongly with market capitalisation at the same level (r = 0.242, N =
100, p < 0.02). Of course, correlation is not the same as causation, so it may
simply be that companies are using social media effectively because they are
more valuable and are therefore better able to invest in the right resources.
Social media performance as a lead indicator?
To find any statistically significant correlation between data like these is
interesting, but comparing similar time periods is not always revealing. For that
reason we looked at the financial performance data again, three weeks after
the social media performance data.
Reassuringly, the relationship with market capitalisation remained but we also found a number of statistically significant correlations between PRINT™
scores at the beginning of November and share price movement at the end of
the month.
• SPI, Awareness Quotient (AQ) and Engagement Quotient (EQ) scores, and Popularity, Receptiveness, Interaction and Network Reach scores for 1–7 November all correlated with the daily percentage change in share price on 28 November (r > 0.216, N = 100, p < .05). Higher social media performance scores were associated with positive changes in share price.
• Most notably, the correlations between the Receptiveness score and the daily, weekly and monthly change in share price to 28 November were all statistically significant (r > 0.207, N = 100, p < 0.05, indicating at least a 95% probability that the correlation is not happening by chance).
Of course, many more data points would be required to determine whether or
not this represents a real or consistent lead indicator. However, the presence
of any such statistically significant correlations between social media
performance and share price movements should certainly embolden corporate
communications directors to go to their CEOs and CFOs and say: “Look, this
matters, and I need more resources to do it properly.”

© 2012 Sociagility Ltd Page 30
Social Media in The City
Return on social – the need for social KPIs
As many brands forge ahead with their social communications strategies, chief
executives, chief marketing officers across all sectors are still grappling with
the issue of how to measure the return on the money spent and human
resources employed. An Econsultancy report this year, for example, found that
41 per cent of respondents say they don’t know the return on any of the money
they invest in social media.
Proving that social media performance in isolation delivers a direct financial
ROI is often a fruitless exercise. It is usually next to impossible to determine
real money returns, just as for many other equally essential parts of the
marketing or operational budget.
But it is perfectly possible to find formal, meaningful metrics that bridge the
gap between fans, followers, re-‐tweets, etc. and real business outcomes. These
‘social KPIs’ are essential if companies are to set objectives, manage programmes and, crucially, justify their expenditure and investment in social
media tools, staff and agencies at board level.

© 2012 Sociagility Ltd Page 31
Social Media in The City
Conclusions and recommendations
It is clear from this study that the FTSE100 constituents, comprising the largest
listed companies in the UK, take widely different approaches to social media
for corporate communications purposes. There are some excellent examples of
consistent, planned social media performance. However, two-‐thirds are below
the average for their peers and a typical FTSE 100 company will be engaging
half-‐heartedly at best.
Why do companies underperform?
We have deliberately not investigated companies’ individual strategies, or lack thereof. However, our research suggests three broad reasons for comparative
underperformance, each a combination of style and substance.
1. The company is not much concerned about direct external public
communications generally
A significant number of companies make direct contact with them deliberately
difficult.... Names of responsible staff are not published and any contact
frequently has to be via a pro forma email contact form. In this group are those
who use their external advisers as buffers between themselves and
unstructured public contact. Small wonder that social media engagement is
weak.
2. The company feels social media do not matter
Whether by design or default, this group of companies appears to consider
social media irrelevant. The low priority given to social media is shown by
avoidance of any engagement at all or, typically, by having ‘forgotten’ they
exist so that there is little or no activity on listed channels.
3. The company has a weak social media strategy
Someone, somewhere, has decided social media IS important but there is lack
of organisational buy-‐in and, as a result, insufficient or inappropriate resource
and a lack of applied KPIs. Typically, companies in this group show a siloed
approach , with unbalanced, uncoordinated efforts across different channels,
perhaps reflecting fragmented internal ‘ownership’ of these channels.
We have set out earlier in this report why we believe this matters (see Page 6).
In essence we think that social media should not be ignored a by any brand,
consumer or corporate; that all stakeholders can and should be engaged with,
not just customers, and therefore that all parts of the organisation can get

© 2012 Sociagility Ltd Page 32
Social Media in The City
involved; and that management ignorance is no longer an excuse. Social media inaction at corporate level is therefore not a neutral but actually an
uncompetitive policy.
Performance Improvement
Each company’s social media strategy can only be usefully developed in the
context of the business and communications strategies for that company.
However, our research for this report suggests there are some general lessons
to be learned and some practical steps that any corporate brand can take to
improve their social media performance:
• Ensure an informed debate – in this area, as in any other, strategy should be decided by those who are knowledgeable; external help may be helpful, short-‐term
• Integration is essential – a siloed social media plan is unsustainable and prevents synergy with other forms of communication
• Set clear objectives – only by setting clear objectives and measuring the contribution social media makes can the return on social be discerned.
• Link performance to objectives – once objectives are set, key performance indicators can be identified.
• Focus on more than just popularity – large numbers of fans and followers may keep social media converts happy, but they are not business metrics.
• Understand audience preferences – it’s not always necessary to be effective, or even present, on all the different social networks. Go where your audience is.
• Benchmark performance regularly – do it consistently against focal competitors, using a set of simple but comprehensive key performance indicators like the PRINT Index™.
• Resource in-‐house appropriately and sustainably – social media stakeholder engagement cannot simply be ‘outsourced’. The role for agencies is to support a strong in-‐house function, not replace it.
The influence of social media will only increase and, accordingly, its impact on corporate policy and communications. We hope this report will contribute encourage more large companies to engage proactively and positively.
Tony Burgess-‐Webb Niall Cook

© 2012 Sociagility Ltd Page 33
Social Media in The City
Appendix I: About the authors
Anthony Burgess-‐Webb
A co-‐founder of Sociagility, Tony was previously chief marketing officer at
international communications consultancy Hill & Knowlton, overseeing its
formal and informal web presence and the introduction of internal and
external social media policies and practices. He also founded the firm’s global
digital practice and European technology practice. He has co-‐founded five
other companies including, most recently, brand research Commetric and
equity trading company CommEq.
Married, with one daughter, he is also a pro bono advisor to Iwokrama, a
rainforest preserve in Guyana.
Niall Cook
Before co-‐founding Sociagility, Niall was worldwide head of marketing
technology at Hill & Knowlton where he pioneered the firm’s use of social
media on behalf of clients and for its brand, including its blogging
platform, Collective Conversation. He previously led the European digital
practice. Before that, he held positions at Beenz, the internet payment
platform, Answerthink Consulting Group and global investment bank UBS. He is
the author of Enterprise 2.0, one of the first books to explore the use of social
media inside the enterprise, and is currently writing The Social CEO, to be published in 2013.
Married, with one daughter, he is also a trustee of East Anglia’s Children’s
Hospices.

© 2012 Sociagility Ltd Page 34
Social Media in The City
Appendix II: Sociagility – social media performance consultants
Sociagility is a consultancy focused on creating organizational competitive
advantage by helping clients improve their social media performance.
The company provides solutions in three areas:
Analysis
Our analytic approach combines traditional audits with our proprietary PRINT™
methodology, a multi-‐channel measurement system that correlates directly
with brand value and provides a KPI for marketers. It offers brands and
organisations insight into the key drivers of their – and their competitors’ –
social media performance and provides a series of indicators to help determine
priorities for action. It is available to agencies under licence.
Consultancy
By understanding commercial, marketing and communications goals and
challenges, Sociagility helps clients put social at the heart of their business
operations -‐ defining objectives and action plans, aligning across departments
and channels, and putting relevant metrics in place.
Resourcing
Sociagility helps its clients create sustainable capability for the future by
building in-‐house social expertise. This includes discovering internal talent,
secondment and recruitment, as well as ongoing training, mentoring and the
transfer of knowledge and skills.
To find out more, please visit www.sociagility.com.

© 2012 Sociagility Ltd Page 35
Social Media in The City
Appendix III: About the PRCA
Founded in 1969, the PRCA is the professional body that represents UK PR
consultancies, in-‐house communications teams, PR freelancers and individuals.
The PRCA promotes all aspects of public relations and internal communications
work, helping teams and individuals maximise the value they deliver to clients
and organisations.
The Association exists to raise standards in PR and communications, providing
members with industry data, facilitating the sharing of communications best
practice and creating networking opportunities.
All PRCA members are bound by a professional charter and codes of conduct,
and benefit from exceptional training. The Association also works for the
greater benefit of the industry, sharing best practice and lobbying on the
industry's behalf e.g. fighting the NLA's digital licence.
The PRCA represents many of the major consultancies in the UK, and currently has more than 300 agency members from around the world, including the
majority of the top 150 UK consultancies. It also represents over 100 in-‐house
communications teams from multinationals, UK charities and leading UK public
sector organisations.

© 2012 Sociagility Ltd Page 36
Social Media in The City
Appendix IV: The PRINT™ Methodology
Senior executives and social media strategists alike can struggle to find
meaningful metrics to assess the impact of their social media activities. PRINT™,
Sociagility’s multi-‐channel social media performance measurement system,
offers a solution.
The PRINT methodology measures five key attributes of social media
performance: popularity, receptiveness, interaction, network reach and trust.
Each is measured across multiple social platforms and channels, including
Twitter, Facebook and YouTube, using relevant metrics for each. The result
provides direct competitor analysis and delivers specific, actionable insights
into areas for improvement.
Benefits
The benefits of PRINT include:
• more strongly correlated with brand value and growth than other ‘influence’ measures;
• more performance-‐focused, directly highlighting competitive (dis)advantages against customer-‐defined set of benchmark brands;
• more comprehensive because it measures multiple channels simultaneously;
• provides insights which are specific and actionable;
• more flexible – provides a one-‐off benchmark ‘snapshot’ or a tracking mechanism;
• more meaningful – PRINT provides a framework for action; • more adaptable – to suit more complex requirements, PRINT can be
adjusted to reflect different audiences and organisations; • easier to integrate into wider social media monitoring, analysis and
planning; • lower cost – PRINT combines traditional research methodology with
proprietary software across multiple platforms.
The Social Performance Index™
At the heart of the solution is the Social Performance Index™ (SPI) – a single
number that shows overall performance compared to a defined set of
competitors or brand, sector and geographical benchmarks. This can be used
as a Key Performance Indicator by senior client management and social media
strategists and by agencies. It has been proven to correlate strongly with brand
value and growth and therefore provides a KPI for social media performance

© 2012 Sociagility Ltd Page 37
Social Media in The City
that can be used to set and track targets. PRINT also analyses the key drivers of social media performance and provides indicators for all five attributes and all
channels to help inform priorities for action.
PRINT Reports
PRINT reports can be one-‐off snapshots or continuous tracking studies. Each
assessment is bespoke and provides comparative scores for a specific set of
competitors. As well as a summary scorecard, detailed comparative scores and
re-‐usable graphics are included for attribute and channel combinations.
Commentary is given on high and low performers by attribute and channel and
specific recommendations are offered for improvement.
PRINT social media performance analyses are delivered electronically in
PowerPoint and PDF format. Each report comprises up to 30 insight charts with re-‐usable graphics including: summary scorecard; brand strengths and
weaknesses assessment; overall performance scores across comparison set by
attribute and channel; comparative attribute scores by channel scores; and
attribute versus attribute comparison charts.
To see how the PRINT™ can be used to benchmark, measure and improve your
competitive social media performance, please contact us at
How agencies can use PRINT™
Access to the underlying PRINT™ methodology is available to any agency
requiring an easy, low-‐cost way to help plan and justify social media campaigns
for clients – and an objective measure of their success. By licensing PRINT™,
agencies get the independent evidence they need to guide and validate social media strategies.
We offer a range of simple, cost-‐effective licensing options with different
features and price points, online access to project data, as well as limited trial
access.
In return for subscribing to the PRINT™ methodology, agencies get access to
lower cost benchmarking scorecards and reports, as well as a range of features
not available when purchasing on a one-‐off basis, including (depending on the
subscription level chosen):
• Online access to manage projects and reports
• Quicker turnaround times

© 2012 Sociagility Ltd Page 38
Social Media in The City
• Lower cost analysis and interpretation • Free trial when paying annually by invoice
• Access to underlying data, in order to conduct more specific analysis • 7-‐day average data sampling to even out any ‘spikes’ in performance
• Aggregation of multiple social network profiles, to provide a fuller picture of brand performance


![Nysca dec social media[1]](https://static.fdocuments.us/doc/165x107/55592ae3d8b42a4f3d8b469a/nysca-dec-social-media1.jpg)