Social Media Habits of Brands Sponsoring the Daytona 500
20
Social Media Benchmarking and Competitive Intelligence on Daytona 500 FEBRUARY 1-27 2014
-
Upload
unmetric -
Category
Social Media
-
view
719 -
download
3
Transcript of Social Media Habits of Brands Sponsoring the Daytona 500
Social Media Benchmarking and Competitive Intelligence on
Daytona 500
FEBRUARY 1-27 2014

About Unmetric We provide not-so-obvious competitive intelligence on over 17,000 brands across 30 sectors … so you know who is outsocializing who. And how.
We understand that while companies have always needed competitive intelligence, it’s never been easy to come by. The modern digital media landscape gives marketers the potential to study their campaign spends, activity and decide on future spends much more rationally than ever before. Unmetric works with leading brands and agencies to help them establish benchmarks for their social media activities. The Unmetric SaaS platform creates more efficient social media teams and drives down costs by providing deep qualitative and quantitative data in an intuitive, easy-to-use online platform.
We Analyze Data From:

Analysis of Brands on FACEBOOK

Brand Name Total Fans Fan Growth Conversation (% of fans) Engagement Fan Posts Admin Posts Responses
(mins)
M&M's U.S.A 10,246,854 0.36% 0.67% 331 364 35 1,032
Budweiser (United States) 5,004,340 0.7% 11.13% 780 663 47 1,323
Lowe's Home Improvement 2,792,449 0.59% 1.14% 579 362 28 106
Farmers Insurance 2,247,964 -0.1% 0.09% 75 128 43 568
FedEx 856,633 3.15% 2.76% 606 1839 25 570
GEICO 350,352 2.23% 0.96% 111 425 26 1,021
The Dow Chemical Company 72,062 0.65% 1.09% 139 68 56 0
3M 26,856 3.07% 1.68% 407 0 13 -
Nationwide 51,001 2.93% 1.81% 531 127 29 256
Notable Metrics on Facebook FEBRUARY 1-27 2014
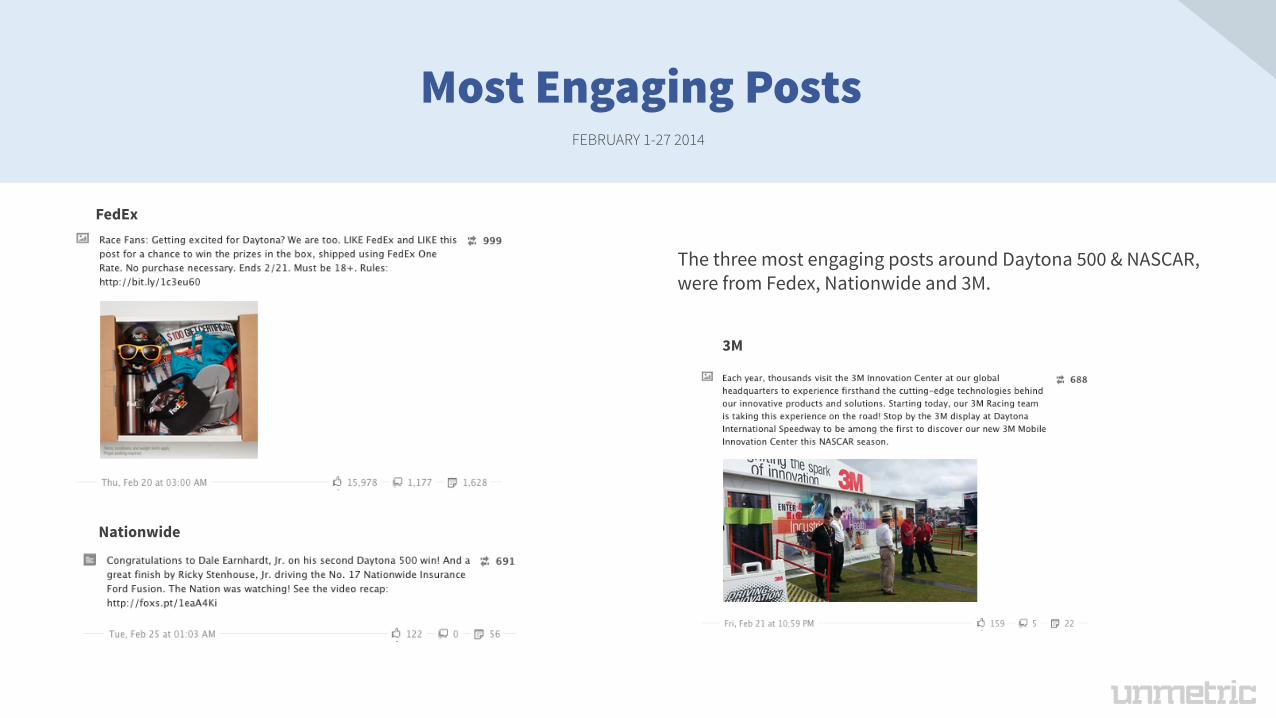
Most Engaging Posts
The three most engaging posts around Daytona 500 & NASCAR, were from Fedex, Nationwide and 3M.
FedEx
Nationwide
3M
FEBRUARY 1-27 2014
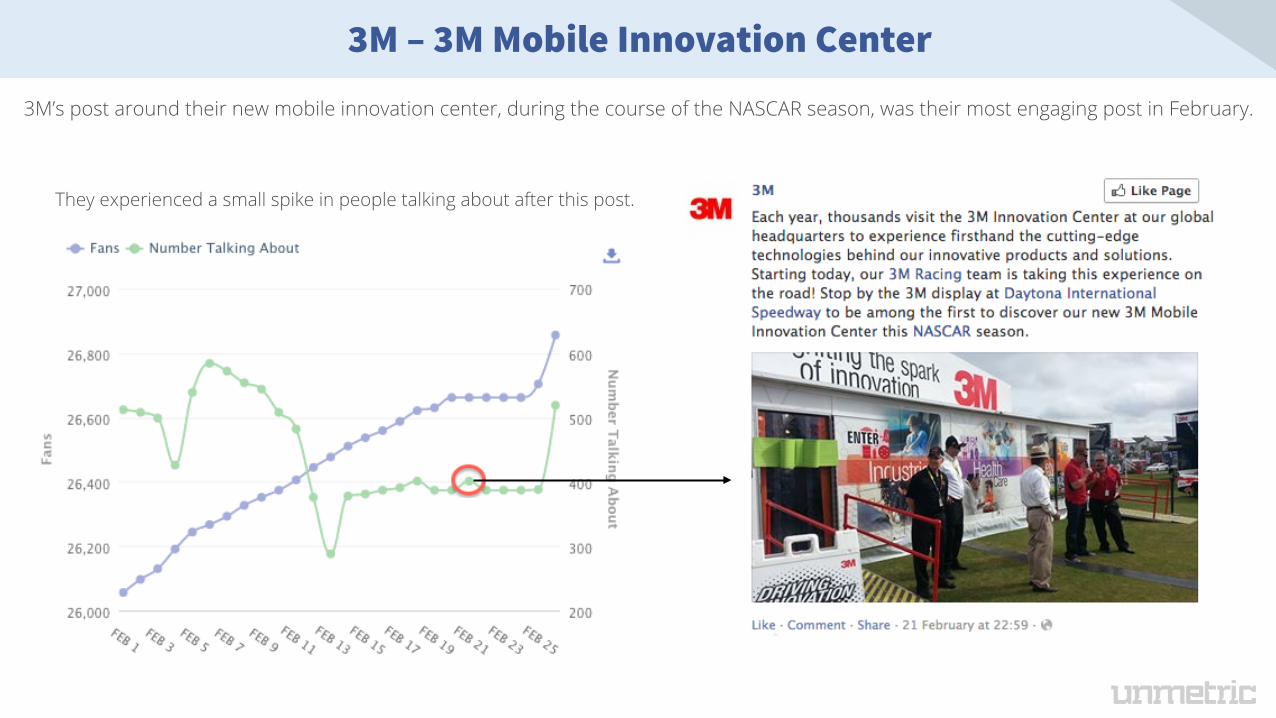
3M’s post around their new mobile innovation center, during the course of the NASCAR season, was their most engaging post in February.
3M – 3M Mobile Innovation Center
They experienced a small spike in people talking about after this post.

FedEx ran a ‘License to Win’ contest in the month of February, which was one of their most engaging posts of the month, with an engagement score of 999.
FedEx – License To Win Sweepstakes
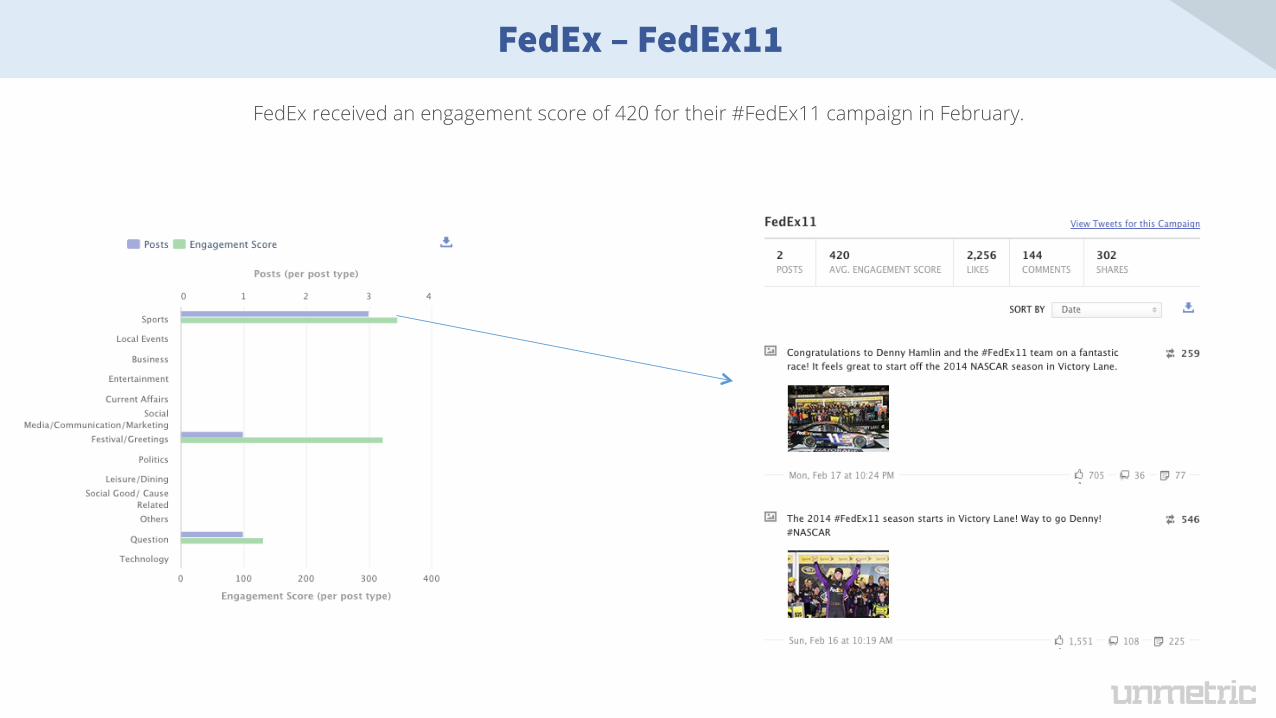
FedEx received an engagement score of 420 for their #FedEx11 campaign in February.
FedEx – FedEx11

M&M’s USA saw good engagement with their “General Content” but great engagement with their sports related posts.
M&Ms USA – Content Strategy

Budweiser Racing averaged a Monthly Active User (MAU) count of 41, lower than the Beverages – Alcohol sector average of 44 and a Daily Active User (DAU) count of 1, which is also the industry average.
Budweiser Racing – App Analytics
Analysis of Brands on
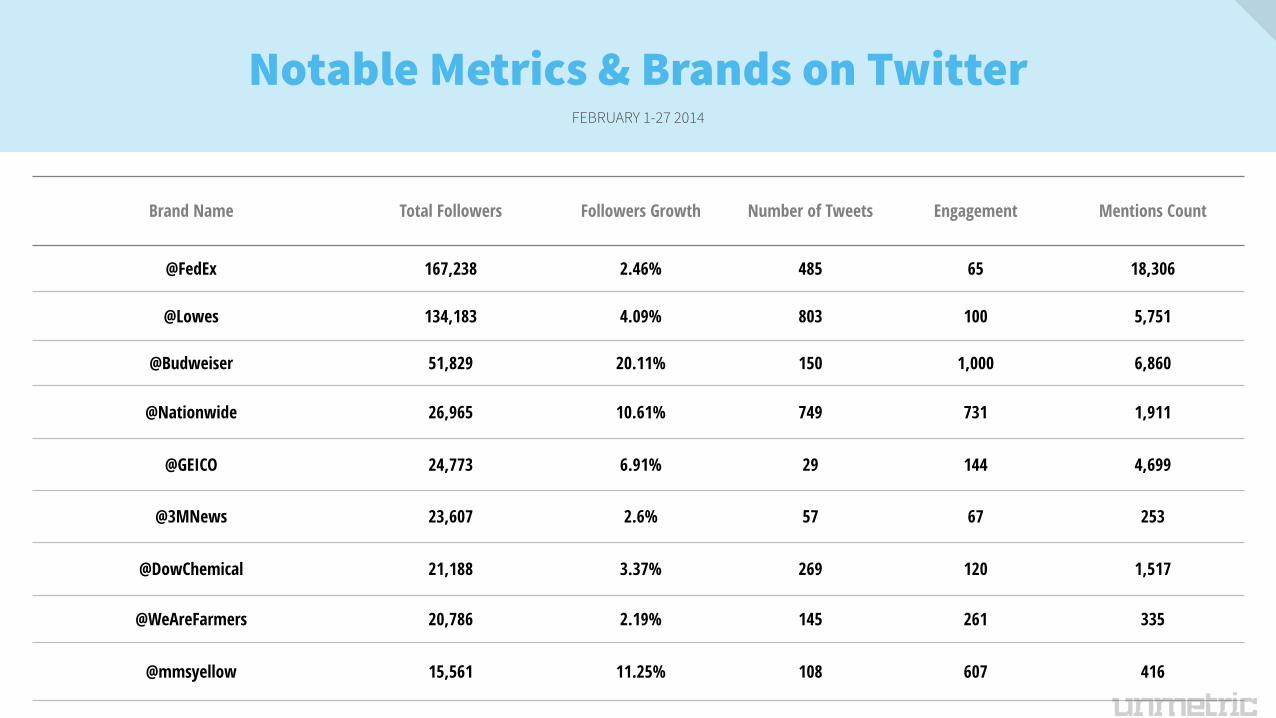
Brand Name Total Followers Followers Growth Number of Tweets Engagement Mentions Count
@FedEx 167,238 2.46% 485 65 18,306
@Lowes 134,183 4.09% 803 100 5,751
@Budweiser 51,829 20.11% 150 1,000 6,860
@Nationwide 26,965 10.61% 749 731 1,911
@GEICO 24,773 6.91% 29 144 4,699
@3MNews 23,607 2.6% 57 67 253
@DowChemical 21,188 3.37% 269 120 1,517
@WeAreFarmers 20,786 2.19% 145 261 335
@mmsyellow 15,561 11.25% 108 607 416
Notable Metrics & Brands on Twitter FEBRUARY 1-27 2014

@mmsyellow tweeted around #daytona500 and #nascar in February and also received great engagement for these tweets. Tweets with #raindelay performed incredibly well with an average engagement score of 998.
M&Ms – Hashtag Analytics
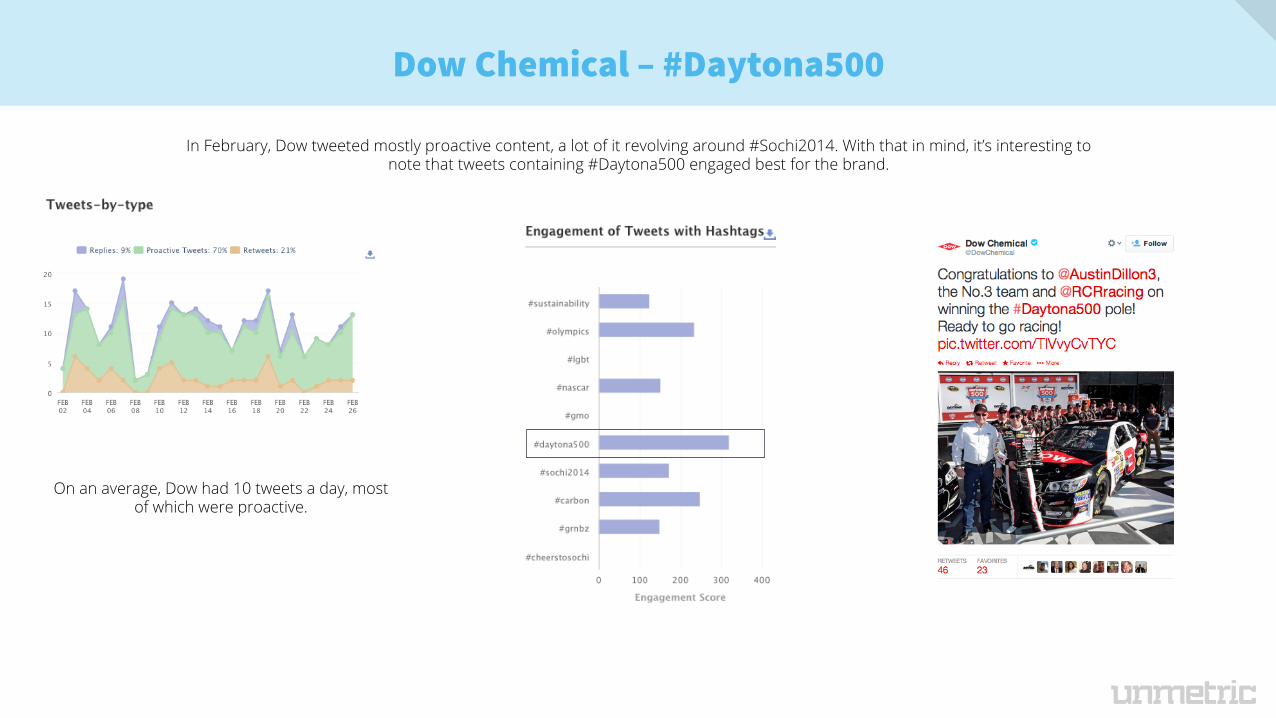
On an average, Dow had 10 tweets a day, most of which were proactive.
Dow Chemical – #Daytona500
In February, Dow tweeted mostly proactive content, a lot of it revolving around #Sochi2014. With that in mind, it’s interesting to note that tweets containing #Daytona500 engaged best for the brand.
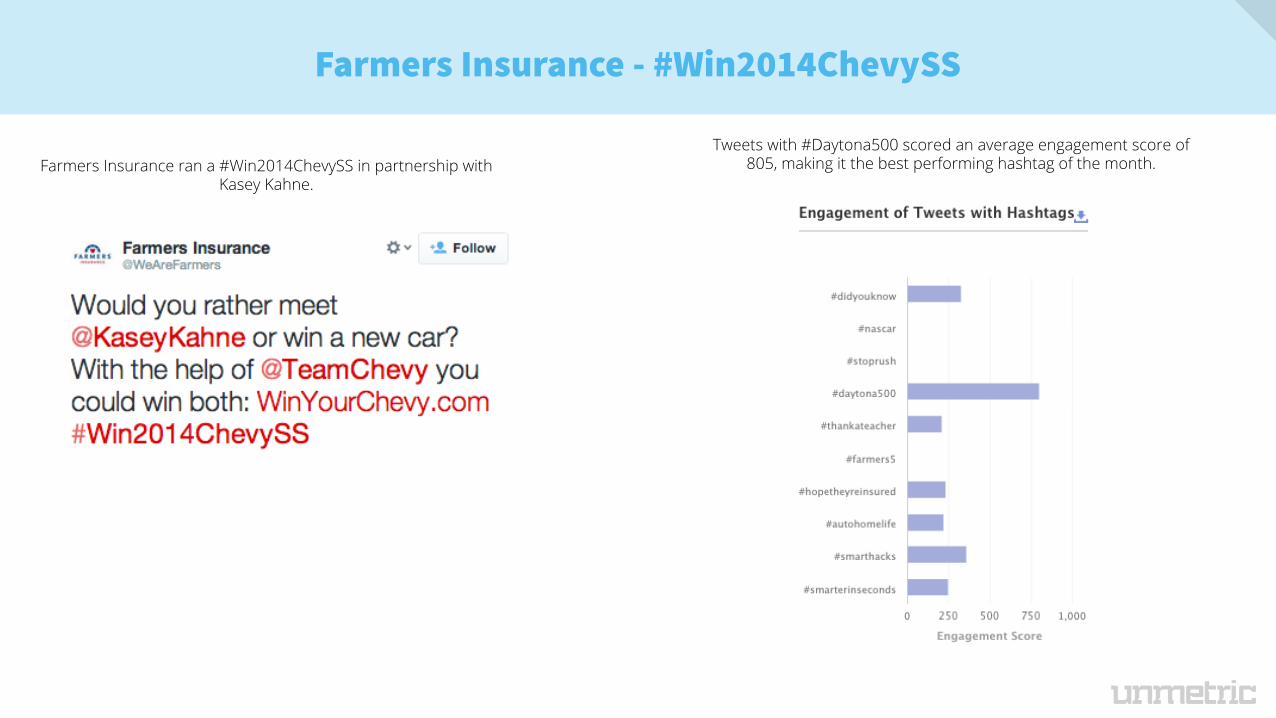
Farmers Insurance ran a #Win2014ChevySS in partnership with Kasey Kahne.
Farmers Insurance - #Win2014ChevySS
Tweets with #Daytona500 scored an average engagement score of 805, making it the best performing hashtag of the month.
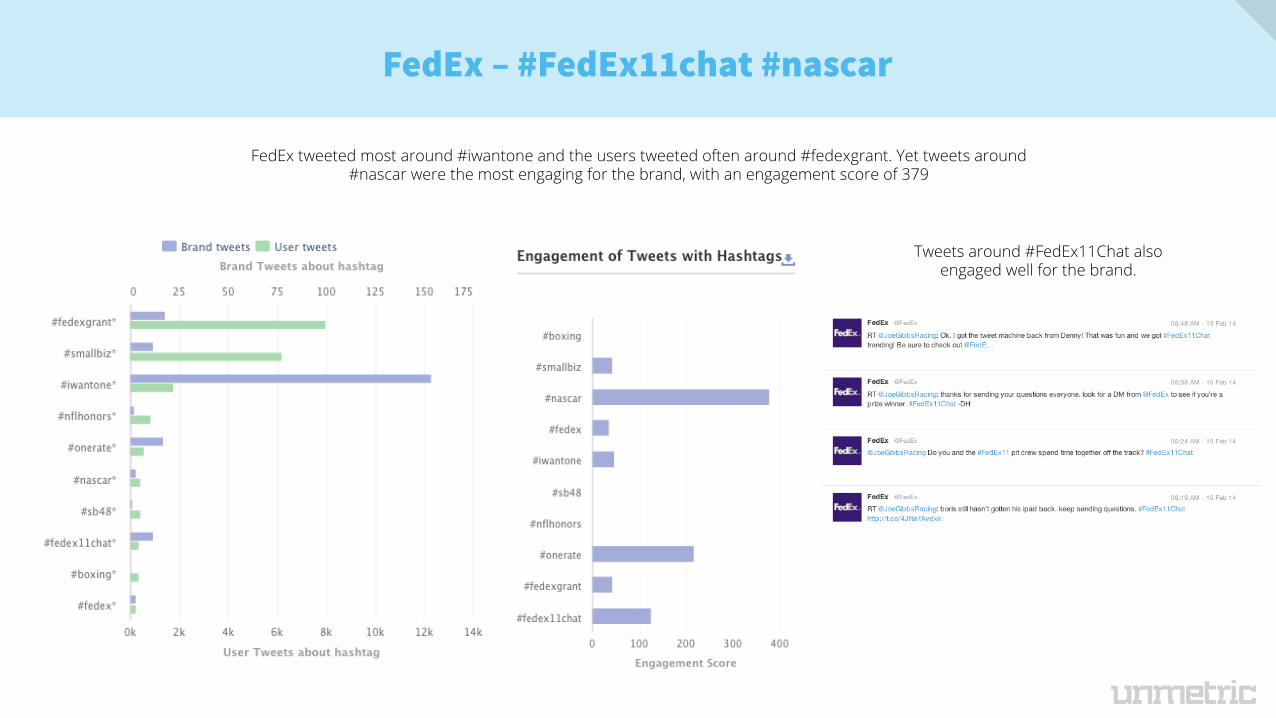
FedEx tweeted most around #iwantone and the users tweeted often around #fedexgrant. Yet tweets around #nascar were the most engaging for the brand, with an engagement score of 379
FedEx – #FedEx11chat #nascar
Tweets around #FedEx11Chat also engaged well for the brand.

Comparative Hashtag Analytics
151
0
379
0
349
0 50 100 150 200 250 300 350 400
Dow Chemical
Farmers Insurance
FedEx
Na?onwide
Yellow M&Ms
#Nascar
Engagement Score
319
805
93
704
0 100 200 300 400 500 600 700 800 900
Dow Chemical
Farmers Insurance
Na?onwide
Yellow M&Ms
#Daytona500
Engagement
In February 2014, on average, tweets with #Daytona500 performed better than tweets containing #Nascar.
APPENDIX

Engagement is the measure of audience responses to a brand's content and activity on a social network. To calculate the engagement score, we weigh audience interactions on brand content such as Likes, Comments, Shares or Favorites, Replies and Retweets based on their importance. We then divide their weighted sum by our estimate of the number of brand fans and followers who actively receive and view such content. Formula Facebook Engagement Score Formula ( No. of Likes + x × No. of Comments + y × No. of Shares ) × 10000 ____________________________________________________________ Audience Reception Rate Twitter Engagement Score Formula ( No. of Favorites + x × No. of Replies + y × No. of Retweets ) × 10000 ____________________________________________________________ Audience Reception Rate Linkedin Engagement Score Formula ( No. of Likes + x × No. of Comments ) × 10000 ____________________________________________________________ Audience Reception Rate The default Unmetric values for x and y are 5 and 10 respectively. Audience Reception Rate The Audience Reception Rate (ARR) is the Unmetric estimate of the number of brand fans/followers who stand to actively receive and view a brand's content. The formula you see below calculates the Audience Reception Rate as a function of the number of brand fans/followers raised to a fixed power value of 0.8. Audience Reception Rate = (Fans or Followers) 0.8
Engagement Score

THANK YOU Contact us at [email protected] for any further information.


![Daytona Daily News. (Daytona, Florida) 1910-02-10 [p 5].](https://static.fdocuments.us/doc/165x107/615ccdcfa3ff1f3bc5223688/daytona-daily-news-daytona-florida-1910-02-10-p-5.jpg)