Social Media and Customer Loyalty in the Travel Trade · VLAANDEREN XIOS HOGESCHOOL LIMBURG...
131
KATHOLIEKE UNIVERSITEIT LEUVEN UNIVERSITEIT GENT UNIVERSITEIT HASSELT VRIJE UNIVERSITEIT BRUSSEL KATHOLIEKE HOGESCHOOL MECHELEN KATHOLIEKE HOGESCHOOL BRUGGE-OOSTENDE ERASMUSHOGESCHOOL BRUSSEL HOGESCHOOL WEST- VLAANDEREN XIOS HOGESCHOOL LIMBURG PLANTIJN HOGESCHOOL ANTWERPEN Academic Year 2011-2012 Social Media and Customer Loyalty in the Travel Trade: A Relational Benefits Perspective Sociale Media en Loyaliteit in de Reissector: een ‘Relational Benefits’ Perspectief Master’s thesis submitted to obtain the degree of Promotor Prof. Dr. Robert Govers Master of Science in Tourism by: Astrid Senders
Transcript of Social Media and Customer Loyalty in the Travel Trade · VLAANDEREN XIOS HOGESCHOOL LIMBURG...

1
KATHOLIEKE UNIVERSITEIT LEUVEN UNIVERSITEIT GENT UNIVERSITEIT HASSELT
VRIJE UNIVERSITEIT BRUSSEL KATHOLIEKE HOGESCHOOL MECHELEN KATHOLIEKE
HOGESCHOOL BRUGGE-OOSTENDE ERASMUSHOGESCHOOL BRUSSEL HOGESCHOOL WEST-
VLAANDEREN XIOS HOGESCHOOL LIMBURG PLANTIJN HOGESCHOOL ANTWERPEN
Academic Year 2011-2012
Social Media and Customer
Loyalty in the Travel Trade:
A Relational Benefits Perspective
Sociale Media en Loyaliteit in de Reissector: een ‘Relational Benefits’ Perspectief
Master’s thesis submitted to obtain the
degree of
Promotor
Prof. Dr. Robert Govers Master of Science in Tourism
by: Astrid Senders

2
Abstract
The aim of this study is to create an understanding of how social media affect customer
loyalty to tour operators, by investigating the complex online relationships they have with
their clients. The relational benefits approach was used to investigate several relational
benefits and their influence on customer loyalty from an online customer perspective. The
sampling frame includes customers having a relationship with tour operators on Facebook.
Structural Equation Modeling was used to analyze the data, a method which is able to test
complex theoretical models. Findings show that customer loyalty is only directly affected by
social and functional benefits. Indirect effects have been found of confidence and hedonic
benefits. Special treatment benefits showed no significant effects at all. The theoretical
contribution of this study is the application of CRM research in relation to the tourism
industry, in a rather new context of social media. The practical contribution is that the travel
trade gains insight in online factors that drive their customers to become loyal.
Key words: customer loyalty, social media, relational benefits approach

3
In het kort: Het doel van dit onderzoek is het leren begrijpen van hoe sociale media
klantenbinding beïnvloed bij reisorganisaties, door de complexe online relaties te
onderzoeken tussen reisorganisaties en hun klanten. Hiervoor werd gebruik gemaakt van de
“relational benefits” benadering om verschillende relationele voordelen te onderzoeken en
het effect ervan op klantenbinding vanuit een online klantenperspectief. Het steekproefkader
bestond uit klanten met een relatie met reisorganisaties op Facebook. Om de verkregen data
te analyseren, is de methode “Structural Equation Modeling” gebruikt, een methode welke in
staat is complexe modellen te testen. Resultaten tonen aan dat klantenbinding alleen direct
beïnvloed wordt door “social” en “functional benefits”. Indirecte effecten zijn gevonden voor
“confidence” en “hedonic benefits”. “Special treatment benefits” bleken helemaal geen effect
te hebben. Dit onderzoek draagt bij aan de huidige literatuur, omdat CRM onderzoek nog
maar weinig is toegepast op het gebied van toerisme en ten tweede ook in een vrij nieuwe
context van sociale media. Het onderzoek is daarnaast ook van praktisch belang voor de
professionele sector, doordat het marketeers inzicht geeft in online factoren die een rol
spelen bij klantenbinding.

4
Table of contents
List of figures ................................................................................................................. 6
List of tables .................................................................................................................. 7
List of appendices .......................................................................................................... 8
1. Introduction ................................................................................................................ 9
1.1 Research objective and question ...............................................................................12
1.2 Demarcation ..............................................................................................................13
1.3 Definitions ..................................................................................................................13
1.4 Structure of the thesis ................................................................................................14
2. Conceptual and Theoretical Foundation ..................................................................... 15
2.1 The concept of Customer Loyalty ...............................................................................15
2.2 The concept of Customer Satisfaction ........................................................................17
2.3 The Relational Benefits Approach ..............................................................................18
2.3.1 Social Benefits .....................................................................................................19
2.3.2 Confidence Benefits .............................................................................................19
2.3.3 Functional Benefits ..............................................................................................20
2.3.4 Special Treatment Benefits ..................................................................................20
2.3.5 Hedonic Benefits ..................................................................................................21
2.3.6 Application of the Relational Benefits Approach in the context of Social Media ....21
2.4 Relationship Commitment .........................................................................................22
2.5 Word of Mouth ..........................................................................................................23
3. The Construction of the Proposed Model .................................................................... 24
3.1 Consequences of Relational Benefits ........................................................................24
3.2 The influence of Customer Satisfaction and Relationship Commitment on Customer
Loyalty ......................................................................................................................26
3.3 The influence of Relationship Commitment and Customer Satisfaction on Word of
Mouth ........................................................................................................................29
3.4 A graphical illustration of the proposed conceptual model .........................................30

5
4. Methodology ............................................................................................................ 31
4.1 Research design .......................................................................................................31
4.2 Data collection ..........................................................................................................31
4.2 Measurement ............................................................................................................33
4.3 Data analysis ............................................................................................................33
5. Results .................................................................................................................... 35
5.1 Checking assumptions ...............................................................................................36
5.2 Exploratory factor analysis .........................................................................................39
5.3 Confirmatory factor analysis .......................................................................................40
5.4 Structural Equation Modeling .....................................................................................43
5.5 Nested Structural Models ...........................................................................................44
5.6 Hypotheses testing ....................................................................................................47
6. Conclusion ............................................................................................................... 53
Limitations and Suggestions for Further Research .......................................................... 56
Theoretical and Managerial Implications......................................................................... 58
Acknowledgements ...................................................................................................... 60
References .................................................................................................................. 61
Appendices ................................................................................................................. 67

6
List of figures
Figure 1: Evolution in active Facebook users (2004-2011) ...................................................11
Figure 2: Relative attitude behavior relationship ...................................................................16
Figure 3: The proposed conceptual model ............................................................................30
Figure 4: Final model ............................................................................................................47

7
List of tables
Table 1: General sample details ...........................................................................................35
Table 2: Fit indices and their acceptable threshold levels .....................................................41
Table 3: Interpretation of BCC values ...................................................................................45
Table 4: Interpretation of BIC values ....................................................................................45
Table 5: Significant direct effects found by the final model ...................................................48
Table 6: Overview of consulted studies for the operationalization of constructs ....................67
Table 7: Studies consulted with respect to "Social Benefits" .................................................69
Table 8: Consulted studies with respect to "Confidence Benefits" ........................................70
Table 9: Consulted studies with respect to "Functional Benefits" ..........................................71
Table 10: Consulted studies with respect to "Special Treatment Benefits" ............................72
Table 11: Consulted studies with respect to "Hedonic Benefits" ...........................................73
Table 12: Consulted studies with respect to "Customer Satisfaction"....................................74
Table 13: Consulted studies with respect to "Customer Loyalty"...........................................75
Table 14: Consulted studies with respect to "Relationship Commitment" ..............................76
Table 15: Consulted studies with respect to "Word of Mouth" ...............................................76
Table 16: Measurement Items included in questionnaire (Likert scales 1-7) .........................77
Table 17: Regression weights in the measurement model .................................................. 121
Table 18: Significant paths found with the proposed model ................................................ 128
Table 19: Significant indirect effects found by the final model ............................................. 131

8
List of appendices
Appendix 1: Measurement scales reviewed for operationalization of constructs…………….67
Appendix 2: Output used to check assumptions…………………………………………………81
Appendix 3: Output used during exploratory factor analysis……………………….………….100
Appendix 4: Output used during confirmatory factor analysis………………………………...121
Appendix 5: Output used during structural equation modeling……………………….……….128
Appendix 6: Output used during nested structural models testing ……………….………….129

9
1. Introduction
The Internet has changed our daily lives completely. From a supplier’s point of view, the
Internet enables companies to attract new customers. For customers, the Internet created a
greater choice in products and services, value and pricing flexibility, due to access to new
and more products. This increased competition and therefore companies are challenged to
remain attractive to customers and to make them loyal to their brand (O’Reilly & Paper,
2009). Keeping existing customers by fostering customer loyalty is less expensive than to
acquire new customers; it takes high investments to obtain information about new customers
and to earn their trust (Conze et al., 2010; Hennig-Thurau, 2002; Gwinner et al. 1998;
O’Reilly & Paper, 2009). Long-term relationships with customers are essential for companies
operating in highly competitive environments. As service goods, tourism products are non-
transparent and therefore a chance exists that customers change suppliers. The non-
transparent aspect is due to the distance between the place of purchase and the place of
consumption (Conze et al., 2010). However, Yen & Gwinner (2003) pointed out that in the
literature the focus on the benefits of long-term relationships for companies is replaced by
the focus on the benefits for customers:
“Today it is crucial to know the desires of the customer and to understand what
services generate benefits for the customers” (Conze et al., 2010).
To remain competitive, companies work on their relationships with their customers which is
also well known as relationship marketing. Berry (1983) defined relationship marketing as
“attracting, maintaining and enhancing customer relationships”. Sheth (1996, cited in Hennig-
Thurau, 2002, p.231) states that customer loyalty is a primary goal of relationship marketing
and sometimes seen as equal to the concept of relationship marketing. According to Vogt

10
(2011), travel and tourism organizations have been one of the early adopters of Customer
Relationship Management. Conze et al. (2010) confirm this by stating that the travel industry
was a pioneer to introduce loyalty programs like frequency flyer programs or hotel loyalty
cards.
Before, marketing practices were one way, but this has changed over the years with the
advent of social media. Social media is different from traditional media, since the
communication runs both ways instead of one-way. The two-way aspect makes it possible to
start conversations between multiple parties (Miller, 2011). Hanna et al. (2011) concluded
that social media must be used in addition to traditional media in their marketing activities.
But the emergence of Web 2.0 requires a different approach of marketers who try to connect
with their customers (Meadows-Klue, 2008). Meadows-Klue (2008) argues:
“Relationship marketing for the Facebook generation demands both thinking
and acting differently”.
Social media have gained popularity the last few years. Developments in information
technology have led to new possibilities for communication in the travel industry. Social
networking sites are increasingly used by online travelers who like to communicate with
others regarding travel information and by those who search for travel-related information
(Sung-Bum & Dae-Young, 2010). Therefore social media are becoming more and more
important in the online tourism domain (Xiang & Gretzel, 2011). Social media are used by
people sharing their experiences and opinions with others and consist of social networks
(e.g. Facebook, MySpace, Linkedin), blogs, micro blogs (e.g. Twitter), social bookmarking
and news services (e.g. NUjij), media sharing sites (e.g. YouTube) and virtual communities
(e.g. Second Life) (Miller, 2011). Social networking sites are, presumably, the most popular

11
social media. Social networking site “Friendster” was the pioneer in social media as known
nowadays. In 2003, it introduced the concept of making friends online. Friendster was
popular at that time, but soon MySpace came along which became the most popular SNS in
2006. Other SNS were launched in 2003 and 2004, respectively Linkedin for business
purposes and Facebook, initially, for college students. Today, SNS are being used by all
kinds of people. Since Facebook allowed users of all ages, it became one of the most
popular SNS as well as for people as for marketing management. As figure 1 shows,
Facebook has over 800 million users that make active use of the social medium. According
to Zarella & Zarella (2011), half of them logs in each day. Beside a huge amount of users,
Facebook has the most general audience which makes it interesting for all kinds of
businesses. All the information resulting from 800 million profiles make Facebook a great
source for marketers. Therefore, social media marketing is being more and more applied
(Miller, 2011).
Figure 1: Evolution in active Facebook users (2004-2011)
Source: Facebook (2011)

12
In professional journals regarding tourism like the Belgian Travel Magazine, it can be read
that, also in the travel trade, social media are more and more included in the marketing mix
(2011a). Social media are becoming more and more important and experts in the
professional sector are recommending the travel trade to actively anticipate to it (Travel
Magazine, 2011b; Travel Magazine, 2011c). The added value of the use of social media by
players in the travel trade is questioned. What is the impact of the use of social media by the
travel trade? Several benefits of social media for the travel trade are suggested, like
enthusing customers for certain destinations, creating brand awareness and creating
customer loyalty (Travel Magazine, 2011a). Kasavana et al. (2010) support this, saying that
social networking can assist in improving customer loyalty and satisfaction. To achieve goals
like these, the use of social media need to respond to customer’s needs (Hekkert, 2011).
This idea connects to the shift in the literature to focus more on the customer’s point of view.
The discussion in the professional sector about the impact of social media on customer
loyalty may solicit for a more rigorous approach and academic research into the
phenomenon.
1.1 Research objective and question
Based on the previous discussion, the objective of this research is to create an
understanding of how social media affect customer loyalty to tour operators, by investigating
the complex online relationships they have with their clients. To meet this objective, this
study aims to identify important drivers of customer loyalty in an online context. The focus
lies on customers and their relationships with tour operators through social media. From a
customer perspective, several relational benefits and their influence on customer loyalty are
investigated. Based on the research objective, the research question is as follows:

13
In what way and to what extent do relational benefits of social media have an impact on
customer loyalty toward a specific tour operator?
1.2 Demarcation
As will be explained in further detail in chapter 4, customers of tour operators on Facebook
were approached to participate in an online survey in order to be able to answer the research
question. Despite of the fact that travel agents are also recommended to use social media,
only tour operators were included in this research because it is expected that online bookers
are more and more purchasing their holidays directly with tour operators. Furthermore,
Facebook was chosen as the sampling frame because its potential for marketing purposes is
being recognized more and more, plus it is relatively easy to gain access to tour operators’
customers on Facebook. The sampling frame was categorized by several different tour
operators having a Facebook page, Belgian as well as Dutch ones, attempting to guarantee
representative results for the tour operator industry.
1.3 Definitions
The most important concepts mentioned in the research objective and research question are
briefly explained below. A more detailed explanation will follow in the next chapter.
As stated earlier, customer loyalty is the primary goal of customer relationship management.
Customer loyalty can be defined as “an enduring desire to maintain a valued relationship”
(Hennig-Thurau et al., 2002). According to the relational benefits approach used in this study,
some sort of relational benefits for the customers must be created in order to make
customers value the relationship with a company, more specifically a tour operator, in the
long run. Relational benefits can be described as “those benefits customers receive from
long-term relationships above and beyond the core service performance” (Gwinner et al.,

14
1998). Five types of relational benefits are incorporated in this research, namely social,
confidence, functional, special treatment and hedonic benefits.
1.4 Structure of the thesis
This thesis is further structured as follows. First, the theoretical foundation of the proposed
conceptual model is presented. Customer loyalty will be explained in more detail and more
attention is given to the relational benefits approach and the relational benefits included here.
Second, the construction of the proposed model will be outlined, which is based on existing
literature. Third, the methodology of this research will be described and fourth, the results are
given. Next, the research question will be answered in the conclusion. Sixth, the limitations of
this research are given including suggestions for future research. Finally, theoretical and
managerial implications are explained.

15
2. Conceptual and Theoretical Foundation
This chapter presents the theoretical framework for the foundation of the proposed model
regarding social media.
2.1 The concept of Customer Loyalty
Relationship building with customers increases customer satisfaction and loyalty (Reynolds &
Beatty, 1999; Berry & Parasuraman, 1991; Czepiel, 1990). According to Hennig-Thurau et al.
(2002), customer loyalty is an important relationship marketing outcome. Keller (1993, cited
in Anderson & Srinivasan, 2003, p.125) defines loyalty as “a favorable attitude for a brand
manifested in repeat buying behavior”. This study incorporates loyalty toward a specific tour
operator as well as loyalty toward their online presence. Therefore, loyalty must be
distinguished from e-loyalty, defining e-loyalty as “a favorable attitude toward a given firm
operating online resulting in repeated use of the online relationship” (Anderson & Srinivan,
2003). Loyalty relationships between tourists and a service provider are often described by
trust, commitment and satisfaction and can be influenced on- and offline, hence both
concepts are relevant for this study. As a concept, loyalty captures behavioral, cognitive and
affective aspects and can be characterized by attitude (Vogt, 2011).
Two key dimensions of loyalty exist in the literature. On the one hand there is behavioral
loyalty and on the other hand there is attitudinal loyalty (Anderson & Srinivasan, 2003;
Hallowell, 1996; Pritchard et al., 1999). Behavioral loyalty can be characterized by repeat
purchases from one particular supplier, an increase in scale and/or scope of the relationship
and by recommendations given. Attitudinal loyalty is about feelings customers have creating
a sort of attachment to a particular product, service or organization and this is solely
cognitive (Hallowell, 1996). Attitude is often related to behavior, but it must be noted that

16
these concepts may differ from each other. One may have a favorable attitude toward a
specific product or service, but not purchase it repeatedly because of other comparable
products or services or a stronger attitude to those other products or services. Furthermore,
consumers’ attitude toward a brand needs to be compared to their attitude toward other
brands of the same consumption context. That is to be able to see differences in the strength
of attitudes toward these brands and to measure customer loyalty (Dick & Basu, 1994).
Figure 2 shows a two-dimensional understanding of customer loyalty, wherein attitudinal and
behavioral loyalty are both incorporated. No loyalty forms a combination of low relative
attitude toward a brand and low repeat patronage. On the opposite there is true loyalty; a
combination of high relative attitude toward a brand and high repeat patronage. Between
these two dimensions, two other dimensions exist, namely latent loyalty and spurious loyalty.
Latent loyalty means that a person may feel attached to a certain brand, but does not show a
repeat patronage. Spurious loyalty however, is the complete opposite of the previous
dimension. It represents a person who makes use of a product or service regularly, but no
feeling of attachment to the product or service exists (Dick & Basu, 1994).
Figure 2: Relative attitude behavior relationship
Source: Dick & Basu (1994, p.101)

17
Customer loyalty forms an important basis for the development of sustainable competitive
advantage (Dick & Basu, 1994), because loyal customers have several benefits in
comparison with ordinary customers. First of all, they can cause an increase in revenues for
a firm. Second, often they purchase more additional goods and services (Gwinner et al.,
1998). Prokesch (1995) argues that British Airways had found that their effort in relationship
building had led to an increase of 9% in business generated by their customers. Third, loyalty
reduces customer turnover and loyal customers create positive word of mouth (Gwinner et
al., 1998; Heskett et al., 1994). Moreover, retaining a customer is less expensive than to
attract a new one, due to less sales and marketing costs (Conze et al., 2010; Hennig-Thurau,
2002; Gwinner et al. 1998; O’Reilly & Paper, 2009). Health (1997) argues that loyal
customers may yield up to ten times more than average customers.
2.2 The concept of Customer Satisfaction
Customer satisfaction is incorporated in the conceptual model, because in many studies it
proved to be an important determinant of customer loyalty as will become clear later on.
Just as customer loyalty, customer satisfaction takes two forms in the field of this study. First,
customer satisfaction toward a specific tour operator can be defined as “the contentment of
the customer with respect to his or her prior experience with a given firm” (Anderson &
Srinivan, 2003). Second, customer e-satisfaction can be described as “the contentment of
the customer with respect to his or her prior experience with a given firm operating in an
online environment” (Anderson & Srinivan, 2003). According to Heskett et al. (1994),
customers are satisfied when the service delivered meets their needs. It would be even
better, if the service delivery exceeds customers’ expectations. Therefore, it can also be
described as the difference between customer expectations and the delivered service

18
(Faché, 2000). In other words, customer satisfaction is the result of customers’ perception of
the value they receive in a relationship (Hallowell. 1996).
2.3 The Relational Benefits Approach
In this study the relational benefits approach was used, which indicates the importance of
benefits for both customers and companies to continue their relationship in the long run.
Positive outcomes of customer loyalty are already mentioned above, however, to create a
long-term relationship also the customer must possess relational benefits. In other words,
there has been a shift in the literature from a business point of view to the customer’s point of
view. Many different types of relational benefits have already been investigated (Gwinner et
al., 1998; Hennig-Thurau et al., 2002). For this research, the most appropriate variables are
chosen; those relational benefits through social media of which it seems plausible to have a
significant effect on customer loyalty.
Customers who are in a relationship with an organization would like to receive a satisfactory
core service. By developing a long-term relationship with a service business, customers will
have extra benefits next to the core service. According to Gwinner et al. (1998), these type of
benefits are called relational benefits. Hennig-Thurau et al. (2002) define relational benefits
as “benefits customers likely receive as a result of having cultivated a long-term relationship
with a service provider”. Literature shows that there are several types of relational benefits.
Researchers do not always use the same benefits in their research and in some cases
relational benefits are adapted or combined. Gwinner et al. (1998) have found significant
relationships between relational benefits and customer loyalty, customer satisfaction and
word of mouth.

19
Below, different types of relational benefits that seem important for this research are
explained.
2.3.1 Social Benefits
The first type of benefits often used in research are social benefits customers receive from a
service. Gwinner et al. (1998) define social benefits as “a customers’ need for social bonding
and dealing with someone familiar”. This type of benefit covers the emotional side of
relationships and is about personal recognition of customers by employees and friendships
between them (Yen & Gwinner, 2003). It includes the joy that comes with a close relationship
with a salesperson (Reynolds & Beatty, 1999). Many customers receive social benefits of
having a relationship with a particular service provider, although it seems more common in
situations where there is much personal interaction. However, social media are new online
environments that might allow personal interaction. Social benefits seem important to
incorporate in the conceptual model, since the need for social bonding comes very close with
the concept of social media where people come together to interact with each other.
2.3.2 Confidence Benefits
Another type of relational benefits often employed in research are confidence benefits.
Confidence benefits are defined by Gwinner et al. (1998) as “the customers’ desire for
reduced risks, reliability, and integrity of the company they are engaging with in a
relationship”. It includes trust and confidence in an organization and the feeling of comfort
and security about a company (Gwinner et al., 1998). According to Yen & Gwinner (2003),
confidence benefits are the most important type of relational benefits in face-to-face
encounters regardless the type of service. Furthermore, confidence benefits seems to be an
important variable in the e-business environment according to Su et al. (2009). Su et al.

20
argue that customers are concerned about trusting online businesses. Furthermore,
customers perceive personal communication as a more reliable source than impersonal
communication (Hennig-Thurau et al., 2002), which may lead to distrust in the information
given through social media by tour operators. Therefore, confidence benefits seem important
to incorporate in the model.
2.3.3 Functional Benefits
Thirdly, functional benefits are designated as relational benefits. This type of benefits covers
several aspects in the literature. According to Reynolds & Beatty (1999), functional benefits
encompass confidence and special treatment benefits. These type of benefits are already
included separately in the theoretical model of this research. However, also items referring to
knowledge are often included in functional benefits. Parra-López et al. (2011), Paul et al.
(2009) and Wang & Fesenmaier (2004) indicate the existence of the knowledge aspect of
this type of benefits. As Wang & Fesenmaier point out, members of communities are looking
for functional benefits when they search online to fulfill specific needs. These specific needs
may be related to information gathering which helps in decision-making processes. Since the
knowledge aspect is not included in any of the other types of benefits, the functional benefits
in this study will cover this knowledge aspect. Though, it will not cover confidence and
special treatment benefits in this research as the latter variables are treated separately.
Moreover, confidence and special treatment benefits are variables originally applied by
Gwinner et al. (1998) and later used by many other researchers as well, for example by Kim
(2009), Lee et al. (2008), Ruiz-Molina et al. (2008) and Chang & Chen (2007).
2.3.4 Special Treatment Benefits
Fourth, special treatment benefits will be included in the theoretical model of this research.
This type of benefits is about special deals and treatment which is unavailable to non-

21
relational customers (Yen & Gwinner, 2003). These benefits include price breaks, faster
service and individualized additional services (Hennig-Thurau et al., 2002; Kim, 2009; Lee et
al., 2008). Special treatment benefits can be utilized by firms to reward loyal customers and
to extend the core service (Lee et al., 2008). There are already many examples of this being
applied in online environments including social media, which is the reason to incorporate this
variable in the conceptual model.
2.3.5 Hedonic Benefits
A type of benefits which is little used in the literature, are hedonic benefits. Wang &
Fesenmaier (2004) argue that one must also take into account experiential aspects when it
comes to consumer information searching, because people also pursue enjoyment and
entertainment. According to the hedonic perspective, consumers are searching for pleasure
in their activities. The online network environment of travel communities is able to bring
amusement, fun, enjoyment and entertainment to people (Wang & Fesenmaier, 2004).
Hedonic benefits are the final relational benefits variable included in the conceptual model of
this study, because it is expected that social media are often used for fun.
2.3.6 Application of the Relational Benefits Approach in the context of Social
Media
According to Yen & Gwinner (2003), the relational benefits approach is mainly applied in the
context of relationships between customers and employees in face-to-face encounters.
Czepiel (1990) defines a customer-salesperson relationship as “an ongoing series of
interactions between a salesperson and a customer while the parties know each other”. Over
the years, the relational benefits perspective is also increasingly used in the context of the
online environment. Due to the use of the Internet, personal contact with employees is
reducing more and more. Therefore, it is interesting to apply the relational benefits approach

22
in an online environment. Yen & Gwinner (2003) were one of the first investigating if
relational benefits in the online environment lead to any significant outcomes like satisfaction
and loyalty. Their findings suggested that this approach remained valid in an online context.
The relational benefits approach may already have been applied in an online context, yet
little research has been done on the existence of relational benefits within the world of social
media. Let alone the existence of relational benefits within the world of social media
regarding interactions between customers and service providers, for example tour operators,
being active on social media. This is of particular interest because social media re-introduce
personal encounters in online environments.
2.4 Relationship Commitment
In the literature, relationship commitment is often added as a mediator between relational
benefits and customer loyalty. According to Hennig-Thurau et al. (2002), relationship
commitment can be defined as “a customer’s long-term orientation toward a business
relationship that is grounded on both emotional bonds and the customer’s conviction that
remaining in the relationship will yield higher net benefits than terminating it”. Another
definition often referred to, is the one of Morgan & Hunt (1994): “an exchange partner
believing that an ongoing relationship with another is so important as to warrant maximum
efforts at maintaining it; that is, the committed party believes the relationship is worth working
on to ensure that it endures indefinitely”. Morgan & Hunt believe that relationship
commitment comes close to customer loyalty and, in addition, is central in relationship
marketing. Berry & Parasuraman (1991, p.139) agree at the latter point, arguing that
“relationships are built on the foundation of mutual commitment”.

23
2.5 Word of Mouth
Relationship building increases customer satisfaction and loyalty, but also causes an
increase in the amount of positive word of mouth (Berry & Parasuraman, 1991; Hennig-
Thurau, 2002; Reynolds & Beatty, 1999). According to Litvin et al. (2007), word of mouth
proved to be one of the most important sources of information in a purchase decision making
process. Particularly in the hospitality and tourism industry, sectors characterized by
intangible products, it is not possible to evaluate products before consumption. People use
the Internet to gather information and are being influenced by travel reviews of others sharing
their experiences on social networking sites (Litvin et al., 2007). As stated earlier, this is
largely due to the customer’s perception of personal communication being a more reliable
source than impersonal communication (Hennig-Thurau et al., 2002). Word of mouth seems
to be a phenomenon which is highly associated with social media and therefore incorporated
in the theoretical model of this study. Whether people share their experiences on- or offline,
word of mouth captures “all informal communications directed at consumers about the usage
or characteristics of particular goods and services, or their sellers” (Westbrook, 1987). It
concerns evaluations that can be either positive, neutral or negative (Anderson, 1998).
Heskett et al. (1994) indicate the importance of customer satisfaction and loyalty in terms of
their future behavior toward a company. The more satisfied customers are, the more likely it
is these customers will be retained. Moreover, consumers who are intended to repurchase
are more likely to create positive word of mouth (Anderson, 1998; Heskett et al., 1994;
Petrick, 2004b, cited in Petrick & Li, 2006). These customers are called apostles. On the
other hand, there are the terrorists; customers who are very unsatisfied and have a
devastating impact on the firm by creating negative word of mouth (Heskett et al., 1994).

24
3. The Construction of the Proposed Model
This section proposes the construction of the proposed model, measuring the influence of
social media on customer loyalty. Based on the literature reviewed, expected relationships
are presented.
3.1 Consequences of Relational Benefits
As outlined before, this study incorporates five different types of relational benefits customers
can perceive from a tour operator being active on social media. The first type are social
benefits. Research has shown that social benefits have a significant impact on customer
loyalty and relationship commitment (cf. Hennig-Thurau et al., 2002, p.240). Although
Hennig-Thurau et al. (2002) did not find support for a positive relationship between social
benefits and customer satisfaction, Reynolds & Beatty (1999) did. Since the interaction
between consumers and a firm’s employees is an important factor of customer’s perception
of the quality of a service, social benefits proved to have a positive effect on customer
satisfaction with the salesperson according to Reynolds & Beatty (1999, p.22). Moreover,
these researchers found a significant effect of social benefits on customer loyalty to the
salesperson. Since the salesperson is substituted by the tour operator being active on social
media in this research, the next hypotheses were formulated:
Hypothesis 1a: Social Benefits are positively associated with Customer e-Satisfaction.
Hypothesis 1b: Social Benefits are positively associated with Customer e-Loyalty.
Hypothesis 1c: Social Benefits are positively associated with Relationship Commitment.
Great significance has been found for the impact of trust and confidence benefits on
relationship satisfaction (cf. Hennig-Thurau et al., 2002, p.240; Yen & Gwinner, 2003, p.493)
and loyalty (cf. Chang & Yen, 2007, p.106; Hennig-Thurau et al., 2002, p.240; Yen &

25
Gwinner, 2003, p.493). Furthermore, there seem to be contradictions in the literature about
the effect of confidence benefits on relationship commitment. Berry (1995, cited in Hennig-
Thurau et al., 2002, p.242), Ganesan and Hess (1997, cited in Hennig-Thurau et al., 2002,
p.242) and Morgan and Hunt (1995, cited in Hennig-Thurau et al., 2002, p.242) all argued
that trust in a service provider should lead to customer commitment. But according to
Hennig-Thurau et al. (2002, p.241), there is only an indirect effect with relationship
satisfaction as a mediator. To be sure not to exclude potential relationships, the following
hypotheses were formulated:
Hypothesis 2a: Confidence Benefits are positively associated with Customer e-Satisfaction.
Hypothesis 2b: Confidence Benefits are positively associated with Customer e-Loyalty.
Hypothesis 2c: Confidence Benefits are positively associated with Relationship Commitment.
Parra-López et al. (2011, p.651) found that functional benefits had a significant effect on the
intention to use social media. However, Wang & Fesenmaier (2004, p.718) did not find
support for a positive relationship between functional benefits and level of participation in an
online travel community. Because of the contradictions and the slightly different variables
used in this study, the following hypotheses were formulated in order to be sure not to
exclude potential relationships:
Hypothesis 3a: Functional Benefits are positively associated with Customer e-Satisfaction.
Hypothesis 3b: Functional Benefits are positively associated with Customer e-Loyalty.
Hypothesis 3c: Functional Benefits are positively associated with Relationship Commitment.
As it comes to special treatment benefits, more contradictions in literature can be found.
Some research showed no significant effects of this type of benefits on customer satisfaction
(cf. Hennig-Thurau et al., 2002, p.240) and customer loyalty (cf. Chang & Yen, 2007, p.106;

26
Hennig-Thurau et al., 2002, p.241), but according to Gwinner et al. (1998, p.109) and Yen &
Gwinner (2003, p.492) it does have a significant effect. Though Hennig-Thurau et al. (2002,
p.240) did not find support for the effect of special treatment benefits on customer
satisfaction and customer loyalty, they did find support for the positive relationship between
special treatment benefits and relationship commitment. Because of the contradictions, all
potential relationships were included in the conceptual model in order to check whether these
exist or not.
Hypothesis 4a: Special Treatment Benefits are positively associated with Customer e-
Satisfaction.
Hypothesis 4b: Special Treatment Benefits are positively associated with Customer e-
Loyalty.
Hypothesis 4c: Special Treatment Benefits are positively associated with Relationship
Commitment.
Wang & Fesenmaier (2004, p.718) found little support for a positive relationship between
hedonic benefits and level of participation in an online travel community. Once again, not
wanting to exclude potential relationships, the next hypotheses were formulated:
Hypothesis 5a: Hedonic Benefits are positively associated with Customer e-Satisfaction.
Hypothesis 5b: Hedonic Benefits are positively associated with Customer e-Loyalty.
Hypothesis 5c: Hedonic Benefits are positively associated with Relationship Commitment.
3.2 The influence of Customer Satisfaction and Relationship
Commitment on Customer Loyalty
Hennig-Thurau et al. (2002, p.241) state that relationship satisfaction and relationship
commitment proved to be mediators between relational benefits and relationship marketing

27
outcomes. These mediators allow a full understanding of the relationship between relational
benefits and customer loyalty. Their research showed that relationship satisfaction and
relationship commitment have a strong and significant effect on customer loyalty (Hennig-
Thurau et al., 2002, p.241). Reynolds & Beatty (1999, p.22) agree at this point by stating that
customer satisfaction proved to have a positive influence on customer loyalty. However, Yen
& Gwinner (2003, p.492) did not find support for this relationship. In terms of commitment,
Gutek et al. (2000, cited in Yen & Gwinner, 2003, p.484) states that customers are more
loyal when they are in a close relationship with an employee of a specific firm. Based on
these studies, the following hypotheses were proposed:
Hypothesis 6: Customer Satisfaction with the Tour Operator is positively associated with
Customer Loyalty to the Tour Operator.
Hypothesis 7: Relationship Commitment is positively associated with Customer Loyalty to the
Tour Operator.
Perceived quality of performance is a main determinant for satisfaction and consumers are
provided with satisfactions apart from the products that are being sold (Reynolds & Beatty,
1999). Westbrook (1981, cited in Reynolds & Beatty, 1999, p. 14) states that consumers are
able to experience satisfaction from an overall experience with the company and through its
salespersons. In Reynolds & Beatty their research, satisfaction of salespersons and
satisfaction of the company are included as separate variables, because they believe that
customers are not only receiving benefits from their relationship with the company but from
their salesperson-relationship as well. Satisfaction of a salesperson proved to have a positive
impact on satisfaction of the company overall (Reynolds & Beatty, 1999, p.22). This is also
confirmed by Goff et al. (1997), Oliver & Swan (1989) and Crosby et al. (1999) as stated by

28
Reynolds & Beatty (1999, p.14). In this study a similar relationship is expected, namely
customers’ satisfaction with the tour operator being active on social media affecting the
satisfaction of the tour operator as a whole. Therefore, the following hypothesis was
formulated:
Hypothesis 8: Customer e-Satisfaction is positively associated with Customer Satisfaction
with the Tour Operator.
Reynolds & Beatty (1999) point out that there is also a difference between loyalty to a
salesperson and loyalty to a company, because of the human contact that is included in a
person-to-person relationship. Czepiel (1990) argues that this may be because trust,
attachment and commitment which arise in person-to-person relationships form the
foundation for person-to-firm relationships. A distinction was made between loyalty to a
salesperson and loyalty to the company, despite the positive relationship that exists between
the two. Loyalty to a salesperson is positively associated with loyalty to a company, only
Reynolds and Beatty pointed out that there is a chance that customers would follow a leaving
salesperson when the merchandise of the stores is similar. This is not the case in the field of
this study, because the tour operator its employee being active on social media remains
unknown for the customer. This potential relationship must not be excluded, wherefore a
distinction was made between e-loyalty and loyalty to the tour operator itself as well:
Hypothesis 9: Customer e-Loyalty is positively associated with Customer Loyalty to the Tour
Operator.
Making a distinction between e-satisfaction and satisfaction with the tour operator overall and
also between e-loyalty and loyalty to the tour operator overall, the next hypothesis was
formulated based on the first hypothesis:

29
Hypothesis 10: Customer e-Satisfaction is positively associated with Customer e-Loyalty.
Customer satisfaction proved to have a significant effect on relationship commitment in
several studies (cf. Beatson et al., 2008, p.215; Hennig-Thurau et al., 2002, p.237; Hennig-
Thurau & Klee, 1997, p.753; Park & Kim, 2008, p.158). Therefore, the following hypotheses
were formulated:
Hypothesis 11: Customer Satisfaction with the Tour Operator is positively associated with
Relationship Commitment.
Hypothesis 12: Customer e-Satisfaction is positively associated with Relationship
Commitment.
3.3 The influence of Relationship Commitment and Customer
Satisfaction on Word of Mouth
According to Hennig-Thurau et al. (2002, p.241), relationship commitment and relationship
satisfaction give an understanding between relational benefits and word of mouth. Their
research showed not only a significant effect of relationship satisfaction and relationship
commitment on customer loyalty, but on word of mouth as well. Dimitriadis (2010, p.306)
confirms the positive relationship between satisfaction and word of mouth. Pritchard et al.
(1999, cited in Hennig-Thurau, 2002, p.232) have found a significant effect of commitment on
customer loyalty in the hotel and airline industry. Gutek et al. (2000, cited in Yen & Gwinner,
2003, p.484) confirm this relationship as well, stating that customers are more willing to
promote a firm when they are in a close relationship with an employee of the specific firm.
Based on these findings, the following hypotheses were formulated:
Hypothesis 13: Relationship Commitment is positively associated with Word of Mouth.
Hypothesis 14: Customer e-Satisfaction is positively associated with Word of Mouth.

30
Hypothesis 15: Customer Satisfaction with the Tour Operator is positively associated with
Word of Mouth.
3.4 A graphical illustration of the proposed conceptual model
The formulated hypotheses are summarized in figure 3, which illustrates the proposed
conceptual model, measuring the influence of social media on customer loyalty in the travel
trade.
Figure 3: The proposed conceptual model
Source: own design

31
4. Methodology
This chapter describes the research design used for this research. Second, a description of
how the data is collected is given, followed by a description of the way the data is measured.
Finally, the method of data analysis is described.
4.1 Research design
As mentioned previously, the objective of this research is to create an understanding of how
social media affect customer loyalty to tour operators, by investigating the complex online
relationships they have with their clients. Therefore, literature on customer loyalty was
reviewed to design a research model. This is the exploratory part of the research. The
explanatory part will take place when the model is tested statistically, using hypotheses that
are associated with the theoretical model. These hypotheses propose causal relationships
between the different variables that eventually lead to loyalty to the tour operator.
4.2 Data collection
The study population consists of those customers of tour operators who have developed a
relationship with their tour operator through social media. Despite of the fact that travel
agents are also recommended to use social media, only tour operators were included in this
research to demarcate the field of research. It is expected that online bookers are more and
more purchasing their holidays directly with tour operators. In addition, travel agents their
clients are often more located locally, which differs from tour operators’ customer base. To
give insights into the research questions stated previously, the focus of this study lies on
customers posting messages or liking posts of their tour operator on Facebook. Solely
Facebook was used as the sampling frame because of two reasons. The first one is that
Facebook has more than 800 million active users worldwide (Facebook, 2011), which makes

32
this medium one of the most popular social networking sites. Its popularity is still increasing
today. Many marketers integrated a Facebook page into their social media marketing
strategy, whether it is to e.g. create awareness, provide service to customers, stimulate
sales and search presence or to foster customer loyalty. Facebook is very useful in targeting
the audience. It allows marketers to provide customers all the information needed, instead of
giving customers a quick update as is possible using Twitter (Zarella & Zarella, 2011).
Ellison et al. (2007) confirm this by arguing that the heavy usage patterns and technological
capacities of Facebook make this social medium interesting. Yet another reason to choose
for Facebook as a sampling frame, comes with a practical motivation. Just as for marketers,
it is easy for a researcher to approach the target group through Facebook because of its
high visibility.
To test the hypotheses of this research, this study employed a survey. The reason for this is
that many respondents are needed to validate the conceptual model and it is impossible to
interview each individual personally. In addition, the research question is descriptive and
there were several variables to be tested. Given these criteria, a survey would be appropriate
according to Vennix (2007). Since this study is about social media, the survey was sent out
online and more specifically to Facebook users who post messages or like posts of their tour
operator. The sampling frame was categorized by 39 different tour operators having a
Facebook page where they post messages frequently. Out of these Facebook pages,
individuals have been selected randomly and proportionally. Proportionally means that on
each Facebook page the same amount of people has been approached in order to attract an
equal variety in types of travelers. Both Dutch and Belgian Facebook users were selected to
increase the volume of potential respondents. Though there are more Dutch Facebook
pages than Belgian ones, there are also Belgian people liking Dutch tour operators and vice

33
versa. Where possible, both Dutch and Belgian pages of the same international tour
operators are included. In order to be able to generalize the results, the aim of this study is to
cover a heterogeneous set of consumers by including two nationalities and a wide variety of
tour operators.
The sample size required for the technique used in this study is approximately 110-165
respondents, since there are 11 latent variables (wherefore 10 times more respondents are
needed to conduct factor analysis (Wijnen, 2002) and 15 times more respondents are
needed to conduct Structural Equation Modeling (Stevens, 1996). Beforehand, a low
response rate was expected because of the unfamiliarity of the target group with the
researcher. Therefore, people their willingness to participate was tested by asking a few
potential respondents for their collaboration. This resulted in a response rate of 12.5%.
4.2 Measurement
50 items were used to capture the various constructs of the conceptual model. Table 16 in
appendix 1 presents the items used. All of these items are based on existing literature and
may be somewhat adjusted to the context of this study. The survey contained Likert Scales
from 1 to 7 (totally disagree – totally agree). The literature on which the items are based are
presented in tables 6 to 15 in appendix 1.
4.3 Data analysis
To understand the complex relationship between social media and customer loyalty, the
theoretical model of this research includes multiple observed variables. Structural Equation
Modeling is a suitable method to (dis-)confirm comprehensive theoretical models such as the
proposed one here, while basic statistical methods are not capable of testing complex
phenomena. As SEM techniques explicitly take measurement errors into account, validity

34
and reliability are greatly recognized (Schumacker & Lomax, 2004). For conducting this
analysis, the programs ‘SPSS’ and ‘AMOS’ were used. The performance of the analysis is
structured corresponding to Mulaik and Millsap (2000) “four-step” modeling approach,
including factor analysis and structural model testing.
Before testing the model, the data gathered needed to be examined. There was no need for
missing value analysis, because each question was mandatory to fill in and incomplete
response could not be resolved. Since Structural Equation Modeling is a multivariate
regression technique (Hair, 2010, p.641), the data were tested on the assumptions for
performing multivariate analysis. These assumptions include normality, linearity,
homoscedasticity and independence of error terms (Hair, 2010, p.182). Another important
assumption for regression analysis that will be tested is no multicollinearity (Field, 2006,
p.170).

35
5. Results
This section represents the results of this study. Out of 2594 people who were asked to fill in
the questionnaire, 11.22% responded. However, nearly half of these respondents did not
complete the survey which led to a sample size of 157 respondents. No missing value
analysis was conducted, because all incomplete response contained too many missing
values. Furthermore, all tour operators were equally represented. Table 1 shows the general
sample details. 36.3% people out of the sample size were male, 63.7% were female. In
terms of nationality, 28.0% are Belgian, 70.7% are Dutch and 1.3% have another nationality.
The majority of the respondents are married and have higher education.
Table 1: General sample details
Consumers # %
Total 157 100
Gender
Male
Female
57
100
36.3
63.7
Nationality
Belgian
Dutch
Other
44
111
2
28.0
70.7
1.3
Education
None
Primary education
Lower secondary education
Higher secondary education
Higher education (without the University)
University
I would rather not say
1
1
19
50
58
25
3
0.6
0.6
12.1
31.8
36.9
15.9
1.9

36
General sample details (continued)
Consumers # %
Domesticities
I live with my parents / grandparents
I live independent
I live independently with child(ren)
I am married / living together without children
I am married / living together with children
I am married / living together, children left home
Other
28
33
3
39
34
16
4
17.8
21.0
1.9
24.8
21.7
10.2
2.5
Source: own findings
This chapter begins with checking the assumptions for multivariate analysis. After that, this
section is structured based on the way the theoretical model is tested. Corresponding to
Mulaik and Millsap (2000), the conceptual model was tested using a four-step modeling
approach:
1. Exploratory factor analysis to determine the number of latent variables;
2. Confirmatory analysis to approve the measurement model;
3. Structural equation modeling to test hypothesized relationships between latent
variables;
4. Nested structural models testing to find the best fitting model.
The first step was performed in SPSS 17.0, while the other steps were carried out in AMOS
20.0.
5.1 Checking assumptions
As stated in §4.3, the data was tested on the assumptions of multivariate analysis, including
normality, linearity, homoscedasticity, independence of error terms and no multicollinearity.
The first assumption to test is the assumption of normality. SEM requires a multivariate
normal distribution, which implies a univariate normal distribution for each variable and a

37
bivariate normal distribution between pairs of variables (Gao et al., 2008). Normality of
multivariate distribution was tested using AMOS by checking Mardia’s coefficient of
multivariate kurtosis and the squared Mahalanobis distance. The critical ratio of Mardia’s
coefficient proved to be equal to 18.917, which indicates significant non-normality since this
value must be below the critical ratio of 1.96. Furthermore, higher values of the squared
Mahalanobis distance indicate larger differences between observations and the centroid
under normal distributed conditions. Therefore, these values are a sign of outliers influencing
non-multivariate normality and indicate that in these data 100 observations proved to be too
far from the centroid (Sharma, 1996). Univariate normality of the data was tested using the
Kolmogorov-Smirnov test and the Shapiro-Wilk test in SPSS. According to Field (2006),
histograms tell little about whether a distribution is close enough to normality and values of
skewness and kurtosis give only information about specific aspects of normality. The
Kolmogorov-Smirnov test is a more objective test to decide whether a distribution is normal
or not and is suitable for small sample sizes (Field, 2006, p.93). Unfortunately, nearly all
variables proved to be significantly non-normal according to both tests (<.05) as can be seen
in appendix 2. In order to meet the condition of normality, transformations to the raw data
were attempted, however without any improvements.
Second, the assumption of linearity was tested. Appendix 2 shows scatter plots of all the
hypothesized relationships. An interpretation of these scatter plots indicates that all
relationships are linear.
Furthermore, outliers shown by the scatter plots give reasons to assume that the third
assumption of homoscedasticity has been violated, so this was tested using Levene’s test
(Hair, 2010). As can be seen in appendix 2, only 10 relationships show homoscedasticity and
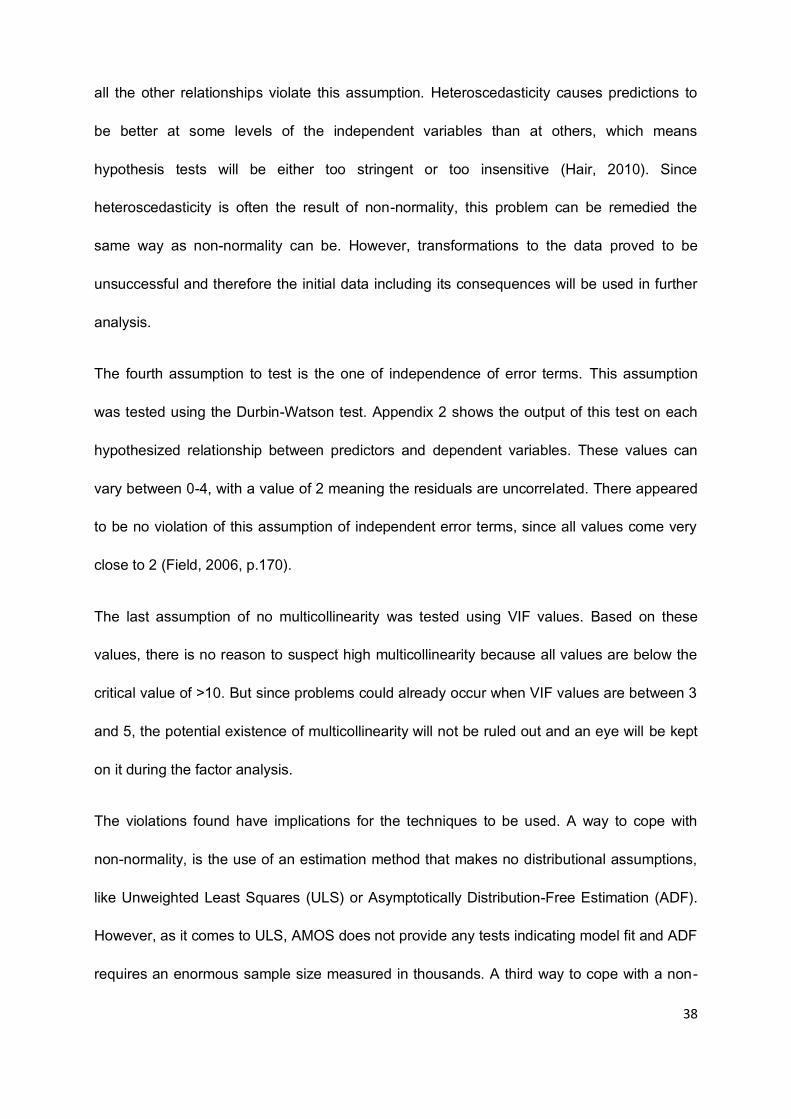
38
all the other relationships violate this assumption. Heteroscedasticity causes predictions to
be better at some levels of the independent variables than at others, which means
hypothesis tests will be either too stringent or too insensitive (Hair, 2010). Since
heteroscedasticity is often the result of non-normality, this problem can be remedied the
same way as non-normality can be. However, transformations to the data proved to be
unsuccessful and therefore the initial data including its consequences will be used in further
analysis.
The fourth assumption to test is the one of independence of error terms. This assumption
was tested using the Durbin-Watson test. Appendix 2 shows the output of this test on each
hypothesized relationship between predictors and dependent variables. These values can
vary between 0-4, with a value of 2 meaning the residuals are uncorrelated. There appeared
to be no violation of this assumption of independent error terms, since all values come very
close to 2 (Field, 2006, p.170).
The last assumption of no multicollinearity was tested using VIF values. Based on these
values, there is no reason to suspect high multicollinearity because all values are below the
critical value of >10. But since problems could already occur when VIF values are between 3
and 5, the potential existence of multicollinearity will not be ruled out and an eye will be kept
on it during the factor analysis.
The violations found have implications for the techniques to be used. A way to cope with
non-normality, is the use of an estimation method that makes no distributional assumptions,
like Unweighted Least Squares (ULS) or Asymptotically Distribution-Free Estimation (ADF).
However, as it comes to ULS, AMOS does not provide any tests indicating model fit and ADF
requires an enormous sample size measured in thousands. A third way to cope with a non-

39
normal distribution, is to use robust statistics along with Generalized Least Squares or
Maximum Likelihood, but robust statistics are unavailable in AMOS. A method which seems
more appropriate is bootstrapping (Blunch, 2008, p.225). Bootstrapping forms also a solution
to small sample sizes, as in this study (Davison & Hinkley, 1997). With bootstrapping the
sample is considered to be the population, out of which new samples with replacement are
taken. From each of these samples, the required sample statistics are calculated which gives
an empirical sampling distribution with estimates of the parameters and empirical standard
errors (Blunch, 2008).
Now that there is a solution to the violation of the assumption of normality, it is time to move
on to the actual analysis. A solution to the heteroscedastic data has not been found, which
must be kept in mind with the results of the hypothesis testing.
5.2 Exploratory factor analysis
With Exploratory Factor Analysis, it is possible to identify different latent variables. To
determine whether the proposed indicators measure only one underlying construct, the
Principal Component Analysis was used. Kaiser-Meyer-Olkin measure of sampling adequacy
tests if correlation patterns are diffused (KMO=0) or compact (KMO=1) and indicated that all
variables show good (.7 ≥ KMO ≥ .8) or even great (.8 ≥ KMO ≥ .9) values (Field, 2006,
p.650), which means it accepts the use of factor analysis on the data. Bartlett’s test of
sphericity showed great significance for all variables (p=.000) indicating that items are highly
correlated with each other, which is necessary for factor analysis to work (Field, 2006,
p.652). Furthermore, most communality values (>.50) indicate that items show sufficient
explanation (Hair, 2010, p.119), except for two items measuring Social and “confidence
benefits”. To determine visually if data have only one underlying factor, scree plots can be
viewed. All curves have a distinctive bend after the first component, which means that there

40
is only one component the items are measuring (Field, 2006, p.633; Blunch, 2008, p.54).
That all items are measuring just one factor, can also be seen in the component matrix which
shows only 1 component. The total variance explained is for most cases well above the
preferred 60% and each variable shows just one eigenvalue above the critical value >1.0.
These findings are based on the output shown in appendix 3 and indicate that the 11
proposed latent variables will be retained, because all items are uni-dimensional.
When using factor analysis to validate a questionnaire, as in this study, it is useful to check
the reliability of the scales (Field, 2006). The full useful data collection (n=157) was tested to
check if the scales are reliable. For this, Cronbach’s Alpha was used, of which its value is
good when it is around .800 (Field, 2006, p.676). As shown in appendix 3, all measurement
scales show high reliability. All of them exceed the value of .800 and half of them even .900.
Next to this, each item correlates well with the scale overall since all these correlations are
above .300 (Field, 2006, p.672). Despite of the unsufficient explanation of two items as found
during the Principal Component Analysis, all items will be retained in further analysis
because deletion of items would not result in substantial higher values of Cronbach’s alpha.
5.3 Confirmatory factor analysis
Using Confirmatory Factor Analysis, relations of the manifest indicators to the latent variables
are tested. If there is an acceptable fit of the measurement model, it is possible to move on to
step 3 in which the structural model will be tested (Mulaik & Millsap, 2000).
In this study, 2000 bootstrap samples were taken because of the model complexity. Simpler
models (e.g. Arbuckle, 2011, p.296), require smaller sample sizes (Hair, 2010, p.661). This
bootstrap method was combined with the Maximum Likelihood method, which is the most
preferred (Blunch, 2008, p.81) and the most common SEM estimation procedure providing

41
valid and stable results (Hair, 2010, p.661). Normally the Maximum Likelihood estimation
method requires normal distribution (Blunch, 2008), but this problem was dealt with using
bootstrapping (Bollen, 1989).
Once the proposed model has been estimated, theory and reality must be compared by
assessing model fit which indicates the similarity of the estimated covariance matrix (theory)
to the observed covariance matrix (reality) (Hair, 2010). Bollen & Stine (1992) showed that
the bootstrap generally used is inappropriate for assessing model fit, wherefore they
introduced a modified method called the Bollen-Stine bootstrap. Several model fit indices
exist. To test the overall model fit, Bollen-Stine bootstrap provides a p-value which need to
exceed .05 in order to accept the model. With p=.001 for the initial model, the measurement
model is rejected. Furthermore, χ2 had a value of 2391.959 and df=1145. Hooper et al.
(2008) have reviewed other researchers and their recommendations for model fit indices to
report and concluded that, next to χ2, it is sensible to report the RMSEA, the SRMR, the CFI
and the PNFI. Table 2 shows the acceptable threshold levels of these model fit indices.
Rejection of the model was supported by the following values: RMSEA=.084; SRMR=.266;
CFI=.826; and, PNFI=.669. Though, RMSEA and PNFI are close to what it is supposed to be
in order to accept the model. However, it is not uncommon to find a poor fit of the proposed
model (Hooper et al., 2008).
Table 2: Fit indices and their acceptable threshold levels
Fit index Acceptable Threshold Levels Reference
Bollen-Stine Bootstrap p >.05 Bollen & Stine (1992)
RMSEA Value < .07 Hooper et al. (2008)
SRMR Value < .08 Hooper et al. (2008)
CFI Value > .95 Hooper et al. (2008)
PNFI Value > .70 Gursoy & Rutherford (2004)

42
In order to improve model fit, items could be deleted if they show regression weights below .2
(Hooper et al., 2008). Since all items have significantly high factor weights (see appendix 4),
no items had to be deleted and an alternative solution must be found to solve the poor model
fit. A second way to improve model fit, is to look if there are any latent variables which have a
relatively high covariance and combine these two into one factor (Hooper et al., 2008).
Although VIF values did not denote high collinearity, this seemed the case for the
“relationship commitment” and “customer loyalty” variables after performing a second
Principal Component Analysis. The items of “relationship commitment” and “customer
loyalty” seem to be unidimensional as shown by the SPSS output in appendix 4. Taking a
closer look at the items of both initial variables, a logical reasoning corresponds with the
aggregation of those two. Reliability was checked again and Cronbach’s alpha showed a
value of .957, which is even better than the two latent variables separately. There was no
need to delete any items, because Cronbach’s alpha could not be improved. χ2 increased to
2548.810 and df is now equal to 1147, with p=.000. Other model fit indices have the following
values: RMSEA=.089; SRMR=.2656; CFI=.805; and, PNFI=.652. This means that there is no
improvement in model fit due when combining “relationship commitment” and “customer
loyalty”.
Although the Durbin-Watson test denoted independence of errors, covarying error terms
could improve model fit (Hooper et al., 2008). According to Jöreskog & Long (1993, cited in
Hooper et al., 2008, p.56), covarying error terms requires a strong theoretical justification,
which is easier to find within the same specific factor than across different factors (Hooper et
al., 2008). Therefore, a couple of error terms of items within the same factor were covaried in
order to try to improve the model fit, using modification indices. Error terms of items with a
relatively high modification index and sufficient theoretical justification were covaried. These

43
included 22 error terms in total. There were two other relatively high modification indices for
error terms, however these were not covaried in AMOS since there is not sufficient
theoretical justification through logical reasoning. Appendix 4 shows which error terms were
covaried including a theoretical justification.
Covarying all these items, did improve the model fit, but unfortunately not enough in order to
accept the measurement model. χ2 decreased to 2223.081 and df is now equal to 1125, with
p=.002. Tabachnick and Fidell (1996) state that reasonable results for other indices approve
continuation of working with the proposed model, despite of a non-significant χ2. Other model
fit indices have following values: RMSEA=.079; SRMR=.2656; CFI=.847; and, PNFI=.675.
These values are still not great, but there is more potential to improve model fit.
The measurement model has been respecified now in order to try to validate the latent
variable constructs. Relationships between these variables were tested in the next
paragraph.
5.4 Structural Equation Modeling
During this third step, the entire model was tested on path significance. Out of a second
Principal Component analysis, it was concluded that the items of the latent variable
“relationship commitment” proved to measure the same underlying factor as the items of
“customer loyalty” did. These variables were taken together as one factor called “customer
loyalty” in further analysis. By interpreting the items the term “customer loyalty” was chosen
to be retained and also because this study is about the influence of social media on customer
loyalty. Each hypothesis related to “relationship commitment” has been adjusted to the
combined latent variable “customer loyalty”, in order to get insight in the entire model.

44
Out of an initial Maximum Likelihood estimation in combination with bootstrapping, it can be
concluded that model fit has improved, but still not enough. Chi-square shows a non-
significant value (χ2=1988.624, df=1120, p=.010) and the model fit indices support this non-
significance with values of .071 for RMSEA, .0835 for SRMR, .879 for CFI and .698 for PNFI.
Still, RMSEA, SRMR and PNFI are very close to the threshold levels of these indices.
However, there is potential to improve model fit during step 4.
With the proposed model, only a few significant paths were found at a confidence interval of
95 percent. As the p-values in appendix 5 show, 7 latent variables proved to have a
significant effect (p≤.05) on another latent variable. Significance was found for hypothesis 6,
supporting the effect of “customer satisfaction” on “customer loyalty”. Next to “customer
satisfaction”, also “social benefits” proved to have a significant effect on “customer loyalty”
which means hypothesis 1c is accepted. Moreover, hedonic benefits proved to affect
“customer e-satisfaction” which leads to an acceptance of hypothesis 5a. A significant effect
of these benefits on “customer e-loyalty” was nearly found, however hypothesis 5b could not
be accepted (p=.056). Next, support was found for hypothesis 8, since the regression weight
for “customer e-satisfaction” in the prediction of “customer satisfaction” is significantly
different from zero at even a .001 probability level. Furthermore, hypothesis 9 is supported,
accepting a significant effect of “customer e-loyalty” on “customer loyalty”. “word of mouth”
was found to be significantly affected by “customer satisfaction” as well as by “customer
loyalty”, whereby hypothesis 13 and 15 are accepted.
5.5 Nested Structural Models
In this last section, a series of nested structural models were tested to find the best fitting
model. For this, the specification search tool in Amos was used. A total of 182 different
models was tested next to the saturated model. All these models were compared using BCC

45
and BIC values; model fit indices provided by the specification search tool in AMOS
(Arbuckle, 2011). Table 3 and 4 show how BCC and BIC values should be interpreted.
Table 3: Interpretation of BCC values
BCC Burnham and Anderson (1998) interpretation
0-2 There is no credible evidence that the model should be ruled out as
being the actual best model for the population of possible samples.
2-4 There is weak evidence that the model is not the best model.
4-7 There is definite evidence that the model is not the best model.
7-10 There is strong evidence that the model is not the best model.
>10 There is very strong evidence that the model is not the best model.
Table 4: Interpretation of BIC values
BIC Raftery (1995) interpretation
0-2 There is weak evidence against a competing model
2-6 There is positive evidence against a competing model
6-10 There is strong evidence against a competing model
>10 There is very strong evidence against a competing model
As can be seen in appendix 6, BCC as well as BIC put model 32 forward as the best fitting
model. However, an interpretation of the BCC values indicate that several other models (with
a BCC value between 0-2) should not be ruled out (Burnham & Anderson, 1998). This means
that 15 other models are also candidates in the competition of the best fitting model. Out of
an interpretation of the BIC values it can be concluded that BIC values between 0-2 have the
highest approximate posterior probability. According to Raftery (1995), this means there is
weak evidence for model 32 against model 22, but positive evidence against 25 other
models. The 15 models which were still in the running according to the BCC value, are now
dismissed by an interpretation of their BIC value. The second and only other model having a
BIC value between 0 and 2, was not indicated as one of the best fitting models by the BCC

46
index and therefore dismissed as well. Another indication for the best fitting model is the
value of C/df. C/df indicates that model 62 (C/df=1.764) is the best fitting model, however this
model did not appear in the list of best fitting models according to BCC and BIC. An
interpretation of the BIC value (7.149) of model 62 declares strong evidence against this
model (Raftery, 1995). Besides, the C/df values for all models are very close to each other.
According to Arbuckle (2011), the overall best fitting model must be included in the short list;
a function provided by the specification search tool in AMOS which shows the best model for
different parameters. This is the case for model 32, as it is displayed here (see appendix 6).
Most other potential best fitting models indicated by the BCC are not in this short list, which is
another reason to exclude these models. Using the plot function in the specification search
tool, no models could be found with an acceptable value of CFI (≥.95) or NFI (≥.90)
(Arbuckle, 2011). Given these criteria, model 32 is chosen as the best fitting model and
shown by figure 4.
The final model is now as good as it gets. Model fit improved, but unfortunately not enough
according to Bollen-Stine bootstrap (χ2=1999.957, df=1132, p=.015). Though model fit index
CFI has improved compared to its value of the proposed model, it still supports poor fit for
the final model (.879). On the other side, RMSEA (.070) and PNFI (.704) show acceptable
model fit values. SRMR improved extremely and has almost an acceptable value (.0827).

47
Figure 4: Final model
Source: own findings
5.6 Hypotheses testing
Table 5 shows the significant paths found by the best fitting model. Different from the original
SEM, 11 hypotheses have received support instead of 6. Almost all variables show a positive
influence on “customer loyalty”, either directly or indirectly. Appendix 6 shows the indirect
effects that were found.
Significance was found for the effect “social benefits” have on “customer e-loyalty” (H1b) and
“customer loyalty” (H1c). The social aspect of the relationship through social media
perceived by customers is positively associated with loyalty to the organization operating
online and even stronger with loyalty to the tour operator offline. If customers like their feeling
of a strong bond with their tour operator through social media, they will have a favorable

48
attitude toward the organization manifested in repeat buying behavior. No significant effect
was found for the relationship between “social benefits” and “customer e-satisfaction”. The
enjoyment of having a close relationship with a tour operator through social media, does not
have a significant effect on customers’ contentment with the tour operator through social
media. As noted in §3.1, contradictions about this relationship exist and the non-significance
found here corresponds to the findings of Hennig-Thurau et al. (2002). Furthermore, an
indirect effect of “social benefits” on “word of mouth” has been found. Therefore, a sense of
some sort of bond with a tour operator through social media positively affects the informal
communication with other customers.
Table 5: Significant direct effects found by the final model
Hypothesis Path
coefficients
S.E. P-value
H1b Customer e-Loyalty Social Benefits .228 .087 .009
H1c Customer Loyalty Social Benefits .434 .099 ***
H2a Customer e-Satisfaction Confidence
Benefits
.398 .072 ***
H3c Customer Loyalty Functional Benefits -.588 .152 ***
H5a Customer e-Satisfaction Hedonic Benefits .458 .091 ***
H6 Customer Loyalty Customer Satisfaction .525 .096 ***
H8 Customer Satisfaction Customer e-
Satisfaction
.757 .111 ***
H9 Customer Loyalty Customer e-Loyalty .410 .094 ***
H10 Customer e-Loyalty Customer e-
Satisfaction
1.076 .148 ***
H13 Word of Mouth Customer Loyalty .294 .059 ***
H15 Word of Mouth Customer Satisfaction .848 .099 ***
Source: own findings

49
As it comes to “confidence benefits” only support was found for hypothesis 2a, stating
“confidence benefits” have a significant effect on “customer e-satisfaction”. A feeling of trust
and confidence with respect to a tour operator creates contentment with the organization
operating in the online environment. No significant influence of “confidence benefits” on
“customer e-loyalty” and “customer loyalty” was found, which contradicts with existing
literature. Most researchers also found significance for the effect on “relationship
commitment”, which was combined with “customer loyalty” during the analysis of this study.
The results here are more corresponding to what Hennig-Thurau et al. (2002) have found; an
indirect effect of “confidence benefits” on “customer e-loyalty” and “customer loyalty”.
“confidence benefits” also proved to have a significant indirect effect on “word of mouth”.
When customers trust their tour operator operating in an online environment, they are
intended to be positive about the organization toward other consumers. Satisfaction and
loyalty, online as well as offline, proved to be mediating this effect.
Next, a remarkably significant effect of “functional benefits” has been found. It turned out that
“functional benefits” have only a direct effect on “customer loyalty” to the tour operator, which
is also negative. This means none of the hypotheses related to “functional benefits” were
accepted, not even hypothesis H3c since this relationship turned out to be negative instead
of positive. Customers who are looking for information in their decision making process and
who find the information they need through social media, did not appear to be loyal to the
tour operator. This finding matches to what has been stated in the introduction, about the
Internet increasing competition because of the greater access to new and more products.
The information provided by tour operators through social media enable consumers to
compare several organizations, which makes it more challenging for the tour operator to
make these customers loyal. Moreover, it slightly affects “word of mouth” indirectly in a

50
negative way. People who search for information which helps in their decision making, are
not only being able to compare but are also intended to share these comparisons with
others. On the other hand, customers who are not focused on information gathering show
more loyalty. These are the type of customers who are satisfied with their tour operator and
who are not interested in what the offerings are elsewhere. They are not intended to search
online for information that helps in their decision making process, because they feel
comfortable with the organization they always go to. No significant effects of “functional
benefits” on “customer e-satisfaction” and “customer e-loyalty” were found though. This
corresponds to the findings of Wang & Fesenmaier (2004), who stated that “functional
benefits” and level of participation in an online travel community are not positively related.
The provided information by tour operators through social media is not the reason why
customers are likely to get satisfied and does not encourage them to make use of the online
relationship on a regularly basis.
None of the hypothesized relationships regarding “special treatment benefits” proved to be
significant, which corresponds to the findings of Chang & Yen (2007) and Hennig-Thurau et
al. (2002). It appears that these benefits do not positively influence people their contentment
or loyalty toward a specific tour operator, neither online or offline. People who are looking for
special deals when it comes to their holidays, are very sensitive to price breaks, faster
service and individualized additional service. It could be that they find their special deal at
one tour operator this year, but when next year another tour operator offers a better special
deal they go to this other organization. For a tour operator it is very hard to make these
customers loyal, because these customers will search for the best deal every time they are
planning to book a holiday and they do not mind with whatever organization this holiday may
be.

51
“Hedonic benefits” showed a significant direct effect on “customer e-satisfaction” (H5a). The
pleasure found in the relationship with a tour operator through social media positively
influences customers’ satisfaction with the specific organization operating in the online
environment. Significant indirect effects have been found of this type of benefits on
“customer e-loyalty”, “customer satisfaction”, “customer loyalty” and “word of mouth”. The
enjoyment of the relationship with a tour operator through social media proves to be an
indication of contentment and for a favorable attitude toward the organization expressed in
repeat buying behavior and favorable informal communication with others. This connects to
the findings of Wang & Fesenmaier (2004), who found little support for a positive relationship
between “hedonic benefits” and level of participation in an online travel community.
“Customer satisfaction” appeared to have a positive effect on “customer loyalty” (H6). Even
stronger support was found for this relationship in an online context (H10). Customers who
are satisfied with their tour operator are likely to make use of the service of the organization
repeatedly. “customer e-satisfaction” is also positively associated with “customer satisfaction”
(H8), which suggests that contentment with the relationship with a tour operator in an online
environment fosters the contentment with the relationship with the organization overall. A
less strong, but still significant, influence have been found regarding loyalty. “customer e-
loyalty” proved to be positively associated with “customer loyalty” (H9), which means that the
attitude toward the online service of a tour operator positively influences the attitude toward
the tour operator overall. Indirectly, “customer e-satisfaction” has also a strong significant
effect on “customer loyalty”. If a customer’s prior online experience with a tour operator has
been satisfying, the customer is likely to have a favorable attitude toward the organization
with “customer e-loyalty” and “customer satisfaction” mediating this effect. There is also a
strong significant effect of “customer e-satisfaction” (indirectly) and “customer satisfaction”

52
(directly) on “word of mouth” (H15). People who are content with their relationship with their
tour operator, either online or offline, are likely to spread favorable “word of mouth”. This is
also the case for loyal customers, as significance have been found for the positive
relationship between “customer loyalty” and “word of mouth” (H13). However, satisfied
customers are 3 times more likely to spread favorable “word of mouth” than loyal customers
are. These findings correspond to the literature, except for the relationship between
“customer e-satisfaction” and “word of mouth”.

53
6. Conclusion
In this last section, conclusions are made based on the empirical findings in this study. These
findings helped in answering the research question stated in the introduction. The research
question was as follows:
In what way and to what extent do relational benefits of social media have an impact on
customer loyalty toward a specific tour operator?
Many studies have shown the importance of relational benefits influencing customer loyalty.
This study provides additional evidence for the role relational benefits play in an online
context, more specifically in a rather new context of social media. Relational benefits have
been applied mostly in face-to-face encounters, however the results prove that the relational
benefits approach remains relevant in a context of social media where personal encounters
are re-introduced.
The results of this study show that social benefits of a relationship with a tour operator
through social media are directly affecting customer loyalty in a positive manner. Customers
who like their strong bond with their tour operator through social media, are likely to have a
favorable attitude toward the organization expressed in repeat bookings. These customers
have the feeling that they have created a friendship and feel personally recognized by their
tour operator. Those sort of feelings prove to be the most important for customers in order to
value their relationship resulting in repeat bookings. An even stronger direct effect found was
the effect of functional benefits on customer loyalty. However, this effect turned out to be
negative, meaning that the provided information through social media enables consumers to
compare different organizations because of the greater access to new and more products. In
addition, people who search for information which helps in their decision making, are not only

54
being able to compare but are also intended to share these comparisons with others.
Customers’ access to more information makes relationship marketing challenging for an
organization due to increasing competition. On the other hand there are customers who
show more loyalty because they are less focused on information gathering. These people are
less interested in offerings elsewhere, because they are satisfied with the tour operator they
always go to. It turns out that customers are not encouraged to become loyal due to the
information tour operators are providing through social media. Confidence and hedonic
benefits only show an indirect effect on customer loyalty. A feeling of trust and confidence
with respect to a tour operator creates loyalty through satisfaction with the organization.
When someone trusts the information and intentions of a tour operator, he or she will
become satisfied about the tour operator’s service on social media, but he or she will not
become loyal immediately. So does the enjoyment of the online relationship with the tour
operator have an indirect effect through satisfaction, of which its influence is even slightly
stronger. The joy the online relationship brings, is a great determinant for customers’
satisfaction with their online relationship. And even though it influences customer loyalty not
directly, it does have the second greatest positive effect on customer loyalty but in an indirect
manner. Special treatment benefits appeared to have no influence on customer loyalty at all.
Customers who are looking for special deals are very sensitive to price breaks, faster service
and individualized service. These type of customers will search for the best deal every time
they are planning to book a holiday, regardless which tour operator offers the deal. Therefore
it is very hard for tour operators to drive these customers to become loyal.
In summary, the results of this study advocate that people are increasingly comparing offers
online with the advent of social media. Tour operators provide all the information themselves,
on which customers base their decisions when it comes to their holidays. But providing

55
information seems not the way to make customers loyal. On the other side, if a tour operator
does not provide information and competitors do, customers are not able to compare with
this specific tour operator which drives the organization out of the competition. Beside the
fact that customers are driven by gathering information online, they are also very deal-
oriented and special deals are quite easy to compare since practically all tour operators offer
price breaks or contests through social media. Providing information and special deals are
therefore not the way to go when fostering customer loyalty is the ultimate goal. Tour
operators are better off with intensifying their personal relationships with their clients, by
making them feel personally recognized and creating an online friendship. Moreover, the
online relationship should be fun for customers to have. Therefore, tour operators must focus
on triggering customers’ interest and they must attempt to delight their customers.

56
Limitations and Suggestions for Further Research
This research contains some limitations, which need to be kept in mind while drawing
conclusions. Also suggestions for further research will be proposed in this section.
First of all, only Facebook has been used as a sampling frame, while there are many other
social media not included in this study. Although Facebook was chosen through valid
reasoning, drawing accurate conclusions about the effect of social media on customer loyalty
toward a tour operator may require investigating other social media as well. A similar
research including several types of social media could be a suggestion for further research.
Second, social media are assumed to have other effects beside those on customer loyalty.
For example, special treatment benefits proved to have no influence on loyalty to the tour
operator, however it may have an effect on brand awareness. There were a few respondents
who commented that they did not belong to the target group, because they only participated
in an online relationship because of their chance to win a free holiday and that they had not
been on vacation with the specific tour operator before. In this case, the tour operator had
succeeded in attracting those customers by offering a contest. Therefore, the potential
special deals have should not be underestimated, but this study made clear that its potential
does not lie in stimulating customer loyalty. A suggestion for further research could be the
application of the relational benefits approach in the context of social media measuring other
marketing goals not included here.
Third, the model was only tested in a context regarding tour operators. However, the effect of
social media on customer loyalty is not only interesting for tour operators, but also for travel
agents who are also recommended by professional experts to use social media. Moreover,

57
other industries may also benefit from research on the effect social media have on customer
loyalty. Therefore, another suggestion for further research could be an application of the
theoretical model in the context of travel agents and other sectors. If other researchers would
find the same results, this could be additional justification of the results of this research.
Finally, the best fitting model did not give acceptable values for all model fit indices. Which
implies that the final model cannot be accepted. The poor model fit could be a consequence
of the small sample size used. Luckily this does not mean individual paths cannot be looked
at, but it must be noted that the data were heteroscedastic and that this could cause
problems in hypotheses testing. A suggestion for further research could be to investigate the
relationships with a larger sample size, to see if a better fitting model can be achieved.

58
Theoretical and Managerial Implications
Vogt (2011) evokes researchers to do more research in the field of customer relationship
management. In practice, customer relationship management is widely used in the tourism
industry, however little research is done with regard to this growing field. Vogt claims that a
greater understanding of customer loyalty and CRM programs used as a relational tool in
social networks, will become more important. This study meets the demand for this specific
CRM research in relation to the tourism industry, as it focuses on the use of social media in
fostering customer loyalty. Furthermore, although the use of the relational benefits approach
has been applied in an online context before, it is rather new in the environment of social
media as argued in §2.3.6.
From a managerial perspective, it is interesting to see where causal relationships lie between
relational benefits and customer loyalty. This in order to explore which relational benefits
have potential in fostering customer loyalty and therefore need special attention by
marketers, since customer loyalty is the primary goal of customer relationship management.
The results of this study show that tour operators should intensify their personal relationships
with their clients, by making them feel personally recognized and creating an online
friendship. The online social bond proved to be the most important factor influencing
customer loyalty. The second most important factor seemed to be the enjoyment of having
an online relationship with a tour operator, which demands tour operators to focus on
triggering customers’ interest and to attempt to bring pleasure to their customers through
social media. Customers’ trust also proved to be influencing customer loyalty, so tour
operators must attempt to reduce the anxiety of customers by communicating their reliability
as well. Just to mention an example, customers can rely on their tour operator when these

59
take care of them in emergency situations. Providing information and special deals did not
prove to stimulate customer loyalty and should be less focused on when the aim of tour
operators is to make their customers loyal. But as stated in the previous chapter, one could
expect special deals to have an effect on brand awareness, which means that special deals
could be worth something. And so does providing information. Tour operators must give
customers the chance to compare their service with competitors’ service. Customers are
likely to make decisions based on the information they are being offered. However, the
personal relationship that tour operators can build with their clients though social media, in
order to increase loyalty, will insulate those customers from the competition at the same time.

60
Acknowledgements
I would like to thank those who have guided me through the process of writing this Master’s
thesis. First of all I would like to thank my promoter, Prof. Dr. Robert Govers, for his quick
response at all times and the feedback, support and suggestions he has given me the past
months. Next to him, I owe many thanks to Ph.D. student Bart Neuts, who always brought
me in the right direction when having trouble during the analysis.

61
References
Anderson, E. W. (1998). Customer Satisfaction and Word of Mouth. Journal of Service
Research, 1(1), 5-17.
Anderson, R. E. & Srinivasan, S. S. (2003). E-Satisfaction and e-Loyalty: A Contingency
Framework. Psychology and Marketing, 20(2), 123-138.
Arbuckle, J. L. (2011). IBM® SPSS® Amos™ 20 User’s Guide. Retrieved 01/25/2011 from
ftp://ftp.software.ibm.com/software/analytics/spss/documentation/amos/20.0/en/Manu
als/IBM_SPSS_Amos_User_Guide.pdf
Beatson, A. Lings, I. & Gudergan, S. (2008). Employee Behavior and Relationship Quality:
Impact on Customers. The Service Industries Journal, 28(2), 211-223.
Benner, J. (2009). The Airline Customer Loyalty Model - A relational approach to
understanding antecedents of customer loyalty in the airline industry. Unpublished
Master’s thesis, Copenhagen Business School.
Berry, L. L., Parasuraman, A. & Zeithaml, V. A. (1991). Understanding Customer
Expectations of Service. Sloan Management Review, 32(3), 39-48.
Blunch, N. J. (2008). Introduction to Structural Equation Modeling using SPSS and AMOS.
London, UK: SAGE Publications Ltd.
Bollen, K. A. (1989). Structural Equations with Latent Variables. NY, USA: Wiley.
Bollen, K. A. & Stine, R. A. (1992). Bootstrapping Goodness-of-Fit Measures in Structural
Equation Models. Sociological Methods Research, 21(2), 205-229.
Burnham, K. P., and D. R. Anderson (1998). Model selection and inference: A practical
information-theoretic approach. New York: Springer-Verlag.
Conze, O., Bieger, T., Laesser, C. & Riklin, T. (2010). Relationship Intention as a Mediator
between Relational Benefits and Customer Loyalty in the Tour Operator Industry.
Journal of Travel and Tourism Marketing, 27, 51-62.
Chang, Y. & Chen, F. (2007). Relational Benefits, Switching Barriers and Loyalty: A study of
Airline Customers in Taiwan. Journal of Air Transport Management, 13, 104-109.

62
Cyr, D., Hassaneinb, K., Headb, M. & Ivanovc, A. (2007). The Role of Social Presence in
establishing loyalty in e-Service Environments. Interacting with Computers, 19(1), 43-
56.
Czepiel, J. A. (1990). Service Encounters and Service Relationships: Implications for
Research. Journal of Business Research, 20, 13-21.
Davison, A. C. & Hinkley, D. V. (1997). Bootstrap methods and their application. Cambridge,
UK: Cambridge University Press.
Dick, A. S. & Basu, K. (1994). Customer Loyalty: Toward an Integrated Conceptual
Framework. Academy of Marketing Science, 22(2), 99-113.
Dimitriadis, S. (2010). Testing Perceived Relational Benefits as Satisfaction and Behavioral
Outcome Drivers. International Journal of Bank Marketing, 28(4), 297-313.
Ellison, N. B., Steinfield, C. & Lampe, C. (2007). The Benefits of Facebook “Friends”: Social
Capital and College Students’ Use of Online Social Networking Sites. Journal of
Computer-mediated Communication, 12, 1143-1168.
Faché, W. (2000). Methodologies for innovation and improvement of services in tourism.
Managing Service Quality, 10(6), 356-366.
Field, A. (2006). Discovering Statistics Using SPSS (2nd ed.). London, UK: SAGE
Publications.
Gwinner, K. P., Gremler, D. D. & Bitner, M. J. (1998). Relational Benefits in Service
Industries: The Customer’s Perspective. Journal of the Academy of Marketing
Science, 26(2), 101-114.
Hallowell, R. (1996). The Relationships of Customer Satisfaction, Customer Loyalty and
Profitability: An Empirical Study. International Journal of Service Industry
Management, 7(4), 27-42.
Han, H. & Kim, W. (2009). Outcomes of Relational Benefits: Restaurant Customer’s
Perspective. Journal of Travel and Tourism Marketing, 26, 820-835.
Hanna, R., Rohm. A. & Crittenden, V. L. (2011). We’re All Connected: The Power of the
Social Media Ecosystem. Business Horizons, 54(3), 265-273.

63
Health, R. P. (1997). Loyalty for sale: Everybody’s doing frequency marketing - But only a
few companies are doing it well. Marketing Tools, 4(6), 40.
Hekkert, V. (2011). Master class Social Media. Unpublished presentation at Master class
Social Media in the Travel Trade, 08/25/2011, Geleen, NL: Travel Counsellors.
Hennig-Thurau, T. & Klee, A. (1997). The Impact of Customer Satisfaction and Relationship
Quality on Customer Retention: A Critical Reassessment and Model Development.
Psychology and Marketing, 14(8), 737-764.
Hennig-Thurau, T., Gwinner, K. P. & Gremler, D. D. (2002). Understanding Relationship
Marketing Outcomes: an Integration of Relational Benefits and Relationship Quality.
Journal of Service Research, 4(3), 230-247.
Heskett, J. L., Jones, T. O., Loveman, G. W., Sasser, W. E., Schlesinger, L. A. (1994).
Putting the Service-Profit Chain to Work. Harvard Business Review, mar-apr, 163-
174.
Hooper, D., Coughlan, J. & Mullen, M. R. (2008). Structural Equation Modelling: Guidelines
for Determining Model Fit. Electric Journal of Business Research Methods, 6(1), 53-
60.
Kasavana, M. L., Nusair, K. & Teodosic, K. (2010). Online social networking: redefining the
human web. Journal of Hospitality and Tourism Technology, 1(1), 68-82.
Kim, W. (2009). Customers’ Responses to Customer Orientation of Service Employees in
Full-Service Restaurants: A Relational Benefits Perspective. Journal of Quality
Assurance in Hospitality and Tourism, 10, 153-174.
Litvin, S. W., Goldsmith, R. E. & Pan, B. (2007). Electronic Word-of-Mouth in Hospitality and
Tourism Management. Tourism Management, 29, 458-468.
Lee, Y., Ahn, W. & Kim, K. (2008). A Study on the Moderating Role of Alternative
Attractiveness in the Relationship between Relational Benefits and Customer Loyalty.
International Journal of Hospitality and Tourism Administration, 9(1), 52-70.
Macintosh, G. (2007). Customer Orientation, Relationship Quality, and Relational Benefits to
the firm. Journal of Services Marketing, 21(3), 150-159.

64
Meadows-Klue, D. (2008). Falling In Love 2.0: Relationship Marketing for the Facebook
Generation. Journal of Direct, Data and Digital Marketing Practice, 9(3), 245-250.
Miller, M. (2011). The Ultimate Web Marketing Guide. Indianapolis, Indiana USA: Que
Publishing.
Morgan, R. M. & Hunt, S. D. (1994). The Commitment-Trust Theory in Relationship
Marketing. Journal of Marketing, 58(3), 20-38.
Mulaik, S. A. & Millsap, R. E. (2000). Doing the Four-Step Right. Structural Equation
Modeling, 7(1), 36-73.
O’Reilly, K. & Paper, D. (2009). Stakeholder Perceptions Regarding eCRM: A Franchise
Case Study. The International Journal of an Emerging Transdiscipline, 12, 191-215.
Parra-López, E., Bulchand-Gidumal, J., Gutiérez-Taño, D. & Díaz-Armas, R. (2011).
Intentions to use Social Media in Organizing and Taking Vacation Trips. Computers in
Human Behavior, 27, 640-654.
Parasuraman, A., Berry, L. L. & Zeithaml, V. A. (1991). Understanding Customer
Expectations of Service. Sloan Management Review, 32(3), 39-48.
Park, C., & Kim, Y. (2009). The Effect of Information Satisfaction and Relational Benefit on
Consumer's On-Line Shopping Site Commitment. In S. Bandyopadhyay
(Ed.), Contemporary Research in E-Branding (pp. 292-312). Pennsylvania, USA: IGI
Global.
Paul, M., Hennig-Thureau, T., Gremler, D. D., Gwinner, K. P. & Wiertz, C. (2009). Toward a
Theory of Repeat Purchase Drivers for Consumer Services. Journal of the Academy
of Marketing Science, 37(2), 215-237.
Petrick, J. F. & Li, X. (2006). What drives Cruise Passengers‘ Perceptions of Value? In
Dowling, R. K. (Ed.), Cruise Ship Tourism (p.63-73). Oxfordshire, UK: CABI.
Pritchard, M. P., Havitz, M. E. & Howard, D. R. (1999). Analyzing the Commitment-Loyalty
Link in Service Contexts. Journal of the Academy of Marketing Science, 27(3), 333-
348.
Prokesch, S. E. (1995). Competing on Customer Service: An Interview with British Airways’
Sir Colin Marshall. Harvard Business Review, 73, 1-18.

65
Raftery, A. E. (1995). Bayesian model selection in structural equation models. In: Testing
structural equation models, K. A. Bollen and J. S. Long, eds. Newbury Park, CA:
Sage Publications, 163–180.
Reynolds, K. E. & Beatty, S. E. (1999). Customer Benefits and Company Consequences of
Customer-Salesperson Relationships in Retailing. Journal of Retailing, 75(1), 11-32.
Ruiz-Molina, M., Gil-Saura, I. & Berenguer-Contrí, G. (2009). Relational Benefits and Loyalty
in Retailing: An Inter-Sector Comparison. International Journal of Retail and
Distribution Management, 37(6), 493-509.
Schumacker, R. E. & Lomax, R. G. (2004). A Beginner’s Guide to Structural Equation
Modeling. (2nd ed.). Mahwah, New Jersey: Lawrence Erlbaum Associates, Inc.
Sharma, S. (1996). Applied Multivariate Techniques. NY, USA: John Wiley & Sons.
Stevens, J. (1996). Applied multivariate statistics for the social sciences. Mahwah, NJ:
Lawrence Erlbaum Publishers.
Su, Q., Li, L. & Cui, Y. W. (2009). Analyzing Relational Benefits in e-Business Environment
from Behavioral Perspective. Systems Research and Behavioral Science, 26, 129-
142.
Sung-Bum, K. & Dae-Young, K. (2010). Travel Information Search Behavior and Social
Networking Sites: The Case of U.S. College Students. Retrieved 06/28/2011 from
http://scholarworks.umass.edu/cgi/viewcontent.cgi?article=1134&context=gradconf_h
ospitality&sei-redir=1
Tabachnick, B. G. & Fidell, L. S. (1996). Using Multivariate Statistics. NY, USA:
HarperCollins.
Travel Magazine (2011a). Voordeel halen uit de Social Media. Travel Magazine, 300, 86-87.
Travel Magazine (2011b). Social Media boost de verkoop. Travel Magazine, 300, 88.
Travel Magazine (2011c). De reisagent: een organische vorm van Facebook. Travel
Magazine, 300, 115.
Vennix, J. (2007). Theorie en praktijk van empirisch onderzoek. Pearson education limited,
Edinburgh, UK.

66
Vogt, C. A. & Fesenmaier, D. R. (1998). Expanding the Functional Information Search Model.
Annals of Tourism Research, 25(3), 551-578.
Vogt, C. A. (2011). Customer Relationship Management in Tourism: Management Needs
and Research Applications. Journal of Travel Research, 50(4), 356-364.
Wang, Y. & Fesenmaier, D. (2004). Towards understanding Member’s General Participation
in and Active Contribution to an Online Travel Community. Tourism Management, 25,
709-722.
Westbrook, R. A. (1987). Product/consumption-based affective responses and post-purchase
processes. Journal of Marketing Research, 24(3), 258–270.
Wijnen, K., Janssens, W., De Pelsmacker, P. & Van Kenhove, P. (2002). Marktonderzoek
met SPSS: Statistische Verwerking en Interpretatie. Antwerp, Belgium: Garant-
Uitgevers n.v.
Xiang, Z. & Gretzel, U. (2010). Role of Social Media in Online Travel Information Search.
Tourism Management, 31, 179-188.
Yen, H. J. R. & Gwinner, K. P. (2003). Internet Retail Customer Loyalty: the Mediating Role
of Relational Benefits. International Journal of Service Industry Management, 14(5),
483-500.
Zarella, D. & Zarella, A. (2011). The Facebook Marketing Book. Sebastopol, California USA:
O’Reilly Media Inc.

67
Appendices
Appendix 1: Measurement scales reviewed for operationalization of
constructs
Table 6: Overview of consulted studies for the operationalization of constructs
Reference Research topic
Anderson & Srinivasan
(2003)
The authors investigate the impact of satisfaction on loyalty in the
context of electronic commerce.
Benner (2009) The objective of this thesis is to contribute to the understanding of drivers
of customer loyalty by exploring the dynamics of customer‐brand
relationships and the role they play for the creation and management of
customer loyalty in the airline industry.
Chang & Chen (2007) This research proposes a model explaining switching barriers and
customer loyalty stemming from customer relational benefits.
Cyr et al. (2007) In this paper a model for e-Loyalty is proposed and used to examine how
varied conditions of social presence in a B2C e-Services context influence
e-Loyalty and its antecedents of perceived usefulness, trust and
enjoyment.
Gwinner et al. (1998) This research examines the benefits customers receive as a result of
engaging in long-term relational exchanges with service firms.
Han & Kim (2009) This study was designed to propose and test a behavioral intention model
by incorporating these constructs in a full-service restaurant setting.
Hennig-Thurau et al. (2002) This article integrates customer loyalty and word of mouth by positioning
customer satisfaction and commitment as relationship quality dimensions
that partially mediate the relationship between three relational benefits
(confidence benefits, social benefits, and special treatment benefits) and
the two outcome variables.
Kim (2009) This study was designed to investigate how the customer orientation of
service employees (COSE) affects customers’ perceptions of relational
benefits and ultimately contributes to repurchase intention in the full-
service restaurant context.
Macintosh (2007) This research seeks to test a model examining the potential links between
customer orientation, expertise, and relationship quality at the
interpersonal level and the link between relationship quality and positive
service outcomes at the firm level, such as loyalty and positive word of
mouth.

68
Overview of consulted studies for the operationalization of constructs (continued)
Reference Research topic
Parra-López et al. (2011) This study proposes a theoretical model to explain the factors determining
the intentions to use social media when organizing and taking vacation
trips.
Paul et al. (2009) This research attempts to overcome that fragmented state of knowledge by
making major advances toward a theory of repeat purchase drivers for
consumer services.
Reynolds & Beatty (1999) This study examines the benefits customers receive from relationships with
clothing/accessories salespeople.
Ruiz-Molina et al. (2009) The purpose of this paper is to empirically test a model that reflects the
different types of relational benefits perceived by customers, as well as the
benefits obtained by the organization in terms of customer loyalty.
Su et al. (2009) This paper explores relational benefits from Chinese customer’s
behavioural perspective.
Vogt & Fesenmaier (1998) This study used a decision-making and information search model as a
framework for explaining the factors which influence the use of
communications as they relate to recreation and tourism experiences.
Yen & Gwinner (2003) This paper proposes a conceptual framework that utilizes the construct of
relational benefits to explain the link between Internet-based self-service
technology attributes and customer loyalty and satisfaction.
Zhang & Bloemer (2008) The authors develop and test a model that explains how value congruence
affects the key components of consumer-brand relationship quality and
outcomes, including satisfaction, trust, affective commitment, and loyalty.

69
Table 7: Studies consulted with respect to "Social Benefits"
Reference Items
Chang & Chen (2007) I enjoy certain social aspects of the relationship
Some airline employees know my name
I have developed friendships with certain airline employees
Gwinner et al. (1998);
Hennig-Thurau et al. (2002);
Ruiz-Molina et al. (2009)
I am recognized by certain employees
I enjoy certain social aspects of the relationship
I have developed a friendship with the service provider
I am familiar with the employees that perform the services
They know my name
Han & Kim (2009) I feel like there is a bond between this restaurant and me
I am familiar with employee(s) who perform(s) services
At least one of the staff at this restaurant knows me
Kim (2009) Based on all my experiences with the restaurant…
…I am recognized by (a) certain employee(s)
…I am familiar with the employee(s) who provide(s) the service
…I have developed a friendship with the employee(s)
…the employee(s) know(s) my name
Reynolds & Beatty (1999) The friendship aspect of my relationship with my sales associate is very
important to me
I enjoy spending time with my sales associate
I value the close, personal relationship I have with my sales associate
I enjoy my sales associate’s company

70
Table 8: Consulted studies with respect to "Confidence Benefits"
Reference Items
Chang & Chen (2007)
I feel I can trust this airline
I am not worried when I fly on this airline
I am confident that the service will be performed correctly by this airline
Gwinner et al. (1998);
Ruiz-Molina et al. (2009)
I believe there is less risk that something will go wrong
I feel I can trust the service provider
I have more confidence the service will be performed correctly
I have less anxiety when I buy the service
I know what to expect when I go in
I get the provider’s highest level of service
Han & Kim (2009) I have confidence that this restaurant provides the best deal
I feel I can trust this restaurant
I have more confidence that services at this restaurant will be performed
correctly
Hennig-Thurau et al. (2002) I know what to expect when I go in
This company’s employees are perfectly honest and truthful
This company’s employees can be trusted completely
This company’s employees have high integrity
Kim (2009) Based on all my experiences with the restaurant…
…I believe there is less risk that something will go wrong
…I feel I can trust the employee(s)
…I have more confidence the service will be performed correctly
…I have less anxiety when I decide to dine out at this restaurant
Yen & Gwinner (2003) I can trust this Web-based travel agency
This Web-based travel agency can free me from anxiety concerning the
security of online transactions
I know what to expect when I get on to the Web site of this travel agency

71
Table 9: Consulted studies with respect to "Functional Benefits"
Reference Items
Parra-López et al. (2011) Social media tools enable me to keep up to date with knowledge about the
tourist sites and activities of interest
Social media tools permit me to save costs and get the most from the
resources invested in the trip
Social media tools give me the possibility to provide and to receive
information about tourist sites and activities of interest
Paul et al. (2009) The customer benefits because s/he gains expert knowledge and
information about the service
Reynolds & Beatty (1999)
I value the convenience benefits my sales associate provides me very
highly
I value the time saving benefits my sales associate provides me very
highly
I benefit from the advice my sales associate gives me
I make better purchase decisions because of my sales associate

72
Table 10: Consulted studies with respect to "Special Treatment Benefits"
Reference Items
Chang & Chen (2007) I can get faster service if necessary
I am placed higher on the stand-by list when the flight is full
This airline will manage to give me a seat when the flight is full
This airline will upgrade my seat when possible
Gwinner et al. (1998);
Hennig-Thurau et al. (2002);
Ruiz-Molina et al. (2009)
I get discounts or special deals that most customers don’t get
I get better prices than most customers
They do services for me that they don’t do for most customers
I am placed higher on the priority list when there is a line
I get faster service than most customers
Han & Kim (2009) This restaurant provides me reliable benefit programs and services
I feel staff at this restaurant treat me special
Kim (2009) Based on all my experiences with the restaurant…
…I receive better prices or special deals that most customers don’t
…they provide services to me that they don’t provide to most other
customers
…I receive faster service than most other customers
…they pay extra attention to my needs
Yen & Gwinner (2003) I am able to save a lot of time on information searching when I browse and
order through this travel agency
I got extra services (e.g. member-only chat room, special offer and
frequent user program) from using this Internet travel agency

73
Table 11: Consulted studies with respect to "Hedonic Benefits"
Reference Items
Cyr et al. (2007)
Perceived enjoyment
I found my visit to this website interesting
I found my visit to this website entertaining
I found my visit to this website enjoyable
I found my visit to this website pleasant
Vogt & Fesenmaier (1998)
Hedonic needs
Emotional
Excite myself about travel
Be entertained
Excite myself with unique cultures
Sensory
Hear the sounds of the ocean
Smell the fresh air
Taste those foods I discover
Experiential
Experience the local culture
Realize experiences that I think about
Phenomenology
Understand the personality of a community
Wonder about daily life of area

74
Table 12: Consulted studies with respect to "Customer Satisfaction"
Reference Items
Anderson & Srinivasan
(2003)
I am satisfied with my decision to purchase from this Web site
If I had to purchase again, I would feel differently about buying from this
Web site
My choice to purchase from this Web site was a wise one
I feel badly regarding my decision to buy from this Web site
I think I did the right thing by buying from this Web site
I am unhappy that I purchased from this Web site
Benner (2009) My experiences with this airline exceed my expectations
Hennig-Thurau et al. (2002) My choice to use this company was a wise choice
I am always delighted with this firm’s service
Overall, I am satisfied with this organization
I think I did the right thing when I decided to use this firm
Reynolds and Beatty (1999) Please indicate your feeling with respect to your sales associate at
“company name”
Pleased – displeased (1-7)
Unhappy – happy (1-7)
Disgusted – contented (1-7)
Frustrating – enjoyable (1-7)
Please indicate your feelings with respect to shopping at “company name”
Pleased – displeased (1-7)
Unhappy – happy (1-7)
Disgusted – contented (1-7)
Frustrating – enjoyable (1-7)
Yen & Gwinner (2003) In general, I am satisfied with the service quality offered by this Internet
travel agency
I feel satisfied with the self-service interface of this Internet travel agency
Zhang & Bloemer (2008) Compared to other banks, I am very satisfied with X
Based on all my experience with X, I am very satisfied
My experiences at X have always been pleasant
Overall, I am satisfied with X

75
Table 13: Consulted studies with respect to "Customer Loyalty"
Reference Items
Anderson & Srinivasan
(2003)
I seldom consider switching to another Web site
As long as the present service continues, I doubt that I would switch Web
sites
I try to use the Web site whenever I need to make a purchase
When I need to make a purchase, this Web site is my first choice
I like using the Web site
To me this site is the best retail Web site to do business with
I believe that this is my favorite retail Web site
Cyr et al. (2007) I would use this website again
I would consider purchasing from this website in the future
I would consider using this website in the future
Hennig-Thurau et al. (2002) I have a very strong relationship with this service provider
I am very likely to switch to another service provider in the near future
Reynolds and Beatty (1999) I am very loyal to my sales associate at “company name”
I don’t plan to shop with my sales associate at “company name” in the
future
I am very committed to my sales associate at “company name”
I don’t consider myself very loyal to my sales associate at “company name”
I am very loyal to “company name”
I am very committed to “company name”
I don’t consider myself a loyal “company name” customer
I don’t plan to shop at “company name” in the future
Ruiz-Molina et al. (2008) As long as the present service continues, I doubt that I would switch store
I try to use the store whenever I need to make a purchase
When I need to make a purchase, this store is my first choice
I like using this store
To me this store is the best store to do business with
In comparison to other stores, I would consider this store as excellent
Yen & Gwinner (2003) This Internet travel agency is my first choice for my next purchase of travel
services
I will continue to purchase from this Internet travel agency

76
Table 14: Consulted studies with respect to "Relationship Commitment"
Reference Items
Hennig-Thurau et al. (2002) My relationship to this specific service provider is something that I am very
committed to
My relationship to this specific service provider is very important to me
My relationship to this specific service provider is something I really care
about
My relationship to this specific service provider deserves my maximum
effort to maintain
Table 15: Consulted studies with respect to "Word of Mouth"
Reference Items
Hennig-Thurau et al. (2002) I often recommend this service provider to others
Macintosh (2005)
I have talked to co-workers and friends about my experience with (firm)
Never = 0
Once or twice = 1
Several times = 2
Many times = 3
If you talked to co-workers or friends about (firm), your comments were
generally
Very negative = -2
Negative = -1
Neutral = 0
Positive = 1
Very positive = 2
Su et al. (2009) I often recommend this firm to my friends
I will introduce this firm to others

77
Table 16: Measurement Items included in questionnaire (Likert scales 1-7)
Model construct Measurement item Based on
Social Benefits Ik word herkend door reisorganisatie X op hun
Facebookpagina
Gwinner et al. (1998);
Hennig-Thurau et al. (2002)
Ik vind de sociale aspecten van mijn relatie met
reisorganisatie X op Facebook leuk
Via Facebook heb ik een vriendschapsrelatie
ontwikkeld met reisorganisatie X
Ik ben bekend met de Facebookpagina van
reisorganisatie X
Mijn naam is bekend bij reisorganisatie X op Facebook
Confidence
Benefits
Ik geloof dat er weinig risico is dat mijn privacy via
Facebook geschonden wordt door reisorganisatie X
Gwinner et al. (1998)
Ik kan de informatie op de Facebookpagina van
reisorganisatie X vertrouwen
Ik heb er vertrouwen in dat reisorganisatie X een
goede dienst verleent op Facebook
Door mijn relatie op Facebook met reisorganisatie X,
heb ik minder angst bij het boeken van een reis
Door de Facebookpagina van reisorganisatie X weet ik
wat ik van de organisatie kan verwachten
Op Facebook krijg ik de best mogelijke service van
reisorganisatie X
Functional
Benefits
De Facebookpagina van reisorganisatie X biedt mij
gemak
Reynolds & Beatty (1999)
Ik haal voordeel uit het advies dat ik krijg via de
Facebookpagina van reisorganisatie X
Ik kan betere beslissingen nemen bij het boeken van
mijn reis door het gebruik van de Facebookpagina van
reisorganisatie X
Reisorganisatie X houdt mij via Facebook op de
hoogte van interessante reizen en bestemmingen
Parra-López et al. (2011)

78
Measurement Items included in questionnaire (continued)
Model construct Measurement item Based on
Special
Treatment
Benefits
Via Facebook ontvang ik kortingen en speciale deals
van reisorganisatie X die de meeste klanten niet
krijgen
Gwinner et al. (1998);
Hennig-Thurau et al. (2002)
Via de Facebookpagina van reisorganisatie X krijg ik
betere prijzen dan de meeste klanten
Via Facebook ontvang ik een service van
reisorganisatie X die veel andere klanten niet krijgen
Indien nodig, kan ik via Facebook snellere service
krijgen van reisorganisatie X
Chang & Chen (2007)
Door middel van de Facebookpagina van
reisorganisatie X bespaar ik tijd bij het zoeken naar
informatie
Yen & Gwinner (2003)
Hedonic Benefits Ik vind mijn bezoek aan de Facebookpagina van
reisorganisatie X telkens interessant
Cyr et al. (2007)
Ik vind mijn bezoek aan de Facebookpagina van
reisorganisatie X amusant
Het bezoeken van de Facebookpagina van
reisorganisatie X verblijdt mij
Ik vind mijn bezoek aan de Facebookpagina van
reisorganisatie X telkens prettig
Door de Facebookpagina van reisorganisatie X krijg ik
zin om te reizen
Vogt & Fesenmaier (1998)
Customer e-
Satisfaction
Vergeleken met andere Facebookpagina’s van
reisorganisaties, ben ik erg tevreden over de
Facebookpagina van reisorganisatie X
Zhang & Bloemer (2008)
Op basis van al mijn ervaringen met de
Facebookpagina van reisorganisatie X, ben ik tevreden
over hun dienstverlening
Mijn ervaringen met de Facebookpagina van
reisorganisatie X zijn altijd prettig
Over het algemeen ben ik tevreden over de
Facebookpagina van reisorganisatie X
De Facebookpagina van reisorganisatie X gaat mijn
verwachtingen te boven
(Benner, 2009)

79
Measurement Items included in questionnaire (continued)
Model construct Measurement item Based on
Customer
Satisfaction with
Tour Operator
Vergeleken met andere reisorganisaties, ben ik erg
tevreden over reisorganisatie X in het algemeen
Zhang & Bloemer (2008)
Op basis van al mijn ervaringen met reisorganisatie X,
ben ik erg tevreden
Mijn ervaringen met reisorganisatie X zijn altijd prettig
Over het algemeen ben ik tevreden over
reisorganisatie X
Reisorganisatie X gaat in het algemeen mijn
verwachtingen te boven
Benner ( 2009)
Customer e-
Loyalty
Ik ben erg loyaal aan de Facebookpagina van
reisorganisatie X
Reynolds and Beatty (1999)
Ik ben van plan om binnenkort weer gebruik te maken
van de Facebookpagina van reisorganisatie X
Ik voel me erg verbonden met de Facebookpagina van
reisorganisatie X
Ik beschouw mezelf erg loyaal aan de Facebookpagina
van reisorganisatie X
Customer Loyalty
to Tour Operator
In het algemeen ben ik erg loyaal aan reisorganisatie X
Reynolds and Beatty (1999)
Ik ben van plan om binnenkort weer gebruik te maken
van reisorganisatie X
Ik ben in het algemeen erg verbonden met
reisorganisatie X
Ik beschouw mezelf een loyale klant van
reisorganisatie X
Relationship
Commitment
Ik ben gehecht aan mijn relatie met reisorganisatie X
Hennig-Thurau et al. (2002)
De relatie met reisorganisatie X is belangrijk voor me
Ik geef veel om de relatie met reisorganisatie X
Mijn relatie met reisorganisatie X verdient mijn
maximale inspanning om te onderhouden

80
Measurement Items included in questionnaire (continued)
Model construct Measurement item Based on
Word of Mouth Ik raad reisorganisatie X vaak aan anderen aan Hennig-Thurau et al. (2002)
Wanneer ik met vrienden of collega’s spreek over
reisorganisatie X, ben ik
1 = zeer negatief
2 = negatief
3 = eerder negatief
4 = neutraal
5 = eerder positief
6 = positief
7 = zeer positief
Macintosh (2005)
Ik ben van plan reisorganisatie X bij anderen te
introduceren
Su et al. (2009)

81
Appendix 2: Output used to check assumptions
Normality tests
Tests of univariate normality
Kolmogorov-Smirnova Shapiro-Wilk
Statistic df Sig. Statistic df Sig.
SocialBenefits .063 157 .200* .983 157 .048
ConfidenceBenefits .056 157 .200* .985 157 .090
FunctionalBenefits .113 157 .000 .966 157 .001
SpecialTreatmentBenefits .064 157 .200* .985 157 .093
HedonicBenefits .084 157 .009 .957 157 .000
eSatisfaction .072 157 .046 .954 157 .000
Satisfaction .106 157 .000 .931 157 .000
eLoyalty .101 157 .000 .976 157 .008
Loyalty .083 157 .011 .966 157 .001
RelationshipCommitment .096 157 .001 .967 157 .001
WOM .104 157 .000 .917 157 .000
a. Lilliefors Significance Correction
*. This is a lower bound of the true significance.
Mardia’s coefficient
Kurtosis Critical ratio
Multivariate 217.743 18.917

82
Scatter plots

83
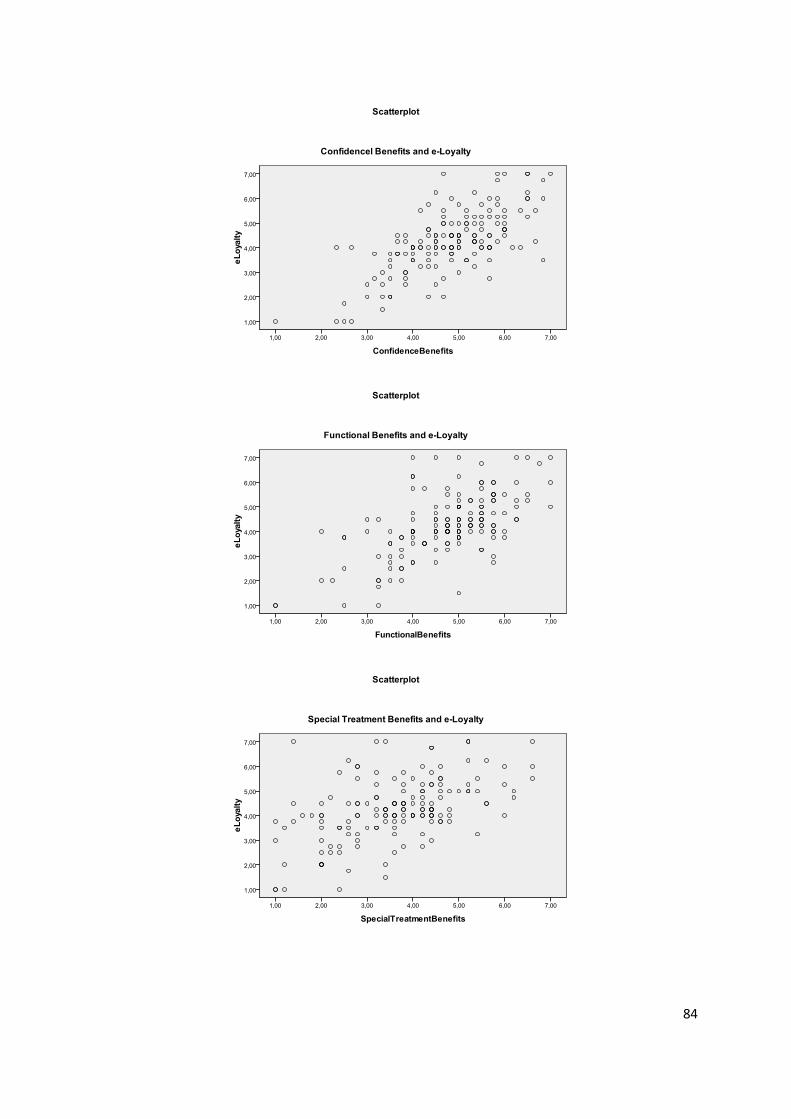
84

85

86

87

88

89

90
Levene’s Test
Test of Homogeneity of Variances
Social
Benefits
Levene
Statistic df1 df2 Sig.
eSatisfaction 3.199 23 128 .000
eLoyalty 1.321 23 128 .167
Commitment 1.955 23 128 .010
Test of Homogeneity of Variances
Confidence
Benefits
Levene
Statistic df1 df2 Sig.
eSatisfaction 2.763 25 128 .000
eLoyalty 1.367 25 128 .133
Commitment 2.157 25 128 .003

91
Test of Homogeneity of Variances
Functional
Benefits
Levene
Statistic df1 df2 Sig.
eSatisfaction 1.304 18 136 .194
eLoyalty 1.056 18 136 .403
Commitment 1.553 18 136 .081
Test of Homogeneity of Variances
Special
Treatment
Benefits
Levene
Statistic df1 df2 Sig.
eSatisfaction 2.869 23 130 .,000
eLoyalty .807 23 130 .718
Commitment 1.429 23 130 .109
Test of Homogeneity of Variances
Hedonic
Benefits
Levene
Statistic df1 df2 Sig.
eSatisfaction 1.190 19 134 .275
eLoyalty 1.447 19 134 .115
Commitment 1.834 19 134 .025
Test of Homogeneity of Variances
Customer e-
Satisfaction
Levene
Statistic df1 df2 Sig.
Satisfaction 3.435 20 134 .000
eLoyalty .932 20 134 .548
Commitment 1.542 20 134 .077
WOM 2.805 20 134 .000

92
Test of Homogeneity of Variances
Customer
Satisfaction Levene Statistic df1 df2 Sig.
Loyalty 1.525 18 132 .091
Commitment .831 18 132 .662
WOM 3.599 18 132 .000
Test of Homogeneity of Variances
Customer e-
Loyalty
Levene
Statistic df1 df2 Sig.
Loyalty 4,184 19 135 ,000
Test of Homogeneity of Variances
Relationship
Commitment
Levene
Statistic df1 df2 Sig.
Loyalty 1.498 21 133 .088

93
Durbin-Watson Test
Model Summaryb
Model Durbin-Watson
1.978a
a. Predictors: (Constant), HedonicBenefits,
SocialBenefits, SpecialTreatmentBenefits,
ConfidenceBenefits, FunctionalBenefits
b. Dependent Variable: eSatisfaction
Model Summaryb
Model Durbin-Watson
1.950a
a. Predictors: (Constant), eSatisfaction,
Satisfaction, SocialBenefits,
SpecialTreatmentBenefits, HedonicBenefits,
ConfidenceBenefits, FunctionalBenefits
b. Dependent Variable: RelationshipCommitment
Model Summaryb
Model Durbin-Watson
1.738a
a. Predictors: (Constant), Satisfaction, eLoyalty,
RelationshipCommitment
b. Dependent Variable: Loyalty
Model Summaryb
Model Durbin-Watson
2.293a
a. Predictors: (Constant), eSatisfaction,
SocialBenefits, SpecialTreatmentBenefits,
HedonicBenefits, ConfidenceBenefits,
FunctionalBenefits
b. Dependent Variable: eLoyalty
Model Summaryb
Model Durbin-Watson
1.927a
a. Predictors: (Constant), eSatisfaction
b. Dependent Variable: Satisfaction
Model Summaryb
Model Durbin-Watson
1.922a
a. Predictors: (Constant),
RelationshipCommitment, eSatisfaction,
Satisfaction
b. Dependent Variable: WOM

94
VIF values
Coefficientsa
Model
Collinearity Statistics
Tolerance VIF
ConfidenceBenefits .347 2.882
FunctionalBenefits .273 3.666
SpecialTreatmentBenefits .446 2.241
HedonicBenefits .378 2.644
eSatisfaction .233 4.287
Satisfaction .256 3.911
eLoyalty .266 3.756
Loyalty .227 4.415
RelationshipCommitment .309 3.240
WOM .246 4.060
a. Dependent Variable: SocialBenefits
Coefficientsa
Model
Collinearity Statistics
Tolerance VIF
FunctionalBenefits .320 3127
SpecialTreatmentBenefits .446 2.243
HedonicBenefits .378 2.643
eSatisfaction .234 4.274
Satisfaction .256 3.901
eLoyalty .269 3.721
Loyalty .224 4.459
RelationshipCommitment .292 3.430
WOM .248 4.025
SocialBenefits .480 2.082
a. Dependent Variable: ConfidenceBenefits

95
Coefficientsa
Model
Collinearity Statistics
Tolerance VIF
SpecialTreatmentBenefits .534 1.873
HedonicBenefits .392 2.552
eSatisfaction .247 4.056
Satisfaction .251 3.984
eLoyalty .266 3.764
Loyalty .229 4.363
RelationshipCommitment .291 3.433
WOM .248 4.028
SocialBenefits .444 2.252
ConfidenceBenefits .376 2.660
a. Dependent Variable: FunctionalBenefits
Coefficientsa
Model
Collinearity Statistics
Tolerance VIF
HedonicBenefits .378 2.644
eSatisfaction .247 4.052
Satisfaction .252 3.963
eLoyalty .266 3.766
Loyalty .225 4.449
RelationshipCommitment .291 3.433
WOM .246 4.058
SocialBenefits .449 2.226
ConfidenceBenefits .324 3.084
FunctionalBenefits .330 3.028
a. Dependent Variable: SpecialTreatmentBenefits

96
Coefficientsa
Model
Collinearity Statistics
Tolerance VIF
eSatisfaction .249 4.014
Satisfaction .251 3.986
eLoyalty .291 3.437
Loyalty .224 4.458
RelationshipCommitment .291 3.433
WOM .246 4.059
SocialBenefits .443 2.256
ConfidenceBenefits .320 3.123
FunctionalBenefits .282 3.546
SpecialTreatmentBenefits .440 2.272
a. Dependent Variable: HedonicBenefits
Coefficientsa
Model
Collinearity Statistics
Tolerance VIF
Satisfaction .257 3.884
eLoyalty .286 3.501
Loyalty .226 4.430
RelationshipCommitment .294 3.407
WOM .246 4.059
SocialBenefits .443 2.255
ConfidenceBenefits .321 3.113
FunctionalBenefits .288 3.473
SpecialTreatmentBenefits .466 2.146
HedonicBenefits .404 2.474
a. Dependent Variable: eSatisfaction

97
Coefficientsa
Model
Collinearity Statistics
Tolerance VIF
eLoyalty .266 3.758
Loyalty .242 4.124
RelationshipCommitment .293 3.412
WOM .335 2.987
SocialBenefits .452 2.214
ConfidenceBenefits .327 3.057
FunctionalBenefits .272 3.671
SpecialTreatmentBenefits .443 2.259
HedonicBenefits .378 2.644
eSatisfaction .239 4.180
a. Dependent Variable: Satisfaction
Coefficientsa
Model
Collinearity Statistics
Tolerance VIF
Loyalty .225 4.448
RelationshipCommitment .305 3.276
WOM .246 4.059
SocialBenefits .445 2.247
ConfidenceBenefits .324 3.082
FunctionalBenefits .273 3.665
SpecialTreatmentBenefits .441 2.269
HedonicBenefits .415 2.409
eSatisfaction .251 3.982
Satisfaction .252 3.972
a. Dependent Variable: eLoyalty

98
Coefficientsa
Model
Collinearity Statistics
Tolerance VIF
RelationshipCommitment .365 2.737
WOM .256 3.899
SocialBenefits .448 2.232
ConfidenceBenefits .320 3.120
FunctionalBenefits .279 3.589
SpecialTreatmentBenefits .442 2.264
HedonicBenefits .379 2.640
eSatisfaction .235 4.256
Satisfaction .272 3.682
eLoyalty .266 3.757
a. Dependent Variable: Loyalty
Coefficientsa
Model
Collinearity Statistics
Tolerance VIF
WOM .257 3.886
SocialBenefits .470 2.130
ConfidenceBenefits .320 3.121
FunctionalBenefits .272 3.673
SpecialTreatmentBenefits .440 2.272
HedonicBenefits .378 2.644
eSatisfaction .235 4.256
Satisfaction .252 3.962
eLoyalty .278 3.599
Loyalty .281 3.559
a. Dependent Variable: RelationshipCommitment

99
Coefficientsa
Model
Collinearity Statistics
Tolerance VIF
SocialBenefits .444 2.254
ConfidenceBenefits .323 3.094
FunctionalBenefits .275 3.640
SpecialTreatmentBenefits .441 2.269
HedonicBenefits .379 2.641
eSatisfaction .233 4.285
Satisfaction .341 2.930
eLoyalty .265 3.767
Loyalty .233 4.283
RelationshipCommitment .305 3.283
a. Dependent Variable: WOM

100
Appendix 3: Output used during exploratory factor analysis
Kaiser-Meyer-Olkin and Bartlett's Test
KMO and Bartlett’s test for each latent variable
Latent variable
#
Items
KMO Bartlett’s test
of sphericity
Sig.
Social Benefits 5 .822 .000
Confidence Benefits 6 .825 .000
Functional Benefits 4 .780 .000
Special Treatment Benefits 5 .832 .000
Hedonic Benefits 5 .829 .000
Customer e-Satisfaction 5 .857 .000
Customer Satisfaction with TO 5 .876 .000
Customer e-Loyalty 4 .801 .000
Customer Loyalty to TO 4 .861 .000
Relationship Commitment 4 .842 .000
WOM 3 .761 .000
Total variance explained
Total Variance Explained for Social Benefits
Component
Initial Eigenvalues Extraction Sums of Squared Loadings
Total
% of
Variance Cumulative % Total % of Variance Cumulative %
1 3.013 60.263 60.263 3.013 60.263 60.263
2 .739 14.783 75.047
3 .510 10.204 85.250
4 .381 7.621 92.871
5 .356 7.129 100.000
Extraction Method: Principal Component Analysis.

101
Total Variance Explained for Confidence Benefits
Component
Initial Eigenvalues Extraction Sums of Squared Loadings
Total
% of
Variance Cumulative % Total % of Variance Cumulative %
1 3.348 55.808 55.808 3.348 55.808 55.808
2 .993 16.556 72.363
3 .559 9.313 81.676
4 .442 7.374 89.051
5 .354 5.907 94.958
6 .303 5.042 100.000
Extraction Method: Principal Component Analysis.
Total Variance Explained for Functional Benefits
Component
Initial Eigenvalues Extraction Sums of Squared Loadings
Total
% of
Variance Cumulative % Total % of Variance Cumulative %
1 2.570 64.257 64.257 2.570 64.257 64.257
2 .608 15.193 79.451
3 .474 11.843 91.293
4 .348 8.707 100.000
Extraction Method: Principal Component Analysis.
Total Variance Explained for Special Treatment Benefits
Component
Initial Eigenvalues Extraction Sums of Squared Loadings
Total % of Variance Cumulative % Total % of Variance Cumulative %
1 3.367 67.349 67.349 3.367 67.349 67.349
2 .765 15.305 82.655
3 .313 6.265 88.920
4 .305 6.098 95.018
5 .249 4.982 100.000
Extraction Method: Principal Component Analysis.

102
Total Variance Explained for Hedonic Benefits
Component
Initial Eigenvalues Extraction Sums of Squared Loadings
Total % of Variance Cumulative % Total % of Variance Cumulative %
1 3.471 69.430 69.430 3.471 69.430 69.430
2 .695 13.896 83.326
3 .342 6.839 90.165
4 .300 5.997 96.162
5 .192 3.838 100.000
Extraction Method: Principal Component Analysis.
Total Variance Explained for Customer e-Satisfaction
Component
Initial Eigenvalues Extraction Sums of Squared Loadings
Total % of Variance Cumulative % Total % of Variance Cumulative %
1 3.494 69.881 69.881 3.494 69.881 69.881
2 .536 10.724 80.605
3 .427 8.544 89.149
4 .313 6.262 95.412
5 .229 4.588 100.000
Extraction Method: Principal Component Analysis.
Total Variance Explained for Customer Satisfaction
Component
Initial Eigenvalues Extraction Sums of Squared Loadings
Total % of Variance Cumulative % Total % of Variance Cumulative %
1 3.860 77.191 77.191 3.860 77.191 77.191
2 .520 10.399 87.590
3 .364 7.282 94.872
4 .141 2.820 97.692
5 .115 2.308 100.000
Extraction Method: Principal Component Analysis.

103
Total Variance Explained for Customer e-Loyalty
Component
Initial Eigenvalues Extraction Sums of Squared Loadings
Total % of Variance Cumulative % Total % of Variance Cumulative %
1 3.229 80.721 80.721 3.229 80.721 80.721
2 .378 9.454 90.175
3 .296 7.401 97.576
4 .097 2.424 100.000
Extraction Method: Principal Component Analysis.
Total Variance Explained for Customer Loyalty
Component
Initial Eigenvalues Extraction Sums of Squared Loadings
Total % of Variance Cumulative % Total % of Variance Cumulative %
1 3.331 83.267 83.267 3.331 83.267 83.267
2 .250 6.247 89.514
3 .248 6.205 95.719
4 .171 4.281 100.000
Extraction Method: Principal Component Analysis.
Total Variance Explained for Relationship Commitment
Component
Initial Eigenvalues Extraction Sums of Squared Loadings
Total % of Variance Cumulative % Total % of Variance Cumulative %
1 3.511 87.774 87.774 3.511 87.774 87.774
2 .252 6.288 94.062
3 .154 3.841 97.903
4 .084 2.097 100.000
Extraction Method: Principal Component Analysis.

104
Total Variance Explained for Word of Mouth
Component
Initial Eigenvalues Extraction Sums of Squared Loadings
Total % of Variance Cumulative % Total % of Variance Cumulative %
1 2.594 86.470 86.470 2.594 86.470 86.470
2 .224 7.454 93.923
3 .182 6.077 100.000
Extraction Method: Principal Component Analysis.
Scree Plots
Social Benefits
Confidence Benefits

105
Functional Benefits
Special Treatment Benefits
Hedonic Benefits

106
Customer e-Satisfaction
Customer Satisfaction
Customer e-Loyalty

107
Customer Loyalty
Relationship Commitment
Word of Mouth

108
Component Matrices
Component Matrixa for Social Benefits
Component
1
Ik word herkend door reisorganisatie X op hun Facebookpagina .794
Ik vind de sociale aspecten van mijn relatie met reisorganisatie X op Facebook leuk .802
Via Facebook heb ik een vriendschapsrelatie ontwikkeld met reisorganisatie X .812
Ik ben bekend met de Facebookpagina van reisorganisatie X .637
Mijn naam is bekend bij reisorganisatie X op Facebook .822
Extraction Method: Principal Component Analysis.
a. 1 components extracted.
Component Matrixa for Confidence Benefits
Component
1
Ik geloof dat er weinig risico is dat mijn privacy via Facebook geschonden wordt door
reisorganisatie X
.613
Ik kan de informatie op de Facebookpagina van reisorganisatie X vertrouwen .730
Ik heb er vertrouwen in dat reisorganisatie X een goede dienst verleent op Facebook .832
Door mijn relatie op Facebook met reisorganisatie X, heb ik minder angst bij het boeken van
een reis
.779
Door de Facebookpagina van reisorganisatie X weet ik wat ik van de organisatie kan
verwachten
.741
Op Facebook krijg ik de best mogelijke service van reisorganisatie X .768
Extraction Method: Principal Component Analysis.
a. 1 components extracted.

109
Component Matrixa for Functional Benefits
Component
1
De Facebookpagina van reisorganisatie X biedt mij gemak .817
Ik haal voordeel uit het advies dat ik krijg via de Facebookpagina van reisorganisatie X .852
Ik kan betere beslissingen nemen bij het boeken van mijn reis door het gebruik van de
Facebookpagina van reisorganisatie X
.789
Reisorganisatie X houdt mij via Facebook op de hoogte van interessante reizen en
bestemmingen
.744
Extraction Method: Principal Component Analysis.
a. 1 components extracted.
Component Matrixa for Special Treatment Benefits
Component
1
Via Facebook ontvang ik kortingen en speciale deals van reisorganisatie X die de meeste
klanten niet krijgen
.735
Via de Facebookpagina van reisorganisatie X krijg ik betere prijzen dan de meeste klanten .886
Via Facebook ontvang ik een service van reisorganisatie X die veel andere klanten niet
krijgen
.885
Indien nodig, kan ik via Facebook snellere service krijgen van reisorganisatie X .848
Door middel van de Facebookpagina van reisorganisatie X bespaar ik tijd bij het zoeken
naar informatie
.735
Extraction Method: Principal Component Analysis.
a. 1 components extracted.

110
Component Matrixa for Hedonic Benefits
Component
1
Ik vind mijn bezoek aan de Facebookpagina van reisorganisatie X telkens interessant .801
Ik vind mijn bezoek aan de Facebookpagina van reisorganisatie X amusant .839
Het bezoeken van de Facebookpagina van reisorganisatie X verblijdt mij .890
Ik vind mijn bezoek aan de Facebookpagina van reisorganisatie X telkens prettig .905
Door de Facebookpagina van reisorganisatie X krijg ik zin om te reizen .718
Extraction Method: Principal Component Analysis.
a. 1 components extracted.
Component Matrixa for Customer e-Satisfaction
Component
1
Vergeleken met andere Facebookpagina’s van reisorganisaties, ben ik erg tevreden over
de Facebookpagina van reisorganisatie X
.809
Op basis van al mijn ervaringen met de Facebookpagina van reisorganisatie X, ben
ik tevreden over hun dienstverlening
.864
Mijn ervaringen met de Facebookpagina van reisorganisatie X zijn altijd prettig .864
Over het algemeen ben ik tevreden over de Facebookpagina van reisorganisatie X .847
De Facebookpagina van reisorganisatie X gaat mijn verwachtingen te boven .793
Extraction Method: Principal Component Analysis.
a. 1 components extracted.
Component Matrixa for Customer Satisfaction
Component
1
Vergeleken met andere reisorganisaties, ben ik erg tevreden over reisorganisatie X in het
algemeen
.842
Op basis van al mijn ervaringen met reisorganisatie X, ben ik erg tevreden .934
Mijn ervaringen met reisorganisatie X zijn altijd prettig .930
Over het algemeen ben ik tevreden over reisorganisatie X .926
Reisorganisatie X gaat in het algemeen mijn verwachtingen te boven .745
Extraction Method: Principal Component Analysis.
a. 1 components extracted.

111
Component Matrixa for Customer e-Loyalty
Component
1
Ik ben erg loyaal aan de Facebookpagina van reisorganisatie X .881
Ik ben van plan om binnenkort weer gebruik te maken van de Facebookpagina van
reisorganisatie X
.846
Ik voel me erg verbonden met de Facebookpagina van reisorganisatie X .930
Ik beschouw mezelf erg loyaal aan de Facebookpagina van reisorganisatie X .933
Extraction Method: Principal Component Analysis.
a. 1 components extracted.
Component Matrixa for Customer Loyalty
Component
1
In het algemeen ben ik erg loyaal aan reisorganisatie X .901
Ik ben van plan om binnenkort weer gebruik te maken van reisorganisatie X .901
Ik ben in het algemeen erg verbonden met reisorganisatie X .920
Ik beschouw mezelf een loyale klant van reisorganisatie X .928
Extraction Method: Principal Component Analysis.
a. 1 components extracted.
Component Matrixa for Relationship Commitment
Component
1
Ik ben gehecht aan mijn relatie met reisorganisatie X .932
De relatie met reisorganisatie X is belangrijk voor me .950
Ik geef veel om de relatie met reisorganisatie X .960
Mijn relatie met reisorganisatie X verdient mijn maximale inspanning om te onderhouden .905
Extraction Method: Principal Component Analysis.
a. 1 components extracted.
112
Component Matrixa for Word of Mouth
Component
1
Ik raad reisorganisatie X vaak aan anderen aan .938
Wanneer ik met vrienden of collega’s spreek over reisorganisatie X, ben ik ... .925
Ik ben van plan reisorganisatie X bij anderen te introduceren .927
Extraction Method: Principal Component Analysis.
a. 1 components extracted.
Communalities
Communalities for Social Benefits
Initial Extraction
Ik word herkend door reisorganisatie X op hun Facebookpagina 1.000 .630
Ik vind de sociale aspecten van mijn relatie met reisorganisatie X op Facebook leuk 1.000 .643
Via Facebook heb ik een vriendschapsrelatie ontwikkeld met reisorganisatie X 1.000 .660
Ik ben bekend met de Facebookpagina van reisorganisatie X 1.000 .406
Mijn naam is bekend bij reisorganisatie X op Facebook 1.000 .675
Extraction Method: Principal Component Analysis.
Communalities for Confidence Benefits
Initial Extraction
Ik geloof dat er weinig risico is dat mijn privacy via Facebook geschonden wordt door
reisorganisatie X
1.000 .376
Ik kan de informatie op de Facebookpagina van reisorganisatie X vertrouwen 1.000 .533
Ik heb er vertrouwen in dat reisorganisatie X een goede dienst verleent op Facebook 1.000 .693
Door mijn relatie op Facebook met reisorganisatie X, heb ik minder angst bij het
boeken van een reis
1.000 .608
Door de Facebookpagina van reisorganisatie X weet ik wat ik van de organisatie kan
verwachten
1.000 .550
Op Facebook krijg ik de best mogelijke service van reisorganisatie X 1.000 .589
Extraction Method: Principal Component Analysis.

113
Communalities for Functional Benefits
Initial Extraction
De Facebookpagina van reisorganisatie X biedt mij gemak 1.000 .668
Ik haal voordeel uit het advies dat ik krijg via de Facebookpagina van reisorganisatie
X
1.000 .727
Ik kan betere beslissingen nemen bij het boeken van mijn reis door het gebruik van
de Facebookpagina van reisorganisatie X
1.000 .622
Reisorganisatie X houdt mij via Facebook op de hoogte van interessante reizen en
bestemmingen
1.000 .554
Extraction Method: Principal Component Analysis.
Communalities for Special Treatment Benefits
Initial Extraction
Via Facebook ontvang ik kortingen en speciale deals van reisorganisatie X die de
meeste klanten niet krijgen
1.000 .541
Via de Facebookpagina van reisorganisatie X krijg ik betere prijzen dan de meeste
klanten
1.000 .784
Via Facebook ontvang ik een service van reisorganisatie X die veel andere klanten
niet krijgen
1.000 .783
Indien nodig, kan ik via Facebook snellere service krijgen van reisorganisatie X 1.000 .719
Door middel van de Facebookpagina van reisorganisatie X bespaar ik tijd bij het
zoeken naar informatie
1.000 .540
Extraction Method: Principal Component Analysis.
Communalities for Hedonic Benefits
Initial Extraction
Ik vind mijn bezoek aan de Facebookpagina van reisorganisatie X telkens interessant 1.000 .642
Ik vind mijn bezoek aan de Facebookpagina van reisorganisatie X amusant 1.000 .705
Het bezoeken van de Facebookpagina van reisorganisatie X verblijdt mij 1.000 .792
Ik vind mijn bezoek aan de Facebookpagina van reisorganisatie X telkens prettig 1.000 .818
Door de Facebookpagina van reisorganisatie X krijg ik zin om te reizen 1.000 .515
Extraction Method: Principal Component Analysis.

114
Communalities for Customer e-Satisfaction
Initial Extraction
Vergeleken met andere Facebookpagina’s van reisorganisaties, ben ik erg tevreden
over de Facebookpagina van reisorganisatie X
1.000 .655
Op basis van al mijn ervaringen met de Facebookpagina van reisorganisatie X, ben
ik tevreden over hun dienstverlening
1.000 .746
Mijn ervaringen met de Facebookpagina van reisorganisatie X zijn altijd prettig 1.000 .746
Over het algemeen ben ik tevreden over de Facebookpagina van reisorganisatie X 1.000 .718
De Facebookpagina van reisorganisatie X gaat mijn verwachtingen te boven 1.000 .629
Extraction Method: Principal Component Analysis.
Communalities for Customer Satisfaction
Initial Extraction
Vergeleken met andere reisorganisaties, ben ik erg tevreden over reisorganisatie X
in het algemeen
1.000 .710
Op basis van al mijn ervaringen met reisorganisatie X, ben ik erg tevreden 1.000 .873
Mijn ervaringen met reisorganisatie X zijn altijd prettig 1.000 .864
Over het algemeen ben ik tevreden over reisorganisatie X 1.000 .857
Reisorganisatie X gaat in het algemeen mijn verwachtingen te boven 1.000 .555
Extraction Method: Principal Component Analysis.
Communalities for Customer e-Loyalty
Initial Extraction
Ik ben erg loyaal aan de Facebookpagina van reisorganisatie X 1.000 .777
Ik ben van plan om binnenkort weer gebruik te maken van de Facebookpagina van
reisorganisatie X
1.000 .716
Ik voel me erg verbonden met de Facebookpagina van reisorganisatie X 1.000 .865
Ik beschouw mezelf erg loyaal aan de Facebookpagina van reisorganisatie X 1.000 .870
Extraction Method: Principal Component Analysis.

115
Communalities for Customer Loyalty
Initial Extraction
In het algemeen ben ik erg loyaal aan reisorganisatie X 1.000 .812
Ik ben van plan om binnenkort weer gebruik te maken van reisorganisatie X 1.000 .812
Ik ben in het algemeen erg verbonden met reisorganisatie X 1.000 .845
Ik beschouw mezelf een loyale klant van reisorganisatie X 1.000 .861
Extraction Method: Principal Component Analysis.
Communalities for Relationship Commitment
Initial Extraction
Ik ben gehecht aan mijn relatie met reisorganisatie X 1.000 .868
De relatie met reisorganisatie X is belangrijk voor me 1.000 .902
Ik geef veel om de relatie met reisorganisatie X 1.000 .922
Mijn relatie met reisorganisatie X verdient mijn maximale inspanning om te
onderhouden
1.000 .819
Extraction Method: Principal Component Analysis.
Communalities for Word of Mouth
Initial Extraction
Ik raad reisorganisatie X vaak aan anderen aan 1.000 .879
Wanneer ik met vrienden of collega’s spreek over reisorganisatie X, ben ik ... 1.000 .855
Ik ben van plan reisorganisatie X bij anderen te introduceren 1.000 .860
Extraction Method: Principal Component Analysis.

116
Reliability analysis
Social Benefits (Cronbach’s α=.831)
Corrected
Item-Total
Correlation
Cronbach's
Alpha if Item
Deleted
Ik word herkend door reisorganisatie X op hun Facebookpagina .650 .792
Ik vind de sociale aspecten van mijn relatie met reisorganisatie X op Facebook
leuk
.667 .791
Via Facebook heb ik een vriendschapsrelatie ontwikkeld met reisorganisatie X .674 .784
Ik ben bekend met de Facebookpagina van reisorganisatie X .478 .837
Mijn naam is bekend bij reisorganisatie X op Facebook .699 .776
Confidence Benefits (Cronbach’s α=.836)
Corrected
Item-Total
Correlation
Cronbach's
Alpha if Item
Deleted
Ik geloof dat er weinig risico is dat mijn privacy via Facebook geschonden
wordt door reisorganisatie X
.462 .836
Ik kan de informatie op de Facebookpagina van reisorganisatie X vertrouwen .583 .815
Ik heb er vertrouwen in dat reisorganisatie X een goede dienst verleent op
.715 .792
Door mijn relatie op Facebook met reisorganisatie X, heb ik minder angst bij
het boeken van een reis
.667 .798
Door de Facebookpagina van reisorganisatie X weet ik wat ik van de
organisatie kan verwachten
.622 .807
Op Facebook krijg ik de best mogelijke service van reisorganisatie X .648 .801

117
Functional Benefits (Cronbach’s α=.813)
Corrected
Item-Total
Correlation
Cronbach's
Alpha if Item
Deleted
De Facebookpagina van reisorganisatie X biedt mij gemak .654 .757
Ik haal voordeel uit het advies dat ik krijg via de Facebookpagina van
reisorganisatie X
.705 .729
Ik kan betere beslissingen nemen bij het boeken van mijn reis door het gebruik
van de Facebookpagina van reisorganisatie X
.616 .774
Reisorganisatie X houdt mij via Facebook op de hoogte van interessante
reizen en bestemmingen
.560 .798
Special Treatment Benefits (Cronbach’s α=.873)
Corrected
Item-Total
Correlation
Cronbach's
Alpha if Item
Deleted
Via Facebook ontvang ik kortingen en speciale deals van reisorganisatie X die
de meeste klanten niet krijgen
.589 .874
Via de Facebookpagina van reisorganisatie X krijg ik betere prijzen dan de
meeste klanten
.801 .826
Via Facebook ontvang ik een service van reisorganisatie X die veel andere
klanten niet krijgen
.797 .822
Indien nodig, kan ik via Facebook snellere service krijgen van reisorganisatie
X
.748 .834
Door middel van de Facebookpagina van reisorganisatie X bespaar ik tijd bij
het zoeken naar informatie
.596 .872

118
Hedonic Benefits (Cronbach’s α=.885)
Corrected
Item-Total
Correlation
Cronbach's
Alpha if Item
Deleted
Ik vind mijn bezoek aan de Facebookpagina van reisorganisatie X telkens
interessant
.676 .871
Ik vind mijn bezoek aan de Facebookpagina van reisorganisatie X amusant .734 .857
Het bezoeken van de Facebookpagina van reisorganisatie X verblijdt mij .807 .840
Ik vind mijn bezoek aan de Facebookpagina van reisorganisatie X telkens
prettig
.836 .835
Door de Facebookpagina van reisorganisatie X krijg ik zin om te reizen .583 .894
Customer e-Satisfaction (Cronbach’s α=.891)
Corrected
Item-Total
Correlation
Cronbach's
Alpha if Item
Deleted
Vergeleken met andere Facebookpagina’s van reisorganisaties, ben ik erg
tevreden over de Facebookpagina van reisorganisatie X
.703 .875
Op basis van al mijn ervaringen met de Facebookpagina van reisorganisatie
X, ben ik tevreden over hun dienstverlening
.776 .858
Mijn ervaringen met de Facebookpagina van reisorganisatie X zijn altijd prettig .770 .860
Over het algemeen ben ik tevreden over de Facebookpagina van
reisorganisatie X
.747 .865
De Facebookpagina van reisorganisatie X gaat mijn verwachtingen te boven .682 .880

119
Customer Satisfaction (Cronbach’s α=.923)
Corrected
Item-Total
Correlation
Cronbach's
Alpha if Item
Deleted
Vergeleken met andere reisorganisaties, ben ik erg tevreden over
reisorganisatie X in het algemeen
.754 .914
Op basis van al mijn ervaringen met reisorganisatie X, ben ik erg tevreden .882 .888
Mijn ervaringen met reisorganisatie X zijn altijd prettig .873 .890
Over het algemeen ben ik tevreden over reisorganisatie X .869 .893
Reisorganisatie X gaat in het algemeen mijn verwachtingen te boven .638 .937
Customer e-Loyalty (Cronbach’s α=.920)
Corrected
Item-Total
Correlation
Cronbach's
Alpha if Item
Deleted
Ik ben erg loyaal aan de Facebookpagina van reisorganisatie X .790 .905
Ik ben van plan om binnenkort weer gebruik te maken van de Facebookpagina
van reisorganisatie X
.739 .922
Ik voel me erg verbonden met de Facebookpagina van reisorganisatie X .868 .878
Ik beschouw mezelf erg loyaal aan de Facebookpagina van reisorganisatie X .871 .877
Customer Loyalty (Cronbach’s α=.933)
Corrected
Item-Total
Correlation
Cronbach's
Alpha if Item
Deleted
In het algemeen ben ik erg loyaal aan reisorganisatie X .824 .918
Ik ben van plan om binnenkort weer gebruik te maken van reisorganisatie X .824 .918
Ik ben in het algemeen erg verbonden met reisorganisatie X .854 .909
Ik beschouw mezelf een loyale klant van reisorganisatie X .867 .904

120
Relationship Commitment (Cronbach’s α=.953)
Corrected
Item-Total
Correlation
Cronbach's
Alpha if Item
Deleted
Ik ben gehecht aan mijn relatie met reisorganisatie X .877 .941
De relatie met reisorganisatie X is belangrijk voor me .907 .932
Ik geef veel om de relatie met reisorganisatie X .926 .927
Mijn relatie met reisorganisatie X verdient mijn maximale inspanning om te
onderhouden
.835 .954
Word of Mouth (Cronbach’s α=.918)
Corrected
Item-Total
Correlation
Cronbach's
Alpha if Item
Deleted
Ik raad reisorganisatie X vaak aan anderen aan .856 .867
Wanneer ik met vrienden of collega’s spreek over reisorganisatie X, ben ik ... .831 .895
Ik ben van plan reisorganisatie X bij anderen te introduceren .837 .881

121
Appendix 4: Output used during confirmatory factor analysis
Table 17: Regression weights in the measurement model
Estimate P
A5 <--- Social_Benefits 1.000 ***
A4 <--- Social_Benefits .653 ***
A3 <--- Social_Benefits 1.079 ***
A2 <--- Social_Benefits .817 ***
A1 <--- Social_Benefits 1.020 ***
B6 <--- Confidence_Benefits 1.000 ***
B5 <--- Confidence_Benefits .960 ***
B4 <--- Confidence_Benefits 1.096 ***
B3 <--- Confidence_Benefits .833 ***
B2 <--- Confidence_Benefits .649 ***
B1 <--- Confidence_Benefits .572 ***
C4 <--- Functional_Benefits 1.000 ***
C3 <--- Functional_Benefits 1.185 ***
C2 <--- Functional_Benefits 1.438 ***
C1 <--- Functional_Benefits 1.213 ***
D5 <--- Special_Treatment_Benefits 1.000 ***
D4 <--- Special_Treatment_Benefits 1.115 ***
D3 <--- Special_Treatment_Benefits 1.129 ***
D2 <--- Special_Treatment_Benefits .987 ***
D1 <--- Special_Treatment_Benefits .914 ***
E5 <--- Hedonic_Benefits 1.000 ***
E4 <--- Hedonic_Benefits 1.193 ***
E3 <--- Hedonic_Benefits 1.171 ***
E2 <--- Hedonic_Benefits 1.016 ***
E1 <--- Hedonic_Benefits 1.093 ***
F1 <--- Customer_eSatisfaction 1.000 ***
F2 <--- Customer_eSatisfaction 1.176 ***
F3 <--- Customer_eSatisfaction 1.118 ***
F4 <--- Customer_eSatisfaction 1.106 ***
F5 <--- Customer_eSatisfaction 1.009 ***

122
Regression weights in the measurement model (continued)
Estimate P
G1 <--- Customer_Satisfaction 1.000 ***
G2 <--- Customer_Satisfaction 1.158 ***
G3 <--- Customer_Satisfaction 1.179 ***
G4 <--- Customer_Satisfaction 1.077 ***
G5 <--- Customer_Satisfaction .852 ***
H4 <--- Customer_eLoyalty 1.000 ***
H3 <--- Customer_eLoyalty .991 ***
H2 <--- Customer_eLoyalty .748 ***
H1 <--- Customer_eLoyalty .809 ***
I4 <--- Customer_Loyalty 1.000 ***
I3 <--- Customer_Loyalty .975 ***
I2 <--- Customer_Loyalty .878 ***
I1 <--- Customer_Loyalty .909 ***
J4 <--- Relationship_Commitment 1.000 ***
J3 <--- Relationship_Commitment 1.094 ***
J2 <--- Relationship_Commitment 1.086 ***
J1 <--- Relationship_Commitment 1.057 ***
K1 <--- WOM 1.000 ***
K2 <--- WOM .880 ***
K3 <--- WOM .947 ***
KMO and Bartlett’s Test
Latent variable #
Items
KMO Bartlett’s test
of sphericity
Sig.
Customer Loyaltya 8 .907 .000
a. Including items of the initial Customer Loyalty and Relationship
Commitment

123
Total Variance Explained for Customer Loyaltya
Component
Initial Eigenvalues Extraction Sums of Squared Loadings
Total
% of
Variance
Cumulative
% Total % of Variance Cumulative %
1 6.164 77.051 77.051 6.164 77.051 77.051
2 .728 9.097 86.148
3 .273 3.411 89.559
4 .256 3.200 92.759
5 .204 2.549 95.309
6 .179 2.237 97.546
7 .129 1.613 99.158
8 .067 .842 100.000
Extraction Method: Principal Component Analysis.
a. Including items of the initial Customer Loyalty and Relationship Commitment
Customer Loyaltya
a. Including items of the initial Customer Loyalty
and Relationship Commitment

124
Component Matrixa for Customer Loyaltyb
Component
1
In het algemeen ben ik erg loyaal aan reisorganisatie X .854
Ik ben van plan om binnenkort weer gebruik te maken van reisorganisatie X .827
Ik ben in het algemeen erg verbonden met reisorganisatie X .878
Ik beschouw mezelf een loyale klant van reisorganisatie X .893
Ik ben gehecht aan mijn relatie met reisorganisatie X .926
De relatie met reisorganisatie X is belangrijk voor me .914
Ik geef veel om de relatie met reisorganisatie X .896
Mijn relatie met reisorganisatie X verdient mijn maximale inspanning om te
onderhouden
.828
Extraction Method: Principal Component Analysis.
a. 1 components extracted.
b. Including items of the initial Customer Loyalty and Relationship Commitment
Communalities for Customer Loyaltya
Initial Extraction
In het algemeen ben ik erg loyaal aan reisorganisatie X 1.000 .729
Ik ben van plan om binnenkort weer gebruik te maken van reisorganisatie X 1.000 .684
Ik ben in het algemeen erg verbonden met reisorganisatie X 1.000 .772
Ik beschouw mezelf een loyale klant van reisorganisatie X 1.000 .797
Ik ben gehecht aan mijn relatie met reisorganisatie X 1.000 .858
De relatie met reisorganisatie X is belangrijk voor me 1.000 .836
Ik geef veel om de relatie met reisorganisatie X 1.000 .802
Mijn relatie met reisorganisatie X verdient mijn maximale inspanning om te
onderhouden
1.000 .686
Extraction Method: Principal Component Analysis.
a. Including items of the initial Customer Loyalty and Relationship Commitment.

125
Customer Loyaltya (Cronbach’s α=.957)
Corrected
Item-Total
Correlation
Cronbach's
Alpha if Item
Deleted
In het algemeen ben ik erg loyaal aan reisorganisatie X .807 .953
Ik ben van plan om binnenkort weer gebruik te maken van
reisorganisatie X
.775 .955
Ik ben in het algemeen erg verbonden met reisorganisatie X .836 .951
Ik beschouw mezelf een loyale klant van reisorganisatie X .855 .950
Ik ben gehecht aan mijn relatie met reisorganisatie X .900 .947
De relatie met reisorganisatie X is belangrijk voor me .885 .948
Ik geef veel om de relatie met reisorganisatie X .863 .950
Mijn relatie met reisorganisatie X verdient mijn maximale inspanning om
te onderhouden
.779 .955
a. Including items of the initial Customer Loyalty and Relationship Commitment

126
Covaried error terms and their modification indices
M.I. Par Change
ε41 ↔ ε40 16.858 .264
ε42 ↔ ε40 10.127 .189
ε42 ↔ ε41 15.477 .243
ε43 ↔ ε40 11.320 .195
ε43 ↔ ε41 19.546 .267
ε43 ↔ ε42 24.599 .277
ε45 ↔ ε40 11.268 -.163
ε45 ↔ ε42 13.618 -.172
ε46 ↔ ε41 21.810 -.258
ε46 ↔ ε42 15.408 -.201
ε46 ↔ ε43 28.783 -.267
ε46 ↔ ε45 45.852 .281
ε47 ↔ ε42 16.447 -.263
ε47 ↔ ε46 34.226 .339
ε48 ↔ ε50 16.381 .208
ε31 ↔ ε32 10.907 .140
ε28 ↔ ε29 10.856 .135
ε22 ↔ ε21 12.801 .214
ε25 ↔ ε21 13.317 -.274
ε17 ↔ ε16 14.697 .339
ε20 ↔ ε16 22.240 -.563
ε7 ↔ ε6 12.216 .331
ε8 ↔ ε7 30.729 .382
ε10 ↔ ε9 12.214 .409

127
Covariance between error terms and their justification
Variable Items with covaried
error terms
Justification
Confidence Benefits 7 ↔ 8 Both items are about trust in the organization.
9 ↔ 10 When people know what to expect, they probably
might have no fear during the booking and vice
versa.
6 ↔ 7 Trust in an organization for not violating one’s
privacy does not mean one can trust the information
provided and vice versa.
Special Treatment
Benefits
16 ↔ 17 Both items are about special deals.
16 ↔ 20 Special deals and discounts do not save time by
searching for information and vice versa.
Hedonic Benefits 21 ↔ 22 Customers might think visiting the Facebook page is
amusing when it is interesting and vice versa.
21 ↔ 25 Customers may think that the Facebook page is
interesting when they are going to feel like traveling
and vice versa.
Customer e-
Satisfaction
28 ↔ 29 When experiences with the Facebook page are
always pleasant, a customer will generally be
satisfied and vice versa
Customer Satisfaction 31 ↔ 32 Both items are about satisfaction with the tour
operator
Customer Loyalty 41 ↔ 40, 42 ↔ 40,
42 ↔ 41, 43 ↔ 40, 43 ↔ 41, 43 ↔ 42, 45 ↔ 40, 45 ↔ 42, 46 ↔ 41, 46 ↔ 42, 46 ↔ 43, 46 ↔ 45, 47 ↔ 42, 47 ↔ 46
All items are about feeling loyal and attached to the
organization, which is correlated to the desire to
book another holiday and providing effort in the
relationship
Word of Mouth 48 ↔ 50 If a customer recommends an organization to
someone else, he might intend to introduce this
organization to another person and the other way
around

128
Appendix 5: Output used during structural equation modeling
Table 18: Significant paths found with the proposed model
P-value
Customer Loyalty Social Benefits .003
Customer e-Satisfaction Hedonic Benefits ***
Customer Loyalty Customer Satisfaction ***
Customer Satisfaction Customer e-Satisfaction ***
Customer Loyalty Customer e-Loyalty .012
Word of Mouth Customer Loyalty ***
Word of Mouth Customer Satisfaction ***

129
Appendix 6: Output used during nested structural models testing
Best fitting models according to BCC
Model Params df C C-df BCC 0 BIC 0 C/df p Notes
32 143 1132 1999.957 867.957 0.000 0.000 1.767 0.000
42 144 1131 1997.114 866.114 0.127 2.212 1.766 0.000
52 145 1130 1994.186 864.186 0.171 4.341 1.765 0.000
43 144 1131 1997.348 866.348 0.362 2.447 1.766 0.000
62 146 1129 1991.938 862.938 0.895 7.149 1.764 0.000
44 144 1131 1997.910 866.910 0.924 3.009 1.766 0.000
54 145 1130 1995.133 865.133 1.119 5.288 1.766 0.000
64 146 1129 1992.242 863.242 1.199 7.453 1.765 0.000
45 144 1131 1998.206 867.206 1.220 3.305 1.767 0.000
55 145 1130 1995.261 865.261 1.247 5.416 1.766 0.000
56 145 1130 1995.307 865.307 1.292 5.462 1.766 0.000
46 144 1131 1998.329 867.329 1.343 3.427 1.767 0.000
47 144 1131 1998.696 867.696 1.710 3.795 1.767 0.000
57 145 1130 1995.741 865.741 1.726 5.896 1.766 0.000
58 145 1130 1995.898 865.898 1.883 6.053 1.766 0.000
48 144 1131 1998.941 867.941 1.955 4.040 1.767 0.000
59 145 1130 1996.078 866.078 2.063 6.233 1.766 0.000
Best fitting models according to BIC
Model Params df C C-df BCC 0 BIC 0 C/df p Notes
32 143 1132 1999.957 867.957 0.000 0.000 1.767 0.000
22 142 1133 2006.734 873.734 3.805 1.721 1.771 0.000
42 144 1131 1997.114 866.114 0.127 2.212 1.766 0.000

130
Best fitting models for different parameters (short list)
Model Params df C C-df BCC 0 BIC 0 C/df p Notes
1 139 1136 2224.558 1088.588 212.714 204.375 1.958 0.000
2 140 1135 2074.926 939.926 66.055 59.800 1.828 0.000
12 141 1134 2027.104 893.104 21.203 17.034 1.788 0.000
22 142 1133 2006.734 873.734 3.805 1.721 1.771 0.000
32 143 1132 1999.957 867.957 0.000 0.000 1.767 0.000
42 144 1131 1997.114 866.114 0.127 2.212 1.766 0.000
52 145 1130 1994.186 864.186 0.171 4.341 1.765 0.000
62 146 1129 1991.938 862.938 0.895 7.149 1.764 0.000
72 147 1128 1990.478 862.478 2.406 10.745 1.765 0.000
82 148 1127 1989.418 862.418 4.317 14.742 1.765 0.000
93 149 1126 1988.822 862.822 6.693 19.202 1.766 0.000
108 150 1125 1988.347 863.347 9.190 23.783 1.767 0.000
112 151 1124 1987.407 863.407 11.221 27.900 1.768 0.000 Unstable
122 152 1123 1987.158 864.158 13.944 32.707 1.770 0.000 Unstable
132 153 1122 1986.942 864.942 16.698 37.547 1.771 0.000 Unstable
142 154 1121 1986.811 19.540 19.540 42.473 1.772 0.000 Unstable
152 155 1120 1986.766 866.766 22.466 47.483 1.774 0.000 Unstable
162 156 1119 1986.470 867.470 25.142 52.244 1.775 0.000 Unstable
178 157 1118 1988.470 870.470 30.113 59.300 1.779 0.000
182 158 1117 0.000 Iteration
Limit

131
Table 19: Significant indirect effects found by the final model
Hedonic
Benefits
Special
Treatment
Benefits
Functional
Benefits
Confidence
Benefits
Social
Benefits
Customer
eSatisfaction
Customer
eLoyalty
Customer
Satisfaction
Customer
Loyalty WOM
Customer
eSatisfaction ,000 ,000 ,000 ,000 ,000 ,000 ,000 ,000 ,000 ,000
Customer
eLoyalty ,493 ,000 ,000 ,429 ,000 ,000 ,000 ,000 ,000 ,000
Customer
Satisfaction ,347 ,000 ,000 ,302 ,000 ,000 ,000 ,000 ,000 ,000
Customer
Loyalty ,384 ,000 ,000 ,334 ,093 ,838 ,000 ,000 ,000 ,000
WOM ,407 ,000 -,173 ,354 ,155 ,888 ,120 ,154 ,000 ,000