Social media analytics: a survey of techniques, tools and...
28
OPEN FORUM Social media analytics: a survey of techniques, tools and platforms Bogdan Batrinca • Philip C. Treleaven Received: 25 February 2014 / Accepted: 4 July 2014 / Published online: 26 July 2014 Ó The Author(s) 2014. This article is published with open access at Springerlink.com Abstract This paper is written for (social science) researchers seeking to analyze the wealth of social media now available. It presents a comprehensive review of software tools for social networking media, wikis, really simple syndication feeds, blogs, newsgroups, chat and news feeds. For completeness, it also includes introduc- tions to social media scraping, storage, data cleaning and sentiment analysis. Although principally a review, the paper also provides a methodology and a critique of social media tools. Analyzing social media, in particular Twitter feeds for sentiment analysis, has become a major research and business activity due to the availability of web-based application programming interfaces (APIs) provided by Twitter, Facebook and News services. This has led to an ‘explosion’ of data services, software tools for scraping and analysis and social media analytics platforms. It is also a research area undergoing rapid change and evolution due to commercial pressures and the potential for using social media data for computational (social science) research. Using a simple taxonomy, this paper provides a review of leading software tools and how to use them to scrape, cleanse and analyze the spectrum of social media. In addition, it discussed the requirement of an experimental computational environment for social media research and presents as an illustration the system architecture of a social media (analytics) platform built by University Col- lege London. The principal contribution of this paper is to provide an overview (including code fragments) for scientists seeking to utilize social media scraping and analytics either in their research or business. The data retrieval techniques that are presented in this paper are valid at the time of writing this paper (June 2014), but they are subject to change since social media data scraping APIs are rapidly changing. Keywords Social media Scraping Behavior economics Sentiment analysis Opinion mining NLP Toolkits Software platforms 1 Introduction Social media is defined as web-based and mobile-based Internet applications that allow the creation, access and exchange of user-generated content that is ubiquitously accessible (Kaplan and Haenlein 2010). Besides social networking media (e.g., Twitter and Facebook), for con- venience, we will also use the term ‘social media’ to encompass really simple syndication (RSS) feeds, blogs, wikis and news, all typically yielding unstructured text and accessible through the web. Social media is especially important for research into computational social science that investigates questions (Lazer et al. 2009) using quantitative techniques (e.g., computational statistics, machine learning and complexity) and so-called big data for data mining and simulation modeling (Cioffi-Revilla 2010). This has led to numerous data services, tools and ana- lytics platforms. However, this easy availability of social media data for academic research may change significantly due to commercial pressures. In addition, as discussed in Sect. 2, the tools available to researchers are far from ideal. They either give superficial access to the raw data or (for B. Batrinca P. C. Treleaven (&) Department of Computer Science, University College London, Gower Street, London WC1E 6BT, UK e-mail: [email protected] B. Batrinca e-mail: [email protected] 123 AI & Soc (2015) 30:89–116 DOI 10.1007/s00146-014-0549-4
Transcript of Social media analytics: a survey of techniques, tools and...
OPEN FORUM
Social media analytics: a survey of techniques, tools and platforms
Bogdan Batrinca • Philip C. Treleaven
Received: 25 February 2014 / Accepted: 4 July 2014 / Published online: 26 July 2014
� The Author(s) 2014. This article is published with open access at Springerlink.com
Abstract This paper is written for (social science)
researchers seeking to analyze the wealth of social media
now available. It presents a comprehensive review of
software tools for social networking media, wikis, really
simple syndication feeds, blogs, newsgroups, chat and
news feeds. For completeness, it also includes introduc-
tions to social media scraping, storage, data cleaning and
sentiment analysis. Although principally a review, the
paper also provides a methodology and a critique of social
media tools. Analyzing social media, in particular Twitter
feeds for sentiment analysis, has become a major research
and business activity due to the availability of web-based
application programming interfaces (APIs) provided by
Twitter, Facebook and News services. This has led to an
‘explosion’ of data services, software tools for scraping and
analysis and social media analytics platforms. It is also a
research area undergoing rapid change and evolution due to
commercial pressures and the potential for using social
media data for computational (social science) research.
Using a simple taxonomy, this paper provides a review of
leading software tools and how to use them to scrape,
cleanse and analyze the spectrum of social media. In
addition, it discussed the requirement of an experimental
computational environment for social media research and
presents as an illustration the system architecture of a
social media (analytics) platform built by University Col-
lege London. The principal contribution of this paper is to
provide an overview (including code fragments) for
scientists seeking to utilize social media scraping and
analytics either in their research or business. The data
retrieval techniques that are presented in this paper are
valid at the time of writing this paper (June 2014), but they
are subject to change since social media data scraping APIs
are rapidly changing.
Keywords Social media � Scraping � Behavior
economics � Sentiment analysis � Opinion mining �NLP � Toolkits � Software platforms
1 Introduction
Social media is defined as web-based and mobile-based
Internet applications that allow the creation, access and
exchange of user-generated content that is ubiquitously
accessible (Kaplan and Haenlein 2010). Besides social
networking media (e.g., Twitter and Facebook), for con-
venience, we will also use the term ‘social media’ to
encompass really simple syndication (RSS) feeds, blogs,
wikis and news, all typically yielding unstructured text
and accessible through the web. Social media is especially
important for research into computational social science
that investigates questions (Lazer et al. 2009) using
quantitative techniques (e.g., computational statistics,
machine learning and complexity) and so-called big data
for data mining and simulation modeling (Cioffi-Revilla
2010).
This has led to numerous data services, tools and ana-
lytics platforms. However, this easy availability of social
media data for academic research may change significantly
due to commercial pressures. In addition, as discussed in
Sect. 2, the tools available to researchers are far from ideal.
They either give superficial access to the raw data or (for
B. Batrinca � P. C. Treleaven (&)
Department of Computer Science, University College London,
Gower Street, London WC1E 6BT, UK
e-mail: [email protected]
B. Batrinca
e-mail: [email protected]
123
AI & Soc (2015) 30:89–116
DOI 10.1007/s00146-014-0549-4

non-superficial access) require researchers to program
analytics in a language such as Java.
1.1 Terminology
We start with definitions of some of the key techniques
related to analyzing unstructured textual data:
• Natural language processing—(NLP) is a field of
computer science, artificial intelligence and linguistics
concerned with the interactions between computers and
human (natural) languages. Specifically, it is the
process of a computer extracting meaningful informa-
tion from natural language input and/or producing
natural language output.
• News analytics—the measurement of the various
qualitative and quantitative attributes of textual
(unstructured data) news stories. Some of these attri-
butes are: sentiment, relevance and novelty.
• Opinion mining—opinion mining (sentiment mining,
opinion/sentiment extraction) is the area of research
that attempts to make automatic systems to determine
human opinion from text written in natural language.
• Scraping—collecting online data from social media
and other Web sites in the form of unstructured text and
also known as site scraping, web harvesting and web
data extraction.
• Sentiment analysis—sentiment analysis refers to the
application of natural language processing, computa-
tional linguistics and text analytics to identify and
extract subjective information in source materials.
• Text analytics—involves information retrieval (IR),
lexical analysis to study word frequency distributions,
pattern recognition, tagging/annotation, information
extraction, data mining techniques including link and
association analysis, visualization and predictive
analytics.
1.2 Research challenges
Social media scraping and analytics provides a rich source
of academic research challenges for social scientists,
computer scientists and funding bodies. Challenges
include:
• Scraping—although social media data is accessible
through APIs, due to the commercial value of the data,
most of the major sources such as Facebook and
Google are making it increasingly difficult for academ-
ics to obtain comprehensive access to their ‘raw’ data;
very few social data sources provide affordable data
offerings to academia and researchers. News services
such as Thomson Reuters and Bloomberg typically
charge a premium for access to their data. In contrast,
Twitter has recently announced the Twitter Data Grants
program, where researchers can apply to get access to
Twitter’s public tweets and historical data in order to
get insights from its massive set of data (Twitter has
more than 500 million tweets a day).
• Data cleansing—cleaning unstructured textual data
(e.g., normalizing text), especially high-frequency
streamed real-time data, still presents numerous prob-
lems and research challenges.
• Holistic data sources—researchers are increasingly
bringing together and combining novel data sources:
social media data, real-time market & customer data
and geospatial data for analysis.
• Data protection—once you have created a ‘big data’
resource, the data needs to be secured, ownership and
IP issues resolved (i.e., storing scraped data is against
most of the publishers’ terms of service), and users
provided with different levels of access; otherwise,
users may attempt to ‘suck’ all the valuable data from
the database.
• Data analytics—sophisticated analysis of social media
data for opinion mining (e.g., sentiment analysis) still
raises a myriad of challenges due to foreign languages,
foreign words, slang, spelling errors and the natural
evolving of language.
• Analytics dashboards—many social media platforms
require users to write APIs to access feeds or program
analytics models in a programming language, such as
Java. While reasonable for computer scientists, these
skills are typically beyond most (social science)
researchers. Non-programming interfaces are required
for giving what might be referred to as ‘deep’ access to
‘raw’ data, for example, configuring APIs, merging
social media feeds, combining holistic sources and
developing analytical models.
• Data visualization—visual representation of data
whereby information that has been abstracted in some
schematic form with the goal of communicating
information clearly and effectively through graphical
means. Given the magnitude of the data involved,
visualization is becoming increasingly important.
1.3 Social media research and applications
Social media data is clearly the largest, richest and most
dynamic evidence base of human behavior, bringing new
opportunities to understand individuals, groups and society.
Innovative scientists and industry professionals are
increasingly finding novel ways of automatically collect-
ing, combining and analyzing this wealth of data. Natu-
rally, doing justice to these pioneering social media
90 AI & Soc (2015) 30:89–116
123

applications in a few paragraphs is challenging. Three
illustrative areas are: business, bioscience and social
science.
The early business adopters of social media analysis
were typically companies in retail and finance. Retail
companies use social media to harness their brand aware-
ness, product/customer service improvement, advertising/
marketing strategies, network structure analysis, news
propagation and even fraud detection. In finance, social
media is used for measuring market sentiment and news
data is used for trading. As an illustration, Bollen et al.
(2011) measured sentiment of random sample of Twitter
data, finding that Dow Jones Industrial Average (DJIA)
prices are correlated with the Twitter sentiment 2–3 days
earlier with 87.6 percent accuracy. Wolfram (2010) used
Twitter data to train a Support Vector Regression (SVR)
model to predict prices of individual NASDAQ stocks,
finding ‘significant advantage’ for forecasting prices
15 min in the future.
In the biosciences, social media is being used to collect
data on large cohorts for behavioral change initiatives and
impact monitoring, such as tackling smoking and obesity or
monitoring diseases. An example is Penn State University
biologists (Salathe et al. 2012) who have developed inno-
vative systems and techniques to track the spread of
infectious diseases, with the help of news Web sites, blogs
and social media.
Computational social science applications include: mon-
itoring public responses to announcements, speeches and
events especially political comments and initiatives; insights
into community behavior; social media polling of (hard to
contact) groups; early detection of emerging events, as with
Twitter. For example, Lerman et al. (2008) use computational
linguistics to automatically predict the impact of news on the
public perception of political candidates. Yessenov and Mi-
sailovic (2009) use movie review comments to study the
effect of various approaches in extracting text features on the
accuracy of four machine learning methods—Naive Bayes,
Decision Trees, Maximum Entropy and K-Means clustering.
Lastly, Karabulut (2013) found that Facebook’s Gross
National Happiness (GNH) exhibits peaks and troughs in-line
with major public events in the USA.
1.4 Social media overview
For this paper, we group social media tools into:
• Social media data—social media data types (e.g.,
social network media, wikis, blogs, RSS feeds and
news, etc.) and formats (e.g., XML and JSON). This
includes data sets and increasingly important real-time
data feeds, such as financial data, customer transaction
data, telecoms and spatial data.
• Social media programmatic access—data services
and tools for sourcing and scraping (textual) data from
social networking media, wikis, RSS feeds, news, etc.
These can be usefully subdivided into:
• Data sources, services and tools—where data is
accessed by tools which protect the raw data or
provide simple analytics. Examples include: Google
Trends, SocialMention, SocialPointer and Social-
Seek, which provide a stream of information that
aggregates various social media feeds.
• Data feeds via APIs—where data sets and feeds are
accessible via programmable HTTP-based APIs and
return tagged data using XML or JSON, etc.
Examples include Wikipedia, Twitter and Facebook.
• Text cleaning and storage tools—tools for cleaning
and storing textual data. Google Refine and DataWran-
gler are examples for data cleaning.
• Text analysis tools—individual or libraries of tools for
analyzing social media data once it has been scraped
and cleaned. These are mainly natural language
processing, analysis and classification tools, which are
explained below.
• Transformation tools—simple tools that can trans-
form textual input data into tables, maps, charts
(line, pie, scatter, bar, etc.), timeline or even motion
(animation over timeline), such as Google Fusion
Tables, Zoho Reports, Tableau Public or IBM’s
Many Eyes.
• Analysis tools—more advanced analytics tools for
analyzing social data, identifying connections and
building networks, such as Gephi (open source) or
the Excel plug-in NodeXL.
• Social media platforms—environments that provide
comprehensive social media data and libraries of tools
for analytics. Examples include: Thomson Reuters
Machine Readable News, Radian 6 and Lexalytics.
• Social network media platforms—platforms that
provide data mining and analytics on Twitter,
Facebook and a wide range of other social network
media sources.
• News platforms—platforms such as Thomson Reu-
ters providing commercial news archives/feeds and
associated analytics.
2 Social media methodology and critique
The two major impediments to using social media for
academic research are firstly access to comprehensive data
sets and secondly tools that allow ‘deep’ data analysis
AI & Soc (2015) 30:89–116 91
123
without the need to be able to program in a language such
as Java. The majority of social media resources are com-
mercial and companies are naturally trying to monetize
their data. As discussed, it is important that researchers
have access to open-source ‘big’ (social media) data sets
and facilities for experimentation. Otherwise, social media
research could become the exclusive domain of major
companies, government agencies and a privileged set of
academic researchers presiding over private data from
which they produce papers that cannot be critiqued or
replicated. Recently, there has been a modest response, as
Twitter and Gnip are piloting a new program for data
access, starting with 5 all-access data grants to select
applicants.
2.1 Methodology
Research requirements can be grouped into: data, analytics
and facilities.
2.1.1 Data
Researchers need online access to historic and real-time
social media data, especially the principal sources, to
conduct world-leading research:
• Social network media—access to comprehensive
historic data sets and also real-time access to sources,
possibly with a (15 min) time delay, as with Thomson
Reuters and Bloomberg financial data.
• News data—access to historic data and real-time news
data sets, possibly through the concept of ‘educational
data licenses’ (cf. software license).
• Public data—access to scraped and archived important
public data; available through RSS feeds, blogs or open
government databases.
• Programmable interfaces—researchers also need
access to simple application programming interfaces
(APIs) to scrape and store other available data sources
that may not be automatically collected.
2.1.2 Analytics
Currently, social media data is typically either available
via simple general routines or require the researcher
to program their analytics in a language such as MAT-
LAB, Java or Python. As discussed above, researchers
require:
• Analytics dashboards—non-programming interfaces
are required for giving what might be termed as ‘deep’
access to ‘raw’ data.
• Holistic data analysis—tools are required for combin-
ing (and conducting analytics across) multiple social
media and other data sets.
• Data visualization—researchers also require visuali-
zation tools whereby information that has been
abstracted can be visualized in some schematic form
with the goal of communicating information clearly and
effectively through graphical means.
2.1.3 Facilities
Lastly, the sheer volume of social media data being gen-
erated argues for national and international facilities to be
established to support social media research (cf. Wharton
Research Data Services https://wrds-web.wharton.upenn.
edu):
• Data storage—the volume of social media data,
current and projected, is beyond most individual
universities and hence needs to be addressed at a
national science foundation level. Storage is required
both for principal data sources (e.g., Twitter), but also
for sources collected by individual projects and
archived for future use by other researchers.
• Computational facility—remotely accessible compu-
tational facilities are also required for: a) protecting
access to the stored data; b) hosting the analytics and
visualization tools; and c) providing computational
resources such as grids and GPUs required for
processing the data at the facility rather than transmit-
ting it across a network.
2.2 Critique
Much needs to be done to support social media research.
As discussed, the majority of current social media resour-
ces are commercial, expensive and difficult for academics
to obtain full access.
2.2.1 Data
In general, access to important sources of social media data
is frequently restricted and full commercial access is
expensive.
• Siloed data—most data sources (e.g., Twitter) have
inherently isolated information making it difficult to
combine with other data sources.
• Holistic data—in contrast, researchers are increasingly
interested in accessing, storing and combining novel
data sources: social media data, real-time financial
market & customer data and geospatial data for
92 AI & Soc (2015) 30:89–116
123
analysis. This is currently extremely difficult to do even
for Computer Science departments.
2.2.2 Analytics
Analytical tools provided by vendors are often tied to a
single data set, maybe limited in analytical capability, and
data charges make them expensive to use.
2.2.3 Facilities
There are an increasing number of powerful commercial
platforms, such as the ones supplied by SAS and Thomson
Reuters, but the charges are largely prohibitive for aca-
demic research. Either comparable facilities need to be
provided by national science foundations or vendors need
to be persuaded to introduce the concept of an ‘educational
license.’
3 Social media data
Clearly, there is a large and increasing number of (com-
mercial) services providing access to social networking
media (e.g., Twitter, Facebook and Wikipedia) and news
services (e.g., Thomson Reuters Machine Readable News).
Equivalent major academic services are scarce.We start by
discussing types of data and formats produced by these
services.
3.1 Types of data
Although we focus on social media, as discussed,
researchers are continually finding new and innovative
sources of data to bring together and analyze. So when
considering textual data analysis, we should consider
multiple sources (e.g., social networking media, RSS
feeds, blogs and news) supplemented by numeric (finan-
cial) data, telecoms data, geospatial data and potentially
speech and video data. Using multiple data sources is
certainly the future of analytics.
Broadly, data subdivides into:
• Historic data sets—previously accumulated and stored
social/news, financial and economic data.
• Real-time feeds—live data feeds from streamed social
media, news services, financial exchanges, telecoms
services, GPS devices and speech.
And into:
• Raw data—unprocessed computer data straight from
source that may contain errors or may be unanalyzed.
• Cleaned data—correction or removal of erroneous
(dirty) data caused by disparities, keying mistakes,
missing bits, outliers, etc.
• Value-added data—data that has been cleaned, ana-
lyzed, tagged and augmented with knowledge.
3.2 Text data formats
The four most common formats used to markup text are:
HTML, XML, JSON and CSV.
• HTML—HyperText Markup Language (HTML) as
well-known is the markup language for web pages and
other information that can be viewed in a web browser.
HTML consists of HTML elements, which include tags
enclosed in angle brackets (e.g., \div[), within the
content of the web page.
• XML—Extensible Markup Language (XML)—the
markup language for structuring textual data using
\tag[…\\tag[ to define elements.
• JSON—JavaScript Object Notation (JSON) is a text-
based open standard designed for human-readable data
interchange and is derived from JavaScript.
• CSV—a comma-separated values (CSV) file contains
the values in a table as a series of ASCII text lines
organized such that each column value is separated by a
comma from the next column’s value and each row
starts a new line.
For completeness, HTML and XML are so-called
markup languages (markup and content) that define a set of
simple syntactic rules for encoding documents in a format
both human readable and machine readable. A markup
comprises start-tags (e.g., \tag[), content text and end-
tags (e.g., \/tag[).
Many feeds use JavaScript Object Notation (JSON), the
lightweight data-interchange format, based on a subset of
the JavaScript Programming Language. JSON is a lan-
guage-independent text format that uses conventions that
are familiar to programmers of the C-family of languages,
including C, C??, C#, Java, JavaScript, Perl, Python, and
many others. JSON’s basic types are: Number, String,
Boolean, Array (an ordered sequence of values, comma-
separated and enclosed in square brackets) and Object (an
unordered collection of key:value pairs). The JSON format
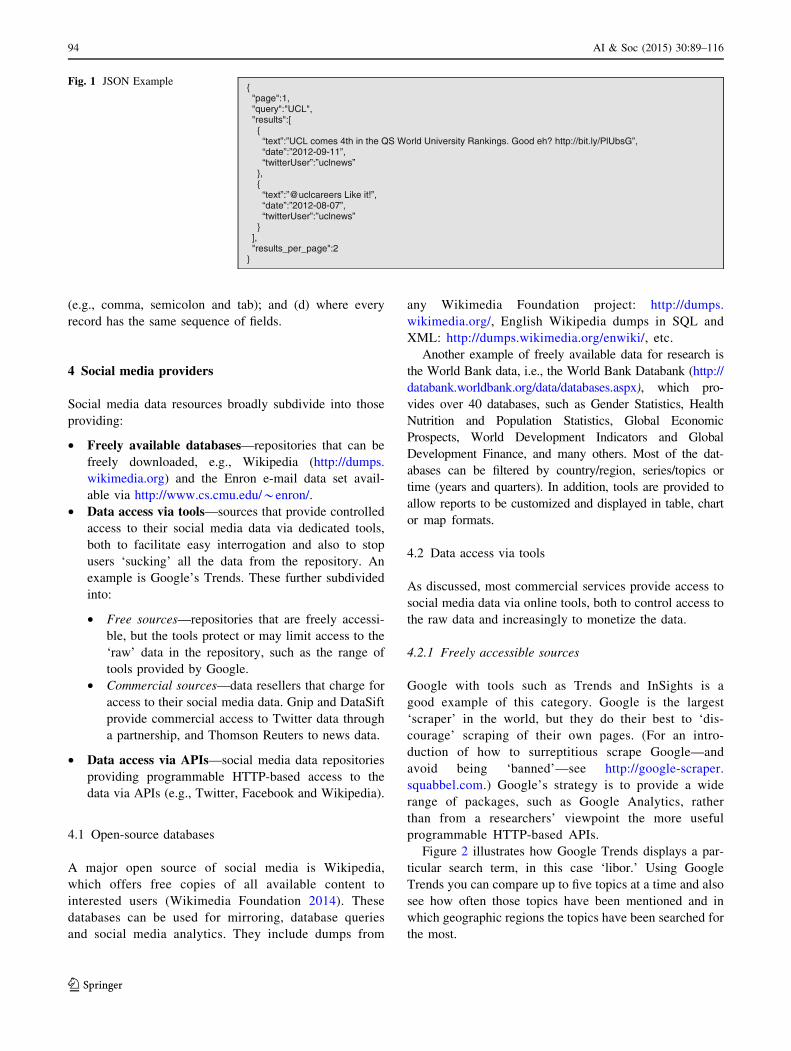
is illustrated in Fig. 1 for a query on the Twitter API on the
string ‘UCL,’ which returns two ‘text’ results from the
Twitter user ‘uclnews.’
Comma-separated values are not a single, well-defined
format but rather refer to any text file that: (a) is plain text
using a character set such as ASCII, Unicode or EBCDIC;
(b) consists of text records (e.g., one record per line);
(c) with records divided into fields separated by delimiters
AI & Soc (2015) 30:89–116 93
123
(e.g., comma, semicolon and tab); and (d) where every
record has the same sequence of fields.
4 Social media providers
Social media data resources broadly subdivide into those
providing:
• Freely available databases—repositories that can be
freely downloaded, e.g., Wikipedia (http://dumps.
wikimedia.org) and the Enron e-mail data set avail-
able via http://www.cs.cmu.edu/*enron/.
• Data access via tools—sources that provide controlled
access to their social media data via dedicated tools,
both to facilitate easy interrogation and also to stop
users ‘sucking’ all the data from the repository. An
example is Google’s Trends. These further subdivided
into:
• Free sources—repositories that are freely accessi-
ble, but the tools protect or may limit access to the
‘raw’ data in the repository, such as the range of
tools provided by Google.
• Commercial sources—data resellers that charge for
access to their social media data. Gnip and DataSift
provide commercial access to Twitter data through
a partnership, and Thomson Reuters to news data.
• Data access via APIs—social media data repositories
providing programmable HTTP-based access to the
data via APIs (e.g., Twitter, Facebook and Wikipedia).
4.1 Open-source databases
A major open source of social media is Wikipedia,
which offers free copies of all available content to
interested users (Wikimedia Foundation 2014). These
databases can be used for mirroring, database queries
and social media analytics. They include dumps from
any Wikimedia Foundation project: http://dumps.
wikimedia.org/, English Wikipedia dumps in SQL and
XML: http://dumps.wikimedia.org/enwiki/, etc.
Another example of freely available data for research is
the World Bank data, i.e., the World Bank Databank (http://
databank.worldbank.org/data/databases.aspx), which pro-
vides over 40 databases, such as Gender Statistics, Health
Nutrition and Population Statistics, Global Economic
Prospects, World Development Indicators and Global
Development Finance, and many others. Most of the dat-
abases can be filtered by country/region, series/topics or
time (years and quarters). In addition, tools are provided to
allow reports to be customized and displayed in table, chart
or map formats.
4.2 Data access via tools
As discussed, most commercial services provide access to
social media data via online tools, both to control access to
the raw data and increasingly to monetize the data.
4.2.1 Freely accessible sources
Google with tools such as Trends and InSights is a
good example of this category. Google is the largest
‘scraper’ in the world, but they do their best to ‘dis-
courage’ scraping of their own pages. (For an intro-
duction of how to surreptitious scrape Google—and
avoid being ‘banned’—see http://google-scraper.
squabbel.com.) Google’s strategy is to provide a wide
range of packages, such as Google Analytics, rather
than from a researchers’ viewpoint the more useful
programmable HTTP-based APIs.
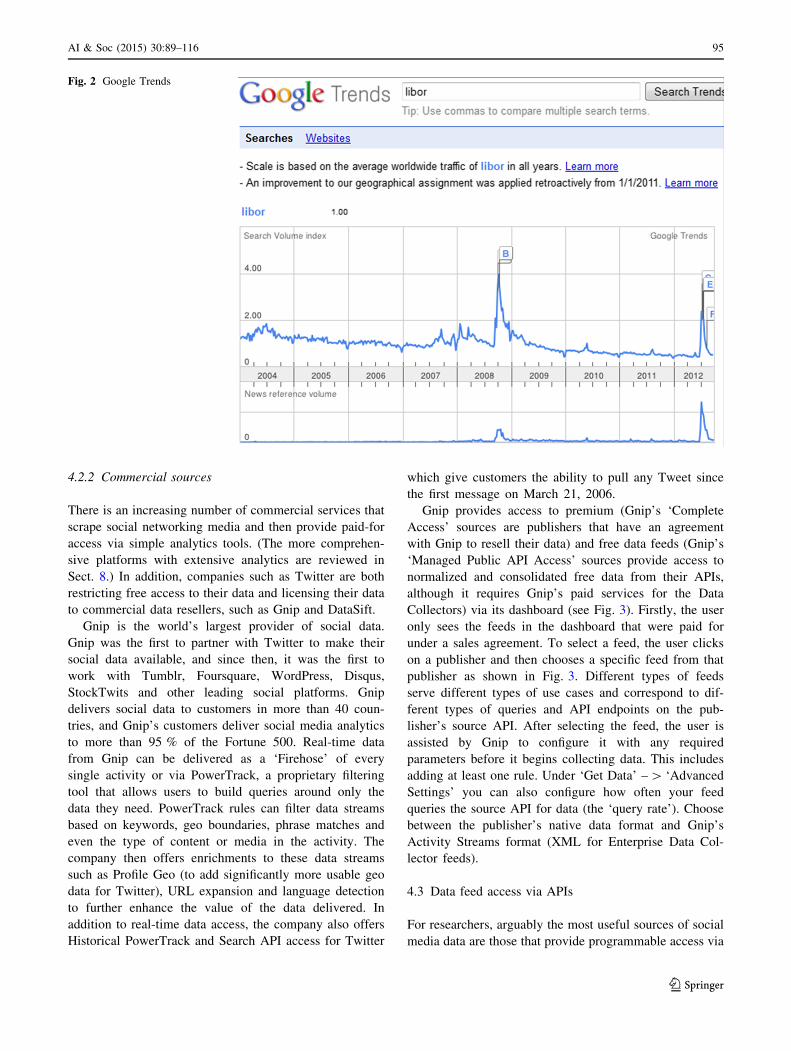
Figure 2 illustrates how Google Trends displays a par-
ticular search term, in this case ‘libor.’ Using Google
Trends you can compare up to five topics at a time and also
see how often those topics have been mentioned and in
which geographic regions the topics have been searched for
the most.
{ "page":1, "query":"UCL", "results":[ { “text”:”UCL comes 4th in the QS World University Rankings. Good eh? http://bit.ly/PlUbsG”, “date”:”2012-09-11”, “twitterUser”:”uclnews” }, { “text”:”@uclcareers Like it!”, “date”:”2012-08-07”, “twitterUser”:”uclnews” } ], "results_per_page":2 }
Fig. 1 JSON Example
94 AI & Soc (2015) 30:89–116
123
4.2.2 Commercial sources
There is an increasing number of commercial services that
scrape social networking media and then provide paid-for
access via simple analytics tools. (The more comprehen-
sive platforms with extensive analytics are reviewed in
Sect. 8.) In addition, companies such as Twitter are both
restricting free access to their data and licensing their data
to commercial data resellers, such as Gnip and DataSift.
Gnip is the world’s largest provider of social data.
Gnip was the first to partner with Twitter to make their
social data available, and since then, it was the first to
work with Tumblr, Foursquare, WordPress, Disqus,
StockTwits and other leading social platforms. Gnip
delivers social data to customers in more than 40 coun-
tries, and Gnip’s customers deliver social media analytics
to more than 95 % of the Fortune 500. Real-time data
from Gnip can be delivered as a ‘Firehose’ of every
single activity or via PowerTrack, a proprietary filtering
tool that allows users to build queries around only the
data they need. PowerTrack rules can filter data streams
based on keywords, geo boundaries, phrase matches and
even the type of content or media in the activity. The
company then offers enrichments to these data streams
such as Profile Geo (to add significantly more usable geo
data for Twitter), URL expansion and language detection
to further enhance the value of the data delivered. In
addition to real-time data access, the company also offers
Historical PowerTrack and Search API access for Twitter
which give customers the ability to pull any Tweet since
the first message on March 21, 2006.
Gnip provides access to premium (Gnip’s ‘Complete
Access’ sources are publishers that have an agreement
with Gnip to resell their data) and free data feeds (Gnip’s
‘Managed Public API Access’ sources provide access to
normalized and consolidated free data from their APIs,
although it requires Gnip’s paid services for the Data
Collectors) via its dashboard (see Fig. 3). Firstly, the user
only sees the feeds in the dashboard that were paid for
under a sales agreement. To select a feed, the user clicks
on a publisher and then chooses a specific feed from that
publisher as shown in Fig. 3. Different types of feeds
serve different types of use cases and correspond to dif-
ferent types of queries and API endpoints on the pub-
lisher’s source API. After selecting the feed, the user is
assisted by Gnip to configure it with any required
parameters before it begins collecting data. This includes
adding at least one rule. Under ‘Get Data’ – [ ‘Advanced
Settings’ you can also configure how often your feed
queries the source API for data (the ‘query rate’). Choose
between the publisher’s native data format and Gnip’s
Activity Streams format (XML for Enterprise Data Col-
lector feeds).
4.3 Data feed access via APIs
For researchers, arguably the most useful sources of social
media data are those that provide programmable access via
Fig. 2 Google Trends
AI & Soc (2015) 30:89–116 95
123

APIs, typically using HTTP-based protocols. Given their
importance to academics, here, we review individually
wikis, social networking media, RSS feeds, news, etc.
4.3.1 Wiki media
Wikipedia (and wikis in general) provides academics with
large open-source repositories of user-generated (crowd-
sourced) content. What is not widely known is that Wiki-
pedia provides HTTP-based APIs that allows programma-
ble access and searching (i.e., scraping) that returns data in
a variety of formats including XML. In fact, the API is not
unique to Wikipedia but part of MediaWiki’s (http://www.
mediawiki.org/) open-source toolkit and hence can be used
with any MediaWiki-based wikis.
The wiki HTTP-based API works by accepting requests
containing one or more input arguments and returning
strings, often in XML format, that can be parsed and used
by the requesting client. Other formats supported include
JSON, WDDX, YAML, or PHP serialized. Details can be
found at: http://en.wikipedia.org/w/api.php?action=
query&list=allcategories&acprop=size&acprefix=hollywood
&format=xml.
The HTTP request must contain: a) the requested
‘action,’ such as query, edit or delete operation; b) an
authentication request; and c) any other supported actions.
For example, the above request returns an XML string
listing the first 10 Wikipedia categories with the prefix
‘hollywood.’ Vaswani (2011) provides a detailed descrip-
tion of how to scrape Wikipedia using an Apache/PHP
development environment and an HTTP client capable of
transmitting GET and PUT requests and handling
responses.
4.3.2 Social networking media
As with Wikipedia, popular social networks, such as
Facebook, Twitter and Foursquare, make a proportion of
their data accessible via APIs.
Although many social networking media sites provide
APIs, not all sites (e.g., Bing, LinkedIn and Skype) provide
API access for scraping data. While more and more social
Fig. 3 Gnip Dashboard, Publishers and Feeds
96 AI & Soc (2015) 30:89–116
123
networks are shifting to publicly available content, many
leading networks are restricting free access, even to aca-
demics. For example, Foursquare announced in December
2013 that it will no longer allow private check-ins on iOS
7, and has now partnered with Gnip to provide a continuous
stream of anonymized check-in data. The data is available
in two packages: the full Firehose access level and a fil-
tered version via Gnip’s PowerTrack service. Here, we
briefly discuss the APIs provided by Twitter and Facebook.
4.3.2.1 Twitter The default account setting keeps users’
Tweets public, although users can protect their Tweets and
make them visible only to their approved Twitter followers.
However, less than 10 % of all the Twitter accounts are
private. Tweets from public accounts (including replies and
mentions) are available in JSON format through Twitter’s
Search API for batch requests of past data and Streaming
API for near real-time data.
• Search API—Query Twitter for recent Tweets con-
taining specific keywords. It is part of the Twitter
REST API v1.1 (it attempts to comply with the design
principles of the REST architectural style, which stands
for Representational State Transfer) and requires an
authorized application (using oAuth, the open standard
for authorization) before retrieving any results from the
API.
• Streaming API—A real-time stream of Tweets, fil-
tered by user ID, keyword, geographic location or
random sampling.
One may retrieve recent Tweets containing particular
keywords through Twitter’s Search API (part of REST API
v1.1) with the following API call: https://api.twitter.com/1.
1/search/tweets.json?q=APPLE and real-time data using
the streaming API call: https://stream.twitter.com/1/
statuses/sample.json.
Twitter’s Streaming API allows data to be accessed via
filtering (by keywords, user IDs or location) or by sampling
of all updates from a select amount of users. Default access
level ‘Spritzer’ allows sampling of roughly 1 % of all
public statuses, with the option to retrieve 10 % of all
statuses via the ‘Gardenhose’ access level (more suitable
for data mining and research applications). In social media,
streaming APIs are often called Firehose—a syndication
feed that publishes all public activities as they happen in
one big stream. Twitter has recently announced the Twitter
Data Grants program, where researchers can apply to get
access to Twitter’s public tweets and historical data in
order to get insights from its massive set of data (Twitter
has more than 500 million tweets a day); research institu-
tions and academics will not get the Firehose access level;
instead, they will only get the data set needed for their
research project. Researchers can apply for it at the
following address: https://engineering.twitter.com/
research/data-grants.
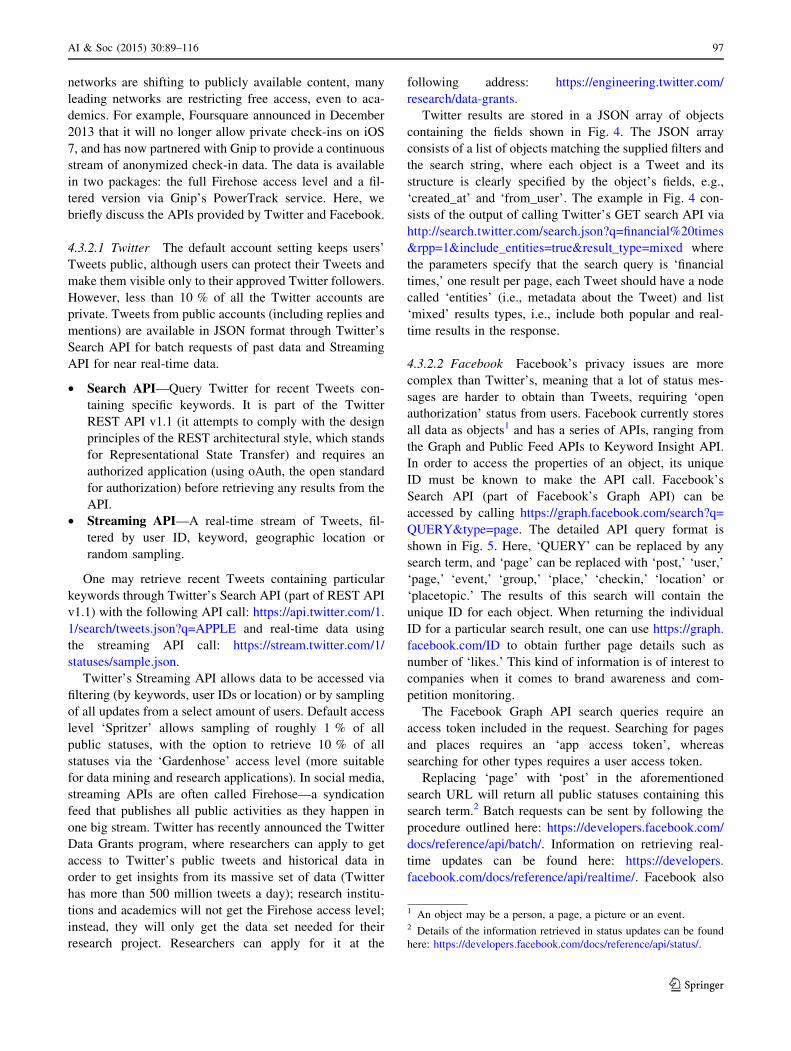
Twitter results are stored in a JSON array of objects
containing the fields shown in Fig. 4. The JSON array
consists of a list of objects matching the supplied filters and
the search string, where each object is a Tweet and its
structure is clearly specified by the object’s fields, e.g.,
‘created_at’ and ‘from_user’. The example in Fig. 4 con-
sists of the output of calling Twitter’s GET search API via
http://search.twitter.com/search.json?q=financial%20times
&rpp=1&include_entities=true&result_type=mixed where
the parameters specify that the search query is ‘financial
times,’ one result per page, each Tweet should have a node
called ‘entities’ (i.e., metadata about the Tweet) and list
‘mixed’ results types, i.e., include both popular and real-
time results in the response.
4.3.2.2 Facebook Facebook’s privacy issues are more
complex than Twitter’s, meaning that a lot of status mes-
sages are harder to obtain than Tweets, requiring ‘open
authorization’ status from users. Facebook currently stores
all data as objects1 and has a series of APIs, ranging from
the Graph and Public Feed APIs to Keyword Insight API.
In order to access the properties of an object, its unique
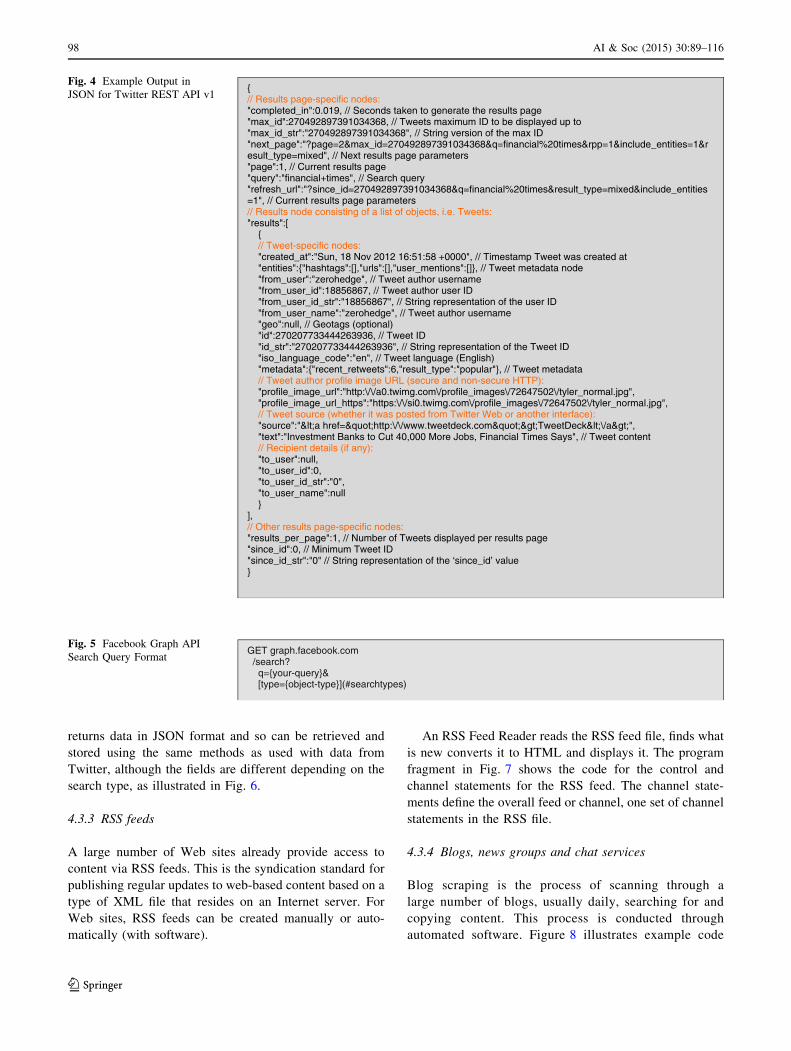
ID must be known to make the API call. Facebook’s
Search API (part of Facebook’s Graph API) can be
accessed by calling https://graph.facebook.com/search?q=
QUERY&type=page. The detailed API query format is
shown in Fig. 5. Here, ‘QUERY’ can be replaced by any
search term, and ‘page’ can be replaced with ‘post,’ ‘user,’
‘page,’ ‘event,’ ‘group,’ ‘place,’ ‘checkin,’ ‘location’ or
‘placetopic.’ The results of this search will contain the
unique ID for each object. When returning the individual
ID for a particular search result, one can use https://graph.
facebook.com/ID to obtain further page details such as
number of ‘likes.’ This kind of information is of interest to
companies when it comes to brand awareness and com-
petition monitoring.
The Facebook Graph API search queries require an
access token included in the request. Searching for pages
and places requires an ‘app access token’, whereas
searching for other types requires a user access token.
Replacing ‘page’ with ‘post’ in the aforementioned
search URL will return all public statuses containing this
search term.2 Batch requests can be sent by following the
procedure outlined here: https://developers.facebook.com/
docs/reference/api/batch/. Information on retrieving real-
time updates can be found here: https://developers.
facebook.com/docs/reference/api/realtime/. Facebook also
1 An object may be a person, a page, a picture or an event.2 Details of the information retrieved in status updates can be found
here: https://developers.facebook.com/docs/reference/api/status/.
AI & Soc (2015) 30:89–116 97
123
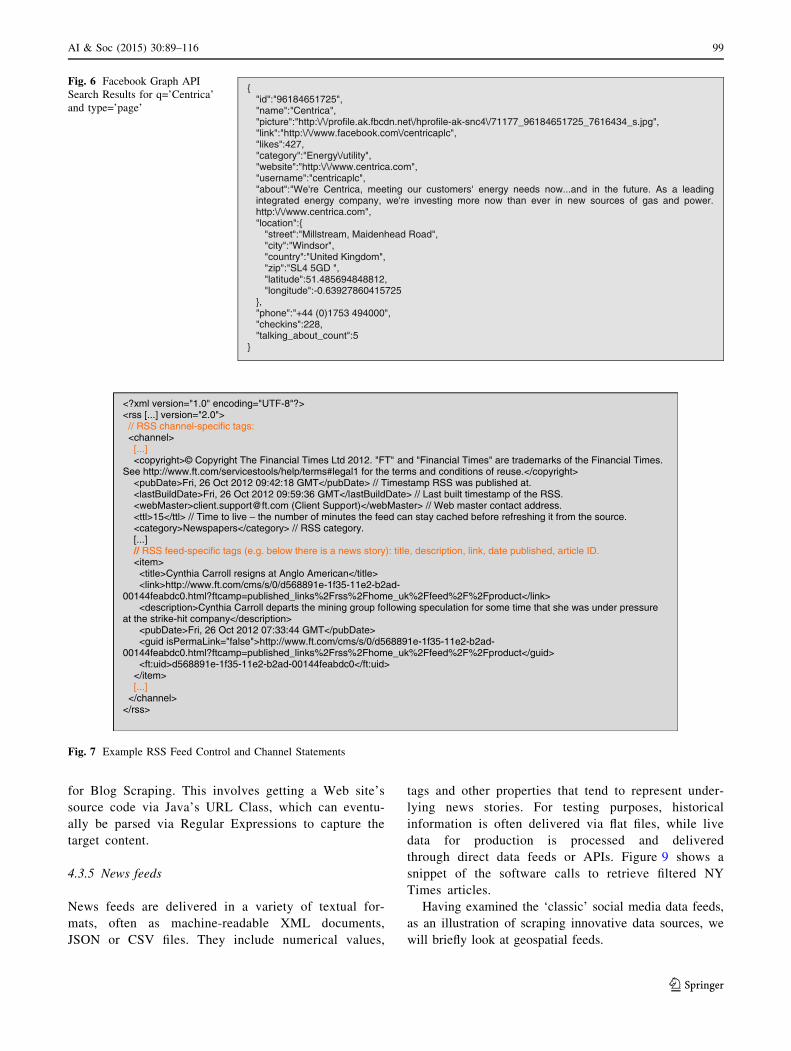
returns data in JSON format and so can be retrieved and
stored using the same methods as used with data from
Twitter, although the fields are different depending on the
search type, as illustrated in Fig. 6.
4.3.3 RSS feeds
A large number of Web sites already provide access to
content via RSS feeds. This is the syndication standard for
publishing regular updates to web-based content based on a
type of XML file that resides on an Internet server. For
Web sites, RSS feeds can be created manually or auto-
matically (with software).
An RSS Feed Reader reads the RSS feed file, finds what
is new converts it to HTML and displays it. The program
fragment in Fig. 7 shows the code for the control and
channel statements for the RSS feed. The channel state-
ments define the overall feed or channel, one set of channel
statements in the RSS file.
4.3.4 Blogs, news groups and chat services
Blog scraping is the process of scanning through a
large number of blogs, usually daily, searching for and
copying content. This process is conducted through
automated software. Figure 8 illustrates example code
{ // Results page-specific nodes: "completed_in":0.019, // Seconds taken to generate the results page "max_id":270492897391034368, // Tweets maximum ID to be displayed up to "max_id_str":"270492897391034368", // String version of the max ID "next_page":"?page=2&max_id=270492897391034368&q=financial%20times&rpp=1&include_entities=1&result_type=mixed", // Next results page parameters "page":1, // Current results page "query":"financial+times", // Search query "refresh_url":"?since_id=270492897391034368&q=financial%20times&result_type=mixed&include_entities=1", // Current results page parameters // Results node consisting of a list of objects, i.e. Tweets: "results":[ {
// Tweet-specific nodes: "created_at":"Sun, 18 Nov 2012 16:51:58 +0000", // Timestamp Tweet was created at "entities":{"hashtags":[],"urls":[],"user_mentions":[]}, // Tweet metadata node "from_user":"zerohedge", // Tweet author username "from_user_id":18856867, // Tweet author user ID "from_user_id_str":"18856867", // String representation of the user ID "from_user_name":"zerohedge", // Tweet author username "geo":null, // Geotags (optional) "id":270207733444263936, // Tweet ID "id_str":"270207733444263936", // String representation of the Tweet ID "iso_language_code":"en", // Tweet language (English) "metadata":{"recent_retweets":6,"result_type":"popular"}, // Tweet metadata // Tweet author profile image URL (secure and non-secure HTTP): "profile_image_url":"http:\/\/a0.twimg.com\/profile_images\/72647502\/tyler_normal.jpg", "profile_image_url_https":"https:\/\/si0.twimg.com\/profile_images\/72647502\/tyler_normal.jpg", // Tweet source (whether it was posted from Twitter Web or another interface): "source":"<a href="http:\/\/www.tweetdeck.com">TweetDeck<\/a>", "text":"Investment Banks to Cut 40,000 More Jobs, Financial Times Says", // Tweet content // Recipient details (if any): "to_user":null, "to_user_id":0, "to_user_id_str":"0", "to_user_name":null } ], // Other results page-specific nodes: "results_per_page":1, // Number of Tweets displayed per results page "since_id":0, // Minimum Tweet ID "since_id_str":"0" // String representation of the ‘since_id’ value }
Fig. 4 Example Output in
JSON for Twitter REST API v1
GET graph.facebook.com /search? q={your-query}& [type={object-type}](#searchtypes)
Fig. 5 Facebook Graph API
Search Query Format
98 AI & Soc (2015) 30:89–116
123
for Blog Scraping. This involves getting a Web site’s
source code via Java’s URL Class, which can eventu-
ally be parsed via Regular Expressions to capture the
target content.
4.3.5 News feeds
News feeds are delivered in a variety of textual for-
mats, often as machine-readable XML documents,
JSON or CSV files. They include numerical values,
tags and other properties that tend to represent under-
lying news stories. For testing purposes, historical
information is often delivered via flat files, while live
data for production is processed and delivered
through direct data feeds or APIs. Figure 9 shows a
snippet of the software calls to retrieve filtered NY
Times articles.
Having examined the ‘classic’ social media data feeds,
as an illustration of scraping innovative data sources, we
will briefly look at geospatial feeds.
{ "id":"96184651725", "name":"Centrica", "picture":"http:\/\/profile.ak.fbcdn.net\/hprofile-ak-snc4\/71177_96184651725_7616434_s.jpg", "link":"http:\/\/www.facebook.com\/centricaplc", "likes":427, "category":"Energy\/utility", "website":"http:\/\/www.centrica.com", "username":"centricaplc", "about":"We're Centrica, meeting our customers' energy needs now...and in the future. As a leading integrated energy company, we're investing more now than ever in new sources of gas and power. http:\/\/www.centrica.com", "location":{
"street":"Millstream, Maidenhead Road", "city":"Windsor", "country":"United Kingdom", "zip":"SL4 5GD ", "latitude":51.485694848812, "longitude":-0.63927860415725
}, "phone":"+44 (0)1753 494000", "checkins":228, "talking_about_count":5
}
Fig. 6 Facebook Graph API
Search Results for q=’Centrica’
and type=’page’
<?xml version="1.0" encoding="UTF-8"?> <rss [...] version="2.0"> // RSS channel-specific tags: <channel> [...] <copyright>© Copyright The Financial Times Ltd 2012. "FT" and "Financial Times" are trademarks of the Financial Times. See http://www.ft.com/servicestools/help/terms#legal1 for the terms and conditions of reuse.</copyright> <pubDate>Fri, 26 Oct 2012 09:42:18 GMT</pubDate> // Timestamp RSS was published at. <lastBuildDate>Fri, 26 Oct 2012 09:59:36 GMT</lastBuildDate> // Last built timestamp of the RSS. <webMaster>[email protected] (Client Support)</webMaster> // Web master contact address. <ttl>15</ttl> // Time to live – the number of minutes the feed can stay cached before refreshing it from the source. <category>Newspapers</category> // RSS category. [...]
// RSS feed-specific tags (e.g. below there is a news story): title, description, link, date published, article ID. <item> <title>Cynthia Carroll resigns at Anglo American</title> <link>http://www.ft.com/cms/s/0/d568891e-1f35-11e2-b2ad-00144feabdc0.html?ftcamp=published_links%2Frss%2Fhome_uk%2Ffeed%2F%2Fproduct</link> <description>Cynthia Carroll departs the mining group following speculation for some time that she was under pressure at the strike-hit company</description> <pubDate>Fri, 26 Oct 2012 07:33:44 GMT</pubDate> <guid isPermaLink="false">http://www.ft.com/cms/s/0/d568891e-1f35-11e2-b2ad-00144feabdc0.html?ftcamp=published_links%2Frss%2Fhome_uk%2Ffeed%2F%2Fproduct</guid> <ft:uid>d568891e-1f35-11e2-b2ad-00144feabdc0</ft:uid> </item> [...] </channel> </rss>
Fig. 7 Example RSS Feed Control and Channel Statements
AI & Soc (2015) 30:89–116 99
123

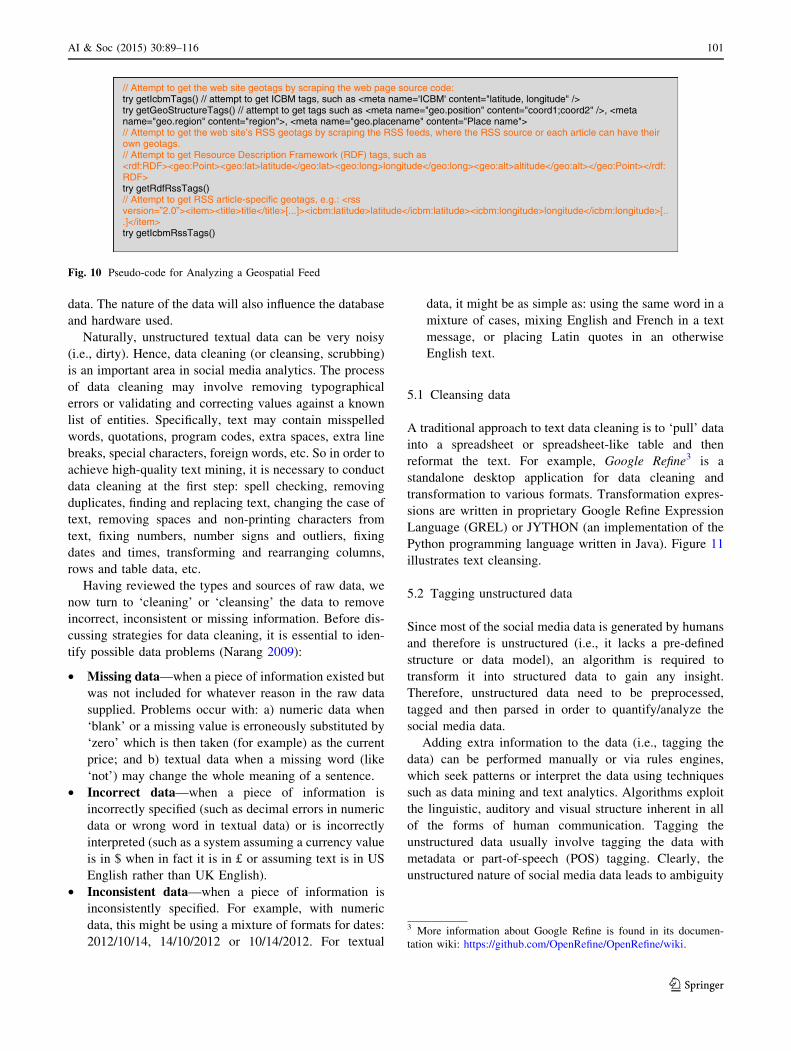
4.3.6 Geospatial feeds
Much of the ‘geospatial’ social media data come from
mobile devices that generate location- and time-sensitive
data. One can differentiate between four types of mobile
social media feeds (Kaplan 2012):
• Location and time sensitive—exchange of messages
with relevance for one specific location at one specific
point-in time (e.g., Foursquare).
• Location sensitive only—exchange of messages with
relevance for one specific location, which are tagged to
a certain place and read later by others (e.g., Yelp and
Qype)
• Time sensitive only—transfer of traditional social
media applications to mobile devices to increase
immediacy (e.g., posting Twitter messages or Facebook
status updates)
• Neither location or time sensitive—transfer of tradi-
tional social media applications to mobile devices (e.g.,
watching a YouTube video or reading a Wikipedia entry)
With increasingly advanced mobile devices, notably
smartphones, the content (photos, SMS messages, etc.)
has geographical identification added, called ‘geotagged.’
These geospatial metadata are usually latitude and lon-
gitude coordinates, though they can also include altitude,
bearing, distance, accuracy data or place names. GeoRSS
is an emerging standard to encode the geographic loca-
tion into a web feed, with two primary encodings: Ge-
oRSS Geography Markup Language (GML) and GeoRSS
Simple.
Example tools are GeoNetwork Opensource—a free
comprehensive cataloging application for geographically
referenced information, and FeedBurner—a web feed
provider that can also provide geotagged feeds, if the
specified feeds settings allow it.
As an illustration Fig. 10 shows the pseudo-code for
analyzing a geospatial feed.
5 Text cleaning, tagging and storing
The importance of ‘quality versus quantity’ of data in
social media scraping and analytics cannot be overstated
(i.e., garbage in and garbage out). In fact, many details of
analytics models are defined by the types and quality of the
// Use Java’s URL, InputStream and DataInputStream classes to read in the content of the supplied URL. URL url; InputStream inputStream = null; DataInputStream dataInputStream; String line; scrapedContent = "";try { // Attempt to open the URL (if valid): url = new URL("http://blog.wordpress.com/"); inputStream = url.openStream(); // throws an IOException dataInputStream = new DataInputStream(new BufferedInputStream(inputStream)); // Read the content line by line and store it in the scrapedContent variable: while ((line = dataInputStream.readLine()) != null) { scrapedContent += line + "\n"; } } catch (MalformedURLException exception) { exception.printStackTrace(); } catch (IOException exception) { exception.printStackTrace(); } finally { try { inputStream.close(); } catch (IOException exception) { } } [...] // Use regular expressions (RE) to parse the desired content from the scrapedContent. RE will attempt to delimit text between some unique tags.
Fig. 8 Example Code for Blog Scraping
nyTimesArticles = GET http://api.nytimes.com/svc/search/v1/article?query=(field:)keywords (facet:[value])(¶ms)&api-key=your-API-key parse_JSON(nyTimesArticles)
Fig. 9 Scraping New York Times Articles
100 AI & Soc (2015) 30:89–116
123
data. The nature of the data will also influence the database
and hardware used.
Naturally, unstructured textual data can be very noisy
(i.e., dirty). Hence, data cleaning (or cleansing, scrubbing)
is an important area in social media analytics. The process
of data cleaning may involve removing typographical
errors or validating and correcting values against a known
list of entities. Specifically, text may contain misspelled
words, quotations, program codes, extra spaces, extra line
breaks, special characters, foreign words, etc. So in order to
achieve high-quality text mining, it is necessary to conduct
data cleaning at the first step: spell checking, removing
duplicates, finding and replacing text, changing the case of
text, removing spaces and non-printing characters from
text, fixing numbers, number signs and outliers, fixing
dates and times, transforming and rearranging columns,
rows and table data, etc.
Having reviewed the types and sources of raw data, we
now turn to ‘cleaning’ or ‘cleansing’ the data to remove
incorrect, inconsistent or missing information. Before dis-
cussing strategies for data cleaning, it is essential to iden-
tify possible data problems (Narang 2009):
• Missing data—when a piece of information existed but
was not included for whatever reason in the raw data
supplied. Problems occur with: a) numeric data when
‘blank’ or a missing value is erroneously substituted by
‘zero’ which is then taken (for example) as the current
price; and b) textual data when a missing word (like
‘not’) may change the whole meaning of a sentence.
• Incorrect data—when a piece of information is
incorrectly specified (such as decimal errors in numeric
data or wrong word in textual data) or is incorrectly
interpreted (such as a system assuming a currency value
is in $ when in fact it is in £ or assuming text is in US
English rather than UK English).
• Inconsistent data—when a piece of information is
inconsistently specified. For example, with numeric
data, this might be using a mixture of formats for dates:
2012/10/14, 14/10/2012 or 10/14/2012. For textual
data, it might be as simple as: using the same word in a
mixture of cases, mixing English and French in a text
message, or placing Latin quotes in an otherwise
English text.
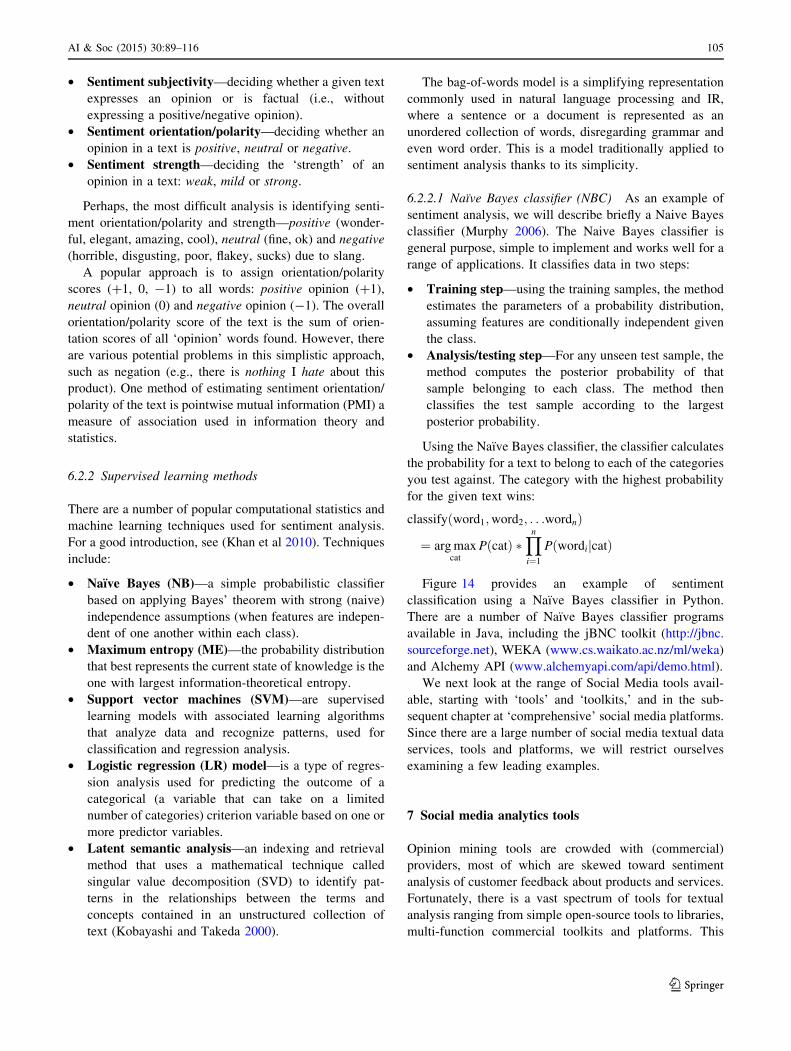
5.1 Cleansing data
A traditional approach to text data cleaning is to ‘pull’ data
into a spreadsheet or spreadsheet-like table and then
reformat the text. For example, Google Refine3 is a
standalone desktop application for data cleaning and
transformation to various formats. Transformation expres-
sions are written in proprietary Google Refine Expression
Language (GREL) or JYTHON (an implementation of the
Python programming language written in Java). Figure 11
illustrates text cleansing.
5.2 Tagging unstructured data
Since most of the social media data is generated by humans
and therefore is unstructured (i.e., it lacks a pre-defined
structure or data model), an algorithm is required to
transform it into structured data to gain any insight.
Therefore, unstructured data need to be preprocessed,
tagged and then parsed in order to quantify/analyze the
social media data.
Adding extra information to the data (i.e., tagging the
data) can be performed manually or via rules engines,
which seek patterns or interpret the data using techniques
such as data mining and text analytics. Algorithms exploit
the linguistic, auditory and visual structure inherent in all
of the forms of human communication. Tagging the
unstructured data usually involve tagging the data with
metadata or part-of-speech (POS) tagging. Clearly, the
unstructured nature of social media data leads to ambiguity
// Attempt to get the web site geotags by scraping the web page source code: try getIcbmTags() // attempt to get ICBM tags, such as <meta name='ICBM' content="latitude, longitude" /> try getGeoStructureTags() // attempt to get tags such as <meta name="geo.position" content="coord1;coord2" />, <meta name="geo.region" content="region">, <meta name="geo.placename" content="Place name"> // Attempt to get the web site’s RSS geotags by scraping the RSS feeds, where the RSS source or each article can have their own geotags. // Attempt to get Resource Description Framework (RDF) tags, such as <rdf:RDF><geo:Point><geo:lat>latitude</geo:lat><geo:long>longitude</geo:long><geo:alt>altitude</geo:alt></geo:Point></rdf:RDF> try getRdfRssTags() // Attempt to get RSS article-specific geotags, e.g.: <rss version=”2.0”><item><title>title</title>[...]><icbm:latitude>latitude</icbm:latitude><icbm:longitude>longitude</icbm:longitude>[...]</item> try getIcbmRssTags()
Fig. 10 Pseudo-code for Analyzing a Geospatial Feed
3 More information about Google Refine is found in its documen-
tation wiki: https://github.com/OpenRefine/OpenRefine/wiki.
AI & Soc (2015) 30:89–116 101
123

and irregularity when it is being processed by a machine in
an automatic fashion.
Using a single data set can provide some interesting
insights. However, combining more data sets and pro-
cessing the unstructured data can result in more valuable
insights, allowing us to answer questions that were
impossible beforehand.
5.3 Storing data
As discussed, the nature of the social media data is highly
influential on the design of the database and possibly the
supporting hardware. It would also be very important to
note that each social platform has very specific (and nar-
row) rules around how their respective data can be stored
and used. These can be found in the Terms of Service for
each platform.
For completeness, databases comprise:
• Flat file—a flat file is a two-dimensional database
(somewhat like a spreadsheet) containing records that
have no structured interrelationship, that can be
searched sequentially.
• Relational database—a database organized as a set of
formally described tables to recognize relations
between stored items of information, allowing more
complex relationships among the data items. Examples
are row-based SQL databases and column-based
kdb ? used in finance.
• noSQL databases—a class of database management
system (DBMS) identified by its non-adherence to the
widely used relational database management system
(RDBMS) model. noSQL/newSQL databases are char-
acterized as: being non-relational, distributed, open-
source and horizontally scalable.
5.3.1 Apache (noSQL) databases and tools
The growth of ultra-large Web sites such as Facebook and
Google has led to the development of noSQL databases as
a way of breaking through the speed constraints that rela-
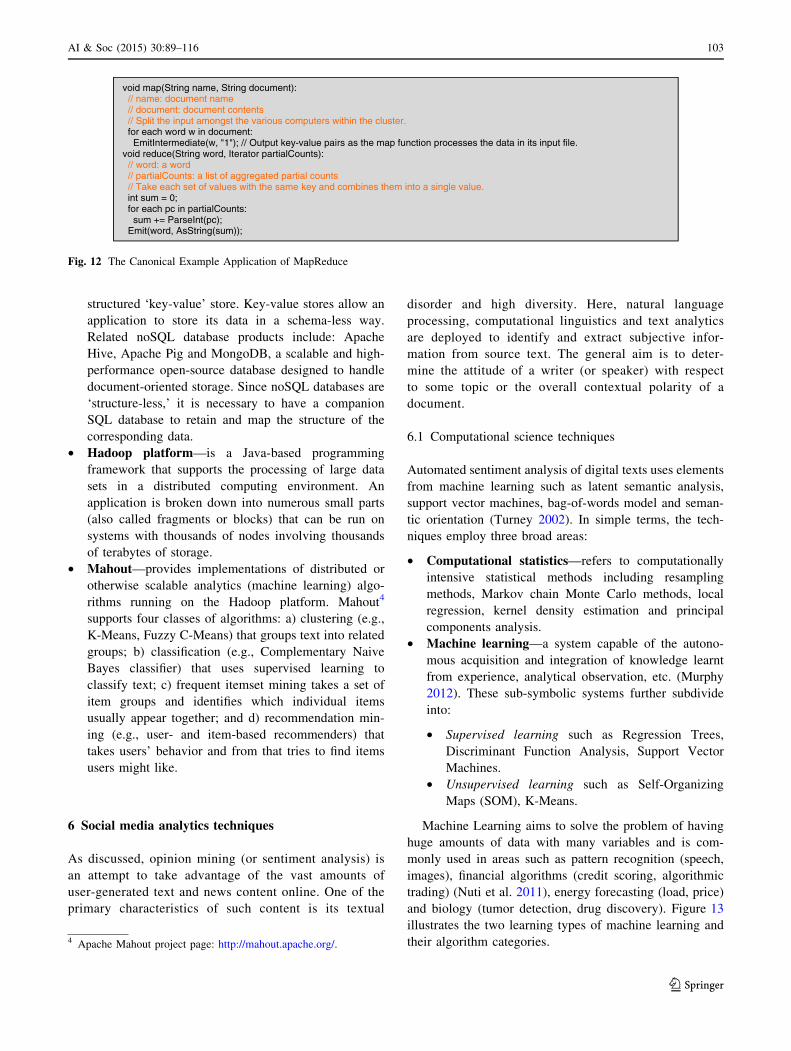
tional databases incur. A key driver has been Google’s
MapReduce, i.e., the software framework that allows
developers to write programs that process massive amounts
of unstructured data in parallel across a distributed cluster
of processors or stand-alone computers (Chandrasekar and
Kowsalya 2011). It was developed at Google for indexing
Web pages and replaced their original indexing algorithms
and heuristics in 2004. The model is inspired by the ‘Map’
and ‘Reduce’ functions commonly used in functional pro-
gramming. MapReduce (conceptually) takes as input a list
of records, and the ‘Map’ computation splits them among
the different computers in a cluster. The result of the Map
computation is a list of key/value pairs. The corresponding
‘Reduce’ computation takes each set of values that has the
same key and combines them into a single value. A Ma-
pReduce program is composed of a ‘Map()’ procedure for
filtering and sorting and a ‘Reduce()’ procedure for a
summary operation (e.g., counting and grouping).
Figure 12 provides a canonical example application of
MapReduce. This example is a process to count the
appearances of each different word in a set of documents
(MapReduce 2011).
5.3.1.1 Apache open-source software The research
community is increasingly using Apache software for
social media analytics. Within the Apache Software
Foundation, three levels of software are relevant:
• Cassandra/hive databases—Apache Cassandra is an
open source (noSQL) distributed DBMS providing a
cleanseText(blogPost) { // Remove any links from the blog post: blogPost[‘text’] = handleLinks(blogPost[‘text’]) // Remove unwanted ads inserted by Google Ads etc. within the main text body: blogPost[‘text’] = removeAds(blogPost[‘text’]) // Normalize contracted forms, e.g. isn’t becomes is not (so that negation words are explicitly specified). blogPost[‘text’] = normalizeContractedForms(blogPost[‘text’]) // Remove punctuation; different logic rules should be specified for each punctuation mark // You might not want to remove a hyphen surrounded by alphanumeric characters. // However you might want to remove a hyphen surrounded by at least one white space. blogPost[‘text’] = handlePunctuation(blogPost[‘text’]) // Tokenize the text on white space, i.e. create an array of words from the original text. tokenizedText = tokenizeStatusOnWhiteSpace(blogPost[‘text’]) // For each word, attempt to normalize it if it doesn’t belong to the WordNet lexical database. for word in tokenizedStatus: if word not in WordNet dictionary: word = normalizeAcronym(word) // Further Natural Language Processing, POS Tagging ... return tokenizedText }
Fig. 11 Text Cleansing Pseudo-code
102 AI & Soc (2015) 30:89–116
123
structured ‘key-value’ store. Key-value stores allow an
application to store its data in a schema-less way.
Related noSQL database products include: Apache
Hive, Apache Pig and MongoDB, a scalable and high-
performance open-source database designed to handle
document-oriented storage. Since noSQL databases are
‘structure-less,’ it is necessary to have a companion
SQL database to retain and map the structure of the
corresponding data.
• Hadoop platform—is a Java-based programming
framework that supports the processing of large data
sets in a distributed computing environment. An
application is broken down into numerous small parts
(also called fragments or blocks) that can be run on
systems with thousands of nodes involving thousands
of terabytes of storage.
• Mahout—provides implementations of distributed or
otherwise scalable analytics (machine learning) algo-
rithms running on the Hadoop platform. Mahout4
supports four classes of algorithms: a) clustering (e.g.,
K-Means, Fuzzy C-Means) that groups text into related
groups; b) classification (e.g., Complementary Naive
Bayes classifier) that uses supervised learning to
classify text; c) frequent itemset mining takes a set of
item groups and identifies which individual items
usually appear together; and d) recommendation min-
ing (e.g., user- and item-based recommenders) that
takes users’ behavior and from that tries to find items
users might like.
6 Social media analytics techniques
As discussed, opinion mining (or sentiment analysis) is
an attempt to take advantage of the vast amounts of
user-generated text and news content online. One of the
primary characteristics of such content is its textual
disorder and high diversity. Here, natural language
processing, computational linguistics and text analytics
are deployed to identify and extract subjective infor-
mation from source text. The general aim is to deter-
mine the attitude of a writer (or speaker) with respect
to some topic or the overall contextual polarity of a
document.
6.1 Computational science techniques
Automated sentiment analysis of digital texts uses elements
from machine learning such as latent semantic analysis,
support vector machines, bag-of-words model and seman-
tic orientation (Turney 2002). In simple terms, the tech-
niques employ three broad areas:
• Computational statistics—refers to computationally
intensive statistical methods including resampling
methods, Markov chain Monte Carlo methods, local
regression, kernel density estimation and principal
components analysis.
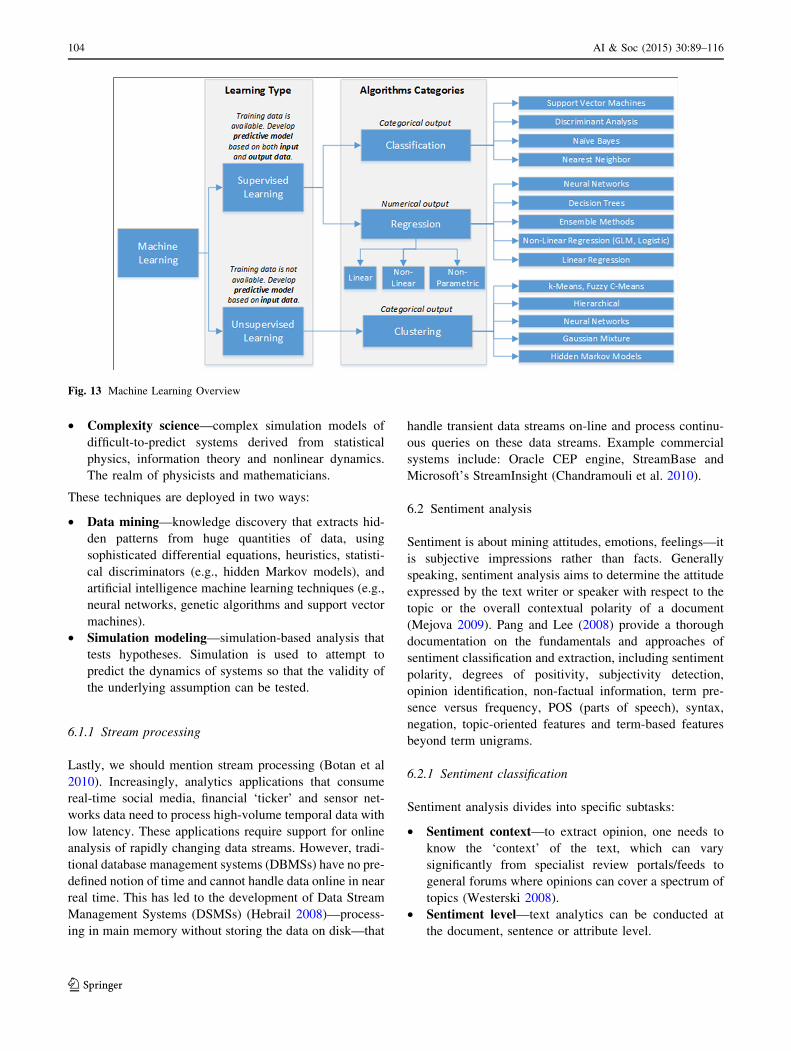
• Machine learning—a system capable of the autono-
mous acquisition and integration of knowledge learnt
from experience, analytical observation, etc. (Murphy
2012). These sub-symbolic systems further subdivide
into:
• Supervised learning such as Regression Trees,
Discriminant Function Analysis, Support Vector
Machines.
• Unsupervised learning such as Self-Organizing
Maps (SOM), K-Means.
Machine Learning aims to solve the problem of having
huge amounts of data with many variables and is com-
monly used in areas such as pattern recognition (speech,
images), financial algorithms (credit scoring, algorithmic
trading) (Nuti et al. 2011), energy forecasting (load, price)
and biology (tumor detection, drug discovery). Figure 13
illustrates the two learning types of machine learning and
their algorithm categories.
void map(String name, String document): // name: document name // document: document contents // Split the input amongst the various computers within the cluster. for each word w in document: EmitIntermediate(w, "1"); // Output key-value pairs as the map function processes the data in its input file. void reduce(String word, Iterator partialCounts): // word: a word // partialCounts: a list of aggregated partial counts // Take each set of values with the same key and combines them into a single value. int sum = 0; for each pc in partialCounts: sum += ParseInt(pc); Emit(word, AsString(sum));
Fig. 12 The Canonical Example Application of MapReduce
4 Apache Mahout project page: http://mahout.apache.org/.
AI & Soc (2015) 30:89–116 103
123
• Complexity science—complex simulation models of
difficult-to-predict systems derived from statistical
physics, information theory and nonlinear dynamics.
The realm of physicists and mathematicians.
These techniques are deployed in two ways:
• Data mining—knowledge discovery that extracts hid-
den patterns from huge quantities of data, using
sophisticated differential equations, heuristics, statisti-
cal discriminators (e.g., hidden Markov models), and
artificial intelligence machine learning techniques (e.g.,
neural networks, genetic algorithms and support vector
machines).
• Simulation modeling—simulation-based analysis that
tests hypotheses. Simulation is used to attempt to
predict the dynamics of systems so that the validity of
the underlying assumption can be tested.
6.1.1 Stream processing
Lastly, we should mention stream processing (Botan et al
2010). Increasingly, analytics applications that consume
real-time social media, financial ‘ticker’ and sensor net-
works data need to process high-volume temporal data with
low latency. These applications require support for online
analysis of rapidly changing data streams. However, tradi-
tional database management systems (DBMSs) have no pre-
defined notion of time and cannot handle data online in near
real time. This has led to the development of Data Stream
Management Systems (DSMSs) (Hebrail 2008)—process-
ing in main memory without storing the data on disk—that
handle transient data streams on-line and process continu-
ous queries on these data streams. Example commercial
systems include: Oracle CEP engine, StreamBase and
Microsoft’s StreamInsight (Chandramouli et al. 2010).
6.2 Sentiment analysis
Sentiment is about mining attitudes, emotions, feelings—it
is subjective impressions rather than facts. Generally
speaking, sentiment analysis aims to determine the attitude
expressed by the text writer or speaker with respect to the
topic or the overall contextual polarity of a document
(Mejova 2009). Pang and Lee (2008) provide a thorough
documentation on the fundamentals and approaches of
sentiment classification and extraction, including sentiment
polarity, degrees of positivity, subjectivity detection,
opinion identification, non-factual information, term pre-
sence versus frequency, POS (parts of speech), syntax,
negation, topic-oriented features and term-based features
beyond term unigrams.
6.2.1 Sentiment classification
Sentiment analysis divides into specific subtasks:
• Sentiment context—to extract opinion, one needs to
know the ‘context’ of the text, which can vary
significantly from specialist review portals/feeds to
general forums where opinions can cover a spectrum of
topics (Westerski 2008).
• Sentiment level—text analytics can be conducted at
the document, sentence or attribute level.
Fig. 13 Machine Learning Overview
104 AI & Soc (2015) 30:89–116
123
• Sentiment subjectivity—deciding whether a given text
expresses an opinion or is factual (i.e., without
expressing a positive/negative opinion).
• Sentiment orientation/polarity—deciding whether an
opinion in a text is positive, neutral or negative.
• Sentiment strength—deciding the ‘strength’ of an
opinion in a text: weak, mild or strong.
Perhaps, the most difficult analysis is identifying senti-
ment orientation/polarity and strength—positive (wonder-
ful, elegant, amazing, cool), neutral (fine, ok) and negative
(horrible, disgusting, poor, flakey, sucks) due to slang.
A popular approach is to assign orientation/polarity
scores (?1, 0, -1) to all words: positive opinion (?1),
neutral opinion (0) and negative opinion (-1). The overall
orientation/polarity score of the text is the sum of orien-
tation scores of all ‘opinion’ words found. However, there
are various potential problems in this simplistic approach,
such as negation (e.g., there is nothing I hate about this
product). One method of estimating sentiment orientation/
polarity of the text is pointwise mutual information (PMI) a
measure of association used in information theory and
statistics.
6.2.2 Supervised learning methods
There are a number of popular computational statistics and
machine learning techniques used for sentiment analysis.
For a good introduction, see (Khan et al 2010). Techniques
include:
• Naıve Bayes (NB)—a simple probabilistic classifier
based on applying Bayes’ theorem with strong (naive)
independence assumptions (when features are indepen-
dent of one another within each class).
• Maximum entropy (ME)—the probability distribution
that best represents the current state of knowledge is the
one with largest information-theoretical entropy.
• Support vector machines (SVM)—are supervised
learning models with associated learning algorithms
that analyze data and recognize patterns, used for
classification and regression analysis.
• Logistic regression (LR) model—is a type of regres-
sion analysis used for predicting the outcome of a
categorical (a variable that can take on a limited
number of categories) criterion variable based on one or
more predictor variables.
• Latent semantic analysis—an indexing and retrieval
method that uses a mathematical technique called
singular value decomposition (SVD) to identify pat-
terns in the relationships between the terms and
concepts contained in an unstructured collection of
text (Kobayashi and Takeda 2000).
The bag-of-words model is a simplifying representation
commonly used in natural language processing and IR,
where a sentence or a document is represented as an
unordered collection of words, disregarding grammar and
even word order. This is a model traditionally applied to
sentiment analysis thanks to its simplicity.
6.2.2.1 Naıve Bayes classifier (NBC) As an example of
sentiment analysis, we will describe briefly a Naive Bayes
classifier (Murphy 2006). The Naive Bayes classifier is
general purpose, simple to implement and works well for a
range of applications. It classifies data in two steps:
• Training step—using the training samples, the method
estimates the parameters of a probability distribution,
assuming features are conditionally independent given
the class.
• Analysis/testing step—For any unseen test sample, the
method computes the posterior probability of that
sample belonging to each class. The method then
classifies the test sample according to the largest
posterior probability.
Using the Naıve Bayes classifier, the classifier calculates
the probability for a text to belong to each of the categories
you test against. The category with the highest probability
for the given text wins:
classify word1;word2; . . .wordnð Þ
¼ arg maxcat
P catð Þ �Yn
i¼1
PðwordijcatÞ
Figure 14 provides an example of sentiment
classification using a Naıve Bayes classifier in Python.
There are a number of Naıve Bayes classifier programs
available in Java, including the jBNC toolkit (http://jbnc.
sourceforge.net), WEKA (www.cs.waikato.ac.nz/ml/weka)
and Alchemy API (www.alchemyapi.com/api/demo.html).
We next look at the range of Social Media tools avail-
able, starting with ‘tools’ and ‘toolkits,’ and in the sub-
sequent chapter at ‘comprehensive’ social media platforms.
Since there are a large number of social media textual data
services, tools and platforms, we will restrict ourselves
examining a few leading examples.
7 Social media analytics tools
Opinion mining tools are crowded with (commercial)
providers, most of which are skewed toward sentiment
analysis of customer feedback about products and services.
Fortunately, there is a vast spectrum of tools for textual
analysis ranging from simple open-source tools to libraries,
multi-function commercial toolkits and platforms. This
AI & Soc (2015) 30:89–116 105
123

section focuses on individual tools and toolkits for scrap-
ing, cleaning and analytics, and the next chapter looks at
what we call social media platforms that provide both
archive data and real-time feeds, and as well as sophisti-
cated analytics tools.
7.1 Scientific programming tools
Popular scientific analytics libraries and tools have been
enhanced to provide support for sourcing, searching and
analyzing text. Examples include: R—used for statistical
programming, MATLAB—used for numeric scientific
programming, and Mathematica—used for symbolic sci-
entific programming (computer algebra).
Data processing and data modeling, e.g., regression
analysis, are straightforward using MATLAB, which pro-
vides time-series analysis, GUI and array-based statistics.
MATLAB is significantly faster than the traditional pro-
gramming languages and can be used for a wide range of
applications. Moreover, the exhaustive built-in plotting
functions make it a complex analytics toolkit. More com-
putationally powerful algorithms can be developed using it
in conjunction with the packages (e.g., FastICA in order to
perform independent component analysis).
Python can be used for (natural) language detection, title
and content extraction, query matching and, when used in
conjunction with a module such as scikit-learn, it can be
trained to perform sentiment analysis, e.g., using a Naıve
Bayes classifier.
Another example, Apache UIMA (Unstructured Infor-
mation Management Applications) is an open-source pro-
ject that analyzes ‘big data’ and discovers information that
is relevant to the user.
7.2 Business toolkits
Business Toolkits are commercial suites of tools that allow
users to source, search and analyze text for a range of
commercial purposes.
SAS Sentiment Analysis Manager, part of the SAS Text
Analytics program, can be used for scraping content
sources, including mainstream Web sites and social media
outlets, as well as internal organizational text sources, and
creates reports that describe the expressed feelings of
consumers, customers and competitors in real time.
RapidMiner (Hirudkar and Sherekar 2013), a popular
toolkit offering an open-source Community Edition
released under the GNU AGPL and also an Enterprise
Edition offered under a commercial license. RapidMiner
provides data mining and machine learning procedures
including: data loading and transformation (Extract,
Transform, Load, a.k.a. ETL), data preprocessing and
visualization, modeling, evaluation, and deployment.
RapidMiner is written in Java and uses learning schemes
and attribute evaluators from the Weka machine learning
environment and statistical modeling schemes from the R
project.
Other examples are Lexalytics that provides a com-
mercial sentiment analysis engine for many OEM and
direct customers; and IBM SPSS Statistics is one of the
most used programs for statistical analysis in social
science.
7.3 Social media monitoring tools
Social media monitoring tools are sentiment analysis tools
for tracking and measuring what people are saying (typi-
cally) about a company or its products, or any topic across
the web’s social media landscape.
In the area of social media monitoring examples include:
Social Mention, (http://socialmention.com/), which pro-
vides social media alerts similarly to Google Alerts;
Amplified Analytics (http://www.amplifiedanalytics.com/),
which focuses on product reviews and marketing informa-
tion; Lithium Social Media Monitoring; and Trackur, which
is an online reputation monitoring tool that tracks what is
being said on the Internet.
Google also provides a few useful free tools. Google
Trends shows how often a particular search-term input
compares to the total search volume. Another tool built
around Google Search is Google Alerts—a content change
detection tool that provides notifications automatically.
Google also acquired FeedBurner—an RSS feeds man-
agement—in 2007.
for (tweet, label) in trainingSetMessage: // Normalize words, handle punctuation, tokenize on white space etc. preProcessMessage(tweet) for tweetWord in tweet: // Tokenize each Tweet, assign the label to each word and store it in the training set trainingSet += (tweetWord, label)
classifier = NaiveBayesClassifier.train(trainingSet) predictedLabel = classifier.classify(getFeatures(preProcessMessage(trainingSet)))
Fig. 14 Sentiment Classification Example using Python
106 AI & Soc (2015) 30:89–116
123
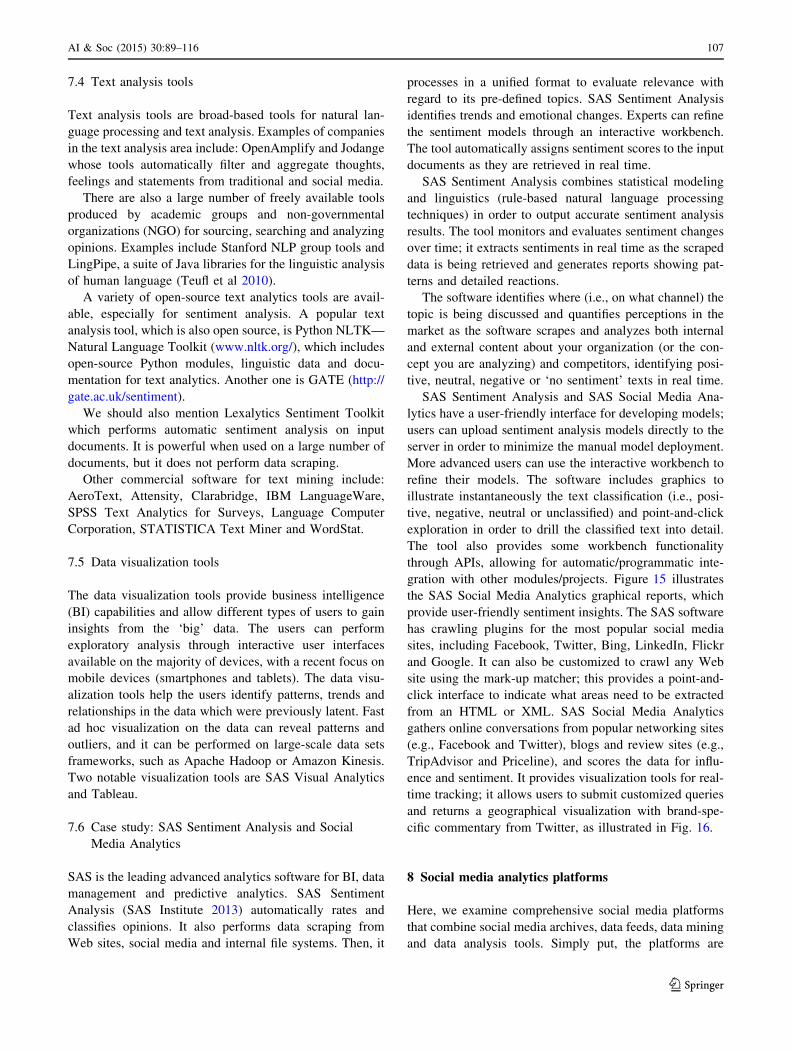
7.4 Text analysis tools
Text analysis tools are broad-based tools for natural lan-
guage processing and text analysis. Examples of companies
in the text analysis area include: OpenAmplify and Jodange
whose tools automatically filter and aggregate thoughts,
feelings and statements from traditional and social media.
There are also a large number of freely available tools
produced by academic groups and non-governmental
organizations (NGO) for sourcing, searching and analyzing
opinions. Examples include Stanford NLP group tools and
LingPipe, a suite of Java libraries for the linguistic analysis
of human language (Teufl et al 2010).
A variety of open-source text analytics tools are avail-
able, especially for sentiment analysis. A popular text
analysis tool, which is also open source, is Python NLTK—
Natural Language Toolkit (www.nltk.org/), which includes
open-source Python modules, linguistic data and docu-
mentation for text analytics. Another one is GATE (http://
gate.ac.uk/sentiment).
We should also mention Lexalytics Sentiment Toolkit
which performs automatic sentiment analysis on input
documents. It is powerful when used on a large number of
documents, but it does not perform data scraping.
Other commercial software for text mining include:
AeroText, Attensity, Clarabridge, IBM LanguageWare,
SPSS Text Analytics for Surveys, Language Computer
Corporation, STATISTICA Text Miner and WordStat.
7.5 Data visualization tools
The data visualization tools provide business intelligence
(BI) capabilities and allow different types of users to gain
insights from the ‘big’ data. The users can perform
exploratory analysis through interactive user interfaces
available on the majority of devices, with a recent focus on
mobile devices (smartphones and tablets). The data visu-
alization tools help the users identify patterns, trends and
relationships in the data which were previously latent. Fast
ad hoc visualization on the data can reveal patterns and
outliers, and it can be performed on large-scale data sets
frameworks, such as Apache Hadoop or Amazon Kinesis.
Two notable visualization tools are SAS Visual Analytics
and Tableau.
7.6 Case study: SAS Sentiment Analysis and Social
Media Analytics
SAS is the leading advanced analytics software for BI, data
management and predictive analytics. SAS Sentiment
Analysis (SAS Institute 2013) automatically rates and
classifies opinions. It also performs data scraping from
Web sites, social media and internal file systems. Then, it
processes in a unified format to evaluate relevance with
regard to its pre-defined topics. SAS Sentiment Analysis
identifies trends and emotional changes. Experts can refine
the sentiment models through an interactive workbench.
The tool automatically assigns sentiment scores to the input
documents as they are retrieved in real time.
SAS Sentiment Analysis combines statistical modeling
and linguistics (rule-based natural language processing
techniques) in order to output accurate sentiment analysis
results. The tool monitors and evaluates sentiment changes
over time; it extracts sentiments in real time as the scraped
data is being retrieved and generates reports showing pat-
terns and detailed reactions.
The software identifies where (i.e., on what channel) the
topic is being discussed and quantifies perceptions in the
market as the software scrapes and analyzes both internal
and external content about your organization (or the con-
cept you are analyzing) and competitors, identifying posi-
tive, neutral, negative or ‘no sentiment’ texts in real time.
SAS Sentiment Analysis and SAS Social Media Ana-
lytics have a user-friendly interface for developing models;
users can upload sentiment analysis models directly to the
server in order to minimize the manual model deployment.
More advanced users can use the interactive workbench to
refine their models. The software includes graphics to
illustrate instantaneously the text classification (i.e., posi-
tive, negative, neutral or unclassified) and point-and-click
exploration in order to drill the classified text into detail.
The tool also provides some workbench functionality
through APIs, allowing for automatic/programmatic inte-
gration with other modules/projects. Figure 15 illustrates
the SAS Social Media Analytics graphical reports, which
provide user-friendly sentiment insights. The SAS software
has crawling plugins for the most popular social media
sites, including Facebook, Twitter, Bing, LinkedIn, Flickr
and Google. It can also be customized to crawl any Web
site using the mark-up matcher; this provides a point-and-
click interface to indicate what areas need to be extracted
from an HTML or XML. SAS Social Media Analytics
gathers online conversations from popular networking sites
(e.g., Facebook and Twitter), blogs and review sites (e.g.,
TripAdvisor and Priceline), and scores the data for influ-
ence and sentiment. It provides visualization tools for real-
time tracking; it allows users to submit customized queries
and returns a geographical visualization with brand-spe-
cific commentary from Twitter, as illustrated in Fig. 16.
8 Social media analytics platforms
Here, we examine comprehensive social media platforms
that combine social media archives, data feeds, data mining
and data analysis tools. Simply put, the platforms are
AI & Soc (2015) 30:89–116 107
123

different from tools and toolkits since platforms are more
comprehensive and provide both tools and data.
They broadly subdivide into:
• News platforms—platforms such as Thomson Reuters
providing news archives/feeds and associated analytics
and targeting companies such as financial institutions
seeking to monitor market sentiment in news.
• Social network media platforms—platforms that
provide data mining and analytics on Twitter, Facebook
and a wide range of other social network media
sources. Providers typically target companies seeking
to monitor sentiment around their brands or products.
8.1 News platforms
The two most prominent business news feed providers are
Thomson Reuters and Bloomberg.
Computer read news in real time and provide automati-
cally key indicators and meaningful insights. The news items
are automatically retrieved, analyzed and interpreted in a few
milliseconds. The machine-readable news indicators can
potentially improve quantitative strategies, risk management
and decision making.
Examples of machine-readable news include: Thomson
Reuters Machine Readable News, Bloomberg’s Event-
Driven Trading Feed and AlphaFlash (Deutsche Borse’s
machine-readable news feed). Thomson Reuters Machine
Readable News (Thomson Reuters 2012a, b, c) has Reuters
News content dating back to 1987, and comprehensive
news from over 50 third-parties dating back to 2003, such
as PR Newswire, Business Wire and the Regulatory News
Service (LSE). The feed offers full text and comprehensive
metadata via streaming XML.
Thomson Reuters News Analytics uses Natural Lan-
guage Processing (NLP) techniques to score news items on
tens of thousands of companies and nearly 40 commodities
and energy topics. Items are measured across the following
dimensions:
• Author sentiment—metrics for how positive, negative
or neutral the tone of the item is, specific to each
company in the article.
• Relevance—how relevant or substantive the story is for
a particular item.
Fig. 15 Graphical Reports with Sentiment Insights
108 AI & Soc (2015) 30:89–116
123
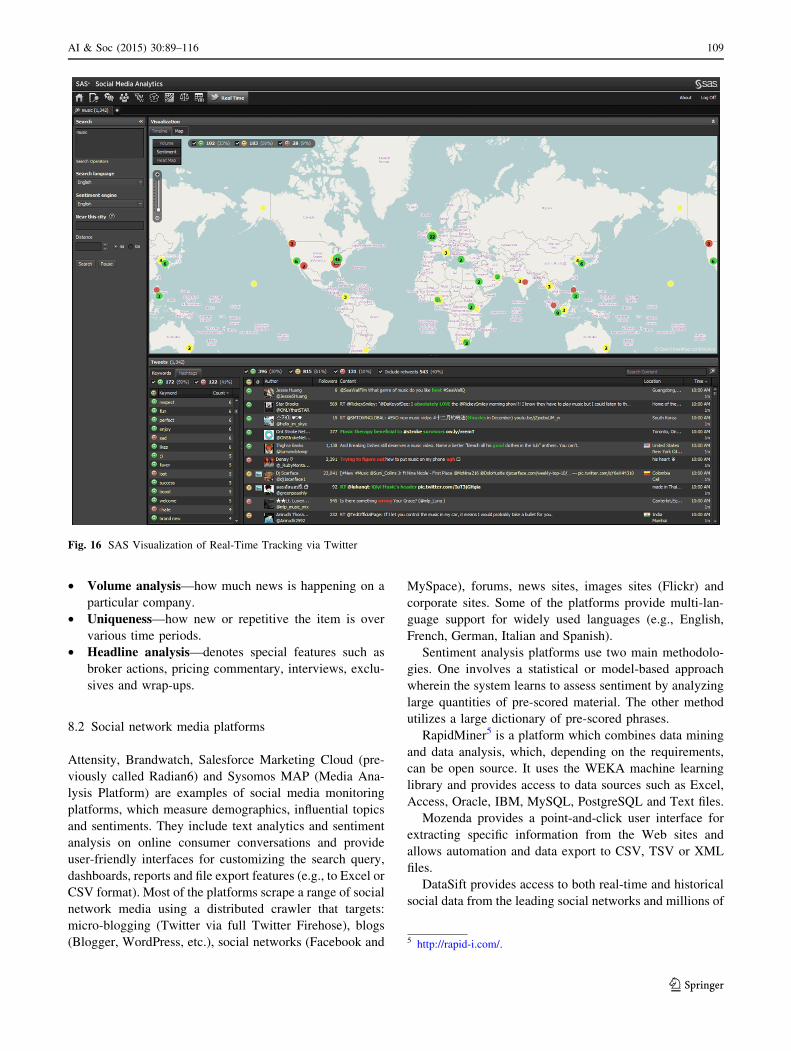
• Volume analysis—how much news is happening on a
particular company.
• Uniqueness—how new or repetitive the item is over
various time periods.
• Headline analysis—denotes special features such as
broker actions, pricing commentary, interviews, exclu-
sives and wrap-ups.
8.2 Social network media platforms
Attensity, Brandwatch, Salesforce Marketing Cloud (pre-
viously called Radian6) and Sysomos MAP (Media Ana-
lysis Platform) are examples of social media monitoring
platforms, which measure demographics, influential topics
and sentiments. They include text analytics and sentiment
analysis on online consumer conversations and provide
user-friendly interfaces for customizing the search query,
dashboards, reports and file export features (e.g., to Excel or
CSV format). Most of the platforms scrape a range of social
network media using a distributed crawler that targets:
micro-blogging (Twitter via full Twitter Firehose), blogs
(Blogger, WordPress, etc.), social networks (Facebook and
MySpace), forums, news sites, images sites (Flickr) and
corporate sites. Some of the platforms provide multi-lan-
guage support for widely used languages (e.g., English,
French, German, Italian and Spanish).
Sentiment analysis platforms use two main methodolo-
gies. One involves a statistical or model-based approach
wherein the system learns to assess sentiment by analyzing
large quantities of pre-scored material. The other method
utilizes a large dictionary of pre-scored phrases.
RapidMiner5 is a platform which combines data mining
and data analysis, which, depending on the requirements,
can be open source. It uses the WEKA machine learning
library and provides access to data sources such as Excel,
Access, Oracle, IBM, MySQL, PostgreSQL and Text files.
Mozenda provides a point-and-click user interface for
extracting specific information from the Web sites and
allows automation and data export to CSV, TSV or XML
files.
DataSift provides access to both real-time and historical
social data from the leading social networks and millions of
Fig. 16 SAS Visualization of Real-Time Tracking via Twitter
5 http://rapid-i.com/.
AI & Soc (2015) 30:89–116 109
123

other sources, enabling clients to aggregate, filter and gain
insights and discover trends from the billions of public
social conversations. Once the data is aggregated and
processed (i.e., DataSift can filter and add context, such as
enrichments—language processing, geodata and demo-
graphics—and categorization—spam detection, intent
identification and machine learning), the customers can use
pre-built integrations with popular BI tools, application and
developer tools to deliver the data into their businesses, or
use the DataSift APIs to stream real-time data into their
applications.
There are a growing number of social media analytics
platforms being founded nowadays. Other notable plat-
forms that handle sentiment and semantic analysis of Web
and Web 2.0-sourced material include Google Analytics,
HP Autonomy IDOL (Intelligent Data Operating Layer),
IBM SPSS Modeler, Adobe SocialAnalytics, GraphDive,
Keen IO, Mass Relevance, Parse.ly, ViralHeat, Social-
bakers, DachisGroup, evolve24, OpenAmplify and
AdmantX.
Recently, more and more specific social analytics plat-
forms have emerged. One of them is iSpot.tv which laun-
ched its own social media analytics platform that matches
television ads with mentions on Twitter and Facebook. It
provides real-time reports about when and where an ad
appears, together with what people are saying about it on
social networks (iSpot.tv monitors almost 80 different
networks).
Thomson Reuters has recently announced that it is now
incorporating Twitter sentiment analysis for the Thomson
Reuters Eikon market analysis and trading platform, pro-
viding visualizations and charts based on the sentiment
data. In the previous year, Bloomberg incorporated tweets
related to specific companies in a wider data stream.
8.3 Case study: Thomson Reuters News Analytics
Thomson Reuters News Analytics (TRNA) provides a huge
news archive with analytics to read and interpret news,
offering meaningful insights. TRNA scores news items on
over 25,000 equities and nearly 40 topics (commodities and
energy). The platform scrapes and analyzes news data in
real time and feeds the data into other programs/projects or
quantitative strategies.
TRNA uses an NLP system from Lexalytics, one of the
linguistics technology leaders, that can track news senti-
ment over time, and scores text across the various dimen-
sions as mentioned in Sect. 8.1.
The platform’s text scoring and metadata has more than
80 fields (Thomson Reuters 2010) such as:
• Item type—stage of the story: Alert, Article, Updates
or Corrections.
• Item genre—classification of the story, i.e., interview,
exclusive and wrap-up.
• Headline—alert or headline text.
• Relevance—varies from 0 to 1.0.
• Prevailing sentiment—can be 1, 0 or -1.
• Positive, neutral, negative—more detailed sentiment
indication.
• Broker action—denotes broker actions: upgrade,
downgrade, maintain, undefined or whether it is the
broker itself
• Price/market commentary—used to flag items
describing pricing/market commentary
• Topic codes—describes what the story is about, i.e.,
RCH = Research, RES = Results, RESF = Results
Forecast, MRG = Mergers and Acquisitions
A snippet of the news sentiment analysis is illustrated in
Fig. 17.
In 2012, Thomson Reuters extended its machine-read-
able news offering to include sentiment analysis and
scoring for social media. TRNA’s extension is called
Thomson Reuters News Analytics (TRNA) for Internet
News and Social Media, which aggregates content from
over four million social media channels and 50,000 Internet
news sites. The content is then analyzed by TRNA in real
time, generating a quantifiable output across dimensions
such as sentiment, relevance, novelty volume, category and
source ranks. This extension uses the same extensive
metadata tagging (across more than 80 fields).
TRNA for Internet News and Social Media is a powerful
platform analyzing, tagging and filtering millions of public
and premium sources of Internet content, turning big data
into actionable ideas. The platform also provides a way to
visually analyze the big data. It can be combined with
Panopticon Data Visualization Software in order to reach
meaningful conclusions more quickly with visually intui-
tive displays (Thomson Reuters 2012a, b, c), as illustrated
in Fig. 18.
Thomson Reuters also expanded the News Analytics
service with MarketPsych Indices (Thomson Reuters
2012a, b, c), which allows for real-time psychological
analysis of news and social media. The Thomson Reuters
MarketPsych Indices (TRMI) service gains a quantitative
view of market psychology as it attempts to identify human
emotion and sentiment. It is a complement to TRNA and
uses NLP processing created by MarketPsych (http://www.
marketpsych.com), a leading company in behavioral psy-
chology in financial markets.
Behavioral economists have extensively investigated
whether emotions affect markets in predictable ways, and
TRMI attempts to measure the state of ‘emotions’ in real
time in order to identify patterns as they emerge. TRMI has
two key indicator types:
110 AI & Soc (2015) 30:89–116
123
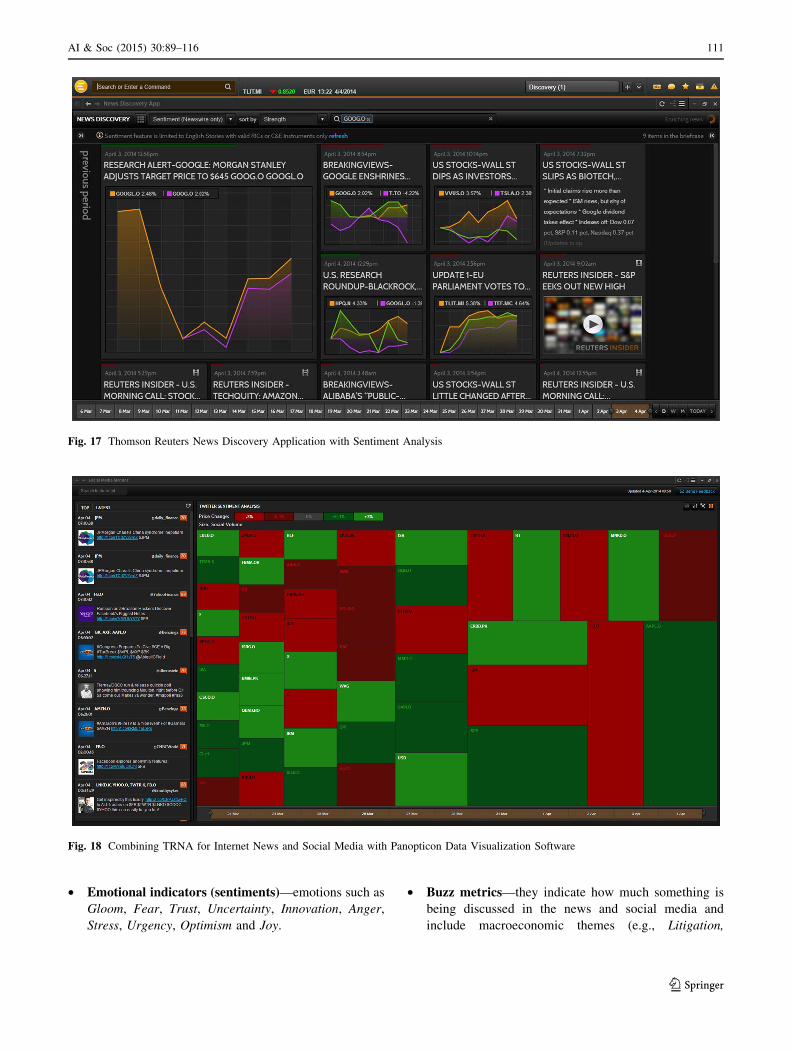
• Emotional indicators (sentiments)—emotions such as
Gloom, Fear, Trust, Uncertainty, Innovation, Anger,
Stress, Urgency, Optimism and Joy.
• Buzz metrics—they indicate how much something is
being discussed in the news and social media and
include macroeconomic themes (e.g., Litigation,
Fig. 17 Thomson Reuters News Discovery Application with Sentiment Analysis
Fig. 18 Combining TRNA for Internet News and Social Media with Panopticon Data Visualization Software
AI & Soc (2015) 30:89–116 111
123
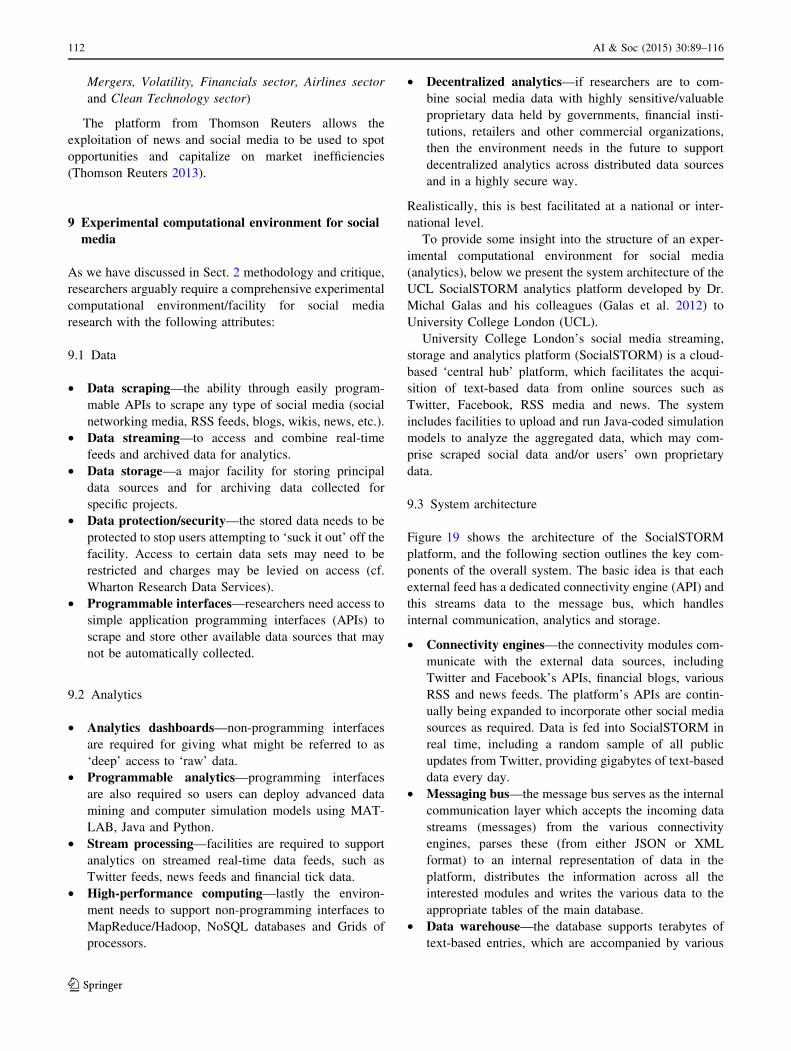
Mergers, Volatility, Financials sector, Airlines sector
and Clean Technology sector)
The platform from Thomson Reuters allows the
exploitation of news and social media to be used to spot
opportunities and capitalize on market inefficiencies
(Thomson Reuters 2013).
9 Experimental computational environment for social
media
As we have discussed in Sect. 2 methodology and critique,
researchers arguably require a comprehensive experimental
computational environment/facility for social media
research with the following attributes:
9.1 Data
• Data scraping—the ability through easily program-
mable APIs to scrape any type of social media (social
networking media, RSS feeds, blogs, wikis, news, etc.).
• Data streaming—to access and combine real-time
feeds and archived data for analytics.
• Data storage—a major facility for storing principal
data sources and for archiving data collected for
specific projects.
• Data protection/security—the stored data needs to be
protected to stop users attempting to ‘suck it out’ off the
facility. Access to certain data sets may need to be
restricted and charges may be levied on access (cf.
Wharton Research Data Services).
• Programmable interfaces—researchers need access to
simple application programming interfaces (APIs) to
scrape and store other available data sources that may
not be automatically collected.
9.2 Analytics
• Analytics dashboards—non-programming interfaces
are required for giving what might be referred to as
‘deep’ access to ‘raw’ data.
• Programmable analytics—programming interfaces
are also required so users can deploy advanced data
mining and computer simulation models using MAT-
LAB, Java and Python.
• Stream processing—facilities are required to support
analytics on streamed real-time data feeds, such as
Twitter feeds, news feeds and financial tick data.
• High-performance computing—lastly the environ-
ment needs to support non-programming interfaces to
MapReduce/Hadoop, NoSQL databases and Grids of
processors.
• Decentralized analytics—if researchers are to com-
bine social media data with highly sensitive/valuable
proprietary data held by governments, financial insti-
tutions, retailers and other commercial organizations,
then the environment needs in the future to support
decentralized analytics across distributed data sources
and in a highly secure way.
Realistically, this is best facilitated at a national or inter-
national level.
To provide some insight into the structure of an exper-
imental computational environment for social media
(analytics), below we present the system architecture of the
UCL SocialSTORM analytics platform developed by Dr.
Michal Galas and his colleagues (Galas et al. 2012) to
University College London (UCL).
University College London’s social media streaming,
storage and analytics platform (SocialSTORM) is a cloud-
based ‘central hub’ platform, which facilitates the acqui-
sition of text-based data from online sources such as
Twitter, Facebook, RSS media and news. The system
includes facilities to upload and run Java-coded simulation
models to analyze the aggregated data, which may com-
prise scraped social data and/or users’ own proprietary
data.
9.3 System architecture
Figure 19 shows the architecture of the SocialSTORM
platform, and the following section outlines the key com-
ponents of the overall system. The basic idea is that each
external feed has a dedicated connectivity engine (API) and
this streams data to the message bus, which handles
internal communication, analytics and storage.
• Connectivity engines—the connectivity modules com-
municate with the external data sources, including
Twitter and Facebook’s APIs, financial blogs, various
RSS and news feeds. The platform’s APIs are contin-
ually being expanded to incorporate other social media
sources as required. Data is fed into SocialSTORM in
real time, including a random sample of all public
updates from Twitter, providing gigabytes of text-based
data every day.
• Messaging bus—the message bus serves as the internal
communication layer which accepts the incoming data
streams (messages) from the various connectivity
engines, parses these (from either JSON or XML
format) to an internal representation of data in the
platform, distributes the information across all the
interested modules and writes the various data to the
appropriate tables of the main database.
• Data warehouse—the database supports terabytes of
text-based entries, which are accompanied by various
112 AI & Soc (2015) 30:89–116
123

types of metadata to expand the potential avenues of
research. Entries are organized by source and accu-
rately time-stamped with the time of publication, as
well as being tagged with topics for easy retrieval by
simulation models. The platform currently uses HBase,
but in future might use Apache Cassandra or Hive.
• Simulation manager—the simulation manager provides
an external API for clients to interact with the data for
research purposes, including a web-based GUI whereby
users can select various filters to apply to the data sets
before uploading a Java-coded simulation model to
perform the desired analysis on the data. This facilitates
all client-access to the data warehouse and also allows
users to upload their own data sets for aggregation with
UCL’s social data for a particular simulation. There is also
the option to switch between historical mode (which
mines data existing at the time the simulation is started)
and live mode (which ‘listens’ to incoming data streams
and performs analysis in real time).
9.4 Platform components
The platform comprises the following modules, which are
illustrated in Fig. 20:
• Back-end services—this provides the core of the
platform functionalities. It is a set of services that
allow connections to data providers, propagation pro-
cessing and aggregation of data feeds, execution and
maintenance of models, as well as their management in
a multiuser environment.
• Front-end client APIs—this provides a set of program-
matic and graphical interfaces that can be used to interact
with a platform to implement and test analytical models.
The programmatic access provides model templates to
simplify access to some of the functionalities and defines
generic structure of every model in the platform. The
graphic user interface allows visual management of
analytical models. It enables the user to visualize data in
various forms, provides data watch grid capabilities,
provides a dynamic visualization of group behavior of
data and allows users to observe information on events
relevant to the user’s environment.
• Connectivity engine—this functionality provides a
means of communication with the outside world, with
financial brokers, data providers and others. Each of the
outside venues utilized by the platform has a dedicated
connector object responsible for control of communi-
cation. This is possible due to the fact that each of the
outside institutions provide either a dedicated API or is
using a communication protocol (e.g., the FIX protocol
and the JSON/XML-based protocol). The platform
provides a generalized interface to allow standardiza-
tion of a variety of connectors.
• Internal communication layer—the idea behind the
use of the internal messaging system in the platform
draws from the concept of event-driven programming.
Analytical platforms utilize events as a main means of
communication between their elements. The elements,
in turn, are either producers or consumers of the events.
The approach significantly simplifies the architecture of
such system while making it scalable and flexible for
further extensions.
• Aggregation database—this provides a fast and robust
DBMS functionality, for an entry-level aggregation of
data, which is then filtered, enriched, restructured and
Fig. 19 SocialSTORM Platform Architecture
AI & Soc (2015) 30:89–116 113
123
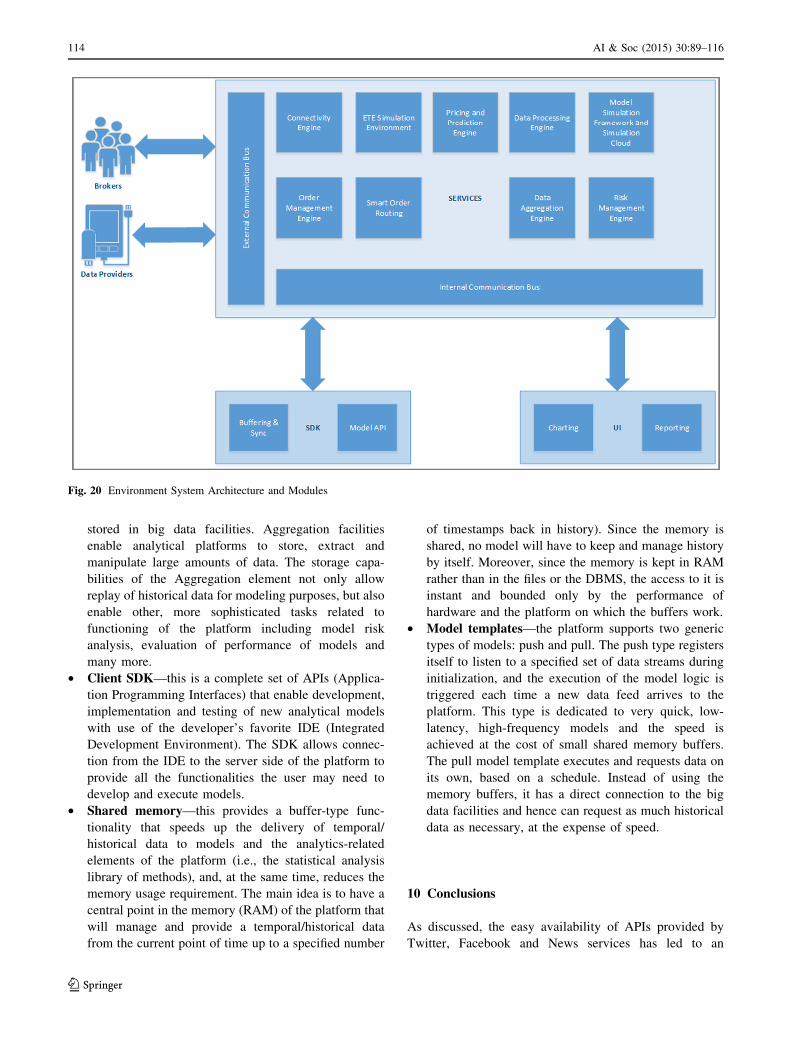
stored in big data facilities. Aggregation facilities
enable analytical platforms to store, extract and
manipulate large amounts of data. The storage capa-
bilities of the Aggregation element not only allow
replay of historical data for modeling purposes, but also
enable other, more sophisticated tasks related to
functioning of the platform including model risk
analysis, evaluation of performance of models and
many more.
• Client SDK—this is a complete set of APIs (Applica-
tion Programming Interfaces) that enable development,
implementation and testing of new analytical models
with use of the developer’s favorite IDE (Integrated
Development Environment). The SDK allows connec-
tion from the IDE to the server side of the platform to
provide all the functionalities the user may need to
develop and execute models.
• Shared memory—this provides a buffer-type func-
tionality that speeds up the delivery of temporal/
historical data to models and the analytics-related
elements of the platform (i.e., the statistical analysis
library of methods), and, at the same time, reduces the
memory usage requirement. The main idea is to have a
central point in the memory (RAM) of the platform that
will manage and provide a temporal/historical data
from the current point of time up to a specified number
of timestamps back in history). Since the memory is
shared, no model will have to keep and manage history
by itself. Moreover, since the memory is kept in RAM
rather than in the files or the DBMS, the access to it is
instant and bounded only by the performance of
hardware and the platform on which the buffers work.
• Model templates—the platform supports two generic
types of models: push and pull. The push type registers
itself to listen to a specified set of data streams during
initialization, and the execution of the model logic is
triggered each time a new data feed arrives to the
platform. This type is dedicated to very quick, low-
latency, high-frequency models and the speed is
achieved at the cost of small shared memory buffers.
The pull model template executes and requests data on
its own, based on a schedule. Instead of using the
memory buffers, it has a direct connection to the big
data facilities and hence can request as much historical
data as necessary, at the expense of speed.
10 Conclusions
As discussed, the easy availability of APIs provided by
Twitter, Facebook and News services has led to an
Fig. 20 Environment System Architecture and Modules
114 AI & Soc (2015) 30:89–116
123
‘explosion’ of data services and software tools for scraping
and sentiment analysis, and social media analytics plat-
forms. This paper surveys some of the social media soft-
ware tools, and for completeness introduced social media
scraping, data cleaning and sentiment analysis.
Perhaps, the biggest concern is that companies are
increasingly restricting access to their data to monetize
their content. It is important that researchers have access to
computational environments and especially ‘big’ social
media data for experimentation. Otherwise, computational
social science could become the exclusive domain of major
companies, government agencies and a privileged set of
academic researchers presiding over private data from
which they produce papers that cannot be critiqued or
replicated. Arguably what is required are public-domain
computational environments and data facilities for quanti-
tative social science, which can be accessed by researchers
via a cloud-based facility.
Acknowledgments The authors would like to acknowledge Michal
Galas who led the design and implementation of the UCL Social-
STORM platform with the assistance of Ilya Zheludev, Kacper
Chwialkowski and Dan Brown. Dr. Christian Hesse of Deutsche Bank
is also acknowledged for collaboration on News Analytics.
Open Access This article is distributed under the terms of the
Creative Commons Attribution License which permits any use, dis-
tribution, and reproduction in any medium, provided the original
author(s) and the source are credited.
References
Botan I et al. (2010) SECRET: a model for analysis of the execution
semantics of stream processing systems. Proc VLDB Endow
3(1–2):232–243
Salathe M et al. (2012) Digital epidemiology. PLoS Comput Biol
8(7):1–5
Bollen J, Mao H, Zeng X (2011) Twitter mood predicts the stock
market. J Comput Sci 2(3):1–8
Chandramouli B et al (2010) Data stream management systems for
computational finance. IEEE Comput 43(12):45–52
Chandrasekar C, Kowsalya N (2011) Implementation of MapReduce
Algorithm and Nutch Distributed File System in Nutch. Int J
Comput Appl 1:6–11
Cioffi-Revilla C (2010) Computational social science. Wiley Inter-
discip Rev Comput Statistics 2(3):259–271
Galas M, Brown D, Treleaven P (2012) A computational social
science environment for financial/economic experiments. In:
Proceedings of the Computational Social Science Society of the
Americas, vol 1, pp 1–13
Hebrail G (2008) Data stream management and mining. In: Fogel-
man-Soulie F, Perrotta D, Piskorski J, Steinberger R (eds)
Mining Massive Data Sets for Security. IOS Press, pp 89–102
Hirudkar AM, Sherekar SS (2013) Comparative analysis of data
mining tools and techniques for evaluating performance of
database system. Int J Comput Sci Appl 6(2):232–237
Kaplan AM (2012) If you love something, let it go mobile: mobile
marketing and mobile social media 4x4. Bus Horiz
55(2):129–139
Kaplan AM, Haenlein M (2010) Users of the world, unite! the
challenges and opportunities of social media. Bus Horiz
53(1):59–68
Karabulut Y (2013) Can Facebook predict stock market activity?
SSRN eLibrary, pp 1–58. http://ssrn.com/abstract=2017099 or
http://dx.doi.org/10.2139/ssrn.2017099. Accessed 2 Feb 2014
Khan A, Baharudin B, Lee LH, Khan K (2010) A review of machine
learning algorithms for text-documents classification. J Adv Inf
Technol 1(1):4–20
Kobayashi M, Takeda K (2000) Information retrieval on the web.
ACM Comput Surv CSUR 32(2):144–173
Lazer D et al (2009) Computational social science. Science
323:721–723
Lerman K, Gilder A, Dredze M, Pereira F (2008) Reading the
markets: forecasting public opinion of political candidates by
news analysis. In: Proceedings of the 22nd international
conference on computational linguistics 1:473–480
MapReduce (2011) What is MapReduce?. http://www.mapreduce.
org/what-is-mapreduce.php. Accessed 31 Jan 2014
Mejova Y (2009) Sentiment analysis: an overview, pp 1–34. http://
www.academia.edu/291678/Sentiment_Analysis_An_Overview.
Accessed 4 Nov 2013
Murphy KP (2006) Naive Bayes classifiers. University of British
Columbia, pp 1–8. http://www.ic.unicamp.br/*rocha/teaching/
2011s1/mc906/aulas/naivebayes.pdf
Murphy KP (2012) Machine learning: a probabilistic perspective. In:
Chapter 1: Introduction. MIT Press, pp 1–26
Narang RK (2009) Inside the black box. Hoboken, New Jersey
Nuti G, Mirghaemi M, Treleaven P, Yingsaeree C (2011) Algorithmic
trading. IEEE Comput 44(11):61–69
Pang B, Lee L (2008) Opinion mining and sentiment analysis. Found
Trends Inf Retr 2(1–2):1–135
SAS Institute Inc (2013) SAS sentiment analysis factsheet. http://www.
sas.com/resources/factsheet/sas-sentiment-analysis-factsheet.pdf.
Accessed 6 Dec 2013
Teufl P, Payer U, Lackner G (2010) From NLP (natural language
processing) to MLP (machine language processing). In: Kotenko
I, Skormin V (eds) Computer network security, Springer, Berlin
Heidelberg, pp 256–269
Thomson Reuters (2010). Thomson Reuters news analytics. http://
thomsonreuters.com/products/financial-risk/01_255/News_Analy
tics_-_Product_Brochure-_Oct_2010_1_.pdf. Accessed 1 Oct
2013
Thomson Reuters (2012) Thomson Reuters machine readable news.
http://thomsonreuters.com/products/financial-risk/01_255/TR_
MRN_Overview_10Jan2012.pdf. Accessed 5 Dec 2013
Thomson Reuters (2012) Thomson Reuters MarketPsych Indices.
http://thomsonreuters.com/products/financial-risk/01_255/TRMI_
flyer_2012.pdf. Accessed 7 Dec 2013
Thomson Reuters (2012) Thomson Reuters news analytics for internet
news and social media. http://thomsonreuters.com/business-unit/
financial/eurozone/112408/news_analytics_and_social_media.
Accessed 7 Dec 2013
Thomson Reuters (2013) Machine readable news. http://thomsonreuters.
com/machine-readable-news/?subsector=thomson-reuters-elektron.
Accessed 18 Dec 2013
Turney PD (2002) Thumbs up or thumbs down? Semantic orientation
applied to unsupervised classification of reviews. In: Proceed-
ings of the 40th Annual Meeting on Association for Computa-
tional Linguistics pp. 417–424
Vaswani V (2011) Hook into Wikipedia information using PHP and
the MediaWiki API. http://www.ibm.com/developerworks/web/
library/x-phpwikipedia/index.html. Accessed 21 Dec 2012
Westerski A (2008) Sentiment analysis: introduction and the state
of the art overview. Universidad Politecnica de Madrid,
Spain, pp 1–9. http://www.adamwesterski.com/wpcontent/files/
AI & Soc (2015) 30:89–116 115
123

docsCursos/sentimentA_doc_TLAW.pdf. Accessed 14 Aug
2013
Wikimedia Foundation (2014) Wikipedia:Database download. http://
en.wikipedia.org/wiki/Wikipedia:Database_download. Accessed
18 Apr 2014
Wolfram SMA (2010) Modelling the stock market using Twitter.
Dissertation Master of Science thesis, School of Informatics,
University of Edinburgh, pp 1–74. http://homepages.inf.ed.ac.
uk/miles/msc-projects/wolfram.pdf. Accessed 23 Jul 2013
Yessenov K, Misailovic S (2009) Sentiment analysis of movie review
comments, pp 1–17. http://people.csail.mit.edu/kuat/courses/6.
863/report.pdf. Accessed 16 Aug 2013
116 AI & Soc (2015) 30:89–116
123