
Social Inequality and the Spread of Misinformation
53
Social Inequality and the Spread of Misinformation Mohamed Mostagir * James Siderius † Abstract We study the spread of misinformation in a social network characterized by unequal access to learning resources. Agents use social learning to uncover an unknown state of the world, and a principal strategically injects misinformation into the network to distort this learning process. A subset of agents throughout the network is endowed with knowledge of the true state. This gives rise to a natural definition of inequality: privileged communities have un- restricted access to these agents while marginalized communities do not. We show that the role that this inequality plays in the spread of misinformation is highly complex. For instance, communities who hoard resources and deny them to the larger population can end up expos- ing themselves to more misinformation. On the other hand, while more inequality generally leads to worse outcomes, the prevalence of misinformation in society is non-monotone in the level of inequality. This implies that policies that decrease inequality without substan- tially reducing it can leave society more vulnerable to misinformation. 1 Introduction The central question of the social learning literature is whether a society or a group of people will manage to learn an unknown state of the world. 1 We study this question in a social network characterized by unequal access to learning resources: some agents are knowledgeable —they are already endowed with knowledge of the true state— while the rest of the agents update their beliefs about this state based on their own information (that they obtain from news sources) as well as from communicating with their friends. A strategic actor – a principal – tampers with the learning process in order to spread misinformation and get agents to mislearn the state of the world. This induces a form of inequality in the network: If some agents are endowed with knowledge of the true state or with a higher ability to learn, then being connected to these agents provides an advantage. Similarly, agents who do not have access to these individuals are com- paratively disadvantaged and their learning may be hampered as a result. This access or lack thereof is determined by the homophily structure of the network. Ho- mophily –the tendency of people to associate with those who are similar to themselves– provides * University of Michigan Ross School of Business † Laboratory for Information and Decision Systems, MIT 1 For example, whether temperatures on earth are increasing over time, as stated in Golub and Jackson (2012). 1
Transcript of Social Inequality and the Spread of Misinformation

Social Inequality and the Spread of Misinformation
Mohamed Mostagir∗ James Siderius†
Abstract
We study the spread of misinformation in a social network characterized by unequal accessto learning resources. Agents use social learning to uncover an unknown state of the world,and a principal strategically injects misinformation into the network to distort this learningprocess. A subset of agents throughout the network is endowed with knowledge of the truestate. This gives rise to a natural definition of inequality: privileged communities have un-restricted access to these agents while marginalized communities do not. We show that therole that this inequality plays in the spread of misinformation is highly complex. For instance,communities who hoard resources and deny them to the larger population can end up expos-ing themselves to more misinformation. On the other hand, while more inequality generallyleads to worse outcomes, the prevalence of misinformation in society is non-monotone inthe level of inequality. This implies that policies that decrease inequality without substan-tially reducing it can leave society more vulnerable to misinformation.
1 Introduction
The central question of the social learning literature is whether a society or a group of people
will manage to learn an unknown state of the world.1 We study this question in a social network
characterized by unequal access to learning resources: some agents are knowledgeable —they
are already endowed with knowledge of the true state— while the rest of the agents update their
beliefs about this state based on their own information (that they obtain from news sources) as
well as from communicating with their friends. A strategic actor – a principal – tampers with
the learning process in order to spread misinformation and get agents to mislearn the state of
the world. This induces a form of inequality in the network: If some agents are endowed with
knowledge of the true state or with a higher ability to learn, then being connected to these agents
provides an advantage. Similarly, agents who do not have access to these individuals are com-
paratively disadvantaged and their learning may be hampered as a result.
This access or lack thereof is determined by the homophily structure of the network. Ho-
mophily –the tendency of people to associate with those who are similar to themselves– provides∗University of Michigan Ross School of Business†Laboratory for Information and Decision Systems, MIT1For example, whether temperatures on earth are increasing over time, as stated in Golub and Jackson (2012).
1
a realistic representation of real-world networks (see Marsden (1987); McPherson et al. (2001)),
and in our framework serves as the underlying mechanism through which inequality propagates
in society. Privileged communities with easy access to knowledgeable agents are more likely to
be protected against misinformation, but if homophily is too high and communities become
more insular, then vulnerable communities with few or no knowledgeable agents will have little
access to the more affluent communities and their resources. How does this inequality affect the
spread of misinformation in the individual communities and society as a whole?
We show that the answer to this question is complex, and that changes to the inequality
structure of society can lead to fairly unintuitive outcomes. Understanding the drivers behind
these outcomes is important because of its potential consequences to social and economic pol-
icy: in addition to its effects on learning, homophily is also connected to segregation in society
(Currarini et al. (2009)), which leads to well-documented economic inequality.2 This makes it
natural to suggest policies that reduce homophily and inequality. Our paper shows that these
policies should be carefully planned –by taking into account the factors that we identify– in or-
der for them to accomplish their desired goals and not result in unintended consequences.
We do not assume the network structure is deterministic; instead, we assume that the net-
work is generated randomly from a distribution and exploit the connection between random
graphs and homophily to examine the effects of the latter on the spread of misinformation. This
allows us to develop general insights that are useful for resource allocation and policy interven-
tions. By understanding how the inequality structure of society interacts with the incentives of
a strategic principal, a social planner can respond to the spread of misinformation by shaping
that inequality structure through endowing some agents with knowledge of the correct state (for
example through education or increasing awareness) or by adjusting the homophily levels in
society, for example through facilitating communication between communities.
Finally, we remark that the prevailing assumption throughout the social learning literature is
that the news that agents obtain is organic: it may or may not be accurate, but it is provided by
sources that have no stake in what the agents’ beliefs are. In reality, such sources are rarely neu-
tral, and may have an interest in shaping these beliefs in order to direct agents towards taking
certain actions. The interference of Cambridge Analytica in the 2016 US presidential election is
one example of such belief manipulation. Similarly, recent outbreaks of measles in Eastern Eu-
rope and parts of the US have been linked to Russian interference and propaganda whose goal
is to convince people that vaccines are harmful in order to make them opt against vaccinating
2Wage inequality and differences in labor market participation across different groups are documented in Cardand Krueger (1992); Chandra (2000), and Heckman et al. (2000). Calvo-Armengol and Jackson (2004) and Calvo-Armengol and Jackson (2007) show that these inequalities can be explained through network models of homophily.
2
themselves and their children.3 Our paper provides a robustness check for some of the results in
the standard learning models. For example, while homophily is unambiguously identified as a
barrier to learning in previous literature (see Golub and Jackson (2012)), its role in this strategic
setup is much more nuanced. Successful learning under this strategic interference model there-
fore implies successful learning in the models in the literature, but the opposite implication is
not necessarily correct.
Contribution and Overview of Results. In this paper, we study the effects of inequality on the
spread of misinformation, with homophily being the underlying mechanism through which in-
equality propagates. A technical simplification (presented in Appendix A.2) allows us to reduce
the study of the random networks arising from these homophily models to studying the expected
network. Given this simplification, we make the following contributions:
Conceptual: We start by giving a definition of learning inequality as a measure of how com-
munities differ in their access to knowledgeable agents. This is determined by i) the distribu-
tion of these agents over different communities, and ii) the level of homophily in society. We
then show that the effect of inequality on the spread of misinformation is not monotone, and is
shaped by several factors. In particular, the principal’s technology for sending signals to agents
can be costly, and that cost is a large determinant for how inequality affects the spread of mis-
information. Theorem 2 shows that when that cost is negligible, so that the principal can target
whomever he wants, then intermediate levels of inequality are always (weakly) worst for society,
even more so than extreme inequality. Theorem 3 shows that this conclusion can be reversed
when the principal’s cost of sending misinformation is no longer negligible, i.e., intermediate
levels of inequality can sometimes be best for society. Such a reversal might occur because the
incentives for the principal to send misinformation are quite complicated when her signaling
technology is relatively expensive.
We also show that another factor that determines how inequality shapes the spread of mis-
information is the relative population sizes of the different communities in society. Theorem 1
shows that when communities have the same size, an increase in inequality has an expected
effect: privileged communities are better off and marginalized communities (with little access
to knowledgable agents) are worse off and more prone to manipulation. However, Theorem 4
shows that if the privileged communities are smaller in size compared to the rest of the under-
privileged population –as is typically the case– then an increase in inequality not only hurts the
large population, but also hurts the privileged communities themselves.
Lastly, we introduce a novel inequality model through a network structure we call strong ho-
3https://www.newsweek.com/russian-trolls-promoted-anti-vaccination-propaganda-measles-outbreak-1332016
3

mophily, which complements the weak homophily model commonly studied in the literature
(and throughout most of our paper). Strong homophily provides a more appropriate framework
for analyzing societies characterized by a hierarchical structure. Propositions 1 and 2 contrast
the effects of weak and strong homophily on the spread of misinformation, and show how the
latter always requires substantially more equality to protect society.
Policy Implications: The findings from our model can be used as input to policy makers. By
understanding the inequality structure of society, resources can best be directed towards inter-
ventions that will protect the population from misinformation. We consider two natural inter-
ventions: first, educating specific agents in the network who will then serve as knowledgeable
agents to protect their (and potentially other) communities. Second, increasing connectivity
across communities in order to make the network less segregated and provide more access to
these knowledgeable agents.
Our policy recommendations are parametrized by the budget that the planner has available.
We give conditions under which an equitable distribution of resources is best for society, and
show that it can be in the best interest of privileged communities to champion policies that allo-
cate resources to marginalized communities, otherwise everyone in the population is worse off.
However, due to the complexity of the phenomena being studied, exceptions can sometimes oc-
cur. When the principal’s signaling technology is costly, some inequality in the network might
be best at protecting society from misinformation. Conversely, when signaling costs are cheap,
intermediate levels of inequality are worst for society, and in this case a budget-constrained
planner who cannot drastically reduce extreme inequality and instead opts to just reduce it can
unwittingly push society into a regime that is susceptible to misinformation. Our results in this
case advocate for a minimum budget allocation that allows the planner to reduce inequality
enough to bypass the problematic intermediate inequality region. More generally, our model
provides a basic framework to think about these decisions in terms of the primitives of the prob-
lem represented by the inequality structure, the principal’s signaling costs, and the planner’s
budget.
Related Literature The seminal paper of Golub and Jackson (2012) shows how homophily slows
down social learning. Instead of learning rates, our focus is on understanding the role of ho-
mophily in whether a network is impervious to manipulation when the learning horizon is long,
and when information is potentially provided by a strategic source. Lobel and Sadler (2015) show
how the role of homophily in a sequential learning model depends on the density of the network.
Homophily in that paper is used to describe alignment of preferences over the agents’ decision
4

problem,4 whereas homophily in our model captures similarities along dimensions (race, age,
profession, income, etc.) that can be orthogonal to whatever state the agents are trying to learn.
Knowledgeable agents in our model are stubborn agents who know the truth. Opinion dy-
namics with stubborn agents have been studied in Acemoglu et al. (2013) and Yildiz et al. (2013)
among others. The recent work of Sadler (2019) extends Yildiz et al. (2013) to random graphs.
What differentiates our paper from this literature is the presence of a strategic principal, which
gives rise to completely different learning dynamics and implications.
There is recent work on fake news and manipulation. In Candogan and Drakopoulos (2017)
and Papanastasiou (2020), there is no strategic news provider; fake news already exists in the
system and the focus is on how it can be identified and controlled. There are also papers that
examine how agents are manipulated but without considering the network aspect, e.g. Mostagir
(2010), and the more recent work of Chen and Papanastasiou (2021) in an observational learn-
ing context, Mostagir and Siderius (2021b) in the context of product reviews, and Keppo et al.
(2019). The manipulation problem as presented in our paper was introduced in Mostagir et al.
(2021), where agents interact over a fixed and known network topology. Our paper embeds this
model in a random network structure in order to study the role of inequality in the spread of
misinformation. In addition, our paper provides a prescriptive component to evaluate which
policies may be effective in stopping the spread of misinformation as a function of inequality in
society. As mentioned earlier, these policies also speak to issues of community integration and
resource allocation.
Our paper assumes only knowledge of the random process from which the network is gen-
erated. There is recent literature that tries to recover the network structure from relational data,
e.g. Alidaee et al. (2020); Ata et al. (2018) consider a seller who does not know the network struc-
ture but, in the presence of externalities, estimates it from transaction data. Other recent work,
e.g. Auerbach (2019), tests whether a network was generated from an inhomogeneous random
graph model (which includes the class of stochastic block matrices commonly used to model
homophily). These methods can be used to estimate the structure of homophily in society and
applied as input to our model.
Finally, our paper is also related to diffusion and seeding in random networks, as exemplified
by the recent work of Manshadi et al. (2018), Akbarpour et al. (2018), and Sadler (2019). These
papers consider the classic problem of which agents to select in order to spread information
throughout the network. The primary difference with our work is that we consider an adversar-
ial, strategic principal who is trying to spread his own influence in the network, and our goal is4For example, an agent who is deciding on a restaurant weighs the opinion of her friend differently if she and her
friend prefer the same type of food.
5

to identify conditions and policies under which we can stop this principal from spreading mis-
information, with a specific emphasis on the role of inequality and the social structure of the
network in propagating such information.
Organization We introduce a model of strategic misinformation in random social networks in
Section 2. Section 3 demonstrates some of the main results and insights in the paper through
a few examples. The formal results follow in Sections 4 and 5, while Section 6 investigates im-
portant variations on our main model by introducing strong homophily and studying networks
where communities can be of different sizes. Finally, we discuss possible interventions to pre-
vent the spread of misinformation in Section 7 and conclude the paper in Section 8.
2 Model
Random Network Model Our model is built on top of a class of random networks known as
stochastic block networks, which are based on inhomogeneous Erdos-Renyi graphs. Stochas-
tic block networks were introduced in Holland et al. (1983) and are the focus of the study of
homophily in Golub and Jackson (2012). In these networks, agents interact in well-connected
communities, with few links between communities. These communities are based on demo-
graphic factors such as age, location, income, education, and so on. Formally, agents within the
same community ` are linked with probability ps and agents in different communities are linked
with probability pd < ps. We refer to this as the homophily structure of the network. This model
turns out to be rather accurate in describing friendship and communication patterns, as doc-
umented in previous empirical work such as Marsden (1987), and determines the social circle
that an agent exchanges information with, as discussed in the Learning section below.
States and Actions Time is discrete and agents learn over a finite horizon, t ∈ {1, . . . , T}.5 At
time t = 0, the underlying state y ∈ {S,R} is drawn, with P(y = S) = q ∈ (0, 1). Agents try
to learn the state of the world in order to take an action at time T , with the goal of taking the
action that matches the true state, i.e. take action S if the state is S or action R if the state is
R.6 A principal is interested in agents taking action R regardless of what the state of the world
is. These payoffs are represented in Table 1, where the two numbers in each cell represent the
payoffs to the principal and to the agent, respectively, for the state of nature and agent action
5Implicit in this is that agents receive news at the same time. In Appendix A we provide a less parsimonious, butequivalent, model where agents digest news at different rates, among other generalizations, that do not affect theconclusions of the model.
6For example, as in Mostagir et al. (2021), they want to learn whether a particular vaccine is safe (state of the worldy = S) so that they vaccinate (take action S) or whether a vaccine is risky (state of the world y = R) so that they wouldchoose to avoid vaccination (take action R).
6
AgentR S
State yR 1, 1 + b 0, 0
S 1, b 0, 1
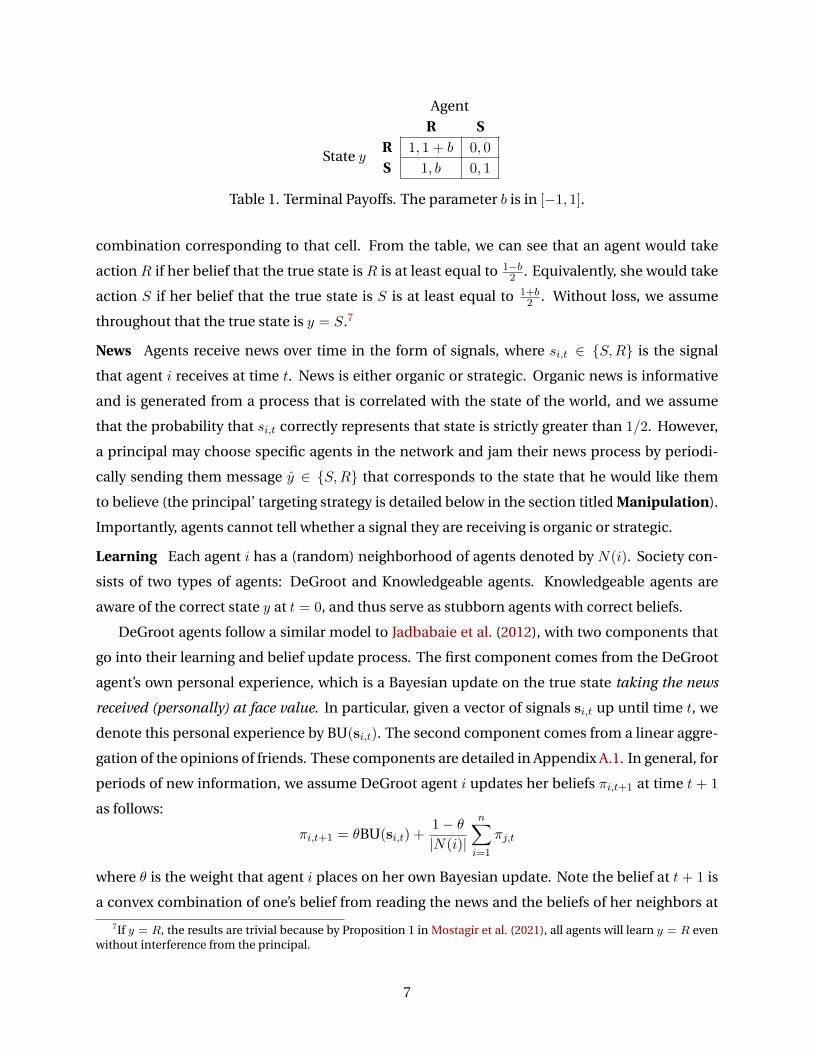
Table 1. Terminal Payoffs. The parameter b is in [−1, 1].
combination corresponding to that cell. From the table, we can see that an agent would take
action R if her belief that the true state is R is at least equal to 1−b2 . Equivalently, she would take
action S if her belief that the true state is S is at least equal to 1+b2 . Without loss, we assume
throughout that the true state is y = S.7
News Agents receive news over time in the form of signals, where si,t ∈ {S,R} is the signal
that agent i receives at time t. News is either organic or strategic. Organic news is informative
and is generated from a process that is correlated with the state of the world, and we assume
that the probability that si,t correctly represents that state is strictly greater than 1/2. However,
a principal may choose specific agents in the network and jam their news process by periodi-
cally sending them message y ∈ {S,R} that corresponds to the state that he would like them
to believe (the principal’ targeting strategy is detailed below in the section titled Manipulation).
Importantly, agents cannot tell whether a signal they are receiving is organic or strategic.
Learning Each agent i has a (random) neighborhood of agents denoted by N(i). Society con-
sists of two types of agents: DeGroot and Knowledgeable agents. Knowledgeable agents are
aware of the correct state y at t = 0, and thus serve as stubborn agents with correct beliefs.
DeGroot agents follow a similar model to Jadbabaie et al. (2012), with two components that
go into their learning and belief update process. The first component comes from the DeGroot
agent’s own personal experience, which is a Bayesian update on the true state taking the news
received (personally) at face value. In particular, given a vector of signals si,t up until time t, we
denote this personal experience by BU(si,t). The second component comes from a linear aggre-
gation of the opinions of friends. These components are detailed in Appendix A.1. In general, for
periods of new information, we assume DeGroot agent i updates her beliefs πi,t+1 at time t + 1
as follows:
πi,t+1 = θBU(si,t) +1− θ|N(i)|
n∑i=1
πj,t
where θ is the weight that agent i places on her own Bayesian update. Note the belief at t + 1 is
a convex combination of one’s belief from reading the news and the beliefs of her neighbors at
7If y = R, the results are trivial because by Proposition 1 in Mostagir et al. (2021), all agents will learn y = R evenwithout interference from the principal.
7
time t. We implicitly assume in this formulation that every agent weights her neighbors equally.
Manipulation At t = 0, before the learning process begins, the principal picks an influence
strategy xi ∈ {0, 1} for each agent i in the network, where xi = 1 indicates that agent i is targeted
by the principal (and will therefore occasionally receive strategic news signals y). The principal
may play any influence strategy x ≡ {xi}ni=1 over the network, and incurs an upfront investment
cost ε > 0 for each agent with xi = 1, thus the utility of the principal is the number of agents
taking action R less total investment cost.
Agent i is manipulated if she would figure out the correct state in the absence of interference
from the principal (i.e. when x = 0), but would mislearn the state when the principal has a
profitable network strategy x 6= 0, as T → ∞. Notice that the agent does not have to be directly
targeted by the principal to be manipulated. Likewise, an agent may not be manipulated even if
she is targeted. A network is impervious to manipulation if there is no profitable strategy for the
principal that results in any agent mislearning the true state.
DeGroot Centrality Determining whether an agent is manipulated is equivalent to computing
her limit belief of the incorrect state and checking whether the belief is higher than the cut-
off obtained from the payoff table. The concept of DeGroot Centrality (DC) in Mostagir et al.
(2021) combines the ideas of Katz-Bonacich and PageRank centrality and can be computed for a
deterministic network using the technique of weighted walks (Appendix A.3 provides a compre-
hensive primer on how to compute DC). This centrality measure captures how much influence
the principal’s strategy has on a given agent’s belief, and is precisely equal to that agent’s belief
of the incorrect state, i.e., characterizing whether an agent is manipulated or not is equivalent
to computing her DeGroot centrality. With a slight abuse of notation, we will often refer to πi as
the agent’s belief of the correct state (i.e., πi(S)), which is equal to 1 minus agent i’s DC.
Inequality The existence of (knowledgeable) agents who know the correct state and propagate
truthful information gives rise to a degree of inequality across communities. We use the term
privileged to refer to a community with a higher proportion of knowledgeable agents compared
to a marginalized community that has a smaller proportion of these agents. Access to knowl-
edgeable agents is closely tied to the homophily structure, which determines how many (direct)
connections DeGroot agents in different communities have to these agents. Thus, changes in
the homophily of a network also introduce changes to inequality. This working definition of in-
equality is useful for understanding the examples in Section 3; the formal definition is deferred
to Section 4 before we derive our main theorems. In Section 6, we consider the subtle effects of
inequality that arise when communities have different-sized populations and when homophily
takes a more extreme form, preventing certain communities from interacting directly at all.
8

Connection Between Random and Deterministic Networks Analyzing random networks in-
stead of their deterministic counterparts is a difficult task. Exploiting some recent work in cen-
trality on random networks (see Mostagir and Siderius (2021a)), we show that when the pop-
ulation is large, the number of manipulated agents in the realization of the random network
converges to the number of manipulated agents in an appropriately-defined expected network.
It therefore suffices to examine that much simpler network to characterize the spread of misin-
formation. The details of this reduction are provided in Appendix A.2.
3 Demonstration of Main Ideas
This section serves as an overview of the technical results in the paper by presenting three exam-
ples that demonstrate the complex role of inequality in learning and manipulation. The exam-
ples below show that increasing inequality can: i) have divergent effects on different communi-
ties, hurting one community and making another better off, or ii) it can hurt the whole society,
or iii) it can protect the whole society. This variety of outcomes depends on a myriad of factors
like relative community affluence, relative community sizes, and the cost of the manipulation
technology.
Below, we go through the details of each of these examples.
3.1 Inequality Hurts the Most Marginalized
We consider two communities of equal size and explore the degree of manipulation under dif-
ferent homophily structures. Two of the agents on the first island are knowledgeable, compared
to only one of the agents on the other island. Thus, the former island is the privileged commu-
nity and the latter island is the marginalized community. This setup is pictured in Figure 1. In
this example, we vary homophily by setting pd = 0.2 and increasing ps > pd (note that as ps in-
creases, homophily increases). We assume that ε = 0 so that it is costless for the principal to
send misinformation (and therefore will send to everyone).
Figure 1 shows the beliefs of the agents in both communities. Recall that manipulation oc-
curs when an agent’s belief falls below a certain threshold π∗. We see that as ps increases, the
beliefs of the privileged community move closer to the truth (higher belief) whereas the beliefs
of the marginalized community move farther from the truth (lower belief). In addition, there ex-
ists a corresponding homophily threshold ps (approximately 0.4 in this example) whereby when
ps < ps, there is no manipulation, but when ps > ps, the marginalized community becomes
manipulated. An increase in inequality in this example leads to more manipulation in society.
9

Figure 1. On the left is the setup of Section 3.1, and on the right are the beliefs of the two com-munities. As homophily increases (i.e. as ps increases), the beliefs of the privileged communitymove towards the truth while the marginalized community’s beliefs fall below the belief thresh-old given by the dashed line, leading to the agents in that community taking the incorrect action.
Thus, an increase in inequality makes society worse off as the marginalized community becomes
susceptible to misinformation.
3.2 Inequality Hurts Everyone
We now consider three islands: a small privileged community with an eighth of the popula-
tion, a small marginalized community with an eighth of the population, and a large community
with the remaining three quarters of the population. Assume that there are three knowledgeable
agents in the privileged community, one knowledgeable agent in the large community, and no
knowledgeable agents in the marginalized community. This setup is depicted in Figure 2.
Similar to the previous example, we set ε = 0, fix pd = 0.2, and vary ps to change the amount
of homophily in society. The beliefs of the three different communities are shown in Figure 2 as
a function of ps. Given the threshold line π∗ in the plot, we see that as homophily increases, the
beliefs of all agents in the population move farther away from the truth. Once homophily hits
ps = 0.3, two communities are manipulated while the privileged community is still immune. As
homophily increases further to ps = 0.5, everyone in the network is manipulated. This is true
even for the privileged community, despite the fact that agents in this community are forming
more direct connections with knowledgeable agents who spread truthful information.
Such a phenomenon occurs because the size disparity between communities leads to all of
them deriving most of their beliefs from the information spreading in the large community, so
10

Figure 2. On the left is the setup of Section 3.1, and on the right are the beliefs of the two com-munities. As homophily increases (i.e. as ps increases), the beliefs of all communities move awayfrom the truth and fall below the belief threshold, so that all agents take the incorrect action. Fur-ther increase in homophily restores some of the beliefs in the privileged community, but doesnot bring it back to first-best levels.
when inequality hurts this community, it propagates to those who, on the surface, should be
benefiting from it (as in the previous example). Another way of seeing this is that when inequal-
ity decreases, knowledgeable agents in the privileged community can have their voices amplified
through talking to agents in the large community, who then help spread these beliefs over the
network (including back to DeGroot agents in the privileged community).
While intermediate levels of inequality are bad for all agents, Figure 2 shows that an increase
in homophily beyond a certain point (around ps ≈ 0.85) begins to restore the beliefs of the priv-
ileged community, but not to the extent of returning these beliefs to first-best levels. This is a
consequence of the large community suffering with false beliefs and dragging down the beliefs
of those in the privileged community. Thus, once homophily reaches an extreme level, the mis-
information rampant on the large island ceases to spread beyond its own community. In that
sense, extreme homophily is better than intermediate homophily because at least one of the
islands is insulated from the misinformation in the large community.
11

Figure 3. Example of Section 3.3
3.3 Inequality Protects Society
We now give an example to show how the spread of misinformation can be shaped by the in-
terplay between the principal’s strategy and the inequality structure of society. Consider three
communities of the same size. The privileged community has a 3% knowledgeable population,
the “average” community has a 1% knowledgeable population, and the marginalized commu-
nity has no knowledgeable agents. Unlike the previous examples, we assume that ε ∈ (4/5, 1), so
that it is not free for the principal to expend resources in manipulating the beliefs of the agents.
This setup is depicted in Figure 3.
Figure 4a shows the beliefs (of the correct state) when the principal sends signals to everyone
in the population. Suppose there is no homophily, so that ps = pd = 0.2, and, as always, there
is a belief cutoff π∗ for taking the correct action. Then under this strategy, all agents are manip-
ulated, and the cost of sending signals is ε < 1, so this is indeed profitable and the network is
susceptible.8
As homophily increases, the beliefs of the privileged community move closer to the truth and
eventually pass the cutoff, thereby insulating them from the strategy where the principal exerts
maximal influence over the entire population. For instance, when ps > 0.3 in Figure 4a, the
privileged community takes the correct action even though the other two communities do not.
8Note that it is not immediate that every agent will be manipulated in equilibrium, just that the network is suscep-tible (see Mostagir et al. (2021), Corollary 2). However, it can be shown through a more sophisticated argument that ifthe principal targets at most 5/6 of the population (regardless of the distribution across islands), then he manipulatesno one. Thus, the optimal strategy for the principal is to target sufficiently many agents to guarantee that all islandsare manipulated.
12
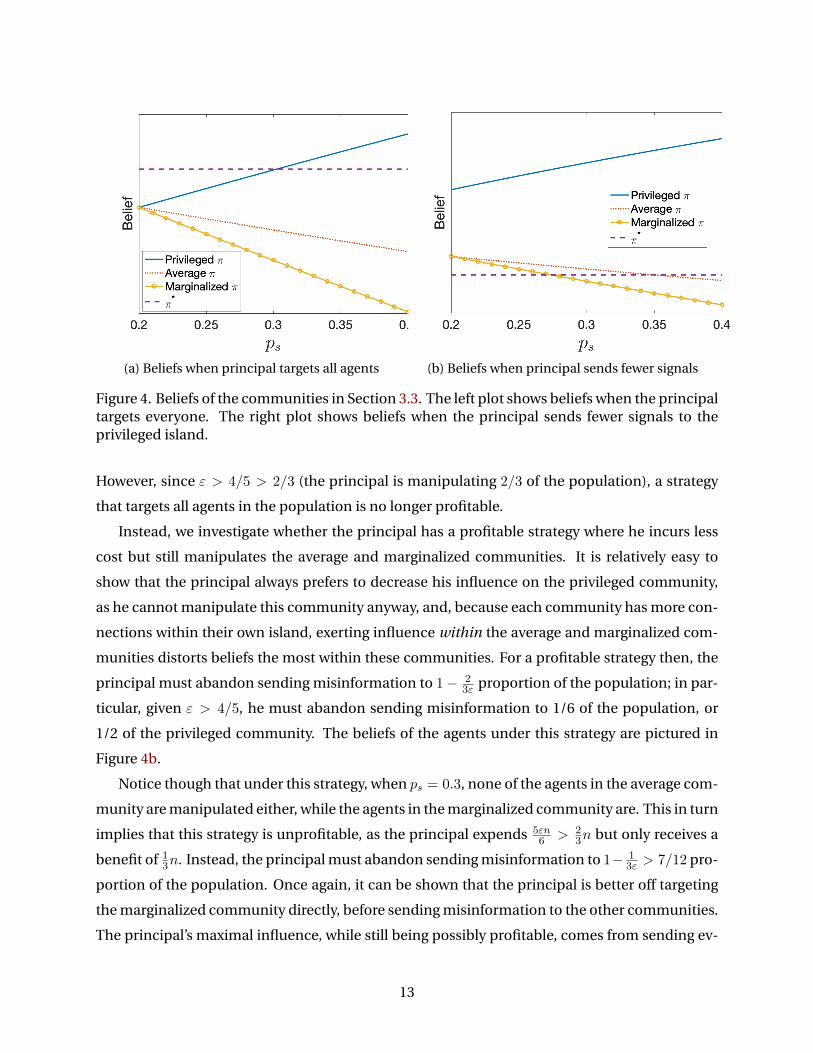
(a) Beliefs when principal targets all agents (b) Beliefs when principal sends fewer signals
Figure 4. Beliefs of the communities in Section 3.3. The left plot shows beliefs when the principaltargets everyone. The right plot shows beliefs when the principal sends fewer signals to theprivileged island.
However, since ε > 4/5 > 2/3 (the principal is manipulating 2/3 of the population), a strategy
that targets all agents in the population is no longer profitable.
Instead, we investigate whether the principal has a profitable strategy where he incurs less
cost but still manipulates the average and marginalized communities. It is relatively easy to
show that the principal always prefers to decrease his influence on the privileged community,
as he cannot manipulate this community anyway, and, because each community has more con-
nections within their own island, exerting influence within the average and marginalized com-
munities distorts beliefs the most within these communities. For a profitable strategy then, the
principal must abandon sending misinformation to 1− 23ε proportion of the population; in par-
ticular, given ε > 4/5, he must abandon sending misinformation to 1/6 of the population, or
1/2 of the privileged community. The beliefs of the agents under this strategy are pictured in
Figure 4b.
Notice though that under this strategy, when ps = 0.3, none of the agents in the average com-
munity are manipulated either, while the agents in the marginalized community are. This in turn
implies that this strategy is unprofitable, as the principal expends 5εn6 > 2
3n but only receives a
benefit of 13n. Instead, the principal must abandon sending misinformation to 1− 1
3ε > 7/12 pro-
portion of the population. Once again, it can be shown that the principal is better off targeting
the marginalized community directly, before sending misinformation to the other communities.
The principal’s maximal influence, while still being possibly profitable, comes from sending ev-
13

Figure 5. Beliefs of the communities in Section 3.3 when the principal attempts to manipulateonly the marginalized community. On the left (right) are the beliefs when the principal targetsa fraction of the average (privileged) community in addition to the marginalized community.Neither strategy is profitable as no one is manipulated.
eryone on the marginalized community misinformation and then either: (i) not sending signals
to the privileged community but sending signals to 1/12 of the average community, or (ii) not
sending signals to the average community but sending signals to 1/12 of the privileged commu-
nity. The beliefs under both these strategies are pictured in Figure 5.9
As can be seen, under either of these strategies there is not enough misinformation sent to
distort even the marginalized island’s beliefs. The network is impervious to manipulation be-
cause of this domino effect: as one community becomes more insulated, its beliefs move closer
to the truth and spill over to the next community and the process repeats until all communities
are protected and the principal had no profitable strategy. As such, the presence of some in-
equality can end up protecting everyone by discouraging strategic manipulation of beliefs. We
call this phenomenon protection contagion and explore it further in Section 5.
4 Inequality and the Spread of Misinformation
In this section, we focus our attention on the case where the cost of sending misinformation, ε, is
close to 0. In such instances, the principal’s optimal strategy is trivial: he sends misinformation
to everyone in the network. This decouples the belief dynamics and inequality structure from
9Any convex combination of targeting agents in both the average and privileged communities lead to the sameconclusion.
14

the principal’s strategy and allows us to study these dynamics in isolation. The case where ε� 0,
and when the principal’s optimal strategy is non-trivial, is the focus of Section 5.
4.1 Inequality and Network Homophily
We assume there are k islands and a society (ps, pd,m) is specified by three objects:10
1. ps: the communication within islands (i.e., the within-island link probability).
2. pd: the communication across islands (i.e., the across-island link probability).
3. m ≡ (m1, . . . ,mk): the vector of knowledgeable agent counts for each island ` ∈ {1, . . . , k}.
We refer to the pair (ps, pd) as the homophily of the network; these parameters completely deter-
mine the social network structure. We always assume ps ≥ pd. Next we define what it means for
one society to exhibit less inequality than another:
Definition 1. (Inequality) We say that society (ps, pd,m) exhibits less inequality than society
(p′s, p′d,m
′) if:
(a) There is more communication across islands; namely, pd ≥ p′d;
(b) There is less communication within islands; namely, ps ≤ p′s;
(c) The distribution of knowledgeable agents across groups is more “equally distributed”; for-
mally, m′/s is a majorization11 of m/s.
with at least one condition strict.
If Society A has less inequality than Society B, this suggests two features. First, any agent in
Society A is more likely to talk to agents outside her own island, relative to the higher inequality
Society B. This is a direct consequence of less homophily. Second, less inequality also implies
less inequality in terms of direct connections to knowledgeable agents: any two agents in Society
A are more likely to have a similar number of (weighted) connections to knowledgeable agents
as compared to Society B. The most equitable distribution of knowledgeable agents occurs when
they are the same constant fraction of the population on every island.
10We use “communities” and “islands” interchangeably throughout.11A majorization x′ of x satisfies (i)
∑k`=1 x` =
∑k`=1 x
′` and (ii)
∑`∗
`=1 x` ≥∑`∗
`=1 x′` for all `∗ ∈ {1, . . . , k}, where the
components of x and x′ are sorted in ascending order (see Marshall et al. (2011)). An equivalent condition is whetherone can transform m′ into m via a sequence of “Robin Hood” operations: one can recover m from m′ via a sequenceof transferring knowledgeable agents from islands that have a larger population of such agents to islands with fewer(see Arnold (1987)).
15

Inequality provides a partial (as opposed to total) ordering on societies. This occurs for the
following reasons. First, if we simultaneously increase homophily and more evenly distribute
knowledgeable agents, then we create more even access to resources but also restrict how com-
munities share these resources, resulting in an ambiguous inequality comparison. For example,
assuming equal island sizes, a society described by (ps, pd,m1,m2) = (0.5, 0.5, 3, 0) is no more or
less equitable than a society described by (p′s, p′d,m
′1,m
′2) = (0.8, 0.2, 2, 1). Second, majorization
itself defines only a partial order, so it is possible that two knowledgeable agents distributions m
and m′ are not comparable. For instance, assuming equal island sizes, (m1,m2,m3) = (1, 1, 4)
is no more or less equitable than (m′1,m′2,m
′3) = (0, 3, 3). For this reason, we use the following
definition in order to compare inequality structures:
Definition 2. We say a society has the most inequality if there exists no other society with (strictly)
more inequality. We say a society has the least inequality if there exists no other society with
(strictly) less inequality. We say a society has intermediate inequality if it is neither a society with
the most or least inequality.
Note that a society with the most inequality necessarily has homophily structure (ps, pd) =
(1, 0) and a society with the least inequality necessarily has (ps, pd) = (0.5, 0.5). However, all the
analysis that follows is continuous in ps and pd, and so holds for (non-empty) open intervals
around these homophily parameters as well. Finally, we remind the reader that we use the term
marginalized to refer to a community that has a smaller proportion of knowledgeable agents
compared to a privileged community (which has a higher proportion of knowledgeable agents ).
4.2 Misinformation in Equal-Sized Communities
Recall that when ε ≈ 0, the principal’s strategy is trivial and she exerts maximal influence on
the population, i.e., x = 1. We assume each island has an equal share of the population s1 =
s2 = · · · = sk = 1/k. In the same vein as Section 3.1, we show that the intuition of “increased
inequality is bad for learning” is accurate in the special case where a) islands have equal sizes (as
in Golub and Jackson (2012)) and b) the only criterion is whether society as a whole is impervious
(i.e. no agent is manipulated) or not, rather than the number of agents manipulated.
Theorem 1. If society (ps, pd,m) is susceptible to manipulation and has less inequality than soci-
ety (p′s, p′d,m
′), then society (p′s, p′d,m
′) is also susceptible to manipulation.
In other words, Theorem 1 states that there is an inequality threshold12 whereby increasing12Because there is only a partial ordering of societies, this threshold holds two of three inequality parameters con-
stant while changing the third one. For example, if the knowledgeable agents distribution is the parameter beingchanged, then one can apply the threshold for any partially ordered sequence of distributions.
16

inequality eventually flips the network from impervious to susceptible. This result corroborates
the evidence that inequality hurts learning; in particular, inequality always negatively affects
learning in the most marginalized communities. However, Theorem 1 does not claim that total
manipulation —the number of manipulated agents— is monotone in the degree of inequality. In
particular, once the network becomes susceptible, it may be possible that increasing inequality
leads to a reduction in the extent of manipulation, though it does not return the network to its
first-best state of imperviousness. This property holds generally:
Theorem 2. For any society with k ≥ 3 islands of equal size and m total knowledgeable agents :
(i) For a given b,m, if there is an impervious network for some inequality structure, the network
with the least inequality is impervious;
(ii) For all b,m, there always exists a network with intermediate inequality that has (weakly)
more manipulation than some network with more inequality.
(iii) There exist values for b,m such that the network of (ii) with intermediate inequality has
strictly more manipulation than some network with more inequality.
Theorem 2 states that an “intermediate” amount of inequality is worse than an extreme
amount of inequality, which in turn is worse than no inequality at all. While removing all in-
equality improves learning, simply reducing inequality in an extremely homophilous society can
actually lead to worse learning and manipulation outcomes.
Underlying the previous result is the fact that social connections have both positive and neg-
ative externalities. On one hand, they serve as a transmission mechanism for spreading the
(correct) beliefs of knowledgeable agents. However, they also allow the principal to spread mis-
information in a more effective way, by using social forces to manipulate other agents as well.
When homophily is extreme, the principal cannot use one community to influence another.
These missing connections can prevent the principal from manipulating certain communities,
who had previously derived their beliefs from more marginalized communities when homophily
was not too extreme. On the other hand, when homophily is quite weak, access to knowledge-
able agents is relatively similar across islands, which allows them to communicate truth most
effectively. It is the intermediate homophily case that often acts as a perfect breeding ground for
manipulating beliefs.
This result provides a sleek connection to models of contagion in financial networks (see
Acemoglu et al. (2015), Babus (2016), Kanak (2017), for example). Similar to the degree of ho-
mophily in our setting, in these models, connections both serve to reduce and exacerbate the
17

propagation of negative forces. On one hand, when a bank’s linked institutions are in distress,
the bank finds itself less well-capitalized and more likely to default. However, when a bank faces
an idiosyncratic or temporary problem, it can rely on neighboring (safe) institutions to protect
it from insolvency. Hence, the stability of a financial network can be subtle, and the effect of
increased interconnectivity is typically ambiguous, just as with social learning in the presence
of homophily and inequality.
5 Strategic Influence and Inequality
The results in Section 4 are obtained under the assumption that the cost of sending misinforma-
tion is negligible, and therefore the principal targets every agent in the population. This ε = 0
case enabled us to measure how misinformation propagates as a function of the inequality struc-
ture in society, without introducing strategic considerations on the part of the principal.
We now relax this by assuming ε � 0, and for simplicity also assume that all communities
are the same size. The latter assumption allows us to isolate the effects of the principal’s strat-
egy from the population size effects identified in Sections 3.2 and 6.1. The ε � 0 assumption
requires a strategic choice by the principal of who to target, and is of critical importance in un-
derstanding the spread of misinformation in the presence of a strategic actor.
For the interested reader, Appendix B.3 expands on Section 3.3 and provides a detailed walk-
through of an example where ε varies from small to large in a society with two communities,
and shows that some inequality can protect the entire society by initially protecting the privi-
leged community. Theorem 3 extends this to an arbitrary number of communities by showing
that such a network where intermediate inequality is best for society always exists when the
principal faces non-negligible signaling costs. This contrasts with Theorem 2, where intermedi-
ate inequality is not only never optimal, but is always (weakly) worst for society when signaling
costs are low. Finally, we conclude with some numerical experiments that show how manipu-
lation changes as a function of simultaneously varying the investment cost and the inequality
structure under the principal’s optimal strategy.
5.1 Protection Contagion: The Case for Some Inequality
Recall from Section 3.3 that when there was no inequality, the principal had a profitable strategy
to target and manipulate everyone. With some inequality, however, the principal was unable
to manipulate one of the more privileged communities, which in turn made his strategy too
expensive. To maintain a profitable strategy, the principal had to reduce his direct influence on
18

that community in order to save costs, while still trying to retain the same extent of (indirect)
overall influence on the other communities. However, this reduction made the principal unable
to manipulate the next privileged community, which similarly led to him reducing his direct
influence in that community, and so on. We refer to this cascade effect as protection contagion.
This effect is not an artifact of Section 3.3, or the example presented in the previous section.
In fact, when the principal has intermediate costs for sending misinformation, protection conta-
gion can sometimes lead to a complete unraveling of his influence when there is some inequality
in the network. This is summarized in the next result.
Theorem 3. Suppose there are k ≥ 2 islands of equal size. There exists b∗ < b∗∗, ε∗ < ε∗∗, such that
if b ∈ (b∗, b∗∗) and ε ∈ (ε∗, ε∗∗), there exists a network with intermediate inequality that is impervi-
ous, despite every network with the most inequality being susceptible, and every network with the
least inequality admitting strictly more manipulation than networks with the most inequality.
Theorem 3 describes a range where intermediate inequality is best for protecting society
from the spread of misinformation. Suppose we order the communities based on their privilege,
i.e. the proportion of knowledgeable agents in the population, and protect the most privileged
community from manipulation. This protection forces the principal to decrease his effort in
this community to try and maintain a profitable strategy. By doing so, the beliefs in that com-
munity move closer towards the truth, and because there is still some communication across
communities, this provides a positive externality to the rest of the network. The principal then
is unable to manipulate the next privileged community, and so stops targeting that community
as well, leading to a recursive process that repeats for all communities, and the principal cannot
target anyone while retaining a positive payoff. However, if inequality becomes extreme, this
contagion effect fails to take place: the positive spillovers from protecting one community are
minimal in the face of gross inequality. Extreme homophily leads to little communication across
communities and so protecting one community still leaves the rest exposed to misinformation.
Note the connection between Theorem 3, when ε � 0, and Theorem 2(a), when ε ≈ 0.
Theorem 2(a) states that if some inequality model is impervious, then the least inequality attains
imperviousness. This is not the case for ε � 0; in particular, Theorem 3 states that it may be
possible for an intermediate inequality model to be the only model that attains imperviousness.
5.2 Numerical Simulations
We provide results from two numerical simulations that illustrate the non-monotonic behav-
ior from the previous section on the broader parameter space. Recall that we can increase the
19

Figure 6. Heat maps showing fraction of agents manipulated as a function of the signalingcost ε and pd (left figure) or m1 (right figure). Note that increasing pd implies decreasing ho-mophily/inequality. Light blocks indicate no manipulation, while gray (dark) blocks indicatehalf (all) the population is manipulated.
level of inequality by increasing homophily or by having a more uneven distribution of knowl-
edgeable agents between islands of equal size. We simulate both of these scenarios. In the first
simulation, we vary the extent of homophily through varying pd (while holding ps fixed). The
second simulation varies the distribution of knowledgeable agents across the islands. In both
cases, we simultaneously vary the cost ε that the principal faces.
Homophily. We fix ps = 0.8 and take b = 0, so that an agent takes an action based on the state
she believes is most likely. There is a total population of 1000 agents split equally across two
islands; one island has 80 knowledgeable agents and the other has the remaining 20.
The left heat map in Figure 6 shows the results of this simulation. In the range of ε ∈ (1.1, 1.7),
we notice the non-monotonicity described in Theorem 3 as we increase pd (i.e., decrease ho-
mophily/inequality). For small values of pd (large homophily), half the agents are manipulated.
As we decrease homophily through increasing pd, we transition to a region where the network is
impervious. Finally, as homophily decreases further, we end up in a region where all agents in
the network are manipulated. This is the same effect seen in the example of Appendix B.3.1.
Distribution of Knowledgeable Agents. We fix (ps, pd) = (0.5, 0.2) and take b = 0. There is a
total population of 1000 agents, split over two islands of equal size, and we vary the number of
knowledgeable agents, m1, on the first island from 0 to 100 (with the other island containing the
remainder, m2 = 100−m1) .
20

The results are shown in the right heat map in Figure 6. Inequality between islands is most
severe when m1 = 0 or m1 = 100, with the least inequality at m1 = 50. In the range ε ∈ (0.9, 1.7),
we see that the network is impervious provided there is sufficient inequality in the distribution
of knowledgeable agents; otherwise, all agents are manipulated. This inequality protects one is-
land from manipulation and, through protection contagion, prevents the principal from having
any profitable strategy.
6 Different Community Sizes and Strong Inequality
Up until now, we have focused on communities that are roughly equal in population and whereby
agents in those communities associate more with those in their own community, but do not dif-
ferentiate their social interactions amongst other communities. In this section, we consider the
complexities of having both (i) large or small communities and (ii) inequality structures that are
“strong,” in the sense that there are significant barriers to communication between certain com-
munities. For the latter, we consider an inequality structure where agents further differentiate
their social interactions by only affiliating with groups who have characteristics that are close to
those of their own community. We call this strong inequality. We consider how this type of strong
inequality affects society at large relative to the weaker notion of inequality with a flat hierarchy,
as we have studied in the previous sections.
6.1 Misinformation with Different Community Sizes
We now consider the case when communities are not the same size. We begin with the following
definition:
Definition 3. We say that an island ` is least privileged if (i) its belief of the correct state is the
least of any island (i.e., π` ≤ π`′ for all `′) and (ii) it has the least knowledgeable agent percentage
of the population (i.e., m`/s` ≤ m`′/s`′ for all `′).
Observe that condition (i) is also equivalent to island ` having the largest DeGroot centrality.
Note that with islands of the same size, condition (i) holds if and only if condition (ii) holds for
island `, so is redundant. However, with islands of different sizes, because influence is asymmet-
rical across islands, neither condition implies the other.
As we saw in Section 3.2, when communities have different population sizes, the results of the
previous section need not hold. When there is a large community, it is possible that additional
inequality can hurt the entire society. Because most communities draw their beliefs from the
21

belief of the “masses,” the effect of inequality on the masses determines how society as a whole
is affected by inequality:
Theorem 4. Suppose there are k islands of unequal sizes. Assume the largest island, island 1, is
the least privileged. For almost all b, there exists size threshold s such that if s1 > s, the number
of manipulated islands is monotonically increasing in inequality, provided that island 1 remains
the least privileged.
Theorem 4 states that if we are to decrease inequality with a large least privileged island,
manipulation can only decrease. Put more simply, if the masses are the least privileged, then
decreasing inequality helps everyone, including very privileged communities. This is because
these communities still form a sizable number of connection with the large island, just by virtue
of the size disparity, and hence draw a large part of their beliefs from there. Indeed, as inequal-
ity decreases, knowledgeable agents in privileged communities can have their voices amplified
through talking to agents in the large community, who then spread these beliefs over the net-
work (including back to DeGroot agents in the privileged communities). The flip side of this is
that if the masses are the least privileged, increasing inequality helps no one: in fact, moving
resources from the masses to the privileged communities ends up making both the masses and
the privileged communities worse off. Theorem 4 thus establishes that inequality benefits soci-
ety as a whole (in a Pareto sense) if it benefits the large community that wields heavy influence.
Likewise, even the privileged islands should want to move their resources to reduce inequality.
Note the assumption that island 1 is the least privileged (and remains so after decreasing in-
equality) cannot be dispensed with. If island 1 is simply underprivileged, non-monotone com-
parative statics might exist following an increase in inequality. The intuition is as follows. While
this inequality hurts island 1’s access to more privileged communities’ resources, it also exposes
island 1 less to communities which are less affluent than itself and may have more misinformed
beliefs. This effect does not exist, of course, when island 1 starts off as the least well-off commu-
nity.
6.2 Weak Inequality vs Strong Inequality
We introduce a different stochastic-block model where are communities ordered by similarity,
with agents in neighboring communities more likely to be linked than agents in communities
that are farther apart. This model captures the more hierarchical structure that is sometimes
observed in society. While this is a natural homophily model, we are not aware of any literature
that studies it compared to the much stronger focus on weakly-assortative networks that we
22

Figure 7. An illustration of Proposition 1: under weak homophily, a linear number of knowledge-able agents is enough to prevent manipulation anywhere in the network. This could includestacking them all on one island.
studied up to this point in the paper . In this model, each community ` has a vector of qualities,
Λ` ∈ RL. Qualities can capture different variables like education, profession, income, etc. Com-
munities are sorted according to their similarity, with the distance metric between communities
` and `′ given by d(`, `′) = ||Λ` −Λ`′ ||2. For simplicity, we assume that L = 1 (the quality vector is
one-dimensional) and thus communities are (strongly) ordered by their Λ` on a line topology.
In both the weak and strong inequality models, for any two agents on the same island, there
is a link probability ps. In the weak inequality model, there is also a link probability pd < ps
for any two agents on different islands. However, in the strong inequality model, agents do not
form links with agents on islands outside of their neighboring islands. Agents in community `
are linked to agents in community `− 1 or `+ 1 with probability pd, whereas agents in “farther”
communities are linked with probability 0,13 with the exception of island 1 and island k, which
are linked to island 2 and island k − 1 only, respectively.
Section 4 and Section 5 documented the effects of weak inequality on manipulation. To make
the comparison between strong and weak inequality most transparent, we consider worst-case
inequality for weak inequality, i.e., the inequality structure that makes the principal most easily
able to manipulate. Toward this end, the following result establishes a condition on the total
number of knowledgeable agents in the weak homophily model needed for imperviousness, in-
dependent of their placement across communities:
Proposition 1. For any (ps, pd), there exists θ such that if θ < θ, there exists a constant c < 1
13We can equivalently assume that these link probabilities are positive but decay sufficiently quickly, such as onthe order of exp(−||Λ` − Λ`′ ||2). For simplicity of exposition and illustration of the effects of our strong assortativeproperty, we simply set the link probabilities to 0.
23

such that if there are m = cn knowledgeable agents anywhere, then any weak inequality model
(regardless of the number of communities k) is impervious. Moreover, c is increasing in ps and
decreasing in pd.
In other words, there exists a threshold cwhereby if a proportion c of the population is knowl-
edgeable, the principal will be unable to manipulate anyone, regardless of the depth of weak in-
equality present. This includes the most extreme inequality configuration where all the knowl-
edgeable agents are on one island, and the rest of the k − 1 islands are all DeGroot (for any k). A
visual depiction of Proposition 1 is given in Figure 7. The assumption that θ is not too large en-
sures that agents use social learning as a primary means of learning; clearly when θ is too close
to 1, the presence of knowledgeable agents is irrelevant because agents place too much weight
on their own (manipulated) news.
Proposition 1 also sheds some light on whether homophily helps or hurts the worst-case
lower bound. Because m is increasing in ps and decreasing in pd, we see the number of knowl-
edgeable agents needed to apply Proposition 1 increases as we increase inequality through the
network homophily structure. This result reinforces the general idea that increasing inequality
makes it more challenging for society to avoid manipulation, despite the exceptions presented
earlier. The intuition is clear: as homophily becomes more severe, configurations like that of
Figure 7 do little to help communities with few to no knowledgeable agents.
For illustration, we assume that the first community has m knowledgeable agents and all
other communities consist of DeGroot agents. At the end of this section, we discuss the robust-
ness of the result to other configurations. There are k communities which may or may not be the
same size and we fix (ps, pd). In the strong inequality model we obtain a much different result
from Proposition 1:
Proposition 2. For any θ > 0 and c < 1, there exist k (independent of k) and ε > 0 where all
communities except k are manipulated, even with cn knowledgeable agents.
Proposition 2 shows the stark difference between weak and strong inequality. First, with
weak inequality, we can always find a proportion c such that cn knowledgeable agents will make
the network impervious, even with rampant (weak) inequality. On the other hand, we can never
find such a proportion c in the strong inequality model: no constant fraction guarantees society
is safe from manipulation because the influence of knowledgeable agents is too diluted under
strong homophily, as seen in Figure 8. Second, the strong inequality network is not only suscep-
tible, but manipulation is actually ubiquitous in society. Note that k does not depend on k, so
when there are several communities, only a vanishing fraction of them will not be manipulated.
24
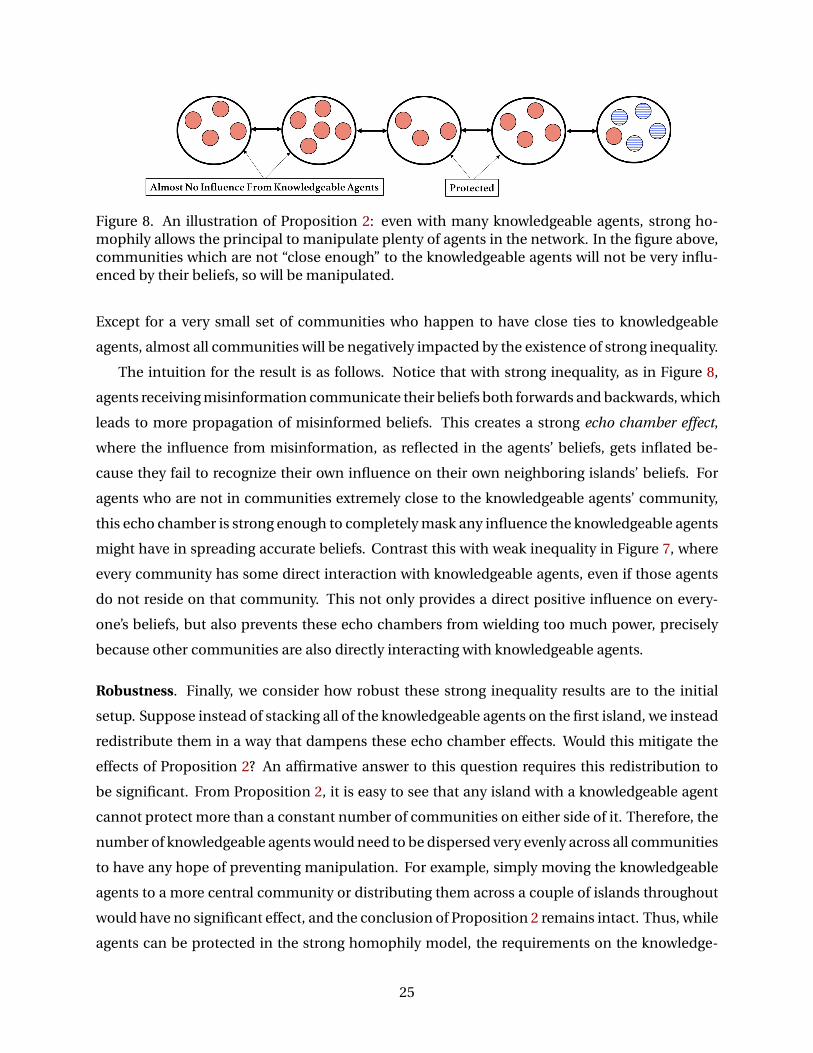
Figure 8. An illustration of Proposition 2: even with many knowledgeable agents, strong ho-mophily allows the principal to manipulate plenty of agents in the network. In the figure above,communities which are not “close enough” to the knowledgeable agents will not be very influ-enced by their beliefs, so will be manipulated.
Except for a very small set of communities who happen to have close ties to knowledgeable
agents, almost all communities will be negatively impacted by the existence of strong inequality.
The intuition for the result is as follows. Notice that with strong inequality, as in Figure 8,
agents receiving misinformation communicate their beliefs both forwards and backwards, which
leads to more propagation of misinformed beliefs. This creates a strong echo chamber effect,
where the influence from misinformation, as reflected in the agents’ beliefs, gets inflated be-
cause they fail to recognize their own influence on their own neighboring islands’ beliefs. For
agents who are not in communities extremely close to the knowledgeable agents’ community,
this echo chamber is strong enough to completely mask any influence the knowledgeable agents
might have in spreading accurate beliefs. Contrast this with weak inequality in Figure 7, where
every community has some direct interaction with knowledgeable agents, even if those agents
do not reside on that community. This not only provides a direct positive influence on every-
one’s beliefs, but also prevents these echo chambers from wielding too much power, precisely
because other communities are also directly interacting with knowledgeable agents.
Robustness. Finally, we consider how robust these strong inequality results are to the initial
setup. Suppose instead of stacking all of the knowledgeable agents on the first island, we instead
redistribute them in a way that dampens these echo chamber effects. Would this mitigate the
effects of Proposition 2? An affirmative answer to this question requires this redistribution to
be significant. From Proposition 2, it is easy to see that any island with a knowledgeable agent
cannot protect more than a constant number of communities on either side of it. Therefore, the
number of knowledgeable agents would need to be dispersed very evenly across all communities
to have any hope of preventing manipulation. For example, simply moving the knowledgeable
agents to a more central community or distributing them across a couple of islands throughout
would have no significant effect, and the conclusion of Proposition 2 remains intact. Thus, while
agents can be protected in the strong homophily model, the requirements on the knowledge-
25

able agents distribution are much stricter: nearly every island has to have some knowledgeable
agents of its own, which requires drastically less inequality.
Second, Mostagir et al. (2021) show that higher density, while not a perfect measure, is of-
ten related to lower manipulation (for instance, see Theorem 4 in Mostagir et al. (2021)). It is
clear that the average degree with strong inequality will be lower than that of weak inequality,
so a natural question is to wonder whether this difference in density is what drives the differ-
ence in manipulation we observe between the two models. For concreteness, assume we have
k communities of the same size in both the strong (with ps, pd) and weak inequality (with p′s, p′d)
models. In the strong inequality model, we take ps = αp′s and pd = αp′d, where α = ps+(k−1)pdps+2pd
.14
This equalizes the average degree (i.e., connections) of the strong and weak inequality models,
but has no effect on any of the beliefs of the agents (or on their DeGroot centralities).15 There-
fore, we see that the differences in density alone cannot explain the differences seen across the
two models.
7 Optimal Interventions
We now discuss the role that a social planner has in combating misinformation. We consider
two possible interventions: educational interventions and homophily interventions. In the for-
mer, we assume the planner may improve the sophistication type of a subset of agents, perhaps
through targeted education. In the latter, the planner may decrease the extent of homophily
through efforts to integrate communities (i.e. by increasing pd). The social planner wants to
enact a policy that protects as many agents as possible from manipulation.
We say a policy is optimal if it minimizes the number of manipulated agents. Similarly, we
say some policy X dominates another policy Y if all agents’ beliefs of the correct state are higher
under X than under Y. While an optimal policy is never dominated, there may be non-optimal
policies that are not dominated, and thus lie at the Pareto frontier of effective interventions.
We can write the beliefs of the agents, π, as:
π(ps, pd,m,x) =
(I
1− θ−B(ps, pd,m,x)
)−1
a
where B is a function of (i) the homophily structure (ps, pd), (ii) the distribution m of knowl-
edgeable agents across islands m, and (iii) the principal’s strategy x. Recall that the belief (of
14For this, we have to naturally assume p′s and p′d are not too large so that pd < ps < 1 and this is possible. Otherwise,there is no way to equalize the average degrees of the two models.
15Technically, this equalizes the average degree for only the islands in the “middle” of the line, but not those on theends. However, assuming there are a large number of communities, this difference will be negligible.
26

the correct state) threshold is given by 1+b2 and the principal wants to maximize the number of
agents whose beliefs fall below this threshold, less the total cost of manipulation, so as before,
the principal solves:
x∗(ps, pd,m) = arg maxx
n∑i=1
(1πi(ps,pd,m,x)<(1+b)/2 − εxi
)Then the planner solves the min-max optimization problem:
minn∑i=1
1πi(ps,pd,m,x∗(ps,pd,m))<(1+b)/2
The combinatorial nature of these problems preclude a general solution. We derive the opti-
mal policies for some special cases and show the nuances of optimal policies via simulation.
For a number of cases, we prove the optimal policy attempts to minimize inequality. However,
this is not always true: if the planner cannot completely eradicate inequality, then sometimes
measures that only slightly reduce it can be counterproductive.
7.1 Educational Interventions
We consider the possibility of endowing some agents in the population with verifiable knowl-
edge about the true state. We assume that this process is costly and that the planner’s budget
constraint is of the form∑n
i=1 1type(i)=K ≤ M , where K designates a knowledgeable agent and
M is an integer. Note that the planner will always use the entire budget in an optimal policy.
Intervention with Large Budget and Cheap Signals. First, we derive the optimal policy when
the planner’s budget is sufficiently large and the principal’s cost of sending signals is nearly free:
Corollary 1. Suppose that the budget M is large enough so that it is possible for the planner to
make the network impervious when ε is small. Then if all islands are the same size, the optimal
policy is to minimize inequality.
This result is in-line with the conclusion of Theorem 1, which argues that when impervious-
ness is possible, the least inequality is always first-best. As a special case, if M is big enough to
make the knowledgeable agents equal on every island, then this is the optimal policy.
Note the assumption that M is big enough that imperviousness is attainable for small ε is
necessary. First, if imperviousness is attainable only for a given ε � 0, then it is possible that
a configuration with some inequality may be optimal, as we show next. This is a direct conse-
quence of Theorem 3. Second, if M is small and so imperviousness is impossible, then an opti-
27
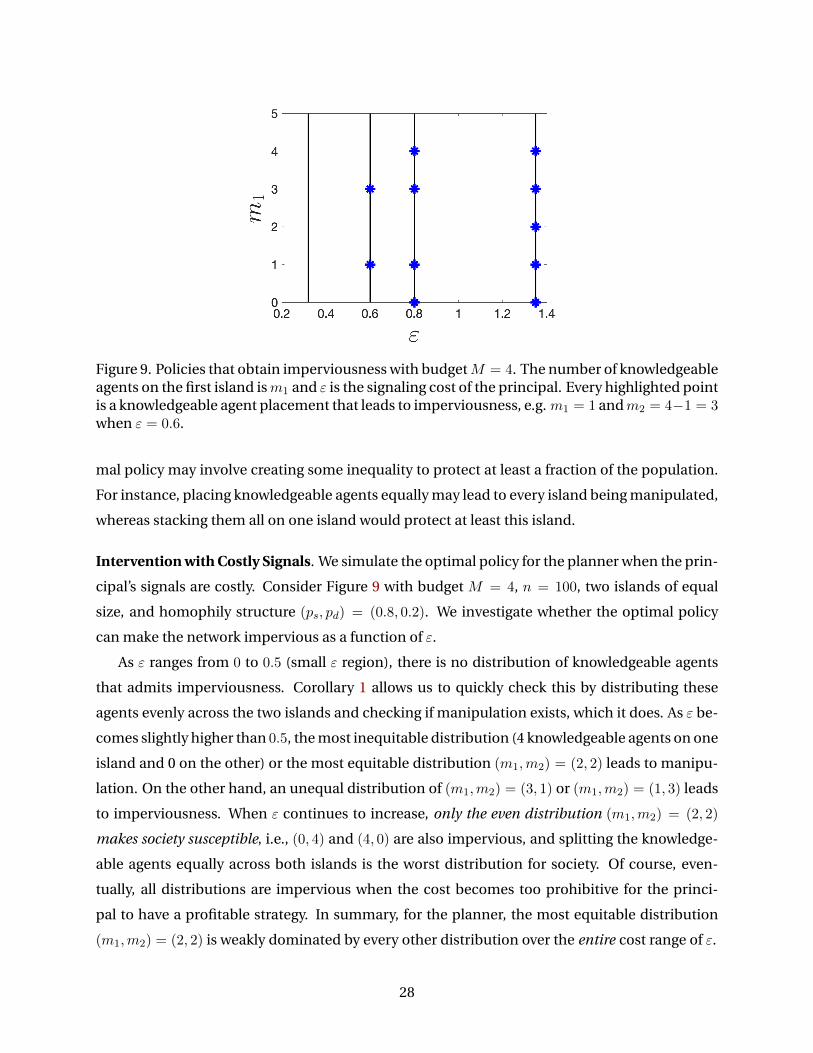
Figure 9. Policies that obtain imperviousness with budgetM = 4. The number of knowledgeableagents on the first island ism1 and ε is the signaling cost of the principal. Every highlighted pointis a knowledgeable agent placement that leads to imperviousness, e.g. m1 = 1 andm2 = 4−1 = 3when ε = 0.6.
mal policy may involve creating some inequality to protect at least a fraction of the population.
For instance, placing knowledgeable agents equally may lead to every island being manipulated,
whereas stacking them all on one island would protect at least this island.
Intervention with Costly Signals. We simulate the optimal policy for the planner when the prin-
cipal’s signals are costly. Consider Figure 9 with budget M = 4, n = 100, two islands of equal
size, and homophily structure (ps, pd) = (0.8, 0.2). We investigate whether the optimal policy
can make the network impervious as a function of ε.
As ε ranges from 0 to 0.5 (small ε region), there is no distribution of knowledgeable agents
that admits imperviousness. Corollary 1 allows us to quickly check this by distributing these
agents evenly across the two islands and checking if manipulation exists, which it does. As ε be-
comes slightly higher than 0.5, the most inequitable distribution (4 knowledgeable agents on one
island and 0 on the other) or the most equitable distribution (m1,m2) = (2, 2) leads to manipu-
lation. On the other hand, an unequal distribution of (m1,m2) = (3, 1) or (m1,m2) = (1, 3) leads
to imperviousness. When ε continues to increase, only the even distribution (m1,m2) = (2, 2)
makes society susceptible, i.e., (0, 4) and (4, 0) are also impervious, and splitting the knowledge-
able agents equally across both islands is the worst distribution for society. Of course, even-
tually, all distributions are impervious when the cost becomes too prohibitive for the princi-
pal to have a profitable strategy. In summary, for the planner, the most equitable distribution
(m1,m2) = (2, 2) is weakly dominated by every other distribution over the entire cost range of ε.
28
Therefore, in the case of costly signals for the principal, the planner may want to introduce
some inequality in the knowledgeable agents distribution. This is precisely to generate the pro-
tection contagion effect documented in Theorem 3.
Intervention with One Large Island. We next consider a setting where there is one large island
and many small islands; without loss, let the large island be island 1:
Corollary 2. When ε is small, there exists s such that if s1 > s, any policy that makes island 1 the
least privileged is dominated by a policy with more knowledgeable agents on this island, provided
that such a policy does not already use the entire budget on island 1.
Corollary 2 complements Theorem 4: when there is a single large island, a policy which sub-
jects the masses (on the large island) to inequality is not only sub-optimal, it actually hurts all
agents in society. In particular, if we start with a configuration of many small privileged com-
munities and one large under-privileged community, then even the privileged communities
are negatively impacted by taking resources (knowledgeable agents) from the under-privileged
community. Therefore, the social planner and those agents in privileged communities should
(rationally) support expending more resources on the least privileged community.
7.2 Homophily Interventions
We now consider a fixed homophily model with parameters (ps, pod) and knowledgeable agents
distributionm. We assume the social planner pays a positive, convex costφ(pd−pod) withφ(0) = 0
to increase (or decrease) connections between islands. As before, we assume the planner has a
budget to spend; that is, the planner must satisfy φ(pd − pod) ≤ Budget.
For the remainder of this section, we focus on the case where the principal’s signaling cost ε
is small. Similar conclusions to the previous section apply when ε � 0. Our first result shows
that an equally-distributed knowledgeable agents policy eliminates the need for a homophily
intervention:
Proposition 3. If knowledgeable agents are equally distributed (i.e., m` = Ms` for all `), then
pd = pod is an optimal policy.
When knowledgeable agents are distributed proportional to the islands’ populations, the be-
liefs of all agents in society are the same regardless of the homophily parameters. Therefore, no
additional intervention is necessary because access to knowledgeable agents is perfectly equi-
table.
29

Large Budget. We first focus on the case where the planner’s homophily budget is fairly large.
Based on our observations in Theorem 1 and Theorem 2 we have:
Proposition 4. Suppose the budget is greater than φ(ps − pod) and large enough to make the net-
work impervious. Then if all islands have the same size, pd = ps is the optimal policy when ε is
sufficiently small.
When homophily can be fully corrected, some intervention is desirable. By Theorem 2, we
know that if the budget is big enough for the planner to implement pd = ps, this obtains the
first-best outcome. Thus, the optimal policy is always to completely eliminate any homophily
that exists in the network.
Small Budget. When the planner’s budget is limited, implementing pd = ps may not be feasible.
In this case, it may not be optimal to simply reduce inequality by minimizing (ps − pd); as we
saw in Theorem 2, often some inequality can be worse than extreme inequality. In other words,
a planner who simply helps decrease inequality without eradicating it completely can do un-
intended harm. In fact, unlike educational interventions, the planner may not want to use the
entire budget.
We simulate the optimal pd with three islands of equal size, n = 999, which have 100, 60, and
10 knowledgeable agents, respectively. We assume the cost function φ(α) = 10α2, pod = 0, and
ps = 0.8. Note the principal can set pd ≤√Budget/10 < 0.8 provided that the budget is at most
5. As in Proposition 3, we assume the cost of the principal’s signaling technology is small, i.e.,
ε ≈ 0.
In Figure 10, we show both the optimal homophily (pd) choice of the planner and the maxi-
mum pd attainable by the budget. We see that when the budget is small, the planner prefers to
leave relatively extreme homophily in society as opposed to making the more substantial cor-
rection allowed by the budget. Once the budget exceeds a threshold (around 1.3 in the figure),
however, the planner uses all of it up to remove as much homophily from the network as possi-
ble. Thus, a planner tasked with stopping misinformation through reducing inequality should
always ask for a budget allocation that is at least equal to that threshold, in order to guarantee
that this reduction will indeed achieve the desired effect and be beneficial to society.
8 Conclusion
This paper analyzes the role of inequality in social learning when the information that agents
receive is a mixture of organic news and news originating from a strategic actor. This setup re-
30

Figure 10. Optimal (Simulated) pd with limited budget. The dotted curve is the level of ho-mophily achieved by spending the entire budget available, whereas the solid curve is the op-timal level of homophily given that budget. A planner should always ask for a minimum budget(around 1.3 in the figure) allocation that makes these two curves coincide.
sembles many scenarios where an information provider may have their own agenda and exerts
costly effort to influence agents to take certain actions. Inequality in society results from the
distribution of knowledgeable agents who know the true state of the world. Privileged com-
munities have a higher proportion of these agents, and the homophily structure of the network
determines access to these agents across communities.
We show that the role that inequality plays in the spread of misinformation is shaped by
relative community privilege, relative community sizes, and the cost of the principal’s signaling
technology. This leads to a range of outcomes depending on how these factors interact. For
example, when the privileged communities are small in size compared to the population at large,
as is often the case, then an increase in inequality not only makes the large population worse off,
but it also makes the privileged communities themselves more prone to misinformation, thus
it is in the privileged communities’ best interest to encourage allocating resources to the larger
community. Generally, the spread of misinformation in not monotone in the level of inequality
in the network. Even more so, intermediate levels of inequality can be worst for society when
the signaling costs of the principal is low, but can be best for society when the principal’s costs
are high.
In a similar vein, policies that counteract manipulation depend on the principal’s signaling
costs as well as the social planner’s budget. When signaling costs are low, so that the princi-
pal can target everyone, then the planner’s optimal policies with a large budget involve erad-
31

icating inequality through an equitable placement of knowledgeable agents and/or removing
homophily from the network. When signaling costs are no longer trivial, the planner needs to
be more careful, as inequality extremes might be worse for society than intermediate inequal-
ity regimes. This is a consequence of a protection contagion phenomenon that precludes the
principal from having a profitable manipulation strategy. Generally, the complexity of comput-
ing these optimal strategies provides a wealth of interesting algorithmic challenges that can be
explored further and constitute a promising area for future work.
Finally, our model provides a basic framework to analyze the phenomena described in the
paper in terms of the primitives of the problem represented by the inequality structure, the plan-
ner’s budget, and the strategic injection of misinformation. Given the salience of these points
in modern social learning environments, the model provides a step towards understanding the
complex interactions of these factors, and offers guidelines that can help inform policies that
aim to reduce inequality and protect society from misinformation.
32

Appendix
A Technical Conditions and Model Details
Appendix A.1 provides more technical details about the deterministic model in Mostagir et al.(2021), while Appendix A.2 shows how to adapt that model to random networks with differentcommunities and different levels of access to resources. Finally, Appendix A.3 demonstrates themain methods used in the proofs of this paper.
A.1 News Generation and Belief Evolution
The following model details are from Mostagir et al. (2021) and are presented here for contextu-alization of Section 2.
(a) Organic News: We assume agents receive organic information about the state y over time.News is generated according to a Poisson process with unknown parameter λi > 0 for eachagent i; for simplicity, assume λi has atomless support over (λ,∞) and λ > 0. Let us denoteby (t
(i)1 , t
(i)2 , . . .) the times at which news occurs for agent i. For all τ ∈ {1, 2, . . .}, the organic
news for agent i generates a signal st(i)τ∈ {S,R} according to the distribution:
P(st(i)τ
= S∣∣∣y = S
)= P
(st(i)τ
= R∣∣∣y = R
)= pi ∈ [1/2, 1)
i.e., the signal is correlated with the underlying truth.
(b) News from Principal: In addition to the organic news process, there is a principal who mayalso generate news of his own. At t = 0, the principal picks an influence state y ∈ {S,R}. Theprincipal then picks an influence strategy xi ∈ {0, 1} for each agent i in the network. If theprincipal chooses xi = 1, for any agent i, then he (the principal) generates news accordingto an independent Poisson process with (possibly strategically chosen) intensity λ∗i which isreceived by all agents where xi = 1. We assume the principal commits to sending signals atthis intensity, which may not exceed some threshold λ.
(c) News Observations: Agents are unable to distinguish news sent by the principal or that or-ganically generated. We denote by t(i)1 , t
(i)2 , . . . the arrival of all news, either from organic
sources or from the principal, for agent i. At each time t(i)τ , if the news is organic, the agentgets a signal according to the above distribution, whereas if the news is sent from the princi-pal, she gets a signal of y.
(d) DeGroot Update: DeGroots use a simple learning heuristic to update beliefs about the un-derlying state from other agents. We assume every DeGroot agent believes signals arrive ac-
cording to a Poisson process and all signals are independent over time with P(si,t
(i)τ
= y)
=
pi (i.e., takes the news at face value). DeGroot agents form their opinions about the state boththrough their own experience (i.e., the signals they receive) and the beliefs of their neighbors.Given history hi,t = (s
i,t(i)1
, si,t
(i)2
, . . . , si,t
(i)τi
) up until time t with τi = max{τ : t(i)τ ≤ t}, each
agent forms a personal belief about the state according to Bayes’ rule. Let zSi,t and zRi,t denotethe number of S andR signals, respectively, that agent i received by time t; then the DeGroot
33

agent has a direct “personal experience”:
BU(S|hi,t) =pzSi,ti (1− pi)z
Ri,tq
pzSi,ti (1− pi)z
Ri,tq + p
zRi,ti (1− pi)z
Si,t(1− q)
As mentioned in Section 2, each DeGroot i then updates her belief for all k∆ < t ≤ (k + 1)∆according to:
πi,t = θiBU(hi,t) +n∑i=1
αijπj,k∆
for some weights θi, αij with θi+∑n
j=1 αij = 1, and ∆ is a time period of short length. Note for
simplicity in this paper we assume θi = θ for all DeGroots i and αij = 1−θ|N(i)| for all j ∈ N(i).
(e) DeGroot Centrality Vector: To figure out the limit beliefs of the DeGroot agents when theprincipal targets everyone who is not a knowledgeable agent, denote by γ the vector in{0, 1}n that designates which agents are targeted by the principal and let γi = xi = 1 wher-ever agent i is DeGroot and γi = 0 everywhere else. DeGroot centrality, which is equivalent tothe belief in the incorrect state in the limit is then given byD(γ) = (I−W)−1γ =
∑∞k=0 W
kγ,where I is the identity and W is the adjacency matrix of weights given in Mostagir et al.(2021). DeGroot agent i is manipulated if her belief in the false state is above the cutoff, i.e. ifDi(γ) > (1− b)/2. More detailed methods on the computation of DeGroot centrality is givenin A.3.
A.2 Model Adaptation to Stochastic-Block Networks
Using the proof technique in Mostagir and Siderius (2021a), the following result establishes thatas long as the population is large enough, it is sufficient to analyze the deterministic analoguesof the random networks introduced in Section 2:
Theorem 5. For almost all b,16 as n → ∞, the probability that a random network drawn fromthe weak or strong inequality models has the same number of manipulated agents as the expectednetwork converges to 1.17
Theorem 5 offers a technical simplification: instead of analyzing the random networks drawnaccording to the weak and strong homophily models, we can treat these networks as determin-istic objects where the weights are chosen proportionally to the probability of link formation.Moreover, because all of our results are invariant to a doubling of the population as long as theproportion of knowledgeable and DeGroot agents remains constant on every island, every ex-ample can be extended to the case of n→∞ and Theorem 5 can be applied.
In the original model of Mostagir et al. (2021), the authors derived results for arbitrary (butdeterministic) network structures, where the principal must make (essentially) a binary deci-sion for each agent whether to send her misinformed signals. In this paper, we instead adaptthis model for random social networks which embed a notion of inequality in the form of un-equal access to educational resources. At the core of the random network process are “islands”(or communities) where agents within an island have similar resources, but can have different
16Recall that b is the parameter in Table 1. “Almost all” is meant in the measure theoretic sense; the only exceptionslie on a set of measure 0 in (−1, 1).
17The formal definitions of realized and expected networks can be found in Mostagir and Siderius (2021a)
34

resources from agents on different islands. Thus, the principal’s optimal strategy instead is moresubtle: he can target a fraction of the population on a given island (a rational number between 0and 1). Because of symmetry, the principal does not care which agents on the island he actuallytargets, just the total percentage. Recall agents put θ weight on their own personal experience.This implies that, in the standard model, there will be two belief types within a given island,depending on whether the principal targets the agent directly or not.
To avoid this, and to add parsimony to the model, we assume agents will perform the personal-experience Bayesian update using the “average” news sent to the island. In particular, if theprincipal targets κ` fraction of the population on an island, the Bayesian update part of the be-lief update converges to 1− κ` as T →∞. This implies that all agents’ beliefs on the same islandwill be the same, and allows us to study manipulation in the context of how certain communitiesare affected versus others.
Note this adaptation does not change much from the standard model. For instance, if θ isnot too large (and agents rely significantly on social learning), then the differences in beliefs oftwo agents on the same island will be small in the standard setup. Thus, our results generalizeeasily to the case of the standard model as well, where agents are treated as individual binarydecisions for the principal.
Finally, we note that all results implicitly assume that n→∞, because only under these con-ditions does Theorem 5 equate the manipulation in random networks with that of their expectedcounterparts. Thus, while knowledgeable agent counts are technically discrete objects, becauseall of our results are closed under multiplication of the knowledgeable and DeGroot populationson each island by the same constant, we can think of “knowledgeable proportions” on each is-land and need not worry about whether such proportions divide the population size withoutremainder.
A.3 DeGroot Centrality: General Methods
Note that given a fixed strategy for the principal, the beliefs of (DeGroot) agents within a givenisland are the same due to symmetry as n→∞.18 Here, we will introduce the general methodol-ogy for determining whether a population (or community) whose structure is randomly drawnfrom either the strong or weak homophily model is susceptible to manipulation. Let us definesome notation:
(i) κ` is the fraction of island ` targeted by the principal (note that who he specifically targetson the island is immaterial);
(ii) N` is the “neighborhood” of island `; in the weak homophily model it is equal to {`′|`′ 6= `}whereas in the strong homophily model it is equal to:
{2}, if ` = 1
{`− 1, `+ 1}, if ` ∈ {2, . . . , k − 1}{`− 1}, if ` = k
One can compute DeGroot centralities by simply counting the weighted walks to misin-formed agents, as in Figure 11. However, DeGroot centrality computations are easiest whenconsidering the linear recursive formulation of weighted walks, as in Figure 12.
18See Appendix A.2.
35

Figure 11. An illustration of computing weighted walks to knowledgeable agents. Solid circlesare DeGroot agents and shaded circles are knowledgeable agents. Solid lines represent higherweights “within-community links” than dashed lines. Consider the top-left agent, and for eachwalk, multiply the weights of the links along the walk. The figure on the left shows a first-orderwalk, i.e. a walk of length 1, which consists of the link directly connecting that agent to a knowl-edgeable agent. The second-order walk displayed on the right consists of walks of length 2, sothat there is a link to another DeGroot agent who is linked to a knowledgeable agent, and theweight of that walk is the product of the two link weights and so on. Total weighted walks is thesum over all orders (i.e., walk lengths) of walks 1, 2, . . ..
This calculation is done in two parts. The first part involves computing weighted walks toknowledgeable agents from agent i living on some island `, which we denote as wK` . The secondpart involves computing weighted walks to DeGroots who do not directly consume misinforma-tion from the principal, which we denote as wD` . The belief of the agent on island ` is then givenby w` = wK` + wD` .
We can calculate this explicitly as:
wK`1− θ
=psm` +
∑`′∈N` pdm`′
pss`n+∑
`′∈N` pds`′n+(1−θ) ps(s`n−m`)
pss`n+∑
`′∈N` pds`′nwK` +(1−θ)
∑`′∈N` pd(s`′n−m`′)
pss`n+∑
`′∈N` pds`′nwK`′
Similarly, we have:
wD`1− θ
= θ1− κ`1− θ
+ θps(1− κ`)(s`n−m`) +
∑`′∈N` pd(1− κ`′)(s`′n−m`′)
pss`n+∑
`′∈N` pds`′n
+(1− θ) ps(1− κ`)(s`n−m`)
pss`n+∑
`′∈N` pds`′nwD` + (1− θ)
∑`′∈N` pd(1− κ`′)(s`′n−m`′)
pss`n+∑
`′∈N` pds`′nwD`′
In particular, beliefwK` andwD` both admit linear matrix equations with a closed-form solutions:
IwK
1− θ= aK +BKw =⇒ wK =
(I
1− θ−BK
)−1
aK
IwD
1− θ= aD +BDw =⇒ wD =
(I
1− θ−BD
)−1
aD
where the total belief of the correct state is w` = wK` + wD` , which is the complement of agent i
36

Figure 12. An analytic approach to computing walks for the top-left agent (which equals herbelief of the true state). Each agent’s sum of walks equals a weighted-average of her neighbors’sums of walks.
on island `’s DeGroot centrality (i.e.,D` = 1− w`).
B Proofs
Preliminaries The following notation is used throughout the proofs. The vector γ ∈ {0, 1}ndenotes which agents are targeted by the principal, and the DeGroot Centrality vector resultingfrom this targeting is denoted by D(γ). DeGroot agent on island ` is manipulated if D`(γ) >(1− b)/2. Equivalently, we write π` or w` as the belief of an agent on island ` (the latter explicitlyreferring to walk counting, but is equivalent to π`).
B.1 Section 2
Proof of Theorem 5. The proof uses results from Mostagir and Siderius (2021a). The main resultof that paper shows that one can focus on expected instead of random networks if three assump-tions are satisfied. Assumption 1 from the Mostagir and Siderius (2021a) holds because our net-works are drawn from an inhomogeneous Erdos-Renyi model. Assumption 2 from that paperis also satisfied because θ is constant and the homophily models are connected almost surely.Similarly, the expected degrees and normal society conditions are satisfied because for the former,the expected degrees grow linearly in n for both the weak and strong inequality models, and forthe latter, θ is the same for all agents. Therefore, we can apply Theorem 1 from the note for DeG-
root centrality on an arbitrary targeting vector γ, i.e., limn→∞ P[||D(n)(γ)− D(n)(γ)||∞ > ε
]= 0.
Thus, as n→∞:
limn→∞
(P[D(n)i < (1− b)/2 < D(n)
i for some i]
+ P[D(n)i < (1− b)/2 < D(n)
i for some i])
= 0
except for countably many b. Thus, for generic b, the number of manipulated agents is the sameunder both the expected and realized networks in the weak and strong inequality models, asn→∞.
37

B.2 Section 4
Proof of Theorem 1. Notice the network is susceptible to manipulation (with high probability) ifthere exists an agent j with Dj(1D) > (1 − b)/2; similarly, the network is impervious to manip-ulation (with high probability) if for all agents j, Dj(1D) < (1 − b)/2. We show that increasinghomophily leads to an increase in the inequality of DeGroot centralities (i.e., D(1D)). We havethe system of equations:
1
1− θw =
k
n(ps + (k − 1)pd)
psm1 + pd
∑`6=1m`
psm2 + pd∑
`6=2m`
· · ·psmk + pd
∑`6=km`
+k(1− θ)
n(ps + (k − 1)pd)
ps(n/k −m1) pd(n/k −m2) · · · pd(n/k −mk)pd(n/k −m1) ps(n/k −m2) · · · pd(n/k −mk)
· · · · · · · · · · · ·pd(n/k −m1) pd(n/k −m2) · · · ps(n/k −mk)
w
which is equivalent to:
k
(1− θ)n(ps + (k − 1)pd)w =
psm1 + pd
∑` 6=1m`
psm2 + pd∑
` 6=2m`
· · ·psmk + pd
∑` 6=km`
+ (1− θ)
ps(n/k −m1) pd(n/k −m2) · · · pd(n/k −mk)pd(n/k −m1) ps(n/k −m2) · · · pd(n/k −mk)
· · · · · · · · · · · ·pd(n/k −m1) pd(n/k −m2) · · · ps(n/k −mk)
w
Without loss of generality suppose that island k has the least number of knowledgeable agentsof any island. Consider the map T given by:
T : w 7→
psm1 + pd
∑` 6=1m`
psm2 + pd∑
` 6=2m`
· · ·psmk + pd
∑` 6=km`
+(1−θ)
ps(n/k −m1) pd(n/k −m2) · · · pd(n/k −mk)pd(n/k −m1) ps(n/k −m2) · · · pd(n/k −mk)
· · · · · · · · · · · ·pd(n/k −m1) pd(n/k −m2) · · · ps(n/k −mk)
w
We claim that T has the property that (w` ≥ wk) =⇒ T (w`) ≥ T (wk). Suppose that w` ≥ wk,then:
m` + (1− θ)w`(n/k −m`) ≥ mk + (1− θ)w`(n/k −mk)
≥ mk + (1− θ)wk(n/k −mk)
which moreover implies that
ps(m` + (1− θ)w`(n/k −m`)) + pd(mk + (1− θ)wk(n/k −mk)) +∑`′ 6=`,k
pd(m`′ + (1− θ)w`′(n/k −m`′))
≥ pd(m` + (1− θ)w`(n/k −m`)) + ps(mk + (1− θ)wk(n/k −mk)) +∑`′ 6=`,k
pd(m`′ + (1− θ)w`′(n/k −m`′))
38

because ps > pd. Because ps, pd, n are fixed, this suggests the map k(1−θ)n(ps+(k−1)pd) · T also has
this property, so any fixed point of T must have w` ≥ wk by Brouwer’s fixed point theorem for allislands `. Since the system is linear and non-singular, there is a unique fixed-point withw` ≥ wk.This implies the DeGroot centrality of the island with the least knowledgeable agents is alwaysmaximal and determines whether the network is impervious.
For the remainder of this part of the proof, we define a new operator T which maps w,parametrized by ps, pd, and m, respectively. We show the following: (i) T |ps is decreasing inps for wk, (ii) T |pd is increasing in pd for wk, and (iii) T |m subject to
∑m` = m is increasing
with every “Robin Hood” operation that puts more knowledgeable agents on island k for wk.19
This result suffices in order to show that there exists a fixed-point of T which obeys the desiredproperties of Theorem 1 (by Brouwer20), and by linearity, this fixed-point is unique.
1. Decreasing in ps: Let us define T as:
T |ps : w 7→ 1
ps + pd
[psm1 + pd
∑`6=1m`
psm2 + pd∑
`6=2m`
· · ·psmk + pd
∑`6=km`
+ (1− θ)
ps(n/k −m1) pd(n/k −m2) · · · pd(n/k −mk)pd(n/k −m1) ps(n/k −m2) · · · pd(n/k −mk)
· · · · · · · · · · · ·pd(n/k −m1) pd(n/k −m2) · · · ps(n/k −mk)
w]
Computing directly:
∂T (wk|ps)∂ps
= pd(mk + (1− θ)(n/k −mk)wk)−
∑` 6=k (m` + (1− θ)(n/k −m`)w`)
(ps + pd)2< 0
where the inequalities follow from the analysis above.
2. Increasing pd: Let us define T in the same way as in (1), except parametrized by pd. Then inexactly the same way:
∂T (wk|pd)∂pd
= −pspd
∂T (wk|ps)∂ps
> 0
which is the desired result.
3. Majorization: Assume that we remove a knowledgeable agent from island `∗ and add itto island k, with the assumption that mk + 1 ≤ m`∗ − 1. There are two cases: (i) islandk still has the fewest knowledgeable agents (and thus the greatest DeGroot centrality), or(ii) some other island had the exact same number of knowledgeable agents as island k.In the latter case, the majorization does not affect whether the network is impervious or
19Note that other “Robin Hood” operations do not affect wk, so does not affect the imperviousness of the network.20In particular, let (w1, w2) be the old fixed-point and (w′1, w
′2) the new fixed point. We illustrate for the case of
increasing ps: all other cases are similar. By increasing ps, we know that T maps all w1 larger and all w2 smaller.Therefore, the convex compact set [w1, 1]× [0, w2] maps into itself, which implies the new fixed-point (w′1, w
′2) lies in
this set.
39

susceptible. In the former case, define T as:
T |m : w 7→[
psm1 + pd∑
` 6=1m`
psm2 + pd∑
` 6=2m`
· · ·psmk + pd
∑` 6=km`
+ (1− θ)
ps(n/k −m1) pd(n/k −m2) · · · pd(n/k −mk)pd(n/k −m1) ps(n/k −m2) · · · pd(n/k −mk)
· · · · · · · · · · · ·pd(n/k −m1) pd(n/k −m2) · · · ps(n/k −mk)
w]
Computing the directional derivative along the gradient u = ek−e`∗ (where ei is the vectorof all 0’s except for a 1 in ith spot):
∂T (wk)|m∂mk
− ∂T (wk)|m∂m`∗
= pd (1− (1− θ)wk)− ps (1− (1− θ)w`∗)
Note that because wk ≤ w`∗ , (1− (1− θ)wk) ≥ (1− (1− θ)w`∗). Because ps > pd, the aboveexpression is positive.
Lastly, we need to argue that in the case of islands of equal size, increased DeGroot centralityinequality (i.e., the island with larger centrality increases its centrality while the other’s centralitydecreases) cannot make the network go from susceptible to impervious. To check if the networkis impervious, all that needs to be checked is maxiDi(1D) > (1−b)/2. When inequality of the De-Groot centrality increases, then maxiDi(1D) increases, and so the above inequality is more likelyto be satisfied when inequality is increased. Therefore, the network can go from impervious tosusceptible, but not the other direction.
Proof of Theorem 2. Part (i) is a direct implication of Theorem 1: it is impossible for an increase ininequality to make the network switch from susceptible to impervious. Thus, if some inequalityconfiguration makes the network impervious, it must necessarily be the case that the networkwith the least inequality is impervious.
For parts (ii) and (iii), consider the following construction of the inequality structures. If forall choices of (m, pd) the DeGroot centralities of all of the islands are monotone in ps (eithermonotonically increasing or decreasing) then choose ps sufficiently close to 1 such that manip-ulation is the same under this inequality structure and ps = 1 (i.e., extreme homophily). Sucha ps < 1 is guaranteed because centralities are continuous in the inequality parameters. Other-wise, there exists (m, pd) such that at least one island has non-monotone centrality in ps. First,note that all centralities are concave in ps; this can be seen from considering the map in the proofof Theorem 1 for ps and noting that:
∂2T (w`|ps)∂p2
s
=
m` + (1− θ)(n/k −m`)w` −∑`6=k
(m` + (1− θ)(n/k −m`)w`)
· p2s − p2
d
(ps + pd)4> 0
because both terms in the above expression are positive. (Recall that w` is equal to 1 minus cen-trality, so convexity ofw` corresponds to concavity of centrality.) Second, note that the centralitycurve of an island with more knowledgeable agents always lies above an island with fewer (thiswas shown in Theorem 1). Suppose some island that exhibits the non-monotonicity of centralityin ps; if there are multiple, pick the island whose centrality apex occurs at the largest value for ps
40

(call this is the “special” island); call this value p∗s. If we choose b so that (1− b)/2 lies just belowthe apex of the centrality curve, then this island will be manipulated for p∗s, but not at ps = 1because the centrality curve for the special island is concave (and thus is decreasing after p∗s).All islands with more knowledgeable agents than the special island are protected when thereis the most inequality, and all islands with fewer knowledgeable agents than the special islandare manipulated under p∗s. Similarly, every other island has either: (i) monotonically decreasingcentrality, (ii) monotonically increasing centrality, or (iii) non-monotone centrality. In the caseof (i) and (iii), by assumption, the island cannot be manipulated at ps = 1 but is at p∗s. Moreoverfor islands of type (ii), the centrality must naturally lie above the centrality curve of the specialisland, so is manipulated at p∗s. Thus, this intermediate inequality structure has strictly moremanipulation than the most inequality.
It just remains to show that for every k ≥ 3, there exists a choice of m and distribution mthat has at least one non-monotone centrality curve. For this, we provide an explicit example fork = 3. The parameters are given by θ = 1/20, pd = .2, m1 = 44, m2 = 29, m3 = 0, n = 1000, forthree islands. The plot is given in Figure 13.
Figure 13. DeGroot centrality for island 2 as a function of ps.
To generalize to more communities, simply add a community with all DeGroot agents. Thiswill make the centrality of the special island increase for intermediate inequality relative to mostinequality because the centrality of the all DeGroot island will exceed that of the special island.Thus, there will still be manipulation with intermediate inequality, but not with the most in-equality.
Proof of Theorem 4. As in the proof of Theorem 1, let us consider each of the inequality casesseparately and define corresponding maps T . We show that all beliefs decrease following anincrease in ps, decrease in pd, or a reverse “Robin Hood” operation.
1. ps: Let us define T as:
T |ps : w 7→
psm1+pd∑6=1m`
pss1+(1−s1)pdpsm2+pd
∑6=2m`
pss2+(1−s2)pd
· · ·psmk+pd
∑6=km`
pssk+(1−sk)pd
+ (1− θ)
ps(s1n−m1)pss1+(1−s1)pd
pd(s2n−m2)pss1+(1−s1)pd
· · · pd(skn−mk)pss1+(1−s1)pd
pd(s1n−m1)pss2+(1−s2)pd
ps(s2n−m2)pss2+(1−s2)pd
· · · pd(skn−mk)pss2+(1−s2)pd
· · · · · · · · · · · ·pd(s1n−m1)
pssk+(1−sk)pd
pd(s2n−m2)pssk+(1−sk)pd
· · · ps(skn−mk)pssk+(1−sk)pd
w
41

Computing directly for island 1:
∂T (w1|ps)∂ps
= pd(1− s1) (m1 + (1− θ)(ns1 −m1)w1)− s1
∑`6=1 (m` + (1− θ)(ns` −m`)w`)
(pss1 + pd(1− s1))2
=1
(pss1 + pd(1− s1))2
m1
s1+ (1− θ)(n−m1/s1)w1 −
∑`6=1m`
1− s1− (1− θ)
∑6=1
ns` −m`
1− s1w`
By assumption, m1/s1 <
∑6=1m`/(1− s1) and w1 ≤ w`, thus,
∂T (w1|ps)∂ps
<w1(1− θ)
(pss1 + pd(1− s1))2
n−m1/s1 −∑` 6=1
ns` −m`
1− s1
=
w1(1− θ)(pss1 + pd(1− s1))2
(n−m1/s1 − n+
m−m1
1− s1
)=
w1(1− θ)(pss1 + pd(1− s1))2
s1m−m1
s1(1− s1)< 0
Thus, the beliefs of the agents on island 1 decrease following an increase in ps. Then ob-serve that for other islands ` 6= 1:(
1
1− θ− (1− θ) ps(s`n−m`)
n(pss` + pd(1− s`))
)w` =
psm` + pd∑
`′ 6=`m`′
n(pss` + pd(1− s`))+ (1− θ)
∑`′ 6=`
pd(s`′n−m`′)
n(pss` + pd(1− s`))w`′
when s1 is sufficiently close to 1, the above simplifies to:
1
1− θw` =
pdm1
n(pss` + pd(1− s`))+ (1− θ) pd(s1n−m1)
n(pss` + pd(1− s`))w1
Both pdm1
n(pss`+pd(1−s`)) and pd(s1n−m1)n(pss`+pd(1−s`)) are decreasing in ps, and we just showed that w1 is
decreasing in ps. Thus belief of island ` is also decreasing in ps.
2. pd: Recall that
∂T (w1|pd)∂pd
= −pspd
∂T (w1|ps)∂ps
> 0
And the expression for w` when s1 is sufficiently close to 1 is:
1
1− θw` =
pdm1
n(pss` + pd(1− s`))+ (1− θ) pd(s1n−m1)
n(pss` + pd(1− s`))w1
Both pdm1
n(pss`+pd(1−s`)) and pd(s1n−m1)n(pss`+pd(1−s`)) are increasing in pd, and we showed prior that w1 is
increasing in pd. Thus belief of island ` is also increasing in pd.
3. Majorization: We consider a “Robin Hood” operation that adds a knowledgeable agentto the large island. Once again we compute the directional derivative along the gradient
42

u = e1 − e`∗ for some island `∗:
∂T (w1|m)
∂m1− ∂T (w1|m)
∂m`∗=ps(1− (1− θ)w1)− pd(1− (1− θ)w`)
pss1 + (1− s1)pd> 0
because w1 ≤ w` and ps ≥ pd. Similarly, when s1 is sufficiently close to 1:
1
1− θw` =
pdm1
n(pss` + pd(1− s`))+ (1− θ) pd(s1n−m1)
n(pss` + pd(1− s`))w1
which is increasing in m1 given that w1 is increasing in m1.
Note that when s1 is sufficiently large, a reverse “Robin Hood” operation that does notimpact island 1 will have little effect on the beliefs of the islands. Thus, provided that noisland’s centrality lies directly at (1 − b)/2 (which holds for b on a set of full measure), thisoperation will have no impact on which agents are manipulated.
B.3 Section 5
B.3.1 Illustrative Example
Suppose there are two islands of equal size. We assume that 5% of the population is knowledge-able, and we have a fixed homophily structure of (ps, pd) = (0.5, 0.2). Moreover, suppose thatb = 0, so that agents choose the action corresponding to the state they believe is more likely.We explore how inequality, in the form of the distribution of knowledgeable agents across theislands, affects the principal’s strategy as we vary the cost ε:
1. Extreme inequality: Suppose knowledgeable agents constitute 10% of the population ofthe first island and the second island has no knowledgeable agents at all. Let κ` denote theproportion of agents targeted by the principal on island `. Then the fraction (of the totalpopulation) of agents manipulated, along with the proportions of island 1 and island 2 tar-geted by the principal (i.e., κ1 and κ2) are given in Figure 14. With extreme inequality, theprincipal “gives up” on the island with more knowledgeable agents, and sends no misinfor-mation to any agents on this island (κ1 = 0). On the other hand, he sends misinformationto almost all of the second island and manipulates everyone on that island, until the costof sending signals exceeds a threshold ε > 1.
2. Intermediate inequality: Now suppose the first island has 7.5% knowledgeable agents andthe second island has only 2.5%. The principal’s strategy and resulting manipulation areshown in Figure 15. The principal sends misinformation to everyone on the second island,but importantly, this alone is not enough to manipulate the agents on that island: he alsohas to send misinformation to the first island in order to be able to manipulate the secondisland. However, this strategy targets more agents on the whole than when there is extremeinequality, and thus is more expensive. After a point ε < 1, the principal has no profitablestrategy. This network is therefore more resilient than one with extreme inequality, sincethe cost range that allows the principal to (profitably) spread misinformation is smaller.
3. No inequality: Finally, suppose both islands have 5% knowledgeable agents. The plot of theprincipal’s strategy and resulting manipulation are shown in Figure 16. Similar to the caseof extreme inequality, there is a threshold ε > 1 such that the principal has no profitable
43

Figure 14. The principal’s optimal strategy for various values of ε under extreme inequality. De-pending on the curve, (Respective) fraction refers to either the fraction of the entire populationmanipulated, or the fraction of a given island that is targeted. For example, when ε = 0.5, theprincipal targets no one on the first island and almost everyone on the second island and endsup manipulating half the population.
strategy above that threshold, and so this inequality structure is again less resilient thanthe case of intermediate inequality. However, unlike the case of extreme inequality, theentire population is manipulated before this threshold is met. Thus, for ε < 1, the absenceof inequality leads to maximal manipulation relative to the other inequality structures.
The computation of the principal’s optimal strategy when there are two islands with the samepopulation, as in the example above, can be easily generalized via the algorithm presented next.
Algorithm. Let the marginalized island be the island with fewer knowledgeable agents and theprivileged island be the island with more knowledgeable agents (if the number of knowledgeableagents is equal, label them arbitrarily). Moreover, let κm, κp be the proportion of agents targetedon the marginalized and privileged islands, respectively. The principal’s optimal strategy can becomputed as follows:
(i) Consider the strategy where the principal targets all agents.
(a) If neither island is manipulated, the principal’s optimal strategy is x = 0.
(b) If both islands are manipulated, then decrease κm until the belief on the marginalizedisland matches that of the privileged island or κm = 0. Then decrease κm and κp one-for-one,21 (if κm = 0, just decrease κp), until both (identical) beliefs fall below thecutoff. (Note that if κp = κm = 0, no island will be manipulated, so such κp, κm alwaysexist.) Record the payoff 1− κp+κm
2 ε.
(c) If just the marginalized island is manipulated, decrease κp until the marginalized is-land’s belief is below π∗. If κp = 0 still results in the marginalized island’s manipula-tion, begin decreasing κm until this island is no longer manipulated. If the payoff of12 −
κp+κm2 ε > 0, this is the principal’s optimal strategy.
21Formally, “one-for-one” here means decrease them simultaneously so that the beliefs of both island remain iden-tical as these decrease, which may not necessarily correspond to the same change for κm as κp to achieve this.
44
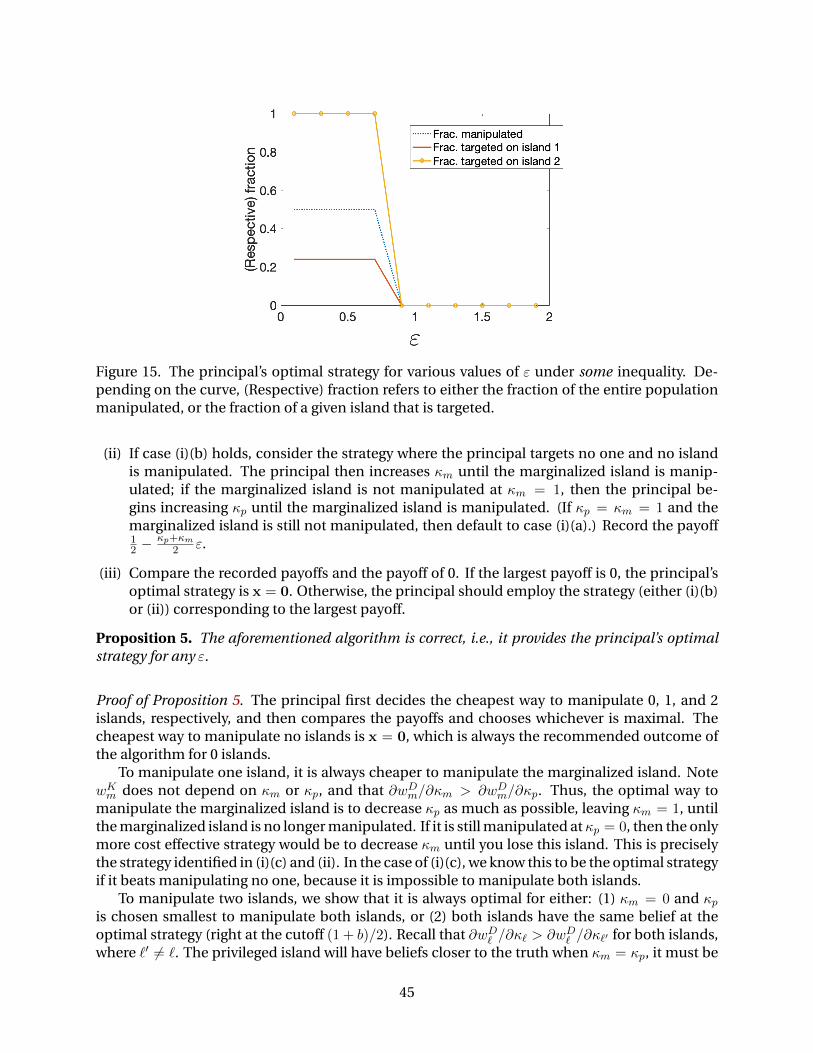
Figure 15. The principal’s optimal strategy for various values of ε under some inequality. De-pending on the curve, (Respective) fraction refers to either the fraction of the entire populationmanipulated, or the fraction of a given island that is targeted.
(ii) If case (i)(b) holds, consider the strategy where the principal targets no one and no islandis manipulated. The principal then increases κm until the marginalized island is manip-ulated; if the marginalized island is not manipulated at κm = 1, then the principal be-gins increasing κp until the marginalized island is manipulated. (If κp = κm = 1 and themarginalized island is still not manipulated, then default to case (i)(a).) Record the payoff12 −
κp+κm2 ε.
(iii) Compare the recorded payoffs and the payoff of 0. If the largest payoff is 0, the principal’soptimal strategy is x = 0. Otherwise, the principal should employ the strategy (either (i)(b)or (ii)) corresponding to the largest payoff.
Proposition 5. The aforementioned algorithm is correct, i.e., it provides the principal’s optimalstrategy for any ε.
Proof of Proposition 5. The principal first decides the cheapest way to manipulate 0, 1, and 2islands, respectively, and then compares the payoffs and chooses whichever is maximal. Thecheapest way to manipulate no islands is x = 0, which is always the recommended outcome ofthe algorithm for 0 islands.
To manipulate one island, it is always cheaper to manipulate the marginalized island. NotewKm does not depend on κm or κp, and that ∂wDm/∂κm > ∂wDm/∂κp. Thus, the optimal way tomanipulate the marginalized island is to decrease κp as much as possible, leaving κm = 1, untilthe marginalized island is no longer manipulated. If it is still manipulated atκp = 0, then the onlymore cost effective strategy would be to decrease κm until you lose this island. This is preciselythe strategy identified in (i)(c) and (ii). In the case of (i)(c), we know this to be the optimal strategyif it beats manipulating no one, because it is impossible to manipulate both islands.
To manipulate two islands, we show that it is always optimal for either: (1) κm = 0 and κpis chosen smallest to manipulate both islands, or (2) both islands have the same belief at theoptimal strategy (right at the cutoff (1 + b)/2). Recall that ∂wD` /∂κ` > ∂wD` /∂κ`′ for both islands,where `′ 6= `. The privileged island will have beliefs closer to the truth when κm = κp, it must be
45

Figure 16. The principal’s optimal strategy for various values of εunder no inequality. Dependingon the curve, (Respective) fraction refers to either the fraction of the entire population manipu-lated, or the fraction of a given island that is targeted.
the case that κp ≥ κm in the optimal strategy for 2-island manipulation. Of these strategies, (1)is clearly then optimal provided that κm = 0 does not cause the marginalized island’s belief to lieabove the cutoff (and thus, not manipulate both islands). Otherwise, if some island `’s belief isstrictly above the cutoff, then one can decrease κ` a small amount and increase κ`′ for `′ 6= ` bya smaller amount, again, because ∂wD` /∂κ` > ∂wD` /∂κ`′ for both islands `. This is cheaper thanthe previous strategy, a contradiction. So (2) must be optimal.
Finally, step (iii) checks whether 0-island, 1-island, or 2-island manipulation is the most prof-itable.
Proof of Theorem 3. The beliefs of all agents will be identical in the network with the least in-equality. Let m(b) be the maximum number of knowledgeable agents such that if these agentsare all distributed evenly across the islands, every agent is manipulated if the principal targetsevery DeGroot, which is a function of b. Moreover, because of symmetry, it is clear that manipu-lating every agent or manipulating no agent is the principal’s optimal strategy, and in particularfor ε < 1, manipulating every agent is a profitable strategy. (Note that this does not imply thatγ = 1D is optimal, just that manipulating every agent is optimal.) When we move to an in-equality configuration with the most inequality, there are two cases: (1) m(b) ≤ n/k − 1 or (2)m(b) ≥ n/k. In case (1), we stack all of the knowledgeable agents on a single island and set ps = 1and pd = 0, noting that there is at least one DeGroot on this island. It is clear that this meansthe island with all the knowledgeable agents will have a decrease in their DeGroot centrality,which by definition of m(b), will protect this island from manipulation. At the same time, thisconfiguration is still susceptible to manipulation, because the islands with all DeGroots agentswill be manipulated given ε < 1. In case (2), we make island 1 contain all knowledgeable agentsand one DeGroot, and then distribute the remaining knowledgeable agents equally amongst therest of the islands. For sufficiently large n, this will always (strictly) decrease the centrality of theone DeGroot agents on the island with concentrated knowledgeable agents, thereby protectingher from manipulation; at the same time, the DeGroots on the other islands will continue to bemanipulated, as their centrality does not decrease (and may increase).
Finally, we show there exists a model with intermediate inequality that is impervious for
46

some open interval of ε ∈ (ε∗, ε∗∗) and b ∈ (b∗, b∗∗). Once again there are two cases: (1) m(b) ≤n/k − 1 and (2) m(b) ≥ n/k. In the former case, put all of the knowledgeable agents on island 1along with one DeGroot, as before. In the latter case, put n/k − 1 knowledgeable agents on is-land 1 along with one DeGroot, and then distribute the rest of the knowledgeable agents evenlyamongst the remaining islands. If 0 < pd < ps < 1, then we have a model of intermediate in-equality where the beliefs (of the correct state) of the agents on island 1 exceed those on theother islands (which are identical because of symmetry).22 Because the beliefs of the agents onisland 1 exceed that of other islands, we know the principal cannot manipulate the DeGroot onisland 1, even if he were to target every DeGroot in the population. Next, we show that for anyδ < 1, there exists some pd and b > −1 such that the principal needs to target at least δ pro-portion of the DeGroots on island 1 and at least δ proportion of the DeGroots on the rest of theislands.23 We know that π1 > π` when the principal targets every DeGroot for all ` 6= 1 giventhat pd < ps. Thus, we can always choose b such that (1 + b)/2 is arbitrarily close to π` but stillsatisfies π1 > (1 + b)/2 > π`. Given pd > 0, any (substantial) deviation from γ = 1D, in the∞-norm, leads to some island ` 6= 1 not being manipulated. Because the principal should alwaysenact a symmetric strategy with respect to all islands ` 6= 1, we then either have (i) the networkis impervious, or (ii) the principal should send signals to at least δ proportion of each island,where δ can be arbitrarily close to 1. In the latter case, the payoff of the principal is no more thann(k−1k
)− m(b) − (n − m(b))δε, again, for δ arbitrarily close to 1. Thus, there exists ε < 1 such
that the principal’s payoff from this strategy is negative. Hence, the network is impervious witha model of intermediate inequality.
B.4 Section 6
Proof of Proposition 1. Suppose there aren agents in the network, and there arem knowledgeableagents. We denote by w`→r the weighted walks from an agent on island ` to any knowledgeableagent on island r. For ` 6= r, we can write:
w`→r ≥ (1− θ) pdmr
n(pss` + npd(1− s`))+ (1− θ)2
(npss`w`→r + pd(nsr −mr)wr→r + npd
∑τ 6=r,` sτwτ→r
npss` + npd(1− s`)
)≥ (1− θ) pdmr
n(pss` + pd(1− s`))+ (1− θ)2
(npss`wr + pd(nsr −mr)(wr + wr→r − wr) + npd(1− s` − sr)wr
npss` + npd(1− s`)
)= (1− θ) pdmr
n(pss` + pd(1− s`))+ (1− θ)2
(wr +
npdsr(wr→r − wr)− pdmrwr→rnpss` + npd(1− s`)
)= (1− θ) pdmr
n(pss` + pd(1− s`))+ (1− θ)2
(pss` + pd(1− s` − sr)pss` + pd(1− s`)
wr +pd(nsr −mr)
n(pss` + pd(1− s`))wr→r
)≥ (1− θ)2 pdmr
n(pss` + pd(1− s`))+ (1− θ)2
(pss` + pd(1− s` − sr)pss` + pd(1− s`)
wr +pd(nsr −mr)
n(pss` + pd(1− s`))wr→r
)22This was shown in the proof of Theorem 1.23Note that there is technically only one DeGroot on island 1, so targeting δ proportion of one DeGroot seems non-
sensical. However, Appendix A.2 reconciles this: because the analysis is always closed under multiplication of eachisland by the same proportion of knowledgeable agents and DeGroots, we can always expand the size of the DeGrootpopulation such that δ proportion (assuming δ ∈ Q) of δ(n/k −m1) is an integer.
47

where wr = minτ 6=r wτ→r. This implies that:
wr ≥ (1− θ)2 pdmr + pd(nsr −mr)wr→rnθ(pss` + pd(1− s`))− (1− θ)pdsr
Similarly,
wr→r = (1− θ) psmr
n(pssr + pd(1− sr))+ (1− θ)2
ps(nsr −mr)wrr + pd
∑τ 6=r sτw
τr
npssr + npd(1− sr)
≥ (1− θ) psmr
n(pssr + pd(1− sr))+ (1− θ)2
[wr +
npssr(wr→r − wr)− psmrwr→rnpssr + npd(1− sr)
]= (1− θ) psmr
n(pssr + pd(1− sr))+ (1− θ)2
[pd(1− sr)
pssr + pd(1− sr)wr +
ps(nsr −mr)
n(pssr + pd(1− sr))wr→r
]≥ (1− θ)2 psmr
n(pssr + pd(1− sr))+ (1− θ)2
[pd(1− sr)
pssr + pd(1− sr)wr +
ps(nsr −mr)
n(pssr + pd(1− sr))wr→r
]which moreover implies that
wr→r ≥ (1− θ) psmr + (1− θ)npd(1− sr)wrθpsnsr + npd(1− sr) + (1− θ)psmr
Combining these two results we get:
wr ≥ (1− θ)2pdmr + pd(nsr −mr)(1− θ) psmr+(1−θ)npd(1−sr)wr
θpsnsr+npd(1−sr)+(1−θ)psmrnθ(pss` + pd(1− s`))− (1− θ)pdsr
=⇒ [nθ(pss` + pd(1− s`))− (1− θ)pdsr]wr
≥ (1− θ)3pdmr + pd(nsr −mr)
psmr+(1−θ)npd(1−sr)wrθpsnsr+npd(1−sr)+(1−θ)psmr
nθ(pss` + pd(1− s`))− (1− θ)pdsr=⇒ [nθ(pss` + pd(1− s`))− (1− θ)pdsr]wr≥ (1− θ)3pdmr + (1− θ)3pd(nsr −mr)
psmr
θpsnsr + npd(1− sr) + (1− θ)psmr
+ (1− θ)4pd(nsr −mr)npd(1− sr)
θpsnsr + npd(1− sr) + (1− θ)psmrwr
Note that:([nθ(pss` + pd(1− s`))− (1− θ)pdsr] [θpsnsr + npd(1− sr) + (1− θ)psmr]− (1− θ)4p2
d(nsr −mr)(1− sr))wr
≥(1− θ)3pdmr [θpsnsr + npd(1− sr) + (1− θ)psmr] + (1− θ)3pd(nsr −mr)
Therefore, we can write wr ≥ N(n)/D(n), where:
N(n) ≡(1− θ)3pdmr [θpsnsr + npd(1− sr) + (1− θ)psmr] + (1− θ)3pd(nsr −mr)
D(n) ≡ [nθ(pss` + pd(1− s`))− (1− θ)pdsr] [θpsnsr + npd(1− sr) + (1− θ)psmr]− (1− θ)4p2d(nsr −mr)(1− sr)
If there are m = crn knowledgeable agents on island r, as n→∞, we have that:
wr ≥(1− θ)3pdcr
θ(pss+ pd(1− s))
48

where s = maxτ∈{1,...,k} sτ . Thus, the network is impervious as long as wr > (1 + b)/2. This
moreover implies the network is impervious if cr ≥ θ(pss+pd(1−s))(1+b)2(1−θ)3pd
for any island r. By thepigeonhole principle, there must be an island with at least c/k proportion of the population thatis knowledgeable. Thus taking c = k θ(pss+pd(1−s))(1+b)
2(1−θ)3pdand applying the result for the island r
which has the largest proportion of knowledgeable agents, we see the network is impervious tomanipulation. Moreover c < 1 provided that θ is not too large.
Proof of Proposition 2. For each θ and c we construct a strong inequality model where all but kcommunities are manipulated. Put all cn knowledgeable agents on the first island on the linetopology and let all other islands contain only DeGroots and be the same size as each other. Weassume that the principal attempts to manipulate the last k − k communities along the line. Wecompute D`(1) for every island by counting knowledgeable walks for every island; we denotethese walks by w` which is equivalent to 1−D`(γ). For island 2, we have the recursion:
w2 = (1− θ) pds1
pd(s1 + s3) + pss2+ (1− θ)2 pss2w2 + pds3w3
pd(s1 + s3) + pss2
=⇒ w2 = (1− θ) pds1
pd(s1 + s3) + pss2 − (1− θ)2pss2+ (1− θ)2 pds3w3
pd(s1 + s3) + pss2 − (1− θ)2pss2
For ` ≥ 3:
w` = (1− θ)2 pd(w`−1s`−1 + w`+1s`+1) + psw`s`pd(s`−1 + s`+1) + pss`
=⇒ w` = (1− θ)2 pd(w`−1s`−1 + w`+1s`+1)
pd(s`−1 + s`+1) + pss` − (1− θ)2pss`
withw1 = 1 because the island consists of all knowledgeable agents. We first show that lim`→∞w`must exist. To do this, we show that w` is monotonically decreasing in `. We know there isa unique fixed point for w, so if we prove that a decreasing sequence of w` maps to anotherdecreasing sequence of w`, then by Brouwer’s fixed point theorem the unique solution must bea decreasing in `. Note that:
w` ≤ (1− θ)2 pd(w`−1s`−1 + w`s`+1)
pd(s`−1 + s`+1) + pss` − (1− θ)2pss`
=⇒(
1− pds`+1
pd(s`−1 + s`+1) + pss` − (1− θ)2pss`
)w` ≤ (1− θ)2 pdw`−1s`−1
pd(s`−1 + s`+1) + pss` − (1− θ)2pss`
=⇒w` ≤ (1− θ)2 pdw`−1s`−1
pds`−1 + pss` − (1− θ)2pss`≤ w`−1
where the final inequality follows from the fact that β αα+δ < 1 for α, β, δ ∈ (0, 1). Thus, w` con-
verges to some w∞. Note that w∞ must satisfy the fixed-point equation:
w∞ = (1− θ)2 pd(s`−1 + s`+1)w∞pd(s`−1 + s`+1) + pss` − (1− θ)2pss`
Again, since pd(s`−1+s`+1)pd(s`−1+s`+1)+pss`−(1−θ)2pss`
< 1, clearly w∞ = 0.
Now, suppose the principal attempts to manipulate k− k communities at the end of the line.By our previous result, we know that for every δ > 0, there exists a sufficiently large k, such thatwk+1 < δ. Therefore, for any b, the principal can manipulate k− k of the islands at the end of the
49

line. This yields a payoff of∑k
`=k+1 nsk − nε(1− s1), which is positive for some sufficiently smallε > 0. Thus, the network is susceptible to manipulation and all but k islands are manipulated.
B.5 Section 7
Proof of Corollary 1. By assumption, the budget is large enough to make the network impervi-ous. Thus, by Theorem 1, the network is impervious if the current distribution of knowledgeableagents m is majorized by every other distribuiton (i.e., inequality cannot be reduced by a moreequal redistribution of knowledgeable agents). Minimizing inequality with an educational in-tervention accomplishes this.
Proof of Corollary 2. Leveraging Theorem 4, we know that decreasing inequality when the bigisland is the most underprivileged does not introduce more manipulation, and in fact, mightreduce it. Assuming the policy does not put all of the knowledgeable agents on island 1, we knowsuch a redistribution is a different feasible policy. In the proof of Theorem 4, this is shown to betrue because decreasing inequality increases all agents’ beliefs. This is exactly the definition of adominant policy.
Proof of Proposition 3. We show that if the knowledgeable agents are assigned in proportion toisland populations, i.e., m` = M · s`, then all DeGroot centralities are equal. Then, homophilyhas no effect (beliefs are the same on every island), so setting pd = pod is optimal, and alwaysfeasible because it costs nothing. Consider the map T :
T : w 7→ (1−θ)
psm1+
∑` 6=1 pdm`
npss1+npd(1−s1)
· · ·psmk+
∑` 6=k pdm`
npssk+npd(1−sk)
+(1−θ)2
ps(ns1−m1)
npss1+npd(1−s1)pd(ns2−m2)
npss1+npd(1−s1) · · · pd(nsk−mk)npss1+npd(1−s1)
· · · · · · · · · · · ·pd(ns1−m1)
npssk+npd(1−sk)pd(ns2−m2)
npssk+npd(1−sk) · · · ps(nsk−mk)npssk+npd(1−sk)
w
Note we will simply plug in w = w∗1 to T and show it is a fixed point for some constant w∗. Forisland `:
w` = (1− θ) ·psm` +
∑`′ 6=` pdm`′ + (1− θ)ps(ns` −m`)w` + (1− θ)
∑`′ 6=` pd(ns`′ −m`′)w`′
npss` + npd(1− s`)
= (1− θ) ·pss`M +
∑`′ 6=` pds`′M + (1− θ)ps(ns` − s`M)w∗ + (1− θ)
∑`′ 6=` pd(ns`′ − s`′M)w∗
npss` + npd(1− s`)
= (1− θ) · M(pss` + pd(1− s`)) + (1− θ)w∗(npss` + npd(1− s`)−M(pss` + pd(1− s`)))npss` + npd(1− s`)
= (1− θ) · M + (1− θ)w∗(n−M)
n
The above expression has no dependence on `. Letting w∗ = M(1−θ)M(1−θ)+θn , we see then that w` =
w∗, which completes the proof. This has no dependence on pd, so all pd are optimal, includingpod.
Proof of Proposition 4. The condition that the budget exceeds φ(ps− pod) is to guarantee that pd =ps is feasible. By Theorem 1, given that all islands are the same size, a network with less inequalitycannot transition from impervious to susceptible. Thus, removing all homophily (i.e., reducing
50

inequality the most through the homophily parameters) must make the network imperviousgiven this is possible for some homomphily structure. Thus, setting ps = pd makes the networkimpervious which is obviously an optimal policy.
51

References
Acemoglu, Daron, Giacomo Como, Fabio Fagnani, and Asuman Ozdaglar (2013), “Opinion fluc-tuations and disagreement in social networks.” Mathematics of Operations Research, 38, 1–27.
Acemoglu, Daron, Asuman Ozdaglar, and Alireza Tahbaz-Salehi (2015), “Systemic Risk and Sta-bility in Financial Networks.” American Economic Review, 105, 564–608, URL https://www.
aeaweb.org/articles?id=10.1257/aer.20130456.
Akbarpour, Mohammad, Suraj Malladi, and Amin Saberi (2018), “Diffusion, seeding, and thevalue of network information.” In Proceedings of the 2018 ACM Conference on Economics andComputation, 641–641, ACM.
Alidaee, Hossein, Eric Auerbach, and Michael P Leung (2020), “Recovering network structurefrom aggregated relational data using penalized regression.” arXiv preprint arXiv:2001.06052.
Arnold, Barry C. (1987), Majorization and the Lorenz Order: A Brief Introduction. LectureNotes in Statistics, Springer-Verlag, New York, URL https://www.springer.com/gp/book/
9780387965925.
Ata, Baris, Alexandre Belloni, and Ozan Candogan (2018), “Latent agents in networks: Estima-tion and pricing.” arXiv preprint arXiv:1808.04878.
Auerbach, Eric (2019), “Measuring differences in stochastic network structure.” arXiv preprintarXiv:1903.11117.
Babus, Ana (2016), “The formation of financial networks.” The RAND Journal of Economics, 47,239–272, URL https://onlinelibrary.wiley.com/doi/abs/10.1111/1756-2171.12126.
Calvo-Armengol, Antoni and Matthew O Jackson (2004), “The effects of social networks on em-ployment and inequality.” American economic review, 94, 426–454.
Calvo-Armengol, Antoni and Matthew O Jackson (2007), “Networks in labor markets: Wage andemployment dynamics and inequality.” Journal of economic theory, 132, 27–46.
Candogan, Ozan and Kimon Drakopoulos (2017), “Optimal signaling of content accuracy: En-gagement vs. misinformation.” Operations Research, forthcoming.
Card, David and Alan B Krueger (1992), “School quality and black-white relative earnings: Adirect assessment.” The Quarterly Journal of Economics, 107, 151–200.
Chandra, Amitabh (2000), “Labor-market dropouts and the racial wage gap: 1940-1990.” Ameri-can Economic Review, 90, 333–338.
Chen, Li and Yiangos Papanastasiou (2021), “Seeding the herd: Pricing and welfare effects ofsocial learning manipulation.” Management Science.
Currarini, Sergio, Matthew O Jackson, and Paolo Pin (2009), “An economic model of friendship:Homophily, minorities, and segregation.” Econometrica, 77, 1003–1045.
Golub, Benjamin and Matthew O Jackson (2012), “How homophily affects the speed of learningand best-response dynamics.” The Quarterly Journal of Economics, 127, 1287–1338.
52
Heckman, James J, Thomas M Lyons, and Petra E Todd (2000), “Understanding black-white wagedifferentials, 1960-1990.” American Economic Review, 90, 344–349.
Holland, Paul W, Kathryn Blackmond Laskey, and Samuel Leinhardt (1983), “Stochastic block-models: First steps.” Social networks, 5, 109–137.
Jadbabaie, Ali, Pooya Molavi, Alvaro Sandroni, and Alireza Tahbaz-Salehi (2012), “Non-bayesiansocial learning.” Games and Economic Behavior, 76, 210–225.
Kanak, Zafer (2017), “Rescuing the Financial System: Capabilities, Incentives, and Optimal In-terbank Networks.” Technical Report 17-17, NET Institute, URL https://ideas.repec.org/
p/net/wpaper/1717.html.
Keppo, Jussi, Michael Jong Kim, and Xinyuan Zhang (2019), “Learning manipulation throughinformation dissemination.” Available at SSRN 3465030.
Lobel, Ilan and Evan Sadler (2015), “Preferences, homophily, and social learning.” OperationsResearch, 64, 564–584.
Manshadi, Vahideh, Sidhant Misra, and Scott Rodilitz (2018), “Diffusion in random networks:Impact of degree distribution.” Operations Research, forthcoming.
Marsden, Peter V (1987), “Core discussion networks of americans.” American sociological review,122–131.
Marshall, Albert W., Ingram Olkin, and Barry C. Arnold (2011), Inequalities: Theory of Majoriza-tion and Its Applications, 2 edition. Springer Series in Statistics, Springer-Verlag, New York,URL https://www.springer.com/gp/book/9780387400877.
McPherson, Miller, Lynn Smith-Lovin, and James M Cook (2001), “Birds of a feather: Homophilyin social networks.” Annual review of sociology, 27, 415–444.
Mostagir, Mohamed (2010), “Exploiting myopic learning.” In International Workshop on Internetand Network Economics, 306–318, Springer.
Mostagir, Mohamed, Asu Ozdaglar, and James Siderius (2021), “When is society susceptible tomanipulation?” Management Science, forthcoming.
Mostagir, Mohamed and James Siderius (2021a), “Centrality in stochastic networks.” Workingpaper.
Mostagir, Mohamed and James Siderius (2021b), “Strategic reviews.” Working paper.
Papanastasiou, Yiangos (2020), “Fake news propagation and detection: A sequential model.”Management Science.
Sadler, Evan (2019), “Influence campaigns.” Available at SSRN 3371835.
Yildiz, Ercan, Asuman Ozdaglar, Daron Acemoglu, Amin Saberi, and Anna Scaglione (2013), “Bi-nary opinion dynamics with stubborn agents.” ACM Transactions on Economics and Compu-tation (TEAC), 1, 19.
53